nanofabrication and engineering of gene delivery vectors
TRANSCRIPT

Nanofabrication and Engineering
of Gene Delivery Vectors
Emma Charlotte Claire Butterworth
Submitted to the Department of Engineering, Queen Mary
University of London in partial fulfilment of the requirements
for the degree of Doctor of Philosophy

2
I, Emma Charlotte Claire Butterworth, confirm that the research included within this
thesis is my own work or that where it has been carried out in collaboration with, or
supported by others, that this is duly acknowledged below and my contribution
indicated. Previously published material is also acknowledged below.
I attest that I have exercised reasonable care to ensure that the work is original, and
does not to the best of my knowledge break any UK law, infringe any third party’s
copyright or other Intellectual Property Right, or contain any confidential material.
I accept that the College has the right to use plagiarism detection software to check
the electronic version of the thesis.
I confirm that this thesis has not been previously submitted for the award of a degree
by this or any other university.
The copyright of this thesis rests with the author and no quotation from it or
information derived from it may be published without the prior written consent of the
author.
Signature:
Date: 29/11/18

3
Abstract
Coaxial electrospray is an encapsulation method in use in biomedical research
for the encapsulation of drugs and genes. In this thesis, its ability to produce polymer
capsules with a core-shell structure was investigated as potential non-viral vector for
gene delivery. Three main aspects were considered. 1) The shell polymer was varied
between a homopolymer and block copolymer to compare their ability to condense
the inner polymer and so produce a smaller particle. 2) DNA is expensive and not
cost-effective to use in the large quantities required here. Therefore two different
polymers (carboxymethyl cellulose and hyaluronic acid, referred to as CMC and HA
respectively) were used for the inner polymer and as potential cost-effective models
for DNA due to their similar structures – long-chain polymers with a negative charge.
3) Electrosprayed particles were characterised and compared with bulk-assembled
complexes to assess differences in size, structure and zeta potential. For electrospray
to be considered as a good method, it must produce particles with characteristics that
are at least as good as complexes produced through self-assembly.
It was seen that electrospray was able to produce particles of a similar size to
bulk-assembled complexes (110 nm and 106 nm respectively) and core-shell
structures were seen with all particles and complexes. The main differences were seen
with zeta potential. Complexes using the block copolymer decreased the zeta potential
to a large degree, but this decrease was not seen with electrosprayed particles
suggesting a difference in shell structure. Particles and complexes containing
hyaluronic acid were seen to be less stable than those containing CMC as they
underwent aggregation in aqueous phase.

4
Finally it was seen that the particles produced by electrospray were relatively
soft as they underwent deformation when sprayed onto hard substrates.

5
Acknowledgements
The first thanks must go to my supervisors Professor John Stark and Doctor Julien
Gautrot, without whom none of this would have been possible. Your support and
advice have been invaluable over the last four years.
Next to my friends and colleagues at QMUL! Thanks for all the delicious lunches and
dinners! Special thanks to Hui for keeping me company in the somewhat empty lab
during the first year.
Thanks as well to the technicians who helped me over the course of the PhD. Roger
Nelson, Russell Bailey and Vicente Araullo-Peters who were always happy to lend a
hand.
And finally thank you to my family for supporting me always.

6
List of Figures and Tables
Figures
Figure 2.1 Basic electrospray set-up
Figure 2.2 Spray modes as applied voltage increases
Figure 2.3 Cone-jet diagram, where r is the distance from the cone apex and α is
the semi-angle of the cone
Figure 2.4 Various possible meniscus shapes of cone-jet sprays: a) Taylor cone,
b) meniscus curved away from cone axis, c) & d) meniscus curved towards cone axis.
(Cloupeau, M. & Prunetfoch, B. J Electrostat 22, 135-159 (1989)17)
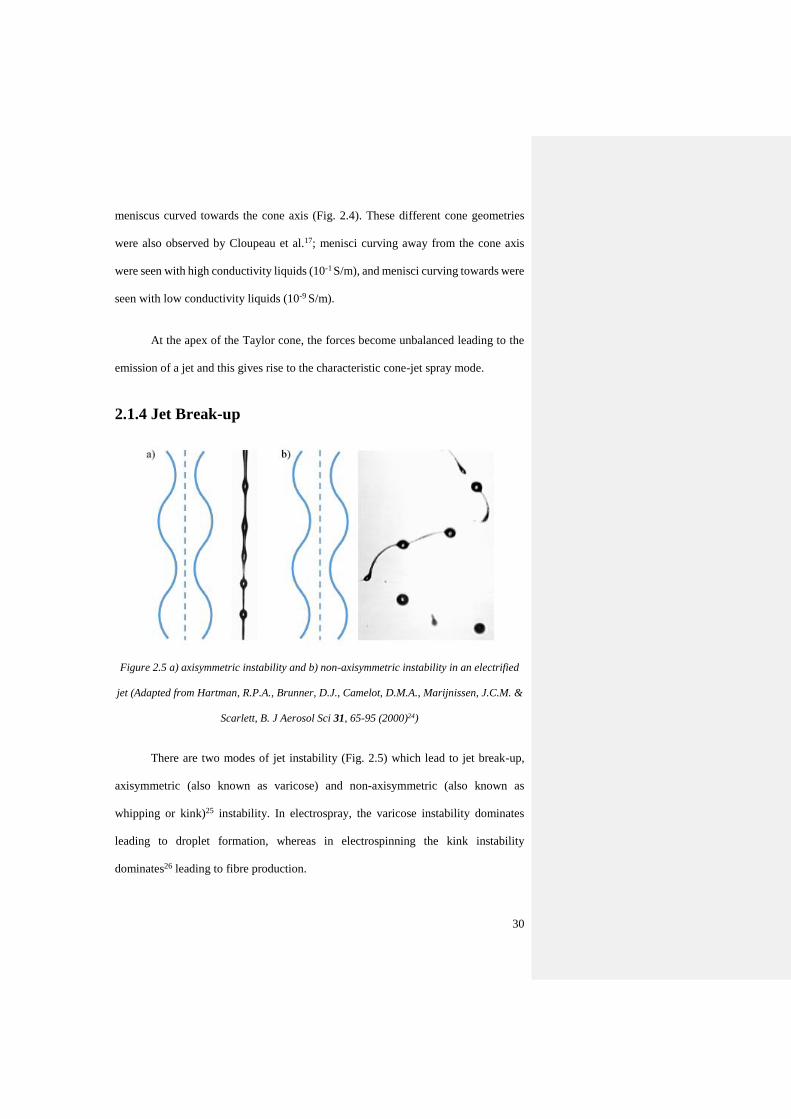
Figure 2.5 a) axisymmetric instability and b) non-axisymmetric instability in an
electrified jet (Adapted from Hartman, R.P.A., Brunner, D.J., Camelot, D.M.A.,
Marijnissen, J.C.M. & Scarlett, B. J Aerosol Sci 31, 65-95 (2000)24)
Figure 2.6 Cone-jet mode of single electrospray
Figure 2.7 Comparison of experimental data with dimensionless droplet size
(Rd Rσ⁄ ) as a function of the Weber number. The solid black line represents Gañan-
Calvo’s scaling law (Rd Rσ⁄ = We), and the dashed black line represents de la Mora’s
scaling law (Rd Rσ⁄ = We2
3⁄ ). The vertical dotted line represents the limit of the
scaling law. (Adapted from Gañan-Calvo, A.M. & Montanero, J.M. Physical Review
E 79 (2009)31)
Figure 2.8 Current collected by an electrode held 2mm from the needle tip
(Marginean, I., Kelly, R.T., Page, J.S., Tang, K. & Smith, R.D. Analytical Chemistry
79, 8030-8036 (2007)19)
Figure 2.9 Cone-jet mode of coaxial electrospray
Figure 2.10 Diagram of the cone-jet spray where 0 indicates the medium the
electrospray takes place in, 1 indicates the outer liquid and 2 indicates the inner liquid
Figure 2.11 Data obtained for coaxial electrospray compared to Gañan-Calvo's
current scaling law. (Lopez-Herrera, J.M., Barrero, A., Lopez, A., Loscertales, I.G. &
Marquez, M. J Aerosol Sci 34, 535-552 (2003)39)

7
Figure 2.12 Mean droplet diameter with an outer driving liquid EG with an inner
liquid of sunflower oil (Lopez-Herrera, J.M., Barrero, A., Lopez, A., Loscertales, I.G.
& Marquez, M. J Aerosol Sci 34, 535-552 (2003)39)
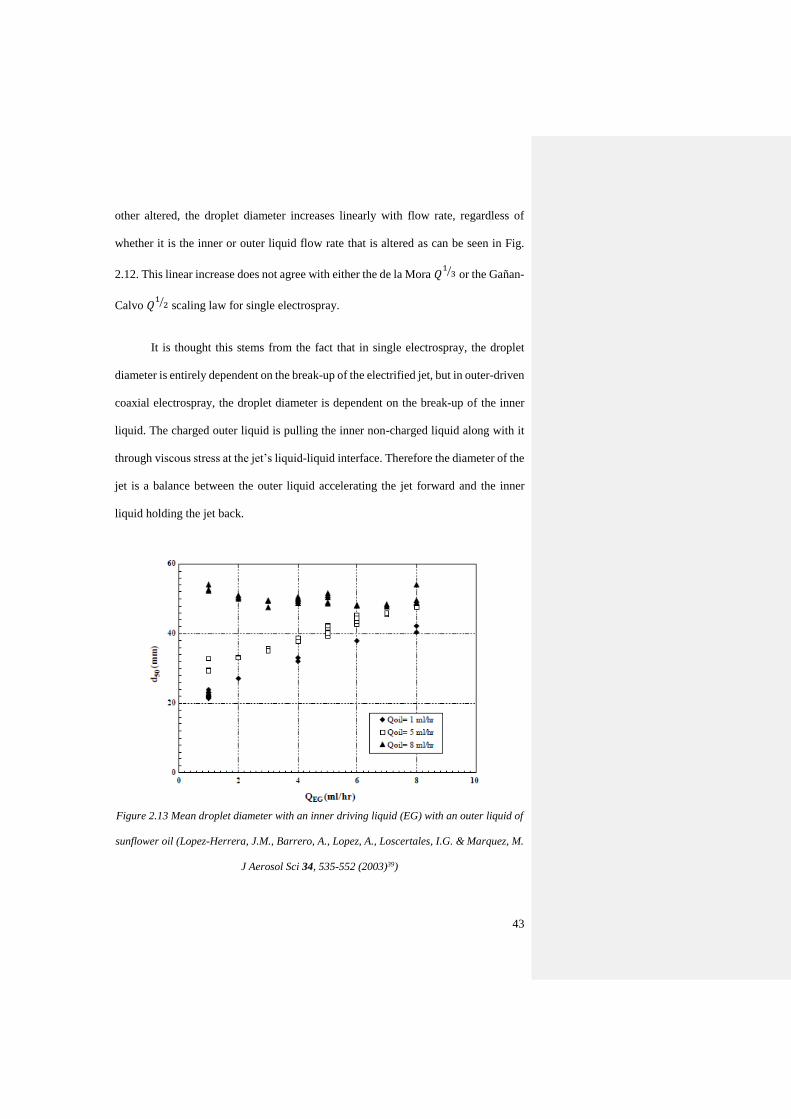
Figure 2.13 Mean droplet diameter with an inner driving liquid (EG) with an outer
liquid of sunflower oil (Lopez-Herrera, J.M., Barrero, A., Lopez, A., Loscertales, I.G.
& Marquez, M. J Aerosol Sci 34, 535-552 (2003)39)
Figure 2.14 Mean droplet diameter with an inner driving liquid of ethanol and outer
liquid of olive oil (Mei, F. & Chen, D.R. Physics of Fluids 19 (2007)40)
Figure 2.15 Data on vectors used in clinical trials worldwide, compiled by the
Journal of Gene Medicine66
Figure 2.16 DNA structure
Figure 2.17 The process of endocytosis: 1) a particle approaches the cell membrane,
2) the cell membrane engulfs the particle, 3) the cell membrane pinches off into a
capsule (known as a vacuole) and carries the particle into the cell
Figure 2.18 a) electrostatic interaction between DNA and a branched polycation
leading to a polyplex, b) a polycation with a PEG block and plasmid DNA leading to
a micelle with DNA complexed with the polycation at the core and a PEG shell, c)
DNA adsorbed onto a core, with a shell adsorbed onto the DNA using a layer-by-layer
technique ((a) adapted from Liao, J.F. et al. Theranostics 7, 2593-2605 (2017)85, b)
adapted from Uchida, S. et al. Journal of Controlled Release 155, 296-302 (2011)86)
Figure 3.1 Schematic of electrospray set-up used
Figure 3.2 Set-up using both syringe pump and pressure head (Li, Z., Mak, S.Y.,
Sauret, A. & Shum, H.C. Lab on a Chip 14, 744-749 (2014)111)
Figure 3.3 a) both liquids partially fill their respective needles, b) inner liquid
syringe is raised until a drip of inner liquid can be seen, c) increasing voltage is applied
to the needle until cone-jet mode is reached, d) outer liquid syringe is raised until outer
liquid emerges from needle and coaxial cone-jet mode is established
Figure 3.4 a) inner cone-jet is established to find onset voltage, outer needle is
empty, b) voltage applied to needle is turned off, extractor voltage kept on, inner flow

8
rate stopped, and outer syringe connected, c) the outer needle is filled, and inner cone-
jet re-established, d) outer liquid is drawn over the inner cone-jet forming a coaxial
cone-jet
Figure 3.5 Coaxial needles a) six pieces of wire are welded onto the outside of the
inner needle to ensure it is centred within the outer needle55 b) no centring method is
used, leaving the inner needle off-centre49 (Adapted from Yuan, S. et al. Plos One 10
(2015)55 and Wu, Y. et al. Molecular Pharmaceutics 6, 1371-1379 (2009)49)
Figure 3.6 Coaxial needle set-up where the inner needle tip is both recessed within
the outer needle and bent to touch the outer needle. The liquid used were high
concentrations of polycaprolactone (PCL) and polystyrene (PS) both in chloroform.
(Hwang, Y.K., Jeong, U. & Cho, E.C. Langmuir 24, 2446-2451 (2008)38)
Figure 3.7 a) inner needle (28 gauge), b) outer needle (21 gauge), c) assembled
coaxial needle, d) SEM image of needle-tip showing centring divots in outer needle,
e) diagram (not to scale) demonstrating a cross-section of the needle’s centring system
Figure 3.8 The outer liquid can be seen wetting up the outside of the needle19
(Adapted from Wu, Y., Fei, Z., Lee, L.J. & Wyslouzil, B.E. Biotechnol Bioeng 105,
834-841 (2010)16)
Figure 3.9 a) outer liquid wetting to the inner edge of the outer needle, b) outer
liquid wetting to the outer edge of the outer needle
Figure 3.10 Different levels of protrusion inner needle a) cone-jet mode with inner
needle level with outer needle, b) cone-jet mode with 1 mm protrusion, c) dripping
mode with 2 mm protrusion (Adapted from Sofokleous, P., Lau, W.K., Edirisinghe,
M. & Stride, E. Rsc Advances 6, 75258-75268 (2016)125)
Figure 3.11 Image of needle and extractor holder with grounded plate
Figure 3.12 A diagram indicating the voltages applied to the needle and extractor
relative to ground
Figure 3.13 a) Start-up with cone-jet of inner liquid only, b) coaxial electrospray
where outer liquid can be seen attached to the inner edge of the outer needle
Figure 3.14 Structure of CMC sodium salt

9
Figure 3.15 a) PLA structure, b) PDMAEMA structure, c) PLA-PDMAEMA
structure
Figure 3.16 Diagram illustrating the totally internally reflected infrared beam
passing through the ATR crystal (Misra, N.N., Sullivan, C. & Cullen, P.J., Current
Biochemical Engineering 2, 4-16 (2015)145)
Figure 3.17 a) SEM image of dry collection on aluminium foil, b) SEM images of
aluminium foil c) blank gold-coated silicon wafer with smooth appearance, d) blank
gold-coated silicon wafer with rough appearance
Figure 3.18 Diagram showing the laser which reflects off the cantilever in,
allowing the motion to be detected by the photodiode in order to image the topography
of the sample
Figure 3.19 Diagram demonstrating how tip geometry leads to a horizontally
measured particle diameter that is greater than the actual particle diameter. Measuring
the diameter vertically, i.e. via the maximum peak height of a particle, gives a more
accurate measurement. (Delvallée, A., Feltin, N., Ducourtieux, S., Trabelsi, M. &
Hochepied, J.-F. International Congress of Metrology, 06007 (2013)143)
Figure 3.20 Diagram of TEM showing the path of the electron beam through the
microscope (Ali, M., (Suez University, 2015)148)
Figure 4.1 Normalised FTIR spectra of solid CMC, freeze-dried deprotonated and
protonated CMC samples
Figure 4.2 Spectra of PDMAEMA and CMC in solid form
Figure 4.3 FTIR spectra of electrosprayed particles of CMC:PDMAEMA in ratios
of 1:5 and 1:20 where samples were allowed to air dry
Figure 4.4 FTIR spectra comparison of electrosprayed particles following air-
drying at ambient conditions and vacuum-drying overnight
Figure 4.5 FTIR spectra comparison of electrosprayed (ES) CMC-PDMAEMA
with a) solid polymers and b) single electrosprayed polymers
Figure 4.6 FTIR spectra of bulk-assembled complexes of CMC-PDMAEMA
prepared in aqueous phase in a 1:5 weight ratio at varying pH (pH 5 in orange, pH7

10
in grey, pH 11 in yellow) shown with the spectra of the solid individual polymers for
comparison (PDMAEMA light blue, CMC dark blue). In all three cases, the peak
around 1600 cm-1 (carbonyl of CMC) can be seen signifying the presence of CMC.
Figure 4.7 Comparison across a range of pH for bulk-assembled complexes
showing a) mean peak height and b) mean diameter obtained via AFM (shown with
standard error) (n= 27, 43 and 24 for pH 5, 7 and 11 respectively)
Figure 4.8 a) FTIR spectra comparison of identifiable peaks from electrosprayed
particles (inner flow rate 0.2mL/h, outer flow rate 0.1 mL/h) and bulk-assembled
complexes of CMC-PDMAEMA with a polymer weight ratio of 1:5
(CMC:PDMAEMA) in both cases, b) corresponding ratios to the 1730 cm-1 peak, c)
comparison of FTIR spectra from bulk-assembled CMC-PDMAEMA complexes in
various ratios (denoted in brackets), and d) calibration curve of ratios of 1365 cm-1 to
1730 cm-1 peak relative to CMC percentage.
Figure 4.9 Comparison of the mean diameter, obtained through AFM, of bulk-
assembled complexes (BA, n=54) and electrosprayed CMC-PDMAEMA particles
(ES, n=78) (shown with standard error)
Figure 4.10 Comparison between the mean zeta potential of CMC-PDMAEMA
electrosprayed particles (ES) and bulk-assembled complexes (BA) (shown with
standard deviation)
Figure 4.11 TEM images a) & b) show examples of bulk-assembled complexes of
CMC-PDMAEMA, c) & d) show electrosprayed CMC-PDMAEMA particles. The
dark spots are assumed to be aggregations of silver which were used to stain the CMC
to give a greater contrast with respect to neutral or cationic phases such as
PDMAEMA. The outlines of outer shells are highlighted in e) & f).
Figure 5.1 AFM data from electrosprayed CMC-PDMAEMA particles. AFM
images using a) Mw 90,000 CMC at 100 µg/mL, b) Mw 90,000 CMC at 100 ng/mL,
c) Mw 250,000 at 100 ng/mL, and comparison of mean particles sizes with d) using
different molecular weights of CMC (Mw 250,000, n = 96 and Mw 90,000, n = 112)
at 100 µg/mL and e ) Mw 90,000 CMC at different concentrations (100 µg/mL, n =
78 and 100 ng/mL, n = 112) (shown with standard error). In both d) and e), * indicates
a significant difference between the two conditions for p<0.05 (unpaired t-test).

11
Figure 5.2 Comparison of FTIR spectra of single electrosprayed PDMAEMA and
PLA-PDMAEMA
Figure 5.3 FTIR spectra of coaxially electrosprayed CMC-PLA-PDMAEMA
particles compared with the single electrospray individual polymers (all samples
vacuum-dried)
Figure 5.4 AFM images of electrosprayed a) CMC-PDMAEMA particles, b)
CMC-PLA-PDMAEMA particles, c) a comparison of the mean peak heights of CMC-
PDMAEMA and CMC-PLA-PDMAEMA and d) a comparison of lateral diameter
with a correction factor given by Yang et al.22. For c), * indicates significant
difference for p<0.05 (unpaired t-test). Both c) & d) are shown with standard error.
Figure 5.5 Zeta potential comparison of electrosprayed (blue) and self-assembled
(orange) CMC-PDMAEMA and CMC-PLA-PDMAEMA particles (shown with
standard deviation)
Figure 5.6 FTIR spectra comparison of solid HA and single electrosprayed HA
showing the emergence of additional peaks following the electrospray process which
may be due to protonation
Figure 5.7 FTIR spectra of electrosprayed HA-PDMAEMA compared with single
electrosprayed PDMAEMA and HA
Figure 5.8 FTIR spectra of electrosprayed HA-PLA-PDMAEMA compared with
single electrosprayed PLA-PDMAEMA and HA
Figure 5.9 AFM images of electrosprayed particles a) CMC-PDMAEMA, b)
CMC-PLA-PDMAEMA, c) HA-PDMAEMA, d) HA-PLA-PDMAEMA, and a
comparison of mean peak heights obtained via AFM (HA-PDMAEMA n = 291, HA-
PLA-PDMAEMA n = 170, CMC-PDMAEMA n = 78, CMC-PLA-PDMAEMA n =
81) (shown with standard error). * indicates a significant difference for p<0.05
(unpaired t-test).
Figure 5.10 A comparison of zeta potential across different polymer combinations
prepared with electrospray (blue) and self-assembly (orange) (shown with standard
deviation)
Figure 5.11 TEM images of bulk-assembled complexes a) CMC-PDMAEMA, b)
CMC-PLA-PDMAEMA, c) HA-PDMAEMA and d) HA-PLA-PDMAEMA

12
Figure 5.12 TEM images of electrosprayed particles a) CMC- PDMAEMA, b)
CMC-PLA-PDMAEMA, c) HA-PDMAEMA and d) HA-PLA-PDMAEMA

13
Tables
Table 2.1 Table 2.1 Liquid combinations used in coaxial electrospray for biomedical
purposes. (Adapted from Kavadiya, S. & Biswas, P. J Aerosol Sci 125, 182-207
(2018)60)
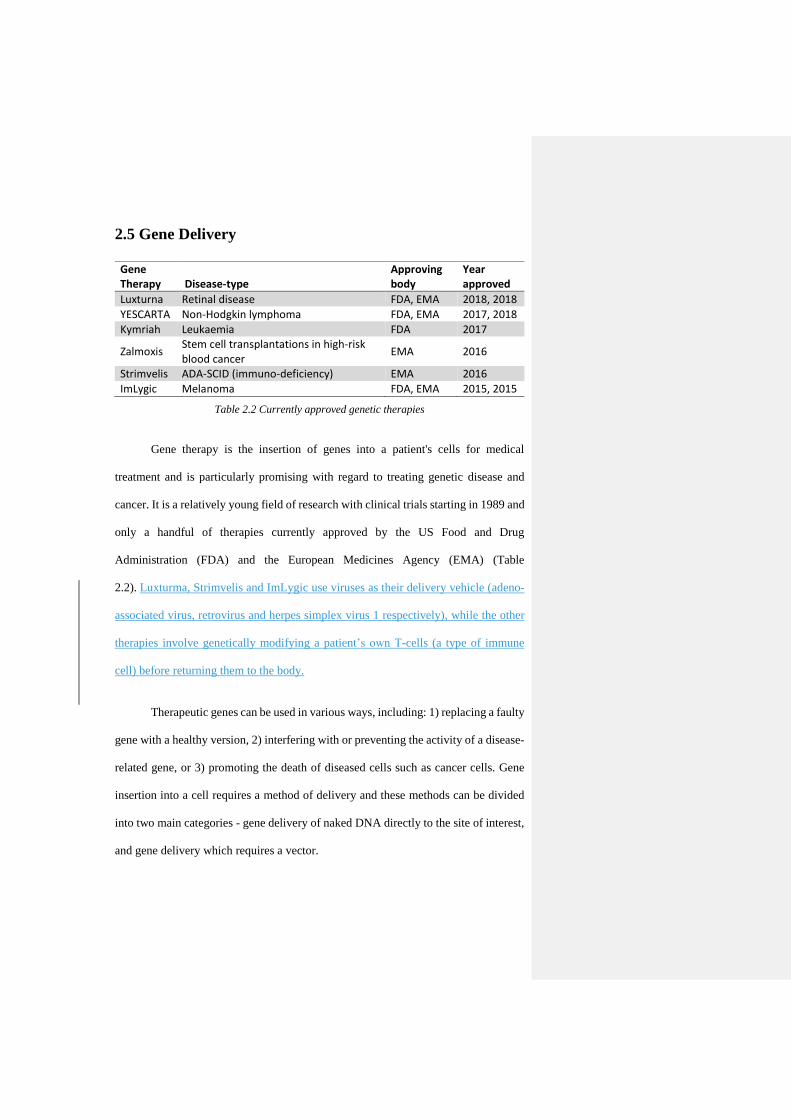
Table 2.2 Currently approved genetic therapies
Table 4.1 A comparison of hydrodynamic diameter and polydispersity index across
different pH for bulk-assembled CMC-PDMAEMA complexes
Table 4.2 Comparison of hydrodynamic diameter and polydispersity index (PdI) of
bulk-assembled complexes and electrosprayed particles of CMC-PDMAEMA with
standard deviation
Table 5.1 Varying pH of self-assembled CMC-PLA-PDMAEMA particles measured
by DLS
Table 5.2 Comparison of DLS sizing between electrosprayed CMC-PDMAEMA and
CMC-PLA-PDMAEMA
Table 5.3 Comparison of mean diameter (from DLS) of particles self-assembled at
pH 7
Table 5.4 Comparing sizes from AFM data of electrosprayed particles with all core-
shell combinations
Table 5.5 Comparison of mean diameter (from DLS) of electrosprayed HA-
PDAMEMA and HA-PLA-PDMAEMA particles

14
Nomenclature
AFM atomic force microscopy
ALA 5-aminovulinic acid
ATR attenuated total reflectance
CA4 combretastatin A4
CDDP cisplatin
CMC carboxymethyl cellulose
DC-Chol 3β-[N-(N’,N’-dimethylaminoethane)-carbamoyl] cholesterol
DI H2O deionised water
DLS dynamic light scattering
DMAc dimethylacetamide
DMF dimethylformamide
DOX doxorubicin
EE 100-55 Eudragit L 100-55
Egg PC egg phosphatidylcholine
ERS Eudragit RS
FTIR Fourier transform infrared spectroscopy
GF griseofulvin
GFP green fluorescent protein
HA sodium hyaluronate
HCl hydrochloric acid
ID inner diameter
L-100 Eudragit L-100
NaCl sodium chloride
NaOH sodium hydroxide

15
OD outer diameter
PAA poly(acrylic acid)
PAM poly(acrylamide)
PMAA poly(methylacrylic acid)
PBS phosphate buffer solution
PCL polycaprolactone
PdI polydispersity index
PDLLA poly-DL-lactic acid
PDMAEMA poly(2-dimethylamino-ethylmethacrylate)
pDNA plasmid DNA
PEG polyethylene glycol
PEI polyethylenimine
PFA perfluoroalkoxy alkane
pKa acid dissociation constant
PLA poly(lactic acid)
PLGA poly(lactic-c-glycolic acid)
PS polystyrene
PTFE polytetrafluoroethylene
PVP polyvinylpyrrolidone
SEAP secreted alkaline phosphate
SEM scanning electron microscopy
siRNA silencing RNA
TEM transmission electron microscopy
THF tetrahydrofuran
Q0 characteristic flow rate

16
d0 characteristic jet diameter
q charge
I current
ρ density
r distance form cone apex
R droplet radius
φ electric potential in spherical coordinates
En electric stress from the field normal to the cone surface
K electrical conductivity
te electrical relaxation time
Q flow rate
g gravity
h height
δ inverse of dimensionless flow rate
dj jet diameter
φent polymer fraction at chain entanglement
φch.ov polymer fraction at chain overlap
φray polymer fraction at Raleigh limit
p pressure
εr relative permittivity
α semi-angle of cone
γ surface tension
Es tangential electric field on the jet surface
ε0 vacuum permittivity
µ viscosity

17
δμ viscous dimensionless parameter
V voltage

18
Contents
Chapter One - Introduction ........................................................................................ 23
1.1 Biomedical Applications of Electrospray ........................................................ 23
1.2 Thesis Aim ....................................................................................................... 24
1.3 Thesis Structure................................................................................................ 24
Chapter Two – Literature Review ............................................................................. 26
2.1 Electrospray ..................................................................................................... 26
2.1.1 Basic Mechanism ...................................................................................... 26
2.1.2 Spray Modes .............................................................................................. 27
2.1.3 Taylor Cone-jet Spray ............................................................................... 28
2.1.4 Jet Break-up ............................................................................................... 30
2.1.5 Coulomb Fission ........................................................................................ 32
2.2 Single Electrospray .......................................................................................... 32
2.2.1 Current Scaling Laws ................................................................................ 33
2.2.2 Jet Diameter Scaling Laws ........................................................................ 34
2.2.3 Electrospray Parameters ............................................................................ 36
2.2.3.1 Flow Rate ........................................................................................... 36
2.2.3.2 Voltage ............................................................................................... 37
2.2.3.3 Spray Current ..................................................................................... 38
2.3 Coaxial Electrospray ........................................................................................ 39

19
2.3.1 Driving Liquid Concept............................................................................. 39
2.3.2 Current Scaling Law .................................................................................. 41
2.3.3 Jet Diameter Scaling Law .......................................................................... 42
2.4 Electrospraying Polymers ................................................................................ 45
2.4.1 Solvent properties ...................................................................................... 45
2.4.2 Polymer properties .................................................................................... 47
2.5 Gene Delivery .................................................................................................. 51
2.5.1 Gene Vectors ............................................................................................. 53
2.5.1.1 Viral Vectors ...................................................................................... 53
2.5.2.2 Naked DNA ....................................................................................... 55
2.2.5.3 Non-viral Vectors .............................................................................. 56
Chapter Three – Experimental Methods .................................................................... 62
3.1 Electrospray Methodology ............................................................................... 62
3.2 Coaxial Electrospray Apparatus ....................................................................... 63
3.2.1 Liquid Supply ............................................................................................ 64
3.2.2 Syringes ..................................................................................................... 69
3.2.3 Coaxial Needle .......................................................................................... 70
3.2.4 Extractor .................................................................................................... 76
3.2.5 Applied Voltage ........................................................................................ 78
3.2.6 Collection Plate ......................................................................................... 79
3.2.7 Working Distance ...................................................................................... 79

20
3.3 Monitoring Equipment ..................................................................................... 80
3.3.1 Visualising the coaxial cone-jet mode ....................................................... 80
3.3.2 Shunt Resistor ............................................................................................ 82
3.3.3 Ambient Conditions .................................................................................. 82
3.4 Solution Preparation ......................................................................................... 83
3.5 Electrospray Experimental Procedure .............................................................. 86
3.6 Particle Characterisation Methods ................................................................... 87
3.6.1 Particle Composition ................................................................................. 87
3.6.2 Particle Size ............................................................................................... 88
3.6.3 Particle Structure ....................................................................................... 91
3.6.4 Zeta Potential ............................................................................................. 93
Chapter Four – Particle Characterisation ................................................................... 95
4.1 Introduction ...................................................................................................... 95
4.2 Materials and Methods ..................................................................................... 96
4.2.1 Materials .................................................................................................... 96
4.2.2 CMC Protonation ...................................................................................... 96
4.2.3 Fabrication of Bulk-Assembled Complexes .............................................. 96
4.2.4 Fabrication of Electrosprayed Particles ..................................................... 97
4.2.5 Fourier Transform Infrared Spectroscopy ................................................. 97
4.2.6 Dynamic Light Scattering ......................................................................... 98
4.2.7 Atomic Force Microscopy ......................................................................... 98

21
4.2.8 Transmission Electron Microscopy ........................................................... 99
4.3 Results and Discussion................................................................................... 100
4.3.1 Particle Composition ............................................................................... 100
4.3.1.1 Single Polymer Analysis.................................................................. 100
4.3.1.2 Deciding the CMC:PDMAEMA Weight Ratio ............................... 102
4.3.1.3 Self-Assembly with Varying pH ..................................................... 105
4.3.1.4 CMC Content of Electrosprayed Particles ....................................... 111
4.3.2 Particle Sizing .......................................................................................... 112
4.3.3 Zeta Potential ........................................................................................... 114
4.3.4 Particle and Complex Structure ............................................................... 116
4.4 Conclusion ..................................................................................................... 117
Chapter Five – Effect of Polymer Structure on Electrosprayed Particles ............... 120
5.1 Introduction .................................................................................................... 120
5.2 Materials and Methods ................................................................................... 121
5.2.1 Materials .................................................................................................. 121
5.2.2 Fabrication of Self-assembled Particles .................................................. 121
5.2.3 Fabrication of Electrosprayed Particles ................................................... 121
5.2.4 Fourier Transform Infrared Spectroscopy ............................................... 122
5.2.5 Dynamic Light Scattering ....................................................................... 122
5.3.6 Atomic Force Microscopy ....................................................................... 122
5.3.7 Transmission Electron Microscopy ......................................................... 123

22
5.3 Results and Discussion................................................................................... 124
5.3.1 Impact of the molecular weight and concentration of CMC ................... 124
5.3.2 Impact of Using Block Copolymer as the Shell Polymer ....................... 126
5.3.2.1 FTIR ................................................................................................. 126
5.3.2.2 Sizing ............................................................................................... 129
5.3.2.3 Zeta Potential ................................................................................... 134
5.3.3 Comparing the use of HA and CMC ....................................................... 137
5.3.3.1 FTIR ................................................................................................. 137
5.3.3.2 Sizing ............................................................................................... 141
5.3.3.3 Zeta Potential ................................................................................... 145
5.3.3.4 TEM ................................................................................................. 146
5.4 Conclusion ..................................................................................................... 148
Chapter Six – Conclusions and Future Work .......................................................... 151
6.1 Conclusions .................................................................................................... 151
6.2 Future work .................................................................................................... 153
7. References ............................................................................................................ 155

23
Chapter One
Introduction
1.1 Biomedical Applications of Electrospray
Electrospray has many applications such as an ionization source for mass
spectrometry1, colloid thrusters for use in spacecraft propulsion2, nanoscale particle
deposition3. In the biomedical field there is current ongoing research into its ability to
produce monodisperse capsules for drug and gene delivery systems4. The main
attractive features are the ability to produce monodisperse particles5 and size control
based on known electrospray scaling laws6. Monodispersity allows for better control
of drug or gene dosage volume and a predictable release profile7, and size is important
as the optimum size for efficient cell uptake can vary between cells8-10.
Another advantage of electrospray is the ability to use organic solvents with
delicate therapeutic molecules. For example with coaxial electrospray, where two
liquid are electrosprayed simultaneously, if one liquid contains the organic solvent
and the other the therapeutic molecule, the exposure of the therapeutic molecule to the
solvent is limited and so damage is prevented11.
Although the throughput of electrospray may be low when producing particles
on the nanoscale, the system can be upscaled by using an array of needles rather than
a single needle12, 13. Overall this makes electrospray a relatively easy, one-step method

24
for producing drug and gene delivery systems. In the case of gene delivery, it is
particularly attractive as a means of producing a non-viral delivery vector14-16.
1.2 Thesis Aim
The aim of this thesis is to look at the use of coaxial electrospray as a method
of preparing core-shell particles for a gene delivery system. This was done by
comparing various characteristics of complexes produced through bulk-assembly with
particles produced through electrospray.
Additionally two different polymers were compared for the shell and a further
two for the core. For the shell polymers, a homopolymer and block copolymer were
compared to see their different effects on particle size and structure. For the core
polymers, two different long-chain polymers were compared to assess their suitability
as a cost-effective model for DNA.
1.3 Thesis Structure
Chapter Two contains a literature review comprised of two sections. The first
gives an overview of electrospray including the current understanding of single
electrospray scaling laws and their applicability to coaxial electrospray; the effect of
solvents and polymers on electrosprayed particle formation and coaxial electrospray
liquid combinations. The second section looks at current DNA delivery systems used
in research; describes various non-viral self-assembly systems and previous research
into electrosprayed DNA vectors.
Chapter Three introduces the experimental methods used in this thesis. The
first part looks at the decisions that went into designing the coaxial electrospray set-
25
up and describes the polymers and solvents used. The second part looks at the methods
used to characterise the particles produced by electrospray.
Chapter Four characterises particles for their composition, size and zeta
potential and compares them to particles produced by self-assembly, a commonly used
method for creating delivery systems.
Chapter Five compares the use of
a homopolymer and block copolymer for the particle shell; looks at the influence of
different molecular weight of the core polymer; and compares the use of two different
long-chain polymers (carboxymethyl cellulose and hyaluronic acid) as potential
models for DNA.
Chapter Six presents the overall conclusions to the work in this thesis and
directions for future work.

26
Chapter Two
Literature Review 2.1 Electrospray
2.1.1 Basic Mechanism
Figure 2.1 Basic electrospray set-up
Electrospray is a method by which an electrified liquid is sprayed through a
needle and the resulting wet droplets or dry particles are collected. The liquid is
charged by setting up an electric field between the needle and the collection plate,
commonly achieved by applying high voltage directly to the needle and grounding the
collection plate (Fig. 2.1). The liquid becomes charged as it passes through the needle,
electrostatic repulsion overcomes the liquid’s surface tension changing the emerging
jet into a spray, which is attracted towards the grounded collection plate. In this set-
up, an extractor is also often used to help accelerate the droplets from the spray down
Liquid supply
Needle at high voltage
Cone-jet
Grounded collection plate

27
towards the collection plate. This is necessary as the droplets all possess a like charge
and so will scatter due to electrostatic repulsion.
2.1.2 Spray Modes
Figure 2.2 Spray modes as applied voltage increases
Depending on the voltage applied, different spray modes are observed (Fig.
2.2), and these can be classified as either dripping or spraying modes17-19. As the
applied voltage increases, the main observed modes are as follows:
1) Dripping mode - The main forces at play are gravity and surface tension. When
gravity overcomes surface tension, a droplet falls from the end of the needle to the
collection plate.
2) Pulsation mode - This takes place over four phases: 1) accumulation of liquid, 2)
cone formation, 3) liquid jet ejection, and 4) relaxation of the meniscus20.
3) Cone-jet mode - The liquid meniscus forms a stable cone-shape (the Taylor cone)
at the end of the needle and emits a steady jet which breaks up into a spray.
4) Multi-jet mode - Several jets are emitted from the meniscus.
2) Pulsating 3) Cone-jet 4) Multi-jet 1) Dripping

28
2.1.3 Taylor Cone-jet Spray
When a liquid passes through an electrified needle, over a certain range of
applied voltage the meniscus will form a stable, jet-emitting cone at the end of the
needle17. This stable cone is known as the Taylor cone21, and the cone-jet spray mode
is considered the ideal mode for electrospray due to its stability.
Figure 2.3 Cone-jet diagram, where r is the distance from the cone apex and α is the semi-
angle of the cone
Excluding the region very close to the apex, the Taylor cone can be considered
hydrostatic. The balance between surface tension (γ) and the electric stress from the
field normal to the cone surface (En), is what gives the cone its stability22. The balance
of forces on the surface of an equipotential cone can be described by
𝛾
𝑟𝑡𝑎𝑛𝛼=
1
2휀0𝐸𝑛
2 (2.1)
where r is distance from the cone apex, α is the semi-angle of the cone (as seen in Fig.
2.3) and ε0 is the vacuum permittivity.

29
In spherical coordinates, the electric potential φ is given as
φ = 𝐴𝑟1
2⁄ 𝑃12⁄ (cos 𝜗) (2.2)
where the constant A is
A = (2𝛾
휀0𝑃12⁄
′2 (− cos 𝛼)𝑠𝑖𝑛2𝛼 𝑡𝑎𝑛𝛼)
12⁄
(2.3)
𝑃12⁄ is the Legendre function of the order of 1 2⁄ and ϑ = π − α. For the condition of
the cone being equipotential, 𝑃12⁄ 𝑐𝑜𝑠𝜗 = 0 which gives α to be 49.29°, known as the
Taylor angle22 (Fig. 2.3).
Figure 2.4 Various possible meniscus shapes of cone-jet sprays: a) Taylor cone, b) meniscus
curved away from cone axis, c) & d) meniscus curved towards cone axis. (Cloupeau, M. &
Prunetfoch, B. J Electrostat 22, 135-159 (1989)17)
However, the Taylor cone can be observed over a range of angles showing that
there are in fact multiple solutions. This is explored by de la Mora23 who expresses
the difference between the surface tension and electric stress as pressure difference
Δp, where Δp = 0 gives the 'perfect' Taylor cone, Δp < 0 gives a family of cones with
the meniscus curved away from the cone axis, and Δp > 0 gives a family with the
a) b) c) d)
30
meniscus curved towards the cone axis (Fig. 2.4). These different cone geometries
were also observed by Cloupeau et al.17; menisci curving away from the cone axis
were seen with high conductivity liquids (10-1 S/m), and menisci curving towards were
seen with low conductivity liquids (10-9 S/m).
At the apex of the Taylor cone, the forces become unbalanced leading to the
emission of a jet and this gives rise to the characteristic cone-jet spray mode.
2.1.4 Jet Break-up
Figure 2.5 a) axisymmetric instability and b) non-axisymmetric instability in an electrified
jet (Adapted from Hartman, R.P.A., Brunner, D.J., Camelot, D.M.A., Marijnissen, J.C.M. &
Scarlett, B. J Aerosol Sci 31, 65-95 (2000)24)
There are two modes of jet instability (Fig. 2.5) which lead to jet break-up,
axisymmetric (also known as varicose) and non-axisymmetric (also known as
whipping or kink)25 instability. In electrospray, the varicose instability dominates
leading to droplet formation, whereas in electrospinning the kink instability
dominates26 leading to fibre production.

31
Hartman et al.24 established three varicose break-up regimes: 1) a thread
develops between each ‘bulge’, the lower bulge breaks off to form a droplet, and the
thread retracts into the bulge above it, 2) the thread connecting two bulges breaks off
at both ends and forms a small secondary droplet, and 3) a secondary droplet develops
on the thread and a further thread develops between this secondary droplet and main
droplet which then breaks off to form an even smaller droplet. The change between
these regimes is related to the current which is in turn dependent on the flow rate. In
order to keep a small size distribution, it is necessary to use as low a flow rate as
possible in order to stay within the first varicose break-up regime and keep the number
of secondary droplets to a minimum.
However, whipping break-up can also be seen in electrospray and this leads to
an increase in the droplet size distribution. The tipping point between the two break-
up modes is determined by the stress ratio of electric normal stress over the surface
tension stress. Hartman et al.24 showed through experimental data for a variety liquids
that this occurs around 0.3. The stress ratio increases with the current through the cone
and the current is itself dependent upon the flow rate. To avoid whipping break-up it
is therefore necessary to keep to a low flow rate. Hartman et al.27 also noted that for
small diameter needles, the applied voltage had an effect on the current; a 1 mm
diameter needle had a current 15% higher than for an 8 mm diameter needle for a cone
of the same dimensions relative to the needle diameter. For keeping a low droplet size
distribution, it is therefore important to use as low an applied voltage as possible i.e.
the onset voltage.

32
2.1.5 Coulomb Fission
Lord Rayleigh calculated the maximum charge q at which a droplet of radius
R can maintain a stable shape28,
𝑞2 = 64𝜋2휀0𝛾𝑅3 (2.4)
where ε0 = vacuum permittivity, and γ = surface tension. Following its formation
through jet break-up, a droplet’s radius will shrink due to evaporation as it travels.
This decrease in radius causes an increase in surface charge which, when it exceeds
the Rayleigh limit q, causes the droplet’s shape to destabilise and jets are emitted
which rid it of mass and excess charge before it returns once more to a stable shape.
2.2 Single Electrospray
Figure 2.6 Cone-jet mode of single electrospray
The physics of electrospray are complex owing to the many parameters
involved and our understanding of their working is incomplete. For the single cone-
jet mode (Fig. 2.6), scaling laws demonstrate the relation of current and jet diameter

33
to flow rate and present an extremely useful guide to controlling the size of droplets
produced from the spray.
2.2.1 Current Scaling Laws
The current scaling laws all show current (I) as being dependent on a flow rate
(Q) in the form 𝐼~𝑄𝑥, where the power index ranges from 1 4⁄ to 1 2⁄ . Most laws also
involve a constant that must be derived experimentally.
The earliest scaling law, derived by de la Mora & Loscertales29, was dependent
on flow rate and fluid properties (surface tension, conductivity and dielectric constant)
and was very close to Q1
2⁄ . However, Gañan-Calvo et al.5 later derived two separate
dependencies on flow rate. For liquids with high enough viscosity and conductivity,
the scaling law is close to Q1
2⁄ , but for liquids with low enough viscosity and
conductivity it is closer to Q1
4⁄ . The cut-off between 'high' and 'low' is determined
by 𝛿𝜇𝛿1
3⁄ , where 𝛿𝜇 =𝜌𝑄
𝜇𝑑0= (
𝜌𝜀0𝛾2
𝐾𝜇3)
13⁄
is the viscous dimensionless parameter and
δ =𝑄0
𝑄=
𝛾𝜀0
𝜌𝐾𝑄 is the inverse of the dimensionless flow rate (where µ is viscosity, ρ is
density, and K is conductivity) and both d0 and Q0 are characteristics length scales
found through the П-theorem of dimensionless analysis, and are the characteristic jet
diameter and flow rate respectively. Liquids with 𝛿𝜇𝛿1
3⁄ ≪ 1 are high viscosity, and
liquids with 𝛿𝜇𝛿1
3⁄ ≫ 1 are low viscosity. Agreement with the low viscosity Q1
4⁄
scaling law was seen by Yao et al.30, where the two liquids used both had a value of
𝛿𝜇𝛿1
3⁄ much greater than 1.

34
2.2.2 Jet Diameter Scaling Laws
The jet diameter scaling law can be used to predict the diameter of a droplet
formed immediately upon jet break-up6. De la Mora & Loscertales29 found the jet
diameter (dj) scaled with a characteristic length r*, which is itself proportional to Q1
3⁄ .
𝑑𝑗 = 𝐺(휀)𝑟∗ (2.5)
𝑟∗ = (
𝑄휀휀0
𝐾)
13⁄
(2.6)
When tested experimentally however, a variety of function 𝐺(휀) are found23.
One of the reasons suggested for this is in the way that dj is measured. If dj is found
by measuring droplet diameter, any evaporation from the droplet before the
measurement is taken will affect the diameter. If the jet itself is measured, then the
diameter will vary as the jet is not a true cylinder but decreases in diameter as it
extends from the Taylor cone23. Therefore the choice of where on the jet to measure
the diameter will have an effect on 𝐺(휀).
Gañan-Calvo et al.31 proposed an alternative scaling law based upon the
electrical potential decay within the region of transition from cone to jet (small relative
to capillary diameter but large relative to jet radius), being of the same order as the
kinetic energy flux. The electrical potential decay can be found through 𝐼∆𝑉 where 𝐼
is
𝐼~𝐾𝑅2𝐸𝑠 (2.7)

35
and ∆𝑉 (change in voltage) is
∆𝑉~𝐸𝑠𝐿 (2.8)
where 𝐸𝑠 (tangential electric field on the jet surface) is calculated from Taylor’s
solution.
𝐸𝑠~ (
𝜎
휀0𝐿)
12⁄
(2.9)
Therefore, for a jet of radius R, the electrical potential decay is found to be
𝐼∆𝑉~𝜎
휀0𝐾𝑅2
(2.10)
Putting this equal to kinetic energy flux 𝜌𝑈2𝑄 (where the characteristic velocity
𝑈~𝑄𝑅−2) gives
𝑅~ (𝜌𝑄3휀0
𝜎𝐾)
16⁄
(2.11)
Comparison with published data showed strong agreement with droplet
diameter scaling with R at a variety of flow rates both near and far from the minimum
flow rate31, 32. A comparison was also made between the two competing scaling laws,
looking at them in terms of the dimensionless droplet size and Weber number31 (Fig.
2.7), where clear agreement can be seen with Gañan-Calvo’s scaling law for cases
where the Weber number is below 20.

36
Figure 2.7 Comparison of experimental data with dimensionless droplet size (𝑅𝑑 𝑅𝜎⁄ ) as a
function of the Weber number. The solid black line represents Gañan-Calvo’s scaling law
(𝑅𝑑 𝑅𝜎⁄ = 𝑊𝑒), and the dashed black line represents de la Mora’s scaling law (𝑅𝑑 𝑅𝜎⁄ =
𝑊𝑒2
3⁄ ). The vertical dotted line represents the limit of the scaling law. (Adapted from
Gañan-Calvo, A.M. & Montanero, J.M. Physical Review E 79 (2009)31)
However, there is still recent data that does not agree with the Gañan-Calvo
scaling law. Park et al.33 examined electrospray of deionised water and saw good
agreement with the de la Mora scaling law of 𝑑𝑗 = 𝐺(휀)𝑟∗, where 𝐺(휀) = 0.88.
2.2.3 Electrospray Parameters
2.2.3.1 Flow Rate
The flow rate is a commonly controlled parameter and, in the case of creating
small diameter droplets, a low flow rate is desirable as it is related to jet diameter (seen
in section 2.2.2). Chen & Pui34 found 𝐾𝑄 (where K is conductivity and Q is flow rate)
to be related linearly to the emitted current, meaning that a higher conductivity allows
for a lower flow rate.

37
The minimum flow rate is of particular interest as it is where droplets with the
lowest size distribution will be generated. De la Mora & Loscertales29 found the
minimum flow rate relation 𝜂𝑚𝑖𝑛 = (𝜌𝐾𝑄𝑚𝑖𝑛
𝛾𝜀𝑟𝜀0)
12⁄
, where 𝜂𝑚𝑖𝑛 is a dimensionless
parameter of the order 1.
There have been a variety of other 𝑄𝑚𝑖𝑛 scaling laws derived for specific
liquid conditions. Gañan-Calvo et al.6 agreed with de la Mora’s scaling law in the case
of a liquid of low viscosity and high conductivity, but in situations where viscous
forces stall the jet below 𝑄𝑚𝑖𝑛, proposed that 𝑄𝑚𝑖𝑛 scales with 𝑄0 𝛿𝜇⁄ . Additionally,
Scheideler and Chen35 put forward another scaling law for viscous liquids of low
conductivity, 𝑄𝑚𝑖𝑛 scales with 𝛾𝐷2 𝜇⁄ where D is the outer diameter of the nozzle.
This is the first scaling law to take into account any characteristics of the needle.
2.2.3.2 Voltage
The appropriate applied voltage must be used in order to attain the stable cone-
jet spray mode. The voltage at which a stable cone-jet is first established is known as
the onset voltage. The cone-jet also displays hysteresis with regard to the voltage17.
When increasing the voltage, the spray mode will change from dripping mode to cone-
jet mode at V1 and then to multi-jet mode at V2. However, when decreasing the voltage,
a stable cone-jet will still be present below V1 and will change back to dripping mode
at a lower voltage V0.
The applied voltage can be negative or positive, which can be referred to as
spraying in negative-mode or positive-mode respectively. It is easier to achieve a

38
stable spray in positive-mode than negative-mode as electric discharge from the
needle-tip occurs at higher voltages more in the former than the latter36.
2.2.3.3 Spray Current
Figure 2.8 Current collected by an electrode held 2mm from the needle tip. (Marginean, I.,
Kelly, R.T., Page, J.S., Tang, K. & Smith, R.D. Analytical Chemistry 79, 8030-8036
(2007)19)
The spray current changes with spray mode and a jump in current can be seen
between each mode (moving from dripping mode up to multi-jet mode)19, 37. As Fig.
2.8 shows, the jump between spray modes is more distinct at lower flow rates in the
order of tens of nL/s. While the spray current cannot be controlled independently of
other parameters, it gives information about whether the spray is in a stable regime,
particularly at low flow rates.

39
2.3 Coaxial Electrospray
Figure 2.9 Cone-jet mode of coaxial electrospray
The concept of coaxial electrospray (Fig. 2.9) is the same as single
electrospray, but uses concentric needles to produce a spray consisting of droplets
with a core-shell structure, where most commonly the core is made up of the inner
needle liquid and the shell is made up of the outer needle liquid. Alternatively, the
inner liquid can swell and engulf the outer liquid. This approach was taken by Hwang
et al.38. The liquid used in the inner needle was viscoelastic and it expanded as it exited
the needle due to a phenomenon known as ‘die stress’. When the flow rate of the inner
liquid was greater than that of the outer liquid, this expansion was enough for the inner
liquid to engulf the outer liquid completely and so droplets were produced with the
inner needle liquid as the shell and the outer needle liquid as the core.
2.3.1 Driving Liquid Concept
Lopez-Herrera et al.39 introduced the concepts of a ‘driving liquid’ and
‘driving character’ as a way of describing a situation where the current is carried
wholly by the inner or outer liquid. When looking at a coaxial electrospray of ethylene
glycol (inner liquid, EG) and Somos (outer liquid, a type of resin), it was seen that the

40
emitted current changed when the Somos flow rate was altered, and hardly at all when
the EG flow rate was altered. Somos was referred to as the driving liquid, as the
emitted current was entirely dependent on the Somos flow rate. The 'driving character'
of a liquid was determined by seeing which of the two liquids had the lower electrical
relaxation time 𝑡𝑒 =𝜀𝑟𝜀0
𝐾. As can be seen, electrical relaxation time is dependent on a
liquid's conductivity and therefore, in a given pair of liquids the driving character can
be 'transferred' from one liquid to another by a sufficient increase in the conductivity
of the non-driving liquid.
Figure 2.10 Diagram of the cone-jet spray where 0 indicates the medium the electrospray
takes place in, 1 indicates the outer liquid and 2 indicates the inner liquid
The driving liquid affects the location of charges within the cone and jet. An
outer driving liquid means the charges will be located on the surface between the outer
liquid and the medium in which the electrospray takes place. With an inner driving
liquid, the charges will be located on the surface between the two liquids. The location
of charges has implications for the coaxial scaling laws given by Lopez-Herrera et
al.39, which is reflected in their use of the effective surface tension. When the outer
liquid is the driving liquid, 𝛾𝑒𝑓𝑓 = 𝛾01,where 𝛾01 refers to the surface tension between

41
the outer liquid and the outer medium. In the case of the inner liquid being the driving
liquid, when the outer liquid coating is sufficiently thin, the effective surface tension
is 𝛾𝑒𝑓𝑓 = 𝛾01 + 𝛾12 , where 𝛾01 is as before, and 𝛾12 refers to the surface tension
between the outer and inner liquids (Fig. 2.10).
2.3.2 Current Scaling Law
Figure 2.11 Data obtained for coaxial electrospray compared to Gañan-Calvo's current
scaling law. (Lopez-Herrera, J.M., Barrero, A., Lopez, A., Loscertales, I.G. & Marquez, M.
J Aerosol Sci 34, 535-552 (2003)39)
When looking at coaxial scaling laws, Lopez-Herrera et al.39 used various
combinations of EG, sunflower oil and water for coaxial electrospray with both inner
and outer driving liquids and the data obtained was made dimensionless using the
values given by Gañan-Calvo et al.5 with the addition of β which represents the
relative dielectric constant between the two liquids used (Fig. 2.11). Agreement was
seen with the single electrospray scaling law which follows the power law 𝑄1
2⁄ .

42
However, as can be seen in Fig. 2.10, one set of data (inner driving liquid: deionised
water, outer liquid: sunflower oil), while lying parallel to the 𝑄1
2⁄ scaling law line,
had significantly higher values than expected for the current. This discrepancy seems
unrelated to the use of an inner driving liquid as the values found from another inner
driven pair of liquids fall around the line of the scaling law. An explanation could not
be given for this behaviour when using water, suggesting that it is perhaps related to
the properties of deionised water. This indicates that there is still more work to be
done on improving the understanding of the current scaling laws for coaxial
electrospray for a great variety of liquids.
2.3.3 Jet Diameter Scaling Law
Figure 2.12 Mean droplet diameter with an outer driving liquid EG with an inner liquid of
sunflower oil (Lopez-Herrera, J.M., Barrero, A., Lopez, A., Loscertales, I.G. & Marquez, M.
J Aerosol Sci 34, 535-552 (2003)39)
For the jet diameter scaling law, in the outer driving liquid case it has been
observed by Lopez-Herrera et al.39 that when one flow rate is held constant and the
43
other altered, the droplet diameter increases linearly with flow rate, regardless of
whether it is the inner or outer liquid flow rate that is altered as can be seen in Fig.
2.12. This linear increase does not agree with either the de la Mora 𝑄1
3⁄ or the Gañan-
Calvo 𝑄1
2⁄ scaling law for single electrospray.
It is thought this stems from the fact that in single electrospray, the droplet
diameter is entirely dependent on the break-up of the electrified jet, but in outer-driven
coaxial electrospray, the droplet diameter is dependent on the break-up of the inner
liquid. The charged outer liquid is pulling the inner non-charged liquid along with it
through viscous stress at the jet’s liquid-liquid interface. Therefore the diameter of the
jet is a balance between the outer liquid accelerating the jet forward and the inner
liquid holding the jet back.
Figure 2.13 Mean droplet diameter with an inner driving liquid (EG) with an outer liquid of
sunflower oil (Lopez-Herrera, J.M., Barrero, A., Lopez, A., Loscertales, I.G. & Marquez, M.
J Aerosol Sci 34, 535-552 (2003)39)

44
When looking at the case of an inner driving liquid, again a linear dependency
on the driving flow rate was seen for an outer flow rate of 5 mL/h and 1 mL/h over a
range of 1-8 mL/h for the inner liquid (Fig. 2.13). However, at a higher outer flow rate
of 8 mL/h, any dependency on the inner flow rate was lost. It was suggested that this
is due to the droplet size being dependent on the capillary break-up of the more viscous,
uncharged sunflower oil.
While the linear dependency at lower flow rates seems to disagree with the
non-linear dependency of single electrospray, when the data is made dimensionless it
is difficult to conclusively rule out any agreement with either the 𝑄1
2⁄ scaling law of
Gañan-Calvo or the 𝑄1
3⁄ scaling law of de la Mora and Loscertales.
Figure 2.14 Mean droplet diameter with an inner driving liquid of ethanol and outer liquid
of olive oil (Mei, F. & Chen, D.R. Physics of Fluids 19, 103303 (2007)40)
Mei et al.40 also looked at liquid pairs with an inner driving liquid, but at much
lower flow rates and with driving liquids of a lower viscosity than EG (ethanol and

45
tributyl phosphate were examined) (Fig. 2.14). Although there is not a clear linear
dependence as in Fig. 2.13, there is an obvious increase in mean droplet diameter with
inner flow rate, up to an inner flow rate of 20 µL/min. This suggests again that there
is a limit beyond which the scaling law is not applicable.
2.4 Electrospraying Polymers
Coaxial electrospray presents an excellent method for encapsulation, and is
particularly attractive in the biomedical field for its ability to create a delivery system
for therapeutic molecules of small size and low polydispersity. It also allows for the
use of organic solvents with the shell polymer, which may be damaging to the
therapeutic molecules in other circumstances; the organic solvent is in contact with
the inner liquid for such a short time before evaporating, that there is negligible
negative effect.
2.4.1 Solvent properties
In order to produce dry polymeric particles with a core-shell structure, it is
important that the solvent in the outer liquid has completely evaporated by the time
the particle reaches the collection plate. The solvent evaporation rate therefore has an
effect on the minimum distance needed between needle and collection plate in order
to ensure complete evaporation. It also has an effect on when Coulomb fission occurs,
which is something to be avoided in order to ensure a small size distribution.
The solvent evaporation rate can also be altered by controlling the environment
in which the electrospray takes place, for example by enclosing the system in an
airtight chamber and introducing a flow of gas perpendicular to the direction of
spray41-43. However, the rate of gas flow also affects the motion of the droplets and

46
this must be accounted for when positioning the collection plate in order to ensure
maximum particle collection efficiency44.
The solvent evaporation rate also has an effect on particle morphology.
Zamani et al.45 used polymer dissolved in various ratios of dichloromethane (DCM)
and dimethylformamide (DMF). The mixture of these two solvents was used as DMF
has the effect of decreasing the effective solvent vapour pressure46 and so helps
decrease the fast evaporation rate of DCM in order to ensure the polymer chains have
time to diffuse through the droplet and form a shell before the solvent evaporates and
so reduce porosity42. DMF also has the effect of increasing electrical conductivity47.
However, particle size was seen to decrease with a lower DMF concentration and the
mixture of solvents also gave rise to particles with collapsed and non-spherical
morphologies. Although the reasons behind this are not addressed by Zamani et al.45,
the presence of fibres attached to the particles was reported which may have been
produced through Coulomb fission13. The presence of fibres was seen to decrease
when DCM alone was used and this could be explained by the lower conductivity,
meaning that the Rayleigh limit was not reached before sufficient polymer chain
entanglement despite the higher evaporation rate. Park & Lee48 also noted that in two
solvent systems, the differing evaporation rates could lead to phase separation of
polymer chain rich and polymer chain poor areas giving rise to porous particles.
As seen in the scaling laws, flow rate is related to the surface tension and
decreasing the solvent’s surface tension with surfactants can help lower the flow rate.

47
2.4.2 Polymer properties
The effect of polymer molecular weight on particles was also examined by
Zamani et al.45. Their findings showed that higher (57.6-91.6 kDa) and lower (31.3-
57.6 kDa) molecular weights did not have a significant effect on particle size, but did
have significant effect on particle release profiles. Both high and low weight polymers
gave similar particle morphologies - spherical with a dimpled surface.
Almería et al.13 looked at the effect of polymer entanglement on particle
morphology, and identified three different scenarios based on the polymer volume
fraction of a droplet at the time of Coulomb fission. First they defined three polymer
volume fractions: the polymer volume fractions at the Rayleigh limit (φray), at chain
overlap (φch.ov.) and at entanglement (φent).
Scenario 1: 𝜑𝑟𝑎𝑦 < 𝜑𝑐ℎ.𝑜𝑣.
The droplets undergo Coulomb fission, but following this they are still liquid
enough to reform into a spherical shape. Offspring droplets are produced which
increases the particle size distribution.
Scenario 2: 𝜑𝑟𝑎𝑦 > 𝜑𝑒𝑛𝑡
If there is sufficient polymer chain entanglement, the polymer shell will
prevent any disruption when Coulomb fission occurs. In this situation it is therefore
possible that the structure of the shell is formed enough that any offspring droplets
will consist of solvent only and so not affect the particle size distribution.
Scenario 3: 𝜑𝑐ℎ.𝑜𝑣. < 𝜑𝑟𝑎𝑦 < 𝜑𝑒𝑛𝑡

48
In this scenario, the polymer chains are sufficiently entangled to prevent the
droplet from rupturing at Coulomb fission, but not enough to keep the droplet in a
spherical shape. The morphologies of the final particles are therefore ‘frozen’ at the
time of fission, giving rise to elongated particles with long tails.
Coaxial electrospray has been used for biomedical purposes and often use
polymers as to create the shell for encapsulation of drugs or DNA. Table 2.1 outlines
some liquid combinations used, their spray conditions and the sizes of particles
produced. From this, it can be seen that DNA has previously been coaxially sprayed
successfully16, 49. However, one case looked at lipoplex production49, and the other
case16, while looking at polyplex production, only used a homopolymer and
additionally issues with the spray itself are evident and discussed further in section
3.2.3.

49
Core Shell Needle Dimensions Flow rates Concentration
Particle Size Reference Inner Outer Inner Outer Inner Outer
DNA in
OPTI-MEM
medium
PEI in OPTI-
MEM medium
ID: 0.21 mm ID: 0.6 mm 6 mL/h 6 mL/h 20 µg/mL 17.2 µg/mL 250 nm Wu et al. 201016
DNA in 1X
PBS
DC-Chol, Egg
PC, DSPE-PEG-
Mal in ethanol
(molar ratio
30:68:2)
ID: 0.21 mm ID: 0.6 mm 1.2 mL/h 1.2 mL/h 0.5 mg/mL 10 mg/mL 190 nm Wu et al. 200949
BSA in DI
H2O, PLGA in
TFE (1:5)
PLGA in TFE ID: 0.5 mm ID: 0.8 mm 0.8 mL/h 0.8 mL/h 39.4 mg/mL 30 mg/mL 2.41 µm Wang et al. 201350
BSA in DI
H2O
PLGA in DCM ID: 300 µm
OD: 560 µm
ID: 840 um 0.1-0.2 mL/h 1-2 mL/h 10-100 mg/mL 40-60 mg/mL 3-5.5 µm Zamani at al.
201445
BSA in DI
H2O
PLGA in DCM ID: 0.41 mm
OD: 0.72 mm
ID: 2 mm 0.2-1 mL/h 3-4 mL/h 100-200
mg/mL
50-150 mg/mL 5-10 µm Xie et al. 200851
PLGA in
DMAc
Oestradiol in
methanol
ID: 0.9 mm
OD: 1.5 mm
ID: 1.9 mm 0.12 mL/h 0.6 mL/hr 100 mg/mL 20-100 mg/mL 100 nm - 2.5
µm
Enayati et al.
201052
Paclitaxel in
olive oil
TiO2 in ethanol,
DMF, acetic acid
(1:1:1)
— — 0.8 mL/h 0.4 mL/h 1 g/mL 5 mg/mL 1.5-2 µm Jing et al. 201147
ALA in
ethanol
PLGA in acetone — — 1-1.8 (only
flow rate
ratio given)
2 — — 0.2-1 µm Guan et al. 201653
EE 100-55 in
ethanol
ERS in DCM ID: 0.3 mm
OD: 0.5 mm
ID: 1.0 mm 0.2 mL/h 0.4-0.8
mL/h
20 mg/mL 20 mg/mL 280 - 440 nm Hao et al. 201454
Ccurcumin in
acetone
PLGA in ethyl
acetate
ID: 0.33 mm
OD: 0.64 mm
ID: 1.01
mm
0.1-0.5 mL/h 0.1-5
mL/h
20-50 mg/mL 50-100 mg/mL 2-4 µm Yuan et al. 201555
GF in
chloroform
L-100 in ethanol ID: 0.4 mm ID: 0.8 mm 0.36 mL/h 0.5 mL/h 10 mg/mL 10 mg/mL 1.86 µm Zhang et al. 201143

50
PCL and DOX
in acetonitrile,
PVP and DOX
in ethanol
PLGA and CA4
in THF and
acetonitrile (2:8)
— — 0.2 mL/h 0.8 mL/h 70 mg/mL
50 mg/mL
100 mg/mL 424 nm
455.7 nm
Cao et al. 201456
Budesonide in
acetonitrile
PLGA in
acetonitrile
— — 0.048 mL/h 0.3 mL/h 1 mg/mL 2-50 mg/mL 289 nm - 1.2
µm
Lee et al. 201057
CDDP in
DMAc
PLGA in DMAc ID: 0.69 mm
OD: 1.07 mm
ID: 1.2 mm 0.12 mL/h 0.24 mL/h 2 mg/mL 20 mg/mL 850 nm Reardon et al.
201758
PLGA and
DOX in DCM
PDLLA in DCM — — 0.5-1 mL/h 2.5-7
mL/h
50-200 mg/mL 50-200 mg/mL 30 µm Xu et al. 201359
Abbreviations: ID inner diameter, OD outer diameter, Egg PC egg phosphatidylcholine, DC-Chol 3β-[N-(N’,N’-dimethylaminoethane)-carbamoyl] cholesterol,
PBS phosphate buffer solution, DI H2O deionised water, ALA 5-aminovulinic acid, EE 100-55 Eudragit L 100-55, ERS Eudragit RS, GF griseofulvin, L-100
Eudragit L-100, PCL polycaprolactone, PVP polyvinylpyrrolidone, DOX doxorubicin, CA4 combretastatin A4, THF tetrahydrofuran, CDDP cisplatin, DMAc
dimethylacetamide, PDLLA poly-DL-lactic acid, PLGA poly(lactic-c-glycolic acid)
Table 2.1 Liquid combinations used in coaxial electrospray for biomedical purposes. (Adapted from Kavadiya, S. & Biswas, P. J Aerosol
Sci 125, 182-207 (2018)60)
2.5 Gene Delivery
Gene Therapy Disease-type
Approving body
Year approved
Luxturna Retinal disease FDA, EMA 2018, 2018
YESCARTA Non-Hodgkin lymphoma FDA, EMA 2017, 2018
Kymriah Leukaemia FDA 2017
Zalmoxis Stem cell transplantations in high-risk blood cancer
EMA 2016
Strimvelis ADA-SCID (immuno-deficiency) EMA 2016
ImLygic Melanoma FDA, EMA 2015, 2015
Table 2.2 Currently approved genetic therapies
Gene therapy is the insertion of genes into a patient's cells for medical
treatment and is particularly promising with regard to treating genetic disease and
cancer. It is a relatively young field of research with clinical trials starting in 1989 and
only a handful of therapies currently approved by the US Food and Drug
Administration (FDA) and the European Medicines Agency (EMA) (Table
2.2). Luxturma, Strimvelis and ImLygic use viruses as their delivery vehicle (adeno-
associated virus, retrovirus and herpes simplex virus 1 respectively), while the other
therapies involve genetically modifying a patient’s own T-cells (a type of immune
cell) before returning them to the body.
Therapeutic genes can be used in various ways, including: 1) replacing a faulty
gene with a healthy version, 2) interfering with or preventing the activity of a disease-
related gene, or 3) promoting the death of diseased cells such as cancer cells. Gene
insertion into a cell requires a method of delivery and these methods can be divided
into two main categories - gene delivery of naked DNA directly to the site of interest,
and gene delivery which requires a vector.

52
For successful gene delivery, therapeutic genes must travel to target cells, enter
inside and then be expressed. Each of these stage poses a challenge: genes must
survive degradation within the body when outside the target cells, they must pass
through the cell membrane, and any gene vector must break down to release the genes
allowing them to be expressed.
Delivering a gene to a specific cell type requires a cell targeting strategy. A
common strategy is to identify a receptor that is overexpressed on the target cell
compared to other cells, and functionalise the delivery vector with an appropriate
ligand for the target receptor61, 62. An alternative strategy is external guidance. Silva
et al.63 incorporated magnetic nanoparticles into macrophage-derived vectors and
were able to guide them in vitro via an externally applied magnetic field. This strategy
has also been used successfully in rats for cardiac regeneration64, and to suppress
ovarian cancer growth in mice65.

53
2.5.1 Gene Vectors
Figure 2.15 Data on vectors used in clinical trials worldwide, compiled by the Journal of
Gene Medicine66
In the history of gene therapy clinical trials worldwide, so far only 1 out of a
total 2,597 has been classified by the Journal of Gene Medicine as using a non-viral
vector66 (Fig. 2.15, a detailed breakdown of vectors used can be found on the
website67). The vast majority of trials use viral vectors and a small portion use no
vector.
2.5.1.1 Viral Vectors
Viral vectors are the most commonly used vectors as they are already
optimised to travel through the body, enter cells and release DNA. While viral vectors
have differences in structure, the ones most commonly used in clinical trials can be
generalised to the following: genetic material encased in a protective shell (capsid)
coated with proteins which facilitate entry into the host cell. The main differences are

54
whether the genetic material is RNA or DNA, whether it is single or double strand, if
there is an additional envelope around the capsid and the types of proteins on the
outside of the virus.
However, there are several drawbacks to viral vectors. The first is
immunogenicity; there can be an immediate immune response upon administration of
the viral vectors68-70, or one can develop following repeat administration71-73. The
severe effects of immunogenicity were made tragically apparent during a clinical trial
involving the death of a patient74, and other clinical trials where patients went on to
develop leukaemia75, 76.
Additionally, immune responses can vary between animal models, making it
hard to predict the immune response in humans. Dicks et al.77 saw different cellular
and humoral immune responses to adeno virus-mediated immunisation between mice
and cattle, a clinical trial showed a lack of long-term gene expression in humans due
to T cell-mediated immunity, contradicting preclinical trial results which had seen
long-term expression in mice and dogs78. Li et al.79 also saw differences in immune
response between human and rhesus macaques to adeno-associated virus-mediated
gene transfer; long-term gene expression was achieved in macaques but not in humans.
In short, differences in immune response are possible between non-primate mammals,
primates, and humans which adds an additional layer of difficulty when setting up
clinical trials.
A second limitation is that each virus type has a set genome size, and the
amount of therapeutic genetic material that can be inserted is dependent on how much
of the genome can be safely deleted without compromising the ability of the virus to
55
perform gene delivery80. If the therapeutic payload does not fit in the virus, then non-
viral methods must be considered.
2.5.2.2 Naked DNA
Injecting naked DNA can avoid any issues that come about from immune
response to capsids or insertational mutagenesis – the occurrence of mutations in the
DNA due the insertion of additional base pairs. However, naked DNA has no
protection from degradation within the body and it has been shown in mice that the
half-life of injected plasmid DNA (pDNA) is around 10 minutes81. Therefore the use
of naked DNA is not ideal in situations where it cannot be delivered directly to the
target site.
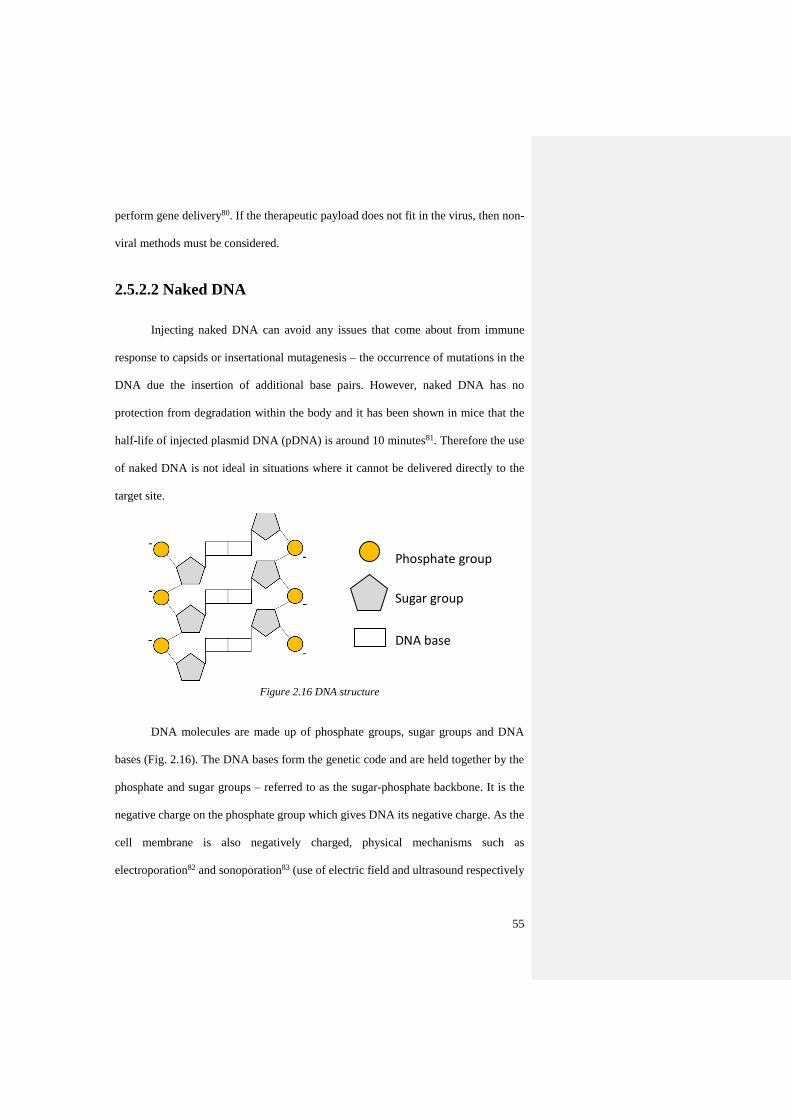
Figure 2.16 DNA structure
DNA molecules are made up of phosphate groups, sugar groups and DNA
bases (Fig. 2.16). The DNA bases form the genetic code and are held together by the
phosphate and sugar groups – referred to as the sugar-phosphate backbone. It is the
negative charge on the phosphate group which gives DNA its negative charge. As the
cell membrane is also negatively charged, physical mechanisms such as
electroporation82 and sonoporation83 (use of electric field and ultrasound respectively
Phosphate group
Sugar group
DNA base

56
to increase cell membrane permeability) are necessary to allow DNA to penetrate into
the cell.
2.2.5.3 Non-viral Vectors
DNA can be encapsulated in biodegradable polymers, creating a non-viral
DNA delivery system. Non-viral vectors are of particular interest as they provide a
solution to any issues with immunogenicity which are a possible risk when using viral
vectors74. As DNA has a negative charge, the use of a polycation (a polymer with a
positive charge) allows for the DNA to be compacted (known as DNA condensation)
thereby leading to a smaller capsule. As previously stated, the membrane of a cell is
negatively charged, so another benefit of using a polycation is that it is able to enter a
cell through a process called endocytosis84 (Fig. 2.17). The capsule will then be broken
down and so achieve transfection (transfer of DNA into a cell) of the encapsulated
DNA.
Figure 2.17 The process of endocytosis: 1) a particle approaches the cell membrane, 2) the
cell membrane engulfs the particle, 3) the cell membrane pinches off into a capsule (known
as a vacuole) and carries the particle into the cell.
Outside cell
Inside cell
Cell
membrane
1)
2)
3) Vacuole

57
Various structures of non-viral vector have been made and the methods by
which they are produced can be grouped into three main categories: basic electrostatic
interaction, encapsulation, and adsorption.
Figure 2.18 a) electrostatic interaction between DNA and a branched polycation leading to
a polyplex, b) a polycation with a PEG (polyethylene glycol) block and plasmid DNA
leading to a micelle with DNA complexed with the polycation at the core and a PEG corona,
c) DNA adsorbed onto a core, with a shell adsorbed onto the DNA using a layer-by-layer
technique (a) adapted from Liao, J.F. et al. Theranostics 7, 2593-2605 (2017)85, b) adapted
from Uchida, S. et al. Journal of Controlled Release 155, 296-302 (2011)86)
DNA is negatively charged, so polycations are used as they will easily
complex with DNA through electrostatic interaction85, 87 (Fig. 2.18a). The most basic

58
particle is simply the DNA entangled with a single type of polycation and the only
consideration needed is that the resulting polyplexes have an overall positive charge
so the main parameter to be controlled is the ratio of polymer to DNA.
DNA can also be encapsulated in a micelle structure through the use of block
copolymers, a polycation attached to a hydrophilic block. In aqueous phase the
positively charged block of the copolymer will complex with the DNA, with the
hydrophilic part of the copolymer forming a shell or corona 86, 88 (Fig. 2.18b) with the
polymer molecules aligned radially. The hydrophilic part of the polymer can also be
augmented with other components for other beneficial effects. Uchida et al.86 used the
addition of chondroitin sulfate to reduce inflammation at the site of injection, and
Dhande et al.89 were able to design a novel diblock glycopolymer that promoted the
uptake of pDNA capsules by liver cells.
Finally adsorption can be used to build up particles with the layer-by-layer
technique (Fig. 2.18c). DNA is adsorbed onto a core and further layers can be
adsorbed on top90, 91. Bishop et al.92 used five alternating layers of polymer and DNA
on gold nanoparticles to codeliver DNA and siRNA (silencing RNA). This method
also gives more control over the size of the particle; starting with a smaller core should
give a smaller final particle.
As well as structure, size is an important consideration in the production of
therapeutic delivery systems as it has an effect on the cell uptake8, but it is not always
the case that smaller is better. He et al.9 compared cell uptake for three particle
diameters (150 nm, 300 nm and 500 nm) for a variety of cell lines and found that in
all cases 150 nm had the highest uptake. However, Xu et al.10 looked at uptake for two
cell lines for a range of particle diameters (50 nm – 300 nm) and found that 100 nm

59
performed best and 50 nm performed worst. Therefore it is important to be able to
tune the size of any therapeutic delivery system depending upon the type of cell being
treated.
There are various polycations that have been used in research for gene
delivery16, 42, 93, 94. Polylactic acid (PLA) and poly(lactic-co-glycolic) acid (PLGA) are
commonly used95-98 because they are already approved for use by the FDA as they
degrade to carbon dioxide and water99. As well as biodegradability and
biocompatibility, polycations can also be selected for their intrinsic beneficial
properties. Both PLA and PLGA can be used as adjuvants to increase the efficacy of
a vaccine100-103, polyethylenimine (PEI) can be used to increase transfection rates104,
105, and coating with polyethylene glycol (PEG), known as PEGylation, can help
prevent aggregation106 and prevent capsules from being cleared from the body through
phagocytosis by preventing the adsorption of opsonins107.
It has been shown that DNA can be electrosprayed and maintain the capacity
for gene expression14, 108, making electrospray a good method for DNA encapsulation
and subsequently the production of a non-viral gene vector. However, there are very
few studies that have used DNA in electrospray.
Chen et al14 used coaxial electrospray plasmids containing Enhanced Green
Fluorescent Protein (eGFP) in the inner liquid, and an outer liquid of deionised water
with nitric acid in a 1:50 ratio. The outer liquid was used to control the charge of the
generated droplets. Rather than DNA encapsulation, this study looked at the use of
electrospray itself as a means of delivering and transfecting DNA – the liquids were
sprayed directly at live cells and were able to penetrate the cell membrane due to their
high velocity.

60
Wu et. al.16 compared self-assembled plasmid DNA/polyethylenimine (PEI)
polyplexes with coaxially sprayed capsules of plasmid DNA in PEI. Two types of
plasmid were used, one which encoded green fluorescent protein (GFP) and another
which encoded secreted alkaline phosphatase (SEAP). First, the plasmids were
sprayed in single electrospray and the sprayed plasmids were tested with gel
electrophoresis to ensure that they had not degraded. GFP plasmids were sprayed at 6
mL/h and SEAP plasmids in 4, 6 and 8 mL/h. In all cases it was seen that the plasmids
were not damaged by the electrospray process.
The plasmids were then coaxially electrosprayed with PEI in the outer needle
to produce plasmid DNA/PEI polyplexes and all liquids were sprayed at 6 mL/h. The
plasmids and PEI were both suspended in OPTI-MEM medium. These polyplexes
were compared with those produced by self-assembly in the same concentrations. The
electrosprayed particles were found to be smaller than the self-assembled ones for
GFP, but larger for SEAP. However, as particle size in electrospray is related to flow
rate, it is possible that using a lower flow rate with SEAP would have been able to
produce smaller particles. When looking at SEAP expression in transfected cells, the
electrosprayed particles produced by different flow rates were compared so it is
possible that the 4 mL/h sprayed particles would have been smaller than the self-
assembled ones. A reason for only measuring the size of 6 mL/h sprayed particles is
not given.
When looking at cell transfection, the electrosprayed GFP particles showed
similar results to the positive control of Lipofectamine 2000 unlike the self-assembled
particles which were not as effective at transfection. However, the GFP only allows
for a qualitative analysis of transfection so the SEAP transfection was necessary to

61
allow for a quantitative measure of transfection by measuring the activity level of
alkaline phosphate. Once again, it was seen that the electrosprayed particles had a
better rate of transfection than the self-assembled ones. However, the reason for this
is not established. While the structures of the particles were not compared, it is
possible that it is the positively charged PEI shell in the core-shell structure produced
by coaxial electrospray gives it an advantage over a self-assembled structure when
entering a cell which has a negatively charged surface, allowing the particle to be
endocytosed.
The mechanism by which PEI transfects is known as the “proton sponge”109,
although the precise details are still debated110. It is thought that PEI is able to escape
endosomes within the cell by absorbing protons that are pumped into the endosome.
Following the accumulation of protons in the endosome, chloride ions passively enter
the endosome which increases the ionic pressure. This leads to water entering the
endosome which then swells and bursts, releasing the PEI into the cell.

62
Chapter Three
Experimental Methods
3.1 Electrospray Methodology
The objective is to use coaxial electrospray to generate capsules of DNA with
a polymer coating for use as a non-viral gene delivery system. The important features
of these particles are that they have diameters on the nanoscale, demonstrate a core-
shell structure and have an overall positive charge for efficient cell uptake (section
2.5.1).
Important parameters to be controlled are of course the flow rate, due to the
scaling law dependence of droplet diameter upon it, and the applied voltage to the
needle in order to be spraying in the stable cone-jet mode.
It is also important to visualise the liquids as they exit the needle tip to ensure
that they are forming a stable cone-jet, and also to monitor the spray current for further
confirmation of a stable spray. Fluctuations in spray current could indicate flow rate
fluctuations that are not perceptible from simply viewing the cone-jet. Additional
parameters to monitor are the ambient temperature and humidity as changes in
temperature will affect liquid properties and changes in humidity will affect the
solvent evaporation rate.

63
3.2 Coaxial Electrospray Apparatus
A schematic of the equipment used can be seen in Fig. 3.1, and is as follows:
the liquid is supplied with a controlled flow rate by two syringe pumps with glass
syringes. These are connected to a stainless steel coaxial needle by perfluoroalkoxy
alkane (PFA) tubing with Luer lock fittings. A stainless steel extractor is positioned
slightly below the needle and below that is a grounded metal collection plate. Both the
needle and extractor are connected to high voltage power supplies.
The current through the needle was measured with a 100 kΩ shunt resistor,
and a 1 MΩ resistor was used to protect the system from an unexpected current surge.
The cone-jet was imaged with a CCD camera attached to a zoom lens with a ring light
source.
Figure 3.1 Schematic of electrospray set-up used
100kΩ resistor
1MΩ resistor
Light source
Camera
Computer
H.V.P.S.
Collection plate
Voltmeter Coaxial needle
Extractor at high voltage
Outer syringe pump
Inner syringe pump

64
When setting up the electrospray equipment, there are many options to
consider and each has their own advantages and disadvantages and the choices taken
in choosing electrospray equipment are often not reported. The following sections will
examine the various alternatives available and explain why each piece of equipment
was eventually chosen for use.
3.2.1 Liquid Supply
There are two choices for liquid supply, either syringe pumps or pressure head.
Using syringe pumps allow for precise control of the flow rate (which is related to
particle size), but a disadvantage is that pulsations can occur due to the step motor
which drives a syringe pump and can be a factor in the polydispersity seen in particle
sizes. Li et al.111 used a co-flow microfluidic device (Fig. 3.2) to observe these
pulsations. In that report, the outer liquid was supplied under gas pressure and the
inner liquid supplied by syringe pump, with the inner liquid needle protruding into the
flowing outer liquid. The two liquids were chosen to have a low interfacial tension to
better visualise at the interface any ripples caused by flow fluctuation.
Figure 3.2 Set-up using both syringe pump and pressure head (Li, Z., Mak, S.Y., Sauret, A.
& Shum, H.C. Lab on a Chip 14, 744-749 (2014)111)
Syringe Pushing block
Syringe pump

65
The inner liquid formed a jet and ripples were visible at the interface between
the two liquids. The frequency of ripples was analysed and seen to relate to the step
size of the syringe pump. They estimated that the fluctuations for flow rate would be
on the order of 1-2%.
Pressure-head driven electrospray systems remove this fluctuation, but leave
the flow rate susceptible to changes in applied voltage. Ryan et al.37 used gravity
pressure head for single electrospray, and saw that in the cone-jet spray regime, flow
rate increased approximately linearly with voltage for a variety of liquids. The flow
rate in syringe pump driven systems is unaffected by voltage due to high hydraulic
impedance.
Syringe pumps are overwhelmingly the most popular choice30, 42, 45, 50, 51, 56-59,
112-117 with the remainder of papers only stating that the liquid was fed through a needle
without stating the method16, 93. However, it can be assumed that the popularity of
syringe pumps is due to their ease of use when controlling flow rate which is vital for
particle diameter control. At the time of writing, coaxial electrospray papers regarding
encapsulation using pressure head as a liquid feed method could not be found.
One of the aims of this research was to produce small diameter particles (on
the nanoscale) which requires the use of low flow rates. As established by the jet
diameter scaling law – jet diameter scales with flow rate and so lower flow rates will
produce smaller droplets. However, at low flow rates, fluctuations have a strong effect
on cone-jet stability.
Syringe pumps are used as standard for biological encapsulation. They operate
using a stepper motor, meaning that rather than moving in a smooth, continuous

66
motion, the plunger of the syringe is pushed a discrete distance each time the motor
turns by one step. When syringe pumps are operating near their minimum flow rate,
these steps can be seen through fluctuations in liquid flow.
With this in mind, a gravity-driven pressure-head system was chosen for the
initial electrospray set-up. The body of a plastic syringe was punctured so that the
liquid inside was open to atmosphere. The pressure-head could then be adjusted by
raising or lowering the syringe to alter the height of the liquid meniscus. The liquid
flow could be stopped by moving the meniscus to the level of the needle tip. The
pressure-head was calculated by 𝑃 = 𝜌𝑔ℎ, where h was normalised to zero at the level
of the needle tip.
Figure 3.3 a) both liquids partially fill their respective needles, b) inner liquid syringe is
raised until a drip of inner liquid can be seen, c) increasing voltage is applied to the needle
until cone-jet mode is reached, d) outer liquid syringe is raised until outer liquid emerges
from needle and coaxial cone-jet mode is established
Setting up a stable cone-jet spray was fairly quick and easy with this set-up
and the process is outlined in Fig. 3.3. Both syringes were filled with liquid and the
liquid menisci were kept below the height of the needle tip to prevent them from
dripping, and potentially mixing together. The inner liquid syringe was raised until
liquid could be seen protruding from the needle tip. Increasing voltage was then
a) b) c) d)

67
applied to the needle until the onset voltage was reached and a stable cone-jet was
formed. In these initial tests, the inner liquid cone-jet was established first as the inner
liquid was the driving liquid. The syringe for the outer liquid was then gradually raised
until the liquid emerged from the outer needle and formed a coaxial cone-jet.
The reason for establishing the inner cone-jet first was to ensure that the liquids
could not mix within the coaxial needle which would lead to instability and also
produce particles which lack a core-shell structure.
This method produced a stable cone-jet spray and polymer particles. However,
there were some drawbacks to this approach. The first was that the height of the
syringe was adjusted by hand and measured against a ruler, so the flow rate was not
finely controlled. The second drawback was that the flow rate was not directly known,
and this was complicated by the fact that flow rate is affected by changes in applied
voltage even while remaining in the same spray mode. A change in flow rates would
also lead to a change in the polymer ratios meaning that repeatability could be a
problem as the onset voltage was not always the same due to uncontrolled
environmental factors such as humidity and temperature. Finally, over the course of
electrospray the height of the menisci will of course drop, and so change the pressure-
head and flow rate.

68
Figure 3.4 a) inner cone-jet is established to find onset voltage, outer needle is empty, b)
voltage applied to needle is turned off, extractor voltage kept on, inner flow rate stopped,
and outer syringe connected, c) the outer needle is filled, and inner cone-jet re-established,
d) outer liquid is drawn over the inner cone-jet forming a coaxial cone-jet
As a result of these difficulties a decision was taken to move to using syringe
pumps (PHD 2000 Infusion, Harvard Instruments) to allow for direct and precise
control over the flow rates without being affected by the applied voltage. The same
coaxial spray set-up sequence was followed; the inner liquid cone-jet was established
first before the outer liquid is added. The set-up procedure outlined in Fig. 3.4 however,
was slightly more complex. After the inner cone-jet had been established, the flow
rate and applied voltage were then stopped while the outer flow rate was connected.
The reason for keeping the outer liquid disconnected while setting up the inner flow
was to ensure that there was no build-up of polymer on the connecter as the solvent
used (chloroform/DMF mixture) was quite volatile.
The inner liquid flow was restarted, voltage applied and the cone-jet was re-
established. Then the outer liquid flow was started, filling the outer needle and the
outer liquid was drawn over the inner cone-jet forming a coaxial cone-jet.
a) b) c) d)

69
3.2.2 Syringes
Another important factor in the liquid supply is the choice of syringe and the
material used for connectors. Plastic syringes are extremely convenient for use; they
are cheap so a new one can be used each time and no cleaning is required. However,
they are subject to deformation by pressure which will affect the accuracy of the
delivered flow rate, making a glass syringe a better choice. In practice however, the
type of syringe used is often unspecified16, 30, 45, 50, 56-59, 114, 117-119, or a reason for the
choice between plastic113, 115, 116 or glass42, 93 is not given.
As well as the choice between syringe materials, the compatibility between
solvents and all materials that they will come into contact with in the system needs to
be considered120, to prevent degradation of the equipment and contamination of the
liquid supply. For the outer liquid, it was determined that stainless steel and
polytetrafluoroethylene (PTFE) would be compatible with potential solvents, so a
stainless steel Luer lock connector was used to connect the tubing to the coaxial needle,
and a syringe with a PTFE Luer lock connector and PTFE tipped plunger (Hamilton
Gastight) was chosen. For the inner liquid, again a glass and PTFE syringe (Hamilton
Gastight) was used. PFA tubing (inner diameter: 750 µm) was used between the
syringes and coaxial needle in both cases.

70
3.2.3 Coaxial Needle
The most conventional configuration of a coaxial needle is two straight needles,
one within the other. The material for the coaxial needle is almost always stainless
steel and can be made with55 or without49 a method to centre the inner needle within
the outer needle (Fig. 3.5a), although without centring the inner needle can be off-
centre (Fig. 3.5b).
Figure 3.5 Coaxial needles a) six pieces of wire are welded onto the outside of the inner
needle to ensure it is centred within the outer needle55 b) no centring method is used, leaving
the inner needle off-centre49 (Adapted from Yuan, S. et al. Plos One 10 (2015)55 and Wu, Y.
et al. Molecular Pharmaceutics 6, 1371-1379 (2009)49)
There is an alternative configuration which was used by Hwang et al38 to
electrospray core-shell particles of high concentration polymers. In this set-up (Fig.
3.6), to avoid having to centre the needle, the inner needle was instead bent to be
touching the inside of the outer needle in order to create an easily reproducible inner
needle position. While this seems counterintuitive to producing core-shell particles,
this set-up takes advantage of ‘die swell’, a process that applies to viscoelastic fluids.
a) b)
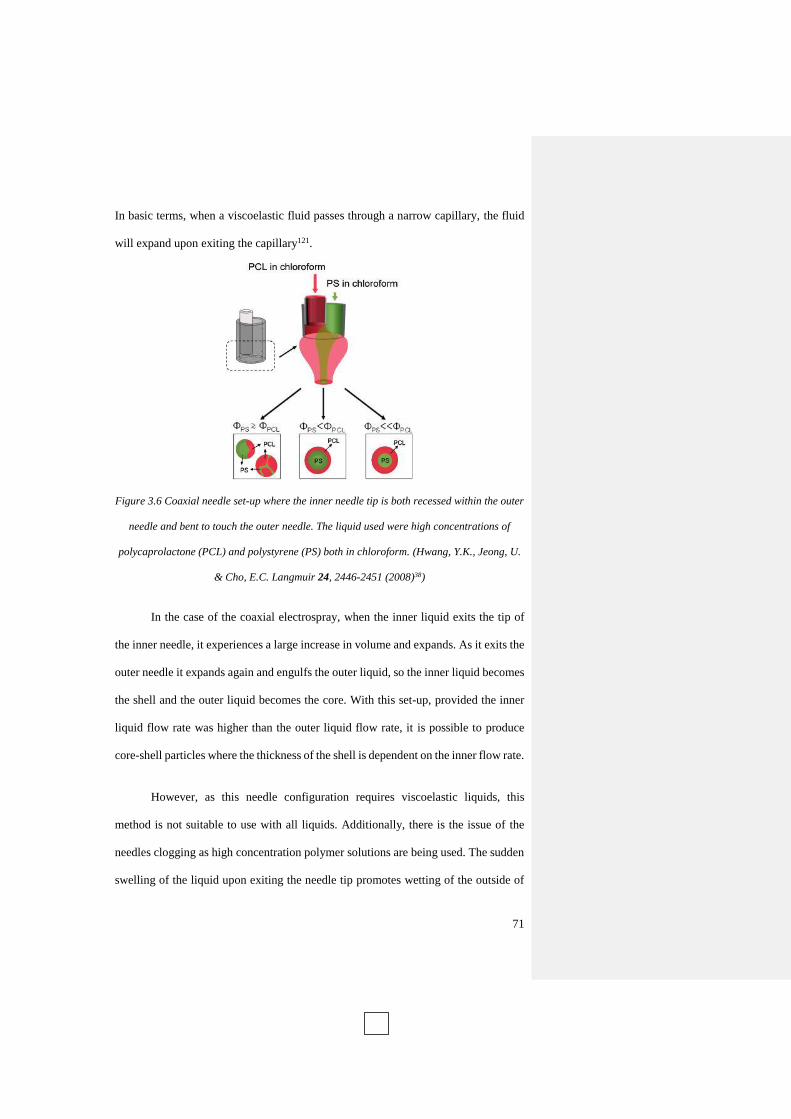
71
In basic terms, when a viscoelastic fluid passes through a narrow capillary, the fluid
will expand upon exiting the capillary121.
Figure 3.6 Coaxial needle set-up where the inner needle tip is both recessed within the outer
needle and bent to touch the outer needle. The liquid used were high concentrations of
polycaprolactone (PCL) and polystyrene (PS) both in chloroform. (Hwang, Y.K., Jeong, U.
& Cho, E.C. Langmuir 24, 2446-2451 (2008)38)
In the case of the coaxial electrospray, when the inner liquid exits the tip of
the inner needle, it experiences a large increase in volume and expands. As it exits the
outer needle it expands again and engulfs the outer liquid, so the inner liquid becomes
the shell and the outer liquid becomes the core. With this set-up, provided the inner
liquid flow rate was higher than the outer liquid flow rate, it is possible to produce
core-shell particles where the thickness of the shell is dependent on the inner flow rate.
However, as this needle configuration requires viscoelastic liquids, this
method is not suitable to use with all liquids. Additionally, there is the issue of the
needles clogging as high concentration polymer solutions are being used. The sudden
swelling of the liquid upon exiting the needle tip promotes wetting of the outside of

72
the needle, and the fast evaporation of the solvent means that a large precipitate can
be left behind. This was seen particularly with polymer solutions with a high glass
transition temperature and larger diameter needles were required for stable spraying.
Therefore this needle configuration is not suitable for aims of this thesis.
Figure 3.7 a) inner needle (28 gauge), b) outer needle (21 gauge), c) assembled coaxial
needle, d) SEM image of needle-tip showing centring divots in outer needle, e) diagram (not
to scale) demonstrating a cross-section of the needle’s centring system
The stainless steel coaxial needle (ramé-hart instrument co.) centres the inner
needle by means of divots pressed in from the outer needle (Fig. 3.7d & e). The
centring is important to ensure a symmetrical electric field around the tip of the needle,
and to ensure an even flow of the outer liquid in the annular space around the inner
needle. Needles with a blunt tip rather than bevelled tip were chosen as a bevelled tip
needle has a much thinner wall at the tip and so any degradation would have a far
greater effect on the symmetry of the electric field requiring needles to be replaced
a) b)
c)
Outer needle
Inner needle
Divots
d)
e)

73
more frequently compared with a blunt tip. The inner needle (Fig. 3.7a) was 28 gauge
(inner diameter: 0.178 mm, outer diameter: 0.356 mm) as it was the smallest needle
offered by ramé-hart instrument co. for a centred coaxial needle that could be
dissembled. The outer needle (Fig. 3.7b) was chosen to be 21 gauge (inner diameter:
0.508 mm, outer diameter: 0.810 mm) as this was the lowest sized outer needle that
had an inner diameter large enough to fit around the inner needle. The smallest
diameter needles possible were chosen in order to be able to produce small,
monodisperse particles. While Tang & Gomez saw no effect on droplet diameter with
needle gauge when using pure liquids122, Arya et al. found that mean particle size and
polydispersity of electrosprayed chitosan particles reduced with needle size93.
The primary concern when using the needle is how to prevent wetting; that is
how to prevent the liquid from clinging to and travelling up the outside of the
individual needles as can be seen in Fig. 3.8. This is necessary because in the case of
the inner needle, it can interfere with the flow of the outer liquid and potentially lead
to the liquids mixing. In the case of the outer liquid, it can collect on the outside of the
needle and then be drawn back down into the cone-jet, leading to a sudden increase in
flow rate and destabilisation.

74
Figure 3.8 The outer liquid can be seen wetting up the outside of the needle (Adapted from
Wu, Y., Fei, Z., Lee, L.J. & Wyslouzil, B.E. Biotechnol Bioeng 105, 834-841 (2010)16)
To avoid wetting, the outside and flat edge of the outer needle were coated in
a solution (C2 liquid crystal concentrate v2, GTechniq) which works to form a crystal
layer over the outer surface of the outer needle. The coating was achieved by dipping
the outer needle into the C2 solution while pushing air through the needle to avoid the
inside being coated. It was then left to air-dry. The inner needle was not coated as
problems with the inner liquid wetting the outside of the inner needle were not
encountered.
Figure 3.9 a) outer liquid wetting to the inner edge of the outer needle, b) outer liquid
wetting to the outer edge of the outer needle
inner liquid
outer liquid
a) b)

75
There is also a choice between having the outer liquid attached either to the
inner edge of the outer needle (Fig. 3.9a) or wetting to the outer edge (Fig. 3.9b). Even
if a stable cone-jet spray is established with the outer liquid wetting to the outer edge
of the outer needle, it is still possible for it to begin to wet up the outside of the needle
during spraying. Keeping the outer liquid attached to the inner edge of the outer needle
reduces the possibility of this happening and so reduces the risk of instability.
With a coaxial needle, there is also a choice between whether to have the inner
needle tip recessed, protruding49, 112 or level with the outer needle tip. Although this
is not a parameter generally commented upon, from images and schematics it can be
seen that all three configurations are in use16, 123, 124.
Figure 3.10 Different levels of protrusion inner needle a) cone-jet mode with inner needle
level with outer needle, b) cone-jet mode with 1 mm protrusion, c) dripping mode with 2 mm
protrusion (Adapted from Sofokleous, P., Lau, W.K., Edirisinghe, M. & Stride, E. Rsc
Advances 6, 75258-75268 (2016)125)
Sofokleous et al125 compared the three configurations (Fig. 3.10) and found
that the inner needle recessed by 2 mm gave the best performance. This was
determined by looking at the encapsulation rate and average particle diameter for each
inner needle position. The inner needle recessed by 2 mm had the best result in both
a) b) c)

76
cases, and the second-best position was 1 mm protruding. However, when the needle
was protruding by 2 mm, a stable cone-jet could not be established. This was
determined to be because the vertical distance from the needle tip to the tip of the cone
was less than 2 mm and therefore the inner needle tip interfered with the formation of
the meniscus of the cone-jet.
Practically speaking, in an inner driving liquid scenario for the start-up
sequence used, having the inner needle protruding is the only configuration that allows
for visual confirmation that a stable cone-jet has formed without the inner liquid
wetting up the outside of the needle. It is also easier to measure the protrusion of the
inner needle with the camera and so ensure that the needle configuration is repeated
for each experiment, than with a recessed or level inner needle.
The final stabilising factor for the set-up to ensure a stable cone-jet was to
place the mount for the needle, extractor and collection plate on a vibration isolation
table (Micro 40, Halcyonics).
3.2.4 Extractor
The use of an extractor helps to concentrate the footprint of the electrospray
and also encourage the droplets to travel downwards to the collection plate and was
kept at around 1-2 kV relative to ground. It was also found that the extractor played a
role in pulling the inner liquid down when the extraction potential was progressing the
electrospray from dripping mode to cone-jet mode whilst preventing fluid from
wetting up the needle. This was important when the inner liquid flow was stopped and
the voltage applied to the needle was turned off, as the extractor voltage could be left

77
on as the inner liquid would otherwise be prone to wetting up the outside of the inner
needle.
Figure 3.11 Image of needle and extractor holder with grounded plate
With regard to position relative to the needle tip, while wanting the extractor
to be close to the tip of the needle, it had to be far enough away that it did not interfere
with the view of the cone-jet through the camera. The extractor was therefore fixed a
few mm below the needle-tip so that the view of both the cone and jet were not
obstructed. The extractor was fixed to arms (indicated in Fig. 3.11) extending
downwards from the needle mount and could be moved slightly around the arms
before being fixed in place by nylon bolts so that the needle tip could be centred in the
extractor aperture.
The aperture of the extractor used was 13 mm in diameter. Initially a smaller
diameter was used but problems were encountered where if the cone became biased
Extractor
Grounded plate
Needle holder
Arms
Needle

78
towards one side of the needle, the jet could reach the side of the aperture and short
circuit.
3.2.5 Applied Voltage
Figure 3.12 Diagram indicating the voltages applied to the needle and extractor relative to
ground
Voltage was applied to the needle and extractor by high voltage power supplies
(HCL 14-20000, FuG) (Fig. 3.12) via a ring terminal around a screw that screwed into
the needle holder to make contact with the needle, and two more ring terminals that
were screwed onto the extractor plates ensuring a good connection. The voltage
applied to the needle was positive to reduce electrical discharge36 and the onset voltage
was used, generally with the applied voltage to needle around 5-6 kV relative to
ground. The extractor was at a lower positive voltage, generally 1-1.5 kV relative to
ground and was adjusted based on keeping the inner liquid pulled down and
preventing it from wetting up the outside of the inner needle as the applied needle
voltage is increased.
Needle
Extractor
Grounded plate
HVPS (5-6 kV)
HVPS (1-1.5 kV)

79
3.2.6 Collection Plate
There are two main methods of collection, either wet or dry. Wet collection
involves spraying into a liquid such as deionised water or a buffer solution that is held
within a grounded container42, 49, 57. A magnetic stirrer may also be used to avoid
agglomeration of the particles42.
Dry collection simply involves spraying directly onto a grounded dry substrate,
often aluminium foil. In some cases, a heat plate may be used to increase solvent
evaporation from the collected particles112. However, there needs to be a balance
between solvent evaporation rate and polymer diffusion rate. If the solvent evaporates
too quickly then there is insufficient time for the polymer to diffuse through the shell
while it is still liquid and so a porous structure is formed.
Different types of collection were required for different particle analysis
methods and these are outlined in section 3.6.
3.2.7 Working Distance
The distance from the needle-tip to the collection substrate is known as the
working distance and can range from short distances of a few centimetres42, 57, to over
20 cm50. This represents the drying time for the particles i.e. the time taken to travel
from needle-tip to the collection plate is the time that the solvent has to evaporate and
leave behind the polymeric particle.
The spray itself may take place in atmosphere and the solvent evaporate as it
travels to the collection substrate, or there may be a gas flow applied to increase

80
solvent evaporation42, 57, 112 which can be used to decrease the required working
distance.
In order to carry out the experiments for this research, the working distance
was determined by collecting dry particles at different working distances and
measuring the mean diameter. If a larger working distance shows a smaller mean
diameter then it can be assumed that the smaller size is due to solvent evaporation i.e.
at the shorter working distance the particles were not fully dry. Particles were
collected at 25mm and 50mm working distances and the peaks of the particle
distribution function was determined by AFM (atomic force microscopy). No
significant difference was found between the mean particle height and so a working
distance of 25mm was deemed to be sufficient (use of AFM to measure particle size
is discussed in more detail in section 3.6.2). The use of the shorter working distance
was also preferable as it reduces the particle spread over the collection substrate,
making it easier to image more particles at a time with AFM.
3.3 Monitoring Equipment
3.3.1 Visualising the coaxial cone-jet mode
It is important to image the liquid as it exits the needle-tip in order to determine
which mode the electrospray is in as the applied voltage is increased. In addition,
viewing the needle-tip will reveal any wetting of the needle or bias in the spray which
is undesirable.

81
The electrospray was lit with a ring light (KL 1500 electronic, Schott) and a
USB CCD camera (UI-2230SE-C-HQ, iDS) with a zoom lens (ZOOM 125, Optem)
and 10x objective lens (M Plan Apo, Mitutoyo).
The ring light helps produce more diffuse lighting and reduce reflection of
light off the liquid. A 20x objective lens (M Plan Apo, Mitutoyo) was also tested in
order to get a clearer image of the jet and so enable a more accurate measurement of
the jet diameter, but the shortness of the focal length meant that the metal housing of
the lens itself biased the direction of the spray and so it was not suitable for use.
Initially, the coaxial system was tested with paraffin oil (inner liquid) and
ethylene glycol (outer liquid). Fluorescein (Sigma-Aldrich) was dissolved into the
ethylene glycol to give a contrast against the paraffin oil to help visualise the coaxial
Inner needle
Outer needle
Inner liquid, single electrospray
Coaxial electrospray
Outer liquid
a)
b)

82
cone-jet. The thickness of the outer liquid in the cone-jet made the interface between
the two liquids very easy to identify. However, when the outer liquid was changed to
polymer dissolved in a low viscosity solvent, the outer layer became much thinner and
the even with fluorescein in the inner liquid, it was not possible to visualise the
interface with the camera.
Figure 3.13 a) Start-up with cone-jet of inner liquid only, b) coaxial electrospray where
outer liquid can be seen attached to the inner edge of the outer needle
The presence of the coaxial cone-jet was confirmed visually by watching for
the single inner cone-jet (Fig. 3.13a) changing to a cone-jet where the outer edge was
attached to the inner edge of the outer needle (Fig. 3.13b), after the outer liquid had
been introduced into the electrospray system. The jet diameter could also be imaged
with the camera to give an idea of the initial wet droplet size prior to solvent
evaporation.
3.3.2 Shunt Resistor
A shunt resistor was used to monitor for current fluctuation on the coaxial
needle. A 100kΩ resistor was placed in series in the circuit with a voltmeter in parallel.
The current could then be calculated by dividing the recorded voltage by 100kΩ. It
was used in series with a 1 MΩ resistor to protect the system from any unexpected
current surge.
3.3.3 Ambient Conditions
The temperature and humidity are also important factors in electrospray.
Changes in temperature can of course affect the properties of any liquids and humidity

83
also has an effect, particularly on the electrospray of polymers. Moisture in the air
reduces solvent evaporation which can have an effect on the working distance
requirements and also the morphology of the dried particles. The temperature and
relative humidity were both monitored using a temperature and humidity data logger
(DT-172, CEM). The temperature could be controlled by the air conditioning in the
lab, but the relative humidity could not be – on days of high humidity, it was often
difficult to obtain a stable cone-jet. The experiments themselves were all conducted
within a fume cupboard (Capitair Flex M391, Erlab).
3.4 Solution Preparation
DNA is a long chain negatively charged polymer which is stable in aqueous
phase. However it is not cost-effective to use in the volumes required by this
electrospray system purely for characterisation. Therefore it was decided to use
carboxymethyl cellulose (CMC) (supplied in its sodium salt form) as a stand-in for
DNA. Like DNA, CMC is also a long chain polymer, negatively charged and soluble
in water (Fig. 3.14) and far cheaper and available in a greater range of molecular
weights compared to other similar negatively charged polymers such as poly(acrylic
acid) (PAA)126, poly(acrylamide) (PAM)127 or poly(methylacrylic acid) (PMAA)128.

84
Figure 3.14 Structure of CMC sodium salt
For the block copolymer shell, PLA-PDMAEMA (Fig. 3.15c) was chosen for
use and it has been used in previous studies for self-assembled gene delivery
systems129, 130. PDMAEMA (Fig. 3.15b) is a polycation which has previously been
used to complex with DNA131-134 and is known for its good transfection rate both as a
homopolymer135 and as part of a copolymer136. It has previously been used in
electrospray as a copolymer but in single electrospray only and not for
encapsulation137. PLA (Fig. 3.15a) is biodegradable138, 139 and has been used
previously with both single electrospray as a drug carrier140 and coaxial electrospray
for protein encapsulation141.

85
Figure 3.15 a) PLA structure, b) PDMAEMA structure, c) PLA-PDMAEMA structure
The inner liquid was composed of CMC (Mw 90,000, Sigma-Aldrich or Mw
250,000, Aqualon) dissolved at a concentration of 100 µg/mL in a mixture of
deionised water (80%) and ethanol (20%). Deionised water is known to be difficult to
achieve cone-jet mode with, as its high surface tension means it has a tendency for
electrical discharge142. Ethanol was therefore added to the inner liquid to reduce the
surface tension and so improve the ease of electrospray.
The outer liquid was composed of the outer polymer (either PDMAEMA or
PLA13-PDMAEMA22) dissolved in mixture of chloroform (80%) and
dimethylformamide (DMF) (20%) at 1 mg/mL. Chloroform has been used previously
with polymers for electrospray143 and has a high solvent evaporation rate. The DMF
was used as a cosolvent to induce slight miscibility with the inner liquid in order to
prevent the outer polymer from precipitating at the needle-tip144.
Both liquids were degassed in a sonic bath (FB15051, Fisherbrand) at ambient
temperature for 30 min before use.
a) b)
c)

86
3.5 Electrospray Experimental Procedure
The liquids were prepared, degassed and loaded into syringes. The inner liquid
was pushed manually through the feedline and examined to ensure there were no air
bubbles present. The feedline was connected to the coaxial needle, and air was blown
through the outer needle while the applied voltage to the extractor was turned on to
prevent the possibility of any needle wetting. The inner liquid pump was started and
the extractor voltage was increased until the liquid was dripping with the droplets
pulled directly down from the needle.
Voltage was applied to the needle until the inner liquid reached cone-jet mode.
The flow rate and needle applied voltage were then stopped and the outer liquid
connected with the outer feedline filled. The pumps for both liquids were then
restarted and the applied voltage to the needle turned on. When the outer liquid had
filled the outer needle, it was drawn over the cone-jet of the inner liquid and the
coaxial cone-jet was established.
The flow rates used were 0.2 mL/h for the inner liquid and 0.1 mL/h for the
outer liquid. The inner flow rate was determined by running the inner liquid in single
electrospray and increasing the flow rate until a stable cone-jet for 30 min could be
achieved. The outer liquid was then added and the flow rate again increased until a
stable coaxial cone-jet could be maintained.
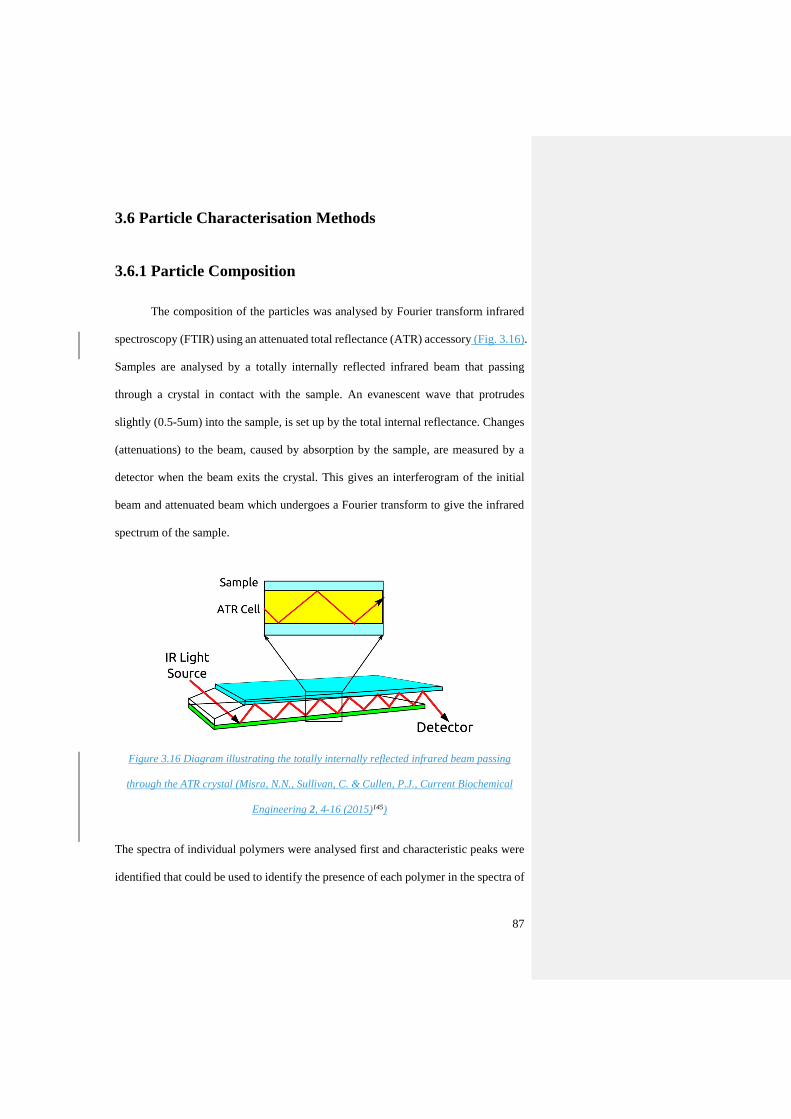
87
3.6 Particle Characterisation Methods
3.6.1 Particle Composition
The composition of the particles was analysed by Fourier transform infrared
spectroscopy (FTIR) using an attenuated total reflectance (ATR) accessory (Fig. 3.16).
Samples are analysed by a totally internally reflected infrared beam that passing
through a crystal in contact with the sample. An evanescent wave that protrudes
slightly (0.5-5um) into the sample, is set up by the total internal reflectance. Changes
(attenuations) to the beam, caused by absorption by the sample, are measured by a
detector when the beam exits the crystal. This gives an interferogram of the initial
beam and attenuated beam which undergoes a Fourier transform to give the infrared
spectrum of the sample.
Figure 3.16 Diagram illustrating the totally internally reflected infrared beam passing
through the ATR crystal (Misra, N.N., Sullivan, C. & Cullen, P.J., Current Biochemical
Engineering 2, 4-16 (2015)145)
The spectra of individual polymers were analysed first and characteristic peaks were
identified that could be used to identify the presence of each polymer in the spectra of

88
the coaxially electrosprayed particles. Comparison with spectra of self-assembled
particles of varying polymer ratio allowed for the creation of a calibration curve. This
could be used to calculate the polymer ratio of electrosprayed particles and check if
the ratio in which the polymers were electrosprayed had been conserved.
For FTIR analysis the collection method was on aluminium foil wrapped
around a glass slide for stability. From a variety of samples with different spray times,
a spray time of 20 min was found to give a good spectra.
3.6.2 Particle Size
Figure 3.17 a) SEM image of dry collection on aluminium foil, b) SEM images of aluminium
foil c) blank gold-coated silicon wafer with smooth appearance, d) blank gold-coated silicon
wafer with rough appearance
a) b)
d) c)

89
A number of methods were used to measure particles size as they each have
their own drawbacks. Initially scanning electron microscopy (SEM) was used for
particle sizing, with dry collection initially on foil (Fig. 3.17a). However, the rough
surface of foil (Fig. 3.17b) made image analysis difficult and so the collection
substrate was changed to gold-coated silicon wafer. This again presented its own
problems as the gold-coating did not always give a smooth surface (Fig. 3.17c & d).
Atomic force microscopy (AFM) was considered next. A piezoelectric crystal
is used to oscillate a cantilever near its resonant frequency. When the tip is close to
the sample surface, the amplitude of oscillation decreases due to interaction with the
sample. When the amplitude changes, the height of the cantilever is automatically
adjusted through a feedback loop to return the oscillation to its original amplitude.
The movement of cantilever is tracked by a laser which reflects off the back of the
cantilever onto a photodiode detector (Fig. 3.18). This allows for the topography of a
sample to be imaged.
Figure 3.18 Diagram showing the laser which reflects off the cantilever in, allowing the
motion to be detected by the photodiode in order to image the topography of the sample
photodiode
laser
cantilever
sample
sample holder

90
While for SEM, the particle size can be measured from the diameter of imaged
particles, for AFM the geometry of the cantilever tip used to determine the topography
of the sample can lead to particle diameter being measured as larger than they actually
are. As can be seen from Fig. 3.19, while data is collected based upon the position of
the cantilever tip, it is in fact the sides of the cantilever tip that contact the particle.
Therefore when measuring the diameter of nanoparticles that are assumed to spherical,
it is common practice to take the maximum peak height of a particle as the diameter146,
147.
Figure 3.19 Diagram demonstrating how tip geometry leads to a horizontally measured
particle diameter that is greater than the actual particle diameter. Measuring the diameter
vertically, i.e. via the maximum peak height of a particle, gives a more accurate
measurement. (Delvallée, A., Feltin, N., Ducourtieux, S., Trabelsi, M. & Hochepied, J.-F.
International Congress of Metrology, 06007 (2013)146)
Like SEM, AFM requires the use of dry samples. For electrosprayed samples,
the particles were sprayed directly onto silicon wafer for 3 min, where the spray time
was determined by comparing samples that had been sprayed for 3, 5 and 10 min. The
sample density of 3 min was considered to give the best sample density for image
91
processing. For self-assembly, particles were made up in aqueous phase, the solution
was dropped onto silicon wafer and left to dry in ambient conditions.
The zetasizer was also used to size particles in suspension. The zetasizer uses
a technique known as dynamic light scattering to calculate the radius of suspended
particles based upon their motion which is detected by a laser shone through the
sample. Particles suspended in solution undergo random motion known as Brownian
motion which can be modelled with the Stokes-Einstein equation. Based upon their
motion and other parameters in the equation, the hydrodynamic radius of the particle
is calculated - that is the radius of a solid spherical particle that would move in the
same way under the same conditions.
For collection, electrosprayed particles were sprayed
into a petri dish of grounded deionised water for 30 min, and
bulk-assembled complexes were assembled at pH 7 in
deionised water.
3.6.3 Particle Structure
Particle structure was analysed by transmission electron microscopy (TEM)
(Fig. 3.20). Optical microscopy resolution is limited by the wavelength of light.
Electron miscroscopy is able to achieve much higher resolution due to the much
smaller wavelength of an electron. TEM generates a beam of electrons which is then

92
accelerated through an applied voltage and focussed by condensers by means of an
applied magnetic field which exerts a force on the electrons.
Figure 3.20 Diagram of TEM showing the path of the electron beam through the microscope
(Ali, M., (Suez University, 2015)148)
Images are created by electrons passing through the sample and striking a
phosphor screen which is detected by a charged-couple device (CCD). Where more
electrons pass through the sample, more light is detected from the phosphor screen
leading to contrast in the image. Electron dense parts of the sample appear darker as
fewer electrons are able to pass through.
For electrospray sample collection, dry collection of 2 min spray time onto
300 mesh copper TEM grids (Agar Scientific) was used. For bulk-assembled samples,
particles were assembled in aqueous phase, dropped onto TEM grids and left to dry
overnight in ambient conditions. In both cases, the inner phase was stained with silver
ions to increase electron density and so provide better contrast against the shell
polymer. For electrosprayed particles, to prepare the inner liquid, 100 µg/ml of CMC

93
was incubated for 1 h with 25 µg/ml of silver nitrate in a solution of 80% deionised
water and 20% ethanol. The particles were fabricated as detailed in section 4.2.4 and
sprayed directly onto a TEM grid for 3 min. In the case of self-assembly, 500 µg/ml
of CMC was incubated for 1 h with 125 µg/ml of silver nitrate in deionised water. The
particles were bulk assembled in solution, and the solution dropped onto a TEM grid
and left to dry in ambient conditions.
3.6.4 Zeta Potential
Particle charge was measured by zeta potential (Zetasizer Nano ZS, Malvern),
which is a measure of the charge that develops at the interface between a sample and
the liquid it is suspended in. When a particle in is solution, an electric double layer is
formed on the particles surface. The surface charge attracts ions of the opposite charge
which are tightly bound to the surface - the Stern layer, and this layer in turn attracts
ions which are more loosely bound - the diffuse layer. The zeta potential is a measure
of charge taken at the slipping plane which lies at the boundary between the diffuse
layer and the bulk suspending liquid.
To measure the zeta potential, the suspended sample is placed in a zeta cell
(Figure). A charge is applied across the cell and the motion of the particles is detected
by a laser, as with particle sizing. Based upon the particle velocity under an applied
electric field of known strength the zeta potential of the particles can be calculated.
Zeta potential requires samples to be suspended in an ionic solution.
Electrosprayed samples were sprayed into 1 mL of 10 mM NaCl (sodium chloride)
for 30 min to achieve a weight concentration of 60 µg/mL, above the 10 µg/mL
minimum recommended by the instrument manufacturer. Self-assembled particles

94
were assembled in deionized water for a weight concentration of 350 µg/mL. 0.1 mL
of this solution was added to 0.9 mL 10 mM NaCl to give a final weight concentration
of 50 µg/mL.
95
Chapter Four
Particle Characterisation
4.1 Introduction
Self-assembly is a process by which molecules can form organised structures
through interactions based upon their inherent characteristics such as charge or
hydrophobicity, rather than being ‘built’ through external guidance. It is a commonly
used method for creating core-shell structure polymer capsules88, 89, 104, 149. Although
coaxial electrospray in principle allows the structuring of two phases into a core-shell
particle, a comparison with bulk-assembled complexes may allow us to see whether
any interaction takes place between the core and shell polymer during the electrospray
process.
In this chapter, bulk-assembled complexes are produced at varying pH as the
encapsulated (CMC) and encapsulating polymer (PDMAEMA) are weak
polyelectrolytes displaying pH-responsive behaviours150-155. Hence characterisation
of the resulting particles would allow to determine the impact of pH-associated
changes in the conformation of these electrolytes on the interfacial assembly of the
nanomaterials.
Coaxially electrosprayed particles are characterised by their chemical
composition, size and structure. In terms of the chemical composition, FTIR

96
spectroscopy is used to identify the presence of both polymers and estimate their
respective ratios.
The mean particle size is assessed by AFM and DLS, particle structure is
imaged by TEM and zeta potential measured. These characteristics are then compared
with those of particles directly self-assembled from the bulk.
4.2 Materials and Methods
4.2.1 Materials
The polymers used were sodium carboxymethyl cellulose (CMC) and poly[2-
dimethylamino)ethyl methacrylate] PDMAEMA. CMC (Mw 90,000) was obtained
from Sigma-Aldrich, and PDMAEMA was synthesised by Dr Danyang Li (QMUL).
Solvents used were chloroform, dimethylformamide (DMF) and ethanol, all obtained
from Sigma-Aldrich and used as received.
4.2.2 CMC Protonation
CMC was dissolved in deionised water to form a 500 µg/mL solution. From
this two solutions further were made, one with the pH decreased with hydrochloric
acid (HCl) to protonate the CMC, one with the pH increased by sodium hydroxide
(NaOH) to deprotonate the CMC.
4.2.3 Fabrication of Bulk-Assembled Complexes
CMC was dissolved in deionised water to form a 500 µg/mL solution and
PDMAEMA was dissolved in deionised water to form a 500 µg /mL solution. These
97
solutions were then mixed in a 1:5 volumetric ratio (CMC:PDMAEMA) and left to
incubate for 1 h, forming a suspension of bulk-assembled polyelectrolyte complexes.
Appropriate volumes of HCl or NaOH were added to the solutions prior to mixing in
order to obtain three solutions at different pH (pH 5, pH 7 and pH 11). The samples
were then freeze-dried and the precipitate collected for FTIR analysis.
4.2.4 Fabrication of Electrosprayed Particles
The electrospray apparatus used was as outlined in Fig. 3.1. The inner liquid
was formed of CMC dissolved in a mixture of 80% deionised water and 20% ethanol
at a concentration of 100 µg/mL. The outer liquid was formed of PDMAEMA
dissolved in a mixture of 80% chloroform and 20% DMF at a concentration of 1
mg/mL. The liquids were sprayed separately in single electrospray at the onset voltage
for cone-jet mode (5-6 kV) with a suitable extractor voltage (1-1.5 kV). The liquids
were also sprayed coaxially in cone-jet mode, with the inner liquid at a flow rate of
0.2 mL/hr and the outer liquid at 0.1 mL/hr. The particle collection was dependent on
the method of particle characterisation.
4.2.5 Fourier Transform Infrared Spectroscopy
Attenuated total reflectance Fourier transform infrared (ATR-FTIR)
spectroscopy (Tensor 27, Bruker) was used to characterise the molecular structure and
composition of the polymers in solid form, freeze-dried residue of bulk-assembled
complexes at varying pH, and dry polymer particles from single and coaxial
electrospray which were collected on aluminium foil for 20 min and dried in a vacuum
oven at 40°C overnight. The liquids for electrospray were prepared as detailed in the

98
previous chapter (section 3.4) and the flow rates used were 0.2 mL/h for the inner
liquid and 0.1 mL/h for the outer liquid.
4.2.6 Dynamic Light Scattering
Dynamic light scattering (DLS) (Zetasizer Nano ZS, Malvern) was used to
determine the hydrodynamic diameter and measure the zeta potential of bulk-
assembled complexes and electrosprayed particles. Electrosprayed particles were
sprayed into grounded deionised water for 30 min and grounded 10 mM NaCl for 30
min for sizing and zeta potential measurements respectively. Bulk-assembled
complexes were assembled at pH 7 in deionised water for sizing and in 10 mM NaCl
for zeta potential measurements.
4.2.7 Atomic Force Microscopy
AFM (NTegra, Bruker) was used with silicon cantilever probes (RTESP-300,
Bruker) which were plasma-treated to render them hydrophilic and prevent particles
adhering to them. Electrosprayed particles were collected on silicon wafers for 3 min,
and bulk-assembled complexes were generated in deionised water and dropped onto
silicon wafers at low concentrations (to prevent aggregation) and left to dry in ambient
conditions.
AFM was performed in semi-contact or tapping mode and images were
acquired with NOVA software where preliminary image processing was performed to
flatten the images. Further image processing was performed in MATLAB. A script
was written to threshold images to remove noise caused by surface roughness, identify
centroids and give the diameter and maximum peak height of each centroid146. The
images were then examined by eye to remove any obvious non-rounded shapes that

99
were likely debris, aggregation or a particle dragged along the wafer. Furthermore,
any particles which were only 9 pixels in size were considered too small to be analysed
accurately and were therefore discounted.
4.2.8 Transmission Electron Microscopy
TEM (JEOL 2010, JEOL Ltd.) was used to image electrosprayed particles and
bulk-assembled complexes. The inner phase was stained with silver ions to provide
better contrast against the shell polymer. For electrosprayed particles, to prepare the
inner liquid, 100 µg/ml of CMC was incubated for 1 h with 25 µg/ml of silver nitrate
in a solution of 80% deionised water and 20% ethanol. The particles were fabricated
as detailed in section 4.2.4 and sprayed directly onto a TEM grid for 3 min. In the case
of self-assembly, 500 µg/ml of CMC was incubated for 1 h with 125 µg/ml of silver
nitrate in deionised water. The particles were bulk assembled in solution as in section
4.2.3, and the solution dropped onto a TEM grid and left to dry in ambient conditions.

100
4.3 Results and Discussion
4.3.1 Particle Composition
First the composition of the particles was established through FTIR spectra
analysis. Individual polymers were examined first to determine which peaks could be
used to identify them when combined within bulk-assembled complexes or
electrosprayed particles.
4.3.1.1 Single Polymer Analysis
Figure 4.1 Normalised FTIR spectra of solid CMC, freeze-dried deprotonated and
protonated CMC samples
FTIR spectra (Fig. 4.1) were taken of freeze-dried residue from solutions of
protonated and deprotonated CMC and compared with that of solid CMC. There are
two broad peaks and four better resolved peaks that can be identified. From
comparison to the literature, the large shallow peak at around 3300 cm-1 can be
600110016002100260031003600
wavenumber (cm-1)
protonated
deprotonated
unaltered
CH2
OHCH-O-CH2
OH CH
O=COH
O=CONa

101
attributed to –OH stretch156, 157, the small peak around 2900 cm-1 can be attributed to
C-H98, 158, the peak around 1590 cm-1 can be attributed to the C=O in the carboxyl
group156, 159, the peak around 1410 cm-1 can be attributed to the methyl group (-CH2)156,
160, the peak around 1310 cm-1 can be attributed to –OH156, 157, and the peak at around
1050 cm-1 can be attributed to CH-O-CH2 stretching157, 160. Confirmation of the
carbonyl peak at 1590 cm-1 can be seen by comparison between the protonated and
unaltered CMC spectra. The protonated spectra shows the appearance of a peak at
1718 cm-1 and a decrease in the O=CONa peak intensity relative to the other three
main peaks. This is in agreement with the reported shifted observed for carboxylic
acids and corresponding conjugated bases159. During the freeze-drying process
protonation is expected due to increase in acidity161. However, in the deprotonated
spectra a protonated peak at 1718 cm-1 cannot be seen, indicating that the degree of
protonation is insufficient to be detected.
FTIR spectra were then used to identify unique peaks from each polymer in
the bulk-assembled complexes and electrosprayed particles in order to confirm that
both the inner and outer polymer were present. First, spectra of the individual
600110016002100260031003600wavenumber (cm-1)
PDMAEMA
CMC
CHC=O
CH2
CN

102
polymers were taken to find unique peaks which could be used to confirm the presence
of each polymer from the spectra of particles where both were used (Fig. 4.2).
Figure 4.2 Spectra of PDMAEMA and CMC in solid form
For the PDMAEMA, peaks from the C-H in the amine groups can be seen at
2821 cm-1 and 2771 cm-1 162. The other identifying peaks are at 1772 cm-1 and 1722
cm-1, both attributed to C=O of the ester, the peak at 1456cm-1 is attributed to the CH2
group and at 1146 cm-1 there is a peak attributed to the C-N group162-164. Comparing
the normalised spectra for PDMAEMA and CMC, it can be seen that CMC has a
strong peak at 1595 cm-1 from the carbonyl group, where PDMAEMA has a small
background signal and CMC also has a unique peak at 1310 cm-1 from the hydroxyl
group, where again there is very little signal in the PDMAEMA spectra. Therefore,
although the separation of these peaks is not perfectly resolved, these can be regarded
as two key peaks to look for when confirming the presence of CMC in electrosprayed
particles and bulk-assembled complexes.
4.3.1.2 Deciding the CMC:PDMAEMA Weight Ratio
As FTIR spectra were used to confirm the presence of both polymers in the
electrosprayed particles and bulk-assembled complexes, it was important that the
weight ratio of polymers used was one that allowed the peaks of both polymers to
clearly visible on the same spectra.
Initially a weight ratio of 1:20 of CMC:PDMAEMA was used in the
electrospray in the interests of using low flow rates to achieve particles of small
diameter. However, from the spectra of the electrosprayed particles it was apparent
that the identifying peaks of CMC could not be clearly distinguished from those of

103
PDMAEMA. The ratio of CMC:PDMAEMA was changed to 1:5 by and in this
spectra, the emergence of a peak at 1600 cm-1 relating to the carbonyl of the CMC
becomes obvious (Fig. 4.3). Therefore, the ratio of 1:5 was kept as the default ratio to
use in both electrospray and self-assembly for easy confirmation of CMC presence.
Figure 4.3 FTIR spectra of electrosprayed particles of CMC:PDMAEMA in ratios of 1:5
and 1:20 where samples were allowed to air dry. The peaks around 2300 cm-1 can be
ignored as they are related to atmospheric carbon dioxide.
The large broad peak that can be seen between 3600 cm-1 and 3000 cm-1
indicates –OH groups, arising from the presence of water as well as hydroxyl moieties
in the CMC structure. To reduce the component due to residual solvent/water, it was
decided to dry samples in a vacuum oven (Fig. 4.4). A reduction in the large OH peak
around 3300 cm-1 can be seen suggesting the removal of water and also new strong
peaks at around 1260 cm-1 and 810 cm-1 can clearly be seen, neither of which can be
seen in the spectra for the individual polymers in solid state (Fig. 4.2).
600110016002100260031003600
wavenumber (cm-1)
1:20
1:5
1606 cm-1

104
Figure 4.4 FTIR spectra comparison of electrosprayed particles following air-drying at
ambient conditions and vacuum-drying overnight
These new peaks could result from residual higher boiling point solvents
introduced in the electrospray system that are not completely removed through drying
in the vacuum oven. Looking at spectra for the individual solvents, both chloroform
and DMF show a sharp peak at ~1250 cm-1, and chloroform also shows a very strong,
broad peak between 700-800 cm-1 165, 166. For the inner liquid, ethanol shows a distinct
peak around 800 cm-1 and another around 1270 cm-1 167. Chloroform is known to
remain in polymeric microspheres even after vacuum-drying168-170 and so it is possible
the peaks are from residual chloroform.
600110016002100260031003600
wavenumber (cm-1)
CMC-PDMAEMA air-dried
CMC-PDMAEMA vacuum-dried
3300 cm-1 1260 cm-1 810 cm-1

105
Figure 4.5 FTIR spectra comparison of electrosprayed (ES) CMC-PDMAEMA with a) solid
polymers and b) single electrosprayed polymers
A comparison between the spectra of the coaxially electrosprayed CMC-
PDMAEMA, the single-sprayed polymers and polymers in solid state reveals that the
appearance of the sharp peaks at 1263 cm-1 and 810 cm-1 only occurs with single
electrosprayed polymers (Fig. 4.5b) as these peaks are not present in the spectra of the
individual solid polymers (Fig. 4.5a). Therefore, for comparison with coaxially
electrosprayed particles, it was decided that the spectra of single electrosprayed
polymers should be used as opposed to the spectra of solid polymers.
4.3.1.3 Self-Assembly with Varying pH
As pH-responsive polymers are being used, bulk-assembled complexes were
made at varying pH conditions in order to establish the effect that pH has on particle
size and composition. PDMAEMA and CMC were dissolved in aqueous phase at
different pH (pH 5, pH 7 and pH 11) and then mixed to form bulk-assembled
complexes in a 1:5 (CMC:PDMAEMA) weight ratio, as established previously (Fig.
4.3), to allow for the confirmation of CMC presence via FTIR spectra.
a) b)

106
Figure 4.6 FTIR spectra of bulk-assembled complexes of CMC-PDMAEMA prepared in
aqueous phase in a 1:5 weight ratio at varying pH (pH 5 in orange, pH7 in grey, pH 11 in
yellow) shown with the spectra of the solid individual polymers for comparison (PDMAEMA
light blue, CMC dark blue). In all three cases, the peak around 1600 cm-1 (carbonyl of
CMC) can be seen signifying the presence of CMC.
In all pH conditions, it is possible to see the presence of CMC confirmed by
the appearance of the carbonyl peak at around 1600 cm-1 (Fig. 4.6). At pH 11, a shift
to a lower wavenumber can be seen in the 1600 cm-1 peak indicating deprotonation of
the carbonyl group. This indicates that the CMC at this pH may be more swollen than
at the other pH conditions due to electrostatic repulsion between the deprotonated
groups.
Next the complexes are sized to give further insight into the effect that the
different pH conditions have on polymer interaction during bulk-assembly.
600110016002100260031003600
wavenumber (cm-1)
PDMAEMA
CMC-PDMAEMA (pH 5)
CMC-PDMAEMA (pH 7)
CMC-PDMAEMA (pH 11)
CMC
O=CONa
C=O
CN
CH2-O-CH2

107
Figure 4.7 Comparison across a range of pH for bulk-assembled complexes showing a)
mean peak height and b) mean diameter obtained via AFM (shown with standard error) (n=
27, 43 and 24 for pH 5, 7 and 11 respectively)
The mean peaks heights for bulk-assembled complexes seem to show pH 7
gives the largest particles (Fig. 4.7). Although the lateral diameter measured through
AFM cannot be used as a measure of actual particle diameter146, 147, it can be seen that
the trend in diameter with pH is markedly different. This may indicate particle
instability during the drying process or perhaps important changes in the mechanical
properties and hydrophobicity of the resulting complexes, assembled at different pH.
In self-assembled polyelectrolyte multilayer films, it has been seen that altering the
pH can affect the film thickness and stiffness171-173.
Complexes assembled at high pH are also expected to be more hydrophobic,
. Additionally, as the water
evaporates during sample drying process, the pH of the remaining solution will be
increasing leading to an increase in protonation and the pH at which the sample is
finally dried cannot be known for certain. In any case, it can be concluded that AFM
0
20
40
60
80
100
120
140
160
pH5 pH7 pH11
mea
n p
eak
hei
ght
(nm
)
0.0
0.2
0.4
0.6
0.8
1.0
1.2
1.4
pH5 pH7 pH11
mea
n d
iam
eter
(µ
m)
a) b)

108
is not a suitable method for measuring bulk-assembled complex size as the stability
of the dried complex is unknown. Therefore DLS was used to examine bulk-
assembled complex size (Table 4.1). These results show that pH 11 gives by far the
largest sized complexes, over 1 µm in diameter, which could arise from the relatively
hydrophobic nature of PDMAEMA at this pH and the aggregation of several
complexes. pH 5 gives the next smallest complexes with a diameter of 214.1 nm, and
pH 7 gives the smallest complexes with a diameter of 165.9 nm, perhaps due to the
stronger electrostatic charge on both polymers at this pH. The PdI (polydispersity
index) of pH 7 is also lower than that of pH 5 (0.44 and 0.39 respectively).
pH Mean diameter (nm) Std. Dev. PdI Std. Dev.
5 214.1 26.0 0.444 0.025
7 165.9 6.864 0.392 0.015
11 1364 30.66 0.474 0.372
Table 4.1 Comparison of hydrodynamic diameter and polydispersity index across different
pH for bulk-assembled CMC-PDMAEMA complexes
The change in complex size with pH, can be attributed to a change in behaviour
of CMC and PDMAEMA; they are both pH-responsive polymers and as such will
release or accept protons depending on the pH of their environment. CMC is a
carboxylic acid with a pKa value between 4 and 5174, 175 , is most negative at pH 7 and
above150, 151, and undergoes swelling at high pH176, 177. This is due to the deprotonation
of the carboxylic acid groups (as seen in Fig. 4.5), leading to electrostatic repulsion
between these groups and so an increase in the size of the CMC.

109
PDMAEMA is a cationic polymer with a pKa value between 7 and 8178, 179 and
undergoes swelling at low pH. PDMAEMA contains a tertiary amine group that is
protonated at low pH and so the increase in electrostatic repulsion between these
protonated groups leads to swelling. With this in mind, the size increase at pH 11
could be attributed to CMC swelling and the size increase at pH 5 could be attributed
to a combination of PDMAEMA swelling and reduced negative charge of the CMC.
It can be concluded that the greater negative charge of the CMC at pH7 is
promoting a stronger interaction with the cationic PDMAEMA (at this pH), which
leads to a smaller mean particle size and less polydispersity. Lin et al. formed bulk-
assembled complexes of PDMAEMA with DNA and saw a mean size of 230 nm at
pH 7 and 115 nm at pH 5180. This was determined to be due to the stronger positive
charge of PDMAEMA at lower pH181. DNA also has a lower pKa than CMC and so
is more negatively charged than CMC at lower pH 5182. Stolnik et al.181 looked at bulk-
assembled complexes of DMAEMA and plasmid DNA (pDNA) and were able to
achieve complex sizes of around 100 nm at a variety of pH (pH 4-8), but the optimum
pH for the smallest size complex was dependent on the ratio of DMAEMA to pDNA.
When the ratio of DMAEMA to pDNA was higher, a lower pH (4-6) was more
favourable for producing smaller complexes and when the ratio was lower, a higher
pH (7) was better. The ratio of polymers in Table 4.1 is 1:5 CMC:PDMAEMA which
indicates that a lower pH is better, but the optimum pH is not as low as that as used
with pDNA due to the higher pKa of CMC.
The use of pH 7 also helps to strike a balance between the swelling of both
polymers which again helps to reduce the size. It therefore follows that, while the
degree of polymer interaction that takes place during electrospray is not known at this

110
point, it is prudent to have the CMC, i.e. the inner liquid, at pH 7 to reduce CMC
swelling and give a greater negative charge.
4.3.1.4 CMC Content of Electrosprayed Particles
A comparison of peak ratios between CMC-PDMAEMA electrosprayed
particles and bulk-assembled complexes showed a similar trend in ratios between
peaks and therefore a calibration curve was made to try to quantify the proportion of
CMC present in the electrosprayed particles.
Figure 4.8 a) FTIR spectra comparison of identifiable peaks from electrosprayed particles
(inner flow rate 0.2mL/h, outer flow rate 0.1 mL/h) and bulk-assembled complexes of CMC-
PDMAEMA with a polymer weight ratio of 1:5 (CMC:PDMAEMA) in both cases, b)
a) b)
c) d)

111
corresponding ratios to the 1730 cm-1 peak, c) comparison of FTIR spectra from bulk-assembled
CMC-PDMAEMA complexes in various ratios (denoted in brackets), and d) calibration curve of
ratios of 1365 cm-1 to 1730 cm-1 peak relative to CMC percentage.
The calibration curve was made by comparing peak ratios over three different
bulk-assembled complexes of CMC-PDMAEMA at pH 7 (prepared in ratios of 1:5
(spectra shown in Fig. 4.6), 1:3, 1:1 and 3:1 (Fig. 4.8c).
The 1730 cm-1 peak was used as the standard peak for comparison as there is
no contribution from CMC around that wavenumber. The peak at 1365 cm-1 was
selected for comparison as it is a peak that has been identified where little contribution
is expected from PDMAEMA (Fig. 4.78b). The three ratios were used to form a
calibration curve of peak ratio vs CMC percentage in particle (Fig. 4.8d). The R2 value
(0.91) shows a good linear correlation, and the calibration curve gives the 1703:1365
cm-1 peak ratio as being 0.25, while the actual peak ratio from the electrosprayed
sample is 0.19. This shows that the ratio of polymers is more or less preserved in the
particles following electrospray which indicates that the phase composition in
electrosprayed droplets is comparable to that of the feed. This could be attributed to
the use of DMF, with a high boiling point, in the outer liquid to encourage
miscibility144 so the polymer does not gather at the outer interface between the outer
liquid and air.
4.3.2 Particle Sizing
While bulk-assembled complexes are made through electrostatic interaction
between the two polymers, the process of particle production in coaxial electrospray
is not only dependent upon the interaction between the polymers to form particles, as
it is driven by the charged liquids carrying the polymers and solvent evaporation.

112
Therefore it could be expected that there is a difference between the characteristics of
particles made by these two methods.
First the sizes of particle produced by the two methods were compared.
Figure 4.9 Comparison of the mean diameter, obtained through AFM, of bulk-assembled
complexes (BA, n=54) and electrosprayed CMC-PDMAEMA particles (ES, n=78) (shown
with standard error)
The mean peak height of bulk-assembled complexes and electrosprayed
partilces of CMC-PDMAEMA were analysed by AFM and DLS. For AFM, the mean
heights were 128 nm and 56 nm for the bulk-assembled complexes and electrosprayed
particles respectively (Fig. 4.9), and for DLS the hydrodynamic diameter was 165.9
nm (PdI 0.392) and 117.4 nm (PdI 0.373) for the bulk-assembled complexes and
electrosprayed particles respectively (Table 4.2).
Assembly Method Z-average Std. Dev. PdI Std. Dev.
Bulk-assembly 165.9 6.86 0.392 0.015
Electrospray 117.3 17.94 0.373 0.064
0
20
40
60
80
100
120
140
160
BA ES
mea
n p
eak
hei
ght
(nm
)

113
Table 4.2 Comparison of hydrodynamic diameter and polydispersity index (PdI) of bulk-
assembled complexes and electrosprayed particles of CMC-PDMAEMA with standard
deviation
The AFM data shows the electrosprayed particles to be smaller than the bulk-
assembled complexes, but it has already been seen in the previous AFM data (Fig.
4.7), that this method is unreliable when sizing bulk-assembled complexes. The DLS
data showed the electrosprayed particles to be smaller than the bulk-assembled
complexes, average sizes of 117.3 nm and 165.9 nm respectively. This suggests that
the electrosprayed particles would be small enough to successfully enter cells9, 10.
Wu et al. were able to transfect murine cells (NIH 3T3) with coaxially
electrosprayed particles of PEI and pDNA that were around 250 nm in diameter and
saw better transfection than bulk-assembled complexes prepared in the same ratios16.
Looking at the electrospray conditions used, it can be seen that they used higher flow
rates (6 mL/h for both inner and outer liquids) which led to a higher polymer
throughput – 223.2 µg/h compared to 120 µg/h as used here to form CMC-
PDMAEMA particles. In other words, while the scaling laws dictate that the particle
size scales with flow rate, the rate of polymer throughput is also an important
consideration when electrospraying polymeric particles.
4.3.3 Zeta Potential
Next the zeta potential of bulk-assembled complexes and electrosprayed
particles were compared to give an insight into their respective polymer structures.

114
Figure 4.10 Comparison between the mean zeta potential of CMC-PDMAEMA
electrosprayed particles (ES) and bulk-assembled complexes (BA) (shown with standard
deviation)
The mean zeta potential of electrosprayed particles and bulk-assembled
complexes of CMC-PDMAEMA were measured through DLS and were found to be
15.8 mV and 19.1 mV respectively (Fig. 4.10). This confirms the abundance of
PDMAEMA with respect to CMC, and suggest that a PDMAEMA shell is observed
in both cases due to CMC’s negative charge at pH 7150, 151. This is expected from the
bulk-assembled complexes due to the way in which the particles are formed by
electrostatic interaction and the larger quantity of PDMAEMA compared to CMC.
The positive charge on the electrosprayed particles is further confirmation that both
polymers are being sprayed and suggests that the particles could be uptaken by cells
through endocytosis9. Lo et al.183 saw a similar zeta potential for bulk-assembled
DNA-PDMAEMA complexes in the same 1:5 ratio (22.4 mV ± 0.8) which implies
that these electrosprayed CMC-PDMAEMA particles present a reasonable model for
DNA-PDMAEMA if looking at cell uptake based on zeta potential alone.
0
5
10
15
20
ES BA
Zeta
Po
ten
tial
(m
V)

115
4.3.4 Particle and Complex Structure
Figure 4.11 TEM images a) & b) show examples of bulk-assembled complexes of CMC-
PDMAEMA, c) & d) show electrosprayed CMC-PDMAEMA particles. The dark spots are
assumed to be aggregations of silver which were used to stain the CMC to give a greater
contrast with respect to neutral or cationic phases such as PDMAEMA. The outlines of
outer shells are highlighted in e) & f).
c) d)
e) f)
a) b)
116
The TEM images of the bulk-assembled complexes (Fig. 4.11a & b), show a
core-shell structure but the spotty nature of the shell suggests a relatively
inhomogeneous coating. The images of the electrosprayed particle (Fig. 4.11c & d)
showed that the particles produced by electrospray do indeed have a core-shell
structure. Measurements taken of the shell width gave mean averages of 4 nm (Fig
4.11e) and 7 nm (Fig 4.11f). However, due to time contraints not many particles could
be imaged. For a more comprehensive look at particle structure, imaging many
particles would help to give an idea of the proportion of particles that show good core-
shell structure and poor core-shell structure.
A clear difference is that the contrast between core and shell is far better in the
bulk-assembled complexes. This suggests that there is a higher density of CMC than
in the electrosprayed particles. This could be due the electrosprayed particles being
softer than the bulk-assembled complexes and so flattening as they impact the TEM
grid. A more detailed look at the size and deformation of particles following dry
collection is carried out in the next chapter.
4.4 Conclusion
From the FTIR spectra of individual polymers, unique peaks with which the
presence of both polymers within the produced particles were identified, allowing
confirmation of the presence of both polymers in the bulk-assembled complexes and
coaxially electrosprayed particles.
From the DLS data of bulk-assembled complexes, it can be seen that while
complexation can occur over a range of pH, pH 7 produces the smallest complexes.
This change in size is related to CMC swelling at high pH and PDMAEMA swelling

117
at low pH, CMC being more negatively charged at pH 7 than lower pH values and
PDMAEMA being positively charged below pH 7. This also highlighted a difference
between CMC and DNA; DNA has a low pKa and is therefore also to produce small
complexes at lower pH values than possible with CMC.
The degree of electrostatic interaction between the polymers during particle
formation in electrospray is not known, so the extent of the effect of CMC’s negative
charge on particle size cannot quantified, but it is still advantageous to lessen CMC
swelling. Therefore the inner liquid for electrospray was prepared at pH 7.
A calibration curve made through peak ratios from the FTIR spectra of bulk-
assembled complexes in different polymer ratios showed that the polymer ratio in
which the liquids are supplied by syringe pump is preserved to a very similar degree
in the final particles following the electrospray process.
DLS data on particle size shows that the electrospray method produces slightly
smaller particles on average and with a slightly smaller PdI. The TEM images show
that electrosprayed particles have a core-shell structure and this is backed up by the
zeta potential of electrosprayed particles having a positive charge indicating that
PDMAEMA is on the outside of the particles. However, the electrosprayed particles
appear to be flattened, due to the lower CMC density indicated by the lower core-shell
contrast compared to bulk-assembled complexes.
Overall, for CMC-PDMAEMA it would appear that electrospray is able to
produce particles that are smaller than those produced through self-assembly, have the
desired core-shell structure to protect negatively charged payloads such as DNA and
a positive charge which can facilitate efficient cell uptake.

118
Chapter Five
Effect of Polymer Structure
on Electrosprayed Particles
5.1 Introduction
In self-assembly, amphiphilic block copolymers can be used for the
encapsulation based upon electrostatic interaction184, 185. Having looked at
encapsulation with PDMAEMA in the previous chapter, a block copolymer PLA-
PDMAEMA will now be used to provide a further point of comparison between self-
assembled and electrosprayed particles. PLA-PDMAEMA has been used before by
Qian et al.129 to encapsulate doxorubicin through self-assembly and also by Babikova
et al.186 to encapsulate curcumin but based upon the hydrophobicity of PLA rather
than electrostatic interaction with the drug to be encapsulated.
Secondly, the use of sodium hyaluronate (HA) as a DNA substitute will be
assessed and compared to CMC. Like CMC, HA has a carboxyl group and low pKa187
giving it a negative charge at pH 7 which gives it similar properties to DNA. It is also
far more cost-effective than DNA to use in large quantities and is therefore another
good potential candidate for a DNA model.

119
5.2 Materials and Methods
5.2.1 Materials
Sodium hyaluronate (HA) (Mw 10,000) was obtained from Lifecore
Biomedical. CMC (Mw 90,000) was obtain from Sigma Aldrich and CMC (Mw
250,000) was obtained from Aqualon. PDMAEMA and PLA-PDMAEMA were both
synthesised at QMUL by Dr Danyang Li and Dr Zi Zhang respectively. Chloroform,
DMF and ethanol were all obtained from Sigma Aldrich.
5.2.2 Fabrication of Self-assembled Particles
CMC, HA, PDMAEMA and PLA-PDMAEMA were each dissolved in
deionised water to form 500 µg/mL solutions. These were mixed in 1:5 ratios
(CMC:PDMAEMA, CMC:PLA-PDMAEMA, HA:PDMAEMA or HA-PLA-
PDMAEMA) and left to incubate for 1 h forming a suspension of self-assembled
particles. Appropriate volumes of HCl or NaOH were added to the solutions prior to
mixing in order to obtain three solutions at different pH (pH 5, pH 7 and pH 11). The
samples were then freeze-dried and the precipitate collected for FTIR analysis.
5.2.3 Fabrication of Electrosprayed Particles
The electrospray apparatus used was as outlined in Fig. 3.1. The inner liquid
was formed of CMC or HA dissolved in a mixture of 80% deionised water and 20%
ethanol at a concentration of 100 µg/mL or 100 ng/mL. The outer liquid was formed
of PDMAEMA or PLA-PDMAEMA dissolved in a mixture of 80% chloroform and
20% DMF at a concentration of 1 mg/mL. The liquids were sprayed separately in
single electrospray at the onset voltage for cone-jet mode (applied voltage to needle

120
at 5-6 kV relative to ground) with a suitable extractor voltage (1-1.5 kV relative to
ground) and collected on aluminium foil. The liquids were also sprayed together, the
inner liquid at a flow rate of 0.2 mL/hr and the outer liquid at 0.1 mL/hr in coaxial
cone-jet mode. The collection method was dependent on the method of particle
analysis.
5.2.4 Fourier Transform Infrared Spectroscopy
ATR-FTIR spectroscopy (Tensor 27, Bruker) was used to obtain absorption
spectra of the polymers in solid form, freeze-dried residue of self-assembled particles
at varying pH, and dry polymer particles from single and coaxial electrospray which
were collected on aluminium foil and dried in a vacuum oven at 40°C overnight.
5.2.5 Dynamic Light Scattering
DLS (Zetasizer Nano ZS, Malvern) was used to size and measure the zeta
potential of self-assembled and electrosprayed particles. Electrosprayed particles were
sprayed into grounded deionised water for 30 min and grounded 10mM NaCl for 30
min for sizing and zeta potential measurements respectively. Self-assembled particles
were assembled at pH 7 in deionised water for sizing and in NaCl 10mM for zeta
potential measurements.
5.3.6 Atomic Force Microscopy
AFM (NTegra, Bruker) was used with RTESP-300 aFM probes (Bruker)
which were plasma-treated to render them hydrophobic and prevent particles adhering
to them. Electrosprayed particles were collected on silicon wafer for 3 min, and self-

121
assembled particles were made in deionised water which was dropped onto silicon
wafer and left to dry in ambient conditions.
AFM was performed in semi-contact or tapping mode and images were
acquired with NOVA software where preliminary image processing was performed to
flatten the images. Further image processing was performed in MATLAB. A script
was written to threshold images to remove noise caused by surface roughness, identify
centroids and give the diameter and maximum peak height of each centroid. The
images were then examined by eye to remove any obvious non-rounded shapes that
were likely debris, aggregation or a particle dragged along the wafer. Furthermore,
any particles which were only 9 pixels in size were considered too small to be analysed
accurately and were therefore discounted.
5.3.7 Transmission Electron Microscopy
TEM (JEOL 2010, JEOL Ltd.) was used to image electrosprayed and self-
assembled particles with a 200kV beam. The inner phase was stained with silver ions
to provide better contrast against the shell polymer. For electrosprayed particles, to
prepare the inner liquid, 100 µg/ml of CMC was incubated for 1 h with 25 µg/ml of
silver nitrate in a solution of 80% deionised water and 20% ethanol. The particles were
fabricated as detailed in section 4.2.4 and sprayed directly onto a TEM grid for 3 min.
In the case of self-assembly, 500 µg/ml of CMC was incubated for 1 h with 125 µg/ml
of silver nitrate in deionised water. The particles were bulk assembled in solution as
in section 4.2.3, and the solution dropped onto a TEM grid and left to dry in ambient
conditions.

122
5.3 Results and Discussion
5.3.1 Impact of the molecular weight and concentration of
CMC
First the impact of the molecular weight of CMC on particle size was examined
by comparing the sizes of electrosprayed particles using higher molecular weight
CMC (Mw 250,000) with the lower molecular weight CMC (Mw 90,000) that has
been used so far. This is an important parameter to consider as the molecular weight
of therapeutic DNA can vary greatly188. However, when using the Mw 250,000 CMC
it was found to be difficult to maintain a stable cone-jet at the same concentration (100
ug/mL) that was used for Mw 90,000 CMC. This was thought to be due to the needle
being blocked by the polymer and so the different molecular weights were compared
at a lower concentration of 100 ng/mL while keeping the same flow rates as used
previously (inner, 0.2 mL/h and outer 0.1 mL/h).

123
Figure 5.1 AFM data from electrosprayed CMC-PDMAEMA particles. AFM images using a) Mw
90,000 CMC at 100 µg/mL, b) Mw 90,000 CMC at 100 ng/mL, c) Mw 250,000 at 100 ng/mL, and
comparison of mean particles sizes with d) using different molecular weights of CMC (Mw 250,000, n
= 96 and Mw 90,000, n = 112) at 100 µg/mL and e ) Mw 90,000 CMC at different concentrations
(100 µg/mL, n = 78 and 100 ng/mL, n = 112) (shown with standard error). In both d) and e), *
indicates a significant difference between the two conditions for p<0.05 (unpaired t -test).
0
10
20
30
40
Mw 90,000 Mw 250,000
mea
n p
eak
hei
ght
(nm
)
d)b)
0
10
20
30
40
50
60
70
100 ug/mL 100 ng/mL
mea
n p
eak
hei
ght
(nm
)
*
*
e)
Mw 90,000 100 µg/mL
a)
Mw 90,000 100 ng/mL
b)
Mw 250,000 100 ng/mL
c)

124
AFM was used to compare the sizes of electrosprayed CMC-PDMAEMA
particles with different molecular weights (Mw 90,000 and Mw 250,000) and
concentrations (100 µg/mL and 100 ng/mL) of CMC. From the AFM images (Fig. 5.1
a,b & c), it can be seen that the particles have not collapsed as a concave particle would
appear as a ring, rather than the bright points seen here.
Mw 90,000 and Mw 250,000 CMC gave mean particle diameters of 42 nm and
32 nm respectively (Fig. 5.1d). A t-test showed a significant difference between these
particle sizes for p<0.05. Fink et al. examined self-assembly polyplexes with different
molecular weights of DNA and also saw an increase in mean diameter with DNA
molecular weight188.
Different concentrations were also compared for Mw 90,000 CMC and the
mean particle sizes were 67 nm and 32 nm for concentrations of 100 µg/mL and 100
ng/mL respectively (Fig. 5.1e). Overall, this suggests that when controlling for particle
size when using DNA, the molecular weight must be taken into account, and as well
as the flow rate, it is possible to control particle size by polymer concentration
5.3.2 Impact of Using Block Copolymer as the Shell Polymer
5.3.2.1 FTIR
First the FTIR of the PLA-PDMAEMA was compared with CMC in order to
determine which peaks could be used to identify the presence of both polymers in
electrosprayed particles.

125
Figure 5.2 Comparison of FTIR spectra of single electrosprayed PDMAEMA and PLA-
PDMAEMA
The peaks of electrosprayed PDMAEMA were identified in the previous
chapter, and through comparison with the PLA-PDMAEMA spectra (Fig. 5.2) the
contributions of PLA to the block copolymer can be seen through the appearance of
new peaks and changes in peak ratios.
The broad peak at around 3300 cm-1 is attributed to the O-H group189. There
are two peaks from the C-H group, the peaks at 2994 cm-1 appears as a shoulder, and
the peak at 2932 cm-1 overlaps with a PDMAEMA peak190, 191. The peak at 1724 cm-
1 can be attributed to the C=O group189, 190, the peak at 1454 cm-1 can be attributed to
the C-H group192, and the peaks at 1174 cm-1 and 1088 cm-1 can both be attributed to
the C-O-C group189, 190, 193. There is the additional appearance of a broad peak around
1650 cm-1 which is not identified, but it is present in other FTIR spectra of PLA in the
600110016002100260031003600
wavenumber cm-1
ES PLA-PDMAEMA
ES PDMAEMA
O-H
C=O
C-H
C-O-C
C-H

126
literature191, 194. However, this new peak overlaps with the 1600 cm-1 peak used to
identify CMC presence in particles and so a new strategy must be found.
Figure 5.3 FTIR spectra of coaxially electrosprayed CMC-PLA-PDMAEMA particles
compared with the single electrospray individual polymers (all samples vacuum-dried)
The FTIR spectra of coaxially electrosprayed CMC-PLA-PDMAEMA
particles were compared with the single electrosprayed individual polymers in roder
to confirm the presence of CMC. As with the electrosprayed CMC-PDMAEMA
spectra (Fig. 5.3), there are again strong, sharp peaks visible at 1263 cm-1 and 810 cm-
1. However, the peak at 1728 cm-1 from the C=O in the ester is unique to PLA-
PDMAEMA, and the ratios of other peaks to it can be taken from the CMC-PLA-
PDMAEMA spectra and compared to the ratio in the PLA-PDMAEMA spectra. A
change in ratio would indicate a contribution to the peak from CMC. Looking at ratio
of the 1101 cm-1 peak from C-O-C of the oxygen bridge to the 1728 cm-1 peak, an
increase can be seen from 1.06 in the PLA-PDMAEMA spectra to 1.68 in the CMC-

127
PLA-PDMAEMA spectra, indicating a contribution from the CMC and therefore
confirming its presence in the particles.
5.3.2.2 Sizing
Table 5.1 Varying pH of bulk-assembled CMC-PLA-PDMAEMA particles measured by DLS
Next, the mean diameters of bulk-assembled CMC-PLA-PDMAEMA
complexes produced at different pH conditions were analysed by DLS (Table 5.1).
PLA is also a pH responsive polymer and so it is important to determine if its addition
to the system has had any effect on the pH at which the PLA-PDMAEMA is best able
to condense CMC.
Complexes produced at pH 5 have an extremely high mean diameter,
polydispersity index (PdI) and standard deviations, indicating the presence of
aggregates. This is in strong contrast to the CMC-PDMAEMA self-assembled
particles which had a mean diameter of 214 nm. As discussed in the previous chapter,
CMC and PDMAEMA are expected to be slightly negative174, 175 and positive178, 179
respectively at this pH value. PLA is a polyacid like CMC and has a pKa value of
3.86195 making it negatively charged at pH 5. At this pH, swelling is expected from
PDMAEMA and so there would be a lower density of PLA in the corona of the particle.
The hydrophobicity of PLA196, 197 may have encouraged aggregation of particles,
leading to the high diameter and PdI.
pH Mean diameter (nm) Std. Dev. PdI Std. Dev.
5 1018 167 1.000 0.000
7 111 2.38 0.200 0.019
11 371 39.8 0.382 0.042

128
Particles produced at pH 7 and pH 11 show lower PdI, and as with CMC-
PDMAEMA, pH 7 gives the lowest mean diameter of 111 nm with a PdI of 0.200. pH
11 is above the pKa of both CMC and PLA so both polymers are will experience
swelling198, 199. While with CMC-PDMAEMA, pH 11 gave the largest particles most
likely due to aggregation because of PDMAEMA’s hydrophobicity, when using PLA-
PDMAEMA, the PLA in the corona will prevent this aggregation.
However, as seen with CMC-PDMAEMA, complexes bulk -assembled at pH
7 give the lowest mean diameter and PdI, as it is gives the best balance between
polymer swelling and polymer charge strength allowing for a strong interaction
between CMC and the PDMAEMA of PLA-PDMAEMA and therefore CMC
prepared at pH 7 was used for electrospray with PLA-PDMAEMA.
PLA-PDMAEMA has been used to complex with other molecules at pH 7 and
shown similar size micelles being formed. Babikova et al.186 used PLA-PDMAEMA
to complex with curcumin and formed particles with a mean diameter between 76 nm
and 165 nm (measure by DLS) depending on the ratio of PLA to PDMAEMA in the
copolymer. Star-branched PLA-PDMAEMA has also been used by Qian et al.129 as a
gene vector and when loaded with DNA, was found to have a mean diameter between
65.0 nm and 93.2 nm (measured by DLS) depending on the number of PDMAEMA
branches. While these diameters are similar however, the method of drug/DNA
loading is different. Both methods rely upon the PLA-PDMAEMA self-assembling
into micelles in aqueous phase, based upon the hydrophobicity of PLA. The micelles
formed are therefore the reverse of what is produced here – PDMAEMA in the core
with a PLA corona. The curcumin is trapped within the micelle as it forms, and the
DNA adsorbed onto the PDMAEMA corona of the micelles. Despite this difference,

129
it seems that the mean diameter produced where PDMAEMA complexes with the
payload, is comparable in scale to instances where the PLA is in the core.
Next, the sizes (determined by AFM) of electrosprayed CMC-PDMAEMA
and CMC-PLA-PDMAEMA particles were compared to examine the ability of a
block copolymer to condense CMC when using electrospray.
Figure 5.4 AFM images of electrosprayed a) CMC-PDMAEMA particles, b) CMC-PLA-
PDMAEMA particles, c) a comparison of the mean peak heights of CMC-PDMAEMA and
CMC-PLA-PDMAEMA and d) a comparison of lateral diameter with a correction factor
given by Yang et al.147. For c), * indicates significant difference for p<0.05 (unpaired t-test).
Both c) & d) are shown with standard error.
CMC-PLA-PDMAEMA CMC-PDMAEMA
b) a)
c) d)

130
The AFM analysis of electrosprayed CMC-PDMAEMA and CMC-PLA-
PDMAEMA particles show the mean diameter of the CMC-PLA-PDMAEMA
particles to be significantly smaller than that of the CMC-PDMAEMA particles for
p<0.05 (Fig. 5.4 c), and from the AFM images it can again be seen that the particles
have not collapsed and become concave. Bulk-assembled particles were not examined
by AFM due to the unknown stability of the dried complex, as described in section
4.3.1.3.
A difference in sizes between the two measuring methods is expected as AFM
analyses a dry particle which may be flattened slightly by impact, and DLS analyses
the hydrodynamic diameter of a wet particle which will experience some polymer
swelling.
In the previous chapter, comparing the TEM images of bulk-assembled
complexes and electrosprayed particles of CMC-PDMAEMA, and seeing the apparent
lower density of CMC in the electrosprayed particles suggested that they had flattened.
Although the lateral diameter measured by AFM is known to be inaccurate due to the
tip geometry, using an average correction factor determined by Yang et al.147, it is
possible to get an idea for whether the particles have maintained a spherical shape or
not. The corrected mean lateral diameters for CMC-PDMAEMA and CMC-PLA-
PDMAEMA (Fig. 5.4d) are 178 nm and 78 nm respectively. When compared to the
mean peak heights, it can be seen that the corrected lateral diameters are much larger
still – 3.2 times larger for CMC-PDMAEMA and 6 times larger for CMC-PLA-
PDMAEMA. This confirms that the particles are indeed flattening when landing on
the silicon wafer substrate. However, if the particles are considered as spheres with
flattened bases, with the mean peak as height and the corrected mean lateral diameter

131
as diameter, then the CMC-PDMAEMA particles are still one order of magnitude
larger than the CMC-PLA-PDMAEMA particles in terms of volume.
It is known that in order to form the shell, the outer polymer is required to
diffuse throughout the solvent of the droplet13. It therefore follows that there must be
a difference in some aspect of shell formation between PDMAEMA and PLA-
PDMAEMA, as all other electrospray conditions are unaltered. PDMAEMA has a
positive charge, whereas PLA-PDMAEMA will have both a positive charge from the
PDMAEMA and a negative charge from the PLA. During particle formation, the outer
polymer must diffuse through the solvent around the droplet and sufficient chain
entanglement must take place before the solvent evaporates for the shell to form13, 200.
It is therefore possible that as the polymers diffuse through the solvent around a
droplet, PDMAEMA molecules will be more spread out from each other due to
electrostatic repulsion, and PLA-PDMAEMA molecules will be more packed together
due to electrostatic attraction. This could lead to greater polymer entanglement in the
PLA-PDMAEMA shell and hence the decrease in particle size as the solvent
evaporates.
Particle Mean diameter (nm) Std. dev. PdI Std. dev.
CMC-PDMAEMA 117 17.94 0.373 0.064
CMC-PLA-PDMAEMA 106 10.34 0.355 0.039
Table 5.2 Comparison of DLS sizing between electrosprayed CMC-PDMAEMA and CMC-
PLA-PDMAEMA
It was seen with AFM analysis that CMC-PLA-PDMAEMA particles were
smaller than CMC-PDMAEMA particles and this is also seen with DLS sizing (Table

132
5.2), but the standard deviation suggests that the spread of particles sizes overlap and
does not show much of a difference between the types of particle compared to the
AFM data (Fig. 5.4).
Particles sizes obtained via DLS are expected to be larger than those obtained
via AFM as firstly DLS samples are wet particles which may experience a degree of
polymer swelling while AFM samples are dry particles which may have flattened
slightly upon impact201, as was seen to be the case. Additionally, DLS measures the
hydrodynamic diameter of the particles, which is based upon particle diffusion and is
therefore an indirect measurement of the physical particle size.
5.3.2.3 Zeta Potential
Next the zeta potential was examined and compared with that of CMC-
PDMAEMA bulk-assembled complexes and electrosprayed particles to see the effect
of the additional PLA in the shell.

133
Figure 5.5 Zeta potential comparison of electrosprayed (blue) and self-assembled (orange)
CMC-PDMAEMA and CMC-PLA-PDMAEMA particles (shown with standard deviation)
Looking at the zeta potential (Fig. 5.5) of CMC-PDMAEMA and CMC-PLA-
PDMAEMA it can be seen that there is a distinct decrease from +19.1 mV to +7.58
mV for the self-assembled particles. In contrast, the electrosprayed particles see only
a modest decrease from +15.8 mV to +14.2 mV.
The lower zeta potential seen with PLA-PDMAEMA in the self-assembled
particles can be taken to indicate that the corona is rich in PLA as PLA has a negative
zeta potential around pH 7202, 203. This indicates a radial alignment of the PLA-
PDMAEMA molecules with the PDMAEMA oriented towards the core, complexing
with the CMC. Similar structures have been seen with electrostatic self-assembly
using other cationic block copolymers by Pippa et al. when encapsulating insulin184
and by Pispas et al. when encapsulating lysozyme185.
By contrast the zeta potentials for CMC-PDMAEMA and CMC-PLA-
PDMAEMA show very little change, showing that the structure of the electrosprayed

134
particles differ from the self-assembled particles. It suggests that the shell is not as
PLA rich as with the self-assembled particles i.e. no radial alignment of polymer
molecules and therefore it can be concluded that any degree of electrostatic interaction
that occurred between the core and shell polymer is negligible.

135
5.3.3 Comparing the use of HA and CMC
First the FTIR spectra of HA was examined to determine which peaks could
be used to identify HA and so confirm its presence in electrosprayed particles.
5.3.3.1 FTIR
Figure 5.6 FTIR spectra comparison of solid HA and single electrosprayed HA showing the
emergence of additional peaks following the electrospray process which may be due to
protonation
From the solid HA FTIR spectra (Fig. 5.6), there are five well-resolved peaks
that can be seen: a broad peak around 3294 cm-1 from the O-H group, a peak at 2893
cm-1 from the C-H group, a peak at 1606 cm-1 from the C=O asymmetric stretch, a
peak at 1405 cm-1 from the C=O symmetric stretch, and a peak at 1034 cm-1 from the
600110016002100260031003600
wavenumber (cm-1)
solid HA
ES HA
C=O (protonated)
C-O (amide)
C=O
C=O
C-O-C
C-OH
N-H
C-HO-H

136
C-O stretch204-206. Additionally there is a slight shoulder at 1650 cm-1 from the C-O
group of the amide, a shoulder at 1560 cm-1 that is attributed to the N-H from the
amide group and a small peak at 1149 cm-1 from the C-O-C oxygen bridge206.
The electrosprayed HA spectra shares the same general shape but the
emergence of additional peaks is clear. The first main difference is a new peak at 1741
cm-1 which can be attributed to the asymmetric stretch of the protonated form of the
C=O group seen at 1606 cm-1 206. This protonation leads to a reduction in intensity of
the unprotonated peak, which sees both the C-O amide and N-H shoulders in the solid
HA spectra, become clear peaks in the electrosprayed spectra.
The appearance of the protonated peak seems to be evidence that the HA is
undergoing protonation during the electrospray process. Protonation driven by electric
fields has been seen by others207, 208. Sugihara et al. saw that for a monolayer of a
carboxylic acid, a positive applied voltage shifted the pKa upwards209. However, the
same protonation of the C=O from the carboxylate group is not seen with
electrosprayed CMC.

137
Figure 5.7 FTIR spectra of electrosprayed HA-PDMAEMA compared with single
electrosprayed PDMAEMA and HA
In the FTIR spectra of HA-PDMAEMA (Fig. 5.7), a broad peak from the C=O
of the carboxyl group in HA can be seen at 1629 cm-1, with a slight shoulder from the
C-O in the amide group at 1654 cm-1. Its ratio to the peak at 1737 cm-1 from the C=O
of PDMAEMA indicates the presence of both polymers in the coaxially
electrosprayed particles.
600110016002100260031003600
wavenumber (cm-1)
ES HA
ES PDMAEMA
ES HA-PDMAEMA
C=O (carboxyl)
C-O
C=O

138
Figure 5.8 FTIR spectra of electrosprayed HA-PLA-PDMAEMA compared with single
electrosprayed PLA-PDMAEMA and HA
Next, the FTIR spectra of HA-PLA-PDMAEMA was assessed to check for the
presence of both polymers in the electrosprayed particles (Fig. 5.8). As determined
from the CMC-PLA-PDMAEMA spectra, when using PLA-PDMAEMA, it is not
possible to look at the C=O peak from the carboxyl group to find evidence of HA
presence in the electrosprayed particles. However, the appearance of a peak around
1560 cm-1 has no contribution from the PDMAEMA spectra and can be attributed to
the peak from N-H in HA206, thereby confirming the presence of HA in the particles.
600110016002100260031003600
wavenumber (cm-1)
ES PLA-PDMAEMA
ES HA-PLA-PDMAEMA
ES HA
N-H
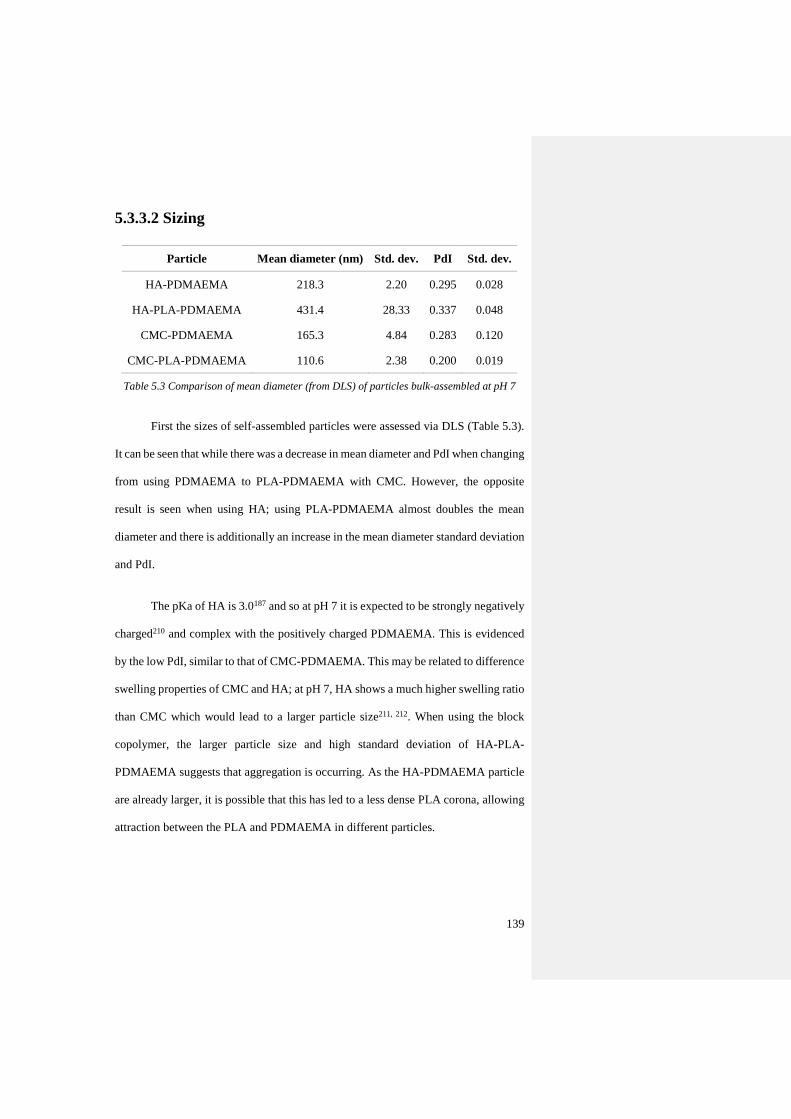
139
5.3.3.2 Sizing
Particle Mean diameter (nm) Std. dev. PdI Std. dev.
HA-PDMAEMA 218.3 2.20 0.295 0.028
HA-PLA-PDMAEMA 431.4 28.33 0.337 0.048
CMC-PDMAEMA 165.3 4.84 0.283 0.120
CMC-PLA-PDMAEMA 110.6 2.38 0.200 0.019
Table 5.3 Comparison of mean diameter (from DLS) of particles bulk-assembled at pH 7
First the sizes of self-assembled particles were assessed via DLS (Table 5.3).
It can be seen that while there was a decrease in mean diameter and PdI when changing
from using PDMAEMA to PLA-PDMAEMA with CMC. However, the opposite
result is seen when using HA; using PLA-PDMAEMA almost doubles the mean
diameter and there is additionally an increase in the mean diameter standard deviation
and PdI.
The pKa of HA is 3.0187 and so at pH 7 it is expected to be strongly negatively
charged210 and complex with the positively charged PDMAEMA. This is evidenced
by the low PdI, similar to that of CMC-PDMAEMA. This may be related to difference
swelling properties of CMC and HA; at pH 7, HA shows a much higher swelling ratio
than CMC which would lead to a larger particle size211, 212. When using the block
copolymer, the larger particle size and high standard deviation of HA-PLA-
PDMAEMA suggests that aggregation is occurring. As the HA-PDMAEMA particle
are already larger, it is possible that this has led to a less dense PLA corona, allowing
attraction between the PLA and PDMAEMA in different particles.

140
Figure 5.9 AFM images of electrosprayed particles a) CMC-PDMAEMA, b) CMC-PLA-
PDMAEMA, c) HA-PDMAEMA, d) HA-PLA-PDMAEMA, and a comparison of mean peak
heights obtained via AFM (HA-PDMAEMA n = 291, HA-PLA-PDMAEMA n = 170, CMC-
PDMAEMA n = 78, CMC-PLA-PDMAEMA n = 81) (shown with standard error). *
indicates a significant difference for p<0.05 (unpaired t-test).
CMC-PDMAEMA
HA-PDMAEMA HA-PLA-PDMAEMA
CMC-PLA-PDMAEMA
a) b)
c) d)
e)
*
*
*

141
The mean peak height of electrosprayed particles was obtained via AFM (Fig.
5.9). Unlike the self-assembled particles, the electrosprayed particles with HA show
the same trend as the CMC particles – a decrease in size when changing from
PDMAEMA to PLA-PDMAEMA in the shell. This suggests that there is perhaps a
problem with the stability of the self-assembled HA particles in aqueous phase.
Particle Mean peak
height (nm)
Corrected
mean lateral
diameter (nm)
Aspect
ratio
Partial
Sphere
Volume
(nm3)
HA-PDMAEMA 43.5 597 13.7 1.6 x10⁶
HA-PLA-
PDMAEMA 13.2 225 17.1 5.9 x10⁴
CMC-PDMAEMA 56.0 178 3.2 6.9 x10⁵
CMC-PLA-
PDMAEMA 12.9 78 6.1 1.8 x10⁴
Table 5.4 Comparing sizes from AFM data of electrosprayed particles with all core-shell
combinations
Again, the lateral diameters obtained via AFM can also be considered to give
an idea of how flattened the particles are (Table 5.4). Comparing the HA and CMC
particles it is clear that although from the mean peak heights the particles appear
similar, the aspect ratio shows that the HA particles are most likely far softer.
Additionally, from the partial sphere volume it can be seen that the HA particles are
larger than the CMC particles.
The smaller size of the PLA-PDMAEMA particles in both cases implies that
the chain entanglement may be occurring faster than with PDMAEMA alone, as
discussed in section 5.3.2. This may be due to electrostatic interaction between the
negative PLA and positive PDMAEMA, compared to the positively-charged

142
PDMAEMA alone for which electrostatic repulsion may have led to lower degree of
chain entanglement and so a larger shell formed as solvent evaporation took place.
Looking at the DLS sizing of electrosprayed particles with HA (Table 5.5), it
is clear from the large diameters and standard deviation that the particles are not stable
in aqueous phase and are aggregating.
Particle Mean diameter (nm) Std. dev. PdI Std. dev.
HA-PDMAEMA 532 51.77 0.553 0.046
HA-PLA-PDMAEMA 1598 654.9 0.912 0.152
Table 5.5 Comparison of mean diameter (from DLS) of electrosprayed HA-
PDAMEMA and HA-PLA-PDMAEMA particles
In all cases for electrosprayed particles, it can be seen that there is a problem
with maintaining morphology during dry collection and wet collection, particularly
for the HA particles. Methods employed by others to preserve morphology and
prevent aggregation have included spraying into an emulsion to coat the particles to
give more stability12, and performing electrospray in an air-flow chamber with the
particles collected in a filter213. It is also possible to increase the polymer
concentration in the shell to give a thicker and potentially stronger shell. However, the
shell polymer concentration can only be increased so much as beyond a certain point,
fibre formation is seen50. Increasing the outer polymer concentration also affects the
particle size214 and so it would be better to explore other avenues for preventing
particle deformation first.

143
5.3.3.3 Zeta Potential
Next the zeta potential of bulk-assembled complexes and electrosprayed
particles was compared for all polymer combinations to give an insight into the shell
structure.
Figure 5.10 Comparison of zeta potential across different polymer combinations prepared
with electrospray (blue) and self-assembly (orange) (shown with standard deviation)
Fig. 5.10 shows the variation in zeta potential across the different
combinations of inner and outer polymer produced by both electrospray and self-
assembly methods. For the self-assembly method, the same trend can be seen for both
CMC and HA particles – there is a decrease in zeta potential when changing the outer
shell polymer from PDMAEMA to PLA-PDMAEMA. This suggests that the
interaction between the inner and outer polymers does not vary between the CMC and
HA.
For the electrospray method, there is a very slight decrease with the CMC
particles, but the HA particles show no such trend. This suggests that the particles are
not stable and it is clear from the particle sizing by DLS (Table 5.4), that the particles
0
5
10
15
20
CMC-PDMAEMA CMC-PLA-PDMAEMA HA-PDMAEMA HA-PLA-PDMAEMA
zeta
po
ten
tial
(m
V)

144
have aggregated. The low zeta potential of the HA samples compared to the CMC
samples suggests that the HA has indeed escaped from the particles and the mixture
of HA and PDMAEMA or PLA-PDMAEMA aggregates gives an overall low zeta
potential.
5.3.3.4 TEM
All polymer combinations of bulk-assembled complexes and electrosprayed
particles were examined by TEM and compared to check for core-shell structure.
Figure 5.11 TEM images of bulk-assembled complexes a) CMC-PDMAEMA, b) CMC-PLA-
PDMAEMA, c) HA-PDMAEMA and d) HA-PLA-PDMAEMA
a) b)
d) c)

145
From the TEM images in Fig. 5.11, it is clear that there is a difference between
CMC and HA bulk-assembled complexes. While a core-shell structure can be seen in
all cases, the cores of the CMC complexes show much higher density than the HA,
and within the HA it seems that individual blocks can be seen. Basta et al. saw
complexation of CMC with silver giving rise to both rounded and angular complexes
depending on the source of CMC215. It is possible that what is being seen here is the
encapsulation of CMC-silver and HA-silver complexes. This suggests that the staining
method should be revised in order to prevent this complexation.
Figure 5.12 TEM images of electrosprayed particles a) CMC- PDMAEMA, b) CMC-PLA-
PDMAEMA, c) HA-PDMAEMA and d) HA-PLA-PDMAEMA
b
)
c
)
a
)
d
)

146
From the electrosprayed TEM images (Fig. 5.12), it is clear that while all three
particles appear to have a core-shell structure, they all have a different appearance.
However, the CMC-PLA-PDMAEMA particle is similar in appearance to coaxially
electrosprayed particles by Shams et al.116 and the HA-PDMAEMA and HA-PLA-
PDMAEMA particles are similar to coaxially electrosprayed particles by Lee et al.57.
As seen from the AFM data, the particles with a PLA-PDMAEMA shell are
smaller than those with a PDMAEMA shell. Although only single particles are shown
here, the diameters are not as large as the mean corrected lateral diameters seen with
AFM and so it seems that the shape of the particles is better preserved with the TEM
grids. This may be related to the difference in softness between the silicon wafer and
the lacey carbon of the TEM grids.
Comparing the bulk-assembled complexes with the electrosprayed particles, it
is clear that the structures seen within the core in the bulk-assembled complexes are
not present. It is possible that as the bulk-assembly solution is left to dry on the TEM
grids, that additional complexation and aggregation is occurring during this time.
5.4 Conclusion
Due to their different mechanisms of synthesis, bulk-assembled complexes
and electrosprayed particles can display different properties. In self-assembly, size
can be controlled through the pH the particles are assembled in due to the effects on
the charge of the polymers and polymer swelling. The clear decrease in zeta potential
when going from PDMAEMA to PLA-PDMAEMA shows that there is an
organisation to the outer shell that is not present in the electrosprayed particles which
see only a slight zeta potential decrease. This suggests that while in self-assembly,
arranging the orientation of a shell polymer so that a functionalised group is gathered

147
mainly on the outer surface can be achieved, they will be more evenly distributed
throughout the whole shell in electrospray, and polymer charge has negligible effect
on interaction between polymers during electrospray compared to self-assembly.
Therefore functionalisation should occur after the particles have been produced, for
example by an additional coating or a using a triaxial needle: inner liquid – core,
middle liquid – shell, outer liquid – additional functionalisation.
From the particle sizing, it seems that PLA-PDMAEMA is able to produce
smaller particles in electrospray with both CMC and HA, but the particles containing
HA are larger than their CMC counterparts. The ability of the PLA-PDMAEMA to
condense the core polymer is thought to be due to a tighter shell formation due to
electrostatic interaction between the PLA-PDMAEMA molecules themselves due to
the positively charged PDMAEMA and negatively charged PLA blocks. The larger
size of the HA particles is thought to be due to the higher swelling ratio of HA
compared to CMC.
There is however, an issue with the electrospray particle collection affecting
the particle morphology. Flattening of the particles was seen during dry collection
with electrospray for AFM and to a lesser degree for TEM which makes it difficult to
size the dry particles. In wet collection, for zeta sizing and zeta potential
measurements, the CMC particles were seen to be more stable than the HA particles
which showed a high degree of aggregation. Methods employed by others to preserve
morphology and prevent aggregation have included spraying into an emulsion to coat
the particles to give more stability12, and performing electrospray in an air-flow
chamber with the particles collected in a filter213. The employment of similar methods
may allow for better characterisation and comparison with the bulk-assembled

148
complexes; while the electrosprayed CMC particles appear to be smaller than the
equivalent bulk-assembled complexes, they also have a slightly higher PdI which may
be related to instability or aggregation.
In the case of using CMC and HA as substitutes for DNA, CMC appears to be
the better choice as it displays better stability in aqueous phase and produced smaller
particles, on a similar scale to viruses, in wet and dry conditions, most likely due to
the lower swelling ratio of CMC.

149
Chapter Six
Conclusions and Future Work
6.1 Conclusions
This study has compared the abilities of a block copolymer (PLA-
PDMAEMA) and homopolymer (PDMAEMA) to condense long-chain polymers
(CMC and HA) when forming core-shell particles through coaxial electrospray, with
an interest to proposing CMC and HA as polymers that can be used as cost-effective
models for DNA. Looking at a common chemical supplier (Sigma-Aldrich), CMC and
HA are available in the greatest range of molecular weights compared to other
polymers negative at neutral pH such as PAA, PAM or PMAA. Additionally, CMC is
far cheaper; 100 g can be purchased for less than £50 unlike PAA, PAM and PMAA
which can only be bought in milligrams or tens of grams and are considerably more
expensive per gram. Additionally electrosprayed particles and bulk-assembled
complexes of the same inner and outer polymer weight ratios have been characterised
and compared.
The core-shell structure has been confirmed for all particle types, although the
zeta potential shows that the structure of the core varies between electrosprayed
particles and bulk-assembled complexes. The reduction in zeta potential between
PDMAEMA and PLA-PDMAEMA shells of the complexes indicates that when using
the block copolymer, the PDMAEMA block is oriented towards the core giving a PLA
rich corona. In contrast very little zeta potential reduction is seen with the

150
electrosprayed particles suggesting that this radial orientation is not present. However,
with both methods, it seemed PLA-PDMAEMA was able to produce smaller
complexes and particles albeit by different methods. It is proposed that for the
electrosprayed particles, electrostatic interaction between the PLA-PDMAEMA
molecules as they diffuse through the solvent shell leads to a tighter shell structure
and so a smaller final particle, compared to the PDMAEMA alone. However, this
difference in the shell structures between electrospray and self-assembly means that
while in self-assembly, multi-block polymers can be radially oriented around the core
to form structured complexes (e.g. core -> protective shell -> functionalised group),
in electrospray one would expect the functionalised group to appear evenly distributed
throughout the shell, rather than gathered on the surface. Achieving functionalisation
on electrosprayed particles may require a higher concentration of the functionalised
group, use of triaxial needles or coating the particles during wet collection.
Particle sizing indicates that the electrosprayed particles containing CMC are
on the nanoscale (~100 nm), similar to bulk-assembled complex sizes and are also
similar in size DNA and PDMAEMA complexes seen in the literature. However,
problems were seen with electrosprayed particle deformation during dry collection.
This suggests that the electrosprayed particles are relatively soft and an alternate
collection method to spraying directly onto a hard substrate would help better preserve
the particle morphology. Evidence supporting this can be seen in the reduction of
particle diameter between the AFM data (particles sprayed onto silicon wafer) and the
TEM data (particles sprayed onto lacey carbon film). Additionally the HA particles
appeared highly unstable in aqueous phase as a high degree of aggregation was seen.
It is possible that this is related to HA’s high swelling ratio and therefore CMC seems
to the better candidate for a cost-effective model for DNA. It is able to produce

151
electrosprayed particles with a similar zeta potential to bulk-assembled polymer
encapsulated DNA particles seen in the literature which suggests that it may show
comparative cell transfection abilities.
6.2 Future work
This study has indicated that 1) during electrospray, use of a block copolymer
in the outer liquid leads to the creation of a smaller particle than the use of a
homopolymer, and 2) CMC may be a suitable
model for DNA as it is able to produce particles through electrospray that have a
similar zeta potential to bulk-assembled DNA polymer capsules and therefore also
display similar transfection ability. The next step would be to compare
electrosprayed CMC particles with DNA with both PDMAEMA and PLA-
PDMAEMA in order to directly compare their behaviour and evaluate how similar
they are. However, further work is also required to create a particle that is robust
enough to withstand deformation during dry collection and achieve a more in depth
characterisation of the particle structure.
The deformation of electrosprayed particles during dry collection makes it
difficult to measure the size of dried particles accurately and also the softness of the
shell suggests that there is some way to go before these particles are comparable in
strength to viral vectors. It would be worthwhile exploring other collection methods
such as using softer collection substrates or coating particles during wet collection to
add strength to the shell. Alternatively increasing the thickness of the shell could also
improve strength although the degree to which this can be done is limited due to fibre
production as the polymer weight percentage increases.

152
During TEM imaging, Energy Dispersive Spectroscopy could be used to look
further into the structure of the particles and complexes, and provide additional
information as to whether any mixing of the two polymer phases has occurred.
Finally an assessment of the ability of bulk-assembled complexes and
electrosprayed particles to transfect cells compared to viral vectors would be
beneficial. With the goal of producing a non-viral vector, it is important that it has
comparable transfection ability to viral vectors.
153
7. References
1. Ho, C.S. et al. Electrospray ionisation mass spectrometry: principles and
clinical applications. The Clinical biochemist. Reviews 24, 3-12 (2003).
2. Gamero-Castano, M. & Hruby, V. Electrospray as a Source of Nanoparticles
for Efficient Colloid Thrusters. J Propul Power 17, 977-987 (2001).
3. Jaworek, A. et al. Electrospray Nanocoating of Microfibres. Solid State
Phenomena 140, 127-132 (2008).
4. Bock, N., Dargaville, T.R. & Woodruff, M.A. Electrospraying of polymers
with therapeutic molecules: State of the art. Prog Polym Sci 37, 1510-1551
(2012).
5. Ganan-Calvo, A.M., Davila, J. & Barrero, A. Current and droplet size in the
electrospraying of liquids. Scaling laws. J Aerosol Sci 28, 249-275 (1997).
6. Ganan-Calvo, A.M., Rebollo-Munoz, N. & Montanero, J.M. The minimum or
natural rate of flow and droplet size ejected by Taylor cone-jets: physical
symmetries and scaling laws. New J Phys 15 (2013).
7. Gomez, A., Bingham, D., Juan, L.d. & Tang, K. Production of protein
nanoparticles by electrospray drying, Vol. 29. (1998).
8. Shang, L., Nienhaus, K. & Nienhaus, G.U. Engineered nanoparticles
interacting with cells: size matters. J Nanobiotechnol 12 (2014).
9. He, C.B., Hu, Y.P., Yin, L.C., Tang, C. & Yin, C.H. Effects of particle size
and surface charge on cellular uptake and biodistribution of polymeric
nanoparticles. Biomaterials 31, 3657-3666 (2010).
10. Xu, A.R. et al. A physical model for the size-dependent cellular uptake of
nanoparticles modified with cationic surfactants. International Journal of
Nanomedicine 7, 3547-3554 (2012).
11. Chakraborty, S., Liao, I.C., Adler, A. & Leong, K.W. Electrohydrodynamics:
A facile technique to fabricate drug delivery systems. Adv Drug Deliver Rev
61, 1043-1054 (2009).
154
12. Almería, B., Fahmy, T.M. & Gomez, A. A multiplexed electrospray process
for single-step synthesis of stabilized polymer particles for drug delivery.
Journal of Controlled Release 154, 203-210 (2011).
13. Almeria, B., Deng, W.W., Fahmy, T.M. & Gomez, A. Controlling the
morphology of electrospray-generated PLGA microparticles for drug delivery.
J Colloid Interf Sci 343, 125-133 (2010).
14. Chen, D.R., Wendt, C.H. & Pui, D.Y.H. A novel approach for introducing bio-
materials into cells. Journal of Nanoparticle Research 2, 133-139 (2000).
15. Boda, S.K., Li, X. & Xie, J. Electrospraying an enabling technology for
pharmaceutical and biomedical applications: A review. J Aerosol Sci 125, 164-
181 (2018).
16. Wu, Y., Fei, Z.Z., Lee, L.J. & Wyslouzil, B.E. Coaxial Electrohydrodynamic
Spraying of Plasmid DNA/Polyethylenimine (PEI) Polyplexes for Enhanced
Nonviral Gene Delivery. Biotechnology and Bioengineering 105, 834-841
(2010).
17. Cloupeau, M. & Prunetfoch, B. Electrostatic Spraying of Liquids in Cone-Jet
Mode. J Electrostat 22, 135-159 (1989).
18. Jaworek, A. & Krupa, A. Classification of the modes of EHD spraying. J
Aerosol Sci 30, 873-893 (1999).
19. Marginean, I., Kelly, R.T., Page, J.S., Tang, K. & Smith, R.D. Electrospray
characteristic curves: In pursuit of improved performance in the nanoflow
regime. Analytical Chemistry 79, 8030-8036 (2007).
20. Marginean, I., Parvin, L., Heffernan, L. & Vertes, A. Flexing the electrified
meniscus: The birth of a jet in electrosprays. Analytical Chemistry 76, 4202-
4207 (2004).
21. Taylor, G. Disintegration of Water Drops in an Electric Field, Vol. 280. (1964).
22. Higuera, F.J. Flow rate and electric current emitted by a Taylor cone. J Fluid
Mech 484, 303-327 (2003).
23. de la Mora, J.F. The fluid dynamics of Taylor cones. Annu Rev Fluid Mech 39,
217-243 (2007).

155
24. Hartman, R.P.A., Brunner, D.J., Camelot, D.M.A., Marijnissen, J.C.M. &
Scarlett, B. Jet break-up in electrohydrodynamic atomization in the cone-jet
mode. J Aerosol Sci 31, 65-95 (2000).
25. Huebner, A.L. & Chu, H.N. INSTABILITY AND BREAKUP OF CHARGED
LIQUID JETS. J Fluid Mech 49, 361-& (1971).
26. Li, F., Yin, X.-Y. & Yin, X.-Z. Axisymmetric and non-axisymmetric
instability of an electrified viscous coaxial jet. J Fluid Mech 632, 199-225
(2009).
27. Hartman, R.P.A., Brunner, D.J., Camelot, D.M.A., Marijnissen, J.C.M. &
Scarlett, B. Electrohydrodynamic atomization in the cone-jet mode physical
modeling of the liquid cone and jet. J Aerosol Sci 30, 823-849 (1999).
28. Rayleigh, L. XX. On the equilibrium of liquid conducting masses charged with
electricity. Philosophical Magazine Series 5 14, 184-186 (1882).
29. De la mora, J.F. & Loscertales, I.G. The Current Emitted by Highly
Conducting Taylor Cones. J Fluid Mech 260, 155-184 (1994).
30. Yao, J., Lim, L.K., Xie, J.W., Hua, J.S. & Wang, C.H. Characterization of
electrospraying process for polymeric particle fabrication. J Aerosol Sci 39,
987-1002 (2008).
31. Ganan-Calvo, A.M. & Montanero, J.M. Revision of capillary cone-jet physics:
Electrospray and flow focusing. Physical Review E 79 (2009).
32. Ganan-Calvo, A.M., Lopez-Herrera, J.M., Herrada, M.A., Ramos, A. &
Montanero, J.M. Review on the physics of electrospray: From electrokinetics
to the operating conditions of single and coaxial Taylor cone-jets, and AC
electrospray. J Aerosol Sci 125, 32-56 (2018).
33. Park, I., Hong, W.S., Kim, S.B. & Kim, S.S. Experimental investigations on
characteristics of stable water electrospray in air without discharge. Physical
Review E 95 (2017).
34. Chen, D.R. & Pui, D.Y.H. Experimental investigation of scaling laws for
electrospraying: Dielectric constant effect. Aerosol Sci Tech 27, 367-380
(1997).

156
35. Scheideler, W.J. & Chen, C.H. The minimum flow rate scaling of Taylor cone-
jets issued from a nozzle. Applied Physics Letters 104 (2014).
36. Yamashita, M. & Fenn, J.B. Negative-Ion Production with the Electrospray
Ion-Source. J Phys Chem-Us 88, 4671-4675 (1984).
37. Ryan, C.N., Smith, K.L. & Stark, J.P.W. The flow rate sensitivity to voltage
across four electrospray modes. Applied Physics Letters 104 (2014).
38. Hwang, Y.K., Jeong, U. & Cho, E.C. Production of uniform-sized polymer
core-shell microcapsules by coaxial electrospraying. Langmuir 24, 2446-2451
(2008).
39. Lopez-Herrera, J.M., Barrero, A., Lopez, A., Loscertales, I.G. & Marquez, M.
Coaxial jets generated from electrified Taylor cones. Scaling laws. J Aerosol
Sci 34, 535-552 (2003).
40. Mei, F. & Chen, D.-R. Investigation of compound jet electrospray: Particle
encapsulation. Physics of Fluids 19, 103303 (2007).
41. Ciach, T. Microencapsulation of drugs by electro-hydro-dynamic atomization.
International Journal of Pharmaceutics 324, 51-55 (2006).
42. Valo, H. et al. Electrospray Encapsulation of Hydrophilic and Hydrophobic
Drugs in Poly(L-lactic acid) Nanoparticles. Small 5, 1791-1798 (2009).
43. Zhang, S. et al. Coaxial Electrospray Formulations for Improving Oral
Absorption of a Poorly Water-Soluble Drug. Molecular Pharmaceutics 8, 807-
813 (2011).
44. Rezvanpour, A., Attia, A.B.E. & Wang, C.-H. Enhancement of Particle
Collection Efficiency in Electrohydrodynamic Atomization Process for
Pharmaceutical Particle Fabrication. Ind Eng Chem Res 49, 12620-12631
(2010).
45. Zamani, M., Prabhakaran, M.P., Thian, E.S. & Ramakrishna, S. Protein
encapsulated core-shell structured particles prepared by coaxial
electrospraying: Investigation on material and processing variables.
International Journal of Pharmaceutics 473, 134-143 (2014).

157
46. Ho, H. & Lee, J. PEG/PLA Core/Shell Particles from Coaxial
Electrohydrodynamic Spray Drying. Macromolecular Research 19, 815-821
(2011).
47. Jing, Y., Zhu, Y., Yang, X., Shen, J. & Li, C. Ultrasound-Triggered Smart
Drug Release from Multifunctional Core-Shell Capsules One-Step Fabricated
by Coaxial Electrospray Method. Langmuir 27, 1175-1180 (2011).
48. Park, C.H. & Lee, J. Electrosprayed Polymer Particles: Effect of the Solvent
Properties. J. Appl. Polym. Sci. 114, 430-437 (2009).
49. Wu, Y. et al. Coaxial Electrohydrodynamic Spraying: A Novel One-Step
Technique To Prepare Oligodeoxynucleotide Encapsulated Lipoplex
Nanoparticles. Molecular Pharmaceutics 6, 1371-1379 (2009).
50. Wang, Y. et al. Controlled release behaviour of protein-loaded microparticles
prepared via coaxial or emulsion electrospray. Journal of Microencapsulation
30, 490-497 (2013).
51. Xie, J.W., Ng, W.J., Lee, L.Y. & Wang, C.H. Encapsulation of protein drugs
in biodegradable microparticles by co-axial electrospray. J Colloid Interf Sci
317, 469-476 (2008).
52. Enayati, M., Ahmad, Z., Stride, E. & Edirisinghe, M. One-step
electrohydrodynamic production of drug-loaded micro- and nanoparticles.
Journal of the Royal Society Interface 7, 667-675 (2010).
53. Guan, Y.P. et al. Preparation of ALA-loaded PLGA nanoparticles and its
application in PDT treatment. Journal of Chemical Technology and
Biotechnology 91, 1128-1135 (2016).
54. Hao, S.L., Wang, B.C., Wang, Y.Z. & Xu, Y.Q. Enteric-coated sustained-
release nanoparticles by coaxial electrospray: preparation, characterization,
and in vitro evaluation. Journal of Nanoparticle Research 16, 11 (2014).
55. Yuan, S. et al. Coaxial Electrospray of Curcumin-Loaded Microparticles for
Sustained Drug Release. Plos One 10 (2015).
56. Cao, Y., Wang, B.C., Wang, Y.Z. & Lou, D.S. Polymer-controlled core-shell
nanoparticles: a novel strategy for sequential drug release. Rsc Advances 4,
30430-30439 (2014).

158
57. Lee, Y.H., Mei, F., Bai, M.Y., Zhao, S. & Chen, D.R. Release profile
characteristics of biodegradable-polymer-coated drug particles fabricated by
dual-capillary electrospray. Journal of Controlled Release 145, 58-65 (2010).
58. Reardon, P.J.T. et al. Electrohydrodynamic fabrication of core-shell PLGA
nanoparticles with controlled release of cisplatin for enhanced cancer
treatment. International Journal of Nanomedicine 12, 3913-3926 (2017).
59. Xu, Q.X. et al. Coaxial electrohydrodynamic atomization process for
production of polymeric composite microspheres. Chemical Engineering
Science 104, 330-346 (2013).
60. Kavadiya, S. & Biswas, P. Electrospray deposition of biomolecules:
Applications, challenges, and recommendations. J Aerosol Sci 125, 182-207
(2018).
61. Akita, H. et al. A neutral lipid envelope-type nanoparticle composed of a pH-
activated and vitamin E-scaffold lipid-like material as a platform for a gene
carrier targeting renal cell carcinoma. Journal of Controlled Release 200, 97-
105 (2015).
62. Xu, C.-F., Liu, Y., Shen, S., Zhu, Y.-H. & Wang, J. Targeting glucose uptake
with siRNA-based nanomedicine for cancer therapy. Biomaterials 51, 1-11
(2015).
63. Silva, A.K.A. et al. Combining magnetic nanoparticles with cell derived
microvesicles for drug loading and targeting. Nanomedicine: Nanotechnology,
Biology and Medicine 11, 645-655 (2015).
64. Zhang, Y. et al. Targeted delivery of human VEGF gene via complexes of
magnetic nanoparticle-adenoviral vectors enhanced cardiac regeneration. Plos
One 7, e39490-e39490 (2012).
65. Bietenbeck, M., Florian, A., Faber, C., Sechtem, U. & Yilmaz, A. Remote
magnetic targeting of iron oxide nanoparticles for cardiovascular diagnosis
and therapeutic drug delivery: where are we now? International journal of
nanomedicine 11, 3191-3203 (2016).
66. Medicine, J.o.G., Vol. 2017 Vectors Used in Gene Therapy Clinical Trials
Worldwide (John Wiley and Sons Ltd, 2017).
159
67. , Vol. 2017 (Journal of Gene Medicine, 2017).
68. Zaiss, A.K. et al. Complement is an essential component of the immune
response to adeno-associated virus vectors. J Virol 82, 2727-2740 (2008).
69. Appledorn, D.M. et al. Adenovirus vector-induced innate inflammatory
mediators, MAPK signaling, as well as adaptive immune responses are
dependent upon both TLR2 and TLR9 in vivo. J Immunol 181, 2134-2144
(2008).
70. Zhu, J., Huang, X. & Yang, Y. Innate immune response to adenoviral vectors
is mediated by both Toll-like receptor-dependent and -independent pathways.
J Virol 81, 3170-3180 (2007).
71. Mingozzi, F. et al. CD8+ T-cell responses to adeno-associated virus capsid in
humans. Nat Med 13, 419 (2007).
72. Gahery-Segard, H. et al. Immune response to recombinant capsid proteins of
adenovirus in humans: Antifiber and anti-penton base antibodies have a
synergistic effect on neutralizing activity. J Virol 72, 2388-2397 (1998).
73. Zhu, J.G., Huang, X.P. & Yang, Y.P. Type IIFN signaling on both B and CD4
T cells is required for protective antibody response to adenovirus. J Immunol
178, 3505-3510 (2007).
74. Raper, S.E. et al. Fatal systemic inflammatory response syndrome in a
ornithine transcarbamylase deficient patient following adenoviral gene
transfer. Mol Genet Metab 80, 148-158 (2003).
75. Hacein-Bey-Abina, S. et al. Insertional oncogenesis in 4 patients after
retrovirus-mediated gene therapy of SCID-X1. J Clin Invest 118, 3132-3142
(2008).
76. Braun, C.J. et al. Gene Therapy for Wiskott-Aldrich Syndrome-Long-Term
Efficacy and Genotoxicity. Sci Transl Med 6 (2014).
77. Dicks, M.D.J. et al. The relative magnitude of transgene-specific adaptive
immune responses induced by human and chimpanzee adenovirus vectors
differs between laboratory animals and a target species. Vaccine 33, 1121-
1128 (2015).

160
78. Manno, C.S. et al. Successful transduction of liver in hemophilia by AAV-
Factor IX and limitations imposed by the host immune response. Nat Med 12,
342 (2006).
79. Li, H. et al. Capsid-specific T-cell Responses to Natural Infections With
Adeno-associated Viruses in Humans Differ From Those of Nonhuman
Primates. Molecular Therapy 19, 2021-2030 (2011).
80. Lundstrom, K. Viral Vectors in Gene Therapy. Diseases 6, 42 (2018).
81. Kawabata, K., Takakura, Y. & Hashida, M. The Fate of Plasmid DNA after
Intravenous-Injection in Mice - Involvement of Scavenger Receptors in Its
Hepatic-Uptake. Pharm Res 12, 825-830 (1995).
82. Pinyon, J.L. et al. Close-Field Electroporation Gene Delivery Using the
Cochlear Implant Electrode Array Enhances the Bionic Ear. Sci Transl Med 6
(2014).
83. Gao, D. et al. Ultrasound-Triggered Phase-Transition Cationic Nanodroplets
for Enhanced Gene Delivery. ACS Appl. Mater. Interfaces 7, 13524-13537
(2015).
84. Mislick, K.A. & Baldeschwieler, J.D. Evidence for the role of proteoglycans
in cation-mediated gene transfer. P Natl Acad Sci USA 93, 12349-12354
(1996).
85. Liao, J.F. et al. Self-Assembly DNA Polyplex Vaccine inside Dissolving
Microneedles for High-Potency Intradermal Vaccination. Theranostics 7,
2593-2605 (2017).
86. Uchida, S. et al. Combination of chondroitin sulfate and polyplex micelles
from Poly(ethylene glycol)-poly{N '-[N-(2-aminoethyl)-2-
aminoethyl]aspartamide} block copolymer for prolonged in vivo gene
transfection with reduced toxicity. Journal of Controlled Release 155, 296-
302 (2011).
87. Howard, K.A. et al. Formulation of a microparticle carrier for oral polyplex-
based DNA vaccines. Bba-Gen Subjects 1674, 149-157 (2004).

161
88. Zhang, X.F. et al. PEGylated poly(amine-co-ester) micelles as biodegradable
non-viral gene vectors with enhanced stability, reduced toxicity and higher in
vivo transfection efficacy. J Mater Chem B 2, 4034-4044 (2014).
89. Dhande, Y.K. et al. N-Acetylgalactosamine Block-co-Polycations Form
Stable Polyplexes with Plasmids and Promote Liver-Targeted Delivery.
Biomacromolecules 17, 830-840 (2016).
90. Ganas, C. et al. Biodegradable capsules as non-viral vectors for in vitro
delivery of PEI/siRNA polyplexes for efficient gene silencing. Journal of
Controlled Release 196, 132-138 (2014).
91. Li, L.H., Puhl, S., Meinel, L. & Germershaus, O. Silk fibroin layer-by-layer
microcapsules for localized gene delivery. Biomaterials 35, 7929-7939 (2014).
92. Bishop, C.J., Tzeng, S.Y. & Green, J.J. Degradable polymer-coated gold
nanoparticles for co-delivery of DNA and siRNA. Acta Biomater 11, 393-403
(2015).
93. Arya, N., Chakraborty, S., Dube, N. & Katti, D.S. Electrospraying: A Facile
Technique for Synthesis of Chitosan-Based Micro/Nanospheres for Drug
Delivery Applications. J. Biomed. Mater. Res. Part B 88B, 17-31 (2009).
94. Esselin, N. et al. Potentialities of the Poly(Aminoethyl Methacrylate) p(AMA)
as Gelatin-Like Polymer in Complex Coacervation. 06, 147-160 (2016).
95. Pavot, V. et al. Encapsulation of Nod1 and Nod2 receptor ligands into
poly(lactic acid) nanoparticles potentiates their immune properties. Journal of
Controlled Release 167, 60-67 (2013).
96. Saini, V. et al. Humoral and cell-mediated immune-responses after
administration of a single-shot recombinant hepatitis B surface antigen
vaccine formulated with cationic poly(l-lactide) microspheres. J Drug Target
18, 212-222 (2010).
97. Han, F.Y., Thurecht, K.J., Whittaker, A.K. & Smith, M.T. Bioerodable PLGA-
Based Microparticles for Producing Sustained-Release Drug Formulations and
Strategies for Improving Drug Loading. Front Pharmacol 7 (2016).
98. Freiberg, S. & Zhu, X. Polymer microspheres for controlled drug release.
International Journal of Pharmaceutics 282, 1-18 (2004).

162
99. Liu, H., Slamovich, E.B. & Webster, T.J. Less harmful acidic degradation of
poly(lactic-co-glycolic acid) bone tissue engineering scaffolds through titania
nanoparticle addition. International Journal of Nanomedicine 1, 541-545
(2006).
100. Sivakumar, S.M. & Sukumaran, N. Induction of Immune Response of
Hepatitis B Vaccine Using Polyester Polymer as an Adjuvant. Vaccine (2008).
101. Ataman-Onal, Y. et al. Surfactant-free anionic PLA nanoparticles coated with
HIV-1 p24 protein induced enhanced cellular and humoral immune responses
in various animal models. Journal of Controlled Release 112, 175-185 (2006).
102. Bansal, V., Kumar, M., Dalela, M., Brahmne, H.G. & Singh, H. Evaluation of
synergistic effect of biodegradable polymeric nanoparticles and aluminum
based adjuvant for improving vaccine efficacy. International Journal of
Pharmaceutics 471, 377-384 (2014).
103. Zhang, W.F. et al. Immunopotentiator-Loaded Polymeric Microparticles as
Robust Adjuvant to Improve Vaccine Efficacy. Pharm Res 32, 2837-2850
(2015).
104. Zhang, X., Duan, Y.J., Wang, D.F. & Bian, F.L. Preparation of arginine
modified PEI-conjugated chitosan copolymer for DNA delivery. Carbohyd
Polym 122, 53-59 (2015).
105. Jiang, D.H. & Salem, A.K. Optimized dextran-polyethylenimine conjugates
are efficient non-viral vectors with reduced cytotoxicity when used in serum
containing environments. International Journal of Pharmaceutics 427, 71-79
(2012).
106. Jokerst, J.V., Lobovkina, T., Zare, R.N. & Gambhir, S.S. Nanoparticle
PEGylation for imaging and therapy. Nanomedicine-Uk 6, 715-728 (2011).
107. Qie, Y.Q. et al. Surface modification of nanoparticles enables selective
evasion of phagocytic clearance by distinct macrophage phenotypes (vol 6,
26269, 2016). Sci Rep-Uk 6 (2016).
108. Davies, L.A. et al. Electrohydrodynamic comminution: A novel technique for
the aerosolisation of plasmid DNA. Pharm Res 22, 1294-1304 (2005).

163
109. Parodi, A. et al. Enabling cytoplasmic delivery and organelle targeting by
surface modification of nanocarriers. Nanomedicine-Uk 10, 1923-1940 (2015).
110. Benjaminsen, R.V., Mattebjerg, M.A., Henriksen, J.R., Moghimi, S.M. &
Andresen, T.L. The possible "proton sponge " effect of polyethylenimine (PEI)
does not include change in lysosomal pH. Molecular therapy : the journal of
the American Society of Gene Therapy 21, 149-157 (2013).
111. Li, Z., Mak, S.Y., Sauret, A. & Shum, H.C. Syringe-pump-induced fluctuation
in all-aqueous microfluidic system implications for flow rate accuracy. Lab on
a Chip 14, 744-749 (2014).
112. Kim, W. & Kim, S.S. Synthesis of biodegradable triple-layered capsules using
a triaxial electrospray method. Polymer 52, 3325-3336 (2011).
113. Ghayempour, S. & Mortazavi, S.M. Fabrication of micro-nanocapsules by a
new electrospraying method using coaxial jets and examination of effective
parameters on their production. J Electrostat 71, 717-727 (2013).
114. Hao, S.L. et al. Formulation of porous poly(lactic-co-glycolic acid)
microparticles by electrospray deposition method for controlled drug release.
Materials Science & Engineering C-Materials for Biological Applications 39,
113-119 (2014).
115. Zarchi, A.A.K. et al. Development and optimization of N-Acetylcysteine-
loaded poly (lactic-co-glycolic acid) nanoparticles by electrospray. Int. J. Biol.
Macromol. 72, 764-770 (2015).
116. Shams, T., Parhizkar, M., Illangakoon, U.E., Orlu, M. & Edirisinghe, M.
Core/shell microencapsulation of indomethacin/paracetamol by co-axial
electrohydrodynamic atomization. Materials & Design 136, 204-213 (2017).
117. Parhizkar, M. et al. Electrohydrodynamic encapsulation of cisplatin in poly
(lactic-co-glycolic acid) nanoparticles for controlled drug delivery. Nanomed-
Nanotechnol 12, 1919-1929 (2016).
118. Xie, J. & Wang, C.-H. Encapsulation of proteins in biodegradable polymeric
microparticles using electrospray in the Taylor Cone-Jet mode. Biotechnology
and Bioengineering 97, 1278-1290 (2007).

164
119. Liu, H. et al. Double-layered hyaluronic acid/stearic acid-modified
polyethyleneimine nanoparticles encapsulating (-)-gossypol: a nanocarrier for
chiral anticancer drugs. J Mater Chem B 2, 5238-5248 (2014).
120. Gasket, Q.C., Vol. 2018 (http://www.quickcutgasket.com; 2018).
121. Wang, K. in Viscoelasticity - From Theory to Biological Applications. (ed.
J.D. Vicente) 77-96 (IntechOpen, 2012).
122. Tang, K.Q. & Gomez, A. Monodisperse electrosprays of low electric
conductivity liquids in the cone-jet mode. J Colloid Interf Sci 184, 500-511
(1996).
123. Chen, X.P., Jia, L.B., Yin, X.Z., Cheng, J.S. & Lu, J. Spraying modes in
coaxial jet electrospray with outer driving liquid. Physics of Fluids 17 (2005).
124. Chang, M.W., Stride, E. & Edirisinghe, M. A New Method for the Preparation
of Monoporous Hollow Microspheres. Langmuir 26, 5115-5121 (2010).
125. Sofokleous, P., Lau, W.K., Edirisinghe, M. & Stride, E. The effect of needle
tip displacement in co-axial electrohydrodynamic processing. Rsc Advances 6,
75258-75268 (2016).
126. Merck (2019).
127. Merck, Vol. 2019 (Merck; 2019).
128. Merck, Vol. 2019 (2019).
129. Qian, X.M. et al. Star-branched amphiphilic PLA-b-PDMAEMA copolymers
for co-delivery of miR-21 inhibitor and doxorubicin to treat glioma.
Biomaterials 35, 2322-2335 (2014).
130. Munier, S., I, M., Delair, T., Verrier, B. & Ataman-Onal, Y. Cationic PLA
nanoparticles for DNA delivery: Comparison of three surface polycations for
DNA binding, protection and transfection properties. Colloid Surface B 43,
163-173 (2005).
131. Guo, S.T. et al. Amphiphilic and biodegradable methoxy polyethylene glycol-
block-(polycaprolactone-graft-poly(2-(dimethylamino)ethyl methacrylate)) as
an effective gene carrier. Biomaterials 32, 879-889 (2011).

165
132. Liu, C.K., Dou, Q.Q., Liow, S.S., Kumar, J.N. & Loh, X.J. Cationic Micelles
Based on Polyhedral Oligomeric Silsesquioxanes for Enhanced Gene
Transfection. Aust J Chem 69, 363-371 (2016).
133. Lin, D.S. et al. Structural contributions of blocked or grafted poly(2-
dimethylaminoethyl methacrylate) on PEGylated polycaprolactone
nanoparticles in siRNA delivery. Biomaterials 32, 8730-8742 (2011).
134. Zheng, X. et al. Structural impact of graft and block copolymers based on
poly(N-vinylpyrrolidone) and poly(2-dimethylaminoethyl methacrylate) in
gene delivery. J Mater Chem B 3, 4027-4035 (2015).
135. Cherng, J.Y., vandeWetering, P., Talsma, H., Crommelin, D.J.A. & Hennink,
W.E. Effect of size and serum proteins on transfection efficiency of poly((2-
dimethylamino)ethyl methacrylate)-plasmid nanoparticles. Pharm Res 13,
1038-1042 (1996).
136. Loh, X.J., Ong, S.J., Tung, Y.T. & Choo, H.T. Co-delivery of drug and DNA
from cationic dual-responsive micelles derived from poly(DMAEMA-co-
PPGMA). Materials Science & Engineering C-Materials for Biological
Applications 33, 4545-4550 (2013).
137. Isik, T., Demir, M.M., Aydogan, C., Ciftci, M. & Yagci, Y. Hydrophobic
Coatings from Photochemically Prepared Hydrophilic Polymethacrylates via
Electrospraying. J Polym Sci Pol Chem 55, 1338-1344 (2017).
138. Vert, M., Li, S.M., Spenlehauer, G. & Guerin, P. Bioresorbability and
Biocompatibility of Aliphatic Polyesters. J Mater Sci-Mater M 3, 432-446
(1992).
139. Okamoto, M. & John, B. Synthetic biopolymer nanocomposites for tissue
engineering scaffolds. Prog Polym Sci 38, 1487-1503 (2013).
140. Lu, J., Hou, R., Yang, Z.L. & Tang, Z.H. Development and characterization
of drug-loaded biodegradable PLA microcarriers prepared by the
electrospraying technique. Int J Mol Med 36, 249-254 (2015).
141. Xu, Y.X. & Hanna, M.A. Morphological and structural properties of two-
phase coaxial jet electrosprayed BSA-PLA capsules. Journal of
Microencapsulation 25, 469-477 (2008).

166
142. Li, J.L. & Tok, A. Electrospraying of water in the cone-jet mode in air at
atmospheric pressure. Int J Mass Spectrom 272, 199-203 (2008).
143. Yao, S.L. et al. Drug-nanoencapsulated PLGA microspheres prepared by
emulsion electrospray with controlled release behavior. Regen Biomater 3,
309-317 (2016).
144. Yu, J.H., Fridrikh, S.V. & Rutledge, G.C. Production of Submicrometer
Diameter Fibers by Two-Fluid Electrospinning. Adv Mater 16, 1562-1566
(2004).
145. Misra, N.N., Sullivan, C. & Cullen, P.J. Process Analytical Technology (PAT)
and Multivariate Methods for Downstream Processes. Current Biochemical
Engineering 2, 4-16 (2015).
146. Delvallée, A., Feltin, N., Ducourtieux, S., Trabelsi, M. & Hochepied, J.-F.
Comparison of nanoparticle diameter measurements by Atomic Force
Microscopy and Scanning Electron Microscopy. International Congress of
Metrology, 06007 (2013).
147. Yang, D.Q., Xiong, Y.Q., Guo, Y., Da, D.A. & Lu, W.G. Sizes correction on
AFM images of nanometer spherical particles. J Mater Sci 36, 263-267 (2001).
148. Ali, M., Vol. Comparative Study on Structural and some Physical Properties
of ZnO Thin Films Prepared by Pulsed Laser Deposition (PLD) (Suez
University, 2015).
149. Bai, J., Beyer, S., Yein, T.S. & Trau, D. Self-Assembly of Polyamines as a
Facile Approach to Fabricate Permeability Tunable Polymeric Shells for
Biomolecular Encapsulation. ACS Appl. Mater. Interfaces 3, 1665-1674
(2011).
150. Cai, T. et al. Effect of hydrolysis degree of hydrolyzed polyacrylamide grafted
carboxymethyl cellulose on dye removal efficiency. Cellulose 20, 2605-2614
(2013).
151. Duhoranimana, E. et al. Effect of sodium carboxymethyl cellulose on complex
coacervates formation with gelatin: Coacervates characterization, stabilization
and formation mechanism. Food Hydrocolloid 69, 111-120 (2017).

167
152. Chen, N., Tong, Z., Yang, W. & Brennan, A.B. Biocomposites with tunable
properties from poly(lactic acid)-based copolymers and carboxymethyl
cellulose via ionic assembly. Carbohyd Polym 128, 122-129 (2015).
153. Krishnamoorthy, M. et al. Solution Conformation of Polymer Brushes
Determines Their Interactions with DNA and Transfection Efficiency.
Biomacromolecules 18, 4121-4132 (2017).
154. Tangeysh, B., Fryd, M., Ilies, M.A. & Wayland, B.B. Palladium metal
nanoparticle size control through ion paired structures of [PdCl4](2-) with
protonated PDMAEMA. Chem Commun 48, 8955-8957 (2012).
155. Niskanen, J. et al. Thermoresponsiveness of PDMAEMA. Electrostatic and
Stereochemical Effects. Macromolecules 46, 2331-2340 (2013).
156. Xing, R.M. et al. Superparamagnetic magnetite nanocrystal clusters as
potential magnetic carriers for the delivery of platinum anticancer drugs. J
Mater Chem 21, 11142-11149 (2011).
157. Nadagouda, M.N. & Varma, R.S. Synthesis of thermally stable carboxymethyl
cellulose/metal biodegradable nanocomposites for potential biological
applications. Biomacromolecules 8, 2762-2767 (2007).
158. Lin, X.Y. et al. Synthesis, characterization and electrospinning of new
thermoplastic carboxymethyl cellulose (TCMC). Chem Eng J 215, 709-720
(2013).
159. Kalliola, S. et al. The pH sensitive properties of carboxymethyl chitosan
nanoparticles cross-linked with calcium ions. Colloid Surface B 153, 229-236
(2017).
160. Li, Y., Zeng, Q., Gentle, I.R. & Wang, D.W. Carboxymethyl cellulose binders
enable high-rate capability of sulfurized polyacrylonitrile cathodes for Li-S
batteries. J Mater Chem A 5, 5460-5465 (2017).
161. Wu C, S.S., Varshney D, Shalaev E in Lyophilized Biologics and Vaccines
(Springer, 2015).
162. Mao, J., Ji, X.L. & Bo, S.Q. Synthesis and pH/Temperature-Responsive
Behavior of PLLA-b-PDMAEMA Block Polyelectrolytes Prepared via ROP
and ATRP. Macromol Chem Phys 212, 744-752 (2011).

168
163. Bonkovoski, L.C. et al. Polyelectrolyte complexes of poly[(2-dimethylamino)
ethyl methacrylate]/chondroitin sulfate obtained at different pHs: I.
Preparation, characterization, cytotoxicity and controlled release of
chondroitin sulfate. International Journal of Pharmaceutics 477, 197-207
(2014).
164. Yu, H.P., Fu, Y.C., Li, G. & Liu, Y.X. Antimicrobial surfaces of quaternized
poly[(2-dimethyl amino)ethyl methacrylate] grafted on wood via ARGET
ATRP. Holzforschung 67, 455-461 (2013).
165. Coblentz Society, I. (National Institute of Standards and Technology, NIST
Chemistry WebBook.
166. Coblentz Society, I. (National Institute of Standards and Technology, NIST
Chemistry WebBook.
167. Coblentz Society, I. (National Institute of Standards and Technology, NIST
Chemistry WebBook.
168. Mumper, R.J. & Jay, M. Poly(L-lactic Acid) Microspheres Containing
Neutron-Activatable Holmium-165: A Study of the Physical Characteristics of
Microspheres Before and After Irradiation in a Nuclear Reactor. Pharm Res 9,
149-154 (1992).
169. Koegler, W.S., Patrick, C., Cima, M.J. & Griffith, L.G. Carbon dioxide
extraction of residual chloroform from biodegradable polymers. J Biomed
Mater Res 63, 567-576 (2002).
170. Zielhuis, S.W. et al. Removal of chloroform from biodegradable therapeutic
microspheres by radiolysis. International Journal of Pharmaceutics 315, 67-
74 (2006).
171. Silva, J.M. et al. pH Responsiveness of Multilayered Films and Membranes
Made of Polysaccharides. Langmuir 31, 11318-11328 (2015).
172. Thompson, M.T., Berg, M.C., Tobias, I.S., Rubner, M.F. & Van Vliet, K.J.
Tuning compliance of nanoscale polyelectrolyte multilayers to modulate cell
adhesion. Biomaterials 26, 6836-6845 (2005).

169
173. Han, U., Seo, Y. & Hong, J. Effect of pH on the structure and drug release
profiles of layer-by-layer assembled films containing polyelectrolyte, micelles,
and graphene oxide. Sci Rep 6, 24158 (2016).
174. Bhattacharyya, R. & Ray, S.K. Kinetic and Equilibrium Modeling for
Adsorption of Textile Dyes in Aqueous Solutions by Carboxymethyl
Cellulose/Poly(acrylamide-co-hydroxyethy methacrylate) Semi-
interpenetrating Network Hydrogel. Polym Eng Sci 53, 2439-2453 (2013).
175. Cerchiara, T. et al. Microparticles based on chitosan/carboxymethylcellulose
polyelectrolyte complexes for colon delivery of vancomycin. Carbohyd Polym
143, 124-130 (2016).
176. Akar, E., Altinisik, A. & Seki, Y. Preparation of pH- and ionic-strength
responsive biodegradable fumaric acid crosslinked carboxymethyl cellulose.
Carbohyd Polym 90, 1634-1641 (2012).
177. Lohani, A., Singh, G., Bhattacharya, S.S., Hegde, R.R. & Verma, A. Tailored-
interpenetrating polymer network beads of kappa-carrageenan and sodium
carboxymethyl cellulose for controlled drug delivery. J Drug Deliv Sci Tec 31,
53-64 (2016).
178. van de Wetering, P. et al. A Mechanistic Study of the Hydrolytic Stability of
Poly(2-(dimethylamino)ethyl methacrylate). Macromolecules 31, 8063-8068
(1998).
179. Bütün, V., Armes, S.P. & Billingham, N.C. Synthesis and aqueous solution
properties of near-monodisperse tertiary amine methacrylate homopolymers
and diblock copolymers. Polymer 42, 5993-6008 (2001).
180. Lin, S. et al. An Acid-Labile Block Copolymer of PDMAEMA and PEG as
Potential Carrier for Intelligent Gene Delivery Systems. Biomacromolecules
9, 109-115 (2008).
181. Rungsardthong, U. et al. Effect of Polymer Ionization on the Interaction with
DNA in Nonviral Gene Delivery Systems. Biomacromolecules 4, 683-690
(2003).
182. Yetgin, S. & Balkose, D. Calf thymus DNA characterization and its adsorption
on different silica surfaces. RSC Advances 5, 57950-57959 (2015).

170
183. Lo, C.-W., Chang, Y., Lee, J.-L., Tsai, W.-B. & Chen, W.-S. Tertiary-Amine
Functionalized Polyplexes Enhanced Cellular Uptake and Prolonged Gene
Expression. Plos One 9, e97627 (2014).
184. Pippa, N., Karayianni, M., Pispas, S. & Demetzos, C. Complexation of
cationic-neutral block polyelectrolyte with insulin and in vitro release studies.
International Journal of Pharmaceutics 491, 136-143 (2015).
185. Pispas, S. Complexes of lysozyme with sodium (sulfamate-
carboxylate)isoprene/ethylene oxide double hydrophilic block copolymers.
Journal of Polymer Science Part A: Polymer Chemistry 45, 509-520 (2007).
186. Babikova, D. et al. Functional block copolymer nanocarriers for anticancer
drug delivery. Rsc Advances 6, 84634-84644 (2016).
187. Liao, Y.H., Jones, S.A., Forbes, B., Martin, G.P. & Brown, M.B. Hyaluronan:
Pharmaceutical characterization and drug delivery. Drug Deliv 12, 327-342
(2005).
188. Fink, T.L. et al. Plasmid size up to 20 kbp does not limit effective in vivo lung
gene transfer using compacted DNA nanoparticles. Gene Ther 13, 1048-1051
(2006).
189. Mofokeng, J.P., Luyt, A.S., Tábi, T. & Kovács, J. Comparison of injection
moulded, natural fibre-reinforced composites with PP and PLA as matrices.
Journal of Thermoplastic Composite Materials 25, 927-948 (2011).
190. Chieng, B.W., Ibrahim, N.A., Then, Y.Y. & Loo, Y.Y. Epoxidized Vegetable
Oils Plasticized Poly(lactic acid) Biocomposites: Mechanical, Thermal and
Morphology Properties. Molecules 19, 16024-16038 (2014).
191. Katiyar, V. & Nanavati, H. Ring-opening polymerization of L-lactide using
N-heterocyclic molecules: mechanistic, kinetics and DFT studies. Polym
Chem-Uk 1, 1491-1500 (2010).
192. Zhu, L.-J., Liu, F., Yu, X.-M., Gao, A.-L. & Xue, L.-X. Surface
zwitterionization of hemocompatible poly(lactic acid) membranes for
hemodiafiltration. J Membrane Sci 475, 469-479 (2015).

171
193. Christie, R.J., Nishiyama, N. & Kataoka, K. Minireview: Delivering the Code:
Polyplex Carriers for Deoxyribonucleic Acid and Ribonucleic Acid
Interference Therapies. Endocrinology 151, 466-473 (2010).
194. Ghasemi, S., Behrooz, R. & Ghasemi, I. Investigating the properties of
maleated poly(lactic acid) and its effect on poly(lactic acid)/cellulose
nanofiber composites. J Polym Eng 38, 391-398 (2018).
195. Eyal, A.M. & Canari, R. pH Dependence of Carboxylic and Mineral Acid
Extraction by Amine-Based Extractants: Effects of pKa, Amine Basicity, and
Diluent Properties. Ind Eng Chem Res 34, 1789-1798 (1995).
196. Chaiwong, C., Rachtanapun, P., Wongchaiya, P., Auras, R. & Boonyawan, D.
Effect of plasma treatment on hydrophobicity and barrier property of
polylactic acid. Surf Coat Tech 204, 2933-2939 (2010).
197. Lee, S.H. & Yeo, S.Y. Improvement of Hydrophilicity of Polylactic Acid
(PLA) Fabrics by Means of a Proteolytic Enzyme from Bacillus licheniformis.
Fiber Polym 17, 1154-1161 (2016).
198. Proikakis, C.S., Mamouzelos, N.J., Tarantili, P.A. & Andreopoulos, A.G.
Swelling and hydrolytic degradation of poly(D,L-lactic acid) in aqueous
solutions. Polym Degrad Stabil 91, 614-619 (2006).
199. Barbucci, R., Magnani, A. & Consumi, M. Swelling behavior of
carboxymethylcellulose hydrogels in relation to cross-linking, pH, and charge
density. Macromolecules 33, 7475-7480 (2000).
200. Festag, R. et al. Effects of molecular entanglements during electrospray of
high molecular weight polymers. J Am Soc Mass Spectr 9, 299-304 (1998).
201. Hanton, S.D. et al. Investigations of electrospray sample deposition for
polymer MALDI mass spectrometry. J Am Soc Mass Spectr 15, 168-179
(2004).
202. Guo, H.L. et al. A GO@PLA@ HA Composite Microcapsule: Its Preparation
and Multistage and Controlled Drug Release. Eur J Inorg Chem, 3312-3321
(2017).
203. Zheng, S.S. et al. Evaluation of optimum conditions for pachyman
encapsulated in poly(D,L-lactic acid) nanospheres by response surface

172
methodology and results of a related in vitro study. International Journal of
Nanomedicine 11, 4891-4904 (2016).
204. Fischer, R.L., McCoy, M.G. & Grant, S.A. Electrospinning collagen and
hyaluronic acid nanofiber meshes. J Mater Sci-Mater M 23, 1645-1654 (2012).
205. Jiang, B.P. et al. Water-soluble hyaluronic acid-hybridized polyaniline
nanoparticles for effectively targeted photothermal therapy. J Mater Chem B
3, 3767-3776 (2015).
206. Gilli, R., Kacurakova, M., Mathlouthi, M., Navarini, L. & Paoletti, S. Ftir
Studies of Sodium Hyaluronate and Its Oligomers in the Amorphous Solid-
Phase and in Aqueous-Solution. Carbohyd Res 263, 315-326 (1994).
207. Burgess, I., Seivewright, B. & Lennox, R.B. Electric Field Driven
Protonation/Deprotonation of Self-Assembled Monolayers of Acid-
Terminated Thiols. Langmuir 22, 4420-4428 (2006).
208. Stoodley, P., deBeer, D. & LappinScott, H.M. Influence of electric fields and
pH on biofilm structure as related to the bioelectric effect. Antimicrob Agents
Ch 41, 1876-1879 (1997).
209. Sugihara, K., Shimazu, K. & Uosaki, K. Electrode Potential Effect on the
Surface pKa of a Self-Assembled 15-Mercaptohexadecanoic Acid Monolayer
on a Gold/Quartz Crystal Microbalance Electrode. Langmuir 16, 7101-7105
(2000).
210. Gasperini, A.A.M. et al. Association between Cationic Liposomes and Low
Molecular Weight Hyaluronic Acid. Langmuir 31, 3308-3317 (2015).
211. Kim, J.-T., Lee, D.-Y., Kim, Y.-H., Lee, I.-K. & Song, Y.-S. Effect of pH on
Swelling Property of Hyaluronic Acid Hydrogels for Smart Drug Delivery
Systems. Journal of Sensor Science and Technology 21, 256-262 (2012).
212. Liu, P.F., Zhai, M.L., Li, J.Q., Peng, J. & Wu, J.L. Radiation preparation and
swelling behavior of sodium carboxymethyl cellulose hydrogels. Radiat Phys
Chem 63, 525-528 (2002).
213. Ding, L., Lee, T. & Wang, C.-H. Fabrication of monodispersed Taxol-loaded
particles using electrohydrodynamic atomization. Journal of Controlled
Release 102, 395-413 (2005).

173
214. Gao, Y., Zhao, D., Chang, M.W., Ahmad, Z. & Li, J.S. Optimising the shell
thickness-to-radius ratio for the fabrication of oil-encapsulated polymeric
microspheres. Chem Eng J 284, 963-971 (2016).
215. Basta, A.H., El-Saied, H., Hasanin, M.S. & El-Deftar, M.M. Green
carboxymethyl cellulose-silver complex versus cellulose origins in biological
activity applications. Int J Biol Macromol 107, 1364-1372 (2018).