nanobpm signals second mini-workshop on nano project at atf december 11-12, 2004 toyoko orimoto yury...
TRANSCRIPT

NanoBPM SignalsNanoBPM Signals
Second Mini-Workshop on Nano Project at ATFSecond Mini-Workshop on Nano Project at ATFDecember 11-12, 2004December 11-12, 2004
Toyoko OrimotoToyoko OrimotoYury KolomenskyYury Kolomensky
Lawrence Berkeley Laboratory &Lawrence Berkeley Laboratory &University of California, BerkeleyUniversity of California, Berkeley
in collaboration within collaboration withSLAC, LLNL, UCL SLAC, LLNL, UCL

NanoBPM Signals – Toyoko Orimoto
IntroductionIntroduction
• Waveform fit
• Strip charts for online monitoring
• Offline analysis to determine calibration
• Study of correlations from fits
Nano BPM Nano BPM ProjectProject@ ATF@ ATF

NanoBPM Signals – Toyoko Orimoto
BPM Strip ChartsBPM Strip Charts

NanoBPM Signals – Toyoko Orimoto
BPM Strip ChartsBPM Strip Charts
• Strip charts display position, tilt, and phase from fits
BPM 1
BPM 2
BPM 3
• Raw waveforms & residuals from fits
• Display other statistics: amplitude, frequency, decay time, etc.
• Can also replay offline and change calibrations, etc.
• Online monitoring to steer BPMs
NanoBPM Signals – Toyoko Orimoto
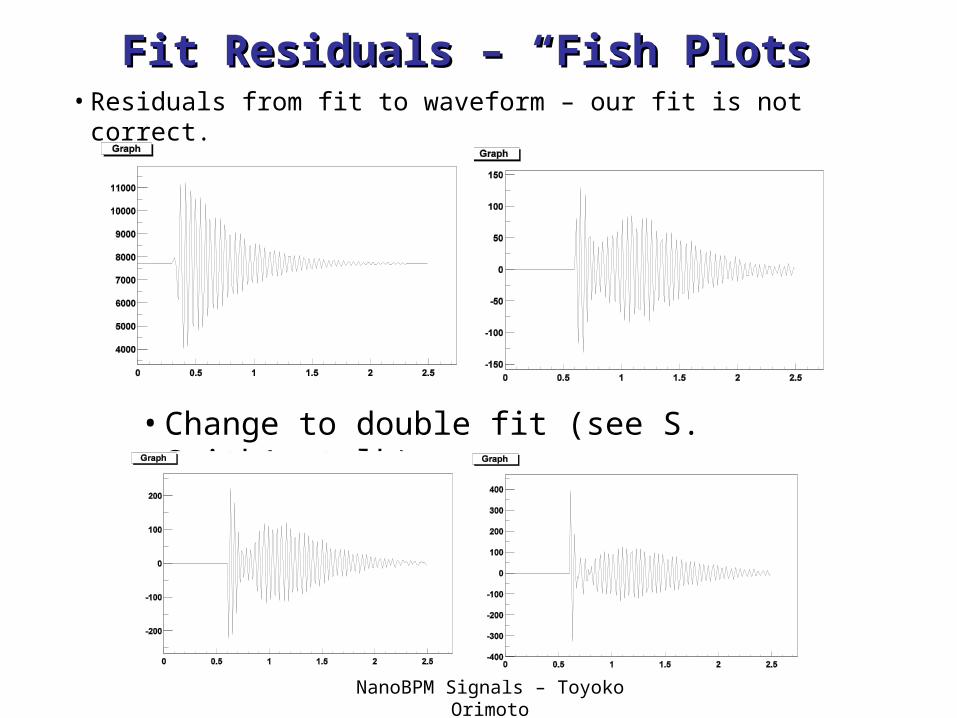
Fit Residuals – “Fish Plots”Fit Residuals – “Fish Plots”• Residuals from fit to waveform – our fit is not correct.
• Change to double fit (see S. Smith’s talk)

NanoBPM Signals – Toyoko Orimoto
Beam Position & Tilt CalibrationBeam Position & Tilt Calibration
movers move cavity in 50 m position steps
(500 rad for tilt calibration)
event
Q
Similar procedure to calibrate tilt
event
I
Q
I
IQ Phase tan-
1(slope)
Slope = position scale
Slope = tilt scale

NanoBPM Signals – Toyoko Orimoto
Calibration CheckCalibration Check
As a cross-check, waveforms were re-fitted with the calibration constants produced using the steps previously outlined.
If calibration constants were good, then Q → position and I → tilt.
So we expect I vs Q plots to be flat and tilt vs event to be flat (in the case of position calibration)…
Q vs. I

NanoBPM Signals – Toyoko Orimoto
““Bow-tie” CorrelationBow-tie” Correlation
• See a “bow-tie” effect in position vs tilt after calibration
• Further away from position, larger spread in tilt
• Avoid such effects by working at smaller amplitudes for calibration for now…
• Also will try to get reference cavity frequency closer to the other BPM frequencies
Position vs Tilt

NanoBPM Signals – Toyoko Orimoto
Frequency & Position CorrelationFrequency & Position Correlation
• Frequency dependence on sign of position
• Difference ~ 0.05 MHz• Such sensitivity occurs
with small amplitude
BPM1 Y Freq vs event
BPM1 Y Amplitude vs event
BPM1 Y Q vs event

NanoBPM Signals – Toyoko Orimoto
Frequency & Position CorrelationFrequency & Position Correlation
… Study this by looking at data with beam centered in different quadrants of the BPMs
Y1 Q
Y1
Fre
quen
cy
See S. Smith’s talk

NanoBPM Signals – Toyoko Orimoto
Position & Tilt CorrelationsPosition & Tilt CorrelationsCorrelation matrix: Dec 02 data
• Correlations from fits computed
X Pos Y Pos X Tilt Y Tilt Ref
BPM 1, 2, 3
X P
os
Y P
os
X T
ilt
Y T
ilt
Ref
Red: high correlation
Green: no correlation
Blue: anti-correlation
• Use this as a debugging tool:
• Sign error in X2 calibration
• Intensity correlated to X2 tilt – problem with the fitting

NanoBPM Signals – Toyoko Orimoto
Position & Tilt CorrelationsPosition & Tilt Correlations
X Pos Y Pos X Tilt Y Tilt Ref
BPM 1, 2, 3
X P
os
Y P
os
X T
ilt
Y T
ilt
Ref • Red: high correlation
• Green: no correlation• Blue: anti-correlation
• Similar to July 2003 data
• Y tilt anti-correlated with X position
• Tilts should be more correlated
Correlation matrix: Dec 07 data

NanoBPM Signals – Toyoko Orimoto
ConclusionsConclusions
• Continue to analyze data offline
• Improve fitting algorithm
• Improve calibration technique
• Study correlations in further detail