nalcor energy newfoundland and labrador hydro · pdf filenalcor energy newfoundland and...
TRANSCRIPT

Nalcor Energy
Newfoundland and Labrador Hydro
2016 Transparency & Accountabil i ty Performance Report
June 2017

2016 TRANSPARENCY & ACCOUNTABILITY
PERFORMANCE REPORT
NALCOR ENERGY
NEWFOUNDLAND AND LABRADOR HYDRO
Message from the Boards of Directors Honourable Siobhan Coady Minister of Natural Resources Government of Newfoundland and Labrador P. O. Box 8700 St. John’s, NL A1B 4J6 Dear Minister Coady: In accordance with the Transparency and Accountability Act, I am pleased to submit the 2016 Annual Performance Report on behalf of the Boards of Directors of Nalcor Energy and Newfoundland and Labrador Hydro.
The 2014-2016 Strategic Plan for Nalcor Energy and Newfoundland and Labrador Hydro outlined the applicable strategic directions of the Provincial Government in relation to the energy sector, as communicated by the Minister of Natural Resources.
This Performance Report will present results for all of Nalcor Energy, including Newfoundland and Labrador Hydro. As 2016 is the final year of the strategic plan, performance results for the 2014-2016 planning period are summarized in addition to the accomplishments for the calendar year 2016. Results are also provided in relation to the organizations’ overall missions that covered the period 2011-2016.
As the Boards of Directors of Nalcor Energy and Newfoundland and Labrador Hydro, we are accountable for the preparation of this report and are accountable for the results.
Brendan Paddick John Green
Chair, Board of Directors Chair, Board of Directors
Nalcor Energy Newfoundland Labrador Hydro

2016 TRANSPARENCY & ACCOUNTABILITY
PERFORMANCE REPORT
NALCOR ENERGY
NEWFOUNDLAND AND LABRADOR HYDRO
2016 TRANSPARENCY & ACCOUNTABILITY
PERFORMANCE REPORT
NALCOR ENERGY
NEWFOUNDLAND AND LABRADOR HYDRO
TABLE OF CONTENTS
1 OVERVIEW .................................................................................................................................... 1
2 SHARED COMMITMENTS ........................................................................................................... 12
3 OUTCOME OF MISSION .............................................................................................................. 14
4 OUTCOMES OF GOALS AND OBJECTIVES ................................................................................... 20
ISSUE 1: SAFETY LEADERSHIP ................................................................................................ 20
ISSUE 2: ELECTRICITY SUPPLY................................................................................................ 31
ISSUE 3: UPPER CHURCHILL ASSET MANAGEMENT AND POWER CONTRACT LEGAL ACTIONS
............................................................................................................................................... 44
ISSUE 4: OIL AND GAS INTERESTS, EXPLORATION AND DEVELOPMENT .............................. 49
ISSUE 5: LOWER CHURCHILL DEVELOPMENT ....................................................................... 57
ISSUE 6: BULL ARM FABRICATION SITE LONG TERM STRATEGY AND LEASE MANAGEMENT
............................................................................................................................................... 64
ISSUE 7: ENERGY MARKETING PORTFOLIO MANAGEMENT AND LONG TERM STRATEGY .. 69
5 OPPORTUNITIES AND CHALLENGES ........................................................................................... 73
Appendix 1 Energy Portfolio Appendix 2 Nalcor Energy Consolidated Financial Statements Appendix 3 Newfoundland and Labrador Hydro Financial Statements

2016 TRANSPARENCY & ACCOUNTABILITY
PERFORMANCE REPORT
NALCOR ENERGY
NEWFOUNDLAND AND LABRADOR HYDRO
TRANSPARENCY AND ACCOUNTABILITY ACT
2016 ANNUAL PERFORMANCE REPORT
NALCOR ENERGY 1 NEWFOUNDLAND AND LABRADOR HYDRO
1 OVERVIEW
Nalcor
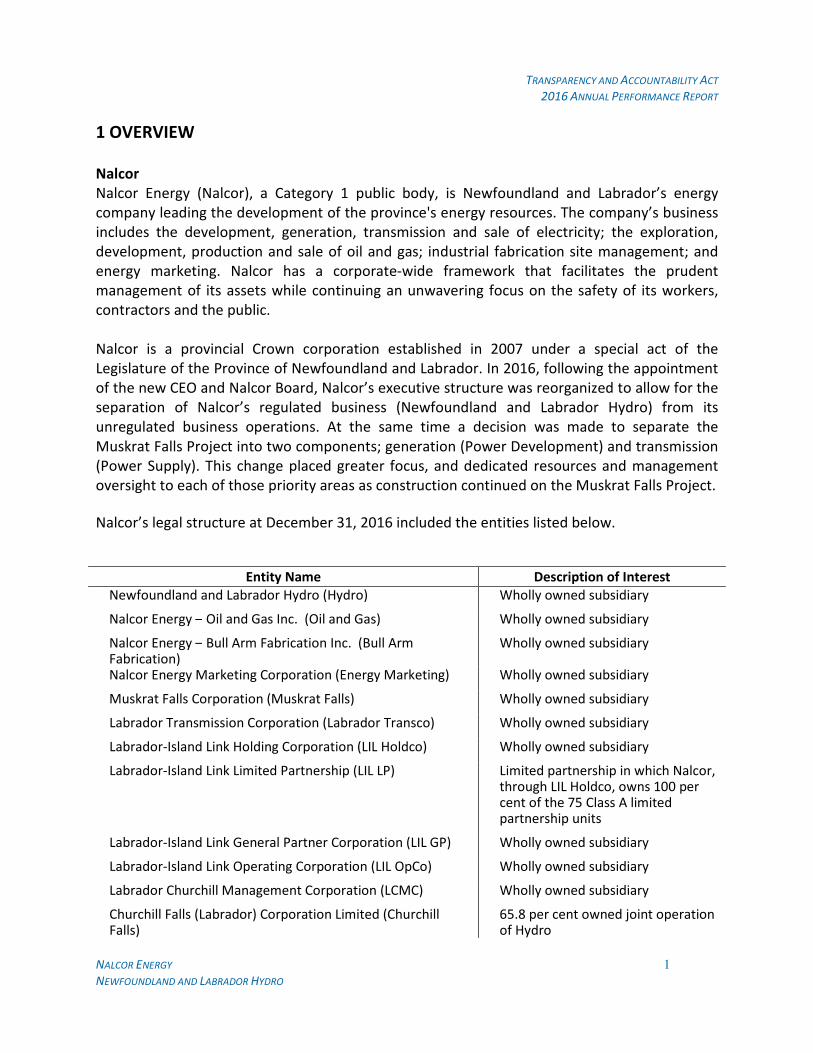
Nalcor Energy (Nalcor), a Category 1 public body, is Newfoundland and Labrador’s energy company leading the development of the province's energy resources. The company’s business includes the development, generation, transmission and sale of electricity; the exploration, development, production and sale of oil and gas; industrial fabrication site management; and energy marketing. Nalcor has a corporate-wide framework that facilitates the prudent management of its assets while continuing an unwavering focus on the safety of its workers, contractors and the public. Nalcor is a provincial Crown corporation established in 2007 under a special act of the Legislature of the Province of Newfoundland and Labrador. In 2016, following the appointment of the new CEO and Nalcor Board, Nalcor’s executive structure was reorganized to allow for the separation of Nalcor’s regulated business (Newfoundland and Labrador Hydro) from its unregulated business operations. At the same time a decision was made to separate the Muskrat Falls Project into two components; generation (Power Development) and transmission (Power Supply). This change placed greater focus, and dedicated resources and management oversight to each of those priority areas as construction continued on the Muskrat Falls Project.
Nalcor’s legal structure at December 31, 2016 included the entities listed below.
Entity Name Description of Interest
Newfoundland and Labrador Hydro (Hydro) Wholly owned subsidiary
Nalcor Energy – Oil and Gas Inc. (Oil and Gas) Wholly owned subsidiary
Nalcor Energy – Bull Arm Fabrication Inc. (Bull Arm Fabrication)
Wholly owned subsidiary
Nalcor Energy Marketing Corporation (Energy Marketing) Wholly owned subsidiary
Muskrat Falls Corporation (Muskrat Falls) Wholly owned subsidiary
Labrador Transmission Corporation (Labrador Transco) Wholly owned subsidiary
Labrador-Island Link Holding Corporation (LIL Holdco) Wholly owned subsidiary
Labrador-Island Link Limited Partnership (LIL LP) Limited partnership in which Nalcor, through LIL Holdco, owns 100 per cent of the 75 Class A limited partnership units
Labrador-Island Link General Partner Corporation (LIL GP) Wholly owned subsidiary
Labrador-Island Link Operating Corporation (LIL OpCo) Wholly owned subsidiary
Labrador Churchill Management Corporation (LCMC) Wholly owned subsidiary
Churchill Falls (Labrador) Corporation Limited (Churchill Falls)
65.8 per cent owned joint operation of Hydro

TRANSPARENCY AND ACCOUNTABILITY ACT
2016 ANNUAL PERFORMANCE REPORT
NALCOR ENERGY 2 NEWFOUNDLAND AND LABRADOR HYDRO
Twin Falls Power Corporation Limited (Twin Falls) 33.3 per cent owned joint venture of Churchill Falls
Gull Island Power Corporation (GIPCo) Wholly owned subsidiary (inactive)
Lower Churchill Development Corporation (LCDC) 51 per cent owned subsidiary of Hydro (inactive)
Headquartered in St. John’s, Nalcor’s energy portfolio is located throughout the province (see Appendix 1).
Hydro
As the primary generator of electricity for use in Newfoundland and Labrador, Hydro is focused
on providing a safe, reliable and least-cost electricity supply to meet current energy demand
and future growth.
The majority of Hydro’s business is regulated by the Newfoundland and Labrador Board of
Commissioners of Public Utilities (PUB) and its electricity rates are set through periodic general
rate applications. The regulated portion of the company includes the generation, transmission
and distribution of electrical power and energy to utility, residential and commercial customers,
as well as island industrial customers. The non-regulated activities of Hydro include electricity
sales to industrial customers in Labrador west.
Hydro’s generating assets include nine hydroelectric plants, one oil-fired plant, four gas
turbines, and 25 diesel plants. These generating assets along with a network of transmission
and distribution lines bring electricity to communities throughout Newfoundland and Labrador.
In 2016, Newfoundland and Labrador Hydro was separated from Nalcor’s unregulated
businesses and is to operate as a more independent regulated utility.
Vision
As per the 2014-16 Strategic Plan for Nalcor Energy and Newfoundland and Labrador Hydro, the vision statements for Nalcor and Hydro are as follows;
Nalcor
To build a strong economic future for successive generations of Newfoundlanders and Labradorians
Hydro
To be recognized as an innovative provider of quality energy services.
TRANSPARENCY AND ACCOUNTABILITY ACT
2016 ANNUAL PERFORMANCE REPORT
NALCOR ENERGY 3 NEWFOUNDLAND AND LABRADOR HYDRO
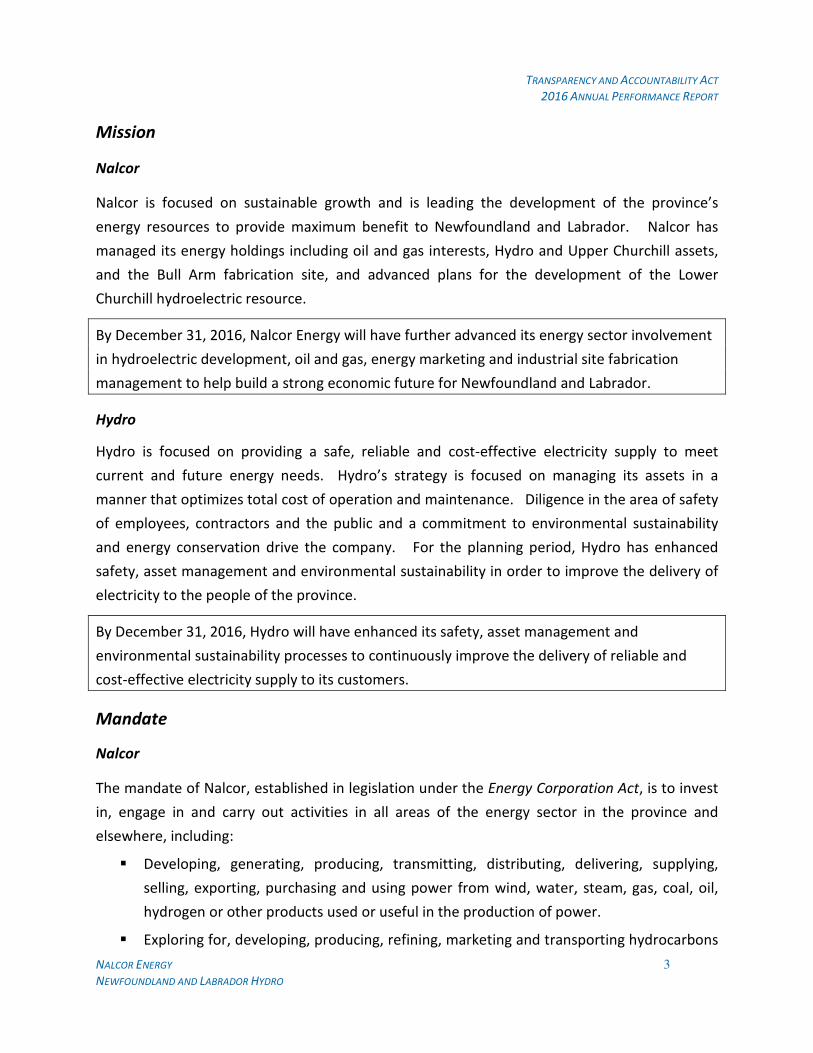
Mission
Nalcor
Nalcor is focused on sustainable growth and is leading the development of the province’s
energy resources to provide maximum benefit to Newfoundland and Labrador. Nalcor has
managed its energy holdings including oil and gas interests, Hydro and Upper Churchill assets,
and the Bull Arm fabrication site, and advanced plans for the development of the Lower
Churchill hydroelectric resource.
By December 31, 2016, Nalcor Energy will have further advanced its energy sector involvement
in hydroelectric development, oil and gas, energy marketing and industrial site fabrication
management to help build a strong economic future for Newfoundland and Labrador.
Hydro
Hydro is focused on providing a safe, reliable and cost-effective electricity supply to meet
current and future energy needs. Hydro’s strategy is focused on managing its assets in a
manner that optimizes total cost of operation and maintenance. Diligence in the area of safety
of employees, contractors and the public and a commitment to environmental sustainability
and energy conservation drive the company. For the planning period, Hydro has enhanced
safety, asset management and environmental sustainability in order to improve the delivery of
electricity to the people of the province.
By December 31, 2016, Hydro will have enhanced its safety, asset management and
environmental sustainability processes to continuously improve the delivery of reliable and
cost-effective electricity supply to its customers.
Mandate
Nalcor
The mandate of Nalcor, established in legislation under the Energy Corporation Act, is to invest
in, engage in and carry out activities in all areas of the energy sector in the province and
elsewhere, including:
� Developing, generating, producing, transmitting, distributing, delivering, supplying,
selling, exporting, purchasing and using power from wind, water, steam, gas, coal, oil,
hydrogen or other products used or useful in the production of power.
� Exploring for, developing, producing, refining, marketing and transporting hydrocarbons

TRANSPARENCY AND ACCOUNTABILITY ACT
2016 ANNUAL PERFORMANCE REPORT
NALCOR ENERGY 4 NEWFOUNDLAND AND LABRADOR HYDRO
and products from hydrocarbons.
� Manufacturing, producing, distributing and selling energy related products and services.
� Research and development.
Hydro
The Hydro Corporation Act mandates Hydro to be responsible for:
� Developing and purchasing power and energy on an economic and efficient basis.
� Engaging within the province and elsewhere in the development, generation,
production, transmission, distribution, delivery, supply, sale, purchase and use of power
from water, steam, gas, coal, oil, wind, hydrogen and other products.
� Supplying power, at rates consistent with sound financial administration, for domestic,
commercial, industrial or other uses in the province and subject to the prior approval of
the Lieutenant-Governor in Council, outside of the province.

TRANSPARENCY AND ACCOUNTABILITY ACT
2016 ANNUAL PERFORMANCE REPORT
NALCOR ENERGY 5 NEWFOUNDLAND AND LABRADOR HYDRO
Lines of Business
Nalcor has six lines of business: Newfoundland and Labrador Hydro, Churchill Falls, Oil and Gas,
Lower Churchill Project, Bull Arm Fabrication and Energy Marketing. The activities of these
lines of business support the fulfillment of the strategic directions of the Provincial Government
for the energy sector. A description of each of the lines of business is presented below.
Newfoundland and Labrador Hydro
Hydro is the primary generator of electricity for sale in Newfoundland and Labrador. The utility
delivers safe, reliable, and least-cost power to utility, industrial, residential and commercial
customers in over 200 communities in the province.
Hydro activities can be grouped as follows:
� Electricity generation involves the operations of nine hydroelectric generating stations, one
oil-fired plant, four gas turbines, and 25 diesel plants, including 21 isolated diesel generating
and distribution systems. Hydro is also responsible for forecasting electricity requirements
in the province and advancing options to ensure adequate supply to meet forecasted
electricity demand.
� Transmission activities include the operation and maintenance of over 3,700 kilometres of
transmission lines.
� System operations provides oversight of the electricity system to reliably meet the changing
requirements of electricity customers by utilizing the combination of available generation
and power delivery resources to provide service safely and cost effectively.
� Distribution and customer service activities include the operation and maintenance of more
than 3,300 kilometres of distribution lines. Customer service activities address the
requirements of Newfoundland Power, industrial customers and over 38,000 direct
residential and commercial customers in rural Newfoundland and Labrador.
Churchill Falls
Nalcor’s operation in Churchill Falls is one of the largest underground hydroelectric power-
houses in the world, with a rated capacity of 5,428 megawatts (MW). Safely operating and
maintaining its electricity assets, as well as municipal and community services, drives the
Churchill Falls strategy.
TRANSPARENCY AND ACCOUNTABILITY ACT
2016 ANNUAL PERFORMANCE REPORT
NALCOR ENERGY 6 NEWFOUNDLAND AND LABRADOR HYDRO
The Churchill Falls generating station provides clean, renewable electricity to millions of
consumers throughout North America. A significant portion of that electricity is being sold to
Hydro-Québec under a long-term contract. Churchill Falls sells 525 MW to Hydro for use in the
province, to serve mining industry in Labrador West, and for exports via sales to Nalcor Energy
Marketing.
Nalcor Energy – Oil and Gas
Nalcor Energy – Oil and Gas manages oil and gas interests and is currently a partner in three
developments in the Newfoundland and Labrador offshore oil and gas industry: the Hebron oil
field, the White Rose Growth Project, and the Hibernia Southern extension. Through its multi-
year exploration strategy, Nalcor Energy – Oil and Gas also supports efforts toward further
exploration and development of the province’s potential offshore and onshore resources. The
company also continues to pursue additional investment opportunities.
Lower Churchill Project
The hydroelectric potential of Muskrat Falls and Gull Island make the lower Churchill River in
Labrador the best hydroelectric sources in North America and is a key component of the
province’s energy warehouse. The clean, stable, renewable electricity provides an opportunity
for the province to meet its own domestic and industrial needs in an environmentally
sustainable way, and also export excess electricity to other jurisdictions where the demand for
clean, renewable energy continues to grow.
Bull Arm Fabrication
Bull Arm Fabrication manages Atlantic Canada’s largest fabrication site. Close to international
shipping lanes and Europe, this site has unobstructed, deep water access to the Atlantic Ocean.
This facility spans over 2,560 hectares and has integrated and comprehensive infrastructure to
support fabrication and assembly of three key project functions, simultaneously, in three
separate theatres: Topsides Fabrication and Assembly, Dry-dock Fabrication and Construction,
and Deepwater Construction and Integration Site. Currently, the Bull Arm site is fully leased by
ExxonMobil for the construction and commissioning phases of the Hebron Project.
TRANSPARENCY AND ACCOUNTABILITY ACT
2016 ANNUAL PERFORMANCE REPORT
NALCOR ENERGY 7 NEWFOUNDLAND AND LABRADOR HYDRO
Energy Marketing
Nalcor is involved in energy marketing and other energy activities including non-regulated
electricity generation, wind energy, and research and development. Nalcor’s current energy
marketing portfolio will grow over the coming years and currently includes recall power that is
not required by Hydro.
Values
Employees of Nalcor and its subsidiaries, including Hydro, are committed to building a bright
future for Newfoundland and Labrador, unified by the following core values:
Open Communication Fostering an environment where information moves
freely in a timely manner.
Accountability Holding ourselves responsible for our actions and
performance.
Safety Relentless commitment to protecting ourselves, our
colleagues, and our community.
Honesty and Trust Being sincere in everything we say and do.
Teamwork Sharing our ideas in an open and supportive manner to
achieve excellence.
Respect and Dignity Appreciating the individuality of others by our words and
actions.
Leadership Empowering individuals to help guide and inspire others.
Primary Clients
In addition to the clients of its subsidiary, Hydro, Nalcor’s clients include:
� Partners in oil and gas projects
� Emera Energy
� Bull Arm Fabrication site tenants
� Supply and service companies in the energy sector
TRANSPARENCY AND ACCOUNTABILITY ACT
2016 ANNUAL PERFORMANCE REPORT
NALCOR ENERGY 8 NEWFOUNDLAND AND LABRADOR HYDRO
Hydro sells electricity to three primary customer groups:
� Newfoundland Power - an investor-owned utility which distributes electrical power to
262,000 customers on the island portion of the province, with Hydro supplying over 90 per
cent of its energy requirements.
� Industrial customers – regulated sales to Corner Brook Pulp & Paper Limited, North Atlantic
Refining Limited, Vale, Praxair and Teck Resources Limited and unregulated sales to the Iron
Ore Company of Canada (IOC) and Wabush Mines in Labrador.
� Over 38,000 residential and commercial customers in rural Newfoundland and Labrador.

TRANSPARENCY AND ACCOUNTABILITY ACT
2016 ANNUAL PERFORMANCE REPORT
NALCOR ENERGY 9 NEWFOUNDLAND AND LABRADOR HYDRO
Number of Employees, Physical Location and Other Key Statistics
Nalcor
Nalcor, the province’s energy corporation, is leading the development of the province’s energy
resources. As of December 31, 2016, Nalcor had 1,545 employees, with 62 per cent of these
employees located in rural parts of the island and Labrador. The gender composition of
Nalcor’s employee group was 73 per cent male and 27 per cent female. Nalcor is currently
implementing a multi-year action plan to support gender equity, diversity and inclusion.
Gender Rural Urban Total Per cent
Female 155 255 410 27%
Male 808 327 1135 73%
Total 963 582 1545
Per cent 62% 38%
Hydro
Headquartered in St. John’s with assets and offices throughout Newfoundland and Labrador,
Hydro is the primary generator of electricity for use in Newfoundland and Labrador. As of
December 31, 2016, Hydro directly employed 934 people. The location of these employees
reflects Hydro’s service area and the location of the company’s electricity assets, with 70 per
cent located in rural areas. The gender composition of Hydro’s employee group is 81 per cent
male and 19 per cent female. As the largest employer within Nalcor, Hydro will play a key role
in implementing Nalcor’s multi-year action plan to support gender equity, diversity, and
inclusion.
Gender Rural Urban Total Per cent
Female 60 120 180 19%
Male 594 160 754 81%
Total 654 280 934
Per cent 70% 30%
TRANSPARENCY AND ACCOUNTABILITY ACT
2016 ANNUAL PERFORMANCE REPORT
NALCOR ENERGY 10 NEWFOUNDLAND AND LABRADOR HYDRO
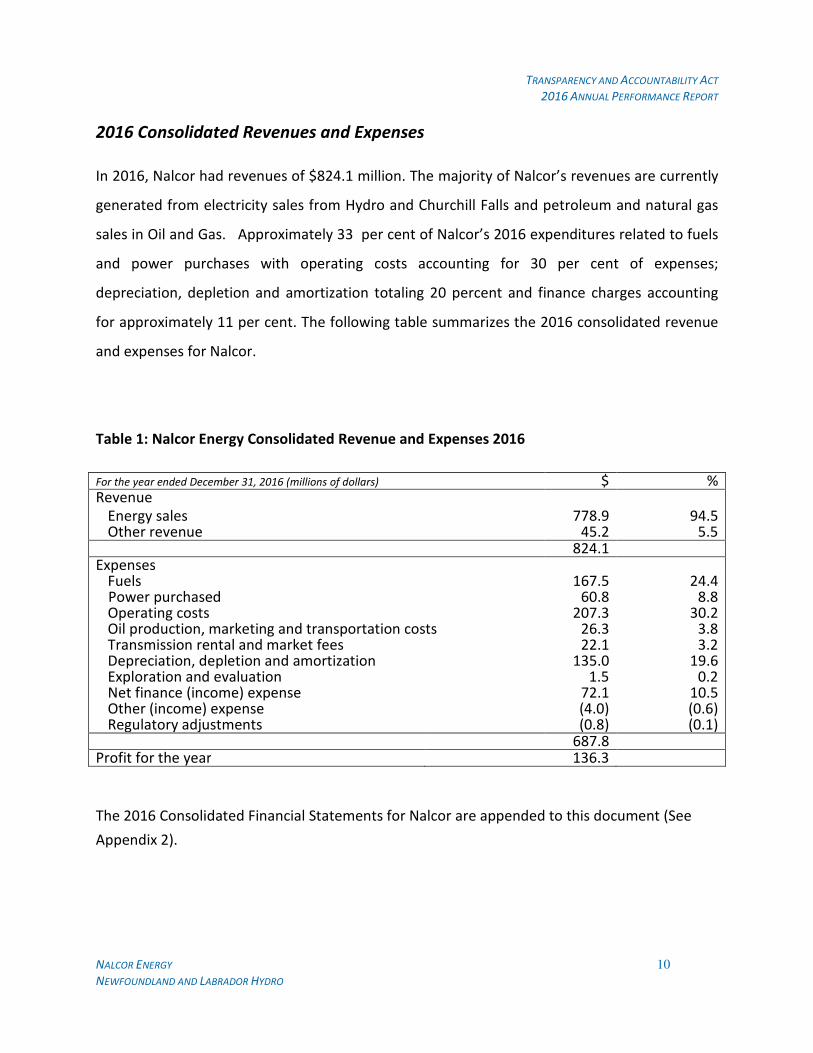
2016 Consolidated Revenues and Expenses
In 2016, Nalcor had revenues of $824.1 million. The majority of Nalcor’s revenues are currently
generated from electricity sales from Hydro and Churchill Falls and petroleum and natural gas
sales in Oil and Gas. Approximately 33 per cent of Nalcor’s 2016 expenditures related to fuels
and power purchases with operating costs accounting for 30 per cent of expenses;
depreciation, depletion and amortization totaling 20 percent and finance charges accounting
for approximately 11 per cent. The following table summarizes the 2016 consolidated revenue
and expenses for Nalcor.
Table 1: Nalcor Energy Consolidated Revenue and Expenses 2016
For the year ended December 31, 2016 (millions of dollars) $ % Revenue
Energy sales Other revenue
778.9 45.2
94.5 5.5
824.1 Expenses
Fuels Power purchased Operating costs Oil production, marketing and transportation costs Transmission rental and market fees Depreciation, depletion and amortization Exploration and evaluation Net finance (income) expense Other (income) expense Regulatory adjustments
167.5 60.8
207.3 26.3 22.1
135.0 1.5
72.1 (4.0)
(0.8)
24.4 8.8
30.2 3.8 3.2
19.6 0.2
10.5 (0.6) (0.1)
687.8 Profit for the year 136.3
The 2016 Consolidated Financial Statements for Nalcor are appended to this document (See
Appendix 2).

TRANSPARENCY AND ACCOUNTABILITY ACT
2016 ANNUAL PERFORMANCE REPORT
NALCOR ENERGY 11 NEWFOUNDLAND AND LABRADOR HYDRO
Hydro
In 2016, Hydro had revenues of $675.5 million. The majority of Hydro’s revenues are from
energy sales to utility, rural and industrial customers with other revenues including preferred
dividends. Consolidated energy sales also include CF(L)Co sales to Hydro-Québec as well as
sales of recall power. In 2016, Hydro net income of $56.3 million consisted of $19.0 million
from Hydro Regulated, $40.7 million from Churchill Falls, partially offset by a $3.4 million loss
related to other non-regulated activities. The following table summarizes the 2016
consolidated revenue and expenses for Hydro.
Table 2: Hydro Consolidated Revenue and Expenses 2016
For the year ended December 31 (millions of dollars) $ % Revenue
Energy sales Other revenue
647.7 27.8
95.9 4.1
675.5 Expenses
Fuels Power purchased Operating costs Transmission rental and market fees Depreciation and amortization Net finance (income) expense Other (income) expense Regulatory adjustments
167.5 99.1
173.3 19.2 84.7 70.1
6.1 (0.8)
27.0 16.0 28.0
3.1 13.7 11.3
1.0 (0.1)
619.2 Profit for the year 56.3 The 2016 Consolidated Financial Statements for Hydro are appended to this document (see Appendix 3).

TRANSPARENCY AND ACCOUNTABILITY ACT
2016 ANNUAL PERFORMANCE REPORT
NALCOR ENERGY 12 NEWFOUNDLAND AND LABRADOR HYDRO
2 SHARED COMMITMENTS
Nalcor works with a variety of agencies, departments and commissions to execute its mandate.
During 2016, Nalcor worked closely with each of these organizations to advance the strategic
directions of the Provincial Government related to the energy sector.
Department of Natural Resources
The Department of Natural Resources works with Nalcor and Hydro in policy-related areas for
the various energy sector activities in which the companies engage and supports the
companies’efforts to progress all the strategic issues outlined. For example, the acquisition of
working interests in offshore oil fields and the company’s exploration strategy were
coordinated efforts between the department and Nalcor Energy – Oil and Gas. In 2016, Nalcor
and the Department worked together to communicate insights from its exploration strategy to
global exploration and production companies. These activities support fulfillment of the
strategic direction of government related to the increased exploration and development of
energy resources and realizing maximum benefits to the province through the strategic
development of our resources. The ongoing administration of issues related to the electrical
system throughout the province and the execution of key policy actions are also areas of
significant collaboration with Nalcor and Hydro that support fulfillment of the strategic
directions of government related to a stable and competitive energy supply for domestic use
and export to market.
Department of Finance
The Department of Finance works with Nalcor and Hydro in relation to addressing requirements
related to financial structure, dividend policies as well as providing guarantees for the
company’s debt financing activities. During 2016, Nalcor’s financing plans and equity
requirements, as well as Hydro’s debt, are examples of interactions between the Department
and Nalcor.
Newfoundland and Labrador Board of Commissioners of Public Utilities
The Newfoundland and Labrador Board of Commissioners of Public Utilities (PUB) is responsible
for regulatory oversight of Hydro’s regulated utility activities. This responsibility covers a wide
range of activities, including approval of its revenue requirements, rates, rate structure and
capital program. The role of the PUB is detailed in the Public Utilities Act.
TRANSPARENCY AND ACCOUNTABILITY ACT
2016 ANNUAL PERFORMANCE REPORT
NALCOR ENERGY 13 NEWFOUNDLAND AND LABRADOR HYDRO
During 2016, there was significant regulatory activity related to Hydro’s 2013 General Rate
Application (GRA) and subsequent amendments. Following the public hearing of Hydro’s GRA,
which concluded in early December 2015, final arguments were filed at the end of January 2016
and the GRA order was received on December 1, 2016. Hydro also filed its Prudence
Compliance Application with the PUB on May 25, 2016 in response to the PUB order on the
prudence review of certain Hydro expenditures and projects. Other significant regulatory
activities related to Hydro’s 2017 Capital Budget, proposed cost variance deferral account, the
rate stabilization fund refund, and a number of supplemental capital project applications.
Other Departments/Public Bodies
Nalcor also shares commitments with the Department of Municipal Affairs and Environment1,
Service NL, and the federal Department of Fisheries and Oceans and Environment Canada in
relation to the environmental aspects of the company’s activities. During 2016, for example,
Hydro interacted with the Department of Environment and Climate Change regarding air
emissions testing at several generating sites. As well, Hydro’s proposals to construct a third
transmission line from Bay d’Espoir to the Avalon Peninsula and to repair the Grand Falls were
released from environmental assessment in 2016.
1 As of February 2017, the Department of Environment and Climate Change.

TRANSPARENCY AND ACCOUNTABILITY ACT
2016 ANNUAL PERFORMANCE REPORT
NALCOR ENERGY 14 NEWFOUNDLAND AND LABRADOR HYDRO
3 OUTCOME OF MISSION
In the 2011-2013 and 2014-2016 Strategic Plans, the following missions were presented for
Nalcor and Hydro.
Nalcor
Nalcor is focused on sustainable growth and is leading the development of the province’s
energy resources to provide maximum benefit to Newfoundland and Labrador. Nalcor
managed its energy holdings including oil and gas interests, Hydro and Upper Churchill assets,
and the Bull Arm fabrication site, and advanced plans for the development of the Lower
Churchill hydroelectric resource.
By December 31, 2016, Nalcor Energy will have further advanced its energy sector involvement
in hydroelectric development, oil and gas, energy marketing and industrial site fabrication
management to help build a strong economic future for Newfoundland and Labrador.
Measure: Advanced energy sector involvement
Indicators:
� Effectively managed Upper Churchill resource to:
• Maintain assets to ensure long-term reliable service; and,
• Pursue Power Contract adjustments.
� As an active partner in existing offshore oil developments, fulfilled all required obligations
and worked to attain alignment between provincial interests and project partners.
� Advanced oil and gas exploration activity.
� Significantly advanced the Lower Churchill Development Phase I and continued efforts to
progress Phase II.
� Monitored safety, asset management and environmental protection at the Bull Arm
Fabrication Site and planned for long-term site utilization.
� Enhanced energy marketing capabilities toward establishing a self-contained energy
marketing line of business.
Outcomes:
During the 2011-2016 mission period, over $400 million in capital was invested to keep
Churchill Falls assets in reliable operating condition for the long-term. With the plant and
related infrastructure aging, asset management is critical to keeping assets in reliable operating
TRANSPARENCY AND ACCOUNTABILITY ACT
2016 ANNUAL PERFORMANCE REPORT
NALCOR ENERGY 15 NEWFOUNDLAND AND LABRADOR HYDRO
condition to provide reliable service to customers for the long-term and to ensure assets are
fully functional well beyond the expiry of current commitments in 2041. Also during this same
time, Churchill Falls continued preparations for, and participated in, a legal challenge regarding
the pricing terms for the remainder of the 1969 Power Contract with Hydro-Québec.
Nalcor’s oil and gas activities continued to progress. Nalcor Oil, through representation on
management, commercial, financial and technical committees, has worked with its joint
venture partners to help reach significant milestones in offshore developments, with first oil for
both West White Rose and the Hibernia Southern Extension in 2011 and the 2012 sanction of
the Hebron project. The North Amethyst field, White Rose Extension Project, produced over 45
million barrels through December 2016. Oil from the Hibernia Southern Extension (HSE)
continued to supplement production from the original Hibernia project area, helping the overall
field in achieving the one billionth barrel of oil on December 21, 2016. Accelerated drilling
progress in 2016 helped achieve record production levels from the Hibernia Southern Extension
area. Progress continued in the period on the Hebron Project, meeting scheduled milestones
required for the tow-out of the Hebron Gravity Based Structure (GBS) to the field. The Utilities
and Process Module (UPM) arrived at Bull Arm from Ulsan, Korea in the third quarter of 2016.
Mating of the integrated topsides and the GBS was completed prior to year-end.
The multi-year exploration strategy continued to increase exploration interest in the province
during the 2011-2013 planning period. The collection of 2D seismic data, 47,000 line kilometres
- an area larger than the Gulf Coast of the United States- continued off Labrador and down the
southeast coast over the Orphan Basin, Flemish Pass and Flemish Cap. Geoscience exploration
and scientific analysis identified three new deep water basins (Chidley, Holton, and Henley),
during this period, and the previously established Hawke Basin has substantially increased in
size. During 2016, the multi-year Exploration Strategy was successfully executed, with 41,800
line km of seismic data completed to bring 5 year total to over 150,000 line km, one of largest
regional seismic programs in the world.

TRANSPARENCY AND ACCOUNTABILITY ACT
2016 ANNUAL PERFORMANCE REPORT
NALCOR ENERGY 16 NEWFOUNDLAND AND LABRADOR HYDRO
In late 2012 the official sanction of the Muskrat Falls Project was announced by the
Government of Newfoundland and Labrador. Since the start of construction in early 2013,
many milestones and accomplishments have been reached across the project from Churchill
Falls, Labrador to Soldiers Pond, Newfoundland. Procurement for all major contracts is nearing
completion, economic and employment benefits are being realized for local businesses and
residents, and some major components of the project have been completed. The project
continued to advance significantly during the 2014-2016 planning period. In 2016, for the
transmission projects in Labrador and on the island (Power Supply), 100 per cent of the towers
and wire stringing was completed on two, 250 km transmission lines from Churchill Falls to
Muskrat Falls. Construction on the 1,100 km Labrador-Island Transmission Link (LIL) also
significantly advanced across the province. Significant work was completed at the Strait of Belle
Isle Marine Cable Crossing where longest high voltage direct current cable landfall pull-in in the
world was completed. At the Muskrat Falls hydroelectric site in Labrador, the facility’s spillway
was put into operation. Four of the five spillway gates were safely and successfully raised,
opening the spillway and redirecting the flow of the lower Churchill River at Muskrat Falls for
the first time. In addition, following the completion of the temporary cofferdam in the fall, the
river impoundment process commenced. Over the planning period work also continued to
assess market and market access opportunities for the second phase of the Lower Churchill
Development, Gull Island.
In 2011, Nalcor executed a lease with ExxonMobil Canada Properties for the construction,
fabrication and commissioning phases of the Hebron project. Since the execution of the lease,
significant site upgrades and refurbishments, by the tenant, have been approved by Nalcor.
Nalcor engaged with the tenant in the review of safety statistics and sharing of best practices
and developed a framework for the review of environmental activities at site. As well, during
the 2011-2016 planning period, Nalcor has engaged stakeholders and completed research to
inform the long-term strategy for site utilization at the Bull Arm Fabrication Site.
TRANSPARENCY AND ACCOUNTABILITY ACT
2016 ANNUAL PERFORMANCE REPORT
NALCOR ENERGY 17 NEWFOUNDLAND AND LABRADOR HYDRO
During the 2011-2016 planning period, Nalcor continued to build its energy marketing expertise
and processes consistent with its plan to establish a self-contained energy marketing line of
business. Nalcor also continued to pursue opportunities during the 2014-2016 reporting period
to maximize the value of its energy marketing portfolio and achieved revenues higher than
market benchmark.
Hydro
Hydro is focused on providing a safe, reliable and cost-effective electricity supply to meet
current and future energy needs. Hydro’s strategy is focused on managing its assets in a
manner that optimizes total cost of operation and maintenance. Diligence in the area of safety
of employees, contractors and the public and a commitment to environmental sustainability
and energy conservation drive the company. Over the mission period, Hydro has enhanced
safety, asset management and environmental sustainability in order to improve the delivery of
electricity to the people of the province.
By December 31, 2016, Hydro will have enhanced its safety, asset management and
environmental sustainability processes to continuously improve the delivery of reliable and
cost-effective electricity supply to its customers.
Measure: Enhanced safety, asset management and environmental sustainability processes
Indicators:
� Advanced efforts toward safety excellence with emphasis on employees, contractors, and
the public.
� Enhanced asset management to ensure reliability of electricity assets (generation,
transmission and distribution) as well as future capacity to accommodate power from the
Lower Churchill Development (Muskrat Falls).
� Advanced efforts to secure power from Muskrat Falls for use in the province.
� Advanced research on renewable/alternative power generation options for the province
with environmental sustainability in mind.
� Promoted energy conservation by electricity consumers as well as internal energy
efficiency.
TRANSPARENCY AND ACCOUNTABILITY ACT
2016 ANNUAL PERFORMANCE REPORT
NALCOR ENERGY 18 NEWFOUNDLAND AND LABRADOR HYDRO
Outcomes:
During the 2011-2016 periods, Hydro continued to focus on safety excellence with emphasis on
employees, contractors, and the public. Training programs continued to be developed and
employees participated in training to maintain and enhance their skills to ensure competency
to safely complete work on electrical equipment. Employee safety was also supported through
an injury prevention and awareness communications campaign. Many areas of Hydro achieved
strong safety performance sustaining zero injuries for a number of years however, in 2016
there were a total of six injuries across the company including one lost-time injury.2 While this
performance was an improvement over 2015, the number of incidents was higher than Hydro’s
targeted reduction in the number of employees hurt.
The Public Safety Campaign for Powerline Hazards continued to promote safety around power
lines to heavy equipment operators, contractors and the general public. Other public safety
communications activities addressed safety around dams, dykes and hydroelectric facilities and
safety during power outages.
Hydro continued its focus on asset management to ensure reliability of electricity assets and
Hydro invested significant capital to upgrade or replace assets. As well, Hydro advanced efforts
to secure power from Muskrat Falls for use in the province and in 2013 completed a power
purchase agreement with Muskrat Falls. During the 2011-2016 periods, Hydro invested over
$790 million to upgrade electricity generation, transmission and distribution assets as well as
supporting technology and infrastructure. This included expenditures in 2014 and 2015 totaling
over $128 million related to purchase and installation of a 123.5 megawatt (MW) combustion
turbine at the Holyrood generating station.
The company also completed an internal review of January 2014 electricity supply disruptions
and implemented recommendations related to equipment maintenance and capital investment
as well as communications improvements with Newfoundland Power, customers and the
general public. 2 A more serious injury that prevents someone from returning from work for their next scheduled shift.

TRANSPARENCY AND ACCOUNTABILITY ACT
2016 ANNUAL PERFORMANCE REPORT
NALCOR ENERGY 19 NEWFOUNDLAND AND LABRADOR HYDRO
The investigation of renewable energy sources in communities that rely on diesel generation of
electricity also advanced during this period. The Ramea Wind-Hydrogen Diesel Energy Project
was advanced and offset diesel consumption in that community. As well, Hydro continued to
investigate renewable generation in coastal Labrador communities over this period and
collected data to assess the feasibility of the hydroelectric and wind generation.
Hydro also promoted energy conservation by rural electricity residential and commercial
customers as well as provincial industrial customers during the 2011-16 planning periods.
Hydro created energy savings in its own facilities and pursued initiatives to help Hydro’s rural
electricity residential and commercial customers as well as provincial industrial consumers
conserve energy. Hydro also continued to partner with Newfoundland Power to deliver the
takeCHARGE program which offers rebate programs to encourage residential and commercial
customers to reduce their electricity usage.

TRANSPARENCY AND ACCOUNTABILITY ACT
2016 ANNUAL PERFORMANCE REPORT
NALCOR ENERGY 20 NEWFOUNDLAND AND LABRADOR HYDRO
4 OUTCOMES OF GOALS AND OBJECTIVES
The 2014-2016 Strategic Plan for Nalcor highlighted seven strategic issues around which goals
and objectives were established. These issues encompass the activities of Nalcor and its
subsidiaries. In general, the accomplishments outlined are for Nalcor, accomplishments specific
to Hydro are noted.
For each strategic issue, the information in the 2014-2016 Strategic Plan is reproduced,
followed by an assessment of performance during the planning period. As well, the 2016
objectives, measures and indicators outlined in the 2015 Annual Performance Report are
provided along with a summary of related accomplishments.
ISSUE 1: SAFETY LEADERSHIP
A relentless commitment to safety drives all Nalcor lines of business as we strive to achieve
world class safety and an injury free workplace.
Nalcor has established a safety framework that is built on seven key elements: leadership;
procedures and equipment; competence; supportive culture; union management alignment;
personal responsibility; and, reporting and continuous improvement. This framework guides
processes such as joint union management safety leadership, safe workplace reporting and the
investigation of safety incidents and high-potential near misses. The safety framework is also
the basis for developing multi-year safety plans for communications, work procedures and
training to ensure employee competence and promote a strong safety culture.
Sustained safety performance is a journey. Many areas of Nalcor have sustained excellent
safety performance with zero employee injuries for a number of years and the company is
seeing its safety culture mature with employees identifying and addressing unsafe conditions
and behaviours and accepting personal responsibility for their safety and the safety of their
peers. Safety reporting continued to be strong in 2016 increasing 17.6 per cent over 2015. In
2016, Nalcor achieved the annual improvement targeted and total incidents declined from 13 in
2015 to 11 in 2016 including a reduction in lost-time incidents, more serious incidents that
prevent someone from returning to work for their next scheduled shift, from three to two.

TRANSPARENCY AND ACCOUNTABILITY ACT
2016 ANNUAL PERFORMANCE REPORT
NALCOR ENERGY 21 NEWFOUNDLAND AND LABRADOR HYDRO
Nalcor has strengthened its procedures for working around electrical and other energized
equipment. The work protection code3 (code) creates an isolated and de-energized safe work
area. An updated code is fully implemented across all electricity lines and ongoing monitoring
is in place for compliance. During 2016, Nalcor continued to complete assessments of work
protection code implementation to confirm understanding of, and compliance with, the code
and also completed employee code training. Documenting and verifying work methods for
completing work safely, is also a focus in Nalcor’s electricity operations. Starting in 2010, the
company identified critical tasks, completed risk assessments, and began documenting and
verifying work methods. The verification of documented work methods for completing high-
risk tasks also continued through 2016.
During 2016, safety training also included confined space entry, working at heights and
grounding and bonding4 training. Training for high-voltage switching5 was also delivered
throughout electricity operations to re-inforce the principles and practices associated with
switching. Safety coaching training as well as safety reporting and incident investigation
training was completed by employees throughout Nalcor.
During 2016, Nalcor continued to implement its employee safety communications campaign -
Take a Moment for Safety. The basis of the campaign is that every day, Nalcor employees
encounter hazardous situations and they must be vigilant in reducing exposure to these
hazards. The themes for injury prevention and awareness communications in 2016 reflected
Nalcor’s top-trending injuries - slips, trips and falls; hand-related injuries; new and young
workers and driving related safety. Other themes include mental health and themes related to
the Alcohol and Drug Program.
Safety programs and communications aimed at enhancing contractor and public safety also
progressed with significant emphasis placed on power line safety awareness. The Public Safety
Campaign for Power Line Hazards, which promotes power line safety to the general public, 3 The work protection code (code) establishes conditions that, when combined with appropriate work practices,
procedures and work methods will provide workers with a safe work area when working on or around electrical and other energized equipment.
4 The grounding and bonding program identifies electrical grounding and bonding practices for temporary
grounding of equipment to provide maximum protection for workers performing work on de-energized equipment.
5 High voltage switching is the process in which the electrical configuration of the power system is changed by the
operation of devices in the field. Switching is performed to establish work protection for workers safety or for system integrity and reliability.

TRANSPARENCY AND ACCOUNTABILITY ACT
2016 ANNUAL PERFORMANCE REPORT
NALCOR ENERGY 22 NEWFOUNDLAND AND LABRADOR HYDRO
heavy equipment operators and contractors, continued to be a focus in 2016. This campaign is
delivered in partnership with Newfoundland Power, the Newfoundland and Labrador
Construction Safety Association, and Workplace NL. Power line contacts remain a focus with
more than 50 contacts in Hydro’s service areas in the past five years. In 2016, Hydro saw a
total of 21 public incidents involving powerlines of which nine were contacts with an energized
portion of a line. In addition to power line safety awareness, additional safety communications
addressed public safety around dams, dykes and hydroelectric facilities as well as power outage
safety.
Unless otherwise specified, the goal, objectives, measures, indicators and accomplishments
outlined below apply to both Nalcor and Hydro. Nalcor’s safety programs and initiatives are
targeted to all its lines of business as well as support areas of the company. As a large
electricity operation and the largest employer within Nalcor, Hydro’s accomplishments are a
significant component of the safety performance of Nalcor as a whole.
Goal: By December 31, 2016, Nalcor and Hydro will have continued progress towards sustained safety excellence.
Measure: Continued progress towards sustained safety excellence.
During the 2014-2016 Planning Period, Nalcor and Hydro continued to make progress in
achieving sustained safety excellence. Key safety targets improved and both companies
reduced the number and severity of workplace injuries.
INDICATORS ACCOMPLISHMENTS
Advanced multi-year safety training plan for employees.
During the 2014-2016 planning period, Nalcor and Hydro continued to deliver planned safety training to employees. Safety training is provided to ensure employees are competent and can safely complete work. In addition, training aimed at strengthening safety culture was delivered as planned.
Work protection code, confined space entry and working at
heights training
During the planning period, required safety training for new employees, employees taking on new roles and responsibilities and employees requiring refresher training
TRANSPARENCY AND ACCOUNTABILITY ACT
2016 ANNUAL PERFORMANCE REPORT
NALCOR ENERGY 23 NEWFOUNDLAND AND LABRADOR HYDRO
to maintain competency was completed. In total, 1,383 participants (Hydro – 825) completed work protection code initial training and annual re-fresher training over the three year period. In addition, 407 participants completed confined space training (Hydro – 229) and 726 completed working at heights training (Hydro - 526).
Grounding and bonding training
Training for the grounding and bonding program included 109 Nalcor participants (Hydro – 92) during the 2014-2016 planning period.
High-voltage switching
During the 2014-2016 planning period, 275 Nalcor participants (Hydro – 218) completed high-voltage switching training.
Safe workplace observation program (SWOP) and incident
investigation training
During the planning period, 234 Nalcor (Hydro – 177) participants completed training in SWOP and incident investigation training (Nalcor – 148; Hydro – 109).
Safety Coaching
Safety coaching training helps employees build the skills required to take action on at-risk behaviours by outlining a consistent approach to safety interactions and providing an opportunity to practice the approach. The majority of Nalcor and Hydro employees have already completed safety coaching training but the training is offered periodically to new employees and others who have not participated in the training. In the 2014-2016 period, some 393 participants (Hydro - 185) completed safety coaching training.
Advanced multi-year plan for
safety-related communications
for employees, contractors and
the general public.
Employee
Over the 2014-2016 period, Nalcor completed activities in the multi-year plan for employee safety-related communications. Under the internal safety brand Take a
Moment for Safety, the campaign focused on injury prevention and awareness around top-trending injuries. The campaign included posters, fact sheets, safety moments, lunch and learns, all user emails as well as articles in Nalcor’s internal employee newsletter. In addition, key topics were incorporated in Safety and Health Week activities and the annual Safety Summit attended by
TRANSPARENCY AND ACCOUNTABILITY ACT
2016 ANNUAL PERFORMANCE REPORT
NALCOR ENERGY 24 NEWFOUNDLAND AND LABRADOR HYDRO
employees representing all lines of business.
Contractors and the general public
During the planning period, Nalcor and Hydro completed contractor and public safety communications related to power line safety, safety around electricity facilities and also promoted power outage safety.
The Public Safety Campaign for Power Line Hazards was a focus in each of the last three years. The campaign, which is delivered in partnership with Newfoundland Power, the Newfoundland and Labrador Construction Safety Association, and the WorkplaceNL, promotes power line safety to target audiences such as heavy equipment operators and contractors as well as the general public. The public campaign including print, digital and social media was supplemented with presentations to contractors, apprentice line workers, and students training in operation of heavy equipment. From 2014-2016, Hydro also sponsored the Newfoundland and Labrador Construction Safety Association’s annual conference and had a key note speaking opportunity for several years.
Throughout the planning period, Hydro public communications continued to promote safety around dams, dykes, and hydroelectric facilities. As part of this activity, advisories were issued regarding safety hazards including changing reservoir water levels and recreational safety. As well, presentations were delivered to key stakeholder groups in Bay d’Espoir and Bishops Falls where Hydro operates electricity facilities.
During the planning period, Hydro also developed additional communications materials on power outage safety. This included a video highlighting the specifics of power outage safety as well as new online content on the same subject. As well, Hydro continued to promote safety through its social media channels, such as Twitter and Facebook.
Objective: By December 31, 2016, Nalcor and Hydro will have continued progress towards sustained safety excellence by advancing safety programs.
Measure 1: Delivered safety training and complete planned assessments.

TRANSPARENCY AND ACCOUNTABILITY ACT
2016 ANNUAL PERFORMANCE REPORT
NALCOR ENERGY 25 NEWFOUNDLAND AND LABRADOR HYDRO
Indicators 2016 ACCOMPLISHMENTS
Completed required safety training for new employees and employees taking on new roles.
During 2016, Nalcor and Hydro continued to build on previous efforts to provide safety training to enhance employee competence and the companies’ safety culture. As part of this ongoing commitment, the following technical (e.g. work protection, high voltage switching), legislative, program specific, and safety coaching training was delivered as planned.
Work protection code, confined space entry and working at
heights training
During 2016, required safety training for new employees, employees taking on new roles and responsibilities and employees requiring refresher training was completed. In total, 562 employees completed work protection code training (Hydro – 347), 250 employees completed confined space entry training (Hydro – 145), and 211 employees completed working at heights training (Hydro – 158).
High voltage switching principles and practices training
During 2016, 54 employees (Hydro – 40) completed high voltage switching principles and practices training to re-fresh knowledge related to this high risk work activity in electricity operations.
Safety coaching training
Safety coaching training helps build the skills required to take action relating to at-risk behaviours by outlining a consistent approach to safety interactions and providing an opportunity to practice the approach. The majority of Nalcor employees have already completed safety coaching training but the training is offered periodically to new employees and others who have not participated in the training. During 2016, 88 employees completed the training (Hydro – 47).
Safe workplace observation program (SWOP) and incident
investigation training
In 2016, planned SWOP and incident investigation training was completed with 79 employees participating in SWOP training and
TRANSPARENCY AND ACCOUNTABILITY ACT
2016 ANNUAL PERFORMANCE REPORT
NALCOR ENERGY 26 NEWFOUNDLAND AND LABRADOR HYDRO
Indicators 2016 ACCOMPLISHMENTS
37 completing incident investigation training (Hydro - 61 and 24).
Grounding and bonding training
In 2016, training was delivered to five employees (all Hydro) for grounding and bonding for employees involved in the operation and maintenance of generating plants and terminal stations. The purpose of this training is to provide awareness of temporary grounding and bonding practices for plants and stations in order to provide maximum protection for workers while performing de-energized work. The training focuses on the hazards of step and touch potential as well as static electricity.
Workplace Hazardous Materials Information System (WHMIS)
2015 training
During 2016, employees required to work with workplace hazardous materials within Nalcor and Hydro were required by legislation to complete refresher training to the updated WHMIS 2015. Licenses were distributed to the regions, with 517 employees completing the training (Hydro – 335).
Additional Program Specific Training
During 2016, 83 supervisory employees within Nalcor and Hydro completed online training required by the Alcohol and Drug Program (Hydro – 58).
Completed planned assessments of employee competency to safely perform high-risk activities.
During 2016, Nalcor and Hydro expanded the task observation process, a process used to assess employee competency to safely perform high-risk activities. High-risk activities within the lines and high voltage switching operations were the main focus of assessments for 2016, with 598 task observations completed in Hydro.
Advanced occupational health and wellness employee assessments including hearing conservation and respiratory protection.
In 2016, occupational health and wellness assessments for employees were completed as planned.
Hearing conservation
Through Nalcor’s Hearing Conservation Program, 429 audiograms (Hydro 332) were carried out on employees who are exposed to high noise levels in the workplace. These

TRANSPARENCY AND ACCOUNTABILITY ACT
2016 ANNUAL PERFORMANCE REPORT
NALCOR ENERGY 27 NEWFOUNDLAND AND LABRADOR HYDRO
Indicators 2016 ACCOMPLISHMENTS
assessments are completed annually and are used to assess employees' hearing thresholds and to detect early signs of hearing loss. In addition, a review process was undertaken to ensure all at risk employees were enrolled in the audiometric testing program, and exposure assessments were also conducted for high risk jobs within Hydro, including diesel plant operators and line workers, to better understand their noise level exposure.
Respiratory protection
In 2016, Nalcor's Respiratory Protection Program was revised and a training program was developed as planned. This program outlines the process required to identify, evaluate and control respiratory hazards in the workplace.
Other health & wellness activities
Other occupational health and wellness assessments for employees were also completed in 2016. There were 64 pre-placement medicals (Hydro-20) carried out. These assessments determine if workers are fit for work and identifies any potentially limiting conditions that might impact the individual's ability to perform the job (or part of the job) for which they are being hired.
There were also 316 Personal Health Declarations (Hydro- 72)completed whereby employees declare any pre-existing conditions that may be impacted by their work and are for sedentary positions.
A total of 64 Periodic Medicals (Hydro-20) were conducted on employees in specific jobs to ensure they remain medically fit to conduct their required tasks.
Sixteen employees were referred to an external occupational medical service provider for fitness to work evaluations, assessments or interventions. Typically, these referrals are due to a change in the health status of an employee that may impact the employee’s ability to perform their job tasks.
Ergonomic assessments were completed for thirty-six employees, and over 300 flu vaccines given in various locations throughout the company.

TRANSPARENCY AND ACCOUNTABILITY ACT
2016 ANNUAL PERFORMANCE REPORT
NALCOR ENERGY 28 NEWFOUNDLAND AND LABRADOR HYDRO
Indicators 2016 ACCOMPLISHMENTS
A total of 366 employees availed of Nalcor’s wellness reimbursement program that encourages employees to make positive health and wellness lifestyle changes.
Assessed implementation of select safety programs and identified required enhancements.
During 2016, Nalcor and Hydro continued with the Safety and Health Monitoring Plan. The Monitoring Plan includes program audits which take into account different elements of the Current Safety Management System. Information is compiled by way of interviews with management and staff, documentation reviews and field visits. Results are recorded and shared with area owners, observations immediately dangerous to life or health (IDLH) are addressed immediately while on site and associated actions are assigned through the Safe Workplace Observation Program (SWOP). Eleven program audits were completed in 2016 for key safety programs including Contractor Safety Management (CSMP), Alcohol and Drug (A&D), Work Protection, and Fall Protection. Overall, findings were positive and enhancements included changes to orientations, A&D program revisions and supervisor refresher training, and a CSMP Compliance Improvement Action Plan.
In addition to formal program audits, a total of 424 field level assessments of key operational controls were completed across the company in the following areas: Work Protection, Hearing Conservation, Work Methods, Fall Protection, Confined Space, and Grounding and Bonding – Line Operations. Nalcor has determined those operations and activities that are associated with identified hazards and the implementation of controls is necessary to manage OH&S risks. Assessments are completed to ensure those controls and documented procedures are in place to cover situations where their absence could lead to deviations from OH&S policy and standards and to ensure field staff are knowledgeable in these controls.
Measure 2: Completed planned safety communications activities targeting employees and the public.
Completed employee communication activities for the 2016 injury
During 2016, Nalcor continued implementation of its employee safety communications campaign – Take a Moment for Safety
and completed planned activities. Highlights include:

TRANSPARENCY AND ACCOUNTABILITY ACT
2016 ANNUAL PERFORMANCE REPORT
NALCOR ENERGY 29 NEWFOUNDLAND AND LABRADOR HYDRO
Indicators 2016 ACCOMPLISHMENTS
prevention and awareness campaign related to top injury trends with greater emphasis placed on driving safety, new and young workers and mental health awareness.
� Safety moment information sheets/presentations were rolled out for use across the organization. These safety moments covered key topics including: vehicle safety, slips trips and falls, mental health, alcohol and drug program, new and young workers.
� The employee internal newsletter featured 12 safety-related articles and two issues of the newsletter were solely dedicated to safety.
� The annual Safety and Health Week and the employee Safety Summit focused on key areas/topics including the prevention and awareness related to top injury trends.
Completed public safety communication activities related to power line safety, public safety around electrical facilities and outage safety.
In 2016, Hydro completed public safety communication activities related to power line safety, safety around electricity facilities, power outage safety, and meter reader safety.
Power line safety
The Public Safety Campaign for Power Line Hazards continued to be a focus in 2016. This campaign, which is delivered in partner-ship with Newfoundland Power, the Newfoundland and Labrador Construction Safety Association, and Workplace NL, promotes power line safety to the general public as well as targeted audiences such as heavy equipment operators and contractors.
The public campaign, including print, digital and social media was supplemented with presentations to contractors, apprentice line workers, and students training in the operation of heavy equipment. In 2016, Hydro again sponsored the Newfoundland and Labrador Construction Safety Association’s Annual Conference. In 2016 the powerline partnership working group developed new materials to be used by all partners, creating more consistency in messaging.
In 2016, Hydro developed some materials as part of its Winter Readiness education campaign on the topic of power line safety – specifically focused on power line safety in the winter.
Public safety around electrical facilities
Work continued in 2016 to promote public safety around dams, dykes and hydroelectric facilities. Stakeholder education presentations were delivered to key stakeholder groups in Bay

TRANSPARENCY AND ACCOUNTABILITY ACT
2016 ANNUAL PERFORMANCE REPORT
NALCOR ENERGY 30 NEWFOUNDLAND AND LABRADOR HYDRO
Indicators 2016 ACCOMPLISHMENTS
d’Espoir and Bishop’s Falls. As part of its commitment to public safety around dams, safety advisories were issued throughout the year regarding changing water levels and recreational safety.
Power Outage Safety
As part of its 2016 winter readiness communications program, Hydro developed additional material on power outage safety – including infographics and digital web ads which appeared on the Weather Network during bad weather. As well, Hydro continued to promote safety through its social media channels, such as Twitter and Facebook.
Meter Reader Safety
Meter Readers continue to be exposed to dangerous situations involving things such as dogs, debris, snow, and difficult behaviour when attempting to obtain meter readings. A public education campaign was developed to help customers understand the hazards and what they can, and should, do to help keep Hydro meter readers safe. Tactics included radio ads, posters, social media and digital content, and printed materials.
TRANSPARENCY AND ACCOUNTABILITY ACT
2016 ANNUAL PERFORMANCE REPORT
NALCOR ENERGY 31 NEWFOUNDLAND AND LABRADOR HYDRO
ISSUE 2: ELECTRICITY SUPPLY
Nalcor’s subsidiary, Newfoundland and Labrador Hydro, ensures there is a safe, reliable and
least-cost supply of electricity available to meet current demand and future growth. These
activities supported fulfillment of the strategic directions of the Provincial Government related
to a stable and competitive energy supply for domestic use and export to market. The
initiatives outlined support focus areas related to alternative energy research and
development, and advancement of renewable energy projects and related infrastructure.
Asset Management/Reliability
A key challenge in the Canadian utility industry is renewal of aging electricity infrastructure. As
with other utilities, many of Hydro’s assets are over 40 years old and require significant
investment to ensure a continued safe and reliable supply of electricity.
Asset management is the cornerstone of Hydro’s approach for managing assets over their
lifecycle and making the investments required for reliable, cost-effective electricity to meet the
needs of customers. Keeping Hydro’s electricity systems in reliable operating condition is
accomplished through a combination of routine maintenance of existing assets and
replacement or rehabilitation of assets that have reached the end of their useful life with new
or renewed assets that result in lower life cycle costs or improved operational characteristics.
Hydro has developed long-term asset management plans for key generation, transmission,
distribution assets and supporting technology and infrastructure. These plans reflect the
service required of the asset combined with information about asset condition and operating
and maintenance experience. Long-term asset management plans are the basis for developing
a five-year capital plan that outlines more detailed scopes of work required and the estimated
cost. Hydro’s five-year capital plan contains details on costs and timing of asset replacement
and refurbishment. The five-year plan is a living document and is revised on an ongoing basis
as new information about the condition of assets or performance becomes available and as
asset management strategies evolve.
During 2016, Hydro invested over $200 million to provide safe, reliable and least-cost electricity
to the people of the province. This included $59 million expended for the construction of a new
transmission line between Bay d’Espoir and the western Avalon Peninsula which will improve
reliability on the Avalon where electricity demand is highest. A significant portion of this

TRANSPARENCY AND ACCOUNTABILITY ACT
2016 ANNUAL PERFORMANCE REPORT
NALCOR ENERGY 32 NEWFOUNDLAND AND LABRADOR HYDRO
investment included sustaining capital required to replace or refurbish components of the
generating units at the Holyrood Thermal Generating Station. There were also significant
investments in power transformers and circuit breakers.6
During the planning period, Hydro also completed a review of the January 2014 electricity
system service disruptions and implemented recommendations related to equipment
maintenance and capital investment.
Long-term Least-cost Supply
Hydro has a responsibility to assess electricity requirements in the province and recommend
supply options to meet growing energy needs. Over the planning period, Hydro advanced a
number of projects aimed at sustaining/increasing the reliability of existing assets as well as
meeting projected load growth and customer requests through additions to electricity
infrastructure. Most recently, in May 2016 Hydro conducted a comprehensive risk assessment
of its ability to meet Island Interconnected System energy and demand requirements until the
expected interconnection with the North American electricity grid. The Energy Supply Risk
Assessment report identified a number of alternatives to reduce the risk associated with the
reliability of thermal generation assets.
During 2016, Nalcor and Hydro worked to advance the implementation of processes and
supporting organization structure to prepare for the transition of the Muskrat Falls Project to
operations. The technical integration of new generating and transmission assets into the
provincial transmission system, the implementation of required commercial arrangements and
establishing an operations organization ready to operate and maintain these assets are key
elements of the transition.
Hydro is regulated by the PUB and operates under cost of service regulation whereby it is
entitled to the opportunity to recover, through customer rates, all reasonable and prudent
costs incurred in providing electricity service to its customers. During the planning period
including 2016, there was significant regulatory activity related to the General Rate Application
(GRA) filed by Hydro in July 2013 and subsequent related filings. Final arguments were filed at
the end of January 2016 and the GRA order was received on December 1, 2016. Hydro also
filed its Prudence Compliance Application with the PUB on May 25, 2016 in response to the PUB
6 Transformer - A device used to transfer electric energy from one circuit to another, through a pair of multiply
wound, inductively coupled wire coils that affect such a transfer with a change in voltage, current, phase, or other electric characteristic. Circuit Breaker - A device used to interrupt or break an electrical circuit when an overload condition exists to protect electrical equipment.

TRANSPARENCY AND ACCOUNTABILITY ACT
2016 ANNUAL PERFORMANCE REPORT
NALCOR ENERGY 33 NEWFOUNDLAND AND LABRADOR HYDRO
order on the Prudence Review of certain Hydro expenditures and projects. Other significant
regulatory activities related to Hydro’s proposed cost variance deferral accounts and the rate
stabilization fund refund, and a number of supplemental capital project applications.
Environmental Sustainability
During the 2014-2016 planning period, Hydro also continued to pursue a number of initiatives
aimed at environmental sustainability. The investigation of alternative energy sources in
communities that rely on diesel generation of electricity continued to advance. In 2009, the
Government of Newfoundland and Labrador and Hydro completed the Coastal Labrador
Alternative Energy study to investigate the potential for the integration of alternative energy
sources, including solar, wind and mini-hydroelectric facilities in isolated Labrador communities
that rely on diesel as a primary means of electricity generation. It was recommended in the
study that further measurement and analysis be carried out for high potential locations. This
work began in 2013 and concluded in 2016. Monitoring to assess hydroelectric potential was
completed on the Gilbert River and the St. Lewis River near the communities of Charlottetown,
Port Hope Simpson and Mary’s Harbour in Labrador. The wind monitoring program collected
data at sites in Nain, Makkovik, Hopedale, Cartwright and L’Anse au Loup. Wind data collection
continued in these communities until the second quarter of 2015 when data collection
equipment was decommissioned. A report on the wind conditions, preliminary costs and
viability of implementing wind power generation in the communities was provided to
Government at the end of 2015.
The Ramea Wind-Hydrogen-Diesel (WHD) research and development project was also advanced
during the planning period. The objective of this project is to integrate diesel generators with
renewable generation technology and energy storage equipment. Integration is accomplished
by the Energy Management System (EMS). The EMS was designed by Nalcor and provides
complete automation and control of project equipment. Energy storage is provided by a
hydrogen electrolyzer and a hydrogen fueled generator set (genset). Renewable generation is
used to offset diesel fuel requirements and also reduce Hydro’s carbon footprint as well as
other emissions. The first phase of this project, which began in 2009, focused on integrating
the community’s existing diesel generators with wind turbines and the hydrogen technology.
During 2016, engineering continued for Phase II of the project which included the procurement
and integration of a hydrogen fuel cell into the existing system. A tender was issued for the
supply of a hydrogen fuel cell but due to higher than anticipated costs, the tender was not

TRANSPARENCY AND ACCOUNTABILITY ACT
2016 ANNUAL PERFORMANCE REPORT
NALCOR ENERGY 34 NEWFOUNDLAND AND LABRADOR HYDRO
awarded. At the end of 2016, a financial review of the project was ongoing and alternatives
were being analysed including delaying Phase II.
Hydro’s commitment to environmental sustainability also includes promoting energy
conservation. During the planning period, Hydro pursued initiatives to reduce energy
consumption in its own facilities and delivered programs to help Hydro’s rural electricity
residential and commercial customers, as well as provincial industrial consumers, conserve
energy. Hydro also continued to partner with Newfoundland Power to deliver the takeCHARGE
program that offers rebates and incentives to encourage residential and commercial customers
to reduce their electricity usage. Residential programs included rebates for insulation
upgrades, electronic thermostats, and high efficiency heat recovery ventilators. As well, a
small technology program that offers at-cash rebates for low cost energy efficient products (e.g.
Energy Star® light bulbs) and mail-in rebates for energy efficient appliances and electronics
were available for residential customers. Commercial programs included discounted high
performance lighting, product rebates for heating and lighting controls, and a custom program
that offers incentives based on economical energy saving improvement projects specific to
individual customer facilities. As well, free technical support was offered to help commercial
customers identify electricity savings projects. Hydro’s Isolated System Community Energy
Efficiency Program, which helps residential and commercial customers in isolated communities
save energy also continued.
Since 2010, Hydro has also delivered the Industrial Energy Efficiency Program (IEEP) which
provides industrial electricity customers with financial assistance and technical support to
complete feasibility studies and capital upgrades to achieve energy savings. The program was
relaunched in 2015 with a new marketing and communications strategy. Each of the four
industrial customers was directly engaged in 2015 and 2016 regarding their interest in energy
efficiency and surveyed to understand their future plans for efficiency improvements. In 2016,
one industrial customer completed lighting upgrades through the IEEP.
Goal: By December 31, 2016, Hydro will have advanced plans to ensure a reliable and cost-effective electricity supply for the province.
Measure: Advanced plans to ensure reliable, cost-effective electricity supply.
During the 2014-2016 planning period, Hydro completed or advanced a number of initiatives
aimed at ensuring a reliable, cost-effective supply of electricity to meet needs in the province.

TRANSPARENCY AND ACCOUNTABILITY ACT
2016 ANNUAL PERFORMANCE REPORT
NALCOR ENERGY 35 NEWFOUNDLAND AND LABRADOR HYDRO
Updating plans for asset investments and delivering on spending priorities are key elements of
reliable service for customers. As well, Hydro continued to assess future electricity needs and
prepare for the completion of the Muskrat Falls project.
INDICATORS ACCOMPLISHMENTS
Advanced multi-year plans for asset investments.
Five-year capital plans were refreshed in each year of the planning period and outlined strategic spending priorities for the company. The capital investment plans reflected growth in electricity system demand as well as the age and condition of current infrastructure and assets.
In the 2014-2016 planning period, Hydro advanced the completion of asset investments outlined in the five-year capital plans. During this period, over $565 million was invested to upgrade electricity generation, transmission and distribution assets as well as supporting technology and infrastructure. This included expenditures in 2014 and 2015 totalling over $128 million related to purchase and installation of a 123.5 MW combustion turbine at the Holyrood Thermal Generating Station.
Advanced commercial arrangements and infrastructure planning related to Muskrat Falls.
During 2014-2016, Nalcor and Hydro advanced commercial arrangements and infrastructure planning related to Muskrat Falls. In 2014, Nalcor developed a multi-year strategy to guide
the transition of the Muskrat Falls project to operations.
Within Hydro, the technical integration of new generating
and transmission assets from the project to Hydro’s
longer-term electricity structure and readiness to operate
and maintain these assets were key focus areas during
2014. Also, Hydro completed a project proposal for the
Bay d'Espoir-Western Avalon 230 kV transmission line
and construction of this line has been ongoing since late
2016. In addition to maintaining electricity system
stability and improving the transport of energy to major
growth areas on the Avalon, this project provides
capacity to enable the import of electricity over the

TRANSPARENCY AND ACCOUNTABILITY ACT
2016 ANNUAL PERFORMANCE REPORT
NALCOR ENERGY 36 NEWFOUNDLAND AND LABRADOR HYDRO
Maritime Link to Newfoundland and Labrador if needed.
During 2015, priority initiatives to prepare for the
transition of the Muskrat Falls Project to operations were
completed including the first phase of the North
American Electric Reliability Corporation (NERC)
standards review. As well, technical integration studies
were advanced with the HVdc system vendor to ensure
safe, reliable integration in the final design of the
Labrador-Island Transmission Link and Maritime Link.
During 2016, Nalcor’s organizational structure was
adjusted with operation and maintenance accountability
for the new facilities and all aspects of transitioning the
project to operations consolidated into Nalcor’s Power
Supply with its transmission staffing organizational model
approved.
Planning was completed for all remaining items to be done for the implementation of an independent system operator within Hydro to oversee the reliable operation of the expanded transmission network including the import and export of electricity with neighboring systems. A key responsibility of the system operator will be to ensure transmission service is provided to any entity who wishes to use the Newfoundland and Labrador transmission system on a non-discriminatory basis. This is required to ensure reciprocal service is provided, allowing the transmission of energy generated in Newfoundland and Labrador on transmission systems outside the province.
With the delay in completion of the Muskrat Falls plant,
technical integration analysis was completed to establish
the requirements to enable use of the transmission
system without any generation at Muskrat Falls. Plans
were put in place to meet those requirements. Other
technical analysis continued as required to support
finalizing control designs for both the Maritime Link and
TRANSPARENCY AND ACCOUNTABILITY ACT
2016 ANNUAL PERFORMANCE REPORT
NALCOR ENERGY 37 NEWFOUNDLAND AND LABRADOR HYDRO
the Labrador Island Link.
Commercial work advanced during 2016 including a review of that required to enable the use of the transmission network interconnections to Labrador and to Nova Scotia prior to the Muskrat Falls plant being in service.
Progressed environmental sustainability programs.
Ramea Wind-Hydrogen-Diesel Energy Project
During the planning period, Phase II of the project, which included the integration of a hydrogen fuel cell into the existing system, was advanced. Engineering work progressed and in early 2016, a tender for the supply of a hydrogen fuel cell was issued. The tender was not awarded due to high costs and at the end of 2016; the future of the project was being assessed.
Coastal Labrador Renewable Generation
During the planning period, Hydro advanced the study of potential hydroelectric projects in Labrador coastal communities and also continued the coastal Labrador wind monitoring program.
Data collection to assess hydroelectric potential on the St. Lewis River and Gilbert River continued over the planning period and concluded in June 2016.
The investigation of wind as an alternative energy source in communities that rely on diesel generation of electricity was also advanced during the planning period.
In 2013, wind assessment towers were installed in Nain, Makkovik, Hopedale, Cartwright and L’Anse au Loup to collect data regarding local wind conditions. Data collection continued as planned until the end of the second quarter of 2015.
Energy Efficiency
� takeCHARGE: Over the planning period, Hydro and Newfoundland Power worked in partnership to deliver the takeCHARGE energy efficiency program. During the 2014-2016 period, Hydro residential customers received 583 rebates for products such as insulation and thermostats. As well, in the same period a program to support Hydro’s commercial

TRANSPARENCY AND ACCOUNTABILITY ACT
2016 ANNUAL PERFORMANCE REPORT
NALCOR ENERGY 38 NEWFOUNDLAND AND LABRADOR HYDRO
customers to make more energy efficient lighting choices provided incentives for over 7,000 lighting products.
� Isolated Systems Community Energy Efficiency Program: During 2014-2016, Hydro delivered its Isolated Systems Energy Efficiency Program to help homeowners and small businesses in communities served by diesel systems in Labrador and the island. Over the three years, over 2,300 home and business customers benefitted from the installation of energy efficient technologies free of charge.
� Business Efficiency Program/Isolated Systems Business Efficiency Program (ISBEP): These programs provided rebates for energy efficiency lighting and heating and lighting controls. As well, these programs provided technical support to help customers identify economical energy efficiency opportunities and financial support for capital upgrades. During the 2014-2016 planning period, 26 facility audits were completed and 26 projects were identified and completed.
� Industrial Energy Efficiency Program: The Industrial Energy Efficiency Program, relaunched in 2015, emphasizes communications with customers to document future energy efficiency initiatives including projected budget, energy savings and payback period. Industrial customers continued to be eligible for funding for a portion of the costs of energy audits and implementing identified projects. For the planning period, two projects were completed with annual energy savings estimated at 22,435 MWh.
� Hydro Internal Energy Efficiency: During the 2014-2016 planning period, Hydro also identified and implemented measures to reduce energy use in Hydro facilities. Measures including heating and cooling system optimization, lighting upgrades and controls resulted in energy savings of 12,471 MWh during the planning period.

TRANSPARENCY AND ACCOUNTABILITY ACT
2016 ANNUAL PERFORMANCE REPORT
NALCOR ENERGY 39 NEWFOUNDLAND AND LABRADOR HYDRO
Objective: By December 31, 2016, Hydro will have further advanced electricity system investments, planning for integration of Muskrat Falls, and environmental sustainability initiatives.
Measure 1: Further advanced electricity system investments.
Indicators 2016 ACCOMPLISHMENTS
Updated the Hydro five-year capital plan as required.
In 2016, Hydro completed updates to the five-year capital plan for 2017-2021. The updated plan outlines the timing, scope and cost for investments in the company’s electricity generation, transmission and distribution assets as well as supporting infrastructure and technology. The 2017 capital budget for Hydro is based on the 2017-2021 capital plan.
Updates to the five-year capital plan can result when new information regarding asset condition or performance or availability of parts or service becomes available. During 2016, the decision to complete additional analysis of several projects in Hydro’s five-year capital plan supported the decision to defer the projects to future years or advance the planned timing due to condition of the asset. For example, the replacement of exciter controls7 for generating units 1-6 at the Bay d’Espoir generating station was originally scheduled to start in 2019. The manufacturer of the exciter controls advised that the exciters were in the obsolete phase of their lifecycle and therefore the manufacturer could not guarantee spare parts and technical support. As a result of this information and the potential impact on future reliable operation of the Bay d’Espoir generating units, the project was advanced to start in 2017.
Completed planned 2016 investments in Hydro assets.
In 2016, Hydro invested $204 million to upgrade or replace electricity generation, transmission and distribution equipment and supporting infrastructure. This expenditure was below the $350 million planned for 2016.
The variance is attributable to two major projects: the 230 kilovolt (kV) transmission line from Churchill Falls to Wabush (Labrador West Transmission Line); and the 230 kV transmission line from Bay d’Espoir to Western Avalon (TL 267).
The Labrador West Transmission Line project, intended to help supply power for planned new mining developments in Labrador West, was suspended in September 2014 due to delays in mining project activity and remained suspended through 2015 and
7 The excitation system controls the output voltage of the generator.
TRANSPARENCY AND ACCOUNTABILITY ACT
2016 ANNUAL PERFORMANCE REPORT
NALCOR ENERGY 40 NEWFOUNDLAND AND LABRADOR HYDRO
Indicators 2016 ACCOMPLISHMENTS
2016. This resulted in a variance against budget of some $129 million in 2016.
The TL 267 project was underspent by $18 million in relation to the 2016 budget. This project has undergone schedule and cash flow changes. The anticipated in service date has been accelerated from May 2018 to October 2017 with no change to the overall project budget.
Measure 2: Further advanced planning for integration of Muskrat Falls Project.
Progressed implementation of priority activities to prepare for transition of Muskrat Falls Project to operations.
During 2016, many priority initiatives to prepare for the transition of the Muskrat Falls Project to operations were advanced.
Nalcor’s organization structure was adjusted with operation and maintenance accountability for the new facilities and all aspects of transitioning the project to operations consolidated. The operations organization requirements to support safe and reliable operation of the new facilities, particularly the HVdc8 transmission systems, were reviewed and approved. Planning was completed for all remaining items to be done for the implementation of an independent system operator within Hydro to oversee the reliable operation of the expanded transmission network including the import and export of electricity with neighbouring systems.
Preparatory commercial framework activities to enable use of the transmission network interconnections to Labrador and to Nova Scotia prior to the Muskrat Falls plant being in service were advanced for a 2017 implementation.
Technical integration analysis was completed resulting in identification of technical solutions and the initiation of work to enable transmission of Labrador power to the Island without the Muskrat Falls plant in operation. Planning activities were advanced as required to prepare for the 2017 connection of the new transmission system at Churchill Falls and Soldiers Pond on the Island and the Maritime Link on the west coast of the Island.
Measure 3: Further progressed environmental sustainability initiatives.
8 High Voltage Direct Current (HVdc) refers electric power transmission system (also called a power super highway
or an electrical super highway) that uses direct current for the bulk transmission of electrical power, in contrast with the more common alternating current (AC) systems. HVdc transmission increases the efficiency of power transmission over long distances.

TRANSPARENCY AND ACCOUNTABILITY ACT
2016 ANNUAL PERFORMANCE REPORT
NALCOR ENERGY 41 NEWFOUNDLAND AND LABRADOR HYDRO
Indicators 2016 ACCOMPLISHMENTS
Provided technical expertise as required to the Department of Natural Resources to advance alternative energy research in Labrador.
In 2016, efforts to advance alternative energy research in Labrador focused on hydroelectric potential. During the year, data collection regarding the feasibility study of hydroelectric potential in select Labrador coastal communities was concluded as planned and a report was completed. As well, Hydro provided advice to the Department of Natural Resources as requested.
In 2013, the Government of Newfoundland and Labrador and Hydro completed a feasibility study of potential hydroelectric projects for southern and northern Labrador coastal communities. In that study, a requirement for additional data was identified and data collection continued through to June 2016 and a report on the data was completed.
Also in 2016, the Department of Natural Resources requested that Hydro provide advice on processes to engage potential proponents that could supply alternative and renewable energy for Labrador coastal communities. In September 2016, Hydro provided a presentation to the Department on potential procurement processes focused on options to reduce reliance on diesel fuel for electricity generation.
Progressed Ramea Wind-Hydrogen- Diesel research and development project Phase II.
During 2016, Phase II of the Ramea Wind-Hydrogen- Diesel research and development project was advanced with the release of a tender for the supply of a hydrogen fuel cell. Due to the higher than anticipated fuel cell costs, the tender was not awarded.
As a result of the outcome of the tendering process, other planned work to progress the project was not completed in 2016. At the end of 2016, a financial review of the project was ongoing and alternatives were being analysed including delaying Phase II.
Continued engagement with industrial customers through the Industrial Energy Efficiency Program.
In 2016, Hydro implemented a key account management framework to guide engagement with industrial electricity customers. The key account approach allows for a single-point of contact for all industrial customers and emphasizes a direct working relationship for all industrial customer matters. The Industrial Energy Efficiency Program (IEEP) aimed at promoting energy efficiency is included in the key account approach.
The assistance available to industrial customers through the IEEP includes funding for a portion of the costs of energy audits and

TRANSPARENCY AND ACCOUNTABILITY ACT
2016 ANNUAL PERFORMANCE REPORT
NALCOR ENERGY 42 NEWFOUNDLAND AND LABRADOR HYDRO
Indicators 2016 ACCOMPLISHMENTS
implementing identified projects. In early 2016, 3 of the 5 industrial customers expressed interested in energy efficiency projects, but as the year progressed, customer plans had changed. Supported by Hydro’s IEEP, one industrial customer completed lighting upgrades that will save 177 MWh annually.
Delivered initiatives to help residential and commercial electricity consumers conserve energy.
In 2016, Hydro continued to deliver initiatives to help residential and commercial electricity consumers conserve energy. During the year, the company implemented the first year activities outlined in the Five Year Conservation Plan: 2016-2020 that was filed with the PUB in October 2015. These activities included the joint utility program offerings for residential and commercial customers through the takeCHARGE program delivered in partnership with Newfoundland Power, as well as Hydro’s own energy efficiency programs.
takeCHARGE program
In 2016, the takeCHARGE energy efficiency program continued to see success with 167 rebates to Hydro’s residential customers for insulation, thermostats, heat recovery ventilators, and appliances, over 26,000 products rebated through the Small Technology program, and over 1,500 rebates for efficient lighting technologies purchased by Hydro’s commercial customers. The total annual energy savings from the rebate initiatives is 459 MWh.
Isolated Systems Community Energy Efficiency Program
In 2016, Hydro also continued delivery of the Isolated Systems Community Energy Efficiency Program. This program promotes energy efficiency to residential and commercial customers in communities served by diesel electricity systems in Labrador and on the island. During 2016, 345 residential and business customers benefited from the direct, free installation of over 5,700 energy efficient products with a total annual energy savings of 512 MWh.
Hydro also delivered programs to business customers in the company’s interconnected and isolated areas in 2016. These programs provide facility audits and technical support to identify economical energy efficiency opportunities, and provide financial support for capital upgrades. In 2016, 10 commercial facility
TRANSPARENCY AND ACCOUNTABILITY ACT
2016 ANNUAL PERFORMANCE REPORT
NALCOR ENERGY 43 NEWFOUNDLAND AND LABRADOR HYDRO
Indicators 2016 ACCOMPLISHMENTS
audits were completed to inform customers of opportunities for incentives and 15 projects were completed resulting in annual savings of 829 MWh.

TRANSPARENCY AND ACCOUNTABILITY ACT
2016 ANNUAL PERFORMANCE REPORT
NALCOR ENERGY 44 NEWFOUNDLAND AND LABRADOR HYDRO
ISSUE 3: UPPER CHURCHILL ASSET MANAGEMENT AND POWER CONTRACT LEGAL ACTIONS
The Churchill Falls generating station is one of the largest underground hydroelectric
powerhouses in the world with 5,428 MW of capacity used by millions of consumers in North
America. Nalcor, through its subsidiary, Hydro, holds a 65.8 per cent interest in Churchill Falls
(Labrador) Corporation Limited (CF(L)Co), with Hydro-Québec holding the remainder.
Stewardship of the Churchill Falls assets supports the fulfillment of the strategic direction of the
Provincial Government related to the export of surplus energy. In 2016, Churchill Falls net
income was $57.1 million.
Asset Management
In 2016, Churchill Falls celebrated 45 years since first power. With the plant and related
infrastructure aging, asset management is critical to keeping assets in reliable operating
condition to provide reliable service to customers for the long-term and to ensure assets are
fully functional well beyond the expiry of current commitments in 2041. From 2014-2016
$167.6 million was invested to upgrade or replace Churchill Falls assets, with annual capital
expenditures increasing from $50.3 million to $62.3 million during that period.
Taking steps to ensure the continued performance of the Churchill Falls facilities through
planning and strategic investment is a key element of the CF(L)Co strategy. A long-term asset
management plan has been developed that reflects the level of service required of the plant
combined with key asset information including condition assessments and operating and
maintenance experience. This long-term plan is the basis for developing five-year capital plans
that outline more detailed scope of the work required and the estimated costs. The Churchill
Falls five-year capital plan has informed the increased investment noted above and the plan is
reviewed annually and updated to reflect new information that could impact the timing or
scope of future asset investments.
Upper Churchill Power Contract / Renewed Power Contract – Legal Actions
A power contract with Hydro-Québec dated May 12, 1969, provides for the sale of the majority
of the power and energy from the Churchill Falls facility to Hydro-Québec. When the 1969
Power Contract (Power Contract) was signed, the price to be paid by Hydro-Québec
represented approximately one-third of the average price Hydro-Québec charged its

TRANSPARENCY AND ACCOUNTABILITY ACT
2016 ANNUAL PERFORMANCE REPORT
NALCOR ENERGY 45 NEWFOUNDLAND AND LABRADOR HYDRO
customers. The purchase price under the Power Contract was one-quarter of one cent per
kilowatt hour. Upon the commencement of the Renewed Power Contract between CF(L)Co and
Hydro-Québec on September 1, 2016, the purchase price became fixed at one-fifth of one cent
for the 25 year period of that contract. This means that under the terms of the Renewed Power
Contract, power and energy will continue to be sold to Hydro-Québec significantly below its
present commercial value until 2041.
On November 30, 2009, CF(L)Co called on Hydro-Québec to renegotiate a fair and equitable
purchase price for the remaining term of the Power Contract and the term of the Renewed
Power Contract. Hydro-Québec did not respond. As a result, CF(L)Co commenced proceedings
against Hydro-Québec to address disparities in the pricing under those contracts.
CF(L)Co filed a motion with Quebec Superior Court on February 23, 2010, requesting the court
to amend the pricing terms, effective November 2009, of the Power Contract and the Renewed
Power Contract between CF(L)Co and Hydro-Québec, to permit a more equitable sharing of the
value of the power and energy from Churchill Falls. Since the Power Contract was initiated,
circumstances have changed in a way that could not have been reasonably foreseen at the time
it was executed.
The Quebec Superior Court ruled against CF(L)Co in 2014, following which CF(L)Co filed an
appeal. The Quebec Court of Appeal ruled against CF(L)Co on August 1, 2016. On September
30th, 2016 CF(L)Co filed an application for leave to appeal to the Supreme Court of Canada. In
a second legal action, in July of 2013, Hydro-Québec filed a Motion in Quebec Superior Court
seeking a Declaratory Judgement with respect to the Power Contract and Renewed Power
Contract. Hydro-Québec was seeking declarations with respect to i) “Continuous Energy" under
the Renewed Power Contract (commencing September 1, 2016 and expiring August 31, 2041)
and whether, as CF(L)Co contends, it limits Hydro-Québec's energy entitlements to specific
monthly quantities, prorated based on the number of days in each month, for the term of the
Renewed Power Contract and ii) whether CF(L)Co can sell to a third party on an interruptible
basis amounts of power beyond the 300 MW recall block provided for in the Power Contract
and the Renewed Power Contract. The hearing was held in the fall of 2015. The Quebec
Superior Court ruled against CF(L)Co in August 2016. On September 7, 2016 CF(L)Co filed an
appeal with the Quebec Superior Court. In December 2016, the appeal factum was filed. The
appeal hearing is anticipated in 2018.

TRANSPARENCY AND ACCOUNTABILITY ACT
2016 ANNUAL PERFORMANCE REPORT
NALCOR ENERGY 46 NEWFOUNDLAND AND LABRADOR HYDRO
Goal: By December 31, 2016, CF(L)Co will have advanced opportunities for the Upper Churchill to make a greater economic contribution to the province.
Measure: Pursued opportunities for the Upper Churchill to make a greater economic
contribution to the province.
INDICATORS ACCOMPLISHMENTS
Advanced multi-year plan for renewal of assets
During the 2014-16 planning period, CF(L)Co advanced the renewal of its electricity generation, transmission and other infrastructure with the investment of over $167 million. Multi-year replacement programs for transformers, switchyard equipment, dykes, dams and control structures, as well as high-voltage cabling, were a focus for this period.
Advanced preparations for the Upper Churchill Power legal actions
During the 2014-16 planning period, CF(L)Co advanced preparations for the Upper Churchill Power Contract legal actions. The Quebec Superior Court ruled against CF(L)Co in 2014, following which CF(L)Co filed an appeal. The Quebec Court of Appeal ruled against CF(L)Co on August 1, 2016. On September 30th, 2016 CF(L)Co filed an application for leave to appeal to the Supreme Court of Canada. CF(L)Co also undertook action to prepare and plead a defense in the Declaratory Judgment case filed by Hydro-Québec against CF(L)Co. Following the Court’s decision against CF(L)Co in August 2016, CF(L)Co prepared and filed an appeal factum with the Quebec Court of Appeal in December 2016.

TRANSPARENCY AND ACCOUNTABILITY ACT
2016 ANNUAL PERFORMANCE REPORT
NALCOR ENERGY 47 NEWFOUNDLAND AND LABRADOR HYDRO
Objective: By December 31, 2016, CF(L)Co will have advanced Churchill Falls asset renewal and further advanced required preparations for Upper Churchill Power Contract legal actions.
Measure 1: Advanced multi-year capital investment plan for asset renewal
INDICATORS 2016 ACCOMPLISHMENTS
Reviewed the Churchill Falls five-year capital plan and completed any required updates
During 2016 Churchill Falls refreshed the 2017-2021 capital plan. Planned projects are updated on an annual basis and as required based on condition assessments and risk assessments.
An example of an update to the 2017-2021 plan involved the timing for the upgrade of the turbine runner for one generating unit. Analysis of the efficiency gains from the upgrade supported replacing the runner in 2018.
Completed planned 2016 asset investments of $60 million.
In 2016, Churchill Falls completed capital investments of over $62.3 million, compared to $62.0 million budget planned for the year. Churchill Falls continues to focus on asset investments that are linked directly to generating unit and transmission reliability, and thereby reducing risk of unplanned outages. In 2016 this included replacement of one Switchyard transformer, one Powerhouse transformer, one set of high-voltage cables, modernization of protection and controls for one generating unit, dyke improvements, and replacement of several pieces of switchyard high-voltage switching equipment.
Measure 2: Progressed activities related to the Upper Churchill Power Contract/Renewal Contract legal actions legal actions
Completed required preparations for Upper Churchill Power Contract/Renewal Contract legal actions, specifically the appeal hearing for the case regarding the power contract price.
In 2016, Churchill Falls advanced legal actions for the Upper Churchill Power by filing documentation for appeal proceedings in both legal actions.
TRANSPARENCY AND ACCOUNTABILITY ACT
2016 ANNUAL PERFORMANCE REPORT
NALCOR ENERGY 48 NEWFOUNDLAND AND LABRADOR HYDRO
Completed required preparations for the implementation of terms of the Declaratory Judgment decision in relation to the Renewal Contract coming into effect September 1, 2016.
In 2016, Churchill Falls advanced legal actions for the Upper Churchill Power by filing documentation for appeal proceedings in both legal actions.
TRANSPARENCY AND ACCOUNTABILITY ACT
2016 ANNUAL PERFORMANCE REPORT
NALCOR ENERGY 49 NEWFOUNDLAND AND LABRADOR HYDRO
ISSUE 4: OIL AND GAS INTERESTS, EXPLORATION AND DEVELOPMENT
The mandate of Nalcor, established under the Energy Corporation Act (2008) includes exploring
for, developing, producing, refining, marketing and transporting hydrocarbons and products
from hydrocarbons. These activities supported the fulfillment of the strategic direction of the
Provincial Government related to the increased exploration and development of energy
resources and realizing maximum benefits to the province through the strategic development
of our resources.
Offshore Developments
Nalcor’s subsidiary, Nalcor Energy – Oil and Gas, currently manages oil and gas interests in
three developments offshore Newfoundland and Labrador. Nalcor holds a five per cent
working interest in the White Rose Growth Project which includes the North Amethyst field,
West White Rose Extension and South White Rose Extension. The company also has a 10 per
cent working interest in the Hibernia Southern Extension (HSE), a subsea development which is
a tieback to the Hibernia platform. Nalcor is also a co-venturer in the Hebron oil field holding a
4.9 per cent working interest in the province’s fourth offshore oil project.
In addition to the economic value provided through equity, the ownership position provides
Nalcor with a seat at the decision-making table and direct involvement in the management of
the development of the province’s resources. The knowledge, information and understanding
that this participation brings enables Nalcor to foster relationships helping ensure better
alignment between the provincial interest and the project partners.
The three offshore developments in which Nalcor is a partner reached significant milestones in
2014-2016, including first oil from the South White Rose Extension, the completion of water
injection wells to sustain production at Hibernia Southern Extension and the delivery and
integration of the Hebron Project topsides modules at Bull Arm.

TRANSPARENCY AND ACCOUNTABILITY ACT
2016 ANNUAL PERFORMANCE REPORT
NALCOR ENERGY 50 NEWFOUNDLAND AND LABRADOR HYDRO
Exploration Strategy
Nalcor has developed and is executing an exploration strategy based on global best practices to
find and deliver new oil and gas resources for the benefit of the people of Newfoundland and
Labrador.
As the provincial energy company, Nalcor undertakes strategic investments in new data
acquisition and analysis at the front end of the exploration cycle to find and quantify new oil
and gas resource potential in offshore Newfoundland and Labrador’s frontier basins, open new
areas to industry exploration, and increase Newfoundland and Labrador’s global
competitiveness to attract exploration investment. Nalcor is not competitive with industry and
therefore does not participate in bidding on land; Nalcor participates on behalf of the province
in future projects through equity ownership in new successful developments.
Nalcor Energy takes a systematic and scientific approach to evaluating Newfoundland and
Labrador's frontier basins. Through its proprietary Nalcor Exploration Strategy System (NESS),
Nalcor consistently evaluates all of Newfoundland and Labrador’s basins (over 20) on the key
elements that make up a commercial grade petroleum deposit. This process identifies critical
knowledge gaps that may exist and highlights key risks holding back industry investment.
Nalcor will continue to make investments and design geoscience programs to address the key
risks in a basin-by-basin approach. As more is learned about a region, some basins will likely
look less prospective – a reality of exploration. However, by guiding investments and activity
strategically, Nalcor is positioned to make the right investments at the right time to unlock the
next areas of offshore Newfoundland and Labrador that may contain material prospectivity,
ultimately delivering new resources for the benefit of the people of Newfoundland and
Labrador.
The availability of quality well and seismic data is a critical first step to exploration. To date, the
amount of geoscientific data collected and the number of exploratory wells drilled in offshore
Newfoundland and Labrador are significantly lower than in areas such as offshore United
Kingdom or Norway. Despite similar discovery rates and larger sedimentary basin areas in
offshore Newfoundland and Labrador, historic exploration activity in our offshore has only been
about five to ten per cent of the exploration activity that has taken place in the North Sea.
TRANSPARENCY AND ACCOUNTABILITY ACT
2016 ANNUAL PERFORMANCE REPORT
NALCOR ENERGY 51 NEWFOUNDLAND AND LABRADOR HYDRO
To evaluate our resource potential and help attract interest to offshore Newfoundland and
Labrador, Nalcor with seed funding from the province’s Offshore Geoscience Data Program, has
been strategically investing in new seismic data as well as providing additional analysis and
study work to data license holders. During the planning period, these investments have seen
the basin area in offshore Labrador more than double in size. Three new deep water basins
(Chidley, Holton and Henley) were delineated and the size of the previously established Hawke
Basin has substantially increased. Additionally, many play types and trends (rock formations
that may hold oil) have been identified that are similar to those that have yielded some of the
leading discoveries in other regions of the world.
During 2016, Nalcor made significant progress in executing its exploration strategy. It
continued its partnership with global seismic companies to acquire a total of 154,000 line km of
seismic data to date. These investments are paying a return as Nalcor shares in the revenue as
the new data is licensed by the global exploration and production industry.
In 2015, Nalcor along with its global seismic partners acquired 4,600 square kilometres of 3D
multi-client seismic data - 3D seismic data that was instrumental in identifying key material
scale prospects in the successful 2016 license round in the West Orphan Basin.
Also during 2016, Nalcor Energy Oil and Gas in partnership with MG3 (Survey) UK Limited and
Amplified Geochemical Imaging, collected data focused on the Labrador South 2017 license
round. This data will provide new perspective and insight into working petroleum systems
supporting both ongoing licensing rounds and future exploration.
In 2016, the Government of Newfoundland and Labrador, Nalcor Energy and Beicep Franlab9
announced that the in place oil and gas potential was 25.5 billion barrels of oil and 20.6 trillion
cubic feet of gas for the 2016 Orphan basin license round area in offshore Newfoundland and
Labrador. The area covered by the resource assessment represents approximately 2 per cent
or 20,000 square kilometres of Newfoundland and Labrador’s offshore area. Resource
assessments are planned to be carried out on all future license rounds with the results released
to the global oil and gas industry prior to license round bid closing.
Nalcor, with the Department of Natural Resources, is communicating the insights from its
exploration strategy with a focused marketing and engagement plan to bring this new
9 Beicep-Franlab is a leading independent consultant with 45 years of experience in exploration and production
and geoscience software. The company offers a full range of petroleum upstream consulting services and has hands-on expertise in most of the oil and gas jurisdictions around the world.
TRANSPARENCY AND ACCOUNTABILITY ACT
2016 ANNUAL PERFORMANCE REPORT
NALCOR ENERGY 52 NEWFOUNDLAND AND LABRADOR HYDRO
information on Newfoundland and Labrador’s prospectivity to global exploration and
production companies.
Goal: By December 31, 2016, Nalcor Energy-Oil and Gas will have advanced opportunities to increase the exploration and development of the province’s oil and gas resources.
Measure: Advanced oil and gas development and exploration opportunities.
INDICATORS ACCOMPLISHMENTS
Managed offshore interests.
During the 2014-16 planning period, Nalcor managed its interests and supported the achievement of significant milestones for all three offshore developments.
White Rose Extension
As noted, the White Rose Growth Project includes the North Amethyst field, West White Rose Extension and South White Rose Extension. The North Amethyst field produced first oil in May 2010 and has produced over 45 million barrels through December 2016. In 2015, first production from the South White Rose Extension was achieved and in 2016, first production was achieved from the first producer in the Hibernia formation at the North Amethyst field.
Hibernia Southern Extension
First oil was achieved from the Hibernia Southern Extension (HSE) in 2011, supplementing production from the original Hibernia project area, helping the overall field in achieving the one billionth barrel of oil on December 21, 2016. Accelerated drilling progress in 2016 helped achieve record production levels from the HSE area. Hebron
Progress continued in the period on the Hebron Project, meeting schedule milestones required for the tow-out of the Hebron Gravity Based Structure (GBS) to the field. The Utilities and Process Module (UPM) arrived at Bull Arm from Ulsan, Korea in the third quarter of 2016. Mating of the integrated topsides and the GBS was completed prior to year-end.
Advanced knowledge of During the 2014-16 planning period, Nalcor completed planned

TRANSPARENCY AND ACCOUNTABILITY ACT
2016 ANNUAL PERFORMANCE REPORT
NALCOR ENERGY 53 NEWFOUNDLAND AND LABRADOR HYDRO
INDICATORS ACCOMPLISHMENTS
resource potential through execution of multi-year exploration strategy.
activities in its exploration strategy to support exploration activity in the province. The company partnered with global seismic companies TGS-NOPEC Geophysical Company (TGS) and Petroleum Geo-Services (PGS) and acquired an additional 42,000 kilometres of 2D seismic data. It also completed a multi-client seabed coring program for offshore Newfoundland and Labrador
Objective: By December 31, 2016, Nalcor Energy-Oil and Gas will have continued to support
partners’ efforts to advance offshore project milestones and further enhanced
knowledge of the province’s oil and gas resource potential.
Measure 1: Supported partner’s efforts to progress offshore project milestones
Indicators 2016 ACCOMPLISHMENTS
Worked with partners in the three offshore developments toward planned project milestones:
During 2016, Nalcor worked with its partners to progress planned project milestones. As a working interest partner, Nalcor-Oil and Gas participates in management, technical, commercial and financial committees for each respective project in which it has a working interest. Through these Nalcor has the right to receive information and project detail available only to equity owners. This provides Nalcor with the opportunity to participate in decision-making and provide technical and commercial input to the project operator and joint venture partners to help achieve project milestones. Additionally, Nalcor's minority working interest provides it with voting rights on decisions such as project scope and expenditure authorizations, supply/service/fabrication contracts, well/drilling approvals, work plans and budgets and many other project governance matters.
White Rose Extension � Continued evaluation
of development options for West White Rose toward reaching a final investment decision
� Continued implementing the
White Rose Extension In 2016, first production was achieved from the first producer in the Hibernia formation which is part of the White Rose area. Current production from the White Rose field is in the Ben Nevis/Avalon (BNA) formation which reside in layers above the Hibernia formation. Options continued to be assessed for the development of the White Rose Oil field.

TRANSPARENCY AND ACCOUNTABILITY ACT
2016 ANNUAL PERFORMANCE REPORT
NALCOR ENERGY 54 NEWFOUNDLAND AND LABRADOR HYDRO
Indicators 2016 ACCOMPLISHMENTS
South White Rose Extension Development Plan with the drilling of the first oil producer.
Hibernia Southern Extension � Completed initial
platform drilling program
� Completed third subsea water injection well to provide pressure support to producing wells.
Hibernia Southern Extension � First oil was achieved from the Hibernia Southern Extension
(HSE) in 2011, supplementing production from the original Hibernia project area, helping the overall field in achieving the one billionth barrel of oil on December 21, 2016.
� Over the period 2014-2016, the initial platform drilling campaign and five subsea water injection wells were completed.
� Accelerated drilling progress in 2016 helped achieve record production levels from the HSE area.
Hebron Progressed critical path scopes including delivery of additional modules to the Bull Arm Fabrication site and commenced module integration
Hebron � The Utilities and Process Module (UPM) arrived at Bull Arm
from Ulsan, Korea in the third quarter of 2016. Mating of the integrated topsides and the GBS was completed prior to year-end. During 2016, required milestones were achieved to meet the scheduled mid 2017 tow-out of the Hebron Gravity Based Structure (GBS) to the field

TRANSPARENCY AND ACCOUNTABILITY ACT
2016 ANNUAL PERFORMANCE REPORT
NALCOR ENERGY 55 NEWFOUNDLAND AND LABRADOR HYDRO
Measure 2: Further enhanced knowledge of the province’s oil and gas resource potential through the execution of the exploration strategy
Acquired and analyzed geoscience data � Completed updates to
the multi-year exploration strategy
� Completed detailed
resource assessment (oil, gas volumes) for offshore area in advance of license round close (Eastern Newfoundland region November 2016) with leading, global independent resource evaluation firm.
� Invested with global partners in acquisition of planned seismic data to target areas for upcoming license rounds.
� Planned and executed field survey to capture satellite slick and targeted seabed cores.
During 2016 Nalcor acquired and analyzed geoscience data to enhance knowledge of the province’s oil and gas resource potential through seismic data collection and analysis. The multi-year strategy includes seismic acquisition over the offshore, resource assessments over call for bid rounds, further collection of scientific data. Achievements related to planned 2016 indicators are outlined below. Resource assessment: The detailed resource assessment was completed as planned and released in advance of the 2016 license round close. On August 24th, 2016, the Government of Newfoundland and Labrador, Nalcor and Beicip-Franlab announced that the “in-place10” oil and gas resource potential was 25.5 billion barrels of oil and 20.6 trillion cubic feet for the Orphan basin 2016 license round area in offshore Newfoundland and Labrador. Seismic data acquisition: Nalcor invested with its global partners to acquire 2D seismic data. The companies successfully completed the acquisition of 42,000 kilometres of seismic data to bring the five year total to 154,000 line kilometres – one of the largest regional seismic programs in the world. Satellite slick data: Nalcor continued the planned evaluation of satellite slick data. New satellite images were acquired across frontier areas of the offshore and are being processed for potential oil slick signatures. Reports issued: Both the Drilling Performance Metrics and Biostratigraphy studies were issued as planned. The insights provided through this research continues to provide knowledge to the global oil and gas industry thereby reducing uncertainty of Newfoundland and Labrador’s offshore. Also during the year, Nalcor Energy Oil and Gas in partnership with MG3 (Survey) UK Limited and Amplified Geochemical Imaging completed a multi-client seabed coring program for offshore Newfoundland and Labrador. The data collected will provide new perspective and
10
In place: Total estimated amount of oil and gas, including producible and non-producible quantities.
TRANSPARENCY AND ACCOUNTABILITY ACT
2016 ANNUAL PERFORMANCE REPORT
NALCOR ENERGY 56 NEWFOUNDLAND AND LABRADOR HYDRO
insight into working petroleum systems supporting both ongoing licensing rounds and future exploration. The 2016 survey focused on the Labrador South 2017 license round area.
Communicated Nalcor’s geoscience results to the global oil and gas industry � Continued
presentations to global exploration conferences
� Progressed engagement and continued meetings with global exploration and production companies
Integrated data and analysis from Oil and Gas regional exploration programs to submit nominations to the CNLOPB for future license rounds and nominations for the definition of parcels for the 2017 licence round.
During 2016, Nalcor’s geoscience results were communicated as planned to the global oil and gas industry. Nalcor presented the insights on Newfoundland and Labrador’s prospectivity to the key exploration conferences around the world. In addition to conference presentations, Nalcor progressed engagement and continued meetings with global oil and gas companies to inform them of the new data insights on the prospectivity in the province’s offshore.
Nalcor also completed a number of additional initiatives to communicate geoscience results. The Nalcor exploration website was redesigned to highlight each of the upcoming scheduled license rounds (2016, 2017 and 2019) for offshore Newfoundland and Labrador and the multi-client data and Nalcor invested geoscience studies and reports available for each area. In addition to geoscience data information, detailed maps for each of the license round areas, information about the regulatory license process, and details about each specific license round were also added to the site.
All planned work completed. During 2016, Nalcor completed planned analysis and submitted nominations to the CNLOPB regarding the 2020 license round in North East Newfoundland region and the 2020 license round in the South Newfoundland region. The areas of interest outlined by Nalcor reflect areas that contain potential prospectivity that warrants proceeding to be scheduled for a license round.
As well, Nalcor provided the nomination for the definition of parcels for the 2017 license round. Nalcor’s approach to recommend defining parcels is such that major play trends are broken into multiple parcels and individual prospects are retained in a single block to the degree possible.
TRANSPARENCY AND ACCOUNTABILITY ACT
2016 ANNUAL PERFORMANCE REPORT
NALCOR ENERGY 57 NEWFOUNDLAND AND LABRADOR HYDRO
ISSUE 5: LOWER CHURCHILL DEVELOPMENT
The hydroelectric potential of Muskrat Falls and Gull Island make the lower Churchill River in
Labrador one of the best hydroelectric sources in North America and is a key component of the
province’s energy resource portfolio. The clean, renewable electricity provides an opportunity
for the province to meet its own domestic and industrial needs in an environmentally
sustainable way, and also export excess electricity to other jurisdictions where the demand for
clean, renewable energy continues to grow.
Throughout the planning period, the lower Churchill development supported the fulfillment of
several strategic directions of the Provincial Government including: responsible resource
development through the development of clean, renewable energy through the Lower Churchill
Project; social license through adequate stakeholder consultation and engagement; and
increased participation in energy developments supported the outcome of ensuring maximum
benefits to the province through the strategic development of the province’s resources, while
providing an enhanced stable energy supply for domestic use and export to markets.
Muskrat Falls Project
Phase one of the Lower Churchill Project, the Muskrat Falls Project, includes an 824 megawatt
hydroelectric generating facility at Muskrat Falls, over 1,600 km of transmission lines across the
province, and the construction of the Maritime Link by Emera between Newfoundland and
Nova Scotia. Construction on all components of the project significantly advanced in 2016.
The Muskrat Falls Project will meet the province’s energy needs, provide electricity for future
developments and provide significant jobs and economic benefits for the people of
Newfoundland and Labrador. In addition to enhancing the long-term energy supply, the
development will help the province’s and Canada’s efforts to reduce greenhouse gas emissions.
In June 2016, Nalcor CEO updated the cost and schedule of the Muskrat Falls Project. At June
2016, the forecasted capital cost of the generation and transmission projects was $9.1 billion
before financing costs. Transmission lines and associated infrastructure was projected to be in
service mid-2018 to transmit power from Labrador to the island. First power at Muskrat Falls
was scheduled in fall 2019, with full power by mid-2020.

TRANSPARENCY AND ACCOUNTABILITY ACT
2016 ANNUAL PERFORMANCE REPORT
NALCOR ENERGY 58 NEWFOUNDLAND AND LABRADOR HYDRO
In 2016, employment on the Muskrat Falls Project peaked in October with 4,982 Newfoundland and Labrador residents working on all components of the project, representing 83 per cent of the total workforce in that month. The peak number of women employed on the project in 2016 was 642. During 2016, employment of Labrador Aboriginal people peaked at 590 workers of which 193 were members of the Innu Nation. The implementation of the Impact and Benefits Agreement (IBA) with Innu Nation is continuing. To date, contracts with a projected value of almost $520 million have been awarded to Innu businesses. Processes and personnel have been put in place to support Innu employment on the project.
Joint Nalcor-Innu Nation environmental management initiatives are ongoing, including Innu
environmental monitors working on site.
Lower Churchill Phase 2 – Gull Island
The lower Churchill development’s second hydroelectric installation is proposed at Gull Island
with a capacity of 2,250 MW and average annual energy of 11.9 terawatt hours. During 2016,
Nalcor monitored and assessed external market opportunities for Gull Island – this included
engagement in Ontario, New England and the Maritime markets. In addition there is ongoing
monitoring of potential opportunities for new large-scale industrial requirements in the
province. Also during 2016, Hydro and Nalcor Energy Marketing, in their respective capacities
as transmission customer of Hydro-Québec, engaged in transmission open access regulatory
activities in Quebec through its participation in Open Access Transmission Tariff (OATT)
hearings before the Régie de l’énergie.
Goal: By December 31, 2016, Nalcor will have advanced development of clean, renewable energy from the lower Churchill River hydroelectric resource
Measure: Advanced development of lower Churchill River hydroelectric resource.
INDICATORS ACCOMPLISHMENTS
Advanced construction of Muskrat Falls Project.
During the 2014-16 planning period, Nalcor completed activities necessary to advance construction of the generation and transmission components of the Muskrat Falls Project. Work was completed at the spillway and temporary cofferdam to allow for the redirection the flow of the lower Churchill River at Muskrat Falls.
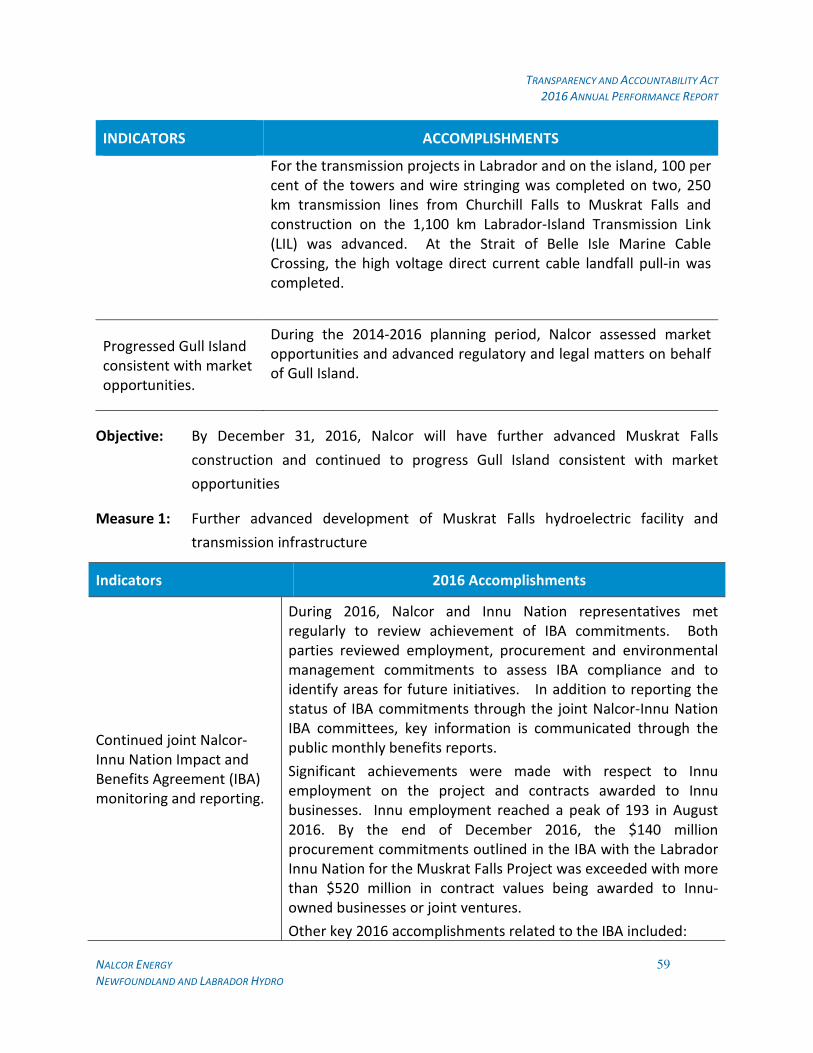
TRANSPARENCY AND ACCOUNTABILITY ACT
2016 ANNUAL PERFORMANCE REPORT
NALCOR ENERGY 59 NEWFOUNDLAND AND LABRADOR HYDRO
INDICATORS ACCOMPLISHMENTS
For the transmission projects in Labrador and on the island, 100 per cent of the towers and wire stringing was completed on two, 250 km transmission lines from Churchill Falls to Muskrat Falls and construction on the 1,100 km Labrador-Island Transmission Link (LIL) was advanced. At the Strait of Belle Isle Marine Cable Crossing, the high voltage direct current cable landfall pull-in was completed.
Progressed Gull Island consistent with market opportunities.
During the 2014-2016 planning period, Nalcor assessed market opportunities and advanced regulatory and legal matters on behalf of Gull Island.
Objective: By December 31, 2016, Nalcor will have further advanced Muskrat Falls
construction and continued to progress Gull Island consistent with market
opportunities
Measure 1: Further advanced development of Muskrat Falls hydroelectric facility and
transmission infrastructure
Indicators 2016 Accomplishments
Continued joint Nalcor-Innu Nation Impact and Benefits Agreement (IBA) monitoring and reporting.
During 2016, Nalcor and Innu Nation representatives met regularly to review achievement of IBA commitments. Both parties reviewed employment, procurement and environmental management commitments to assess IBA compliance and to identify areas for future initiatives. In addition to reporting the status of IBA commitments through the joint Nalcor-Innu Nation IBA committees, key information is communicated through the public monthly benefits reports.
Significant achievements were made with respect to Innu employment on the project and contracts awarded to Innu businesses. Innu employment reached a peak of 193 in August 2016. By the end of December 2016, the $140 million procurement commitments outlined in the IBA with the Labrador Innu Nation for the Muskrat Falls Project was exceeded with more than $520 million in contract values being awarded to Innu-owned businesses or joint ventures.
Other key 2016 accomplishments related to the IBA included:

TRANSPARENCY AND ACCOUNTABILITY ACT
2016 ANNUAL PERFORMANCE REPORT
NALCOR ENERGY 60 NEWFOUNDLAND AND LABRADOR HYDRO
Indicators 2016 Accomplishments
� The joint Nalcor-Innu Nation Environmental Management Committee (EMC) held its annual general meeting in June in Sheshatshiu.
� Participated in the following joint Nalcor-Innu Nation IBA Committees: Tshiashkueish (IBA Implementation) Committee, Environmental Management Committee, Innu Employee Advisory Committee, and Leadership Committee.
� Continued to deliver Innu cultural awareness training throughout the year. To date, over 13,000 people, including LCP management, contractors and site workers have completed this training.
� Supported the LATP in the delivery of targeted training programs to assist Labrador Innu to qualify for Muskrat Falls Project positions. 2016 was primarily focused on safety certification training.
� Awarded four Lower Churchill Project IBA scholarships to Labrador Innu post-secondary students.
� In August, hired the first Innu apprentice Line Worker, who is training towards a permanent position in Power Supply operations.
� Provided a 2-day Supervisory Training program (March 8 - 9) for 13 Innu workers to assist with their career progression opportunities.
Continued implementation of Environmental Management and Environmental Effects Monitoring programs.
� Implementation of Environmental Management and
Environmental Effects Monitoring programs continued as
planned in 2016.
Achieved 100 per cent of Environmental Management System (EMS) targets .
More than 20 environmental effects monitoring plans have been implemented and are ongoing. Some of the initiatives undertaken as part of the Environmental Effects Monitoring Program included:
� Aquatic sampling program for Goose Bay and Lake Melville (fish, water, and sediment).
� Aerial surveys and monitoring of the Red Wine Mountains caribou herd and the Mealy Mountain caribou herd.
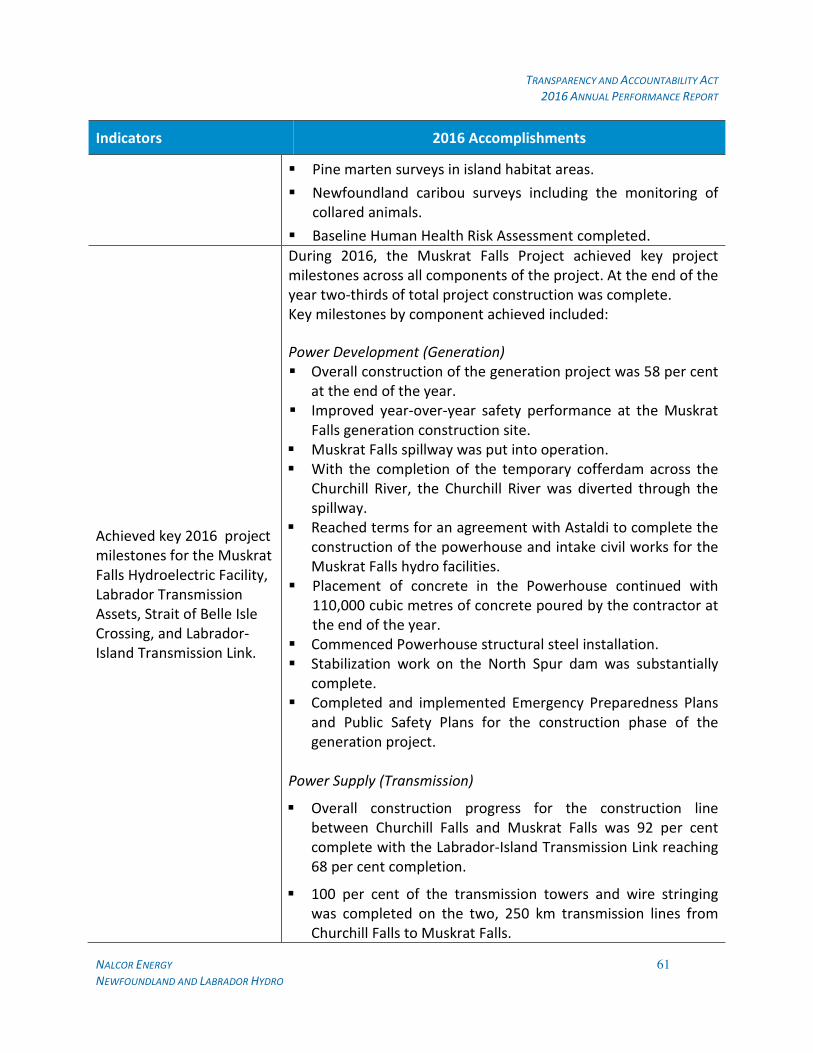
TRANSPARENCY AND ACCOUNTABILITY ACT
2016 ANNUAL PERFORMANCE REPORT
NALCOR ENERGY 61 NEWFOUNDLAND AND LABRADOR HYDRO
Indicators 2016 Accomplishments
� Pine marten surveys in island habitat areas.
� Newfoundland caribou surveys including the monitoring of collared animals.
� Baseline Human Health Risk Assessment completed.
Achieved key 2016 project milestones for the Muskrat Falls Hydroelectric Facility, Labrador Transmission Assets, Strait of Belle Isle Crossing, and Labrador-Island Transmission Link.
During 2016, the Muskrat Falls Project achieved key project milestones across all components of the project. At the end of the year two-thirds of total project construction was complete. Key milestones by component achieved included:
Power Development (Generation)
� Overall construction of the generation project was 58 per cent at the end of the year.
� Improved year-over-year safety performance at the Muskrat Falls generation construction site.
� Muskrat Falls spillway was put into operation. � With the completion of the temporary cofferdam across the
Churchill River, the Churchill River was diverted through the spillway.
� Reached terms for an agreement with Astaldi to complete the construction of the powerhouse and intake civil works for the Muskrat Falls hydro facilities.
� Placement of concrete in the Powerhouse continued with 110,000 cubic metres of concrete poured by the contractor at the end of the year.
� Commenced Powerhouse structural steel installation. � Stabilization work on the North Spur dam was substantially
complete. � Completed and implemented Emergency Preparedness Plans
and Public Safety Plans for the construction phase of the generation project.
Power Supply (Transmission)
� Overall construction progress for the construction line between Churchill Falls and Muskrat Falls was 92 per cent complete with the Labrador-Island Transmission Link reaching 68 per cent completion.
� 100 per cent of the transmission towers and wire stringing was completed on the two, 250 km transmission lines from Churchill Falls to Muskrat Falls.

TRANSPARENCY AND ACCOUNTABILITY ACT
2016 ANNUAL PERFORMANCE REPORT
NALCOR ENERGY 62 NEWFOUNDLAND AND LABRADOR HYDRO
Indicators 2016 Accomplishments
� Construction continued on the Churchill Falls and Muskrat Falls substations reaching 83 per cent and 71 per cent completion respectively.
� Work progressed on the switchyards, converters, and synchronous condensers for the Labrador and island portions of the transmission projects.
� Significant major equipment for the High Voltage direct current component was delivered to the province in 2016.
� Three submarine cables were installed on the seafloor in the Strait of Belle Isle connecting Labrador to the island for the first time in history.
� Following the installation of the marine cables, 540,000 tonnes of locally quarried rock was installed over 80 km to create the protective rock berm over the three cables.
Measure 2: Progressed Gull Island consistent with market opportunities
Indicators 2016 Accomplishments
Completed market assessment and engagement activities with potential customers related to Gull Island
During 2016, Nalcor completed planned market assessment and engagement activities related to Gull Island. These activities included:
� Monitoring market developments in northeast North America related to electricity demand, plant retirements and clean energy policy and legislation; and
� Engaging with governments, market participants, and transmission providers. These engagements included the Ontario /Newfoundland and Labrador Working Group on Electricity Trade and New England policy makers regarding clean energy procurement opportunities.
Monitored policy initiatives that support procurement of new hydro development as a clean energy supply
During 2016, Nalcor continued efforts to advocate for policy initiatives that support procurement of new hydro development as a clean energy supply option in the northeast region.
TRANSPARENCY AND ACCOUNTABILITY ACT
2016 ANNUAL PERFORMANCE REPORT
NALCOR ENERGY 63 NEWFOUNDLAND AND LABRADOR HYDRO
Indicators 2016 Accomplishments
in the northeast region and advocated as appropriate
Nalcor was a key member of the Massachusetts Clean Energy Partnership, a coalition of wind, hydro and transmission companies that was formed to advocate for clean energy resources in the state.
Advanced project readiness activities consistent with progress of market opportunities
During 2016, continued to pursue activities related to market
access. These activities supported efforts to identify and evaluate transmission options to access potential markets for the province’s surplus energy. Hydro and Nalcor Energy Marketing participated in Hydro Québec TransEnergie’s (HQT) open access transmission tariff hearing before the Régie de l’énergie as a current customer of the HQT system; and Nalcor also explored transmission access options with potential developers into the United States Northeast region.
From a project readiness perspective, Nalcor continued baseline data collection for future environmental effects monitoring in accordance with Lower Churchill Hydroelectric Generation Project
Undertaking Order under the Environmental Protection Act. The environmental effects monitoring plans specified in the Order include a scope approved to ensure construction and operational environmental effects are understood.

TRANSPARENCY AND ACCOUNTABILITY ACT
2016 ANNUAL PERFORMANCE REPORT
NALCOR ENERGY 64 NEWFOUNDLAND AND LABRADOR HYDRO
ISSUE 6: BULL ARM FABRICATION SITE LONG TERM STRATEGY AND LEASE MANAGEMENT
The Bull Arm Fabrication site is an important asset for industrial development in Newfoundland
and Labrador and the advancement of the province’s fabrication capability. The site has
capabilities for steel fabrication and concrete construction, outfitting installation, at-shore
hook-up and deep water commissioning. The site has facilitated growth of the province’s
fabrication capability through participation in the Hibernia, Terra Nova and White Rose oil
projects and the Voisey’s Bay project.
During the planning period, the Bull Arm Fabrication site supported fulfillment of the strategic
direction of the Provincial Government related to ensuring maximum benefits to the province
through the strategic development of our resources. More specifically, increased local
industrial and employment benefits are facilitated by a site that can accommodate construction
and fabrication activities in the province.
Nalcor owns the site infrastructure and leases the Bull Arm Fabrication site property from the
Provincial Government. It then leases both to a tenant with the roles and responsibilities of
Nalcor and the site tenant specified in a lease agreement. The Bull Arm Fabrication site has
been leased to ExxonMobil Canada Properties since 2011 for the construction of the Hebron
Project which is expected to produce first oil in 2017. Nalcor remained focused on utilization of
the Bull Arm Fabrication site during the short term for the Hebron project, while planning for a
competitive operation with a sustained workforce in the long-term.
A key provision of the current lease is the management of change process. This process allows
Nalcor to assess, approve and monitor all site infrastructure modifications. The intent is to
meet tenant requirements to customize the site while ensuring that at the end of lease, the
modifications completed by the tenant provide ongoing value or are removed. As well, the
process provides Nalcor with the information about site infrastructure modifications to manage
site assets in the future. Since the arrival of ExxonMobil Canada Properties to the Bull Arm
Fabrication site, Nalcor has reviewed and processed numerous tenant requests to complete site
upgrades and infrastructure refurbishment. As well, Nalcor continued to engage with the
tenant on safety and the environment matters. In regards to safety, this involved regular
meetings where tenant safety results could be reviewed and best practices shared. In regards
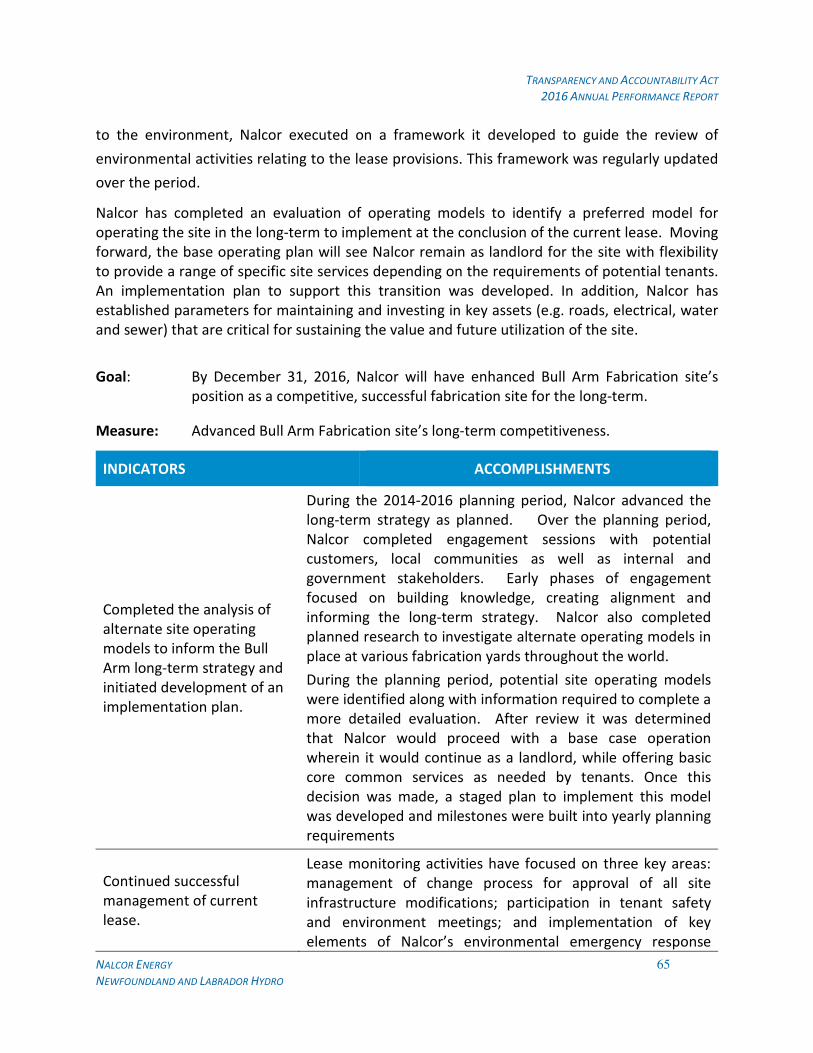
TRANSPARENCY AND ACCOUNTABILITY ACT
2016 ANNUAL PERFORMANCE REPORT
NALCOR ENERGY 65 NEWFOUNDLAND AND LABRADOR HYDRO
to the environment, Nalcor executed on a framework it developed to guide the review of
environmental activities relating to the lease provisions. This framework was regularly updated
over the period.
Nalcor has completed an evaluation of operating models to identify a preferred model for operating the site in the long-term to implement at the conclusion of the current lease. Moving forward, the base operating plan will see Nalcor remain as landlord for the site with flexibility to provide a range of specific site services depending on the requirements of potential tenants. An implementation plan to support this transition was developed. In addition, Nalcor has established parameters for maintaining and investing in key assets (e.g. roads, electrical, water and sewer) that are critical for sustaining the value and future utilization of the site.
Goal: By December 31, 2016, Nalcor will have enhanced Bull Arm Fabrication site’s position as a competitive, successful fabrication site for the long-term.
Measure: Advanced Bull Arm Fabrication site’s long-term competitiveness.
INDICATORS ACCOMPLISHMENTS
Completed the analysis of alternate site operating models to inform the Bull Arm long-term strategy and initiated development of an implementation plan.
During the 2014-2016 planning period, Nalcor advanced the long-term strategy as planned. Over the planning period, Nalcor completed engagement sessions with potential customers, local communities as well as internal and government stakeholders. Early phases of engagement focused on building knowledge, creating alignment and informing the long-term strategy. Nalcor also completed planned research to investigate alternate operating models in place at various fabrication yards throughout the world.
During the planning period, potential site operating models were identified along with information required to complete a more detailed evaluation. After review it was determined that Nalcor would proceed with a base case operation wherein it would continue as a landlord, while offering basic core common services as needed by tenants. Once this decision was made, a staged plan to implement this model was developed and milestones were built into yearly planning requirements
Continued successful management of current lease.
Lease monitoring activities have focused on three key areas: management of change process for approval of all site infrastructure modifications; participation in tenant safety and environment meetings; and implementation of key elements of Nalcor’s environmental emergency response
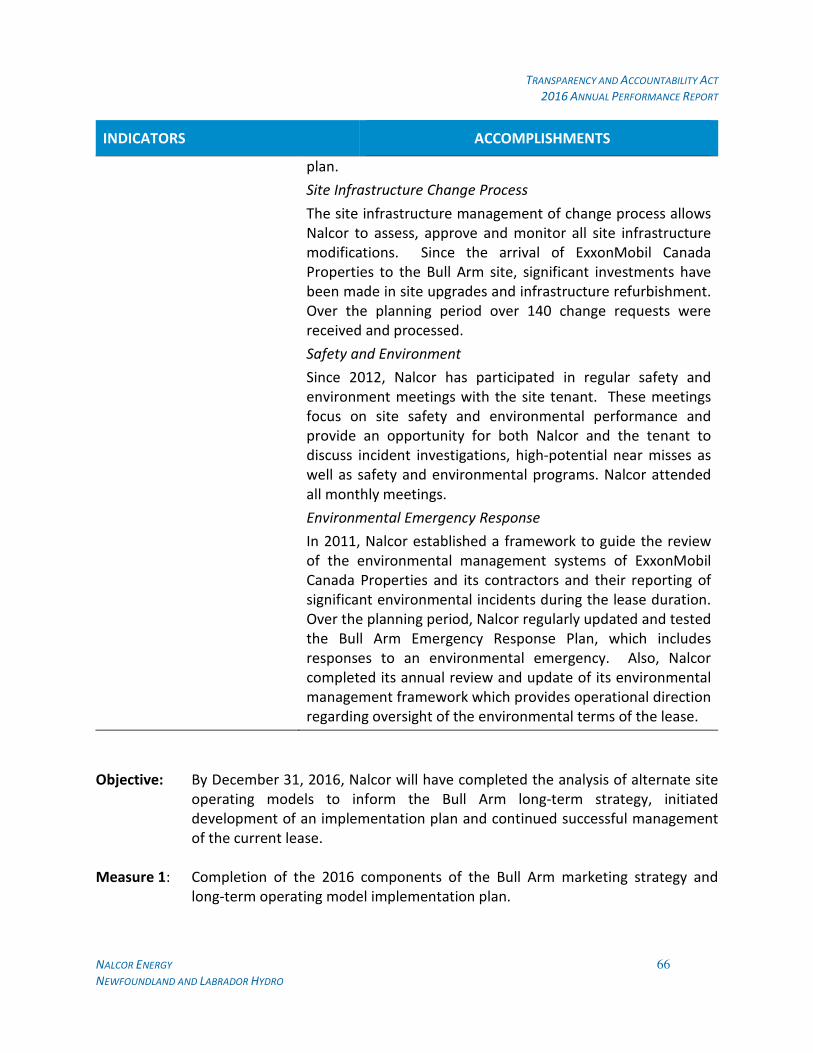
TRANSPARENCY AND ACCOUNTABILITY ACT
2016 ANNUAL PERFORMANCE REPORT
NALCOR ENERGY 66 NEWFOUNDLAND AND LABRADOR HYDRO
INDICATORS ACCOMPLISHMENTS
plan.
Site Infrastructure Change Process
The site infrastructure management of change process allows Nalcor to assess, approve and monitor all site infrastructure modifications. Since the arrival of ExxonMobil Canada Properties to the Bull Arm site, significant investments have been made in site upgrades and infrastructure refurbishment. Over the planning period over 140 change requests were received and processed.
Safety and Environment
Since 2012, Nalcor has participated in regular safety and environment meetings with the site tenant. These meetings focus on site safety and environmental performance and provide an opportunity for both Nalcor and the tenant to discuss incident investigations, high-potential near misses as well as safety and environmental programs. Nalcor attended all monthly meetings.
Environmental Emergency Response
In 2011, Nalcor established a framework to guide the review of the environmental management systems of ExxonMobil Canada Properties and its contractors and their reporting of significant environmental incidents during the lease duration. Over the planning period, Nalcor regularly updated and tested the Bull Arm Emergency Response Plan, which includes responses to an environmental emergency. Also, Nalcor completed its annual review and update of its environmental management framework which provides operational direction regarding oversight of the environmental terms of the lease.
Objective: By December 31, 2016, Nalcor will have completed the analysis of alternate site operating models to inform the Bull Arm long-term strategy, initiated development of an implementation plan and continued successful management of the current lease.
Measure 1: Completion of the 2016 components of the Bull Arm marketing strategy and long-term operating model implementation plan.
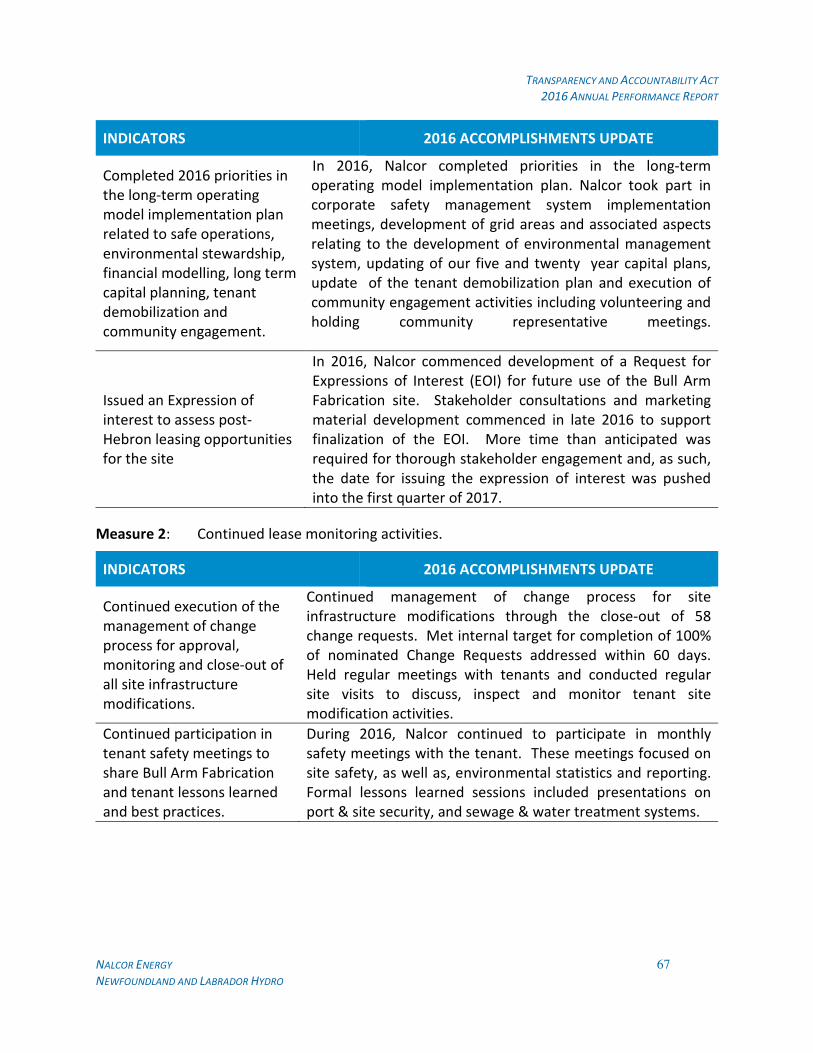
TRANSPARENCY AND ACCOUNTABILITY ACT
2016 ANNUAL PERFORMANCE REPORT
NALCOR ENERGY 67 NEWFOUNDLAND AND LABRADOR HYDRO
INDICATORS 2016 ACCOMPLISHMENTS UPDATE
Completed 2016 priorities in the long-term operating model implementation plan related to safe operations, environmental stewardship, financial modelling, long term capital planning, tenant demobilization and community engagement.
In 2016, Nalcor completed priorities in the long-term operating model implementation plan. Nalcor took part in corporate safety management system implementation meetings, development of grid areas and associated aspects relating to the development of environmental management system, updating of our five and twenty year capital plans, update of the tenant demobilization plan and execution of community engagement activities including volunteering and holding community representative meetings.
Issued an Expression of interest to assess post-Hebron leasing opportunities for the site
In 2016, Nalcor commenced development of a Request for Expressions of Interest (EOI) for future use of the Bull Arm Fabrication site. Stakeholder consultations and marketing material development commenced in late 2016 to support finalization of the EOI. More time than anticipated was required for thorough stakeholder engagement and, as such, the date for issuing the expression of interest was pushed into the first quarter of 2017.
Measure 2: Continued lease monitoring activities.
INDICATORS 2016 ACCOMPLISHMENTS UPDATE
Continued execution of the management of change process for approval, monitoring and close-out of all site infrastructure modifications.
Continued management of change process for site infrastructure modifications through the close-out of 58 change requests. Met internal target for completion of 100% of nominated Change Requests addressed within 60 days. Held regular meetings with tenants and conducted regular site visits to discuss, inspect and monitor tenant site modification activities.
Continued participation in tenant safety meetings to share Bull Arm Fabrication and tenant lessons learned and best practices.
During 2016, Nalcor continued to participate in monthly safety meetings with the tenant. These meetings focused on site safety, as well as, environmental statistics and reporting. Formal lessons learned sessions included presentations on port & site security, and sewage & water treatment systems.

TRANSPARENCY AND ACCOUNTABILITY ACT
2016 ANNUAL PERFORMANCE REPORT
NALCOR ENERGY 68 NEWFOUNDLAND AND LABRADOR HYDRO
INDICATORS 2016 ACCOMPLISHMENTS UPDATE
Completed planned environmental activities including environmental site inspections and annual review of Bull Arm Fabrication’s emergency response plan.
Completed planned review and update of Nalcor’s emergency response plan. Key findings of the review included updates to distribution and emergency contact list and modified roles and responsibilities.
Nalcor reviewed and updated procedures to support the environmental management framework. The procedures detail how Nalcor will process environmental observations, including those of the tenant, communicate environmental information to stakeholders and process environmental documentation and records.

TRANSPARENCY AND ACCOUNTABILITY ACT
2016 ANNUAL PERFORMANCE REPORT
NALCOR ENERGY 69 NEWFOUNDLAND AND LABRADOR HYDRO
ISSUE 7: ENERGY MARKETING PORTFOLIO MANAGEMENT AND LONG TERM STRATEGY
In 2009, Nalcor established an energy marketing team to sell energy from existing and future
developments and build expertise as a participant in competitive energy markets in Canada and
the United States. Nalcor’s energy marketing activities support fulfillment of the strategic
direction of the Provincial Government related to a stable and competitive energy supply for
domestic use and exports to market and, more specifically, the focus area related to the export
of surplus energy.
To access export markets, Nalcor, through its subsidiary, Hydro, signed a Transmission Service
Agreement with Hydro-Québec TransÉnergie (HQT) under HQT’s Open Access Transmission
Tariff in 2009 and in 2013, Nalcor renewed that agreement for another 10 years. The
agreements provide for long-term power transmission capacity from Labrador through Quebec
to the New York border with the ability to transmit electricity to other markets.
In accordance with its long-term growth plans, Nalcor has incorporated a new wholly-owned
subsidiary in 2014, Nalcor Energy Marketing Corporation (Nalcor Energy Marketing). Nalcor
continued to build its internal energy marketing expertise and processes consistent with its
long-term implementation plan for energy marketing operations. As well, over the last three
years measures to increase the value of the energy portfolio were pursued and resulted in
revenues higher than the market benchmark pricing.
During 2016, Nalcor Energy Marketing continued to pursue opportunities to maximize the
overall value of sales creating net income of over $17.1 million. Energy marketing continued to
monitor all markets and the ability to transmit electricity to those markets in order to identify
opportunities to achieve premium prices. Nalcor balances its participation in the day-ahead
and real time spot markets and regularly assesses opportunities to increase value through term
contracts.
Nalcor’s energy portfolio will continue to grow over the coming years with the development of
the lower Churchill River hydroelectric resource. In the long-term, it is also planned that
Energy Marketing will market the production from Nalcor Energy-Oil and Gas’ interests to
global markets. Moving forward, Nalcor Energy Marketing will continue to execute a strategy
aimed at maximizing the value of Nalcor’s existing and future assets.
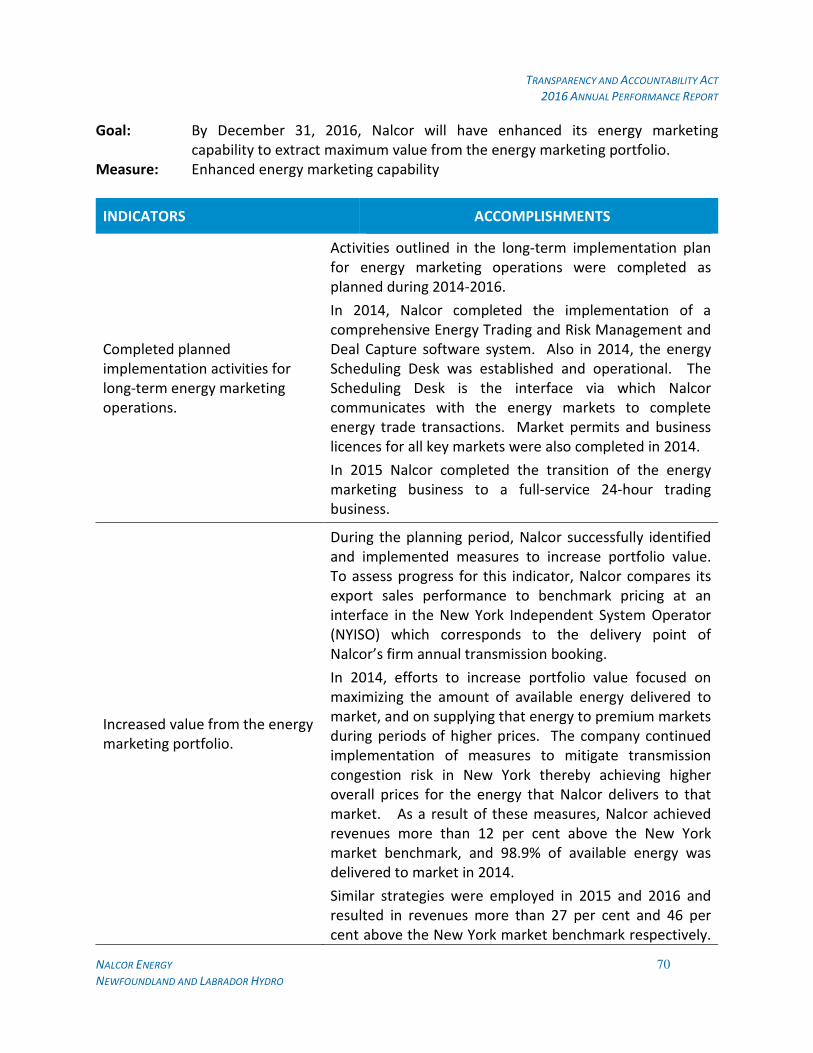
TRANSPARENCY AND ACCOUNTABILITY ACT
2016 ANNUAL PERFORMANCE REPORT
NALCOR ENERGY 70 NEWFOUNDLAND AND LABRADOR HYDRO
Goal: By December 31, 2016, Nalcor will have enhanced its energy marketing capability to extract maximum value from the energy marketing portfolio.
Measure: Enhanced energy marketing capability
INDICATORS ACCOMPLISHMENTS
Completed planned implementation activities for long-term energy marketing operations.
Activities outlined in the long-term implementation plan for energy marketing operations were completed as planned during 2014-2016.
In 2014, Nalcor completed the implementation of a comprehensive Energy Trading and Risk Management and Deal Capture software system. Also in 2014, the energy Scheduling Desk was established and operational. The Scheduling Desk is the interface via which Nalcor communicates with the energy markets to complete energy trade transactions. Market permits and business licences for all key markets were also completed in 2014.
In 2015 Nalcor completed the transition of the energy marketing business to a full-service 24-hour trading business.
Increased value from the energy marketing portfolio.
During the planning period, Nalcor successfully identified and implemented measures to increase portfolio value. To assess progress for this indicator, Nalcor compares its export sales performance to benchmark pricing at an interface in the New York Independent System Operator (NYISO) which corresponds to the delivery point of Nalcor’s firm annual transmission booking.
In 2014, efforts to increase portfolio value focused on maximizing the amount of available energy delivered to market, and on supplying that energy to premium markets during periods of higher prices. The company continued implementation of measures to mitigate transmission congestion risk in New York thereby achieving higher overall prices for the energy that Nalcor delivers to that market. As a result of these measures, Nalcor achieved revenues more than 12 per cent above the New York market benchmark, and 98.9% of available energy was delivered to market in 2014.
Similar strategies were employed in 2015 and 2016 and resulted in revenues more than 27 per cent and 46 per cent above the New York market benchmark respectively.

TRANSPARENCY AND ACCOUNTABILITY ACT
2016 ANNUAL PERFORMANCE REPORT
NALCOR ENERGY 71 NEWFOUNDLAND AND LABRADOR HYDRO
INDICATORS ACCOMPLISHMENTS
More than 99% of available energy was delivered to market in each of 2015 and 2016.
Objective: By December 31, 2016, Nalcor will have further advanced its long-term implementation plan for energy marketing operations and continued to pursue opportunities to increase the value of the current portfolio.
Measure 1: Pursued opportunities to increase portfolio value
INDICATORS 2016 ACCOMPLISHMENTS
Identified opportunities to maximize portfolio value such as targeting higher priced markets and times to exceed the energy price benchmark
During 2016, Nalcor successfully identified and implemented measures to maximize portfolio value. Efforts to increase portfolio value in 2016 focused on supplying energy to premium markets to capture higher prices resulting in revenues more than 46 percent, or $5.9 million, above the New York market benchmark.
Pursued activities to enhance access to premium markets
While New York remains a key market for energy deliveries as this is the delivery point for the key firm transmission path through Quebec, in 2016 Nalcor also gained access to transmission paths into the premium New England market resulting in increased participation in this market in 2016.
Measure 2: Advanced readiness for interconnection of Newfoundland and Labrador electricity system into the North American electricity market.
INDICATORS 2016 ACCOMPLISHMENTS
Completed planned activities to prepare for broader interconnection of Newfoundland and Labrador electricity system into the North American electricity market
In 2016, Nalcor Energy Marketing completed work related to Ready for Commercial Integration (RFCI) to obtain benefits from electricity markets following integration. Energy Marketing also assisted in drafting commercial arrangements that will be required once interconnection of the Provincial electricity system is complete.
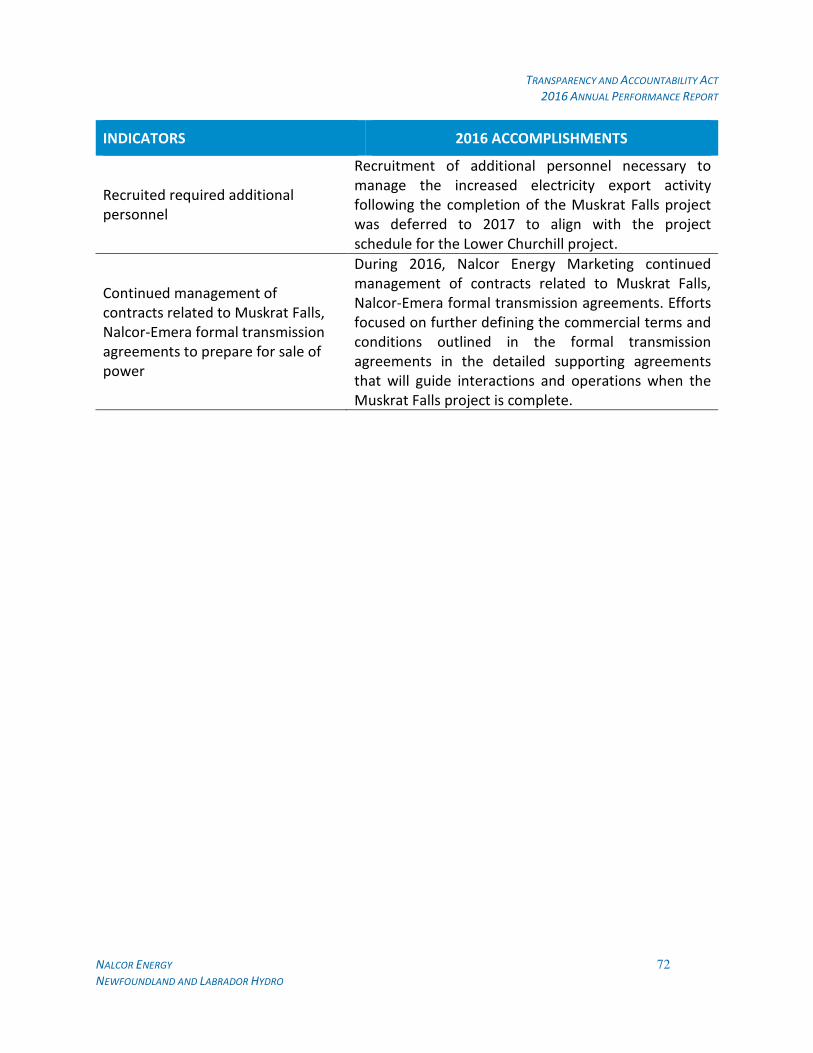
TRANSPARENCY AND ACCOUNTABILITY ACT
2016 ANNUAL PERFORMANCE REPORT
NALCOR ENERGY 72 NEWFOUNDLAND AND LABRADOR HYDRO
INDICATORS 2016 ACCOMPLISHMENTS
Recruited required additional personnel
Recruitment of additional personnel necessary to manage the increased electricity export activity following the completion of the Muskrat Falls project was deferred to 2017 to align with the project schedule for the Lower Churchill project.
Continued management of contracts related to Muskrat Falls, Nalcor-Emera formal transmission agreements to prepare for sale of power
During 2016, Nalcor Energy Marketing continued management of contracts related to Muskrat Falls, Nalcor-Emera formal transmission agreements. Efforts focused on further defining the commercial terms and conditions outlined in the formal transmission agreements in the detailed supporting agreements that will guide interactions and operations when the Muskrat Falls project is complete.
TRANSPARENCY AND ACCOUNTABILITY ACT
2016 ANNUAL PERFORMANCE REPORT
NALCOR ENERGY 73 NEWFOUNDLAND AND LABRADOR HYDRO
5 OPPORTUNITIES AND CHALLENGES
Implementing a new three-year strategic plan for 2017-19 will require that Nalcor and Hydro
build on accomplishments of the past and address future challenges and opportunities. The
issues for the next planning period are consistent with the issues presented in the 2014-2016
plan. The key challenges and opportunities that will be addressed reflect the next phase of
Nalcor and Hydro’s strategy execution in support of the Provincial Government’s energy sector
strategic directions.
Safety leadership
Nalcor and Hydro’s relentless commitment to safety drives all its lines of business. Achieving
excellence in safety is Nalcor’s number one priority and safety is also a shared core value. For
Nalcor and Hydro, safety excellence is more than a way of operating; it is an integral part of the
companies’ strategy for the future. Achieving and maintaining excellent safety performance in
all areas of the company is an ongoing challenge. During the planning period, Nalcor and Hydro
will continue to implement initiatives to move forward on the journey to safety excellence.
Electricity supply
Nalcor’s subsidiary, Hydro, ensures there is a safe, reliable and cost-effective electricity supply
available to meet current demand and future growth. During the 2017-2019 planning period,
Hydro will increase investment to renew aging assets and will implement programs to support
safety and environmental sustainability. Hydro will also develop a multi-year strategy to
prepare for the timely and effective integration of all aspects of Muskrat Falls into the
provincial electricity system.
Upper Churchill asset management and Power Contract legal actions
The Churchill Falls generating station is one of the largest underground hydroelectric
powerhouses in the world. The generating plant and related infrastructure have been in service
for over 45 years and during the next planning period. Taking steps to ensure the continued
performance of the Churchill Falls facilities through planning and strategic investment will drive
the company’s strategy for the current planning period and beyond. Over the coming planning
period, Churchill Falls will also continue to advance Upper Churchill power contract legal
actions.

TRANSPARENCY AND ACCOUNTABILITY ACT
2016 ANNUAL PERFORMANCE REPORT
NALCOR ENERGY 74 NEWFOUNDLAND AND LABRADOR HYDRO
Oil and gas interests, exploration and development
Nalcor’s subsidiary, Nalcor Energy – Oil and Gas, currently manages oil and gas interests in
three developments offshore Newfoundland and Labrador. Nalcor has also developed a multi-
year exploration strategy to encourage more exploration and drilling by international
exploration and production companies. During 2017-2019, Nalcor will continue to support
partners’ efforts to advance offshore project milestones and further enhance knowledge of the
province’s oil and gas resource potential.
Lower Churchill development
The lower Churchill River is one of the most attractive undeveloped hydroelectric resources in
North America. The two sites at Muskrat Falls and Gull Island have a combined capacity of over
3,000 MW. The Muskrat Falls Project includes construction of an 824 MW hydroelectric dam
and more than 1,500 kilometres of transmission lines. During the 2017-2019 planning period,
Nalcor will continue to advance Muskrat Falls construction and progress Gull Island consistent
with progress on market opportunities.
Bull Arm Fabrication site long-term strategy and lease management
The Bull Arm Fabrication site is a fabrication facility with facilities for steel fabrication and
concrete construction, outfitting installation, at-shore hookup and deepwater commissioning.
The site is leased by ExxonMobil Canada Properties for the Hebron project until 2017. Over the
2017-2019 planning period, Nalcor will advance engagement and evaluation activities for the
Bull Arm Fabrication site, advance long-term operations plan for the site to ensure optimized
asset integrity, and continue lease monitoring activities.
Energy marketing portfolio management and long-term strategy
Nalcor’s energy marketing portfolio currently includes Churchill Falls recall power that is surplus
to Newfoundland and Labrador’s needs. This portfolio will continue to grow with the
development of the lower Churchill River hydroelectric resource and increased production from
Nalcor’s oil and gas interests. Over the 2017-2019 planning period, Nalcor will advance its
implementation plan for energy marketing operations and continue to pursue opportunities to
increase the value of its portfolio.

TRANSPARENCY AND ACCOUNTABILITY ACT
2016 ANNUAL PERFORMANCE REPORT

TRANSPARENCY AND ACCOUNTABILITY ACT
2016 ANNUAL PERFORMANCE REPORT
Appendix 1
Energy Portfolio

2015 BUSINESS AND FINANCIAL REPORT 145
Hydroelectric Generation Station
Thermal Plant/Combustion Turbine
Diesel Plant
Wind Generation
Offshore Oil Projects
Industrial Fabrication Site
Diesel Plant operated on behalf of Mushuau Innu First Nation
OPERATED UNDER LICENCE FROM THE GOVERNMENT OF NEWFOUNDLAND AND LABRADOR
POWER PURCHASE AGREEMENT
ENERGY PORTFOLIO
LEGEND
PPA

TRANSPARENCY AND ACCOUNTABILITY ACT
2016 ANNUAL PERFORMANCE REPORT
Appendix 2
Nalcor Energy Consolidated Financial Statements
NALCOR ENERGY CONSOLIDATED FINANCIAL STATEMENTS
December 31, 2016

Deloitte LLP 5 Springdale Street Suite 1000 St. John’s, NL A1E 0E4 Canada
Tel: (709) 576-8480 Fax: (709) 576-8460 www.deloitte.ca
Independent Auditor’s Report
To the Lieutenant-Governor in Council, Province of Newfoundland and Labrador
We have audited the accompanying consolidated financial statements of Nalcor Energy, which comprise the consolidated statement of financial position as at December 31, 2016, and the consolidated statements of profit (loss) and comprehensive income (loss), changes in equity and cash flows for the year then ended, and a summary of significant accounting policies and other explanatory information.
Managements Responsibility for the Consolidated Financial Statements Management is responsible for the preparation and fair presentation of these consolidated financial statements in accordance with International Financial Reporting Standards, and for such internal control as management determines is necessary to enable the preparation of consolidated financial statements that are free from material misstatement, whether due to fraud or error.
Auditor’s Responsibility Our responsibility is to express an opinion on these consolidated financial statements based on our audit. We conducted our audit in accordance with Canadian generally accepted auditing standards. Those standards require that we comply with ethical requirements and plan and perform the audit to obtain reasonable assurance about whether the consolidated financial statements are free from material misstatement.
An audit involves performing procedures to obtain audit evidence about the amounts and disclosures in the consolidated financial statements. The procedures selected depend on the auditor's judgment, including the assessment of the risks of material misstatement of the consolidated financial statements, whether due to fraud or error. In making those risk assessments, the auditor considers internal control relevant to the entity's preparation and fair presentation of the consolidated financial statements in order to design audit procedures that are appropriate in the circumstances, but not for the purpose of expressing an opinion on the effectiveness of the entity's internal control. An audit also includes evaluating the appropriateness of accounting policies used and the reasonableness of accounting estimates made by management, as well as evaluating the overall presentation of the consolidated financial statements.
We believe that the audit evidence we have obtained is sufficient and appropriate to provide a basis for our audit opinion.
Opinion In our opinion, the consolidated financial statements present fairly, in all material respects, the financial position of Nalcor Energy as at December 31, 2016 and its financial performance and cash flows for the year then ended in accordance with International Financial Reporting Standards.
Emphasis of Matter Without modifying our opinion, we draw attention to Note 35 to the financial statements, which explains that certain comparative information for the year ended December 31, 2015 has been restated.
Chartered Professional Accountants March 7, 2017
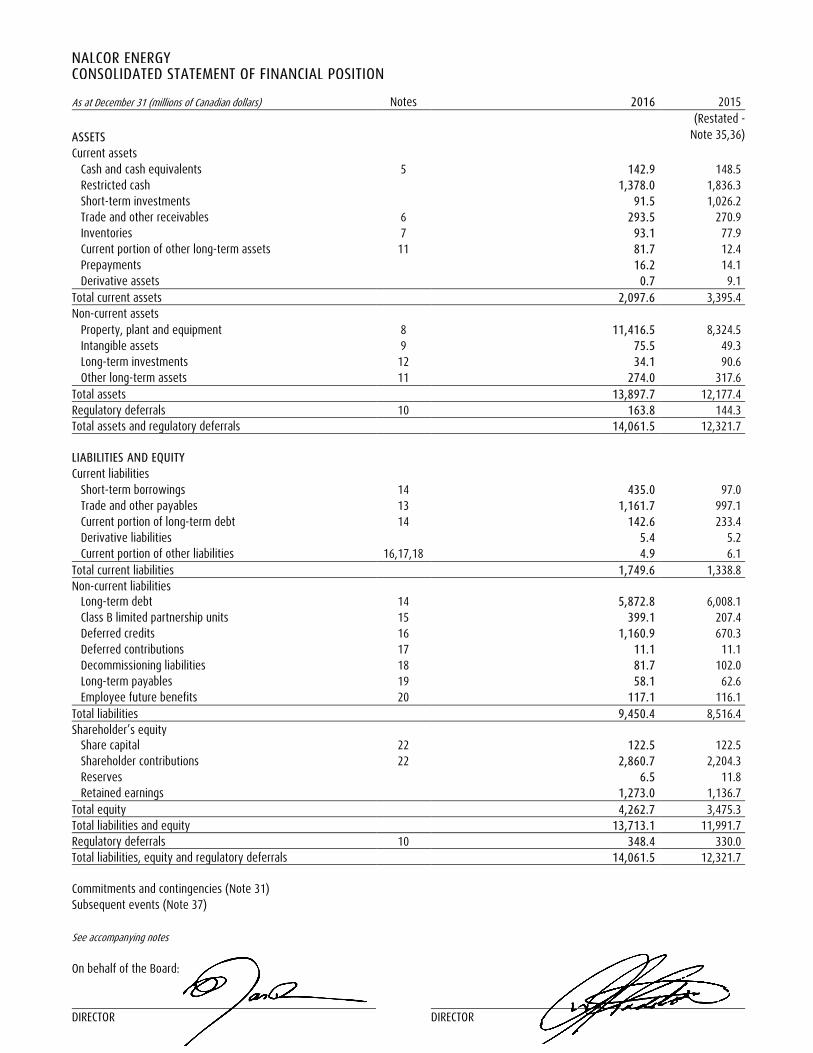
NALCOR ENERGYCONSOLIDATED STATEMENT OF FINANCIAL POSITION
As at December 31 (millions of Canadian dollars) Notes 2016 2015 (Restated -
Note 35,36) ASSETS Current assets
Cash and cash equivalents 5 142.9 148.5 Restricted cash 1,378.0 1,836.3 Short-term investments 91.5 1,026.2 Trade and other receivables 6 293.5 270.9 Inventories 7 93.1 77.9 Current portion of other long-term assets 11 81.7 12.4 Prepayments 16.2 14.1 Derivative assets 0.7 9.1
Total current assets 2,097.6 3,395.4 Non-current assets
Property, plant and equipment 8 11,416.5 8,324.5 Intangible assets 9 75.5 49.3 Long-term investments 12 34.1 90.6 Other long-term assets 11 274.0 317.6
Total assets 13,897.7 12,177.4 Regulatory deferrals 10 163.8 144.3 Total assets and regulatory deferrals 14,061.5 12,321.7
LIABILITIES AND EQUITY Current liabilities
Short-term borrowings 14 435.0 97.0 Trade and other payables 13 1,161.7 997.1 Current portion of long-term debt 14 142.6 233.4 Derivative liabilities 5.4 5.2 Current portion of other liabilities 16,17,18 4.9 6.1
Total current liabilities 1,749.6 1,338.8 Non-current liabilities
Long-term debt 14 5,872.8 6,008.1 Class B limited partnership units 15 399.1 207.4 Deferred credits 16 1,160.9 670.3 Deferred contributions 17 11.1 11.1 Decommissioning liabilities 18 81.7 102.0 Long-term payables 19 58.1 62.6 Employee future benefits 20 117.1 116.1
Total liabilities 9,450.4 8,516.4 Shareholder’s equity
Share capital 22 122.5 122.5 Shareholder contributions 22 2,860.7 2,204.3 Reserves 6.5 11.8 Retained earnings 1,273.0 1,136.7
Total equity 4,262.7 3,475.3 Total liabilities and equity 13,713.1 11,991.7 Regulatory deferrals 10 348.4 330.0 Total liabilities, equity and regulatory deferrals 14,061.5 12,321.7
Commitments and contingencies (Note 31) Subsequent events (Note 37)
See accompanying notes
On behalf of the Board:
DIRECTOR DIRECTOR
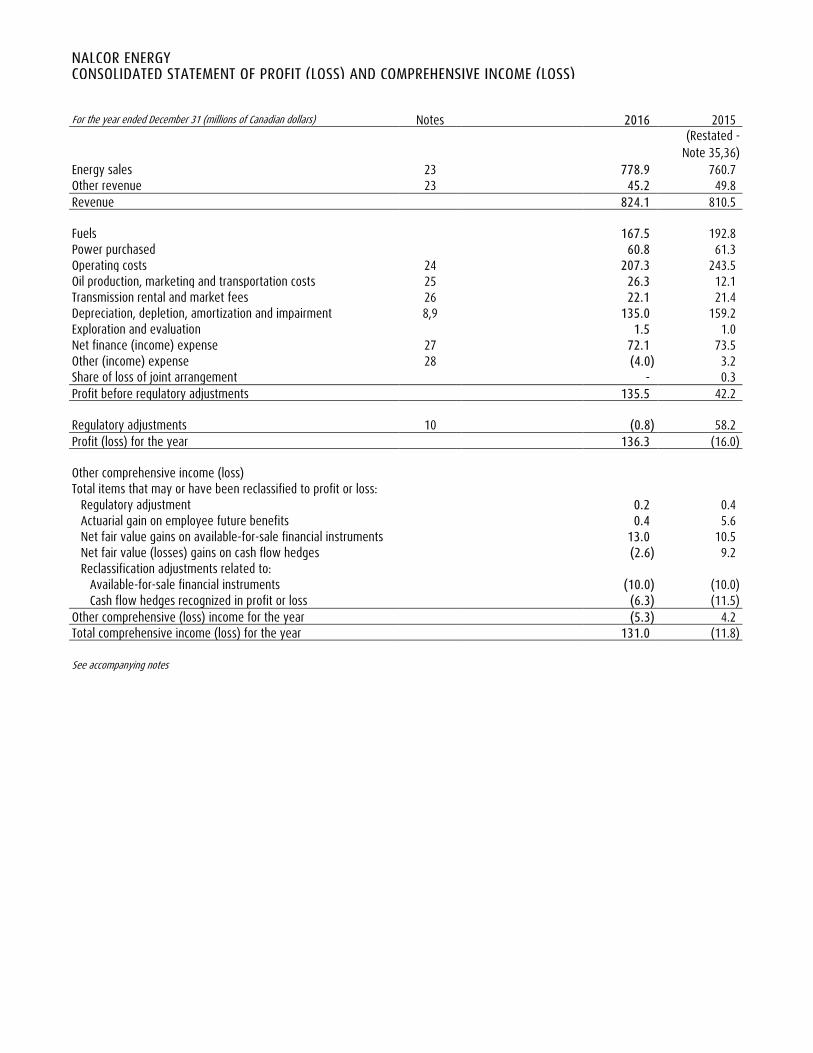
NALCOR ENERGY CONSOLIDATED STATEMENT OF PROFIT (LOSS) AND COMPREHENSIVE INCOME (LOSS) For the year ended December 31 (millions of Canadian dollars) Notes 2016 2015
(Restated -
Note 35,36) Energy sales 23 778.9 760.7 Other revenue 23 45.2 49.8 Revenue 824.1 810.5 Fuels 167.5 192.8 Power purchased 60.8 61.3 Operating costs 24 207.3 243.5 Oil production, marketing and transportation costs 25 26.3 12.1 Transmission rental and market fees 26 22.1 21.4 Depreciation, depletion, amortization and impairment 8,9 135.0 159.2 Exploration and evaluation 1.5 1.0 Net finance (income) expense 27 72.1 73.5 Other (income) expense 28 (4.0) 3.2 Share of loss of joint arrangement - 0.3 Profit before regulatory adjustments 135.5 42.2 Regulatory adjustments 10 (0.8) 58.2 Profit (loss) for the year 136.3 (16.0) Other comprehensive income (loss) Total items that may or have been reclassified to profit or loss:
Regulatory adjustment 0.2 0.4 Actuarial gain on employee future benefits 0.4 5.6 Net fair value gains on available-for-sale financial instruments 13.0 10.5 Net fair value (losses) gains on cash flow hedges (2.6) 9.2 Reclassification adjustments related to:
Available-for-sale financial instruments (10.0) (10.0) Cash flow hedges recognized in profit or loss (6.3) (11.5)
Other comprehensive (loss) income for the year (5.3) 4.2 Total comprehensive income (loss) for the year 131.0 (11.8) See accompanying notes

NALCOR ENERGY CONSOLIDATED STATEMENT OF CHANGES IN EQUITY Employee Share Shareholder Fair Value Benefit Retained (millions of Canadian dollars) Notes Capital Contributions Reserve Reserve Earnings Total Balance at January 1, 2016 122.5 2,204.3 38.7 (26.9) 1,136.7 3,475.3 Profit for the year - - - - 136.3 136.3 Other comprehensive income
Net change in fair value of available-for-sale financial instruments 21 - - 13.0 - - 13.0 Net change in fair value of cash flow hedges 21 - - (2.6) - - (2.6) Net change in fair value of financial instruments reclassified to profit or loss 21 - - (16.3) - - (16.3) Actuarial gain on employee future benefits 20,21 - - - 0.4 - 0.4 Regulatory adjustment 10,21 - - - 0.2 - 0.2
Total comprehensive (loss) income for the year - - (5.9) 0.6 136.3 131.0 Shareholder contributions 22 - 656.4 - - - 656.4 Balance at December 31, 2016 122.5 2,860.7 32.8 (26.3) 1,273.0 4,262.7 (Restated -
Note 35) Balance at January 1, 2015 122.5 1,469.6 40.5 (32.9) 1,152.7 2,752.4 Loss for the year - - - - (16.0) (16.0) Other comprehensive income
Net change in fair value of available-for-sale financial instruments 21 - - 10.5 - - 10.5 Net change in fair value of cash flow hedges 21 - - 9.2 - - 9.2 Net change in fair value of financial instruments reclassified to profit or loss 21 - - (21.5) - - (21.5) Actuarial gain on employee future benefits 20,21 - - - 5.6 - 5.6 Regulatory adjustment 10,21 - - - 0.4 - 0.4
Total comprehensive (loss) income for the year - - (1.8) 6.0 (16.0) (11.8) Shareholder contributions 22 - 734.7 - - - 734.7 Balance at December 31, 2015 122.5 2,204.3 38.7 (26.9) 1,136.7 3,475.3 See accompanying notes
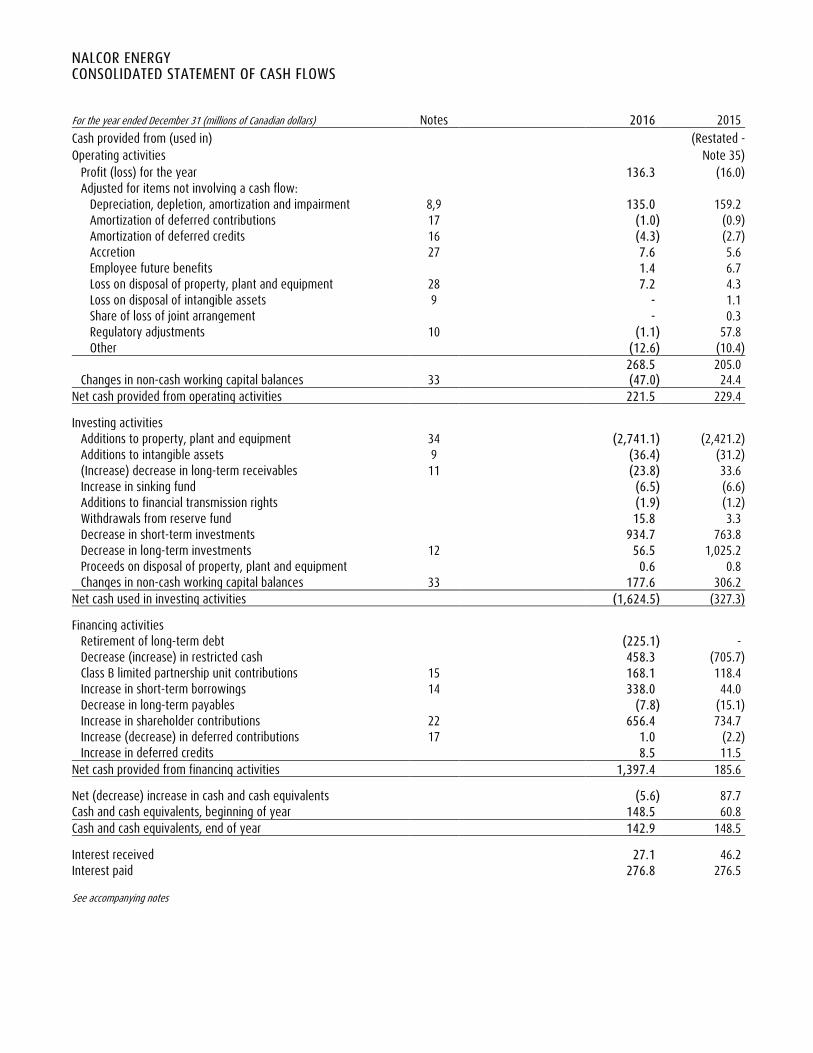
NALCOR ENERGY CONSOLIDATED STATEMENT OF CASH FLOWS For the year ended December 31 (millions of Canadian dollars) Notes 2016 2015 Cash provided from (used in) (Restated -
Note 35) Operating activities Profit (loss) for the year 136.3 (16.0) Adjusted for items not involving a cash flow:
Depreciation, depletion, amortization and impairment 8,9 135.0 159.2 Amortization of deferred contributions 17 (1.0) (0.9) Amortization of deferred credits 16 (4.3) (2.7) Accretion 27 7.6 5.6 Employee future benefits 1.4 6.7 Loss on disposal of property, plant and equipment 28 7.2 4.3 Loss on disposal of intangible assets 9 - 1.1 Share of loss of joint arrangement - 0.3 Regulatory adjustments 10 (1.1) 57.8 Other (12.6) (10.4)
268.5 205.0 Changes in non-cash working capital balances 33 (47.0) 24.4
Net cash provided from operating activities 221.5 229.4 Investing activities
Additions to property, plant and equipment 34 (2,741.1) (2,421.2) Additions to intangible assets 9 (36.4) (31.2) (Increase) decrease in long-term receivables 11 (23.8) 33.6 Increase in sinking fund (6.5) (6.6) Additions to financial transmission rights (1.9) (1.2) Withdrawals from reserve fund 15.8 3.3 Decrease in short-term investments 934.7 763.8 Decrease in long-term investments 12 56.5 1,025.2 Proceeds on disposal of property, plant and equipment 0.6 0.8 Changes in non-cash working capital balances 33 177.6 306.2
Net cash used in investing activities (1,624.5) (327.3) Financing activities
Retirement of long-term debt (225.1) - Decrease (increase) in restricted cash 458.3 (705.7) Class B limited partnership unit contributions 15 168.1 118.4 Increase in short-term borrowings 14 338.0 44.0 Decrease in long-term payables (7.8) (15.1) Increase in shareholder contributions 22 656.4 734.7 Increase (decrease) in deferred contributions 17 1.0 (2.2) Increase in deferred credits 8.5 11.5
Net cash provided from financing activities 1,397.4 185.6 Net (decrease) increase in cash and cash equivalents (5.6) 87.7 Cash and cash equivalents, beginning of year 148.5 60.8 Cash and cash equivalents, end of year 142.9 148.5 Interest received 27.1 46.2 Interest paid 276.8 276.5 See accompanying notes

NALCOR ENERGY NOTES TO THE CONSOLIDATED FINANCIAL STATEMENTS 1. DESCRIPTION OF BUSINESS
Nalcor Energy (Nalcor or the Company) is incorporated under a special act of the Legislature of the Province of Newfoundland and Labrador (the Province) as a Crown corporation and its business includes the development, generation, transmission and sale of electricity, oil and gas, industrial fabrication and energy marketing. Nalcor’s head office is located at 500 Columbus Drive in St. John’s, Newfoundland and Labrador A1B 0C9, Canada.
1.1 Subsidiaries
Nalcor holds interests in the following subsidiaries: A 100% interest in Newfoundland and Labrador Hydro (Hydro), whose principal activity is the generation, transmission and sale of electricity. Hydro’s operations include both regulated and non-regulated activities. A 100% interest in Nalcor Energy – Oil and Gas Inc. (Oil and Gas). Oil and Gas has a mandate to engage in the upstream and downstream sectors of the oil and gas industry. Upstream includes exploration, development, and production activities, while downstream includes transportation and processing activities. A 100% interest in Nalcor Energy – Bull Arm Fabrication Inc. (Bull Arm Fabrication), an industrial fabrication site with a fully integrated infrastructure to support large-scale fabrication and assembly. Its facilities include onshore fabrication halls and shops, a dry-dock and a deep water site. A 100% interest in Nalcor Energy Marketing Corporation (Energy Marketing), a subsidiary established to market Nalcor’s energy throughout North America. A 100% interest in Muskrat Falls Corporation (Muskrat Falls), created to develop, construct, finance and operate the Muskrat Falls plant, an 824 megawatt (MW) hydroelectric generating facility in Labrador. A 100% interest in Labrador Transmission Corporation (Labrador Transco), created to develop, construct, finance and operate transmission assets connecting the Muskrat Falls plant to the existing hydroelectric generating facility in Churchill Falls.
A 100% interest in Labrador-Island Link General Partner Corporation (LIL GP) and Labrador-Island Link Holding Corporation (LIL Holdco), created to control, manage and hold Nalcor’s 65.0% interest in the Labrador-Island Link Limited Partnership (LIL LP). A 100% interest in Labrador-Island Link Operating Corporation (LIL Opco), created to operate and maintain the Labrador-Island Link (LIL). A 100% interest in Lower Churchill Management Corporation (LCMC), created to carry out the project development and management functions for Phase 1 of the Lower Churchill Project (LCP) including planning, engineering and design management, construction management, risk management, finance, procurement and supply chain management.
A limited partnership interest in the LIL LP, created to develop, construct, finance and operate the assets and property constituting the LIL, a transmission link to be constructed between the Muskrat Falls plant and the Newfoundland and Labrador Island Interconnected System. LIL Holdco holds 100% of the Class A and Class C limited partnership units. Nalcor also holds a 100% interest in Gull Island Power Corporation (GIPCo) and a 51.0% interest in Lower Churchill Development Corporation (LCDC), both of which are inactive.
1.2 Investment in Joint Arrangement
Nalcor holds a 65.8% beneficial interest (through Hydro) in Churchill Falls (Labrador) Corporation Limited (Churchill Falls), a joint operation that owns and operates a hydroelectric generating plant and related transmission facilities situated in Labrador with a rated capacity of 5,428 MW.
1

NALCOR ENERGYNOTES TO THE CONSOLIDATED FINANCIAL STATEMENTS
Nalcor holds a 33.33% beneficial interest (through Churchill Falls) in Twin Falls Power Corporation (Twin Falls).
1.3 Special Purpose Entities Nalcor consolidates the results of special purpose entities (SPEs) in which it holds a financial interest and is the primary beneficiary. Nalcor has determined that it is the primary beneficiary of the LIL Construction Project Trust (Project Trust) and as a result has included the financial statements of the Project Trust in these annual audited consolidated financial statements. Nalcor has determined that it is not the primary beneficiary of the Muskrat Falls/Labrador Transmission Assets (MF/LTA) Funding Trust or the LIL Funding Trust and therefore the operations of these trusts are not reflected in these financial statements.
2. SIGNIFICANT ACCOUNTING POLICIES
2.1 Statement of Compliance and Basis of Measurement These annual audited consolidated financial statements have been prepared in accordance with International Financial Reporting Standards (IFRS), as issued by the International Accounting Standards Board (IASB). Nalcor has adopted accounting policies which are based on the IFRS applicable as at December 31, 2016 and includes individual IFRS, International Accounting Standards (IAS), and interpretations made by the IFRS Interpretations Committee and the Standing Interpretations Committee.
These annual audited consolidated financial statements have been prepared on a historical cost basis, except for financial instruments at fair value through profit or loss (FVTPL) and available-for-sale (AFS) which have been measured at fair value. The annual audited consolidated financial statements are presented in Canadian Dollars (CAD) and all values rounded to the nearest million, except when otherwise noted. The annual audited consolidated financial statements were approved by Nalcor’s Board of Directors (the Board) on March 6, 2017.
2.2 Basis of Consolidation The annual audited consolidated financial statements include the financial statements of Nalcor, its subsidiary companies and its share of investments in joint arrangements. In addition, the financial statements of all SPEs, for which Nalcor has been determined the primary beneficiary, are included in these annual audited consolidated financial statements. Intercompany transactions and balances have been eliminated upon consolidation.
Effective June 18, 1999, Hydro, Churchill Falls, and Hydro-Québec entered into a shareholders’ agreement (the Shareholders’ Agreement) which provided, among other matters, that certain of the strategic operating, financing and investing policies of Churchill Falls be subject to approval jointly by representatives of Hydro and Hydro-Québec on Churchill Falls’ Board of Directors. Although Hydro holds a 65.8% ownership interest, the agreement changed the nature of the relationship between Hydro and Hydro-Québec, with respect to Churchill Falls, from that of majority and minority shareholders, respectively, to that of a joint operation. Accordingly, Hydro has recognized its share of assets, liabilities and profit or loss in relation to its interest in Churchill Falls subsequent to the effective date of the Shareholders’ Agreement.
Churchill Falls investment in Twin Falls is accounted for using the equity method.
Substantially all of Oil and Gas’ activities are conducted jointly with others and, accordingly, these annual audited consolidated financial statements reflect only Nalcor’s proportionate interest in such activities.
2.3 Cash and Cash Equivalents and Short-term Investments Cash and cash equivalents consist of amounts on deposit with a Schedule 1 Canadian Chartered bank, as well as highly liquid investments with maturities of three months or less. Investments with maturities greater than three months and less than twelve months are classified as short‐term investments. Cash and cash equivalents are measured at cost which approximates fair value, while short‐term investments are measured at fair value.
2.4 Restricted Cash Restricted cash consists of cash held on deposit with Schedule 1 Canadian Chartered banks and administered by the Collateral
2

NALCOR ENERGYNOTES TO THE CONSOLIDATED FINANCIAL STATEMENTS
Agent for the sole purpose of funding construction costs related to the LIL, Labrador Transmission Assets (LTA) and Muskrat Falls’ hydroelectric plant, including pre-funded equity requirements required under the Labrador-Island Link Limited Project Finance Agreement (LIL PFA) and MF/LTA Project Finance Agreement (MF/LTA PFA). The Project draws funds from these accounts in accordance with procedures set out in the LIL PFA and MF/LTA PFA. Restricted cash also includes accounts administered by the Trustee of the Project Trust which are associated with the establishment of the Project Trust. Restricted cash is measured at cost which approximates fair value.
2.5 Trade and Other Receivables Trade and other receivables are classified as loans and receivables and are measured at amortized cost using the effective interest method.
2.6 Inventories Inventories are carried at the lower of cost and net realizable value. Cost is determined on a weighted average basis and includes expenditures incurred in acquiring the inventories and bringing them to their existing condition and location. Net realizable value represents the estimated selling price for inventories less all estimated costs of completion and costs necessary to make the sale.
2.7 Property, Plant and Equipment Items of property, plant and equipment are recognized using the cost model and thus are recorded at cost less accumulated depreciation and accumulated impairment losses. Cost includes materials, labour, contracted services, professional fees and, for qualifying assets, borrowing costs capitalized in accordance with Nalcor’s accounting policy outlined in Note 2.11. Costs capitalized with the related asset include all those costs directly attributable to bringing the asset into operation. When significant parts of property, plant and equipment are required to be replaced at intervals, Nalcor recognizes such parts as individual assets with specific useful lives and depreciation rates, respectively. Likewise, when a major inspection is performed, its cost is recognized in the carrying amount of the plant and equipment as a replacement if the recognition criteria are satisfied. All other repairs and maintenance costs are recognized in profit or loss as incurred. Property, plant and equipment is not revalued for financial reporting purposes. Depreciation of these assets commences when the assets are ready for their intended use.
Hydro Depreciation is calculated on a straight-line basis over the estimated useful lives of the assets as follows:
Generation plant Hydroelectric 45 to 100 years
Thermal 35 to 65 years Diesel 25 to 55 years Transmission
Lines 30 to 65 years Terminal stations 40 to 55 years Distribution system 30 to 55 years Other assets 5 to 55 years
Hydroelectric generation plant includes the powerhouse, turbines, governors and generators, as well as water conveying and control structures, including dams, dikes, tailrace, penstock and intake structures. Thermal generation plant is comprised of the powerhouse, turbines and generators, boilers, oil storage tanks, stacks, and auxiliary systems. Diesel generation plant includes the buildings, engines, generators, switchgear, fuel storage and transfer systems, dikes and liners and cooling systems.
Transmission lines include the support structures, foundations and insulators associated with lines at voltages of 230, 138 and 69 kilovolt (kV). Terminal stations assets are used to step up voltages of electricity and to step down voltages for distribution. Distribution system assets include poles, transformers, insulators, and conductors.
Other assets include telecontrol, buildings, vehicles, furniture, tools and equipment.
3

NALCOR ENERGY NOTES TO THE CONSOLIDATED FINANCIAL STATEMENTS
Churchill Falls Depreciation is calculated on a straight-line basis over the estimated useful lives of the assets as follows: Hydroelectric generation plant 40 to 100 years Transmission and terminals 30 to 65 years Service facilities and other 5 to 45 years Hydro and Churchill Falls assets’ residual values, useful lives and method of depreciation are reviewed at each financial year end and adjusted prospectively, if appropriate. The carrying value of property, plant and equipment is reviewed for impairment whenever events indicate that the carrying amounts of those assets may not be recoverable. Oil and Gas (i) Development and Production Costs
Items of property, plant and equipment, which include petroleum and natural gas development and production assets, are carried at cost less accumulated depreciation, depletion and impairment. Development and production assets are grouped into cash-generating units (CGUs) for impairment testing.
Expenditures on the construction, installation or completion of infrastructure facilities such as processing facilities and the drilling of development wells, including unsuccessful development or delineation wells, are capitalized within property, plant and equipment, as long as it is technically feasible and economically viable to extract identified reserves.
The initial cost of an asset comprises its purchase price or construction cost, any costs directly attributable to bringing the asset into operation, the initial estimate of the decommissioning costs and, for qualifying assets, borrowing costs. The purchase price or constructed cost is the aggregate amount paid and the fair value of any other consideration given to acquire the asset. Capitalized petroleum and natural gas interests generally represent costs incurred in developing proved and/or probable reserves and bringing in or enhancing production from such reserves, and are accumulated on a field or geotechnical area basis. Gains and losses on disposal of an item of property, plant and equipment, including petroleum and natural gas interests, are determined by comparing the proceeds from disposal with the carrying amount of property, plant and equipment and are recorded in other (income) expense.
(ii) Subsequent Costs
Costs incurred subsequent to the determination of technical feasibility and commercial viability are included in the asset’s carrying amount or recognized as a separate asset, as appropriate, only when it is probable that future economic benefits associated with the asset will flow to Oil and Gas and the cost can be measured reliably. The carrying amount of a replaced asset is derecognized when replaced. Routine repairs and maintenance costs are charged to profit or loss during the period in which they are incurred.
(iii) Depletion The net carrying value of development and production assets is depleted using the unit of production method by reference to the ratio of production in the year to the related proved and probable reserves, and considering estimated future development costs necessary to bring those reserves into production. Future development costs are estimated taking into account the level of development required to produce the reserves. These estimates are reviewed by independent reserve engineers at least annually.
Proved and probable reserves are estimated using independent reserve engineer reports and represent the estimated quantities of crude oil, natural gas and natural gas liquids which geological, geophysical and engineering data demonstrate,
4
NALCOR ENERGY NOTES TO THE CONSOLIDATED FINANCIAL STATEMENTS
with a specified degree of certainty, to be recoverable in future years from known reservoirs and which are considered commercially viable. It is equally likely that the actual remaining quantities recovered will be greater or less than the sum of the estimated proved plus probable reserves.
Such reserves may be considered commercially producible if management has the intention of developing and producing them and such intention is based upon: • a reasonable assessment of the future economics of such production; • a reasonable expectation that there is a market for all (or substantially all) the expected petroleum and natural gas
production; and • evidence that the necessary production, transmission and transportation facilities are available or can be made
available. (iv) Other Assets
Office equipment and computer hardware are carried at cost less accumulated depreciation. Depreciation is recognized in profit or loss on a straight-line basis over the estimated useful life of 5 to 20 years. Depreciation methods, useful lives and residual values are reviewed at each reporting date.
Lower Churchill Project Amortization is calculated on a straight-line basis over the estimated useful lives of the assets as follows: Project support assets 4 to 7 years
2.8 Exploration and Evaluation Assets
Pre-license exploration and evaluation costs are recognized in profit or loss as incurred. Costs of exploring for and evaluating licensed petroleum and gas properties are capitalized and the resulting intangible exploration and evaluation assets are tested for impairment in accordance with IFRS 6 and IAS 36. Exploration and evaluation costs related to each license/prospect are initially capitalized with “Exploration and Evaluation Assets”. Such exploration and evaluation costs may include costs of license acquisition, technical services and studies, exploration drilling and testing, directly attributable overhead and administrative expenses and the projected costs of retiring the assets. General prospecting or evaluation costs incurred prior to having obtained the legal rights to explore an area are expensed directly to profit or loss as they are incurred. Exploration and evaluation assets are not depleted and are carried forward until technical feasibility and commercial viability of extracting a mineral resource is considered to be determined. The technical feasibility and commercial viability of extracting a mineral resource is considered to be determined when proved reserves are determined to exist. A review of each exploration license or field is carried out, at least annually, to ascertain whether proved reserves have been discovered. Upon determination of proved reserves, exploration and evaluation assets attributable to those reserves are first tested for impairment and then reclassified from exploration and evaluation assets to property, plant and equipment.
2.9 Investment Property Investment property is property held for the purpose of generating rental income or capital appreciation, but not for sale in the ordinary course of business, use in the production or supply of goods or services or for administrative purposes. As at December 31, 2016, investment property included the Bull Arm Fabrication site and facilities. Investment property is recognized using the cost model and thus is recorded at cost less accumulated depreciation and accumulated impairment losses. Cost includes materials, labour, contracted services and professional fees. Costs capitalized with the related asset include all those costs directly attributable to bringing the asset into operation. When significant parts of investment property are required to be replaced at intervals, Bull Arm Fabrication recognizes such parts as individual assets with
5
NALCOR ENERGY NOTES TO THE CONSOLIDATED FINANCIAL STATEMENTS
specific useful lives and depreciation, respectively. Likewise, when a major inspection is performed, its cost is recognized in the carrying amount of the investment property as a replacement if the recognition criteria are satisfied. All other repair and maintenance costs are recognized in the Consolidated Statement of Profit and Comprehensive Income as incurred. Investment property is not revalued for financial reporting purposes. Depreciation of these assets commences when the assets are ready for their intended use. Depreciation is calculated on a straight-line basis over the estimated useful lives of the assets as follows: Computer equipment, vehicles and office equipment 5 years Buildings 18 years Topsides module hall door 26 years Visitor center 42 years The assets’ residual values, useful lives and method of depreciation are reviewed at each financial year end and adjusted prospectively, if appropriate. The carrying value of investment property is reviewed for impairment whenever events indicate that the carrying amounts of those assets may not be recoverable.
2.10 Intangible Assets Intangible assets that are expected to generate future economic benefit and are measurable, including computer software costs, costs of technical services, feasibility studies, exploration assets and intellectual property are capitalized as intangible assets in accordance with IAS 38. Intangible assets with finite useful lives are carried at cost less accumulated amortization and accumulated impairment losses. The estimated useful life and amortization method are reviewed at the end of each year, with the effect of any changes in estimate being accounted for on a prospective basis. Intangible assets with indefinite useful lives are carried at cost less accumulated impairment losses. Amortization is calculated on a straight-line basis over the estimated useful lives of the assets as follows: Computer software 5 to 10 years Feasibility studies 5 to 20 years Seismic data acquisitions 6 years
2.11 Borrowing Costs Borrowing costs directly attributable to the acquisition, construction or production of qualifying assets, which are assets that take a substantial period of time to get ready for their intended use or sale, are added to the cost of those assets, until such time as the assets are substantially ready for their intended use or sale. Investment income earned on the temporary investment of specific borrowings pending their expenditure on qualifying assets is deducted from the borrowing costs eligible for capitalization. All other borrowing costs are recognized in the Consolidated Statement of Profit and Comprehensive Income in the period in which they are incurred.
2.12 Impairment of Non-Financial Assets At the end of each reporting period, Nalcor reviews the carrying amounts of its non-financial assets, except for exploration and evaluation assets, to determine whether there is any indication that those assets may be impaired. If any such indication exists, the recoverable amount of the asset is estimated in order to determine the extent of the impairment loss, if any. Exploration and evaluation assets are assessed for impairment when they are reclassified to plant, property and equipment and also if there are indicators that suggest that the carrying amount exceeds the recoverable amount. Where it is not possible to estimate the recoverable amount of an individual asset, Nalcor estimates the recoverable amount of the CGU to which the asset belongs. Where a reasonable and consistent basis of allocation can be identified, corporate assets are
6

NALCOR ENERGY NOTES TO THE CONSOLIDATED FINANCIAL STATEMENTS
also allocated to individual CGUs, or otherwise they are allocated to the smallest group of CGUs for which a reasonable and consistent allocation basis can be identified. The recoverable amount is the higher of fair value less costs of disposal and value in use. In assessing value in use, the estimated future cash flows are discounted to their present value using a discount rate that reflects current market assessments of the time value of money and the risks specific to the asset for which the estimates of future cash flows have not been adjusted. Value in use is generally computed by reference to the present value of future cash flows expected to be derived from non-financial assets. Exploration and evaluation assets are allocated to the CGUs on a project basis when they are assessed for impairment, both at the time of any triggering facts and circumstances as well as upon their reclassification to property, plant and equipment. If the recoverable amount of an asset or CGU is estimated to be less than its carrying amount, the carrying amount of the asset or CGU is reduced to its recoverable amount. An impairment loss is recognized immediately in the Consolidated Statement of Profit and Comprehensive Income.
2.13 Investments in Joint Arrangements A joint arrangement is an arrangement of which two or more parties involved have joint control. Control exists when Nalcor has the power, directly or indirectly, to govern the financial and operating policies of another entity, so as to obtain benefits from its activities. A joint arrangement is either classified as a joint operation or a joint venture based on the rights of the parties involved. Oil and Gas holds equity stakes in the Hebron, Hibernia South Extension and White Rose Extension projects. These projects are classified as joint operations as multiple parties hold joint control and stakeholders have rights to the project assets and obligations for its liabilities. Oil and Gas accounts for its oil and gas investments by recognizing its share of assets, liabilities and profit or loss in relation to its interest in the joint operation. Effective June 18, 1999, Hydro, Churchill Falls and Hydro-Québec entered into the Shareholders' Agreement which provided, among other matters, that certain of the strategic operating, financing and investing policies of Churchill Falls be subject to approval jointly by representatives of Hydro and Hydro-Québec on the Board of Directors of Churchill Falls. Although Hydro retains its 65.8% ownership interest, the agreement changed the nature of the relationship between Hydro and Hydro-Québec, with respect to Churchill Falls, from that of majority and minority shareholders, respectively, to that of joint operators. This investment is accounted for using the proportionate consolidation method. Hydro’s joint operation, Churchill Falls, holds 33.33% of the equity share capital of Twin Falls and is a party with other shareholders in a participation agreement which gives Churchill Falls joint control of Twin Falls. This investment is accounted for using the equity method. Under the equity method, the interest in the joint venture is carried in the Statement of Financial Position at cost plus post acquisition changes in Churchill Falls’ share of net assets of the joint venture. The Consolidated Statement of Profit and Comprehensive Income reflects the share of the profit or loss of the joint venture.
2.14 Employee Future Benefits (i) Pension Plan Employees participate in the Province’s Public Service Pension Plan, a multi-employer defined benefit plan. Contributions by
Nalcor to this Plan are recognized as an expense when employees have rendered service entitling them to the contributions. Liabilities associated with this Plan are held with the Province.
(ii) Other Benefits Nalcor provides group life insurance and health care benefits on a cost-shared basis to retired employees, in addition to a
severance payment upon retirement.
7
NALCOR ENERGY NOTES TO THE CONSOLIDATED FINANCIAL STATEMENTS
The cost of providing these benefits is determined using the projected unit credit method, with actuarial valuations being completed on an annual basis, based on service and Management’s best estimate of salary escalation, retirement ages of employees and expected health care costs.
Actuarial gains and losses on Nalcor’s defined benefit obligation are recognized in reserves in the period in which they occur.
Past service costs are recognized in operating costs as incurred. Pursuant to Order No. P.U. 36 (2015), Nalcor recognizes the amortization of Hydro’s employee future benefit actuarial gains and losses in the Consolidated Statement of Profit and Comprehensive Income as a regulatory adjustment.
The retirement benefit obligation recognized in the Consolidated Statement of Financial Position represents the present value
of the defined benefit obligation.
2.15 Provisions A provision is a liability of uncertain timing or amount. A provision is recognized if Nalcor has a present legal obligation or constructive obligation as a result of past events, it is probable that an outflow of resources will be required to settle the obligation and the amount can be reliably estimated. Provisions are not recognized for future operating losses. The provision is measured at the present value of the best estimate of the expenditures expected to be required to settle the obligation using a discount rate that reflects the current market assessments of the time value of money and the risks specific to the obligation. Provisions are re-measured at each Consolidated Statement of Financial Position date using the current discount rate.
2.16 Decommissioning, Restoration and Environmental Liabilities Legal and constructive obligations associated with the retirement of property, plant and equipment are recorded as liabilities
when those obligations are incurred and are measured as the present value of the expected costs to settle the liability, discounted at a rate specific to the liability. The liability is accreted up to the date the liability will be incurred with a corresponding charge to net finance (income) expense. The carrying amount of decommissioning, restoration and environmental liabilities is reviewed annually with changes in the estimates of timing or amount of cash flows added to or deducted from the cost of the related asset or expensed in the Consolidated Statement of Profit and Comprehensive Income if the liability is short-term in nature.
2.17 Revenue Recognition
Electricity Sales Revenue from the sale of energy is recognized when Nalcor has transferred the significant risks and rewards of ownership to the buyer, recovery of the consideration is probable and the amount of revenue can be reliably measured. Sales within the Province are primarily at rates approved by the Newfoundland and Labrador Board of Commissioners of Public Utilities (PUB), whereas export sales and sales to certain major industrial customers are either at rates under the terms of the applicable contracts, or at market rates. Churchill Falls provides energy to two primary customers: Hydro-Québec and Hydro. A power contract with Hydro-Québec dated May 12, 1969 (the Power Contract) provides for the sale of a significant amount of the energy from Churchill Falls. The Power Contract had a 40-year term that expired August 31, 2016, and was followed by a Renewed Power Contract with Hydro-Québec for an additional 25 years beginning September 1, 2016. The rate was predetermined in the Power Contract and was 2.5426 mills per kWh. The rate during the term of the Renewed Power Contract is 2.0 mills per kWh. Churchill Falls also recognizes revenue from Hydro-Québec under a Guaranteed Winter Availability Contract (GWAC) through 2041. The GWAC was signed with Hydro-Québec in 1998 and provides for the sale of 682 MW of guaranteed seasonal availability to Hydro-Québec during the months of November through March in each of the remaining years until 2041.
8
NALCOR ENERGY NOTES TO THE CONSOLIDATED FINANCIAL STATEMENTS
The value of differences between energy delivered and the Annual Energy Base (AEB), as defined in the Power Contract, was tracked over a four-year period and then either recovered from or refunded to Hydro-Québec over the subsequent four-year period, unless the balance is less than $1.0 million in which case it is recovered or refunded immediately or expiration of the Power Contract in which case it is recovered or refunded within three months. These long-term receivables or long-term payables are subject to interest at 7% per annum (2015 - 7%). Under the Power Contract and Renewed Power Contract, Churchill Falls has the right to recall 300 MW (Recall Power). All of the Recall Power is sold by Churchill Falls to Hydro. Churchill Falls also provides an additional 225 MW to Hydro. Petroleum and Natural Gas Sales Revenue from the sale of crude oil is recognized when the amount of revenue can be reasonably measured, the significant risks and rewards of ownership have passed to the buyer and collection is reasonably assured. This typically occurs when the oil has been produced and delivered to the transshipment facility. Revenue from properties in which Oil and Gas has an interest with other producers is recognized on the basis of Oil and Gas’ net working interest of petroleum and natural gas produced (the entitlement method). Under this method, crude oil produced below or above Oil and Gas’ net working interest results in an under-lift or over-lift position. Under-lift or over-lift positions are measured at market value and recorded as an asset or liability, respectively. Other Revenue Revenue associated with the sale of geoscience data is recognized when the terms and conditions governing sales have been met, the amount of revenue can be reliably measured and recovery of the consideration is probable.
2.18 Leasing Leases are classified as finance leases whenever the terms of the lease transfer substantially all the risks and rewards of ownership to the lessee. All other leases are classified as operating leases.
Lessor accounting Amounts due from lessees under finance leases are recognized as receivables at the amount of Nalcor’s net investment in the leases. Finance lease income is allocated to accounting periods so as to reflect a constant periodic rate of return on Nalcor’s net investment outstanding in respect of the leases. Rental income from operating leases is recognized on a straight-line basis over the term of the relevant lease. Initial direct costs incurred in negotiating and arranging an operating lease are added to the carrying amount of the leased asset and recognized on a straight-line basis over the lease term.
Lessee accounting
Assets held under finance leases are initially recognized as assets of Nalcor at their fair value at the inception of the lease or, if lower, at the present value of the minimum lease payments. The corresponding liability to the lessor is included in the Consolidated Statement of Financial Position as a finance lease obligation. Lease payments are apportioned between finance expenses and reduction of the lease obligation so as to achieve a constant rate of interest on the remaining balance of the liability. Finance expenses are recognized immediately in profit or loss, unless they are directly attributable to qualifying assets, in which case they are capitalized in accordance with Nalcor’s general policy on borrowing costs (Note 2.11). Contingent rental costs are recognized as operating costs in the periods in which they are incurred. Operating lease payments are recognized as an expense on a straight-line basis over the lease term, except where another systematic basis is more representative of the time pattern in which economic benefits from the leased asset are consumed. Contingent rentals arising under operating leases are recognized as an expense in the period in which they are incurred. In the event that lease incentives are received to enter into operating leases, such incentives are recognized as a liability. The
9

NALCOR ENERGY NOTES TO THE CONSOLIDATED FINANCIAL STATEMENTS
aggregate benefit of incentives is recognized as a reduction of rental expense on a straight-line basis, except where another systematic basis is more representative of the time pattern in which economic benefits from the leased asset are consumed.
2.19 Net Finance (Income) Expense
For all financial instruments measured at amortized cost and interest bearing financial assets classified as AFS, interest income or expense is recorded using the effective interest rate method.
2.20 Foreign Currencies Transactions in currencies other than Nalcor’s functional currency (foreign currencies) are recognized using the exchange rate in effect at the date of transaction, approximated by the prior month end close rate. At the end of each reporting period, monetary items denominated in foreign currencies are translated at the rates of exchange in effect at the period end date. Foreign exchange gains and losses not included in regulatory deferrals are recorded in the Consolidated Statement of Profit and Comprehensive Income as other (income) expense.
2.21 Income Taxes Nalcor is exempt from paying income taxes under Section 149(1) (d.1) of the Income Tax Act. 2.22 Financial Instruments
Financial assets and financial liabilities are recognized in the Consolidated Statement of Financial Position when Nalcor becomes a party to the contractual provisions of the instrument and are initially measured at fair value. Subsequent measurement is based on classification. Financial instruments are classified into the following specified categories: financial assets at FVTPL, AFS financial assets, loans and receivables, held-to-maturity investments, financial liabilities at FVTPL, financial instruments used for hedging and other financial liabilities. The classification depends on the nature and purpose of the financial instruments and is determined at the time of initial recognition. Classification of Financial Instruments Nalcor has classified each of its financial instruments into the following categories: financial assets at FVTPL, loans and receivables, held-to-maturity investments, AFS financial assets, financial liabilities at FVTPL, financial instruments used for hedging and other financial liabilities. Financial instrument Category Cash and cash equivalents Loans and receivables Restricted cash Loans and receivables Short-term investments AFS financial assets Trade and other receivables Loans and receivables Derivative instruments At FVTPL and financial instruments used for hedging Sinking funds – investments in same Hydro issue Held-to-maturity investments Sinking funds – other investments AFS financial assets Reserve fund AFS financial assets Long-term receivables Loans and receivables Long-term investments Held-to-maturity investments Trade and other payables Other financial liabilities Short-term borrowings Other financial liabilities Long-term debt Other financial liabilities Long-term payables Other financial liabilities Class B limited partnership units Other financial liabilities
(i) Effective Interest Method The effective interest method is a method of calculating the amortized cost of a financial instrument and allocating interest
income or expense over the relevant period. The effective interest rate is the rate that exactly discounts estimated future cash receipts or payments (including all fees on points paid or received that form an integral part of the effective interest
10
NALCOR ENERGY NOTES TO THE CONSOLIDATED FINANCIAL STATEMENTS
rate, transaction costs and other premiums or discounts) through the expected life of the financial instrument, or, where appropriate, a shorter period to the net carrying amount on initial recognition.
Income or expense is recognized on an effective interest basis for financial instruments other than those financial assets and
liabilities classified as at FVTPL. Financial Assets (ii) Financial Assets at FVTPL Financial assets are classified as at FVTPL when the financial asset is either held for trading or it is designated as at FVTPL. A financial asset is classified as held for trading if:
• it has been acquired principally for the purpose of selling it in the near term; or • on initial recognition it is part of a portfolio of identified financial instruments that Nalcor manages together and has a
recent actual pattern of short-term profit-taking; or • it is a derivative that is not designated and effective as a hedging instrument.
A financial asset other than a financial asset held for trading may be designated as at FVTPL upon initial recognition if:
• such designation eliminates or significantly reduces a measurement or recognition inconsistency that would otherwise arise; or
• the financial asset forms part of a group of financial assets or financial liabilities or both, which is managed and its performance is evaluated on a fair value basis, in accordance with Nalcor’s documented risk management or investment strategy, and information about the grouping is provided internally on that basis; or
• it forms part of a contract containing one or more embedded derivatives, and IAS 39 Financial Instruments: Recognition and Measurement permits the entire combined contract (asset or liability) to be designated as at FVTPL.
Financial assets at FVTPL are stated at fair value, with any gains or losses arising on re-measurement recognized in other (income) expense. The net gain or loss incorporates any dividends or interest earned.
(iii) Loans and Receivables Trade receivables, loans and other receivables with fixed or determinable payments that are not quoted in an active market
are classified as loans and receivables. Loans and receivables are measured at amortized cost using the effective interest method, less any impairment. Interest income is recognized by applying the effective interest rate, except for short-term receivables when the recognition of interest would be immaterial.
(iv) Held-to-Maturity Investments Non-derivative financial assets with fixed or determinable payments and fixed maturity dates that Nalcor has the positive
intent and ability to hold to maturity are classified as held-to-maturity investments. Held-to-maturity investments are measured at amortized cost using the effective interest method less any impairment, with revenue recognized on an effective yield basis.
(v) AFS Financial Assets AFS financial assets are non-derivative financial assets that are designated as available-for-sale or are not classified in any of
the previous categories. Gains and losses arising from changes in fair value are recognized in other comprehensive income and accumulated in the fair value reserve with the exception of impairment losses, interest calculated using the effective interest method, and foreign exchange gains and losses on monetary assets, which are recognized in profit or loss. Where the investment is disposed of or is determined to be impaired, the cumulative gain or loss previously accumulated in the fair value reserve is reclassified to profit or loss.
11
NALCOR ENERGY NOTES TO THE CONSOLIDATED FINANCIAL STATEMENTS
Financial Liabilities and Equity Instruments (vi) Financial Liabilities at FVTPL A financial liability may be classified as at FVTPL if the contracted liability contains one or more embedded derivatives, and if
the embedded derivative significantly modified the cash flows or if the embedded derivative is not closely related to the host liability. Financial liabilities at FVTPL are stated at fair value, with any gains or losses arising from re-measurement recognized in profit or loss.
(vii) Other Financial Liabilities Other financial liabilities, including borrowings, are initially measured at fair value, net of transaction costs. Other financial
liabilities are subsequently measured at amortized cost using the effective interest method, with interest expense recognized on an effective yield basis.
(viii) Derivative Instruments and Financial Instruments Used for Hedging Derivative instruments are utilized by Nalcor to manage risk. Nalcor’s policy is not to utilize derivative instruments for
speculative purposes. Derivatives are initially measured at fair value at the date the derivative contracts are entered into and are subsequently measured at their fair value at the end of each reporting period. The resulting gain or loss is recognized in profit or loss immediately unless the derivative is designated and effective as a hedging relationship.
Nalcor may choose to designate derivative instruments as hedges and apply hedge accounting if there is a high degree of
correlation between the price movements in the derivative instruments and the hedged items. Nalcor formally documents all hedges and the related risk management objectives at the inception of the hedge. Derivative instruments that have been designated and qualify for hedge accounting are classified as either cash flow or fair value hedges.
Hedges which meet the strict criteria for hedge accounting are accounted for as follows:
Cash Flow Hedges The effective portion of the gain or loss on the hedging instrument is recognized directly in other comprehensive income, while any ineffective portion is recognized immediately in the Consolidated Statement of Profit and Comprehensive Income for the year.
Amounts recognized as other comprehensive income (loss) are transferred to the Consolidated Statement of Profit and Comprehensive Income for the period when the hedged transaction affects profit or loss, such as when the hedged financial income or financial expense is recognized or when a forecast sale occurs.
2.23 Derecognition of Financial Instruments
Nalcor derecognizes a financial asset only when the contractual rights to the cash flows from the asset expire, or when it transfers the financial asset and substantially all the risks and rewards of ownership of the asset to another entity. If Nalcor neither transfers nor retains substantially all the risks and rewards of ownership and continues to control the transferred asset, its retained interest in the asset and any associated liability for amounts it may have to pay is recognized. If Nalcor retains substantially all the risks and rewards of ownership of a transferred financial asset, it continues to recognize the financial asset and also recognizes the collateralized borrowing for the proceeds received. Nalcor derecognizes financial liabilities when, and only when, its obligations are discharged, cancelled or they expire.
2.24 Impairment of Financial Assets Financial assets are assessed for indicators of impairment at the end of each reporting period. Financial assets are impaired where there is objective evidence that, as a result of one or more events that occurred after the initial recognition of the financial asset, the estimated future cash flows of the investment have been affected. Evidence of impairment could include: • significant financial difficulty of the issuer or counterparty; or
12

NALCOR ENERGY NOTES TO THE CONSOLIDATED FINANCIAL STATEMENTS
• default or delinquency in interest or principal payments; or • the borrower, more probable than not, entering into bankruptcy or financial re-organization. For certain categories of financial assets, such as trade receivables, assets that are assessed not to be impaired individually are, in addition, assessed for impairment on a collective basis. Objective evidence of impairment for a portfolio of receivables could include Nalcor’s past experience of collecting payments, an increase in the number of delayed payments in the portfolio past the average credit period, as well as observable changes in national or local economic conditions that correlate with defaults on receivables.
For financial assets carried at amortized cost, the amount of the impairment is the difference between the asset’s carrying amount and the present value of estimated future cash flows, discounted at the financial asset’s original effective interest rate.
The carrying amount of the financial asset is reduced by the impairment loss directly for all financial assets with the exception of trade receivables, where the carrying amount is reduced through the use of an allowance account. When a trade receivable is considered uncollectible, it is written off against the allowance account. Subsequent recoveries of amounts previously written off are credited to the allowance account. Changes in the carrying amount of the allowance account are recognized in profit or loss. When an AFS financial asset is considered to be impaired, cumulative gains or losses previously recognized in other comprehensive income are reclassified to profit or loss in the period. If, in a subsequent period, the amount of the impairment loss decreases and the decrease can be related objectively to an event occurring after the impairment was recognized, the previously recognized impairment loss is reversed through profit or loss to the extent that the carrying amount of the investment at the date the impairment is reversed does not exceed what the amortized cost would have been had the impairment not been recognized.
2.25 Government Grants Government grants are recognized when there is reasonable assurance that Nalcor will comply with the associated conditions and that the grants will be received. Government grants are recognized in profit or loss on a systematic basis over the periods in which Nalcor recognizes as expenses the related costs for which the grants are intended to compensate. Specifically, government grants whose primary condition is that Nalcor should purchase, construct or otherwise acquire non-current assets are recognized as deferred revenue in the Consolidated Statement of Financial Position and transferred to the Consolidated Statement of Profit and Comprehensive Income on a systematic and rational basis over the useful lives of the related assets. Government grants that are receivable as compensation for expenses or losses already incurred or for the purpose of giving immediate financial support to Nalcor with no future related costs are recognized in the Consolidated Statement of Profit and Comprehensive Income in the period in which they become receivable.
2.26 Regulatory Deferrals
Hydro’s revenues from its electrical sales to most customers within the Province are subject to rate regulation by the PUB. Hydro's borrowing and capital expenditure programs are also subject to review and approval by the PUB. Rates are set through periodic general rate applications utilizing a cost of service methodology. The preliminary estimate of Hydro’s allowed rate of return based upon Board Order No. P.U. 49 (2016) is 6.6% in 2016 and 6.7% in 2015 +/- 20 basis points. Hydro applies various accounting policies that differ from enterprises that do not operate in a rate regulated environment. Generally, these policies result in the deferral and amortization of costs or credits which are expected to be recovered or refunded in future rates. In the absence of rate regulation, these amounts would be included in the determination of profit or loss in the year the amounts are incurred. The effects of rate regulation on the annual audited consolidated financial statements are disclosed in Note 10.
13

NALCOR ENERGY NOTES TO THE CONSOLIDATED FINANCIAL STATEMENTS 3. SIGNIFICANT ACCOUNTING JUDGMENTS, ESTIMATES AND ASSUMPTIONS
The preparation of the annual audited consolidated financial statements in conformity with IFRS requires Management to make judgments, estimates and assumptions that affect the application of accounting policies and the reported amounts of assets, liabilities, revenues and expenses. Actual results may differ materially from these estimates, including changes as a result of future decisions made by the PUB. The estimates and underlying assumptions are reviewed on an on-going basis. Revisions to accounting estimates are recognized in the period in which the estimate is reviewed if the revision affects only that period or future periods.
3.1 Use of Judgments
(i) Asset Impairment and Reversals
Nalcor applies judgment in evaluating impairment and impairment reversal indicators based on various internal and external factors. The recoverable amount of a CGU or asset is determined based on the higher of fair value less costs of disposal and its value in use. Management uses factors including expected future oil prices and proved and probable reserves from third party specialists and discount rates to determine the recoverable amount, as well as judgments regarding the occurrence of future events. Changes in these factors will affect the recoverable amount of CGUs and assets, which may result in a material adjustment to their carrying value.
(ii) Property, Plant and Equipment Nalcor’s accounting policy relating to property, plant and equipment is described in Note 2.7. In applying this policy, judgment is used in determining whether certain costs are additions to the carrying amount of the property, plant and equipment as opposed to repairs and maintenance. If an asset has been developed, judgment is required to identify the point at which the asset is capable of being used as intended and to identify the directly attributable borrowing costs to be included in the carrying value of the development asset. Judgment is also used in determining the appropriate componentization structure for Nalcor’s property, plant and equipment.
(iii) Revenue Management exercises judgment in estimating the value of electricity consumed by retail customers in the period, but billed subsequent to the end of the reporting period. Specifically, this involves an estimate of consumption for each retail customer, based on the customer’s past consumption history. When recognizing deferrals and related amortization of costs or credits in Hydro Regulated, Management assumes that such costs or credits will be recovered or refunded through customer rates in future years. Recovery of some of these deferrals is subject to a future PUB order. As such, there is a risk that some or all of the regulatory deferrals will not be approved by the PUB which could have a material impact on Hydro Regulated’s profit or loss in the year the order is received.
(iv) Functional Currency Functional currency was determined by evaluating the primary economic environment in which Nalcor operates. As Nalcor enters into transactions in multiple currencies, judgment is used in determining the functional currency. Management considered factors regarding currency of sales, costs incurred, and operating and financing activities and determined the functional currency to be Canadian Dollars.
(v) Determination of CGUs Nalcor’s accounting policy relating to impairment of non-financial assets is described in Note 2.12. In applying this policy, Nalcor groups assets into the smallest identifiable groups for which cash flows are largely independent of the cash flows from other assets or groups of assets. Judgment is used in determining the level at which cash flows are largely independent of other assets or groups of assets.
14

NALCOR ENERGY NOTES TO THE CONSOLIDATED FINANCIAL STATEMENTS
(vi) Discount Rates Certain of Nalcor’s financial liabilities are discounted using discount rates that are subject to Management’s judgment.
(vii) Consolidation of Joint Arrangements
Management exercises judgment when applying the criteria outlined in IFRS 11 to determine whether joint arrangements constitute joint ventures or joint operations. Management has determined that its interest in Churchill Falls is considered a joint operation and its interest in Twin Falls is considered a joint venture.
(viii) Consolidation Management applies its judgment when determining whether to consolidate structured entities in accordance with the criteria outlined in IFRS 10. Management has determined that the Company should consolidate the Project Trust but should not consolidate the MF/LTA and LIL Funding Trusts.
3.2 Use of Estimates (i) Property, Plant and Equipment
Amounts recorded for depreciation are based on the useful lives of Nalcor’s assets. The useful lives of property, plant and equipment are determined by independent specialists and reviewed annually by Nalcor. These useful lives are Management’s best estimate of the service lives of these assets. Changes to these lives could materially affect the amount of depreciation recorded.
(ii) Investment Property Amounts recorded for depreciation are based on the useful lives of Bull Arm Fabrication’s assets. These useful lives are Management’s best estimate of the service lives of these assets. Changes to these lives could materially affect the amount of depreciation recorded. Due to the nature of the property and lack of comparable market data, the fair value of Bull Arm Fabrication’s investment property is determined using the present value of the future cash flows. Significant assumptions used in the determination of fair value include estimates of the amount and timing of future cash flows and the discount rate.
(iii) Intangible Assets Amounts recorded for amortization are based on the useful lives of Nalcor’s assets. These useful lives are Management’s best estimate of the service lives of these assets. Changes to these lives could materially affect the amount of amortization recorded.
(iv) Oil and Natural Gas Reserves
Oil and natural gas reserves are evaluated by independent reserve engineers. Reserve estimates are used in calculating depletion, impairment and decommissioning liabilities. Estimates of recoverable reserves are based upon variable factors and assumptions regarding historical production, production rates, ultimate reserve recovery, marketability of petroleum and natural gas, and timing and amount of future cash expenditures. Changes to these amounts could materially affect these calculations.
(v) Partnership Unit Liabilities
The Partnership determines the fair value of the Class A and Class B limited partnership units at each financial reporting date. These units represent the limited partners’ ownership interests in the Partnership. Due to the nature of the liabilities and lack of comparable market data, the fair value of these units is determined using the present value of future cash flows. Significant assumptions used in the determination of fair value include estimates of the amount and timing of future cash flows and the discount rate.
15
NALCOR ENERGY NOTES TO THE CONSOLIDATED FINANCIAL STATEMENTS
The process of valuing financial liabilities for which no published market price exists is based on inherent uncertainties and the resulting values may differ from values that would have been used had a ready market existed for the liability. These differences could be material to the fair value of the financial liability.
(vi) Decommissioning Liabilities Nalcor recognizes a liability for the fair value of the future expenditures required to settle obligations associated with the
retirement of property, plant and equipment. Decommissioning liabilities are recorded as a liability at fair value, with a corresponding increase to property, plant and equipment. Accretion of decommissioning liabilities is included in the Consolidated Statement of Profit and Comprehensive Income through net finance (income) expense. Differences between the recorded decommissioning liabilities and the actual decommissioning costs incurred are recorded as a gain or loss in the settlement period.
(vii) Employee Future Benefits
Nalcor provides group life insurance and health care benefits on a cost-shared basis to retired employees, in addition to a severance payment upon retirement. The expected cost of providing these other employee benefits is accounted for on an accrual basis, and has been actuarially determined using the projected unit credit method prorated on service, and Management’s best estimate of salary escalation, retirement ages of employees, and expected health care costs.
(viii) Lease Revenue Lease revenue is recognized when services have been rendered, recovery of the consideration is probable and the amount of revenue can be reliably measured. Lease revenue is recognized evenly over the period of the lease contract and may change depending on the final contract value.
(ix) Revenue
In the absence of a signed agreement with Hydro-Québec relating to the AEB, Churchill Falls continues to apply the terms of the previous agreement which expired August 31, 2012. Management continues to work to negotiate terms of a new agreement.
3.3 Use of Assumptions
Derivative Assets
Fair value assumptions for financial transmission rights have been based on internal valuation techniques and models that extrapolate observable external market inputs, such as commodity prices, and include significant judgment regarding the expected impact of seasonality and locational adjustments.
4. FUTURE CHANGES IN ACCOUNTING POLICIES
Amendments to IFRS 11 – Accounting for Acquisition of Interests in Joint Operations, IAS 1 – Disclosure Initiatives and IAS 16 and 38 – Clarification of Acceptable Methods of Depreciation and Amortization that became effective for annual periods beginning on or after January 1, 2016 did not have a material impact on Nalcor’s annual audited consolidated financial statements. Nalcor has not applied the following new and revised IFRS that have been issued but are not yet effective: Amendments to IAS 7 - Disclosure Initiative1 Amendments to IFRS 10 and IAS 28 - Sale or Contribution of Assets between an Investor and its Associate or Joint Venture4 IFRS 9 - Financial Instruments2 IFRS 15 - Revenue from Contracts with Customers2 IFRS 16 - Leases3
16

NALCOR ENERGY NOTES TO THE CONSOLIDATED FINANCIAL STATEMENTS
1Effective for annual periods beginning on or after January 1, 2017, with earlier application permitted. 2Effective for annual periods beginning on or after January 1, 2018, with earlier application permitted. 3Effective for annual periods beginning on or after January 1, 2019, with earlier application permitted. 4Effective for annual periods beginning on or after a date yet to be determined.
4.1 Amendments to IAS 7 - Disclosure Initiative
The amendments require an entity to provide disclosures that enable users of financial statements to evaluate changes in liabilities arising from financing activities, including both changes arising from cash flows and non-cash changes. The amendments do not prescribe a specific format to disclose financing activities; however, an entity may fulfil the disclosure objective by providing a reconciliation between the opening and closing balances in the Statement of Financial Position for liabilities arising from financing activities. The amendments apply prospectively. Entities are not required to present comparative information for earlier periods. Management does not anticipate that the application of these amendments to IAS 7 will have a material impact on Nalcor’s annual audited consolidated financial statement disclosures.
4.2 Amendments to IFRS 10 and IAS 28 - Sale or Contribution of Assets between an Investor and its Associated or Joint Venture The amendments deal with situations where there is a sale or contribution of assets between an investor and its associate or joint venture. In December 2015, the IASB postponed the effective date of this amendment indefinitely pending the outcome of its research project on the equity method of accounting. Earlier application of these amendments is still permitted.
4.3 IFRS 9 - Financial Instruments In July 2014, the IASB finalized the reform of financial instruments accounting and issued IFRS 9 (as revised in 2014), which contains the requirements for a) the classification and measurement of financial assets and financial liabilities, b) impairment methodology, and c) general hedge accounting. IFRS 9 (as revised in 2014) will supersede IAS 39 - Financial Instruments: Recognition and Measurement upon its effective date. Phase 1: Classification and measurement of financial assets and financial liabilities With respect to the classification and measurement, the number of categories of financial assets under IFRS 9 has been reduced; all recognized financial assets that are currently within the scope of IAS 39 will be subsequently measurement at either amortized cost or fair value under IFRS 9. IFRS 9 also contains requirements for the classification and measurement of financial liabilities and derecognition requirements. One major change from IAS 39 relates to the presentation of changes in the fair value of a financial liability designated as at FVTPL attributable to changes in the credit risk of that liability. Under IFRS 9, such changes are presented in other comprehensive income, unless the presentation of the effect of the change in the liability’s credit risk in other comprehensive income would create or enlarge an accounting mismatch in profit or loss.
Phase 2: Impairment of financial assets The impairment model under IFRS 9 reflects expected credit losses, as opposed to incurred credit losses under IAS 39. Under the impairment approach in IFRS 9, it is no longer necessary for a credit event to have occurred before credit losses are recognized. Instead, an entity always accounts for expected credit losses and changes in those expected credit losses. The amount of expected credit losses should be updated at each reporting date to reflect changes in credit risk since initial recognition.
Phase 3: Hedge accounting The general hedge accounting requirements of IFRS 9 retain the three types of hedge accounting mechanisms in IAS 39. However, greater flexibility has been introduced to the types of transactions eligible for hedge accounting. In addition, the effectiveness
17
NALCOR ENERGY NOTES TO THE CONSOLIDATED FINANCIAL STATEMENTS
test has been overhauled and replaced with the principle of an ‘economic relationship’. Retrospective assessment of hedge effectiveness is no longer required. Far more disclosure requirements about an entity’s risk management activities have been introduced. Transitional provisions IFRS 9 (as revised in 2014) is effective for annual periods beginning on or after January 1, 2018 with earlier application permitted. Management has elected to adopt the standard as of the effective date, and although the classifications of existing financial instruments and related disclosures will change, Management does not anticipate material adjustments to Nalcor’s annual audited consolidated financial statements upon transition.
4.4 IFRS 15 Revenue from Contracts with Customers IFRS 15 establishes a single comprehensive model for entities to use in accounting for revenue arising from contracts with
customers. It will supersede the following revenue standards and interpretations upon its effective date: • IAS 18 Revenue; • IAS 11 Construction Contracts; • IFRIC 13 Customer Loyalty Programs; • IFRIC 15 Agreements for the Construction of Real Estate; • IFRIC 18 Transfers of Assets from Customers; and • SIC 31 Revenue-Barter Transactions Involving Advertising Services.
As suggested by the title of the new revenue standard, IFRS 15 will only cover revenue arising from contracts with customers.
Under IFRS 15, a customer of an entity is a party that has contracted with the entity to obtain goods or services that are an output of the entity’s ordinary activities in exchange for consideration. Unlike the scope of IAS 18, the recognition and measurement of interest income and dividend income from debt and equity investments are no longer within the scope of IFRS 15. Instead, they are within the scope of IAS 39 (or IFRS 9 if it is early adopted).
As mentioned above, the new standard has a single model to deal with revenue from contracts with customers. Its core principle
is that an entity should recognize revenue to depict the transfer of promised goods or services to customers in an amount that reflects the consideration to which the entity expects to be entitled in exchange for those goods or services.
Specifically, the standard introduces a five-step approach to revenue recognition:
Step 1: Identify the contract(s) with a customer. Step 2: Identify the performance obligations in the contract. Step 3: Determine the transaction price. Step 4: Allocate the transaction price to the performance obligations in the contract. Step 5: Recognize revenue when (or as) the entity satisfies a performance obligation.
Extensive disclosures are also required by the new standard. Management anticipates that the application of IFRS 15 in the future may have a material impact on the amounts reported and
disclosures made in Nalcor’s annual audited consolidated financial statements. However, it is not practicable to provide a reasonable estimate of the effect of IFRS 15 until Management performs a detailed review.
4.5 IFRS 16 - Leases
IFRS 16 provides a comprehensive model for the identification of lease arrangements and their treatment in the financial statements of both lessees and lessors. It will supersede the following lease standard and interpretations upon its effective date: • IAS 17 Leases; • IFRIC 4 Determining Whether an Arrangement contains a Lease; • SIC-15 Operating Leases – Incentives; and • SIC-27 Evaluating the Substance of Transactions Involving the Legal Form of a Lease.
18
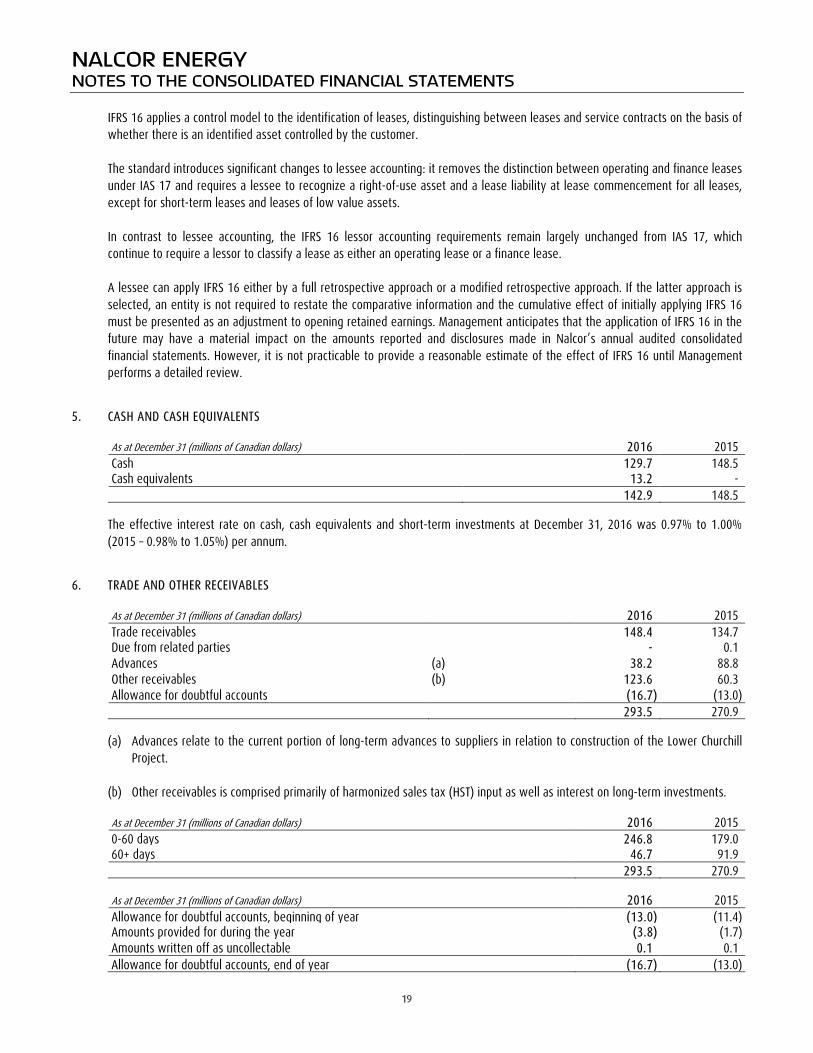
NALCOR ENERGY NOTES TO THE CONSOLIDATED FINANCIAL STATEMENTS
IFRS 16 applies a control model to the identification of leases, distinguishing between leases and service contracts on the basis of whether there is an identified asset controlled by the customer. The standard introduces significant changes to lessee accounting: it removes the distinction between operating and finance leases under IAS 17 and requires a lessee to recognize a right-of-use asset and a lease liability at lease commencement for all leases, except for short-term leases and leases of low value assets. In contrast to lessee accounting, the IFRS 16 lessor accounting requirements remain largely unchanged from IAS 17, which continue to require a lessor to classify a lease as either an operating lease or a finance lease. A lessee can apply IFRS 16 either by a full retrospective approach or a modified retrospective approach. If the latter approach is selected, an entity is not required to restate the comparative information and the cumulative effect of initially applying IFRS 16 must be presented as an adjustment to opening retained earnings. Management anticipates that the application of IFRS 16 in the future may have a material impact on the amounts reported and disclosures made in Nalcor’s annual audited consolidated financial statements. However, it is not practicable to provide a reasonable estimate of the effect of IFRS 16 until Management performs a detailed review.
5. CASH AND CASH EQUIVALENTS As at December 31 (millions of Canadian dollars) 2016 2015 Cash 129.7 148.5 Cash equivalents 13.2 - 142.9 148.5
The effective interest rate on cash, cash equivalents and short-term investments at December 31, 2016 was 0.97% to 1.00% (2015 – 0.98% to 1.05%) per annum.
6. TRADE AND OTHER RECEIVABLES As at December 31 (millions of Canadian dollars) 2016 2015 Trade receivables 148.4 134.7 Due from related parties - 0.1 Advances (a) 38.2 88.8 Other receivables (b) 123.6 60.3 Allowance for doubtful accounts (16.7) (13.0) 293.5 270.9
(a) Advances relate to the current portion of long-term advances to suppliers in relation to construction of the Lower Churchill Project.
(b) Other receivables is comprised primarily of harmonized sales tax (HST) input as well as interest on long-term investments. As at December 31 (millions of Canadian dollars) 2016 2015 0-60 days 246.8 179.0 60+ days 46.7 91.9 293.5 270.9 As at December 31 (millions of Canadian dollars) 2016 2015 Allowance for doubtful accounts, beginning of year (13.0) (11.4) Amounts provided for during the year (3.8) (1.7) Amounts written off as uncollectable 0.1 0.1 Allowance for doubtful accounts, end of year (16.7) (13.0)
19

NALCOR ENERGY NOTES TO THE CONSOLIDATED FINANCIAL STATEMENTS
As at December 31, 2016, trade and other receivables included balances of $43.9 million (2015 - $16.0 million) denominated in United States Dollars (USD).
7. INVENTORIES As at December 31 (millions of Canadian dollars) 2016 2015 No. 6 fuel 34.9 26.4 Materials and other 47.6 41.1 Diesel fuel 3.8 4.2 Other fuel 4.5 3.9 Construction aggregates 2.3 2.3 93.1 77.9
The cost of inventories recognized as an expense during the year is $173.9 million (2015 - $199.3 million) and is included in operating costs and fuels.
8. PROPERTY, PLANT AND EQUIPMENT Petroleum Transmission and Natural Generation and Gas Construction (millions of Canadian dollars) Plant Distribution Properties Other in Progress Total (Note 36) Cost Balance at January 1, 2015 1,534.4 718.2 837.2 207.9 3,016.4 6,314.1 Additions (0.2) - 221.2 - 2,538.8 2,759.8 Disposals (3.0) (3.1) - (3.6) - (9.7) Transfers 179.1 58.7 - 23.6 (261.4) - Decommissioning liabilities and revisions 0.5 (0.3) 58.4 - - 58.6 Other adjustments - - - 190.9 (111.6) 79.3 Balance at December 31, 2015 1,710.8 773.5 1,116.8 418.8 5,182.2 9,202.1 Additions - 0.1 208.2 0.3 3,041.3 3,249.9 Disposals (6.1) (3.2) (0.3) (3.5) - (13.1) Transfers 93.8 97.8 - 28.7 (220.3) - Decommissioning liabilities and revisions (13.9) 1.0 (10.4) - - (23.3) Other adjustments (0.4) - - (1.6) - (2.0) Balance at December 31, 2016 1,784.2 869.2 1,314.3 442.7 8,003.2 12,413.6 Depreciation, depletion and impairment Balance at January 1, 2015 369.6 118.6 95.9 64.3 - 648.4 Depreciation and depletion 44.1 21.9 14.8 12.0 - 92.8 Impairment - - 61.7 - - 61.7 Disposals (1.5) (0.8) - (2.3) - (4.6) Other adjustments - - - 79.3 - 79.3 Balance at December 31, 2015 412.2 139.7 172.4 153.3 - 877.6 Depreciation and depletion 47.6 23.4 40.0 13.8 - 124.8 Disposals (1.8) (1.0) - (2.5) - (5.3) Balance at December 31, 2016 458.0 162.1 212.4 164.6 - 997.1 Carrying value Balance at January 1, 2015 1,164.8 599.6 741.3 143.6 3,016.4 5,665.7 Balance at December 31, 2015 1,298.6 633.8 944.4 265.5 5,182.2 8,324.5 Balance at December 31, 2016 1,326.2 707.1 1,101.9 278.1 8,003.2 11,416.5
20
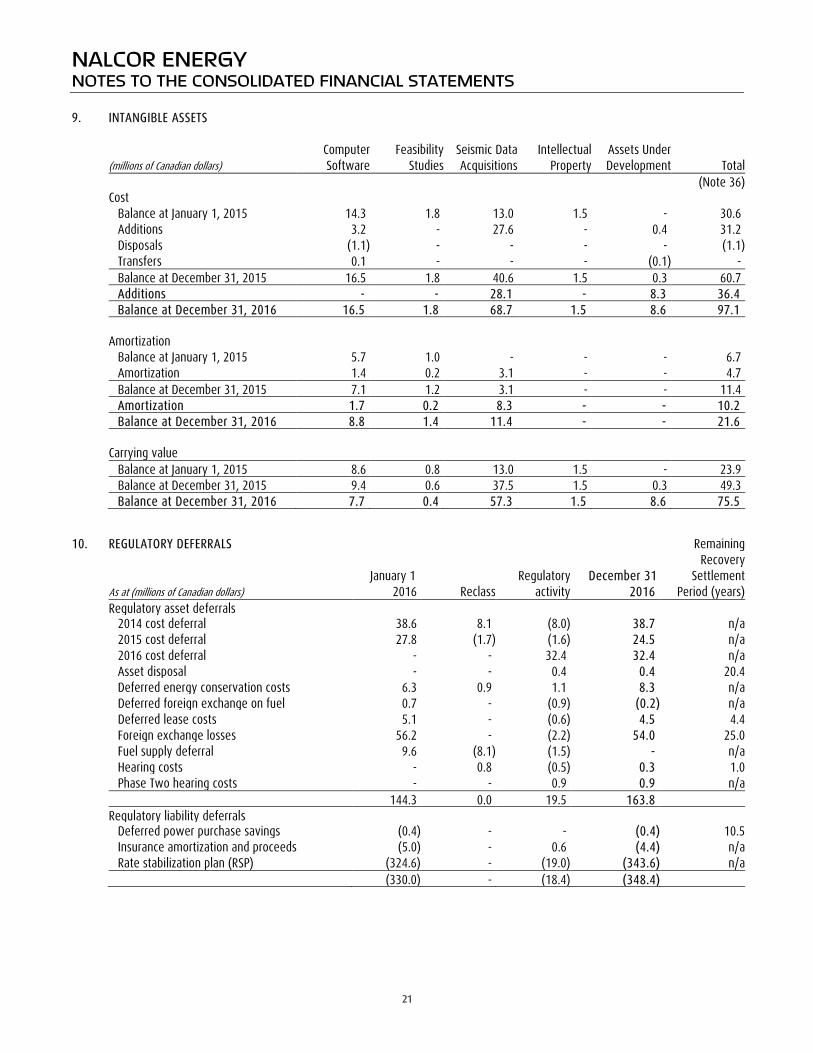
NALCOR ENERGY NOTES TO THE CONSOLIDATED FINANCIAL STATEMENTS 9. INTANGIBLE ASSETS Computer Feasibility Seismic Data Intellectual Assets Under (millions of Canadian dollars) Software Studies Acquisitions Property Development Total (Note 36) Cost Balance at January 1, 2015 14.3 1.8 13.0 1.5 - 30.6 Additions 3.2 - 27.6 - 0.4 31.2 Disposals (1.1) - - - - (1.1) Transfers 0.1 - - - (0.1) - Balance at December 31, 2015 16.5 1.8 40.6 1.5 0.3 60.7 Additions - - 28.1 - 8.3 36.4 Balance at December 31, 2016 16.5 1.8 68.7 1.5 8.6 97.1 Amortization Balance at January 1, 2015 5.7 1.0 - - - 6.7 Amortization 1.4 0.2 3.1 - - 4.7 Balance at December 31, 2015 7.1 1.2 3.1 - - 11.4 Amortization 1.7 0.2 8.3 - - 10.2 Balance at December 31, 2016 8.8 1.4 11.4 - - 21.6 Carrying value Balance at January 1, 2015 8.6 0.8 13.0 1.5 - 23.9 Balance at December 31, 2015 9.4 0.6 37.5 1.5 0.3 49.3 Balance at December 31, 2016 7.7 0.4 57.3 1.5 8.6 75.5 10. REGULATORY DEFERRALS Remaining Recovery January 1 Regulatory December 31 Settlement As at (millions of Canadian dollars) 2016 Reclass activity 2016 Period (years) Regulatory asset deferrals 2014 cost deferral 38.6 8.1 (8.0) 38.7 n/a 2015 cost deferral 27.8 (1.7) (1.6) 24.5 n/a 2016 cost deferral - - 32.4 32.4 n/a Asset disposal - - 0.4 0.4 20.4 Deferred energy conservation costs 6.3 0.9 1.1 8.3 n/a Deferred foreign exchange on fuel 0.7 - (0.9) (0.2) n/a Deferred lease costs 5.1 - (0.6) 4.5 4.4 Foreign exchange losses 56.2 - (2.2) 54.0 25.0 Fuel supply deferral 9.6 (8.1) (1.5) - n/a Hearing costs - 0.8 (0.5) 0.3 1.0 Phase Two hearing costs - - 0.9 0.9 n/a 144.3 0.0 19.5 163.8 Regulatory liability deferrals Deferred power purchase savings (0.4) - - (0.4) 10.5 Insurance amortization and proceeds (5.0) - 0.6 (4.4) n/a Rate stabilization plan (RSP) (324.6) - (19.0) (343.6) n/a (330.0) - (18.4) (348.4)
21
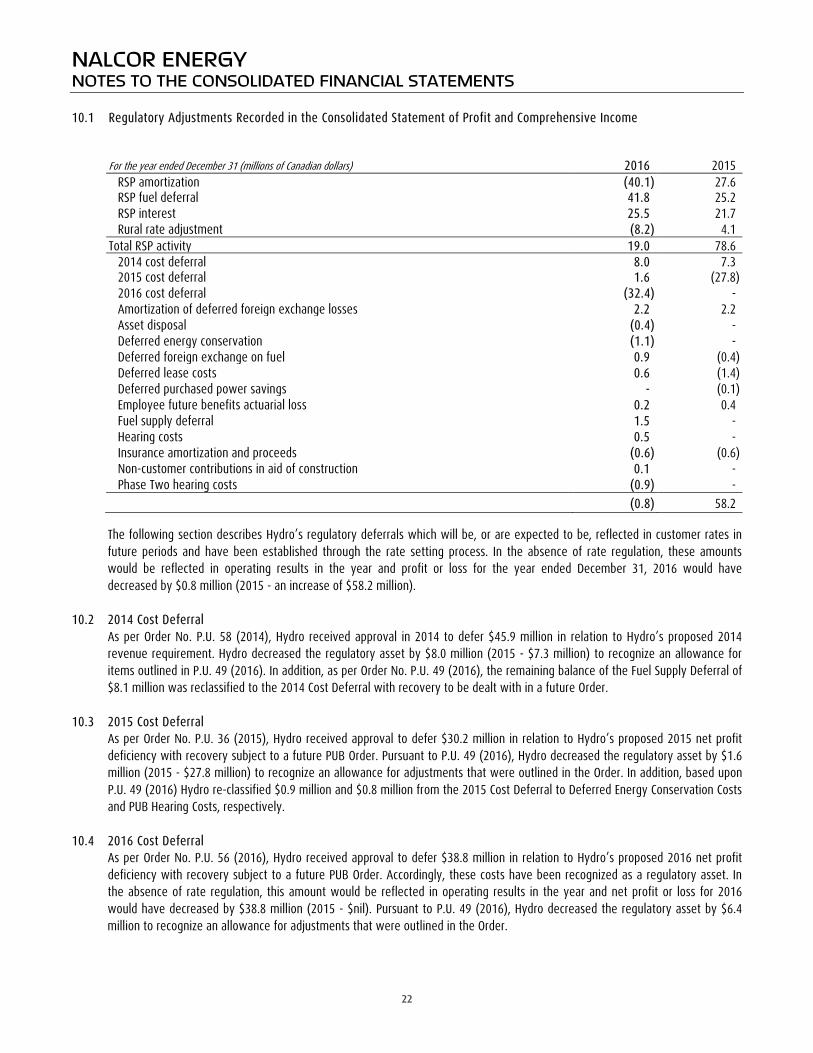
NALCOR ENERGY NOTES TO THE CONSOLIDATED FINANCIAL STATEMENTS 10.1 Regulatory Adjustments Recorded in the Consolidated Statement of Profit and Comprehensive Income For the year ended December 31 (millions of Canadian dollars) 2016 2015 RSP amortization (40.1) 27.6 RSP fuel deferral 41.8 25.2 RSP interest 25.5 21.7 Rural rate adjustment (8.2) 4.1 Total RSP activity 19.0 78.6 2014 cost deferral 8.0 7.3 2015 cost deferral 1.6 (27.8) 2016 cost deferral (32.4) - Amortization of deferred foreign exchange losses 2.2 2.2 Asset disposal (0.4) - Deferred energy conservation (1.1) - Deferred foreign exchange on fuel 0.9 (0.4) Deferred lease costs 0.6 (1.4) Deferred purchased power savings - (0.1) Employee future benefits actuarial loss 0.2 0.4 Fuel supply deferral 1.5 - Hearing costs 0.5 - Insurance amortization and proceeds (0.6) (0.6) Non-customer contributions in aid of construction 0.1 - Phase Two hearing costs (0.9) - (0.8) 58.2
The following section describes Hydro’s regulatory deferrals which will be, or are expected to be, reflected in customer rates in future periods and have been established through the rate setting process. In the absence of rate regulation, these amounts would be reflected in operating results in the year and profit or loss for the year ended December 31, 2016 would have decreased by $0.8 million (2015 - an increase of $58.2 million).
10.2 2014 Cost Deferral
As per Order No. P.U. 58 (2014), Hydro received approval in 2014 to defer $45.9 million in relation to Hydro’s proposed 2014 revenue requirement. Hydro decreased the regulatory asset by $8.0 million (2015 - $7.3 million) to recognize an allowance for items outlined in P.U. 49 (2016). In addition, as per Order No. P.U. 49 (2016), the remaining balance of the Fuel Supply Deferral of $8.1 million was reclassified to the 2014 Cost Deferral with recovery to be dealt with in a future Order.
10.3 2015 Cost Deferral
As per Order No. P.U. 36 (2015), Hydro received approval to defer $30.2 million in relation to Hydro’s proposed 2015 net profit deficiency with recovery subject to a future PUB Order. Pursuant to P.U. 49 (2016), Hydro decreased the regulatory asset by $1.6 million (2015 - $27.8 million) to recognize an allowance for adjustments that were outlined in the Order. In addition, based upon P.U. 49 (2016) Hydro re-classified $0.9 million and $0.8 million from the 2015 Cost Deferral to Deferred Energy Conservation Costs and PUB Hearing Costs, respectively.
10.4 2016 Cost Deferral As per Order No. P.U. 56 (2016), Hydro received approval to defer $38.8 million in relation to Hydro’s proposed 2016 net profit deficiency with recovery subject to a future PUB Order. Accordingly, these costs have been recognized as a regulatory asset. In the absence of rate regulation, this amount would be reflected in operating results in the year and net profit or loss for 2016 would have decreased by $38.8 million (2015 - $nil). Pursuant to P.U. 49 (2016), Hydro decreased the regulatory asset by $6.4 million to recognize an allowance for adjustments that were outlined in the Order.
22
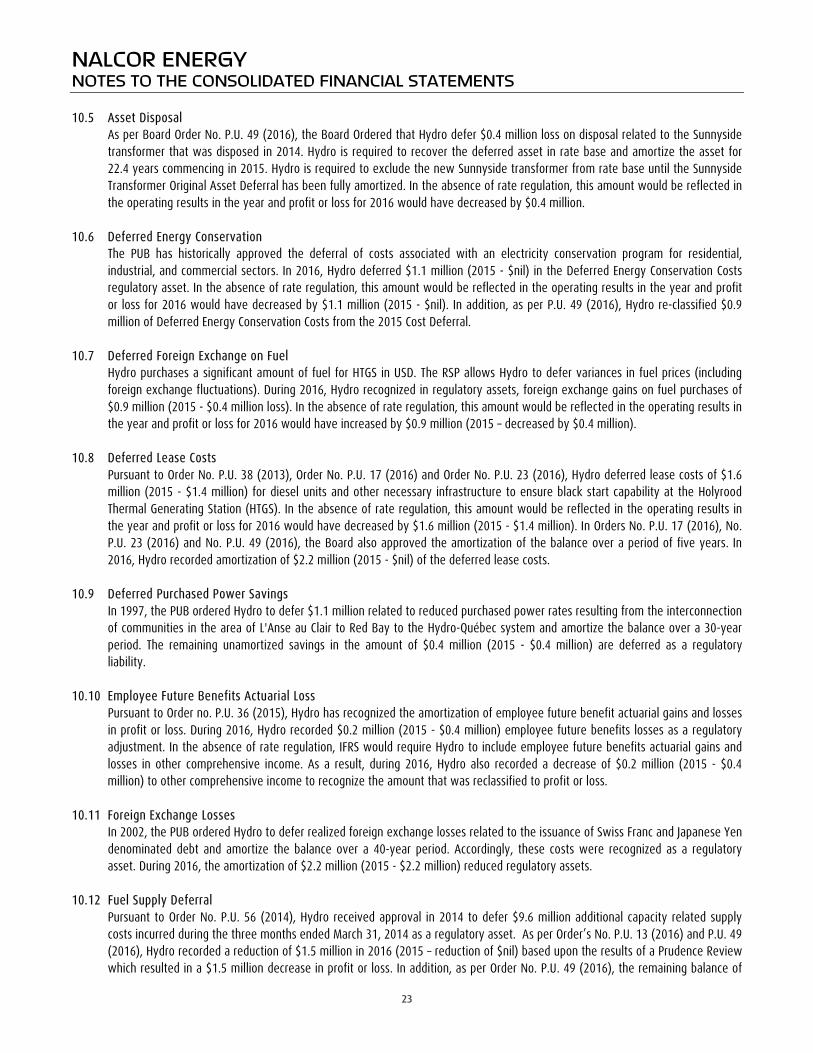
NALCOR ENERGY NOTES TO THE CONSOLIDATED FINANCIAL STATEMENTS 10.5 Asset Disposal
As per Board Order No. P.U. 49 (2016), the Board Ordered that Hydro defer $0.4 million loss on disposal related to the Sunnyside transformer that was disposed in 2014. Hydro is required to recover the deferred asset in rate base and amortize the asset for 22.4 years commencing in 2015. Hydro is required to exclude the new Sunnyside transformer from rate base until the Sunnyside Transformer Original Asset Deferral has been fully amortized. In the absence of rate regulation, this amount would be reflected in the operating results in the year and profit or loss for 2016 would have decreased by $0.4 million.
10.6 Deferred Energy Conservation The PUB has historically approved the deferral of costs associated with an electricity conservation program for residential, industrial, and commercial sectors. In 2016, Hydro deferred $1.1 million (2015 - $nil) in the Deferred Energy Conservation Costs regulatory asset. In the absence of rate regulation, this amount would be reflected in the operating results in the year and profit or loss for 2016 would have decreased by $1.1 million (2015 - $nil). In addition, as per P.U. 49 (2016), Hydro re-classified $0.9 million of Deferred Energy Conservation Costs from the 2015 Cost Deferral.
10.7 Deferred Foreign Exchange on Fuel Hydro purchases a significant amount of fuel for HTGS in USD. The RSP allows Hydro to defer variances in fuel prices (including foreign exchange fluctuations). During 2016, Hydro recognized in regulatory assets, foreign exchange gains on fuel purchases of $0.9 million (2015 - $0.4 million loss). In the absence of rate regulation, this amount would be reflected in the operating results in the year and profit or loss for 2016 would have increased by $0.9 million (2015 – decreased by $0.4 million).
10.8 Deferred Lease Costs Pursuant to Order No. P.U. 38 (2013), Order No. P.U. 17 (2016) and Order No. P.U. 23 (2016), Hydro deferred lease costs of $1.6 million (2015 - $1.4 million) for diesel units and other necessary infrastructure to ensure black start capability at the Holyrood Thermal Generating Station (HTGS). In the absence of rate regulation, this amount would be reflected in the operating results in the year and profit or loss for 2016 would have decreased by $1.6 million (2015 - $1.4 million). In Orders No. P.U. 17 (2016), No. P.U. 23 (2016) and No. P.U. 49 (2016), the Board also approved the amortization of the balance over a period of five years. In 2016, Hydro recorded amortization of $2.2 million (2015 - $nil) of the deferred lease costs.
10.9 Deferred Purchased Power Savings
In 1997, the PUB ordered Hydro to defer $1.1 million related to reduced purchased power rates resulting from the interconnection of communities in the area of L'Anse au Clair to Red Bay to the Hydro-Québec system and amortize the balance over a 30-year period. The remaining unamortized savings in the amount of $0.4 million (2015 - $0.4 million) are deferred as a regulatory liability.
10.10 Employee Future Benefits Actuarial Loss Pursuant to Order no. P.U. 36 (2015), Hydro has recognized the amortization of employee future benefit actuarial gains and losses in profit or loss. During 2016, Hydro recorded $0.2 million (2015 - $0.4 million) employee future benefits losses as a regulatory adjustment. In the absence of rate regulation, IFRS would require Hydro to include employee future benefits actuarial gains and losses in other comprehensive income. As a result, during 2016, Hydro also recorded a decrease of $0.2 million (2015 - $0.4 million) to other comprehensive income to recognize the amount that was reclassified to profit or loss.
10.11 Foreign Exchange Losses In 2002, the PUB ordered Hydro to defer realized foreign exchange losses related to the issuance of Swiss Franc and Japanese Yen denominated debt and amortize the balance over a 40-year period. Accordingly, these costs were recognized as a regulatory asset. During 2016, the amortization of $2.2 million (2015 - $2.2 million) reduced regulatory assets.
10.12 Fuel Supply Deferral Pursuant to Order No. P.U. 56 (2014), Hydro received approval in 2014 to defer $9.6 million additional capacity related supply costs incurred during the three months ended March 31, 2014 as a regulatory asset. As per Order’s No. P.U. 13 (2016) and P.U. 49 (2016), Hydro recorded a reduction of $1.5 million in 2016 (2015 – reduction of $nil) based upon the results of a Prudence Review which resulted in a $1.5 million decrease in profit or loss. In addition, as per Order No. P.U. 49 (2016), the remaining balance of
23

NALCOR ENERGY NOTES TO THE CONSOLIDATED FINANCIAL STATEMENTS
$8.1 million was reclassified to the 2014 Cost Deferral with recovery to be dealt with in a future Order.
10.13 Hearing Costs As per Board Order No. P.U. 49 (2016), the Board approved $0.8 million in Deferred Hearing Costs to be deferred and amortized over a three year period commencing 2015. Pursuant to the Order, Hydro reclassified $0.8 million from the 2015 Cost Deferral to deferred hearing costs. In 2016, Hydro recorded amortization of $0.5 million of the deferred hearing costs.
10.14 Insurance Amortization and Proceeds Pursuant to Order No. P.U. 13 (2012), Hydro records net insurance proceeds against the capital costs and amortizes the balance over the life of the asset. Under IFRS, Hydro is required to recognize the insurance proceeds and corresponding amortization in regulatory liabilities. During 2016, Hydro recorded a decrease to regulatory liabilities resulting from amortization of $0.6 million (2015 - $0.6 million) related to the assets.
10.15 Non-Customer Contributions in Aid of Construction
Pursuant to P.U. 1 (2017), Hydro recognized amortization of deferred contributions in aid of construction (CIAC) from entities which are not customers in profit or loss. During 2016, Hydro recorded $0.1 million (2015 - $nil) non-customer CIAC amortization as a regulatory adjustment. In the absence of rate regulation, IFRS requires non-customer CIACs to be recorded as contributed capital with no corresponding amortization.
10.16 Phase Two Hearing Costs
In April 2016, Hydro received Order No. P.U. 13 (2016) which approved the deferral of costs for 2014, 2015 and subsequent years relating to Phase Two of the investigation into the reliability and adequacy of power on the Island Interconnected system after the interconnection with the Muskrat Falls generating station. As a result, Hydro recorded a regulatory asset of $0.9 million. In the absence of rate regulation, this amount would be reflected in the operating results in the year and profit or loss for 2016 would have decreased by $0.9 million.
10.17 Rate Stabilization Plan (RSP) In 1986, the PUB ordered Hydro to implement a Rate Stabilization Plan (RSP) which primarily provides for the deferral of fuel expense variances resulting from changes in fuel prices, hydrology and load and associated interest. Additionally, the RSP also includes costs associated with the island interconnected and isolated systems. Adjustments required in utility rates to cover the amortization of the balance are implemented on July 1 of each year. Similar adjustments required in industrial rates are implemented on January 1 of each year. During 2016, Hydro recorded a net increase in regulatory liabilities of $19.0 million (2015 - increase of $78.6 million) resulting in an RSP ending balance for 2016 of $343.6 million (2015 - $324.6 million). Included in the balance is $108.6 million (2015 - $126.9 million) which is to be refunded in the following year, with the exception of hydraulic variations, which will be refunded at a rate of 25% of the outstanding balance at December 31, 2016. The remaining portion of the RSP balance totaling $235.0 million (2015 - $197.7 million) has been set aside with $143.4 million (2015 - $133.4 million) to be refunded to Newfoundland Power’s retail customers and Hydro’s Island Rural Customers, $91.2 million (2015 - $61.2 million) subject to a future ruling of the PUB and $0.4 million (2015 - $3.1 million) is being used to phase in Island Industrial rate increases.
24

NALCOR ENERGY NOTES TO THE CONSOLIDATED FINANCIAL STATEMENTS 11. OTHER LONG-TERM ASSETS As at December 31 (millions of Canadian dollars) 2016 2015 Investment property (a) 1.0 1.0 Investment in joint arrangement 1.2 1.2 Long-term receivables (b) 27.4 3.6 Long-term prepayments (c) 3.3 9.2 Reserve fund (d) 14.9 30.9 Sinking funds (e) 307.1 283.6 Other 0.8 0.5 Other long-term assets, end of year 355.7 330.0 Less: current portion (81.7) (12.4) 274.0 317.6
(a) As at December 31, 2016, the fair value measurement of the investment property is categorized as a Level 3 valuation. The fair value of investment property at December 31, 2016 is estimated to be $19.4 million (2015 - $33.8 million). Due to the nature of the property and lack of comparable market data, the fair value of Bull Arm Fabrication’s investment property is determined using the present value of future cash flows. Bull Arm Fabrication’s estimates are based on cash flows estimated to occur between 2017 and 2022, discounted at a rate of 12.0%.
(b) As at December 31, 2016, long-term receivables include $26.9 million (2015 - $3.3 million) related to long-term advances to suppliers in relation to construction of the Lower Churchill Project. The current portion of $38.2 million (2015 - $88.8 million) is included in trade and other receivables. The remaining $0.5 million (2015 - $0.3 million) includes the non-current portion of receivables associated with customer payment plans and the long-term portion of employee purchase programs.
(c) Long-term prepayments include prepaid insurance expenditures related to the Lower Churchill Project.
(d) In 2007, Churchill Falls commenced the creation of a $75.0 million segregated reserve fund pursuant to the terms of the Shareholders' Agreement to contribute towards the funding of capital expenditures related to Churchill Falls' existing facilities and their replacement. Churchill Falls invested $17.0 million in each of 2007, 2008 and 2009 and $8.0 million in each of 2010, 2011 and 2012. In December 2016, $23.4 million (2015 - $5.0 million) was withdrawn to fund a portion of capital expenditures. As per the terms of the Shareholders' Agreement, these funds will be replaced over a five year period when the reserve fund is fully depleted. This fund must remain in place until the end of the Shareholders' Agreement in 2041. Any amounts removed to fund capital expenditures must be replaced. Reserve fund holdings consist of securities issued by the Government of Canada, various provinces of Canada and Schedule 1 and 2 Canadian Chartered Banks.
Nalcor's 65.8% share of the reserve fund consists of the following: As at December 31 (millions of Canadian dollars) 2016 2015 (Note 36) Reserve fund, beginning of year 30.9 34.2 Principal withdrawals (15.4) (3.3) Earnings withdrawn (0.4) - Net discount 0.2 0.1 Mark-to-market adjustment (0.4) (0.1) Reserve fund, end of year 14.9 30.9 Less: current portion (4.9) (10.8) 10.0 20.1
25

NALCOR ENERGY NOTES TO THE CONSOLIDATED FINANCIAL STATEMENTS
(e) As at December 31, 2016, sinking funds include $267.0 million (2015 - $242.6 million) related to repayment of Hydro's long-term debt and $40.1 million (2015 - $41.0 million) related to funding of Nalcor's long-term payable under the Upper Churchill Redress Agreement (UCRA). Sinking fund investments consist of bonds, debentures, promissory notes and coupons issued by, or guaranteed by, the Government of Canada, provincial governments or Schedule 1 banks, and have maturity dates ranging from 2017 to 2041. Hydro debentures, which are intended to be held to maturity, are deducted from debt while all other sinking fund investments are shown separately on the Consolidated Statement of Financial Position as assets. Annual contributions to the various sinking funds are in accordance with bond indenture terms, and are structured to ensure the availability of adequate funds at the time of expected bond redemption. Effective yields range from 0.97% to 9.12% (2015 - 1.22% to 9.12%). Nalcor's sinking funds are held to fund the annual payments to the Innu Nation as required under the UCRA. The sinking funds consist of the following:
As at December 31 (millions of Canadian dollars) 2016 2015 Sinking funds, beginning of year 283.6 268.6 Contributions 8.1 8.1 Earnings 13.8 6.8 Disposals (1.6) (1.5) Mark-to-market adjustment 3.2 1.6 Sinking funds, end of year 307.1 283.6 Less: current portion (76.8) (1.6) 230.3 282.0 Sinking fund instalments due for the next five years are as follows: (millions of Canadian dollars) 2017 2018 2019 2020 2021 Sinking fund instalments 6.7 6.7 6.7 6.7 6.7
26
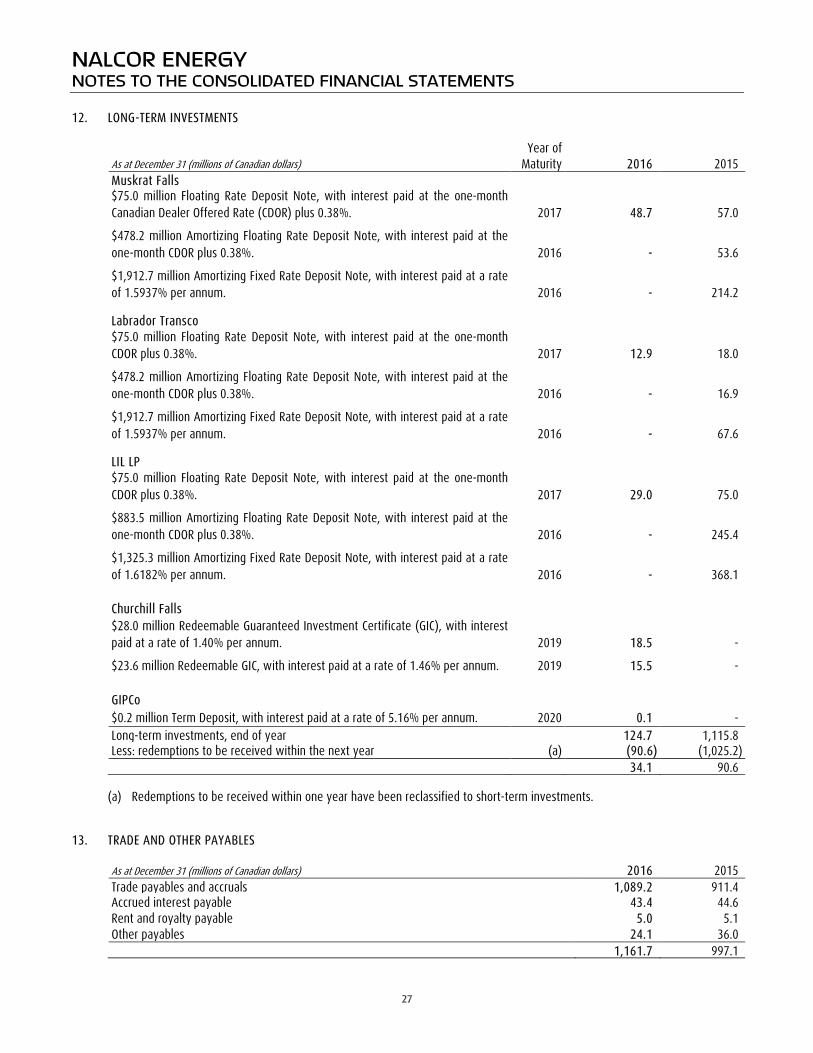
NALCOR ENERGY NOTES TO THE CONSOLIDATED FINANCIAL STATEMENTS 12. LONG-TERM INVESTMENTS
Year of As at December 31 (millions of Canadian dollars) Maturity 2016 2015 Muskrat Falls
$75.0 million Floating Rate Deposit Note, with interest paid at the one-month Canadian Dealer Offered Rate (CDOR) plus 0.38%. 2017 48.7 57.0
$478.2 million Amortizing Floating Rate Deposit Note, with interest paid at the one-month CDOR plus 0.38%. 2016 - 53.6
$1,912.7 million Amortizing Fixed Rate Deposit Note, with interest paid at a rate of 1.5937% per annum. 2016 - 214.2
Labrador Transco
$75.0 million Floating Rate Deposit Note, with interest paid at the one-month CDOR plus 0.38%. 2017 12.9 18.0
$478.2 million Amortizing Floating Rate Deposit Note, with interest paid at the one-month CDOR plus 0.38%. 2016 - 16.9
$1,912.7 million Amortizing Fixed Rate Deposit Note, with interest paid at a rate of 1.5937% per annum. 2016 - 67.6
LIL LP
$75.0 million Floating Rate Deposit Note, with interest paid at the one-month CDOR plus 0.38%. 2017 29.0 75.0
$883.5 million Amortizing Floating Rate Deposit Note, with interest paid at the one-month CDOR plus 0.38%. 2016 - 245.4
$1,325.3 million Amortizing Fixed Rate Deposit Note, with interest paid at a rate of 1.6182% per annum. 2016 - 368.1
Churchill Falls
$28.0 million Redeemable Guaranteed Investment Certificate (GIC), with interest paid at a rate of 1.40% per annum. 2019 18.5 -
$23.6 million Redeemable GIC, with interest paid at a rate of 1.46% per annum. 2019 15.5 - GIPCo $0.2 million Term Deposit, with interest paid at a rate of 5.16% per annum. 2020 0.1 - Long-term investments, end of year 124.7 1,115.8 Less: redemptions to be received within the next year (a) (90.6) (1,025.2) 34.1 90.6
(a) Redemptions to be received within one year have been reclassified to short-term investments. 13. TRADE AND OTHER PAYABLES As at December 31 (millions of Canadian dollars) 2016 2015 Trade payables and accruals 1,089.2 911.4 Accrued interest payable 43.4 44.6 Rent and royalty payable 5.0 5.1 Other payables 24.1 36.0 1,161.7 997.1
27
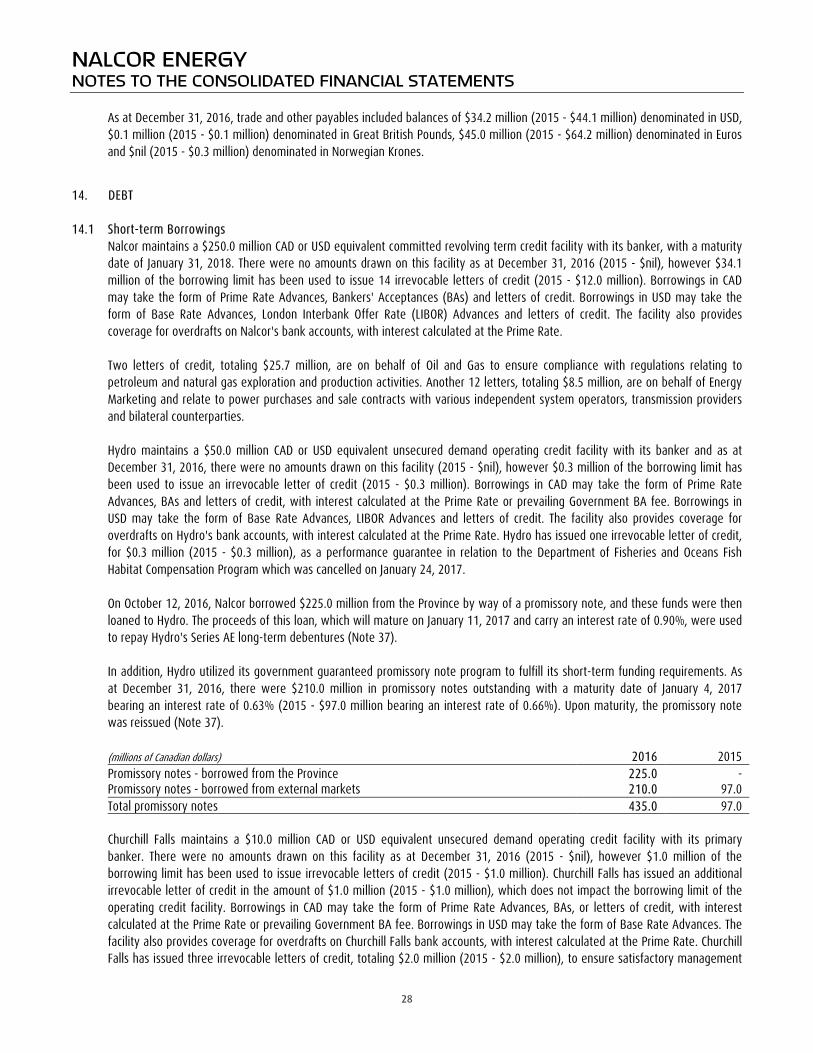
NALCOR ENERGY NOTES TO THE CONSOLIDATED FINANCIAL STATEMENTS
As at December 31, 2016, trade and other payables included balances of $34.2 million (2015 - $44.1 million) denominated in USD, $0.1 million (2015 - $0.1 million) denominated in Great British Pounds, $45.0 million (2015 - $64.2 million) denominated in Euros and $nil (2015 - $0.3 million) denominated in Norwegian Krones.
14. DEBT 14.1 Short-term Borrowings
Nalcor maintains a $250.0 million CAD or USD equivalent committed revolving term credit facility with its banker, with a maturity date of January 31, 2018. There were no amounts drawn on this facility as at December 31, 2016 (2015 - $nil), however $34.1 million of the borrowing limit has been used to issue 14 irrevocable letters of credit (2015 - $12.0 million). Borrowings in CAD may take the form of Prime Rate Advances, Bankers' Acceptances (BAs) and letters of credit. Borrowings in USD may take the form of Base Rate Advances, London Interbank Offer Rate (LIBOR) Advances and letters of credit. The facility also provides coverage for overdrafts on Nalcor's bank accounts, with interest calculated at the Prime Rate. Two letters of credit, totaling $25.7 million, are on behalf of Oil and Gas to ensure compliance with regulations relating to petroleum and natural gas exploration and production activities. Another 12 letters, totaling $8.5 million, are on behalf of Energy Marketing and relate to power purchases and sale contracts with various independent system operators, transmission providers and bilateral counterparties. Hydro maintains a $50.0 million CAD or USD equivalent unsecured demand operating credit facility with its banker and as at December 31, 2016, there were no amounts drawn on this facility (2015 - $nil), however $0.3 million of the borrowing limit has been used to issue an irrevocable letter of credit (2015 - $0.3 million). Borrowings in CAD may take the form of Prime Rate Advances, BAs and letters of credit, with interest calculated at the Prime Rate or prevailing Government BA fee. Borrowings in USD may take the form of Base Rate Advances, LIBOR Advances and letters of credit. The facility also provides coverage for overdrafts on Hydro's bank accounts, with interest calculated at the Prime Rate. Hydro has issued one irrevocable letter of credit, for $0.3 million (2015 - $0.3 million), as a performance guarantee in relation to the Department of Fisheries and Oceans Fish Habitat Compensation Program which was cancelled on January 24, 2017. On October 12, 2016, Nalcor borrowed $225.0 million from the Province by way of a promissory note, and these funds were then loaned to Hydro. The proceeds of this loan, which will mature on January 11, 2017 and carry an interest rate of 0.90%, were used to repay Hydro's Series AE long-term debentures (Note 37). In addition, Hydro utilized its government guaranteed promissory note program to fulfill its short-term funding requirements. As at December 31, 2016, there were $210.0 million in promissory notes outstanding with a maturity date of January 4, 2017 bearing an interest rate of 0.63% (2015 - $97.0 million bearing an interest rate of 0.66%). Upon maturity, the promissory note was reissued (Note 37). (millions of Canadian dollars) 2016 2015 Promissory notes - borrowed from the Province 225.0 - Promissory notes - borrowed from external markets 210.0 97.0 Total promissory notes 435.0 97.0 Churchill Falls maintains a $10.0 million CAD or USD equivalent unsecured demand operating credit facility with its primary banker. There were no amounts drawn on this facility as at December 31, 2016 (2015 - $nil), however $1.0 million of the borrowing limit has been used to issue irrevocable letters of credit (2015 - $1.0 million). Churchill Falls has issued an additional irrevocable letter of credit in the amount of $1.0 million (2015 - $1.0 million), which does not impact the borrowing limit of the operating credit facility. Borrowings in CAD may take the form of Prime Rate Advances, BAs, or letters of credit, with interest calculated at the Prime Rate or prevailing Government BA fee. Borrowings in USD may take the form of Base Rate Advances. The facility also provides coverage for overdrafts on Churchill Falls bank accounts, with interest calculated at the Prime Rate. Churchill Falls has issued three irrevocable letters of credit, totaling $2.0 million (2015 - $2.0 million), to ensure satisfactory management
28

NALCOR ENERGY NOTES TO THE CONSOLIDATED FINANCIAL STATEMENTS
of its waste management and compliance with a certificate of approval for the transportation of special hazardous wastes granted by the Department of Environment and Conservation. Oil and Gas maintains a $30.0 million (2015 - $5.0 million) USD or CAD equivalent unsecured credit facility with its banker and as at December 31, 2016, there were no amounts drawn on this facility (2015 - $nil). Borrowings in CAD may take the form of Prime Rate Advances and letters of credit. Borrowings in USD may take the form of Base Rate Advances and letters of credit. During the year, Oil and Gas issued an irrevocable letter of guarantee in the amount of $0.5 million to the Canada-Newfoundland and Labrador Offshore Petroleum Board, to satisfy liability requirements related to seabed mapping and geochemical sample acquisition work being carried out by a third party. Energy Marketing maintains a $20.0 million CAD or USD equivalent demand operating credit facility with its banker, and as at December 31, 2016, there were no amounts drawn on this facility (2015 - $8.2 million). This facility has an unconditional and irrevocable guarantee from Nalcor. Borrowings in CAD may take the form of Prime Rate Advances, BAs and letters of credit. Borrowings in USD may take the form of Base Rate Advances, LIBOR Advances and letters of credit.
14.2 Long-term Debt The following table represents the value of long-term debt measured at amortized cost: Face Coupon Year of Year of As at December 31 (millions of Canadian dollars) Value Rate % Issue Maturity 2016 2015 Hydro V 0.2 10.50 1989 2014 0.2 0.3 X* 150.0 10.25 1992 2017 149.9 149.8 Y* 300.0 8.40 1996 2026 295.0 294.7 AB* 300.0 6.65 2001 2031 305.5 305.7 AD* 125.0 5.70 2003 2033 123.8 123.8 AE 225.0 4.30 2006 2016 - 224.8 AF 200.0 3.60 2014 2045 197.2 197.1 LIL LP Tranche A 725.0 3.76 2013 2033 725.3 725.3 Tranche B 600.0 3.86 2013 2045 600.1 600.1 Tranche C 1,075.0 3.85 2013 2053 1,075.2 1,075.2 Labrador Transco/Muskrat Falls Tranche A 650.0 3.63 2013 2029 650.2 650.2 Tranche B 675.0 3.83 2013 2037 675.1 675.1 Tranche C 1,275.0 3.86 2013 2048 1,275.2 1,275.2 Total debentures 6,300.2 6,072.7 6,297.3 Less: Sinking fund investments in own debentures 57.3 55.8 6,015.4 6,241.5 Less: payments due within one year (142.6) (233.4) 5,872.8 6,008.1 *Sinking funds have been established for these issues.
Hydro’s promissory notes and debentures are unsecured and unconditionally guaranteed as to principal and interest and, where applicable, sinking fund payments, by the Province. The Province charges Hydro a guarantee fee of 25 basis points annually on the total debt (net of sinking funds) with a remaining term to maturity less than 10 years and 50 basis points annually on total debt (net of sinking funds) with a remaining term to maturity greater than 10 years. The fee for the year ended December 31, 2016 was $4.5 million (2015 - $4.5 million).
29
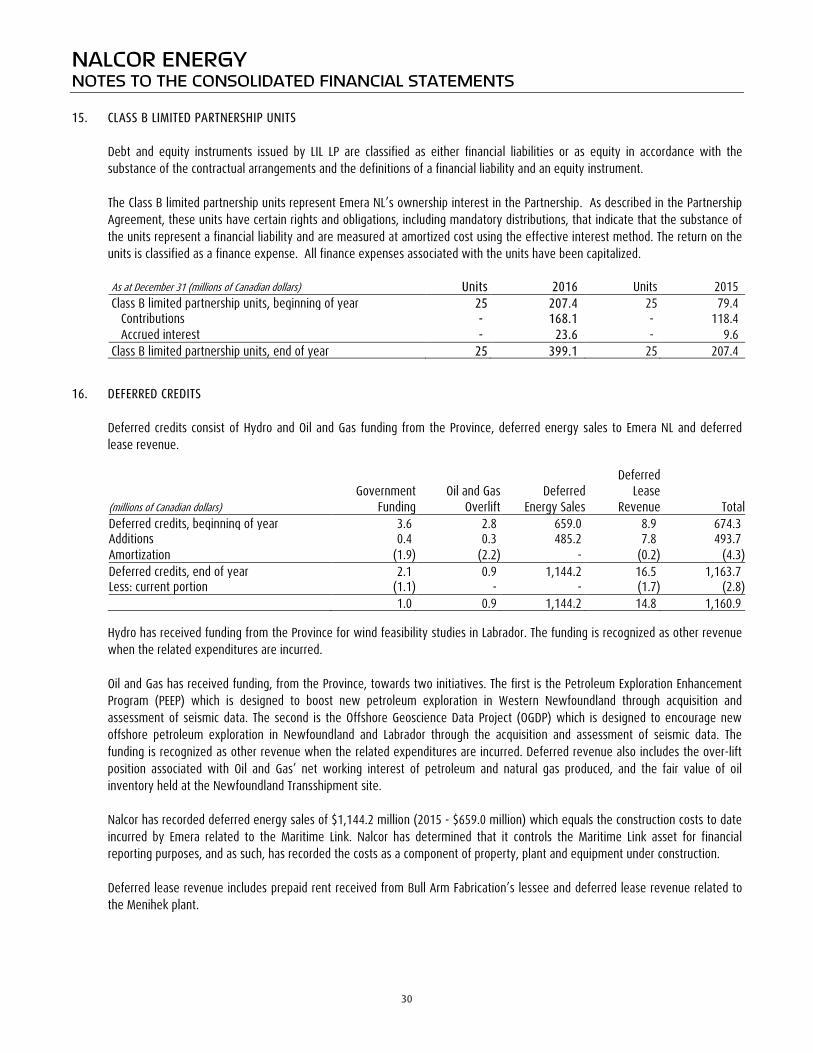
NALCOR ENERGY NOTES TO THE CONSOLIDATED FINANCIAL STATEMENTS 15. CLASS B LIMITED PARTNERSHIP UNITS Debt and equity instruments issued by LIL LP are classified as either financial liabilities or as equity in accordance with the
substance of the contractual arrangements and the definitions of a financial liability and an equity instrument. The Class B limited partnership units represent Emera NL’s ownership interest in the Partnership. As described in the Partnership
Agreement, these units have certain rights and obligations, including mandatory distributions, that indicate that the substance of the units represent a financial liability and are measured at amortized cost using the effective interest method. The return on the units is classified as a finance expense. All finance expenses associated with the units have been capitalized.
As at December 31 (millions of Canadian dollars) Units 2016 Units 2015 Class B limited partnership units, beginning of year 25 207.4 25 79.4 Contributions - 168.1 - 118.4 Accrued interest - 23.6 - 9.6 Class B limited partnership units, end of year 25 399.1 25 207.4 16. DEFERRED CREDITS Deferred credits consist of Hydro and Oil and Gas funding from the Province, deferred energy sales to Emera NL and deferred
lease revenue. Deferred Government Oil and Gas Deferred Lease (millions of Canadian dollars) Funding Overlift Energy Sales Revenue Total Deferred credits, beginning of year 3.6 2.8 659.0 8.9 674.3 Additions 0.4 0.3 485.2 7.8 493.7 Amortization (1.9) (2.2) - (0.2) (4.3) Deferred credits, end of year 2.1 0.9 1,144.2 16.5 1,163.7 Less: current portion (1.1) - - (1.7) (2.8) 1.0 0.9 1,144.2 14.8 1,160.9
Hydro has received funding from the Province for wind feasibility studies in Labrador. The funding is recognized as other revenue when the related expenditures are incurred. Oil and Gas has received funding, from the Province, towards two initiatives. The first is the Petroleum Exploration Enhancement Program (PEEP) which is designed to boost new petroleum exploration in Western Newfoundland through acquisition and assessment of seismic data. The second is the Offshore Geoscience Data Project (OGDP) which is designed to encourage new offshore petroleum exploration in Newfoundland and Labrador through the acquisition and assessment of seismic data. The funding is recognized as other revenue when the related expenditures are incurred. Deferred revenue also includes the over-lift position associated with Oil and Gas’ net working interest of petroleum and natural gas produced, and the fair value of oil inventory held at the Newfoundland Transshipment site. Nalcor has recorded deferred energy sales of $1,144.2 million (2015 - $659.0 million) which equals the construction costs to date incurred by Emera related to the Maritime Link. Nalcor has determined that it controls the Maritime Link asset for financial reporting purposes, and as such, has recorded the costs as a component of property, plant and equipment under construction. Deferred lease revenue includes prepaid rent received from Bull Arm Fabrication’s lessee and deferred lease revenue related to the Menihek plant.
30

NALCOR ENERGY NOTES TO THE CONSOLIDATED FINANCIAL STATEMENTS 17. DEFERRED CONTRIBUTIONS Nalcor has received contributions in aid of construction of property, plant and equipment. These contributions are deferred and
amortized to other revenue over the life of the related property, plant and equipment asset. As at December 31 (millions of Canadian dollars) 2016 2015 (Note 36) Deferred contributions, beginning of year 12.2 15.3 Additions 1.1 1.4 Disposals (0.1) (3.6) Amortization (1.0) (0.9) Deferred contributions, end of year 12.2 12.2 Less: current portion (1.1) (1.1) 11.1 11.1 18. DECOMMISSIONING LIABILITIES
Nalcor has recognized liabilities associated with the retirement of portions of the HTGS, disposal of Polychlorinated Biphenyls (PCB) and decommissioning liabilities resulting from its net ownership interests in petroleum and natural gas properties and related well sites. The reconciliation of beginning and ending carrying amounts of decommissioning liabilities as at December 31, 2016 and December 31, 2015 are as follows:
As at December 31 (millions of Canadian dollars) 2016 2015 Decommissioning liabilities, beginning of year 103.0 43.2 Liabilities settled (0.8) (0.2) Accretion 3.8 1.4 Revisions (23.3) 58.6 Decommissioning liabilities, end of year 82.7 103.0 Less: current portion (1.0) (1.0) 81.7 102.0
The total estimated undiscounted cash flows required to settle the HTGS obligations at December 31, 2016 are $15.2 million (2015 - $32.1 million). The HTGS decommissioning obligation decreased from 2015 primarily due to an updated assumption that Holyrood will be used as an industrial site for the foreseeable future because of the operation of assets such as Holyrood CT and the black start diesels. Payments to settle the liabilities are expected to occur between 2020 and 2023. The fair value of the decommissioning liabilities was determined using the present value of future cash flows discounted at Hydro’s credit adjusted risk free rate of 2.5% (2015 - 2.3%). Hydro has recorded $13.4 million (2015 - $27.0 million) related to HTGS obligations.
The total estimated undiscounted cash flows required to settle the PCB obligations at December 31, 2016 are $2.7 million (2015 - $2.0 million). Payments to settle the liabilities are expected to occur between 2017 and 2025. The fair value of the decommissioning liabilities was determined using the present value of future cash flows discounted at Hydro’s and Churchill Falls’ credit adjusted risk free rates of 2.9% to 3.7% (2015 - 2.6% to 3.8%). Hydro and Churchill Falls have recorded $2.4 million (2015 - $1.8 million) related to PCB obligations. Oil and Gas’ decommissioning liabilities result from net ownership interests in petroleum and natural gas properties and related well sites. The total undiscounted estimated cash flows required to settle the obligations, including a rate of inflation of 2%, at December 31, 2016 are $116.8 million (2015 - $137.4 million). Payments to settle the liabilities are expected to occur between 2017 and 2030. The fair value of the decommissioning liabilities was determined using the present value of future cash flows discounted at rates ranging from 4.0% to 4.3% (2015 - 3.6% to 4.4%).
31

NALCOR ENERGY NOTES TO THE CONSOLIDATED FINANCIAL STATEMENTS
A significant number of Nalcor’s assets include generation plants, transmission assets and distribution systems. These assets can continue to run indefinitely with ongoing maintenance activities. As it is expected that Nalcor’s assets will be used for an indefinite period, no removal date can be determined and consequently, a reasonable estimate of the fair value of any related decommissioning liability cannot be determined at this time. If it becomes possible to estimate the fair value of the cost of removing assets that Nalcor is required to remove, a decommissioning liability for those assets will be recognized at that time.
19. LONG-TERM PAYABLES
As at December 31, 2016, long-term payables consist of a payable to the Innu Nation under the UCRA and a payable to the Innu Nation under the Impact and Benefits Agreement (IBA).
As at December 31 (millions of Canadian dollars) 2016 2015 Long-term payables, beginning of year 77.1 82.2 Payments (15.1) (7.3) Additions and revisions - (1.5) Accretion 3.3 3.7 65.3 77.1 Less: current portion (7.2) (14.5) Long-term payables, end of year 58.1 62.6
Under the UCRA, Nalcor is required to pay to the Innu Nation $2.0 million annually, escalating by 2.5% annually until 2041. At December 31, 2016, $2.2 million (2015 - $2.2 million) of the amount is current and is recorded in trade and other payables. Nalcor has sinking funds in the amount of $40.1 million (2015 - $40.9 million) to fund these future obligations. Under the IBA, Nalcor is required to make annual payments to the Innu Nation that commenced upon sanction of the Muskrat Falls hydroelectric plant. The Muskrat Falls hydroelectric plant was sanctioned in December 2012 and the first IBA payment was made at that time. The IBA requires annual payments of $5.0 million escalating by an annual consumer price index from sanction until first commercial power. The present value of the remaining payments using a discount rate of 2.7% (2015 - 2.6%) is $27.9 million (2015 - $20.3 million). The current portion of the payable at December 31, 2016 is $5.0 million (2015 - $5.0 million) and is recorded in trade and other payables. As at December 31, 2015, a long-term payable related to the Hebron Benefits Agreement Drilling Equipment Set Settlement Agreement of $7.3 million was reclassified to trade and other payables. The balance was paid in 2016.
20. EMPLOYEE FUTURE BENEFITS
20.1 Pension Plan Employees participate in the Province’s Public Service Pension Plan, a multi-employer defined benefit plan. The employer’s contributions of $12.0 million (2015 - $11.7 million) are expensed as incurred.
20.2 Other Benefits
Nalcor provides group life insurance and health care benefits on a cost shared basis to retired employees, and in certain cases, their surviving spouses, in addition to a severance payment upon retirement. In 2016, cash payments to beneficiaries for its unfunded other employee future benefits were $8.9 million (2015 - $3.3 million). An actuarial valuation was performed as at December 31, 2016.
32
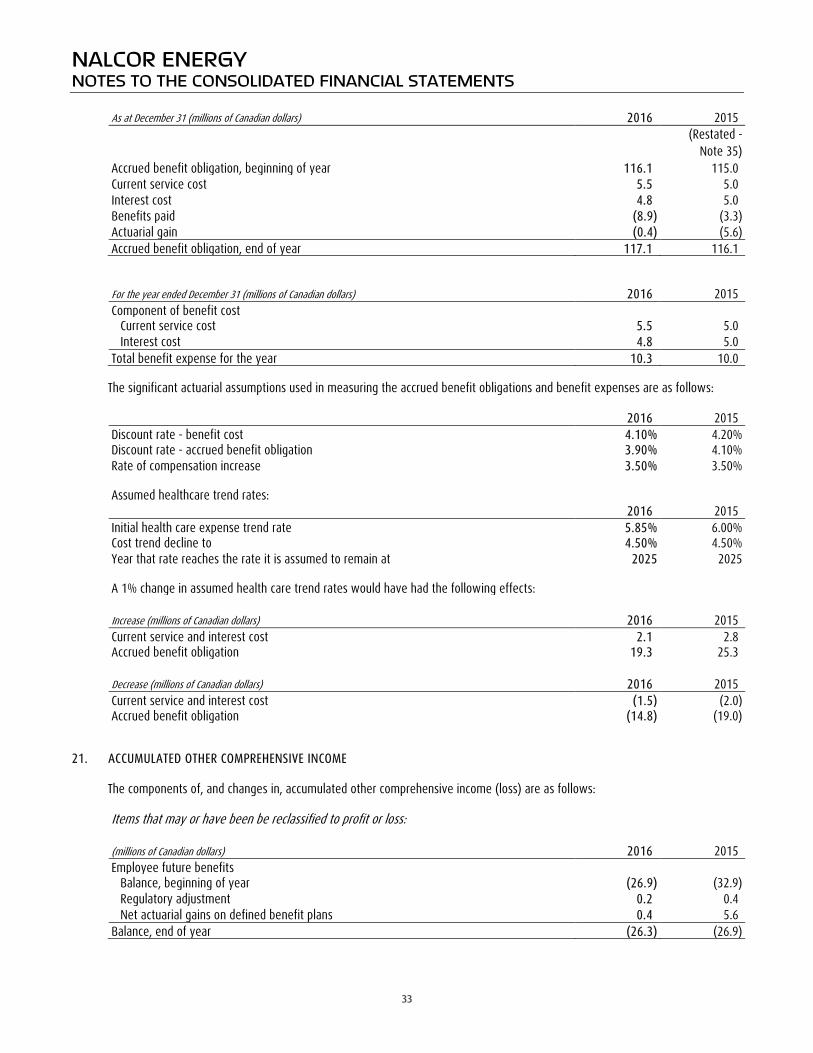
NALCOR ENERGY NOTES TO THE CONSOLIDATED FINANCIAL STATEMENTS As at December 31 (millions of Canadian dollars) 2016 2015
(Restated -
Note 35) Accrued benefit obligation, beginning of year 116.1 115.0 Current service cost 5.5 5.0 Interest cost 4.8 5.0 Benefits paid (8.9) (3.3) Actuarial gain (0.4) (5.6) Accrued benefit obligation, end of year 117.1 116.1 For the year ended December 31 (millions of Canadian dollars) 2016 2015 Component of benefit cost Current service cost 5.5 5.0 Interest cost 4.8 5.0 Total benefit expense for the year 10.3 10.0
The significant actuarial assumptions used in measuring the accrued benefit obligations and benefit expenses are as follows: 2016 2015 Discount rate - benefit cost 4.10% 4.20% Discount rate - accrued benefit obligation 3.90% 4.10% Rate of compensation increase 3.50% 3.50% Assumed healthcare trend rates: 2016 2015 Initial health care expense trend rate 5.85% 6.00% Cost trend decline to 4.50% 4.50% Year that rate reaches the rate it is assumed to remain at 2025 2025 A 1% change in assumed health care trend rates would have had the following effects: Increase (millions of Canadian dollars) 2016 2015 Current service and interest cost 2.1 2.8 Accrued benefit obligation 19.3 25.3 Decrease (millions of Canadian dollars) 2016 2015 Current service and interest cost (1.5) (2.0) Accrued benefit obligation (14.8) (19.0) 21. ACCUMULATED OTHER COMPREHENSIVE INCOME
The components of, and changes in, accumulated other comprehensive income (loss) are as follows: Items that may or have been be reclassified to profit or loss: (millions of Canadian dollars) 2016 2015 Employee future benefits Balance, beginning of year (26.9) (32.9) Regulatory adjustment 0.2 0.4 Net actuarial gains on defined benefit plans 0.4 5.6 Balance, end of year (26.3) (26.9)
33
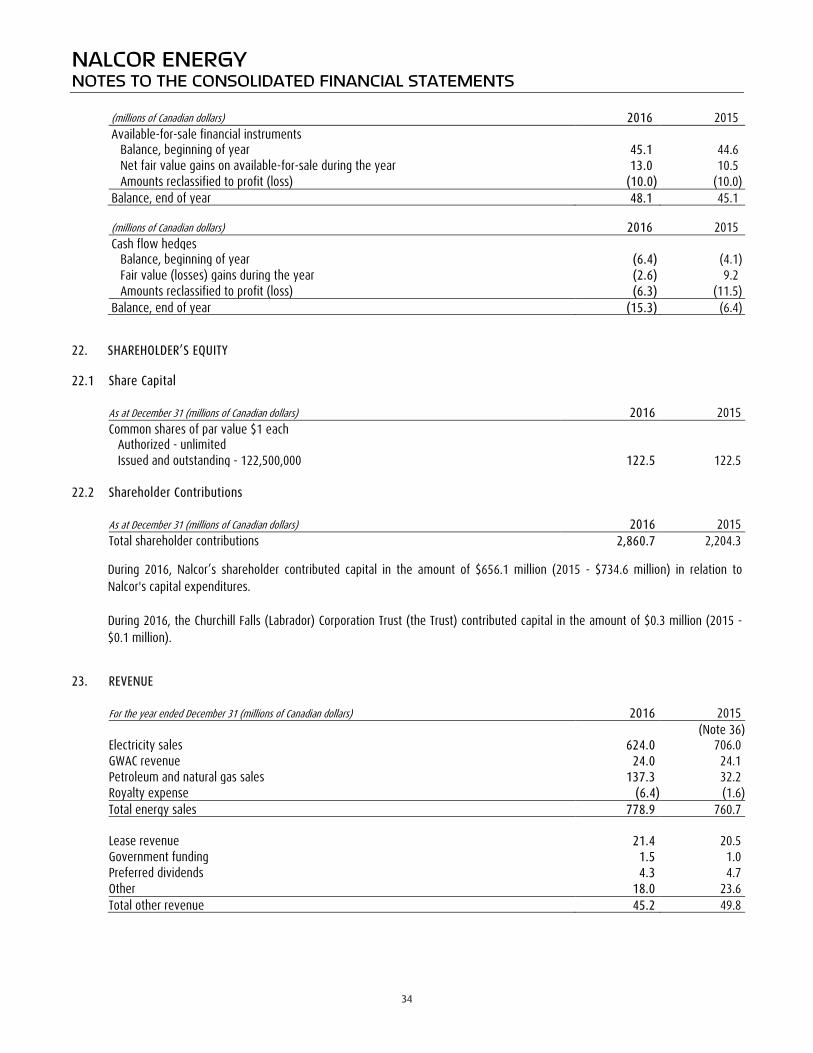
NALCOR ENERGY NOTES TO THE CONSOLIDATED FINANCIAL STATEMENTS (millions of Canadian dollars) 2016 2015 Available-for-sale financial instruments Balance, beginning of year 45.1 44.6 Net fair value gains on available-for-sale during the year 13.0 10.5 Amounts reclassified to profit (loss) (10.0) (10.0) Balance, end of year 48.1 45.1 (millions of Canadian dollars) 2016 2015 Cash flow hedges Balance, beginning of year (6.4) (4.1) Fair value (losses) gains during the year (2.6) 9.2 Amounts reclassified to profit (loss) (6.3) (11.5) Balance, end of year (15.3) (6.4) 22. SHAREHOLDER’S EQUITY 22.1 Share Capital As at December 31 (millions of Canadian dollars) 2016 2015 Common shares of par value $1 each Authorized - unlimited Issued and outstanding - 122,500,000 122.5 122.5 22.2 Shareholder Contributions As at December 31 (millions of Canadian dollars) 2016 2015 Total shareholder contributions 2,860.7 2,204.3
During 2016, Nalcor’s shareholder contributed capital in the amount of $656.1 million (2015 - $734.6 million) in relation to Nalcor's capital expenditures. During 2016, the Churchill Falls (Labrador) Corporation Trust (the Trust) contributed capital in the amount of $0.3 million (2015 - $0.1 million).
23. REVENUE For the year ended December 31 (millions of Canadian dollars) 2016 2015 (Note 36) Electricity sales 624.0 706.0 GWAC revenue 24.0 24.1 Petroleum and natural gas sales 137.3 32.2 Royalty expense (6.4) (1.6) Total energy sales 778.9 760.7 Lease revenue 21.4 20.5 Government funding 1.5 1.0 Preferred dividends 4.3 4.7 Other 18.0 23.6 Total other revenue 45.2 49.8
34

NALCOR ENERGY NOTES TO THE CONSOLIDATED FINANCIAL STATEMENTS 24. OPERATING COSTS For the year ended December 31 (millions of Canadian dollars) 2016 2015 Salaries and benefits 126.9 138.0 Maintenance and materials 32.6 39.3 Professional services 17.4 31.1 Travel and transportation 6.0 8.8 Rental and royalty 4.9 5.1 Equipment rental 4.0 6.1 Other operating costs 15.5 15.1 207.3 243.5 25. OIL PRODUCTION, MARKETING AND TRANSPORTATION COSTS Oil production, marketing and transportation costs include costs incurred by Oil and Gas related to the operating, processing and
transportation of oil. For the year ended December 31 (millions of Canadian dollars) 2016 2015 Project operating costs 16.0 7.7 Processing and marketing expense 6.1 1.7 Transportation and transshipment expense 4.2 2.7 26.3 12.1 26. TRANSMISSION RENTAL AND MARKET FEES Transmission rental and market fees incurred by Energy Marketing are related to the sale and transmission of energy to export
markets. For the year ended December 31 (millions of Canadian dollars) 2016 2015 Transmission rental 21.4 20.2 Market fees 0.7 1.2 22.1 21.4
35

NALCOR ENERGY NOTES TO THE CONSOLIDATED FINANCIAL STATEMENTS 27. NET FINANCE (INCOME) EXPENSE For the year ended December 31 (millions of Canadian dollars) 2016 2015 Finance income Interest on sinking fund 15.3 14.7 Interest on reserve fund 0.7 0.9 Interest on investments 8.4 31.1 Interest on restricted cash 14.6 12.4 Other interest income 2.0 1.1 41.0 60.2 Finance expense Long-term debt 272.9 275.0 Class B limited partnership units 23.6 9.6 Debt guarantee fee 4.5 4.5 Accretion 7.6 5.6 Other 2.8 1.4 311.4 296.1 Interest capitalized during construction (198.3) (162.4) 113.1 133.7 Net finance (income) expense 72.1 73.5 28. OTHER (INCOME) EXPENSE For the year ended December 31 (millions of Canadian dollars) 2016 2015 Mark-to-market commodity swaps - 4.0 Mark-to-market foreign exchange forward contracts - (0.5) Settlement of commodity swaps (9.7) (20.2) Settlement of foreign exchange forward contracts (0.3) 8.1 Financial transmission rights income and amortization (1.6) (1.6) Loss on disposal of property, plant and equipment 7.2 4.3 Asset disposal costs 0.5 1.8 Mark-to-market of open market - (0.1) Insurance proceeds - (0.1) Unrealized foreign exchange loss 0.6 3.3 Realized foreign exchange loss 0.3 1.1 Other (1.0) 3.1 Other (income) expense (4.0) 3.2 29. FINANCIAL INSTRUMENTS AND RISK MANAGEMENT
29.1 Fair Value The estimated fair values of financial instruments as at December 31, 2016 and December 31, 2015 are based on relevant market prices and information available at the time. Fair value estimates are based on valuation techniques which are significantly affected by the assumptions used including the amount and timing of future cash flows and discount rates reflecting various degrees of risk. As such, the fair value estimates below are not necessarily indicative of the amounts that Nalcor might receive or incur in actual market transactions.
As a significant number of Nalcor’s assets and liabilities do not meet the definition of a financial instrument, the fair value estimates below do not reflect the fair value of Nalcor as a whole. Establishing Fair Value Financial instruments recorded at fair value are classified using a fair value hierarchy that reflects the nature of the inputs used in
36
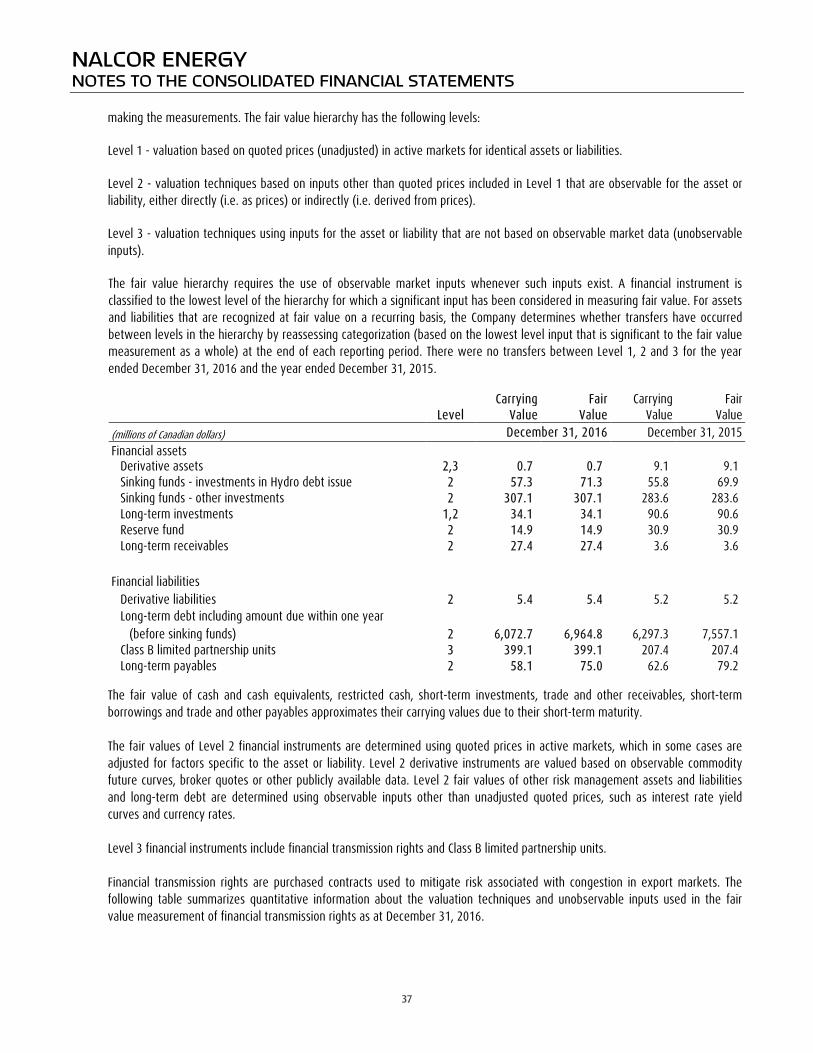
NALCOR ENERGY NOTES TO THE CONSOLIDATED FINANCIAL STATEMENTS
making the measurements. The fair value hierarchy has the following levels:
Level 1 - valuation based on quoted prices (unadjusted) in active markets for identical assets or liabilities.
Level 2 - valuation techniques based on inputs other than quoted prices included in Level 1 that are observable for the asset or liability, either directly (i.e. as prices) or indirectly (i.e. derived from prices).
Level 3 - valuation techniques using inputs for the asset or liability that are not based on observable market data (unobservable inputs).
The fair value hierarchy requires the use of observable market inputs whenever such inputs exist. A financial instrument is classified to the lowest level of the hierarchy for which a significant input has been considered in measuring fair value. For assets and liabilities that are recognized at fair value on a recurring basis, the Company determines whether transfers have occurred between levels in the hierarchy by reassessing categorization (based on the lowest level input that is significant to the fair value measurement as a whole) at the end of each reporting period. There were no transfers between Level 1, 2 and 3 for the year ended December 31, 2016 and the year ended December 31, 2015.
Carrying Fair Carrying Fair Level Value Value Value Value (millions of Canadian dollars) December 31, 2016 December 31, 2015 Financial assets Derivative assets 2,3 0.7 0.7 9.1 9.1 Sinking funds - investments in Hydro debt issue 2 57.3 71.3 55.8 69.9 Sinking funds - other investments 2 307.1 307.1 283.6 283.6 Long-term investments 1,2 34.1 34.1 90.6 90.6 Reserve fund 2 14.9 14.9 30.9 30.9 Long-term receivables 2 27.4 27.4 3.6 3.6 Financial liabilities Derivative liabilities 2 5.4 5.4 5.2 5.2 Long-term debt including amount due within one year (before sinking funds) 2 6,072.7 6,964.8 6,297.3 7,557.1 Class B limited partnership units 3 399.1 399.1 207.4 207.4 Long-term payables 2 58.1 75.0 62.6 79.2
The fair value of cash and cash equivalents, restricted cash, short-term investments, trade and other receivables, short-term borrowings and trade and other payables approximates their carrying values due to their short-term maturity. The fair values of Level 2 financial instruments are determined using quoted prices in active markets, which in some cases are adjusted for factors specific to the asset or liability. Level 2 derivative instruments are valued based on observable commodity future curves, broker quotes or other publicly available data. Level 2 fair values of other risk management assets and liabilities and long-term debt are determined using observable inputs other than unadjusted quoted prices, such as interest rate yield curves and currency rates. Level 3 financial instruments include financial transmission rights and Class B limited partnership units. Financial transmission rights are purchased contracts used to mitigate risk associated with congestion in export markets. The following table summarizes quantitative information about the valuation techniques and unobservable inputs used in the fair value measurement of financial transmission rights as at December 31, 2016.
37

NALCOR ENERGY NOTES TO THE CONSOLIDATED FINANCIAL STATEMENTS Significant Carrying Valuation Unobservable (millions of Canadian dollars) Value Techniques Input(s) Range
Derivative assets (Financial transmission rights) 0.7 Modelled
pricing Price, seasonality and market
factors 9-26%
Methodologies for calculating the fair values of financial transmission rights are determined by using underlying contractual data as well as observable and unobservable inputs. Fair value methodologies are reviewed by Management on a quarterly basis to assess the reasonability of the assumptions made and models are adjusted as necessary for significant expected changes in fair value due to changes in key inputs. As at December 31, 2016, the effect of using reasonably possible alternative assumptions regarding the unobservable implied volatilities may have resulted in $0.1 million to $0.2 million change in the carrying value of the financial transmission rights.
The Class B limited partnership units are carried at amortized cost calculated using the effective interest method. The effective interest rate is defined in the Newfoundland and Labrador Development Agreement as Emera NL's rate of return on equity (RROE), and is equal to the rate approved by the PUB for privately-owned regulated electrical utilities. Due to the unobservable nature of the effective interest rate and cash flows associated with the units, the fair value is assumed to approximate carrying value and the instruments have therefore been classified as Level 3.
The table below sets forth a summary of changes in fair value of the Class B limited partnership units given a one percent change in the discount rate while holding other variables constant: (millions of Canadian dollars) 1% Increase 1% Decrease Class B limited partnership units (5.6) 5.5
29.2 Risk Management Nalcor is exposed to certain credit, liquidity and market price risks through its operating, financing and investing activities.
Financial risk is managed in accordance with a Board approved policy, which outlines the objectives and strategies for the management of financial risk, including the use of derivative contracts. Permitted financial risk management strategies are aimed at minimizing the volatility of Nalcor’s expected future cash flows.
Credit Risk Nalcor’s expected future cash flows are exposed to credit risk through its operating activities, primarily due to the potential for non-performance by its customers, and through its financing and investing activities, based on the risk of non-performance by counterparties to its financial instruments. The degree of exposure to credit risk on cash and cash equivalents, short-term investments, long-term investments and derivative assets as well as from the sale of electricity to customers, including the associated accounts receivable, is determined by the financial capacity and stability of those customers and counterparties. The maximum exposure to credit risk on these financial instruments is represented by their carrying values on the Consolidated Statement of Financial Position at the reporting date. Credit risk on cash and cash equivalents is considered to be minimal, as Nalcor’s cash deposits are held by a Schedule 1 Canadian Chartered bank with a rating of A+ (Standard and Poor’s). Credit risk on restricted cash is considered to be minimal, as Nalcor’s restricted cash deposits are held by Schedule 1 Canadian Chartered banks with a rating of AA- (Standard and Poor’s). Credit risk on short-term investments is minimized by limiting holdings to high-quality, investment grade securities issued by the Federal and Provincial governments, as well as BAs and term deposits issued by Schedule 1 Canadian Chartered banks. Credit exposure on Nalcor’s sinking funds is limited by restricting the holdings to long-term debt instruments issued by the Government of Canada or any province of Canada, Crown corporations and Schedule 1 Canadian Chartered banks. The following credit risk table provides information on credit exposures according to issuer type and credit rating for the remainder of the sinking fund’s portfolio:
38
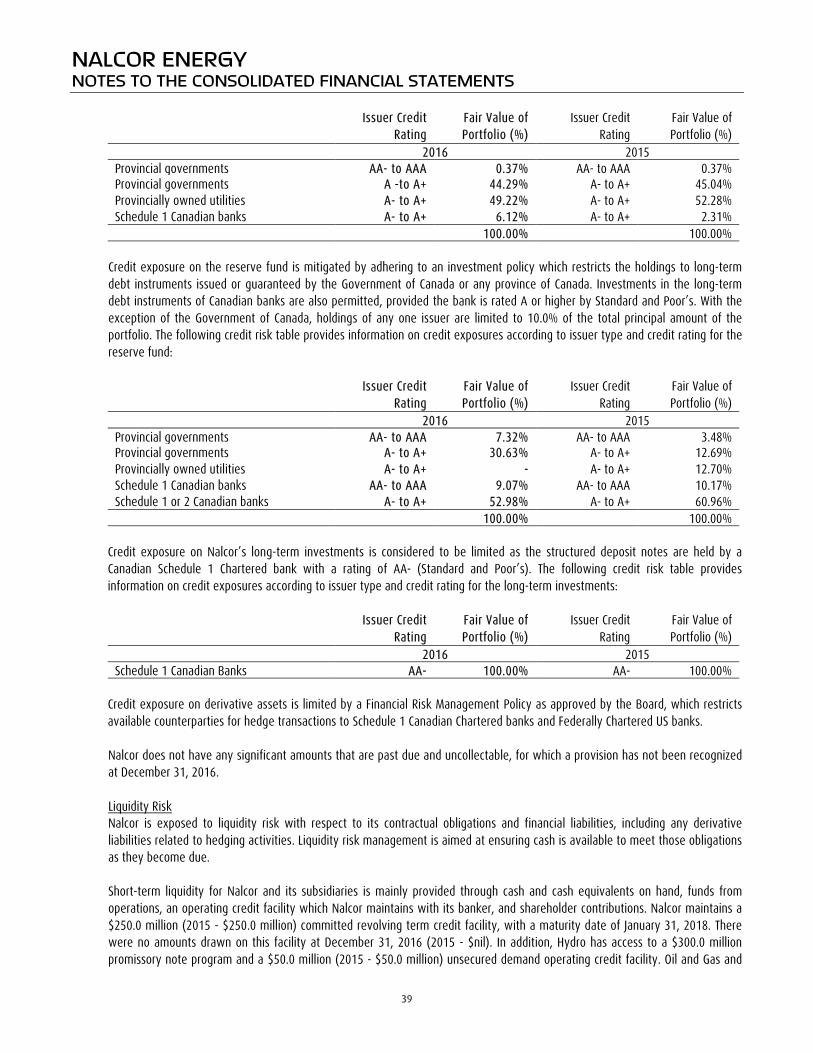
NALCOR ENERGY NOTES TO THE CONSOLIDATED FINANCIAL STATEMENTS
Issuer Credit Rating
Fair Value of Portfolio (%)
Issuer Credit Rating
Fair Value of Portfolio (%)
2016 2015 Provincial governments AA- to AAA 0.37% AA- to AAA 0.37% Provincial governments A -to A+ 44.29% A- to A+ 45.04% Provincially owned utilities A- to A+ 49.22% A- to A+ 52.28% Schedule 1 Canadian banks A- to A+ 6.12% A- to A+ 2.31% 100.00% 100.00%
Credit exposure on the reserve fund is mitigated by adhering to an investment policy which restricts the holdings to long-term debt instruments issued or guaranteed by the Government of Canada or any province of Canada. Investments in the long-term debt instruments of Canadian banks are also permitted, provided the bank is rated A or higher by Standard and Poor’s. With the exception of the Government of Canada, holdings of any one issuer are limited to 10.0% of the total principal amount of the portfolio. The following credit risk table provides information on credit exposures according to issuer type and credit rating for the reserve fund:
Issuer Credit Rating
Fair Value of Portfolio (%)
Issuer Credit Rating
Fair Value of Portfolio (%)
2016 2015 Provincial governments AA- to AAA 7.32% AA- to AAA 3.48% Provincial governments A- to A+ 30.63% A- to A+ 12.69% Provincially owned utilities A- to A+ - A- to A+ 12.70% Schedule 1 Canadian banks AA- to AAA 9.07% AA- to AAA 10.17% Schedule 1 or 2 Canadian banks A- to A+ 52.98% A- to A+ 60.96% 100.00% 100.00%
Credit exposure on Nalcor’s long-term investments is considered to be limited as the structured deposit notes are held by a Canadian Schedule 1 Chartered bank with a rating of AA- (Standard and Poor’s). The following credit risk table provides information on credit exposures according to issuer type and credit rating for the long-term investments:
Issuer Credit
Rating Fair Value of Portfolio (%)
Issuer Credit Rating
Fair Value of Portfolio (%)
2016 2015 Schedule 1 Canadian Banks AA- 100.00% AA- 100.00%
Credit exposure on derivative assets is limited by a Financial Risk Management Policy as approved by the Board, which restricts available counterparties for hedge transactions to Schedule 1 Canadian Chartered banks and Federally Chartered US banks.
Nalcor does not have any significant amounts that are past due and uncollectable, for which a provision has not been recognized at December 31, 2016. Liquidity Risk Nalcor is exposed to liquidity risk with respect to its contractual obligations and financial liabilities, including any derivative liabilities related to hedging activities. Liquidity risk management is aimed at ensuring cash is available to meet those obligations as they become due. Short-term liquidity for Nalcor and its subsidiaries is mainly provided through cash and cash equivalents on hand, funds from operations, an operating credit facility which Nalcor maintains with its banker, and shareholder contributions. Nalcor maintains a $250.0 million (2015 - $250.0 million) committed revolving term credit facility, with a maturity date of January 31, 2018. There were no amounts drawn on this facility at December 31, 2016 (2015 - $nil). In addition, Hydro has access to a $300.0 million promissory note program and a $50.0 million (2015 - $50.0 million) unsecured demand operating credit facility. Oil and Gas and
39
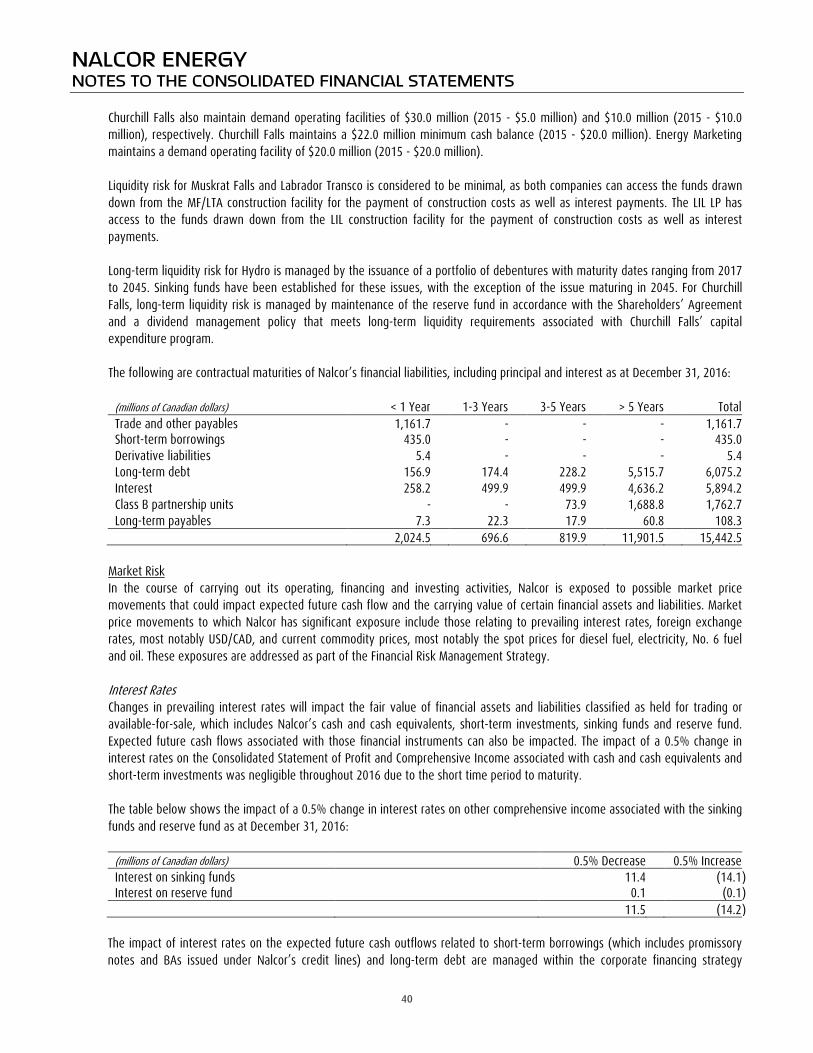
NALCOR ENERGY NOTES TO THE CONSOLIDATED FINANCIAL STATEMENTS
Churchill Falls also maintain demand operating facilities of $30.0 million (2015 - $5.0 million) and $10.0 million (2015 - $10.0 million), respectively. Churchill Falls maintains a $22.0 million minimum cash balance (2015 - $20.0 million). Energy Marketing maintains a demand operating facility of $20.0 million (2015 - $20.0 million). Liquidity risk for Muskrat Falls and Labrador Transco is considered to be minimal, as both companies can access the funds drawn down from the MF/LTA construction facility for the payment of construction costs as well as interest payments. The LIL LP has access to the funds drawn down from the LIL construction facility for the payment of construction costs as well as interest payments. Long-term liquidity risk for Hydro is managed by the issuance of a portfolio of debentures with maturity dates ranging from 2017 to 2045. Sinking funds have been established for these issues, with the exception of the issue maturing in 2045. For Churchill Falls, long-term liquidity risk is managed by maintenance of the reserve fund in accordance with the Shareholders’ Agreement and a dividend management policy that meets long-term liquidity requirements associated with Churchill Falls’ capital expenditure program. The following are contractual maturities of Nalcor’s financial liabilities, including principal and interest as at December 31, 2016:
(millions of Canadian dollars) < 1 Year 1-3 Years 3-5 Years > 5 Years Total Trade and other payables 1,161.7 - - - 1,161.7 Short-term borrowings 435.0 - - - 435.0 Derivative liabilities 5.4 - - - 5.4 Long-term debt 156.9 174.4 228.2 5,515.7 6,075.2 Interest 258.2 499.9 499.9 4,636.2 5,894.2 Class B partnership units - - 73.9 1,688.8 1,762.7 Long-term payables 7.3 22.3 17.9 60.8 108.3 2,024.5 696.6 819.9 11,901.5 15,442.5
Market Risk In the course of carrying out its operating, financing and investing activities, Nalcor is exposed to possible market price movements that could impact expected future cash flow and the carrying value of certain financial assets and liabilities. Market price movements to which Nalcor has significant exposure include those relating to prevailing interest rates, foreign exchange rates, most notably USD/CAD, and current commodity prices, most notably the spot prices for diesel fuel, electricity, No. 6 fuel and oil. These exposures are addressed as part of the Financial Risk Management Strategy. Interest Rates Changes in prevailing interest rates will impact the fair value of financial assets and liabilities classified as held for trading or available-for-sale, which includes Nalcor’s cash and cash equivalents, short-term investments, sinking funds and reserve fund. Expected future cash flows associated with those financial instruments can also be impacted. The impact of a 0.5% change in interest rates on the Consolidated Statement of Profit and Comprehensive Income associated with cash and cash equivalents and short-term investments was negligible throughout 2016 due to the short time period to maturity. The table below shows the impact of a 0.5% change in interest rates on other comprehensive income associated with the sinking funds and reserve fund as at December 31, 2016:
(millions of Canadian dollars) 0.5% Decrease 0.5% Increase Interest on sinking funds 11.4 (14.1 ) Interest on reserve fund 0.1 (0.1 ) 11.5 (14.2 )
The impact of interest rates on the expected future cash outflows related to short-term borrowings (which includes promissory notes and BAs issued under Nalcor’s credit lines) and long-term debt are managed within the corporate financing strategy
40

NALCOR ENERGY NOTES TO THE CONSOLIDATED FINANCIAL STATEMENTS
whereby floating rate debt exposures and interest rate scenarios are forecasted and evaluated. A diversified portfolio of fixed and floating rate debt is maintained and managed with a view to an acceptable risk profile. Key quantitative parameters for interest rate risk management includes the percentage of floating rate debt in the total debt portfolio, coupled with an examination of the weighted average term to maturity of the entire debt portfolio. By setting clear guidelines in respect to these quantitative parameters, Nalcor attempts to minimize the likelihood of a material impact on profit or loss resulting from an unexpected change in interest rates. Foreign Currency and Commodity Exposure Nalcor’s primary exposure to both foreign exchange and commodity price risk arises from its purchases of No. 6 fuel for consumption at the HTGS, USD denominated electricity sales, rental revenues and the sale of crude oil. For the purchase of No.6 fuel, these risks are mitigated through the operation of the RSP. Exposures to USD denominated electricity sales are addressed in accordance with the Board-approved Financial Risk Management Policy. Tactics include the use of forward rate agreements and fixed price commodity swaps. The table below shows the impact of a 0.5% change in foreign exchange rates on trade and other payables as at December 31, 2016
(millions of Canadian dollars) 0.5% Decrease 0.5% Increase Trade and other payables (4.0) 4.0
During 2016, Hydro had $nil total electricity sales denominated in USD (2015 - $33.9 million). Effective October 1, 2015, the export sales are recognized in Energy Marketing in accordance with the PPA. In 2015, foreign exchange risk on these sales was mitigated through the use of foreign currency forward contracts, which were entered into by Energy Marketing. Commodity price risk was mitigated by Hydro for 2015, through the use of electricity price commodity swap. During 2016, nil (2015 - $9.2 million) in realized gains from these derivative contracts was recognized in Hydro's other (income) expense and $nil (2015 - $0.7 million) unrealized losses in unrealized losses were recognized in Hydro's other (income) expense. During 2016, Energy Marketing had energy sales denominated in USD of $31.7 million USD (2015 - $5.5 million USD). To mitigate foreign exchange risk on these sales, Energy Marketing used foreign currency forward contracts. In December 2015, Energy Marketing entered into a series of foreign exchange forward contracts with a notional value of $29.0 million USD and an average exchange rate of $1.34 CAD per USD to hedge foreign exchange risk on 60% of planned USD energy sales for 2016. In December 2016, Energy Marketing entered into a series of foreign exchange forward contracts to hedge foreign exchange risk on approximately 58% of anticipated USD electricity sales in 2017. These contracts, with a notional value of $20.2 million USD, provide Energy Marketing with an average rate of 1.32 CAD per USD. As the foreign exchange forward contracts have been designated as hedging instruments, changes in fair value have been recorded in other comprehensive income. During 2016, $0.1 million in losses from foreign exchange forward contracts were included in other (income) expense (2015 - $5.5 million loss) and $1.0 million in gains (2015 - $1.3 million in losses) remain in other comprehensive income. In December 2015, Energy Marketing entered into a series of fixed price commodity swaps to hedge commodity price risk on approximately 60% of planned energy sales for 2016. These contracts, with a notional value of $29.0 million USD were to provide Energy Marketing with an average price of $41.30 USD per megawatt hour (MWh) (Peak) and $21.60 USD per MWh (Off-Peak). All fixed price commodity swaps were settled by June 30, 2016. During 2016, $3.5 million in gains have been included in other (income) expense. During 2016, additional financial transmission rights with notional values of $1.5 million USD were purchased to mitigate risk on congestion for the remainder of 2016 and a significant portion of 2017. As the rights have not been designated under hedge accounting, changes in fair value have been recorded in other (income) expense.
41

NALCOR ENERGYNOTES TO THE CONSOLIDATED FINANCIAL STATEMENTS
During 2016, total oil sales denominated in USD were $93.6 million (2015 - $25.2 million). While Oil and Gas has exposure to fluctuations in the USD/CAD exchange rate on those sales, a significant portion of Oil and Gas’ planned capital expenditures for 2016 were denominated in USD, which mitigated this exposure. Furthermore, in March, June and November 2015, Oil and Gas entered into a series of commodity price swap contracts to mitigate commodity price exposure on oil sales. Combined, these contracts had a notional value of $11.1 million USD, and provided an average fixed price of $59.85 USD per barrel on approximately 15% of budgeted production for 2016.
On November 30, 2016, Oil and Gas entered into a series of commodity price swap contracts to hedge commodity price risk on approximately 25% of anticipated 2017 production. These contracts have a notional value of $32.3 million USD, and provide an average fixed price of $52.09 USD per barrel.
During 2016, $6.2 million in gains (2015 - $9.8 million) from commodity price swaps contracts, designated under hedge accounting, were included in other income and expense. As the contracts have been designated as hedged instruments, changes in fair value have been recorded in other comprehensive income. For the year ended, $4.5 million in unrealized losses (2015 - $6.9 million in unrealized gains) remain in other comprehensive income.
On December 1, 2016, Oil and Gas entered into series of foreign exchange forward contracts to hedge foreign exchange risk on approximately 23% of anticipated USD energy sales in 2017. These contracts have a notional value of $32.3 million USD and provide Oil and Gas with an average fixed rate of $1.33 CAD per USD.
As the contracts have been designated as hedged instruments, changes in fair value have been recorded in other comprehensive income. For the year ended December 31, 2016, $0.2 million in losses remain in other comprehensive income.
During 2016, total lease revenue in Bull Arm Fabrication denominated in USD was $16.1 million (2015 - $16.1 million). In November 2015, Bull Arm Fabrication entered into a series of foreign exchange forward contracts with a notional value of $17.5 million USD, to mitigate USD/CAD currency exposure on its USD lease revenue for 2016 and the first two months of 2017, at a weighted average fixed exchange rate of $1.33 CAD per USD.
In December 2016, a series of an additional 12 foreign exchange contracts with a total notional value of $16.1 million USD were entered into at a weighted average fixed exchange rate of $1.32 CAD per USD. Combined with the hedge contracts previously in place, 100% of expected USD lease revenue for 2017, and the first two months of 2018, is hedged at a weighted average fixed exchange rate of $1.32 CAD per USD.
During 2016, $0.2 million in losses (2015 - $2.3 million in losses) have been included in other (income) expense related to the Bull Arm Fabrication forward contracts and $0.9 million in unrealized gains (2015 - $0.7 million in losses) remain in other comprehensive income. As at December 31, 2016, the fair value of the derivative liabilities as presented on the Statement of Financial Position was $0.2 million (2015 - $1.1 million).
In December 2013, Muskrat Falls entered into nine bond forward contracts totaling $2.0 billion to hedge the interest rate risk on the forecasted issue of long-term debt. These contracts were designated as part of a cash flow hedging relationship and the resulting change in fair value was recorded in other comprehensive income (loss) with the ineffective portion recognized immediately in other (income) expense. The loss related to the effective portion of the cash flow hedge is capitalized in line with treatment of the interest expense related to the long term debt that it is hedging. The amount amortized in 2016 was $0.8 million (2015 - $0.8 million). The other comprehensive loss will be recognized in profit or loss over the same period as the related debt instruments which mature between 2029 and 2048.
42

NALCOR ENERGY NOTES TO THE CONSOLIDATED FINANCIAL STATEMENTS Commodity and
forward contracts
Other derivatives Total (millions of Canadian dollars) Level II Level II Level III Level II Level III Balance at January 1, 2016 1.6 2.0 0.3 3.6 0.3 Purchases - - 1.9 - 1.9 1.6 2.0 2.2 3.6 2.2 Changes to profit (loss) Amortization - - (1.6) - (1.6) Mark-to-market 3.5 - - 3.5 - Settlements (0.7) (1.9) - (2.6) - Total 2.8 (1.9) (1.6) 0.9 (1.6) Changes in other comprehensive income (loss) Mark-to-market (2.8) - - (2.8) - Realized in (profit) loss (7.0) - - (7.0) - Total (9.8) - - (9.8) - Balance at December 31, 2016 (5.4) 0.1 0.6 (5.3) 0.6 Balance at January 1, 2015 7.6 2.5 0.1 10.1 0.1 Purchases - - 1.2 - 1.2 7.6 2.5 1.3 10.1 1.3 Changes to profit (loss) Amortization - - (0.9) - (0.9) Mark-to-market (7.7) (0.5) 3.2 (8.2) 3.2 Settlements 4.7 - (3.3) 4.7 (3.3) Total (3.0) (0.5) (1.0) (3.5) (1.0) Changes in other comprehensive income (loss) Mark-to-market 9.2 - - 9.2 - Realized in profit (loss) (12.2) - - (12.2) - Total (3.0) - - (3.0) - Balance at December 31, 2015 1.6 2.0 0.3 3.6 0.3 30. RELATED PARTY TRANSACTIONS
Nalcor enters into various transactions with its shareholder and other affiliates. These transactions occur within the normal course of operations and are measured at the exchange amount, which is the amount of consideration agreed to by the related parties. Related parties with which Nalcor transacts are as follows:
Related Party Relationship The Province 100.0% shareholder of Nalcor Churchill Falls Joint arrangement of Hydro Hydro-Québec 34.2% shareholder of Churchill Falls Twin Falls Joint venture of Churchill Falls The Trust Created by the Province with Churchill Falls as the beneficiary LIL LP Partnership in which Nalcor holds 75 Class A Partnership Units PUB Agency of the Province
Routine operating transactions with related parties are settled at prevailing market prices under normal trade terms. Outstanding balances due to or from related parties are non-interest bearing with no set terms of repayment, unless otherwise stated.
(a) Hydro is required to incur the costs of operations of the PUB as well as the cost of hearings and application costs. During
2016, Hydro incurred $1.3 million (2015 - $3.9 million) in costs related to the PUB and has included $2.1 million (2015 - $4.0 million) in trade and other payables.
43

NALCOR ENERGY NOTES TO THE CONSOLIDATED FINANCIAL STATEMENTS
(b) The debt guarantee fee for 2016 was $4.5 million (2015 - $4.5 million). It was paid to the Province on March 31, 2016.
(c) Hydro recognized contributions in aid of construction totaling $0.1 million (2015 - $0.2 million) from the Province related to wind feasibility studies. As at December 31, 2016, $0.4 million (2015 - $0.4 million) has been recorded in deferred credits.
(d) For the year ended December 31, 2016, Hydro has purchased $25.2 million (2015 - $27.8 million) of power generated from
assets related to Exploits Generation, which are held by the Province. In addition, Hydro operates these assets on behalf of Nalcor and recovered costs in the amount of $29.1 million (2015 - $19.2 million).
(e) Hydro recorded $0.2 million (2015 - $0.4 million) as a rate subsidy for rural isolated customers from the Province and $1.8
million (2015 - $2.0 million) as an energy rebate to offset the cost of basic electricity consumption for Labrador rural isolated residential customers under the Northern Strategic Plan. As at December 31, 2016, there is a balance of $1.3 million (2015 - $0.7 million) outstanding in trade and other receivables.
(f) Churchill Falls has entered into long-term power contracts with its shareholders for the sale of substantially all of the power
produced by the generating plant. During 2016, revenue from Hydro-Québec was $102.4 million (2015 - $109.6 million) of which Nalcor has recorded its share of $67.4 million (2015 - $72.1 million).
(g) Under the terms of the Lease and amendments thereto, Churchill Falls is required to pay the Province an annual rental of 8%
of the consolidated net profits before income taxes and an annual royalty of $0.50 per horsepower year generated, as defined in the Lease. At December 31, 2016, $7.5 million (2015 - $7.9 million) was payable to the Province, of which Nalcor has recognized its share of $4.9 million (2015 - $5.2 million).
(h) Churchill Falls tracks the value of differences between energy delivered and the Annual Energy Base over a four year period.
The difference is then recovered from or refunded to Hydro-Québec.
The payable to Hydro-Québec as at December 31, 2016 is the accumulation of differences between energy delivered and the AEB during the four year period from September 1, 2008 to August 31, 2012 and the four year period September 1, 2012 to August 31, 2016. The current portion of $nil (2015 - $1.0 million) is included in trade and other payables. For the year ended December 31, 2016, net finance (income) expense on the related party payable/receivable was $0.2 million (2015 - $0.1 million), of which Nalcor has recorded its share of $0.1 million (2015 - $0.1 million).
(i) On February 3, 2010, the Province established the Trust with Churchill Falls as the beneficiary. The purpose of the Trust is to
fund the external costs and expenses incurred in relation to the motion filed by Churchill Falls seeking a modification to the pricing terms of the 1969 Power Contract. To date, $5.3 million (2015 - $4.9 million) has been received and $13.0 thousand (2015 - $17.0 thousand) has been accrued as receivable from the Trust. Nalcor has recorded its share of $3.5 million (2015 - $3.2 million) as received and $8.6 thousand (2015 - $11.2 thousand) accrued as receivable from the Trust.
(j) As at December 31, 2016, Churchill Falls capacity penalty payable was $0.4 million (2015 - $0.4 million), of which Nalcor has
recorded its share of $0.3 million (2015 - $0.3 million). The capacity penalty relates to the supply of power to Hydro-Québec. Churchill Falls did not incur a capacity penalty in 2016 (2015 - $nil).
(k) For the year ended December 31, 2016, Oil and Gas expensed $6.4 million (2015 - $1.6 million) to the Province for royalties
on its oil and gas operations.
(l) During the year, Oil and Gas made a one-time payment of $7.4 million to the Province in relation to the construction of the drilling equipment set which was constructed outside of the province.
44
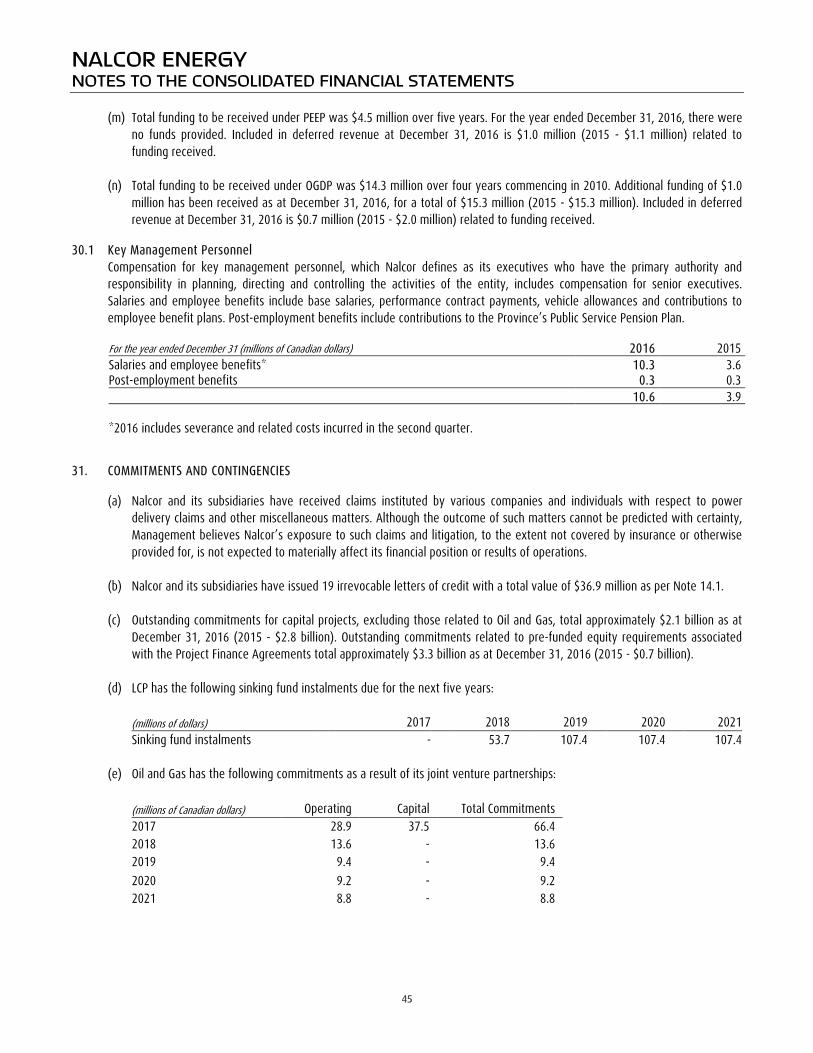
NALCOR ENERGY NOTES TO THE CONSOLIDATED FINANCIAL STATEMENTS
(m) Total funding to be received under PEEP was $4.5 million over five years. For the year ended December 31, 2016, there were no funds provided. Included in deferred revenue at December 31, 2016 is $1.0 million (2015 - $1.1 million) related to funding received.
(n) Total funding to be received under OGDP was $14.3 million over four years commencing in 2010. Additional funding of $1.0
million has been received as at December 31, 2016, for a total of $15.3 million (2015 - $15.3 million). Included in deferred revenue at December 31, 2016 is $0.7 million (2015 - $2.0 million) related to funding received.
30.1 Key Management Personnel
Compensation for key management personnel, which Nalcor defines as its executives who have the primary authority and responsibility in planning, directing and controlling the activities of the entity, includes compensation for senior executives. Salaries and employee benefits include base salaries, performance contract payments, vehicle allowances and contributions to employee benefit plans. Post-employment benefits include contributions to the Province’s Public Service Pension Plan.
For the year ended December 31 (millions of Canadian dollars) 2016 2015 Salaries and employee benefits* 10.3 3.6 Post-employment benefits 0.3 0.3 10.6 3.9 *2016 includes severance and related costs incurred in the second quarter. 31. COMMITMENTS AND CONTINGENCIES
(a) Nalcor and its subsidiaries have received claims instituted by various companies and individuals with respect to power delivery claims and other miscellaneous matters. Although the outcome of such matters cannot be predicted with certainty, Management believes Nalcor’s exposure to such claims and litigation, to the extent not covered by insurance or otherwise provided for, is not expected to materially affect its financial position or results of operations.
(b) Nalcor and its subsidiaries have issued 19 irrevocable letters of credit with a total value of $36.9 million as per Note 14.1.
(c) Outstanding commitments for capital projects, excluding those related to Oil and Gas, total approximately $2.1 billion as at December 31, 2016 (2015 - $2.8 billion). Outstanding commitments related to pre-funded equity requirements associated with the Project Finance Agreements total approximately $3.3 billion as at December 31, 2016 (2015 - $0.7 billion).
(d) LCP has the following sinking fund instalments due for the next five years:
(millions of dollars) 2017 2018 2019 2020 2021 Sinking fund instalments - 53.7 107.4 107.4 107.4
(e) Oil and Gas has the following commitments as a result of its joint venture partnerships:
(millions of Canadian dollars) Operating Capital Total Commitments 2017 28.9 37.5 66.4 2018 13.6 - 13.6 2019 9.4 - 9.4 2020 9.2 - 9.2 2021 8.8 - 8.8
45

NALCOR ENERGY NOTES TO THE CONSOLIDATED FINANCIAL STATEMENTS
(f) Hydro has entered into a number of long-term power purchase agreements as follows: Type Rating Effective Date Term Hydroelectric 175 kW 1988 Continual Hydroelectric 3 MW 1995 25 years Hydroelectric 4 MW 1998 25 years Hydroelectric 300 MW 1998 43 years Cogeneration 15 MW 2003 20 years Wind 390 MW 2004 15 years Wind 27 MW 2008 20 years Wind 27 MW 2009 20 years Wind 300 kW 2010 Continual Hydroelectric 225 MW 2015 25.5 years
(g) Estimated payments due in each of the next five years are as follows:
(millions of dollars) 2017 2018 2019 2020 2021 Power purchases 74.0 74.8 76.8 78.4 79.6
(h) In 2016, Hydro purchased Wabush Mines' rights to the land and assets that comprise the Wabush Terminal Station and a short section of two 230 kV transmission lines that supply this Station. As part of this transaction, Wabush Mines also disclaimed its Crown lease on which another section of 230 kV transmission corridor is located, and Hydro has since applied for a Crown lease for this corridor. All other transmission infrastructure which supplies Labrador West is on land currently subject to a Crown lease to Churchill Falls. Hydro will be filing an application with the PUB for approval of long-term Crown leases and subleases from Churchill Falls for the two 230 kV transmission lines and some terminal equipment serving Labrador West and for the acquisition from Churchill Falls and Twin Falls of some associated terminal station equipment and spares.
(i) In 2014, Hydro entered into three Capacity Assistance Agreements, one with Vale Newfoundland & Labrador Limited (Vale) and two with Corner Brook Pulp and Paper Limited (CBPP) for the purchase of relief power up to 15.8 MW, 60 MW and 30 MW, respectively, during the winter period. In 2016, Hydro also entered into two new Capacity Assistance Agreements, one with Praxair and a second agreement with Vale for the purchase of relief power up to 5MW and 6MW, respectively. All five agreements have a supply period defined in the agreements as December 1 to March 31 for each contract year, concluding March 2018. Payment for services will be dependent on the successful provision of capacity assistance for the winter period by Vale, CBPP and Praxair.
(j) In December 2016, Energy Marketing entered into two, one-year agreements with a transmission provider for 22MW of firm transmission rights. Estimated payments in 2017 are $1.1 million USD.
(k) Energy Marketing holds firm transmission rights with a number of counterparties in order to gain access to export markets. As at December 31, 2016, commitments for transmission rights total $3.2 million for 2017. No transmission rights held by Energy Marketing extend beyond December 31, 2017.
(l) As part of the LIL Project Finance Agreement (PFA), LIL LP has pledged its current and future assets as security to the Collateral Agent. Under the terms and conditions of the Project Trust PFA, LIL LP has also provided a guarantee of the Project Trust’s payment obligations to the Collateral Agent for the benefit of the LIL Funding Trust.
(m) As part of the Muskrat Falls/Labrador Transmission Assets PFA, Muskrat Falls and Labrador Transco have pledged its present
and future assets as security to the Collateral Agent.
46

NALCOR ENERGY NOTES TO THE CONSOLIDATED FINANCIAL STATEMENTS
(n) Under the terms of the Newfoundland and Labrador Development Agreement (NLDA), LIL GP has certain responsibilities and provisions of duty with which it must comply in its role as the general partner. Any failure of LIL GP to comply with the NLDA will result in Nalcor indemnifying Emera NL for any losses sustained.
(o) The minimum lease payments associated with the lease arrangement of Bull Arm Fabrication’s assets and facilities to be
received over the next five years will be as follows:
(millions of Canadian dollars) 2017 2018 2019 2020 2021 Thereafter Minimum lease payments 22.0 3.6 - - - -
32. CAPITAL MANAGEMENT
Nalcor’s principal business requires ongoing access to capital in order to maintain assets and ensure the continuity of its operations as a going concern. Nalcor also requires access to capital to fund its various development activities relating to Oil and Gas and the Lower Churchill Project. Therefore, Nalcor’s primary objective when managing capital is to ensure ready access to capital at a reasonable cost, to minimize its cost of capital within the confines of established risk parameters, and to safeguard Nalcor’s ability to continue as a going concern. The capital managed by Nalcor is comprised of debt (long-term debentures, promissory notes, bank credit facilities and Class B limited partnership units) and equity (share capital, shareholder contributions, reserves and retained earnings).
A summary of the consolidated capital structure is outlined below: As at December 31 (millions of Canadian dollars) 2016 2015 Debt Sinking funds (Hydro portion only) (267.0) (242.6) Short-term borrowings 435.0 97.0 Current portion of long-term debt 142.6 233.4 Long-term debt 5,872.8 6,008.1 Class B limited partnership units 399.1 207.4 6,582.5 60.7% 6,303.3 64.5% Equity Share capital 122.5 122.5 Shareholder contributions 2,860.7 2,204.3 Reserves 6.5 11.8 Retained earnings 1,273.0 1,136.7 4,262.7 39.3% 3,475.3 35.5% Total Debt and Equity 10,845.2 100.0% 9,778.6 100.0%
Nalcor’s committed operating facility has covenants restricting the issuance of debt such that the unconsolidated debt to total capitalization ratio cannot exceed 70.0%. The covenants further stipulate that the debt service coverage ratio should at all times be greater than 1.5 on an unconsolidated basis. As at December 31, 2016, Nalcor was in compliance with these covenants.
32.1 Hydro Hydro’s approach to capital management encompasses various factors including monitoring the percentage of floating rate debt
in the total debt portfolio, the weighted average term to maturity of its overall debt portfolio, its percentage of debt to debt plus equity, and its interest coverage.
47
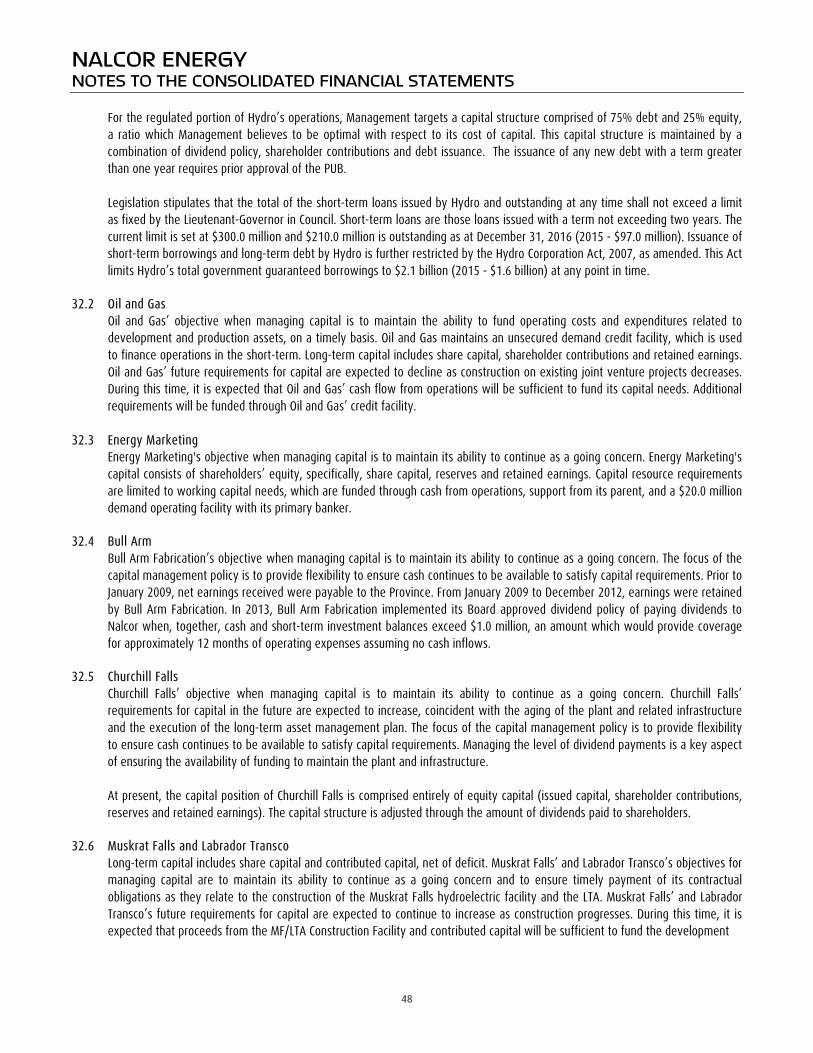
NALCOR ENERGY NOTES TO THE CONSOLIDATED FINANCIAL STATEMENTS
For the regulated portion of Hydro’s operations, Management targets a capital structure comprised of 75% debt and 25% equity, a ratio which Management believes to be optimal with respect to its cost of capital. This capital structure is maintained by a combination of dividend policy, shareholder contributions and debt issuance. The issuance of any new debt with a term greater than one year requires prior approval of the PUB. Legislation stipulates that the total of the short-term loans issued by Hydro and outstanding at any time shall not exceed a limit as fixed by the Lieutenant-Governor in Council. Short-term loans are those loans issued with a term not exceeding two years. The current limit is set at $300.0 million and $210.0 million is outstanding as at December 31, 2016 (2015 - $97.0 million). Issuance of short-term borrowings and long-term debt by Hydro is further restricted by the Hydro Corporation Act, 2007, as amended. This Act limits Hydro’s total government guaranteed borrowings to $2.1 billion (2015 - $1.6 billion) at any point in time.
32.2 Oil and Gas Oil and Gas’ objective when managing capital is to maintain the ability to fund operating costs and expenditures related to
development and production assets, on a timely basis. Oil and Gas maintains an unsecured demand credit facility, which is used to finance operations in the short-term. Long-term capital includes share capital, shareholder contributions and retained earnings. Oil and Gas’ future requirements for capital are expected to decline as construction on existing joint venture projects decreases. During this time, it is expected that Oil and Gas’ cash flow from operations will be sufficient to fund its capital needs. Additional requirements will be funded through Oil and Gas’ credit facility.
32.3 Energy Marketing Energy Marketing's objective when managing capital is to maintain its ability to continue as a going concern. Energy Marketing's
capital consists of shareholders’ equity, specifically, share capital, reserves and retained earnings. Capital resource requirements are limited to working capital needs, which are funded through cash from operations, support from its parent, and a $20.0 million demand operating facility with its primary banker.
32.4 Bull Arm
Bull Arm Fabrication’s objective when managing capital is to maintain its ability to continue as a going concern. The focus of the capital management policy is to provide flexibility to ensure cash continues to be available to satisfy capital requirements. Prior to January 2009, net earnings received were payable to the Province. From January 2009 to December 2012, earnings were retained by Bull Arm Fabrication. In 2013, Bull Arm Fabrication implemented its Board approved dividend policy of paying dividends to Nalcor when, together, cash and short-term investment balances exceed $1.0 million, an amount which would provide coverage for approximately 12 months of operating expenses assuming no cash inflows.
32.5 Churchill Falls
Churchill Falls’ objective when managing capital is to maintain its ability to continue as a going concern. Churchill Falls’ requirements for capital in the future are expected to increase, coincident with the aging of the plant and related infrastructure and the execution of the long-term asset management plan. The focus of the capital management policy is to provide flexibility to ensure cash continues to be available to satisfy capital requirements. Managing the level of dividend payments is a key aspect of ensuring the availability of funding to maintain the plant and infrastructure. At present, the capital position of Churchill Falls is comprised entirely of equity capital (issued capital, shareholder contributions, reserves and retained earnings). The capital structure is adjusted through the amount of dividends paid to shareholders.
32.6 Muskrat Falls and Labrador Transco
Long-term capital includes share capital and contributed capital, net of deficit. Muskrat Falls’ and Labrador Transco’s objectives for managing capital are to maintain its ability to continue as a going concern and to ensure timely payment of its contractual obligations as they relate to the construction of the Muskrat Falls hydroelectric facility and the LTA. Muskrat Falls’ and Labrador Transco’s future requirements for capital are expected to continue to increase as construction progresses. During this time, it is expected that proceeds from the MF/LTA Construction Facility and contributed capital will be sufficient to fund the development
48
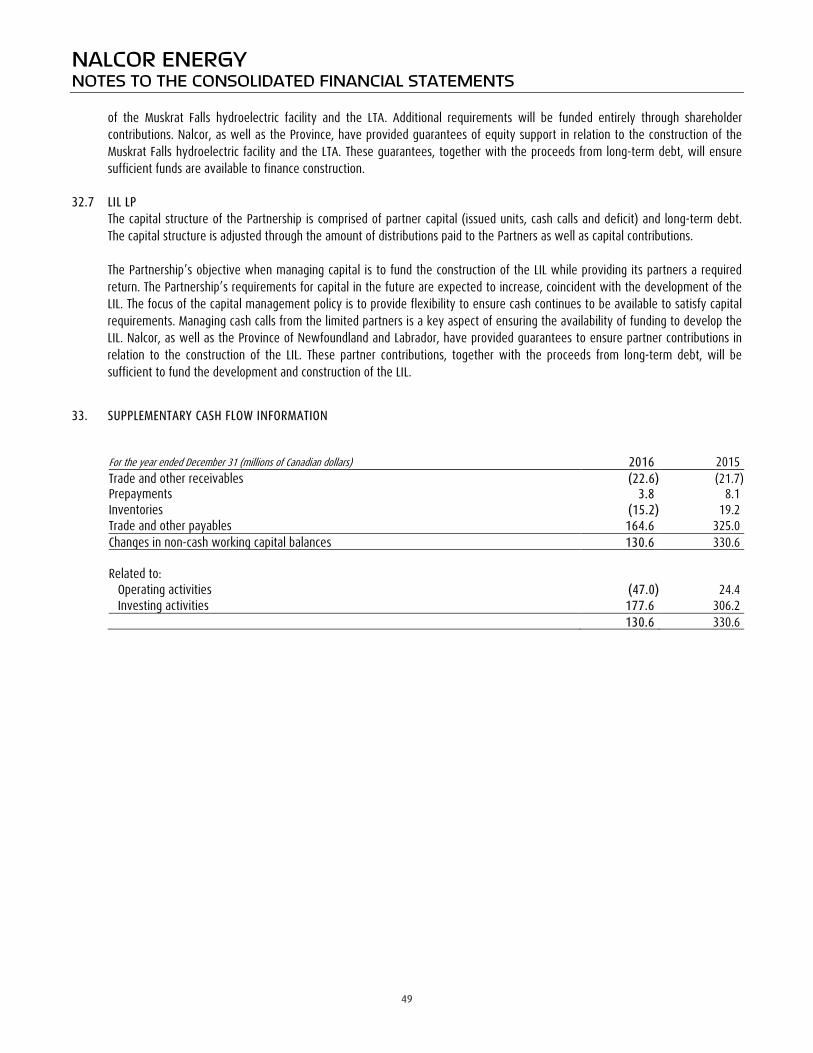
NALCOR ENERGY NOTES TO THE CONSOLIDATED FINANCIAL STATEMENTS
of the Muskrat Falls hydroelectric facility and the LTA. Additional requirements will be funded entirely through shareholder contributions. Nalcor, as well as the Province, have provided guarantees of equity support in relation to the construction of the Muskrat Falls hydroelectric facility and the LTA. These guarantees, together with the proceeds from long-term debt, will ensure sufficient funds are available to finance construction.
32.7 LIL LP The capital structure of the Partnership is comprised of partner capital (issued units, cash calls and deficit) and long-term debt. The capital structure is adjusted through the amount of distributions paid to the Partners as well as capital contributions. The Partnership’s objective when managing capital is to fund the construction of the LIL while providing its partners a required return. The Partnership’s requirements for capital in the future are expected to increase, coincident with the development of the LIL. The focus of the capital management policy is to provide flexibility to ensure cash continues to be available to satisfy capital requirements. Managing cash calls from the limited partners is a key aspect of ensuring the availability of funding to develop the LIL. Nalcor, as well as the Province of Newfoundland and Labrador, have provided guarantees to ensure partner contributions in relation to the construction of the LIL. These partner contributions, together with the proceeds from long-term debt, will be sufficient to fund the development and construction of the LIL.
33. SUPPLEMENTARY CASH FLOW INFORMATION For the year ended December 31 (millions of Canadian dollars) 2016 2015 Trade and other receivables (22.6) (21.7) Prepayments 3.8 8.1 Inventories (15.2) 19.2 Trade and other payables 164.6 325.0 Changes in non-cash working capital balances 130.6 330.6 Related to: Operating activities (47.0) 24.4 Investing activities 177.6 306.2 130.6 330.6
49

NALCOR ENERGY NOTES TO THE CONSOLIDATED FINANCIAL STATEMENTS 34. SEGMENT INFORMATION
Nalcor operates in seven business segments. Hydro Regulated activities encompass sales of electricity to customers within the Province. Churchill Falls operates a hydroelectric generating facility which sells electricity to Hydro-Québec and Hydro. Oil and Gas activities include exploration, development, production, transportation and processing sectors of the oil and gas industry. Energy Marketing includes the sale of electricity to markets outside the Province and other non-regulated electricity sales. Bull Arm Fabrication consists of an industrial fabrication site which is leased for major construction of development projects. Phase 1 of the Lower Churchill Project includes investments in the Muskrat Falls hydroelectric plant, the Labrador-Island Link and the Labrador Transmission Assets. Corporate and other activities encompass development activities including Phase 2 of the Lower Churchill Project and corporate activities. The segments’ accounting policies are the same as those described in Note 2 of the annual audited consolidated financial statements. The designation of segments has been based on a combination of regulatory status and management accountability.
Phase 1 Lower Corporate Hydro Churchill Oil and Energy Bull Churchill and Other Inter- (millions of Canadian dollars) Regulated Falls Gas Marketing Arm Project Activities Segment Total For the year ended December 31, 2016 Energy sales 511.2 96.4 130.9 83.3 - - - (42.9) 778.9 Other revenue 3.8 0.5 9.3 6.0 21.3 - - 4.3 45.2 Revenue 515.0 96.9 140.2 89.3 21.3 - - (38.6) 824.1 Fuels 167.5 - - - - - - - 167.5 Power purchased 60.2 - - 42.9 - - - (42.3) 60.8 Operating costs 124.5 44.4 8.1 11.8 1.2 1.3 16.0 - 207.3 Oil production, marketing and transportation costs - - 26.3 - - - - - 26.3 Transmission rental and market fees - - - 22.1 - - - - 22.1 Depreciation, depletion, amortization and impairment 68.0 16.7 48.5 0.4 - - 1.4 - 135.0 Exploration and evaluation - - 1.5 - - - - - 1.5 Net finance (income) expense 70.9 (1.0) 3.2 0.2 - (1.9) 0.7 - 72.1 Other (income) expense 5.7 0.4 (5.0) (5.6) 0.2 0.3 - - (4.0) Preferred dividends - (4.3) - - - - - 4.3 - Profit (loss) before regulatory adjustments 18.2 40.7 57.6 17.5 19.9 0.3 (18.1) (0.6) 135.5
Regulatory adjustments (0.8) - - - - - - - (0.8) Profit (loss) for the year 19.0 40.7 57.6 17.5 19.9 0.3 (18.1) (0.6) 136.3
Capital expenditures* 218.8 40.9 208.2 - - 2,776.5 5.5 - 3,249.9 Total assets 2,442.4 559.8 1,243.0 14.3 4.0 9,499.7 577.2 (278.9) 14,061.5 *Capital expenditures include non-cash additions of $485.2 million related to the Maritime Link and $23.6 million related to Class B Limited Partnership Unit accrued interest. Total assets include total-to-date amounts of $1,146.5 million related to the Maritime Link and $44.8 million related to Class B Limited Partnership Unit accrued interest.
50
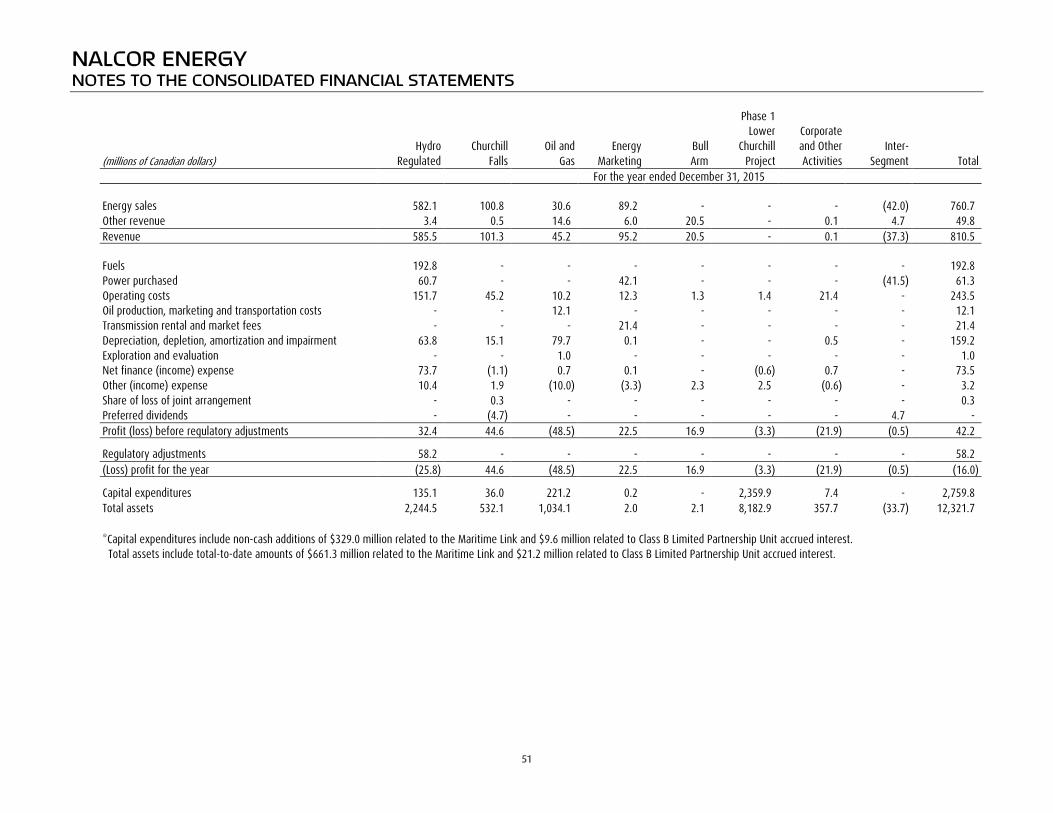
NALCOR ENERGY NOTES TO THE CONSOLIDATED FINANCIAL STATEMENTS
Phase 1 Lower Corporate Hydro Churchill Oil and Energy Bull Churchill and Other Inter- (millions of Canadian dollars) Regulated Falls Gas Marketing Arm Project Activities Segment Total For the year ended December 31, 2015 Energy sales 582.1 100.8 30.6 89.2 - - - (42.0) 760.7 Other revenue 3.4 0.5 14.6 6.0 20.5 - 0.1 4.7 49.8 Revenue 585.5 101.3 45.2 95.2 20.5 - 0.1 (37.3) 810.5 Fuels 192.8 - - - - - - - 192.8 Power purchased 60.7 - - 42.1 - - - (41.5) 61.3 Operating costs 151.7 45.2 10.2 12.3 1.3 1.4 21.4 - 243.5 Oil production, marketing and transportation costs - - 12.1 - - - - - 12.1 Transmission rental and market fees - - - 21.4 - - - - 21.4 Depreciation, depletion, amortization and impairment 63.8 15.1 79.7 0.1 - - 0.5 - 159.2 Exploration and evaluation - - 1.0 - - - - - 1.0 Net finance (income) expense 73.7 (1.1) 0.7 0.1 - (0.6) 0.7 - 73.5 Other (income) expense 10.4 1.9 (10.0) (3.3) 2.3 2.5 (0.6) - 3.2 Share of loss of joint arrangement - 0.3 - - - - - - 0.3 Preferred dividends - (4.7) - - - - - 4.7 - Profit (loss) before regulatory adjustments 32.4 44.6 (48.5) 22.5 16.9 (3.3) (21.9) (0.5) 42.2
Regulatory adjustments 58.2 - - - - - - - 58.2 (Loss) profit for the year (25.8) 44.6 (48.5) 22.5 16.9 (3.3) (21.9) (0.5) (16.0)
Capital expenditures 135.1 36.0 221.2 0.2 - 2,359.9 7.4 - 2,759.8 Total assets 2,244.5 532.1 1,034.1 2.0 2.1 8,182.9 357.7 (33.7) 12,321.7 *Capital expenditures include non-cash additions of $329.0 million related to the Maritime Link and $9.6 million related to Class B Limited Partnership Unit accrued interest. Total assets include total-to-date amounts of $661.3 million related to the Maritime Link and $21.2 million related to Class B Limited Partnership Unit accrued interest.
51

NALCOR ENERGY NOTES TO THE CONSOLIDATED FINANCIAL STATEMENTS 35. PRIOR PERIOD ADJUSTMENTS
The January 1, 2015 and December 31, 2015 figures have been restated as a result of a misstatement relating to the calculation of the other post-employment benefit (OPEB) health and dental liabilities for retirees. The December 31, 2015 figures have been restated to reduce employee future benefits liability by $19.2 million and increase opening retained earnings by $9.7 million and reserves by $9.5 million. The following table summarizes the adjustments to the affected accounts from the previously issued 2015 audited consolidated financial statements to the current year comparative figures:
(millions of Canadian dollars) Previously stated 2015 2015 Adjustment Restated 2015 Statement of Financial Position Employee future benefits liability, Balance at December 31, 2015 (135.3) 19.2 (116.1) Reserves (2.3) (9.5) (11.8) Retained earnings (1,127.0) (9.7) (1,136.7) Statement of Profit and Comprehensive Income Operating costs* 278.9 (1.9) 277.0 Regulatory adjustments 59.5 (1.3) 58.2 Loss for the year (19.2) 3.2 (16.0) Statement of Changes in Equity Reserves, Balance at January 1, 2015 (56.3) 23.4 (32.9) Retained Earnings, Balance at January 1, 2015 1,146.2 6.5 1,152.7 Actuarial gain on employee future benefits 18.2 (12.6) 5.6 Regulatory adjustment 1.7 (1.3) 0.4 Consolidated Statement of Cash Flows Employee future benefits 9.0 (2.3) 6.7 * See Note 36 for additional comparative figures changes impacting operating costs
52
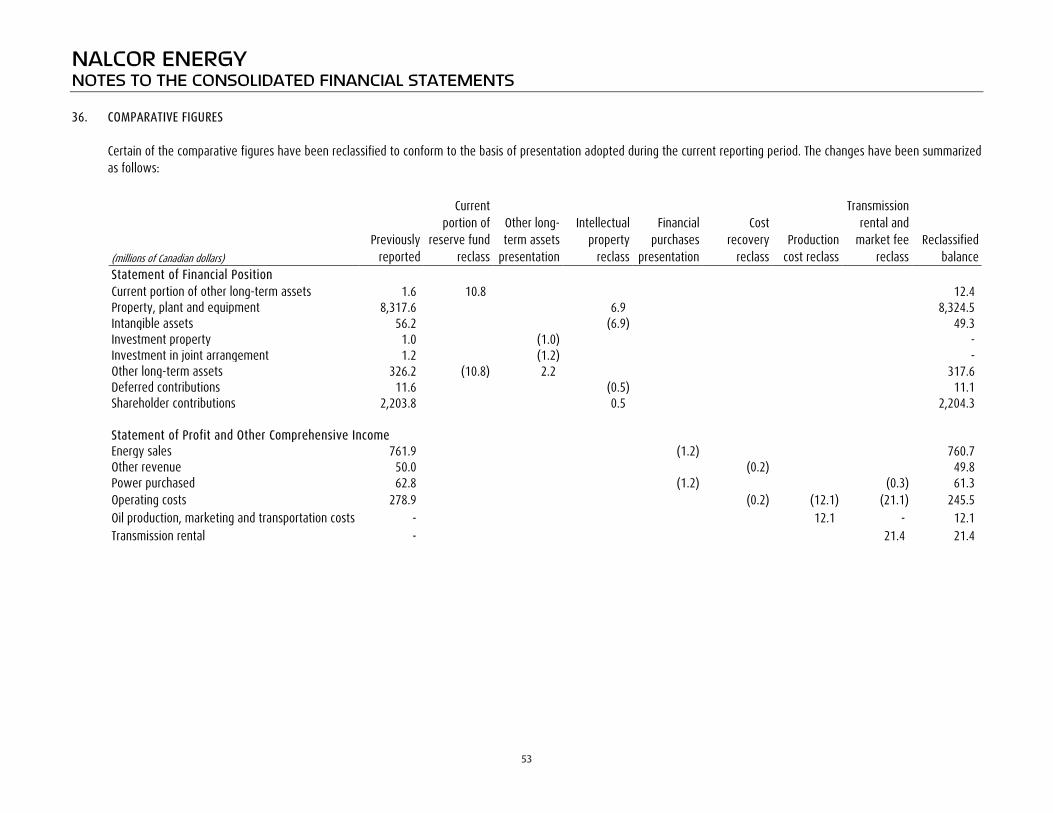
NALCOR ENERGY NOTES TO THE CONSOLIDATED FINANCIAL STATEMENTS 36. COMPARATIVE FIGURES
Certain of the comparative figures have been reclassified to conform to the basis of presentation adopted during the current reporting period. The changes have been summarized as follows:
(millions of Canadian dollars) Previously
reported
Current portion of
reserve fund reclass
Other long-term assets
presentation
Intellectual property
reclass
Financial purchases
presentation
Cost recovery
reclass Production
cost reclass
Transmission rental and
market fee reclass
Reclassified balance
Statement of Financial Position Current portion of other long-term assets 1.6 10.8 12.4 Property, plant and equipment 8,317.6 6.9 8,324.5 Intangible assets 56.2 (6.9) 49.3 Investment property 1.0 (1.0) - Investment in joint arrangement 1.2 (1.2) - Other long-term assets 326.2 (10.8) 2.2 317.6 Deferred contributions 11.6 (0.5) 11.1 Shareholder contributions 2,203.8 0.5 2,204.3 Statement of Profit and Other Comprehensive Income Energy sales 761.9 (1.2) 760.7 Other revenue 50.0 (0.2) 49.8 Power purchased 62.8 (1.2) (0.3) 61.3 Operating costs 278.9 (0.2) (12.1) (21.1) 245.5 Oil production, marketing and transportation costs - 12.1 - 12.1 Transmission rental - 21.4 21.4
53

NALCOR ENERGY NOTES TO THE CONSOLIDATED FINANCIAL STATEMENTS 37. SUBSEQUENT EVENTS
On January 11, 2017, the $225.0 million promissory note with Nalcor was repaid with a new promissory note, which expires March 31, 2017 and has an interest rate of 0.951%. Hydro intends to refinance this loan in the coming months with a long-term debt issuance in the capital markets. On January 13, 2017, Hydro re-opened its Series AF debentures and sold $300.0 million of new debentures to its underwriting syndicate for net proceeds of $284.0 million. On January 24, 2017, the irrevocable letter of credit for $0.3 million, issued as a performance guarantee in relation to the Department of Fisheries and Oceans Fish Habitat Compensation Program, was cancelled by the beneficiary as it was no longer required.
54

TRANSPARENCY AND ACCOUNTABILITY ACT
2016 ANNUAL PERFORMANCE REPORT
Appendix 3
Newfoundland and Labrador Hydro Consolidated Financial Statements

NEWFOUNDLAND AND LABRADOR HYDRO CONSOLIDATED FINANCIAL STATEMENTS
December 31, 2016

Deloitte LLP 5 Springdale Street Suite 1000 St. John’s, NL A1E 0E4 Canada
Tel: (709) 576-8480 Fax: (709) 576-8460 www.deloitte.ca
Independent Auditor’s Report
To the Lieutenant-Governor in Council, Province of Newfoundland and Labrador
We have audited the accompanying consolidated financial statements of Newfoundland and Labrador Hydro, which comprise the consolidated statement of financial position as at December 31, 2016, and the consolidated statements of profit and comprehensive income, changes in equity and cash flows for the year then ended, and a summary of significant accounting policies and other explanatory information.
Management's Responsibility for the Consolidated Financial Statements Management is responsible for the preparation and fair presentation of these consolidated financial statements in accordance with International Financial Reporting Standards, and for such internal control as management determines is necessary to enable the preparation of consolidated financial statements that are free from material misstatement, whether due to fraud or error.
Auditor’s Responsibility Our responsibility is to express an opinion on these consolidated financial statements based on our audit. We conducted our audit in accordance with Canadian generally accepted auditing standards. Those standards require that we comply with ethical requirements and plan and perform the audit to obtain reasonable assurance about whether the consolidated financial statements are free from material misstatement.
An audit involves performing procedures to obtain audit evidence about the amounts and disclosures in the consolidated financial statements. The procedures selected depend on the auditor's judgment, including the assessment of the risks of material misstatement of the consolidated financial statements, whether due to fraud or error. In making those risk assessments, the auditor considers internal control relevant to the entity's preparation and fair presentation of the consolidated financial statements in order to design audit procedures that are appropriate in the circumstances, but not for the purpose of expressing an opinion on the effectiveness of the entity's internal control. An audit also includes evaluating the appropriateness of accounting policies used and the reasonableness of accounting estimates made by management, as well as evaluating the overall presentation of the consolidated financial statements.
We believe that the audit evidence we have obtained is sufficient and appropriate to provide a basis for our audit opinion.
Opinion In our opinion, the consolidated financial statements present fairly, in all material respects, the financial position of Newfoundland and Labrador Hydro as at December 31, 2016, and its financial performance and its cash flows for the year then ended, in accordance with International Financial Reporting Standards.
Emphasis of Matter Without modifying our opinion, we draw attention to Note 31 to the financial statements, which explains that certain comparative information for the year ended December 31, 2015 has been restated.
Chartered Professional Accountants March 7, 2017

NEWFOUNDLAND AND LABRADOR HYDRO CONSOLIDATED STATEMENT OF FINANCIAL POSITION
As at December 31 (millions of Canadian dollars) Notes 2016 2015 (Restated -
Note 31,32) ASSETS Current assets
Cash and cash equivalents 5 26.5 40.1 Trade and other receivables 6 118.9 108.6 Inventories 7 88.9 77.9 Current portion of sinking funds 12 75.2 - Current portion of reserve fund 12 4.9 10.8 Prepayments 5.5 5.8 Derivative asset 25 - 1.9Deferred asset 8 51.1 61.2
Total current assets 371.0 306.3 Non-current assets
Property, plant and equipment 9 2,279.3 2,122.8 Intangible assets 10 7.8 7.1 Long-term investments 13 34.0 - Investment in joint arrangement 1.2 1.2 Other long-term assets 12 202.3 263.0
Total assets 2,895.6 2,700.4 Regulatory deferrals 11 163.8 144.3 Total assets and regulatory deferrals 3,059.4 2,844.7
LIABILITIES AND EQUITY Current liabilities
Short-term borrowings 15 435.0 97.0 Trade and other payables 14 174.4 133.4 Current portion of long-term debt 15 142.6 233.4 Deferred credits 0.4 0.4 Current portion of deferred contributions 16 1.1 1.1 Derivative liability 25 51.1 61.2
Total current liabilities 804.6 526.5 Non-current liabilities
Long-term debt 15 871.7 1,007.0 Deferred contributions 16 12.8 11.6 Decommissioning liabilities 17 15.8 28.8 Employee future benefits 18 102.7 102.4
Total liabilities 1,807.6 1,676.3 Shareholder’s equity
Share capital 20 22.5 22.5 Contributed capital 20 148.1 132.9 Reserves 26.3 19.9 Retained earnings 706.5 663.1
Total equity 903.4 838.4 Total liabilities and equity 2,711.0 2,514.7 Regulatory deferrals 11 348.4 330.0 Total liabilities, equity and regulatory deferrals 3,059.4 2,844.7 Commitments and contingencies (Note 27) Subsequent events (Note 33)
See accompanying notes
On behalf of the Board:
DIRECTOR DIRECTOR

NEWFOUNDLAND AND LABRADOR HYDRO
CONSOLIDATED STATEMENT OF PROFIT AND COMPREHENSIVE INCOME
For the year ended December 31 (millions of Canadian dollars) Notes 2016 2015
(Restated -
Note 31,32) Energy sales 647.7 760.1
Other revenue 27.8 13.5
Revenue 675.5 773.6
Fuels 167.5 192.8
Power purchased 99.1 98.9
Operating costs 21 173.3 201.3
Transmission rental and market fees 22 19.2 21.5
Depreciation and amortization 9,10 84.7 78.9
Net finance (income) expense 23 70.1 72.7
Other (income) expense 24 6.1 2.6
Share of loss of joint arrangement - 0.3
Profit before regulatory adjustments 55.5 104.6
Regulatory adjustments 11 (0.8) 58.2
Profit for the year 56.3 46.4
Other comprehensive income (loss)
Total items that may or have been reclassified to profit or loss
Regulatory adjustment 0.2 0.4
Actuarial gain on employee future benefits 2.9 2.8
Net fair value gains on available-for-sale financial instruments 13.5 10.1
Amounts reclassified to profit or loss (10.2) (10.0)
Other comprehensive income for the year 6.4 3.3
Total comprehensive income for the year 62.7 49.7
See accompanying notes

NEWFOUNDLAND AND LABRADOR HYDRO CONSOLIDATED STATEMENT OF CHANGES IN EQUITY Share Contributed Fair Value Employee
Retained
(millions of Canadian dollars) Notes Capital Capital Reserve Reserve Earnings Total Balance at January 1, 2016 22.5 132.9 41.4 (21.5) 663.1 838.4 Profit for the year - - - - 56.3 56.3 Other comprehensive income Net change in fair value of available-for-sale financial instruments 19 - - 13.5 - - 13.5 Actuarial gain on employee future benefits 18 - - - 2.9 - 2.9 Net change in fair value of financial instruments reclassified to profit or loss 19 - - (10.2) - - (10.2) Regulatory adjustment 11,19 - - - 0.2 - 0.2 Total comprehensive income for the year - - 3.3 3.1 56.3 62.7 Contributed capital 20 - 15.2 - - - 15.2 Dividends 20 - - - - (12.9) (12.9) Balance at December 31, 2016 22.5 148.1 44.7 (18.4) 706.5 903.4
(Restated - Note 31)
Balance at January 1, 2015 22.5 122.8 41.3 (24.7) 661.4 823.3 Profit for the year - - - - 46.4 46.4 Other comprehensive income Net change in fair value of available-for-sale financial instruments 19 - - 10.1 - - 10.1 Actuarial gain on employee future benefits 18 - - - 2.8 - 2.8 Net change in fair value of financial instruments reclassified to profit or loss 19 - - (10.0) - (10.0) Regulatory adjustment 11,19 0.4 0.4 Total comprehensive income for the year - - 0.1 3.2 46.4 49.7 Contributed capital 20 - 10.1 - - - 10.1 Dividends 20 - - - - (44.7) (44.7) Balance at December 31, 2015 22.5 132.9 41.4 (21.5) 663.1 838.4 See accompanying notes
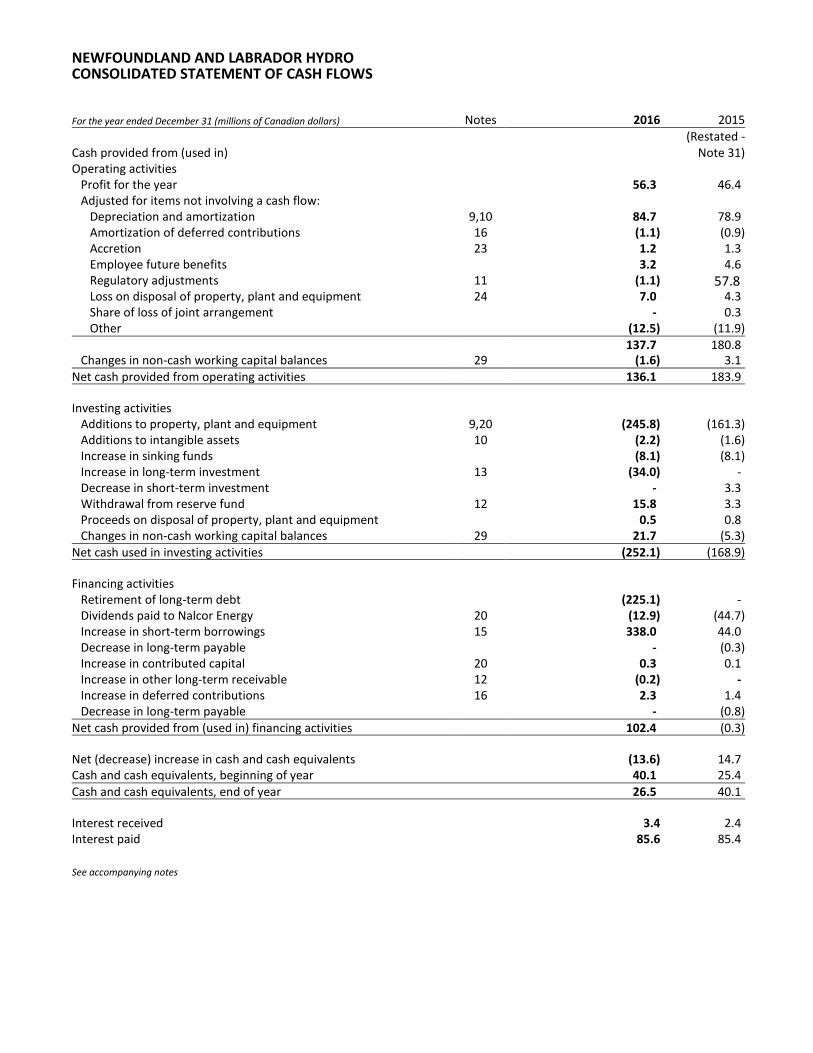
NEWFOUNDLAND AND LABRADOR HYDRO CONSOLIDATED STATEMENT OF CASH FLOWS For the year ended December 31 (millions of Canadian dollars) Notes 2016 2015 (Restated -
Note 31) Cash provided from (used in) Operating activities
Profit for the year 56.3 46.4 Adjusted for items not involving a cash flow:
Depreciation and amortization 9,10 84.7 78.9 Amortization of deferred contributions 16 (1.1) (0.9) Accretion 23 1.2 1.3 Employee future benefits 3.2 4.6 Regulatory adjustments 11 (1.1) 57.8 Loss on disposal of property, plant and equipment 24 7.0 4.3 Share of loss of joint arrangement - 0.3 Other (12.5) (11.9)
137.7 180.8 Changes in non-cash working capital balances 29 (1.6) 3.1
Net cash provided from operating activities 136.1 183.9 Investing activities
Additions to property, plant and equipment 9,20 (245.8) (161.3) Additions to intangible assets 10 (2.2) (1.6) Increase in sinking funds (8.1) (8.1) Increase in long-term investment 13 (34.0) - Decrease in short-term investment - 3.3 Withdrawal from reserve fund 12 15.8 3.3 Proceeds on disposal of property, plant and equipment 0.5 0.8 Changes in non-cash working capital balances 29 21.7 (5.3)
Net cash used in investing activities (252.1) (168.9) Financing activities
Retirement of long-term debt (225.1) - Dividends paid to Nalcor Energy 20 (12.9) (44.7) Increase in short-term borrowings 15 338.0 44.0 Decrease in long-term payable - (0.3) Increase in contributed capital 20 0.3 0.1 Increase in other long-term receivable 12 (0.2) - Increase in deferred contributions 16 2.3 1.4 Decrease in long-term payable - (0.8)
Net cash provided from (used in) financing activities 102.4 (0.3) Net (decrease) increase in cash and cash equivalents (13.6) 14.7 Cash and cash equivalents, beginning of year 40.1 25.4 Cash and cash equivalents, end of year 26.5 40.1 Interest received 3.4 2.4 Interest paid 85.6 85.4 See accompanying notes

NEWFOUNDLAND AND LABRADOR HYDRO NOTES TO THE CONSOLIDATED FINANCIAL STATEMENTS
1. DESCRIPTION OF BUSINESS
Newfoundland and Labrador Hydro (Hydro or the Company) is incorporated under a special act of the Legislature of the Province of Newfoundland and Labrador (the Province). The principal activity of Hydro is the generation, transmission and sale of electricity. Hydro’s operations include both regulated and non-regulated activities. Hydro is a 100% owned subsidiary of Nalcor Energy (Nalcor). Hydro’s head office is located at 500 Columbus Drive in St. John’s, Newfoundland and Labrador A1B 0C9, Canada. Hydro holds interests in the following entities: A 65.8% interest in Churchill Falls (Labrador) Corporation Limited (Churchill Falls). Churchill Falls is incorporated under the laws of Canada and owns and operates a hydroelectric generating plant and related transmission facilities situated in Labrador which has a rated capacity of 5,428 megawatts (MW). A 51% interest in Lower Churchill Development Corporation (LCDC), an inactive subsidiary. LCDC is incorporated under the laws of Newfoundland and Labrador and was established with the objective of developing all or part of the hydroelectric potential of the Lower Churchill River.
2. SIGNIFICANT ACCOUNTING POLICIES 2.1 Statement of Compliance and Basis of Measurement
These annual audited consolidated financial statements have been prepared in accordance with International Financial Reporting Standards (IFRS), as issued by the International Accounting Standards Board (IASB). Hydro has adopted accounting policies which are based on the IFRS applicable as at December 31, 2016, and includes individual IFRS, International Accounting Standards (IAS), and interpretations made by the IFRS Interpretations Committee and the Standing Interpretations Committee. These annual audited consolidated financial statements have been prepared on a historical cost basis, except for financial instruments at fair value through profit or loss (FVTPL) and available-for-sale (AFS) financial assets which have been measured at fair value. The annual audited consolidated financial statements are presented in Canadian Dollars (CAD) and all values rounded to the nearest million, except when otherwise noted. The annual audited consolidated financial statements were approved by Hydro’s Board of Directors (the Board) on March 6, 2017.
2.2 Basis of Consolidation The annual audited consolidated financial statements include the financial statements of Hydro, its subsidiary
company, LCDC, and its share of investments in a joint operation and a joint arrangement. Intercompany transactions and balances have been eliminated upon consolidation.
Effective June 18, 1999, Hydro, Churchill Falls, and Hydro-Québec entered into a Shareholders’ Agreement (the Shareholders’ Agreement) which provided, among other matters, that certain of the strategic operating, financing and investing policies of Churchill Falls be subject to approval jointly by representatives of Hydro and Hydro-Québec on the Board of Directors of Churchill Falls. Although Hydro holds a 65.8% ownership interest, the agreement changed the nature of the relationship between Hydro and Hydro-Québec, with respect to Churchill Falls, from that of majority and minority shareholders, respectively, to that of a joint operation. Accordingly, Hydro has recognized its share of assets, liabilities and profit or loss in relation to its interest in Churchill Falls subsequent to the effective date of the Shareholders’ Agreement.
Churchill Falls holds 33.33% of the equity share capital of Twin Falls Power Corporation Limited (Twin Falls). This
investment is accounted for using the equity method.
- 1 -

NEWFOUNDLAND AND LABRADOR HYDRO NOTES TO THE CONSOLIDATED FINANCIAL STATEMENTS
2.3 Cash and Cash Equivalents and Short-Term Investments Cash and cash equivalents consist of amounts on deposit with a Schedule 1 Canadian Chartered bank, as well as highly liquid investments with maturities of three months or less. Investments with maturities greater than three months and less than twelve months are classified as short-term investments. Cash and cash equivalents are measured at cost, which approximates fair value, while short-term investments are measured at fair value.
2.4 Trade and Other Receivables
Trade and other receivables are classified as loans and receivables and are measured at amortized cost using the effective interest method.
2.5 Inventories Inventories are carried at the lower of cost and net realizable value. Cost is determined on a weighted average basis
and includes expenditures incurred in acquiring the inventories and bringing them to their existing condition and location. Net realizable value represents the estimated selling price for inventories less all estimated costs of completion and costs necessary to make the sale.
2.6 Property, Plant and Equipment
Items of property, plant and equipment are recognized using the cost model and thus are recorded at cost less accumulated depreciation and accumulated impairment losses. Cost includes materials, labour, contracted services, professional fees and, for qualifying assets, borrowing costs capitalized in accordance with Hydro’s accounting policy outlined in Note 2.8. Costs capitalized with the related asset include all those costs directly attributable to bringing the asset into operation. When significant parts of property, plant and equipment are required to be replaced at intervals, Hydro recognizes such parts as individual assets with specific useful lives and depreciation, respectively. Likewise, when a major inspection is performed, its cost is recognized in the carrying amount of the plant and equipment as a replacement if the recognition criteria are satisfied. All other repairs and maintenance costs are recognized in profit or loss as incurred. Property, plant and equipment is not revalued for financial reporting purposes. Depreciation of these assets commences when the assets are ready for their intended use. Hydro Depreciation is calculated on a straight-line basis over the estimated useful lives of the assets as follows: Generation plant Hydroelectric 45 to 100 years Thermal 35 to 65 years Diesel 25 to 55 years Transmission Lines 30 to 65 years Terminal stations 40 to 55 years Distribution system 30 to 55 years Other assets 5 to 55 years
Hydroelectric generation plant includes the powerhouse, turbines, governors and generators, as well as water conveying and control structures, including dams, dikes, tailrace, penstock and intake structures. Thermal generation plant is comprised of the powerhouse, turbines and generators, boilers, oil storage tanks, stacks, and auxiliary systems. Diesel generation plant includes the buildings, engines, generators, switchgear, fuel storage and transfer systems, dikes and liners and cooling systems. Transmission lines include the support structures, foundations and insulators associated with lines at voltages of 230, 138 and 69 kilovolt (kV). Terminal station assets are used to step up voltages of electricity and to step down voltages for distribution. Distribution system assets include poles, transformers, insulators, and conductors. Other assets include telecontrol, buildings, vehicles, furniture, tools and equipment.
- 2 -

NEWFOUNDLAND AND LABRADOR HYDRO NOTES TO THE CONSOLIDATED FINANCIAL STATEMENTS
Churchill Falls Depreciation is calculated on a straight-line basis over the estimated useful lives of the assets as follows: Hydroelectric generation plant 40 to 100 years Transmission and terminals 30 to 65 years Service facilities and other 5 to 45 years Hydro and Churchill Falls assets’ residual values, useful lives and method of depreciation are reviewed at each financial year end and adjusted prospectively, if appropriate. The carrying value of property, plant and equipment is reviewed for impairment whenever events indicate that the carrying amounts of those assets may not be recoverable.
2.7 Intangible Assets Intangible assets that are expected to generate future economic benefit and are measurable, including computer software costs, costs of technical services and studies are capitalized as intangible assets in accordance with IAS 38. Intangible assets with finite useful lives are carried at cost less accumulated amortization and accumulated impairment losses. The estimated useful life and amortization method are reviewed at the end of each year with the effect of any changes in estimate being accounted for on a prospective basis. Intangible assets with indefinite useful lives are carried at cost less accumulated impairment losses. Amortization is calculated on a straight-line basis over the estimated useful lives of the assets as follows: Feasibility studies 5 to 20 years Computer software 10 years
2.8 Borrowing Costs
Borrowing costs directly attributable to the acquisition, construction or production of qualifying assets, which are assets that take a substantial period of time to get ready for their intended use or sale, are added to the cost of those assets, until such time as the assets are substantially ready for their intended use or sale. Investment income earned on the temporary investment of specific borrowings pending their expenditure on qualifying assets is deducted from the borrowing costs eligible for capitalization. All other borrowing costs are recognized in the Consolidated Statement of Profit and Comprehensive Income in the period in which they are incurred.
2.9 Impairment of Non-Financial Assets
At the end of each reporting period, Hydro reviews the carrying amounts of its non-financial assets, to determine whether there is any indication that those assets may be impaired. If any such indication exists, the recoverable amount of the asset is estimated in order to determine the extent of the impairment loss, if any. Where it is not possible to estimate the recoverable amount of an individual asset, Hydro estimates the recoverable amount of the cash generating unit (CGU) to which the asset belongs. Where a reasonable and consistent basis of allocation can be identified, corporate assets are also allocated to individual CGUs, or otherwise they are allocated to the smallest group of CGUs for which a reasonable and consistent allocation basis can be identified. The recoverable amount is the higher of fair value less costs to sell and value in use. In assessing value in use, the estimated future cash flows are discounted to their present value using a discount rate that reflects current market assessments of the time value of money and the risks specific to the asset for which the estimates of future cash flows have not been adjusted. Value in use is generally computed by reference to the present value of future cash flows expected to be derived from non-financial assets. If the recoverable amount of an asset or CGU is estimated to be less than its carrying amount, the carrying amount of the asset or CGU is reduced to its recoverable amount. An impairment loss is recognized immediately in the Consolidated Statement of Profit and Comprehensive Income.
- 3 -

NEWFOUNDLAND AND LABRADOR HYDRO NOTES TO THE CONSOLIDATED FINANCIAL STATEMENTS
2.10 Investment in Joint Arrangement A joint arrangement is an arrangement in which two or more parties have joint control. Control exists when Hydro has the power, directly or indirectly, to govern the financial and operating policies of another entity, so as to obtain benefits from its activities. A joint arrangement is either classified as a joint operation or a joint venture based on the rights of the parties involved. Hydro accounts for its investment in Churchill Falls by recognizing its share of assets, liabilities and profit or loss in relation to its interest in the joint operation. Hydro’s joint operation, Churchill Falls, holds 33.33% of the equity share capital of Twin Falls and is a party with other shareholders in a participation agreement which gives Churchill Falls joint control of Twin Falls. This investment is accounted for using the equity method. Under the equity method, the interest in the joint venture is carried in the Statement of Financial Position at cost plus post acquisition changes in Churchill Falls’ share of net assets of the joint venture. The Statement of Profit and Comprehensive Income reflects the share of the profit or loss of the joint venture.
2.11 Employee Future Benefits
(i) Pension Plan Employees participate in the Province’s Public Service Pension Plan, a multi-employer defined benefit plan.
Contributions by Hydro to this plan are recognized as an expense when employees have rendered service entitling them to the contributions. Liabilities associated with this plan are held with the Province.
(ii) Other Benefits Hydro provides group life insurance and health care benefits on a cost-shared basis to retired employees, in
addition to a severance payment upon retirement. The cost of providing these benefits is determined using the projected unit credit method, with actuarial
valuations being completed on an annual basis based on service and Management’s best estimate of salary escalation, retirement ages of employees and expected health care costs.
Actuarial gains and losses on Hydro’s defined benefit obligation are recognized in reserves in the period in which
they occur. Past service costs are recognized in operating costs as incurred. Pursuant to Order No. P.U. 36 (2015), Hydro recognizes the amortization of employee future benefit actuarial gains and losses in the Consolidated Statement of Profit and Comprehensive Income as a regulatory adjustment.
The retirement benefit obligation recognized in the Statement of Financial Position represents the present value
of the defined benefit obligation.
2.12 Provisions A provision is a liability of uncertain timing or amount. A provision is recognized if Hydro has a present legal obligation or constructive obligation as a result of past events, it is probable that an outflow of resources will be required to settle the obligation and the amount can be reliably estimated. Provisions are not recognized for future operating losses. The provision is measured at the present value of the best estimate of the expenditures expected to be required to settle the obligation using a discount rate that reflects the current market assessments of the time value of money and the risks specific to the obligation. Provisions are re-measured at each Consolidated Statement of Financial Position date using the current discount rate.
- 4 -
NEWFOUNDLAND AND LABRADOR HYDRO NOTES TO THE CONSOLIDATED FINANCIAL STATEMENTS
2.13 Decommissioning, Restoration and Environmental Liabilities Legal and constructive obligations associated with the retirement of property, plant and equipment are recorded as
liabilities when those obligations are incurred and are measured as the present value of the expected costs to settle the liability, discounted at a rate specific to the liability. The liability is accreted up to the date the liability will be incurred with a corresponding charge to net finance (income) expense. The carrying amount of decommissioning, restoration and environmental liabilities is reviewed annually with changes in the estimates of timing or amount of cash flows added to or deducted from the cost of the related asset or expensed in the Consolidated Statement of Profit and Comprehensive Income if the liability is short-term in nature.
2.14 Revenue Recognition
Revenue from the sale of energy is recognized when Hydro has transferred the significant risks and rewards of ownership to the buyer, recovery of the consideration is probable and the amount of revenue can be reliably measured. Sales within the Province are primarily at rates approved by the Newfoundland and Labrador Board of Commissioners of Public Utilities (PUB), whereas export sales and sales to certain major industrial customers are either at rates under the terms of the applicable contracts, or at market rates. Churchill Falls provides energy to two primary customers: Hydro-Québec and Hydro. A power contract with Hydro-Québec dated May 12, 1969 (the Power Contract) provided for the sale of a significant amount of the energy from Churchill Falls. The Power Contract had a 40-year term that expired August 31, 2016, and was followed by a Renewed Power Contract with Hydro-Québec for an additional 25 years beginning September 1, 2016. The rate in the Power Contract was 2.5426 mills per kWh. The rate during the term of the Renewed Power Contract is 2.0 mills per kWh. Churchill Falls also recognizes revenue from Hydro-Québec under a Guaranteed Winter Availability Contract (GWAC) through 2041. The GWAC was signed with Hydro-Québec in 1998 and provides for the sale of 682 MW of guaranteed seasonal availability to Hydro-Québec during the months of November through March in each of the remaining years until 2041. The value of differences between energy delivered and the Annual Energy Base (AEB), as defined in the Power Contract, was tracked over a four-year period and then either recovered from or refunded to Hydro-Québec over the subsequent four-year period, unless the balance is less than $1.0 million in which case it is recovered or refunded immediately or expiration of the Power Contract in which case it is recovered or refunded within 3 months. These long-term receivables or long-term payables are subject to interest at 7% per annum (2015 - 7%). Under the Power Contract and Renewed Power Contract, Churchill Falls has the right to recall 300 MW (Recall Power). All of the Recall Power is sold by Churchill Falls to Hydro. Churchill Falls also provides an additional 225 MW to Hydro.
2.15 Leasing Leases are classified as finance leases whenever the terms of the lease transfer substantially all the risks and rewards of ownership to the lessee. All other leases are classified as operating leases. Lessor accounting Amounts due from lessees under finance leases are recognized as receivables at the amount of Hydro’s net investment in the leases. Finance lease income is allocated to accounting periods so as to reflect a constant periodic rate of return on Hydro’s net investment outstanding in respect of the leases. Rental income from operating leases is recognized on a straight-line basis over the term of the relevant lease. Initial direct costs incurred in negotiating and arranging an operating lease are added to the carrying amount of the leased asset and recognized on a straight-line basis over the lease term.
- 5 -
NEWFOUNDLAND AND LABRADOR HYDRO NOTES TO THE CONSOLIDATED FINANCIAL STATEMENTS
Lessee accounting Assets held under finance leases are initially recognized as assets of Hydro at their fair value at the inception of the lease or, if lower, at the present value of the minimum lease payments. The corresponding liability to the lessor is included in the Consolidated Statement of Financial Position as a finance lease obligation. Lease payments are apportioned between finance expenses and reduction of the lease obligation so as to achieve a constant rate of interest on the remaining balance of the liability. Finance expenses are recognized immediately in profit or loss, unless they are directly attributable to qualifying assets, in which case they are capitalized in accordance with Hydro’s general policy on borrowing costs (Note 2.8). Contingent rental costs are recognized as operating costs in the periods in which they are incurred. Operating lease payments are recognized as an expense on a straight-line basis over the lease term, except where another systematic basis is more representative of the time pattern in which economic benefits from the leased asset are consumed. Contingent rentals arising under operating leases are recognized as an expense in the period in which they are incurred. In the event that lease incentives are received to enter into operating leases, such incentives are recognized as a liability. The aggregate benefit of incentives is recognized as a reduction of rental expense on a straight-line basis, except where another systematic basis is more representative of the time pattern in which economic benefits from the leased asset are consumed.
2.16 Net Finance (Income) Expense For all financial instruments measured at amortized cost and interest bearing financial assets classified as AFS, interest income or expense is recorded using the effective interest rate method.
2.17 Foreign Currencies
Transactions in currencies other than Hydro’s functional currency (foreign currencies) are recognized using the exchange rate in effect at the date of transaction, approximated by the prior month end close rate. At the end of each reporting period, monetary items denominated in foreign currencies are translated at the rates of exchange in effect at the period end date. Foreign exchange gains and losses not included in regulatory deferrals are recorded in the Consolidated Statement of Profit and Comprehensive Income as other (income) expense.
2.18 Income Taxes Hydro is exempt from paying income taxes under Section 149(1) (d.2) of the Income Tax Act. 2.19 Financial Instruments
Financial assets and financial liabilities are recognized in the Consolidated Statement of Financial Position when Hydro becomes a party to the contractual provisions of the instrument and are initially measured at fair value. Subsequent measurement is based on classification. Financial instruments are classified into the following specified categories: financial assets at FVTPL, AFS financial assets, loans and receivables, held-to-maturity investments, financial liabilities at FVTPL, financial instruments used for hedging and other financial liabilities. The classification depends on the nature and purpose of the financial instruments and is determined at the time of initial recognition.
- 6 -

NEWFOUNDLAND AND LABRADOR HYDRO NOTES TO THE CONSOLIDATED FINANCIAL STATEMENTS
Classification of Financial Instruments Hydro has classified each of its financial instruments into the following categories: financial assets at FVTPL, loans and receivables, held-to-maturity investments, AFS financial assets, financial instruments used for hedging and other financial liabilities. Financial Instrument
Cash and cash equivalents Category Loans and receivables
Trade and other receivables Loans and receivables Derivative instruments At FVTPL and financial instruments used for hedging Reserve fund AFS financial assets Sinking funds – investments in same Hydro issue Held-to-maturity investments Sinking funds – other investments AFS financial assets Long-term receivables Loans and receivables Long-term investments AFS financial assets Trade and other payables Other financial liabilities Short-term borrowings Other financial liabilities Long-term debt Other financial liabilities (i) Effective Interest Method The effective interest method is a method of calculating the amortized cost of a financial instrument and
allocating interest income or expense over the relevant period. The effective interest rate is the rate that exactly discounts estimated future cash receipts or payments (including all fees on points paid or received that form an integral part of the effective interest rate, transaction costs and other premiums or discounts) through the expected life of the financial instrument, or, where appropriate, a shorter period to the net carrying amount on initial recognition.
Income or expense is recognized on an effective interest basis for financial instruments other than those
financial assets and liabilities classified at FVTPL. Financial Assets (ii) Financial Assets at FVTPL Financial assets are classified as at FVTPL when the financial asset is either held for trading or it is designated as
at FVTPL. A financial asset is classified as held for trading if:
• it has been acquired principally for the purpose of selling it in the near term; or • on initial recognition it is part of a portfolio of identified financial instruments that Hydro manages together
and has a recent actual pattern of short-term profit-taking; or • it is a derivative that is not designated and effective as a hedging instrument.
A financial asset other than a financial asset held for trading may be designated as at FVTPL upon initial
recognition if:
• such designation eliminates or significantly reduces a measurement or recognition inconsistency that would otherwise arise; or
• the financial asset forms part of a group of financial assets or financial liabilities or both, which is managed and its performance is evaluated on a fair value basis, in accordance with Hydro’s documented risk management or investment strategy, and information about the grouping is provided internally on that basis; or
• it forms part of a contract containing one or more embedded derivatives, and IAS 39 Financial Instruments: Recognition and Measurement permits the entire combined contract (asset or liability) to be designated as at FVTPL.
- 7 -

NEWFOUNDLAND AND LABRADOR HYDRO NOTES TO THE CONSOLIDATED FINANCIAL STATEMENTS
Financial assets at FVTPL are stated at fair value, with any gains or losses arising on re-measurement recognized in other (income) expense. The net gain or loss incorporates any dividends or interest earned.
(iii) Loans and Receivables Trade receivables, loans and other receivables with fixed or determinable payments that are not quoted in an
active market are classified as loans and receivables. Loans and receivables are measured at amortized cost using the effective interest method, less any impairment. Interest income is recognized by applying the effective interest rate, except for short-term receivables when the recognition of interest would be immaterial.
(iv) Held-to-Maturity Investments Non-derivative financial assets with fixed or determinable payments and fixed maturity dates that Hydro has the
positive intent and ability to hold to maturity are classified as held-to-maturity investments. Held-to-maturity investments are measured at amortized cost using the effective interest method less any impairment, with revenue recognized on an effective yield basis.
(v) AFS Financial Assets AFS financial assets are non-derivative financial assets that are designated as available-for-sale or are not
classified in any of the previous categories. Gains and losses arising from changes in fair value are recognized in other comprehensive income and accumulated in the fair value reserve with the exception of impairment losses, interest calculated using the effective interest method, and foreign exchange gains and losses on monetary assets, which are recognized in profit or loss. Where the investment is disposed of or is determined to be impaired, the cumulative gain or loss previously accumulated in the fair value reserve is reclassified to profit or loss.
Financial Liabilities and Equity Instruments
(vi) Classification as Debt or Equity
Debt and equity instruments are classified as either financial liabilities or as equity in accordance with the substance of the contractual arrangement and the definitions of a financial liability and equity instrument.
(vii) Financial Liabilities at FVTPL A financial liability may be classified as at FVTPL if the contracted liability contains one or more embedded
derivatives, and if the embedded derivative significantly modified the cash flows or if the embedded derivative is not closely related to the host liability. Financial liabilities at FVTPL are stated at fair value, with any gains or losses arising from re-measurement recognized in profit or loss.
(viii) Other Financial Liabilities Other financial liabilities, including borrowings, are initially measured at fair value, net of transaction costs.
Other financial liabilities are subsequently measured at amortized cost using the effective interest method, with interest expense recognized on an effective yield basis.
(ix) Derivative Instruments and Financial Instruments Used for Hedging Derivative instruments are utilized by Hydro to manage market risk. Hydro’s policy is not to utilize derivative
instruments for speculative purposes. Derivatives are initially measured at fair value at the date the derivative contracts are entered into and are subsequently measured at their fair value at the end of each reporting period. The resulting gain or loss is recognized in profit or loss immediately unless the derivative is designated and effective as a hedging relationship.
- 8 -
NEWFOUNDLAND AND LABRADOR HYDRO NOTES TO THE CONSOLIDATED FINANCIAL STATEMENTS
2.20 Derecognition of Financial Instruments Hydro derecognizes a financial asset only when the contractual rights to the cash flows from the asset expire, or when it transfers the financial asset and substantially all the risks and rewards of ownership of the asset to another entity. If Hydro neither transfers nor retains substantially all the risks and rewards of ownership and continues to control the transferred asset, its retained interest in the asset and any associated liability for amounts it may have to pay is recognized. If Hydro retains substantially all the risks and rewards of ownership of a transferred financial asset, it continues to recognize the financial asset and also recognizes the collateralized borrowing for the proceeds received. Hydro derecognizes financial liabilities when, and only when, its obligations are discharged, cancelled or they expire.
2.21 Impairment of Financial Assets Financial assets are assessed for indicators of impairment at the end of each reporting period. Financial assets are impaired where there is objective evidence that, as a result of one or more events that occurred after the initial recognition of the financial asset, the estimated future cash flows of the asset have been affected. Evidence of impairment could include: • significant financial difficulty of the issuer or counterparty; or • default or delinquency in interest or principal payments; or • the borrower, more probable than not, entering into bankruptcy or financial re-organization. For certain categories of financial assets, such as trade receivables, assets that are assessed not to be impaired individually are, in addition, assessed for impairment on a collective basis. Objective evidence of impairment for a portfolio of receivables could include Hydro’s past experience of collecting payments, an increase in the number of delayed payments in the portfolio past the average credit period, as well as observable changes in national or local economic conditions that correlate with defaults on receivables.
For financial assets carried at amortized cost, the amount of the impairment is the difference between the asset’s carrying amount and the present value of estimated future cash flows, discounted at the financial asset’s original effective interest rate.
The carrying amount of the financial asset is reduced by the impairment loss directly for all financial assets with the exception of trade receivables, where the carrying amount is reduced through the use of an allowance account. When a trade receivable is considered uncollectible, it is written off against the allowance account. Subsequent recoveries of amounts previously written off are credited to the allowance account. Changes in the carrying amount of the allowance account are recognized in profit or loss. When an AFS financial asset is considered to be impaired, cumulative gains or losses previously recognized in other comprehensive income are reclassified to profit or loss in the period. If, in a subsequent period, the amount of the impairment loss decreases and the decrease can be related objectively to an event occurring after the impairment was recognized, the previously recognized impairment loss is reversed through profit or loss to the extent that the carrying amount of the investment at the date the impairment is reversed does not exceed what the amortized cost would have been had the impairment not been recognized.
2.22 Government Grants
Government grants are recognized when there is reasonable assurance that Hydro will comply with the associated conditions and that the grants will be received. Government grants are recognized in profit or loss on a systematic basis over the periods in which Hydro recognizes as expenses the related costs for which the grants are intended to compensate. Specifically, government grants whose primary condition is that Hydro should purchase, construct or otherwise acquire non-current assets are recognized as deferred revenue in the Statement of Financial Position and transferred to the Consolidated Statement of Profit and Comprehensive Income on a systematic and rational basis over the useful lives of the related assets.
- 9 -
NEWFOUNDLAND AND LABRADOR HYDRO NOTES TO THE CONSOLIDATED FINANCIAL STATEMENTS
Government grants that are receivable as compensation for expenses or losses already incurred or for the purpose of giving immediate financial support to Hydro with no future related costs are recognized in the Consolidated Statement of Profit and Comprehensive Income in the period in which they become receivable.
2.23 Regulatory Deferrals
Hydro’s revenues from its electrical sales to most customers within the Province are subject to rate regulation by the PUB. Hydro's borrowing and capital expenditure programs are also subject to review and approval by the PUB. Rates are set through periodic general rate applications utilizing a cost of service (COS) methodology. The preliminary estimate of Hydro’s allowed rate of return based upon Board Order No. P.U. 49 (2016) is 6.6% in 2016 and 6.7% in 2015 +/- 20 basis points. Hydro applies various accounting policies that differ from enterprises that do not operate in a rate regulated environment. Generally, these policies result in the deferral and amortization of costs or credits which are expected to be recovered or refunded in future rates. In the absence of rate regulation, these amounts would be included in the determination of profit or loss in the year the amounts are incurred. The effects of rate regulation on the annual audited consolidated financial statements are disclosed in Note 11.
3. SIGNIFICANT ACCOUNTING JUDGMENTS, ESTIMATES AND ASSUMPTIONS
The preparation of the annual audited consolidated financial statements in conformity with IFRS requires Management to make judgments, estimates and assumptions that affect the application of accounting policies and the reported amounts of assets, liabilities, revenues and expenses. Actual results may differ materially from these estimates, including changes as a result of future decisions made by the PUB. The estimates and underlying assumptions are reviewed on an on-going basis. Revisions to accounting estimates are recognized in the period in which the estimate is reviewed if the revision affects only that period or future periods.
3.1 Use of Judgments
(i) Property, Plant and Equipment Hydro’s accounting policy relating to property, plant and equipment is described in Note 2.6. In applying this policy, judgment is used in determining whether certain costs are additions to the carrying amount of the property, plant and equipment as opposed to repairs and maintenance. If an asset has been developed, judgment is required to identify the point at which the asset is capable of being used as intended and to identify the directly attributable borrowing costs to be included in the carrying value of the development asset. Judgment is also used in determining the appropriate componentization structure for Hydro’s property, plant and equipment.
(ii) Revenue
Management exercises judgment in estimating the value of electricity consumed by retail customers in the period, but billed subsequent to the end of the reporting period. Specifically, this involves an estimate of consumption for each retail customer, based on the customer’s past consumption history. When recognizing deferrals and related amortization of costs or credits in Hydro Regulated, Management assumes that such costs or credits will be recovered or refunded through customer rates in future years. Recovery of some of these deferrals is subject to a future PUB order. As such, there is a risk that some or all of the regulatory deferrals will not be approved by the PUB which could have a material impact on Hydro Regulated’s profit or loss in the year the order is received.
(iii) Determination of CGUs Hydro’s accounting policy relating to impairment of non-financial assets is described in Note 2.9. In applying this policy, Hydro groups assets into the smallest identifiable group for which cash flows are largely independent of the cash flows from other assets or groups of assets. Judgment is used in determining the level at which cash flows are largely independent of other assets or groups of assets.
- 10 -
NEWFOUNDLAND AND LABRADOR HYDRO NOTES TO THE CONSOLIDATED FINANCIAL STATEMENTS
(iv) Discount Rates Certain of Hydro's financial liabilities are discounted using discount rates that are subject to Management's judgment.
(v) Consolidation of Joint Arrangements Management exercises judgment when applying the criteria outlined in IFRS 11 to determine whether joint arrangements constitute joint ventures or joint operations. Management has determined that its interest in Churchill Falls is considered a joint operation and its interest in Twin Falls is considered a joint venture.
3.2 Use of Estimates
(i) Property, Plant and Equipment Amounts recorded for depreciation are based on the useful lives of Hydro’s assets. The useful lives of property, plant and equipment are determined by independent specialists and reviewed annually by Hydro. These useful lives are Management’s best estimate of the service lives of these assets. Changes to these lives could materially affect the amount of depreciation recorded.
(ii) Intangible Assets Amounts recorded for amortization are based on the useful lives of Hydro’s assets. These useful lives are Management’s best estimate of the service lives of these assets. Changes to these lives could materially affect the amount of amortization recorded.
(iii) Decommissioning Liabilities
Hydro recognizes a liability for the fair value of the future expenditures required to settle obligations associated with the retirement of property, plant and equipment. Decommissioning liabilities are recorded as a liability at fair value, with a corresponding increase to property, plant and equipment. Accretion of decommissioning liabilities is included in the Consolidated Statement of Profit and Comprehensive Income through net finance (income) expense. Differences between the recorded decommissioning liabilities and the actual decommissioning costs incurred are recorded as a gain or loss in the settlement period.
(iv) Employee Future Benefits Hydro provides group life insurance and health care benefits on a cost-shared basis to retired employees, in addition to a severance payment upon retirement. The expected cost of providing these other employee benefits is accounted for on an accrual basis, and has been actuarially determined using the projected unit credit method prorated on service, and Management’s best estimate of salary escalation, retirement ages of employees and expected health care costs.
(v) Revenue In the absence of a signed agreement with Hydro-Québec relating to the AEB, Churchill Falls continues to apply the terms of the previous agreement which expired August 31, 2012. Management continues to work to negotiate terms of a new agreement.
3.3 Use of Assumptions Deferred Assets and Derivative Liabilities Effective October 1, 2015, Hydro entered into a power purchase agreement (PPA) with Nalcor Energy Marketing Corporation (Energy Marketing) which allows for the purchase of available recapture energy from Hydro for resale by Energy Marketing in export markets or through agreements with counterparties. Additionally, the PPA allows for the use of Hydro's transmission service rights by Energy Marketing to deliver electricity, through rights which are provided to Hydro pursuant to a Transmission Service Agreement with Hydro-Québec dated April 1, 2009. In September 2016, the terms of the PPA were amended to require a 60 day termination notice by either party. This replaced the previous termination clause of 90 days prior the end of the operating year. Management’s assumption is that the term of the PPA at December 31, 2016, will continue for at least the next 12 months.
- 11 -
NEWFOUNDLAND AND LABRADOR HYDRO NOTES TO THE CONSOLIDATED FINANCIAL STATEMENTS
Fair values relating to Hydro’s financial instruments and derivatives that have been classified as Level 3, have been determined using inputs for the assets or liabilities that are not readily observable. Certain of these fair values are classified as Level 3 as the transactions do not occur in an active market, or the terms extend beyond the period for which a quoted price is available.
Hydro’s PPA with Energy Marketing is accounted for as a derivative instrument, where Hydro determines that the fair
value at initial recognition differs from the transaction price and the fair value is evidenced neither by a quoted price in an active market for an identical asset or liability, nor based on a valuation technique that uses only data from observable markets. These derivative transactions are initially measured at fair value and the expected difference is deferred. Subsequently, the deferred difference is recognized in other comprehensive income (loss) on an appropriate basis over the life of the related derivative instrument but not later than when the valuation is wholly supported by observable market data or the transaction is completed.
Hydro has elected to defer the difference between the fair value of the power purchase derivative liability upon
initial recognition and the transaction price of the power purchase derivative liability and to amortize the deferred asset on a straight-line basis over its effective term (Note 8). These methods, when compared with alternatives, were determined by Management to more accurately reflect the nature and substance of the transactions.
4. FUTURE CHANGES IN ACCOUNTING POLICIES
Amendments to IFRS 11 – Accounting for Acquisition of Interests in Joint Operations, IAS 1 – Disclosure Initiatives and IAS 16 and 38 – Clarification of Acceptable Methods of Depreciation and Amortization that became effective for annual periods beginning on or after January 1, 2016 did not have a material impact on Hydro’s annual audited consolidated financial statements. Hydro has not applied the following new and revised IFRS that have been issued but are not yet effective: Amendments to IAS 7 - Disclosure Initiative1 Amendments to IAS 10 and IAS 28 - Sale or Contribution of Assets between an Investor and Its Associate or Joint Venture4 IFRS 9 - Financial Instruments2 IFRS 15 - Revenue from Contracts with Customers2 IFRS 16 - Leases3 1Effective for annual periods beginning on or after January 1, 2017, with earlier application permitted. 2Effective for annual periods beginning on or after January 1, 2018, with earlier application permitted. 3Effective for annual periods beginning on or after January 1, 2019, with earlier application permitted. 4Effective for annual periods beginning on or after a date yet to be determined.
4.1 Amendments to IAS 7 - Disclosure Initiative
The amendments require an entity to provide disclosures that enable users of financial statements to evaluate changes in liabilities arising from financing activities, including both changes arising from cash flows and non-cash changes. The amendments do not prescribe a specific format to disclose financing activities; however, an entity may fulfil the disclosure objective by providing a reconciliation between the opening and closing balances in the Statement of Financial Position for liabilities arising from financing activities. The amendments apply prospectively. Entities are not required to present comparative information for earlier periods. Management does not anticipate that the application of these amendments to IAS 7 will have a material impact on Hydro’s annual audited consolidated financial statement disclosures.
- 12 -
NEWFOUNDLAND AND LABRADOR HYDRO NOTES TO THE CONSOLIDATED FINANCIAL STATEMENTS
4.2 Amendments to IFRS 10 and IAS 28 - Sale or Contribution of Assets between an Investor and its Associated or Joint Venture The amendments deal with situations where there is a sale or contribution of assets between an investor and its associate or joint venture.
In December 2015, the IASB postponed the effective date of this amendment indefinitely pending the outcome of its research project on the equity method of accounting. Earlier application of these amendments is still permitted.
4.3 IFRS 9 - Financial Instruments
In July 2014, the IASB finalized the reform of financial instruments accounting and issued IFRS 9 (as revised in 2014), which contains the requirements for a) the classification and measurement of financial assets and financial liabilities, b) impairment methodology, and c) general hedge accounting. IFRS 9 (as revised in 2014) will supersede IAS 39 Financial Instruments: Recognition and Measurement upon its effective date. Phase 1: Classification and measurement of financial assets and financial liabilities With respect to the classification and measurement, the number of categories of financial assets under IFRS 9 has been reduced; all recognized financial assets that are currently within the scope of IAS 39 will be subsequently measured at either amortized cost or fair value under IFRS 9.
IFRS 9 also contains requirements for the classification and measurement of financial liabilities and derecognition requirements. One major change from IAS 39 relates to the presentation of changes in the fair value of a financial liability designated as at FVTPL attributable to changes in the credit risk of that liability. Under IFRS 9, such changes are presented in other comprehensive income, unless the presentation of the effect of the change in the liability’s credit risk in other comprehensive income would create or enlarge an accounting mismatch in profit or loss.
Phase 2: Impairment of financial assets The impairment model under IFRS 9 reflects expected credit losses, as opposed to incurred credit losses under IAS 39. Under the impairment approach in IFRS 9, it is no longer necessary for a credit event to have occurred before credit losses are recognized. Instead, an entity always accounts for expected credit losses and changes in those expected credit losses. The amount of expected credit losses should be updated at each reporting date to reflect changes in credit risk since initial recognition.
Phase 3: Hedge accounting The general hedge accounting requirements of IFRS 9 retain the three types of hedge accounting mechanisms in IAS 39. However, greater flexibility has been introduced to the types of transactions eligible for hedge accounting, specifically broadening the types of instruments that qualify as hedging instruments and the types of risk components of non-financial items that are eligible for hedge accounting. In addition, the effectiveness test has been overhauled and replaced with the principle of an ‘economic relationship’. Retrospective assessment of hedge effectiveness is no longer required. Far more disclosure requirements about an entity’s risk management activities have been introduced.
Transitional provisions IFRS 9 (as revised in 2014) is effective for annual periods beginning on or after January 1, 2018 with earlier application permitted. Management has elected to adopt the standard as of the effective date, and although the classifications of existing financial instruments and related disclosures will change, Management does not anticipate material adjustments to Hydro’s annual audited consolidated financial statements upon transition.
4.4 IFRS 15 - Revenue from Contracts with Customers IFRS 15 establishes a single comprehensive model for entities to use in accounting for revenue arising from contracts with customers. It will supersede the following revenue standards and interpretations upon its effective date: • IAS 18 Revenue; • IAS 11 Construction Contracts; • IFRIC 13 Customer Loyalty Programs; • IFRIC 15 Agreements for the Construction of Real Estate;
- 13 -
NEWFOUNDLAND AND LABRADOR HYDRO NOTES TO THE CONSOLIDATED FINANCIAL STATEMENTS
• IFRIC 18 Transfers of Assets from Customers; and • SIC 31 Revenue-Barter Transactions Involving Advertising Services.
As suggested by the title of the new revenue standard, IFRS 15 will only cover revenue arising from contracts with customers. Under IFRS 15, a customer of an entity is a party that has contracted with the entity to obtain goods or services that are an output of the entity’s ordinary activities in exchange for consideration. Unlike the scope of IAS 18, the recognition and measurement of interest income and dividend income from debt and equity investments are no longer within the scope of IFRS 15. Instead, they are within the scope of IAS 39 (or IFRS 9 if it is early adopted). As mentioned above, the new standard has a single model to deal with revenue from contracts with customers. Its core principle is that an entity should recognize revenue to depict the transfer of promised goods or services to customers in an amount that reflects the consideration to which the entity expects to be entitled in exchange for those goods or services. Specifically, the Standard introduces a five-step approach to revenue recognition: Step 1: Identify the contract(s) with a customer. Step 2: Identify the performance obligations in the contract. Step 3: Determine the transaction price. Step 4: Allocate the transaction price to the performance obligations in the contract. Step 5: Recognize revenue when (or as) the entity satisfies a performance obligation.
Extensive disclosures are also required by the new standard. Management anticipates that the application of IFRS 15 in the future may have a material impact on the amounts reported and disclosures made in Hydro’s annual audited consolidated financial statements. However, it is not practicable to provide a reasonable estimate of the effect of IFRS 15 until Management performs a detailed review.
4.5 IFRS 16 - Leases
IFRS 16 provides a comprehensive model for the identification of lease arrangements and their treatment in the financial statements of both lessees and lessors. It will supersede the following lease standard and interpretations upon its effective date: • IAS 17 Leases; • IFRIC 4 Determining Whether an Arrangement contains a Lease; • SIC-15 Operating Leases – Incentives; and • SIC-27 Evaluating the Substance of Transactions Involving the Legal Form of a Lease.
IFRS 16 applies a control model to the identification of leases, distinguishing between leases and service contracts on the basis of whether there is an identified asset controlled by the customer. The standard introduces significant changes to lessee accounting: it removes the distinction between operating and finance leases under IAS 17 and requires a lessee to recognize a right-of-use asset and a lease liability at lease commencement for all leases, except for short-term leases and leases of low value assets.
In contrast to lessee accounting, the IFRS 16 lessor accounting requirements remain largely unchanged from IAS 17, which continue to require a lessor to classify a lease as either an operating lease or a finance lease. A lessee can apply IFRS 16 either by a full retrospective approach or a modified retrospective approach. If the latter approach is selected, an entity is not required to restate the comparative information and the cumulative effect of initially applying IFRS 16 must be presented as an adjustment to opening retained earnings. Management anticipates that the application of IFRS 16 in the future may have a material impact on the amounts reported and disclosures made in Hydro’s annual audited consolidated financial statements. However, it is not practicable to provide a reasonable estimate of the effect of IFRS 16 until Management performs a detailed review.
- 14 -

NEWFOUNDLAND AND LABRADOR HYDRO NOTES TO THE CONSOLIDATED FINANCIAL STATEMENTS
5. CASH AND CASH EQUIVALENTS
As at December 31 (millions of Canadian dollars) 2016 2015 Cash 13.3 40.1 Cash equivalents 13.2 - 26.5 40.1
The effective interest rate on cash equivalents at December 31, 2016 was 0.97% (2015 – 1.21% to 1.23%). 6. TRADE AND OTHER RECEIVABLES As at December 31 (millions of Canadian dollars) 2016 2015 Trade receivables 95.4 97.2 Due from related parties 14.9 16.7 Other receivables 24.9 7.3 Allowance for doubtful accounts (16.3) (12.6) 118.9 108.6 As at December 31 (millions of Canadian dollars) 2016 2015 0-60 days 115.1 105.1 60+ days 3.8 3.5 118.9 108.6 As at December 31 (millions of Canadian dollars) 2016 2015 Allowance for doubtful accounts, beginning of year (12.6) (11.2) Amounts provided for during the year (3.8) (1.5) Amounts written off as uncollectable 0.1 0.1 Allowance for doubtful accounts, end of year (16.3) (12.6) 7. INVENTORIES As at December 31 (millions of Canadian dollars) 2016 2015 No. 6 fuel 34.9 26.4 Material and other 43.4 41.1 Diesel fuel 3.8 4.2 Other fuel 4.5 3.9 Construction aggregates 2.3 2.3 88.9 77.9 The cost of inventories recognized as an expense during the year is $173.9 million (2015 - $199.3 million) and is included in operating costs and fuels.
- 15 -

NEWFOUNDLAND AND LABRADOR HYDRO NOTES TO THE CONSOLIDATED FINANCIAL STATEMENTS
8. DEFERRED ASSET The deferred asset represents Hydro’s asset related to the PPA with Energy Marketing. The deferred asset is amortized on a straight-line basis over the effective term, being one calendar year, of the related derivative liability. The aggregate difference yet to be recognized in profit or loss at the beginning and end of the year and a reconciliation of the changes of the balance during the year are as follows:
As at December 31 (millions of Canadian dollars) 2016 2015 Deferred asset, beginning of year 61.2 - Additions 51.1 74.9 Amortization (61.2) (13.7) Deferred asset, end of year 51.1 61.2 9. PROPERTY, PLANT AND EQUIPMENT Transmission Generation and Construction As at December 31 (millions of Canadian dollars) Plant Distribution Other in Progress Total Cost Balance at January 1, 2015 1 1,525.9 710.4 204.4 144.5 2,585.2 Additions 1 (0.2) - - 171.4 171.2 Disposals (3.0) (3.1) (3.4) (0.2) (9.7) Transfers 178.1 58.0 21.2 (257.3) - Decommissioning liabilities and revisions 0.5 (0.3) - - 0.2 Balance at December 31, 2015 1 1,701.3 765.0 222.2 58.4 2,746.9 Additions - 0.1 0.1 260.5 260.7 Disposals (6.1) (3.2) (3.4) - (12.7) Transfers 93.8 97.4 24.8 (216.0) - Other adjustments (0.4) (0.1) (0.1) - (0.6) Decommissioning liabilities and revisions (13.9) 1.0 - - (12.9) Balance at December 31, 2016 1,774.7 860.2 243.6 102.9 2,981.4 Depreciation Balance at January 1, 2015 1 369.8 117.6 63.8 - 551.2 Depreciation 44.1 21.6 11.8 - 77.5 Disposals (1.5) (0.8) (2.3) - (4.6) Balance at December 31, 2015 412.4 138.4 73.3 - 624.1 Depreciation 46.7 23.0 13.5 - 83.2 Disposals (1.8) (1.0) (2.4) - (5.2) Balance at December 31, 2016 457.3 160.4 84.4 - 702.1 Carrying value Balance at January 1, 2015 1,156.1 592.8 140.6 144.5 2,034.0 Balance at December 31, 2015 1,288.9 626.6 148.9 58.4 2,122.8 Balance at December 31, 2016 1,317.4 699.8 159.2 102.9 2,279.3 1 Balances have been restated as outlined in Note 31
- 16 -

NEWFOUNDLAND AND LABRADOR HYDRO NOTES TO THE CONSOLIDATED FINANCIAL STATEMENTS
10. INTANGIBLE ASSETS Computer Feasibility Assets Under As at December 31 (millions of Canadian dollars) Software Studies Development Total Cost Balance at January 1, 2015 9.0 1.8 - 10.8 Additions 1.5 - 0.1 1.6 Disposals (1.1) - - (1.1) Transfers 0.1 - (0.1) - Balance at December 31, 2015 9.5 1.8 - 11.3 Additions - - 2.2 2.2 Transfers 0.1 - (0.1) - Balance at December 31, 2016 9.6 1.8 2.1 13.5 Amortization Balance at January 1, 2015 1.8 1.0 - 2.8 Amortization 1.2 0.2 - 1.4 Balance at December 31, 2015 3.0 1.2 - 4.2 Amortization 1.3 0.2 - 1.5 Balance at December 31, 2016 4.3 1.4 - 5.7 Carrying value Balance at January 1, 2015 7.2 0.8 - 8.0 Balance at December 31, 2015 6.5 0.6 - 7.1 Balance at December 31, 2016 5.3 0.4 2.1 7.8 11. REGULATORY DEFERRALS Remaining Recovery January 1 Regulatory December 31 Settlement As at December 31 (millions of Canadian dollars) 2016 Reclass activity 2016 Period (years) Regulatory asset deferrals 2014 cost deferral 38.6 8.1 (8.0) 38.7 n/a 2015 cost deferral 27.8 (1.7) (1.6) 24.5 n/a 2016 cost deferral - - 32.4 32.4 n/a Asset disposal - - 0.4 0.4 20.4 Deferred energy conservation costs 6.3 0.9 1.1 8.3 n/a Deferred foreign exchange on fuel 0.7 - (0.9) (0.2) n/a Deferred lease costs 5.1 - (0.6) 4.5 4.4 Foreign exchange losses 56.2 - (2.2) 54.0 25.0 Fuel supply deferral 9.6 (8.1) (1.5) - n/a Hearing costs - 0.8 (0.5) 0.3 1.0 Phase Two hearing costs - - 0.9 0.9 n/a 144.3 0.0 19.5 163.8 Regulatory liability deferrals Deferred power purchase savings (0.4) - - (0.4) 10.5 Insurance amortization and proceeds (5.0) - 0.6 (4.4) n/a Rate stabilization plan (RSP) (324.6) - (19.0) (343.6) n/a (330.0) - (18.4) (348.4)
- 17 -

NEWFOUNDLAND AND LABRADOR HYDRO NOTES TO THE CONSOLIDATED FINANCIAL STATEMENTS
11.1 Regulatory Adjustments Recorded in the Consolidated Statement of Profit and Comprehensive Income For the year ended December 31 (millions of Canadian dollars) 2016 2015 RSP amortization (40.1) 27.6 RSP fuel deferral 41.8 25.2 RSP interest 25.5 21.7 Rural rate adjustment (8.2) 4.1 Total RSP activity 19.0 78.6 2014 cost deferral 8.0 7.3 2015 cost deferral 1.6 (27.8) 2016 cost deferral (32.4) - Amortization of deferred foreign exchange losses 2.2 2.2 Asset Disposal (0.4) - Deferred energy conservation (1.1) - Deferred foreign exchange on fuel 0.9 (0.4) Deferred lease costs 0.6 (1.4) Deferred purchased power savings - (0.1) Employee future benefits actuarial loss 0.2 0.4 Fuel supply deferral 1.5 - Hearing costs 0.5 - Insurance amortization and proceeds (0.6) (0.6) Non-customer contributions in aid of construction 0.1 - Phase Two hearing costs (0.9) - (0.8) 58.2
The following section describes Hydro’s regulatory deferrals which will be, or are expected to be, reflected in customer rates in future periods and have been established through the rate setting process. In the absence of rate regulation, these amounts would be reflected in operating results in the year and profit or loss for the year ended December 31, 2016 would have decreased by $0.8 million (2015 - an increase of $58.2 million).
11.2 2014 Cost Deferral
As per Order No. P.U. 58 (2014), Hydro received approval in 2014 to defer $45.9 million in relation to Hydro’s proposed 2014 revenue requirement. Hydro decreased the regulatory asset by $8.0 million (2015 - $7.3 million) to recognize an allowance for items outlined in P.U. 49 (2016). In addition, as per Order No. P.U. 49 (2016), the remaining balance of the Fuel Supply Deferral of $8.1 million was reclassified to the 2014 Cost Deferral with recovery to be dealt with in a future Order.
11.3 2015 Cost Deferral
As per Order No. P.U. 36 (2015), Hydro received approval to defer $30.2 million in relation to Hydro’s proposed 2015 net profit deficiency with recovery subject to a future PUB Order. Pursuant to P.U. 49 (2016), Hydro decreased the regulatory asset by $1.6 million (2015 - $27.8 million) to recognize an allowance for adjustments that were outlined in the Order. In addition, based upon P.U. 49 (2016) Hydro re-classified $0.9 million and $0.8 million from the 2015 Cost Deferral to Deferred Energy Conservation Costs and PUB Hearing Costs, respectively.
11.4 2016 Cost Deferral As per Order No. P.U. 56 (2016), Hydro received approval to defer $38.8 million in relation to Hydro’s proposed 2016 net profit deficiency with recovery subject to a future PUB Order. Accordingly, these costs have been recognized as a regulatory asset. In the absence of rate regulation, this amount would be reflected in operating results in the year and net profit or loss for 2016 would have decreased by $38.8 million (2015 - $nil). Pursuant to P.U. 49 (2016), Hydro decreased the regulatory asset by $6.4 million to recognize an allowance for adjustments that were outlined in the Order.
- 18 -

NEWFOUNDLAND AND LABRADOR HYDRO NOTES TO THE CONSOLIDATED FINANCIAL STATEMENTS
11.5 Asset Disposal As per Board Order No. P.U. 49 (2016), the Board ordered that Hydro defer $0.4 million loss on disposal related to the Sunnyside transformer that was disposed in 2014. Hydro is required to recover the deferred asset in rate base and amortize the asset for 22.4 years commencing in 2015. Hydro is required to exclude the new Sunnyside transformer from rate base until the Sunnyside transformer original asset deferral has been fully amortized. In the absence of rate regulation, this amount would be reflected in the operating results in the year and profit or loss for 2016 would have decreased by $0.4 million.
11.6 Deferred Energy Conservation The PUB has historically approved the deferral of costs associated with an electricity conservation program for residential, industrial, and commercial sectors. In 2016, Hydro deferred $1.1 million (2015 - $nil) in the Deferred Energy Conservation Costs regulatory asset. In the absence of rate regulation, this amount would be reflected in the operating results in the year and profit or loss for 2016 would have decreased by $1.1 million (2015 - $nil). In addition, as per P.U. 49 (2016), Hydro re-classified $0.9 million of Deferred Energy Conservation Costs from the 2015 Cost Deferral.
11.7 Deferred Foreign Exchange on Fuel Hydro purchases a significant amount of fuel for HTGS in USD. The RSP allows Hydro to defer variances in fuel prices (including foreign exchange fluctuations). During 2016, Hydro recognized in regulatory assets, foreign exchange gains on fuel purchases of $0.9 million (2015 - $0.4 million loss). In the absence of rate regulation, this amount would be reflected in the operating results in the year and profit or loss for 2016 would have increased by $0.9 million (2015 – decreased by $0.4 million).
11.8 Deferred Lease Costs Pursuant to Order No. P.U. 38 (2013), Order No. P.U. 17 (2016) and Order No. P.U. 23 (2016), Hydro deferred lease costs of $1.6 million (2015 - $1.4 million) for diesel units and other necessary infrastructure to ensure black start capability at the Holyrood Thermal Generating Station (HTGS). In the absence of rate regulation, this amount would be reflected in the operating results in the year and profit or loss for 2016 would have decreased by $1.6 million (2015 - $1.4 million). In Orders No. P.U. 17 (2016), No. P.U. 23 (2016) and No. P.U. 49 (2016), the Board also approved the amortization of the balance over a period of five years. In 2016, Hydro recorded amortization of $2.2 million (2015 - $nil) of the deferred lease costs.
11.9 Deferred Purchased Power Savings
In 1997, the PUB ordered Hydro to defer $1.1 million related to reduced purchased power rates resulting from the interconnection of communities in the area of L'Anse au Clair to Red Bay to the Hydro-Québec system and amortize the balance over a 30-year period. The remaining unamortized savings in the amount of $0.4 million (2015 - $0.4 million) are deferred as a regulatory liability.
11.10 Employee Future Benefits Actuarial Loss Pursuant to Order no. P.U. 36 (2015), Hydro has recognized the amortization of employee future benefit actuarial gains and losses in profit or loss. During 2016, Hydro recorded $0.2 million (2015 - $0.4 million) employee future benefits losses as a regulatory adjustment. In the absence of rate regulation, IFRS would require Hydro to include employee future benefits actuarial gains and losses in other comprehensive income. As a result, during 2016, Hydro also recorded a decrease of $0.2 million (2015 - $0.4 million) to other comprehensive income to recognize the amount that was reclassified to profit or loss.
11.11 Foreign Exchange Losses In 2002, the PUB ordered Hydro to defer realized foreign exchange losses related to the issuance of Swiss Franc and Japanese Yen denominated debt and amortize the balance over a 40-year period. Accordingly, these costs were recognized as a regulatory asset. During 2016, the amortization of $2.2 million (2015 - $2.2 million) reduced regulatory assets.
- 19 -
NEWFOUNDLAND AND LABRADOR HYDRO NOTES TO THE CONSOLIDATED FINANCIAL STATEMENTS
11.12 Fuel Supply Deferral Pursuant to Order No. P.U. 56 (2014), Hydro received approval in 2014 to defer $9.6 million additional capacity related supply costs incurred during the three months ended March 31, 2014 as a regulatory asset. As per Order’s No. P.U. 13 (2016) and P.U. 49 (2016), Hydro recorded a reduction of $1.5 million in 2016 (2015 – $nil) based upon the results of a Prudence Review which resulted in a $1.5 million decrease in profit or loss. In addition, as per Order No. P.U. 49 (2016), the remaining balance of $8.1 million was reclassified to the 2014 Cost Deferral with recovery to be dealt with in a future Order.
11.13 Hearing Costs As per Board Order No. P.U. 49 (2016), the Board approved $0.8 million in Deferred Hearing Costs to be deferred and amortized over a three year period commencing 2015. Pursuant to the Order, Hydro reclassified $0.8 million from the 2015 Cost Deferral to deferred hearing costs. In 2016, Hydro recorded amortization of $0.5 million of the deferred hearing costs.
11.14 Insurance Amortization and Proceeds Pursuant to Order No. P.U. 13 (2012), Hydro records net insurance proceeds against the capital costs and amortizes the balance over the life of the asset. Under IFRS, Hydro is required to recognize the insurance proceeds and corresponding amortization in regulatory liabilities. During 2016, Hydro recorded a decrease to regulatory liabilities resulting from amortization of $0.6 million (2015 - $0.6 million) related to the assets.
11.15 Non-Customer Contributions in Aid of Construction
Pursuant to P.U. 1 (2017), Hydro recognized amortization of deferred contributions in aid of construction (CIAC) from entities which are not customers in profit or loss. During 2016, Hydro recorded $0.1 million (2015 - $nil) non-customer CIAC amortization as a regulatory adjustment. In the absence of rate regulation, IFRS requires non-customer CIACs to be recorded as contributed capital with no corresponding amortization.
11.16 Phase Two Hearing Costs
In April 2016, Hydro received Order No. P.U. 13 (2016) which approved the deferral of costs for 2014, 2015 and subsequent years relating to Phase Two of the investigation into the reliability and adequacy of power on the Island Interconnected system after the interconnection with the Muskrat Falls generating station. As a result, Hydro recorded a regulatory asset of $0.9 million. In the absence of rate regulation, this amount would be reflected in the operating results in the year and profit or loss for 2016 would have decreased by $0.9 million.
11.17 Rate Stabilization Plan (RSP) In 1986, the PUB ordered Hydro to implement a Rate Stabilization Plan (RSP) which primarily provides for the deferral of fuel expense variances resulting from changes in fuel prices, hydrology and load and associated interest. Additionally, the RSP also includes costs associated with the island interconnected and isolated systems. Adjustments required in utility rates to cover the amortization of the balance are implemented on July 1 of each year. Similar adjustments required in industrial rates are implemented on January 1 of each year. During 2016, Hydro recorded a net increase in regulatory liabilities of $19.0 million (2015 - increase of $78.6 million) resulting in an RSP ending balance for 2016 of $343.6 million (2015 - $324.6 million). Included in the balance is $108.6 million (2015 - $126.9 million) which is to be refunded in the following year, with the exception of hydraulic variations, which will be refunded at a rate of 25% of the outstanding balance at December 31, 2016. The remaining portion of the RSP balance totaling $235.0 million (2015 - $197.7 million) has been set aside with $143.4 million (2015 - $133.4 million) to be refunded to Newfoundland Power’s retail customers and Hydro’s Island Rural Customers, $91.2 million (2015 - $61.2 million) subject to a future ruling of the PUB and $0.4 million (2015 - $3.1 million) is being used to phase in Island Industrial rate increases.
- 20 -
NEWFOUNDLAND AND LABRADOR HYDRO NOTES TO THE CONSOLIDATED FINANCIAL STATEMENTS
12. OTHER LONG-TERM ASSETS As at December 31 (millions of Canadian dollars) 2016 2015 Long-term receivables (a) 0.5 0.3 Reserve fund (b) 14.9 30.9 Sinking funds (c) 267.0 242.6 282.4 273.8 Less: current portion of reserve fund (4.9) (10.8) Less: current portion of sinking funds (75.2) - Other long-term assets, end of year 202.3 263.0
(a) The balance of $0.5 million (2015 - $0.3 million) includes the non-current portion of receivables associated with customer payment plans and the long-term portion of employee purchase programs.
(b) In 2007, Churchill Falls commenced the creation of a $75.0 million segregated reserve fund pursuant to the
terms of the Shareholders' Agreement to contribute towards the funding of capital expenditures related to Churchill Falls' existing facilities and their replacement. Churchill Falls invested $17.0 million in each of 2007, 2008 and 2009 and $8.0 million in each of 2010, 2011 and 2012. In December 2016, $23.4 million (2015 - $5.0 million) was withdrawn to fund a portion of capital expenditures. As per the terms of the Shareholders' Agreement, these funds will be replaced over a five year period beginning in 2017.
This fund must remain in place until the end of the Shareholders' Agreement in 2041. Any amounts removed to
fund capital expenditures must be replaced. Reserve fund holdings consist of securities issued by the Government of Canada, various provinces of Canada and Schedule 1 and 2 Canadian Chartered Banks.
Hydro’s proportionate share of the reserve fund consists of the following:
As at December 31 (millions of Canadian dollars) 2016 2015
(Restated -
Note 32) Reserve fund, beginning of year 30.9 34.2 Principal withdrawals (15.4) (3.3) Earnings withdrawn (0.4) - Net discount 0.2 0.1 Mark-to-market adjustment (0.4) (0.1) Reserve fund, end of year 14.9 30.9 Less: current portion (4.9) (10.8) 10.0 20.1
(c) As at December 31, 2016, sinking funds include $267.0 million (2015 - $242.6 million) related to repayment of
Hydro's long-term debt. Sinking fund investments consist of bonds, debentures, promissory notes and coupons issued by, or guaranteed by, the Government of Canada, provincial governments or Schedule 1 banks, and have maturity dates ranging from 2017 to 2033.
Hydro debentures, which are intended to be held to maturity, are deducted from debt while all other sinking fund investments are shown separately on the Consolidated Statement of Financial Position as assets. Annual contributions to the various sinking funds are in accordance with bond indenture terms, and are structured to ensure the availability of adequate funds at the time of expected bond redemption. Effective yields range from 0.97% to 9.12% (2015 - 1.22% to 9.12%).
- 21 -

NEWFOUNDLAND AND LABRADOR HYDRO NOTES TO THE CONSOLIDATED FINANCIAL STATEMENTS
The sinking funds consist of the following: As at December 31 (millions of Canadian dollars) 2016 2015 Sinking funds, beginning of year 242.6 228.4 Contributions 8.1 8.1 Earnings 12.5 5.4 Mark-to-market adjustment 3.8 0.7 Sinking funds, end of year 267.0 242.6 Less: current portion (75.2) - 191.8 242.6 Sinking fund instalments due for the next five years are as follows: (millions of Canadian dollars) 2017 2018 2019 2020 2021 Sinking fund instalments 6.7 6.7 6.7 6.7 6.7 13. LONG-TERM INVESTMENTS
As at December 31 (millions of Canadian dollars) Year of
Maturity 2016 2015
$28.0 million Long-Term Redeemable Guaranteed Investment Certificate (GIC), with interest paid at 1.40%
2019 18.5 -
$23.6 million Long-Term Redeemable GIC, with interest paid at 1.46% 2019 15.5 - 34.0 -
Hydro has recorded their 65.8% proportionate share of the $51.6 million GIC purchased by Churchill Falls during the year for a total of $34.0 million.
14. TRADE AND OTHER PAYABLES As at December 31 (millions of Canadian dollars) 2016 2015 Trade payables 113.4 78.8 Accrued interest payable 27.1 28.8 Payables due to related parties 12.7 9.9 Other payables 21.2 15.9 174.4 133.4
As at December 31, 2016 trade and other payables included balances of $8.4 million (2015 - $0.3 million) denominated in USD.
15. DEBT 15.1 Short-term Borrowings Hydro maintains a $50.0 million CAD or USD equivalent unsecured demand operating credit facility with its banker
and as at December 31, 2016, there were no amounts drawn on this facility (2015 - $nil), however $0.3 million of the borrowing limit has been used to issue an irrevocable letter of credit (2015 - $0.3 million). Borrowings in CAD may take the form of Prime Rate Advances, Bankers’ Acceptances (BAs) and letters of credit, with interest calculated at the Prime Rate or prevailing Government BA fee. Borrowings in USD may take the form of Base Rate Advances, London Interbank Offer Rate (LIBOR) Advances and letters of credit. The facility also provides coverage for overdrafts on Hydro's bank accounts, with interest calculated at the Prime Rate. Hydro has issued one irrevocable letter of credit for $0.3 million (2015 - $0.3 million) as a performance guarantee in relation to the Department of Fisheries and Oceans Fish Habitat Compensation Program which was cancelled on January 24, 2017.
- 22 -

NEWFOUNDLAND AND LABRADOR HYDRO NOTES TO THE CONSOLIDATED FINANCIAL STATEMENTS
On October 12, 2016, Nalcor borrowed $225.0 million from the Province by way of a promissory note, and these funds were then loaned to Hydro. The proceeds of this loan, which will mature on January 11, 2017 and carry an interest rate of 0.90%, were used to repay Hydro's Series AE long-term debentures (Note 33).
In addition, Hydro utilized its government guaranteed promissory note program to fulfill its short-term funding
requirements. As at December 31, 2016, there were $210.0 million in promissory notes outstanding with a maturity date of January 4, 2017 bearing an interest rate of 0.63% (2015 - $97.0 million). Upon maturity, the promissory note was reissued (Note 33).
(millions of Canadian dollars) 2016 2015 Promissory notes - borrowed from the Province 225.0 - Promissory notes - borrowed from external markets 210.0 97.0
435.0 97.0 Churchill Falls maintains a $10.0 million CAD or USD equivalent unsecured demand operating credit facility with its primary banker. There were no amounts drawn on this facility as at December 31, 2016 (2015 - $nil), however $1.0 million of the borrowing limit has been used to issue irrevocable letters of credit (2015 - $1.0 million). Churchill Falls has issued an additional irrevocable letter of credit in the amount of $1.0 million (2015 - $1.0 million), which does not impact the borrowing limit of the operating credit facility. Borrowings in CAD may take the form of Prime Rate Advances, BAs, or letters of credit, with interest calculated at the Prime Rate or prevailing Government BA fee. Borrowings in USD may take the form of Base Rate Advances. The facility also provides coverage for overdrafts on Churchill Falls bank accounts, with interest calculated at the Prime Rate. Churchill Falls has issued three irrevocable letters of credit, totaling $2.0 million (2015 - $2.0 million), to ensure satisfactory management of its waste management and compliance with a certificate of approval for the transportation of special hazardous wastes granted by the Department of Environment and Conservation.
15.2 Long-term Debt The following table represents the value of long-term debt measured at amortized cost: Face Coupon Year of Year of As at December 31 (millions of Canadian dollars) Value Rate % Issue Maturity 2016 2015 Hydro V 0.2 10.50 1989 2014 0.2 0.3 X* 150.0 10.25 1992 2017 149.9 149.8 Y* 300.0 8.40 1996 2026 295.0 294.7 AB* 300.0 6.65 2001 2031 305.5 305.7 AD* 125.0 5.70 2003 2033 123.8 123.8 AE 225.0 4.30 2006 2016 - 224.8 AF 200.0 3.60 2014 2045 197.2 197.1 Total debentures 1,300.2 1,071.6 1,296.2 Less: Sinking fund investments in own debentures 57.3 55.8 1,014.3 1,240.4 Less: payments due within one year 142.6 233.4 Total debentures 871.7 1,007.0 *Sinking funds have been established for these issues.
Hydro’s promissory notes and debentures are unsecured and unconditionally guaranteed as to principal and interest and, where applicable, sinking fund payments, by the Province. The Province charges Hydro a guarantee fee of 25 basis points annually on the total debt (net of sinking funds) with a remaining term to maturity of less than 10 years and 50 basis points annually on total debt (net of sinking funds) with a remaining term to maturity greater than 10 years. The fee for the year ended December 31, 2016 was $4.5 million (2015 - $4.5 million).
- 23 -

NEWFOUNDLAND AND LABRADOR HYDRO NOTES TO THE CONSOLIDATED FINANCIAL STATEMENTS
16. DEFERRED CONTRIBUTIONS Hydro has received contributions in aid of construction of property, plant and equipment. These contributions are deferred and amortized to other revenue over the life of the related property, plant and equipment asset.
As at December 31 (millions of Canadian dollars) 2016 2015 Deferred contributions, beginning of year 12.7 12.2 Additions 2.4 1.4 Disposals (0.1) - Amortization (1.1) (0.9) Deferred contributions, end of year 13.9 12.7 Less: current portion (1.1) (1.1) 12.8 11.6 17. DECOMMISSIONING LIABILITIES
Hydro has recognized liabilities associated with the retirement of portions of the HTGS and the disposal of Polychlorinated Biphenyls (PCB). The reconciliation of the beginning and ending carrying amounts of decommissioning liabilities for December 31, 2016 and December 31, 2015 are as follows:
As at December 31 (millions of Canadian dollars) 2016 2015 Decommissioning liabilities, beginning of year 28.8 28.0 Liabilities settled (0.8) (0.1) Accretion 0.7 0.7 Revisions (12.9) 0.2 Decommissioning liabilities, end of year 15.8 28.8
The total estimated undiscounted cash flows required to settle the HTGS obligations as at December 31, 2016 are $15.2 million (2015 - $32.1 million). The HTGS decommissioning obligation decreased primarily due to an updated assumption that Holyrood will be used as an industrial site for the foreseeable future because of the operation of assets such as the Holyrood CT and the black start diesels. Payments to settle the liability are expected to occur between 2020 and 2023. The fair value of the decommissioning liabilities was determined using the present value of future cash flows discounted at Hydro’s credit adjusted risk free rate of 2.5% (2015 – 2.3%). Hydro has recorded $13.4 million (2015 - $27.0 million) related to HTGS obligations.
The total estimated undiscounted cash flows required to settle the PCB obligations as at December 31, 2016 are $2.7 million (2015 - $2.0 million). Payments to settle the liability are expected to occur between 2017 and 2025. The fair value of the decommissioning liabilities was determined using the present value of future cash flows discounted at Hydro’s and Churchill Falls’ credit adjusted risk free rates of 2.9% to 3.7% (2015 - 2.6% to 3.8%). Hydro and Churchill Falls have recorded $2.4 million (2015 - $1.8 million) related to PCB obligations.
A significant number of Hydro’s assets include generation plants, transmission assets and distribution systems. These assets can continue to run indefinitely with ongoing maintenance activities. As it is expected that Hydro's assets will be used for an indefinite period, no removal date can be determined and, consequently, a reasonable estimate of the fair value of any related decommissioning liability cannot be determined at this time. If it becomes possible to estimate the fair value of the cost of removing assets that Hydro is required to remove, a decommissioning liability for those assets will be recognized at that time.
- 24 -
NEWFOUNDLAND AND LABRADOR HYDRO NOTES TO THE CONSOLIDATED FINANCIAL STATEMENTS
18. EMPLOYEE FUTURE BENEFITS
18.1 Pension Plan Employees participate in the Province’s Public Service Pension Plan, a multi-employer defined benefit plan. The employer’s contributions for the year ended December 31, 2016 of $9.0 million (2015 - $9.2 million) are expensed as incurred.
18.2 Other Benefits
Hydro provides group life insurance and health care benefits on a cost shared basis to retired employees, and in certain cases, their surviving spouses, in addition to a severance payment upon retirement. In 2016, cash payments to beneficiaries for its unfunded other employee future benefits were $3.0 million (2015 - $2.9 million). An actuarial valuation was performed as at December 31, 2016.
As at December 31 (millions of Canadian dollars) 2016 2015
(Restated -
Note 31) Accrued benefit obligation, beginning of year 102.4 100.6 Current service cost 4.2 3.7 Interest cost 4.3 4.2 Benefits paid (3.0) (2.9) Actuarial gain (2.9) (2.8) Transfers (2.3) (0.4) Accrued benefit obligation, end of year 102.7 102.4
When an employee transfers to a related party, the associated accrued benefit obligation is allocated to each respective party based on years of service.
For the year ended December 31 (millions of Canadian dollars) 2016 2015 Component of benefit cost Current service cost 4.2 3.7 Interest cost 4.3 4.2 Total benefit expense for the year 8.5 7.9 The significant actuarial assumptions used in measuring the accrued benefit obligations and benefit expenses are as follows: 2016 2015 Discount rate - benefit cost 4.10% 4.20% Discount rate - accrued benefit obligation 3.90% 4.10% Rate of compensation increase 3.50% 3.50% Assumed healthcare trend rates: 2016 2015 Initial health care expense trend rate 5.85% 6.00% Cost trend decline to 4.50% 4.50% Year that rate reaches the rate it is assumed to remain at 2025 2025
- 25 -
NEWFOUNDLAND AND LABRADOR HYDRO NOTES TO THE CONSOLIDATED FINANCIAL STATEMENTS
A 1% change in assumed health care trend rates would have had the following effects: Increase (millions of Canadian dollars) 2016 2015 Current service and interest cost 1.7 2.4 Accrued benefit obligation 16.5 22.7 Decrease (millions of Canadian dollars) 2016 2015 Current service and interest cost (1.2) (1.7) Accrued benefit obligation (12.7) (17.1) 19. ACCUMULATED OTHER COMPREHENSIVE INCOME The components of, and changes in, accumulated other comprehensive income (loss) are as follows: Items that may or have been reclassified to profit or loss: (millions of Canadian dollars) 2016 2015 Available-for-sale financial instruments Balance at January 1, 2016 41.4 41.3 Net fair value gains on available-for-sale during the year 13.5 10.1 Amounts reclassified to profit or loss (10.2) (10.0) Balance at December 31, 2016 44.7 41.4 (millions of Canadian dollars) 2016 2015 Employee future benefits Balance at January 1, 2016 (21.5) (24.7) Regulatory adjustment 0.2 0.4 Net actuarial gains on defined benefit plans 2.9 2.8 Balance at December 31, 2016 (18.4) (21.5) 20. SHAREHOLDER'S EQUITY 20.1 Share Capital As at December 31 (millions of Canadian dollars) 2016 2015 Common shares of par value of $1 each Authorized - 25,000,000 Issued, paid and outstanding - 22,503,942 22.5 22.5 20.2 Contributed Capital As at December 31 (millions of Canadian dollars) 2016 2015 Contributed capital, beginning of year 132.9 122.8 Additions 15.2 10.1 Contributed capital, end of year 148.1 132.9
During 2016, the Churchill Falls (Labrador) Corporation Trust (the Trust) contributed $0.3 million (2015 - $0.1 million). In addition, LCMC contributed $14.9 million (2015 - $10.0 million) in additions to property, plant and equipment.
- 26 -
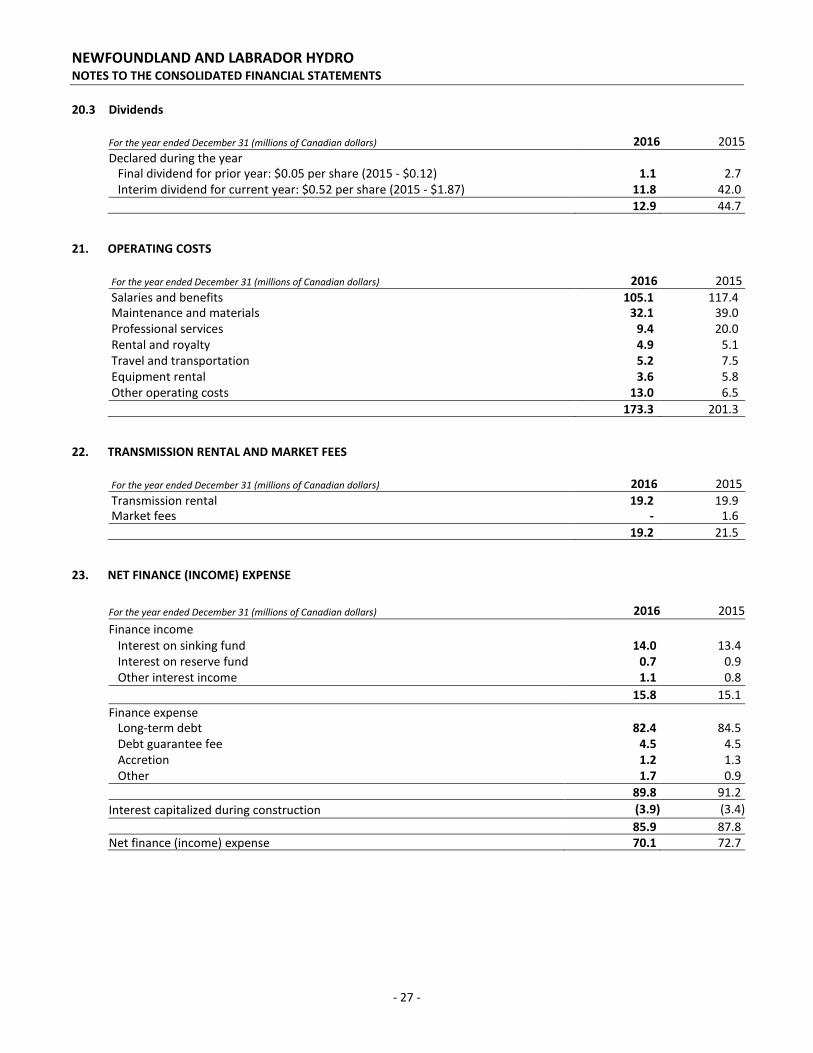
NEWFOUNDLAND AND LABRADOR HYDRO NOTES TO THE CONSOLIDATED FINANCIAL STATEMENTS
20.3 Dividends For the year ended December 31 (millions of Canadian dollars) 2016 2015 Declared during the year Final dividend for prior year: $0.05 per share (2015 - $0.12) 1.1 2.7 Interim dividend for current year: $0.52 per share (2015 - $1.87) 11.8 42.0 12.9 44.7 21. OPERATING COSTS For the year ended December 31 (millions of Canadian dollars) 2016 2015 Salaries and benefits 105.1 117.4 Maintenance and materials 32.1 39.0 Professional services 9.4 20.0 Rental and royalty 4.9 5.1 Travel and transportation 5.2 7.5 Equipment rental 3.6 5.8 Other operating costs 13.0 6.5 173.3 201.3 22. TRANSMISSION RENTAL AND MARKET FEES For the year ended December 31 (millions of Canadian dollars) 2016 2015 Transmission rental 19.2 19.9 Market fees - 1.6 19.2 21.5 23. NET FINANCE (INCOME) EXPENSE For the year ended December 31 (millions of Canadian dollars) 2016 2015 Finance income Interest on sinking fund 14.0 13.4 Interest on reserve fund 0.7 0.9 Other interest income 1.1 0.8 15.8 15.1 Finance expense Long-term debt 82.4 84.5 Debt guarantee fee 4.5 4.5 Accretion 1.2 1.3 Other 1.7 0.9 89.8 91.2 Interest capitalized during construction (3.9) (3.4) 85.9 87.8 Net finance (income) expense 70.1 72.7
- 27 -
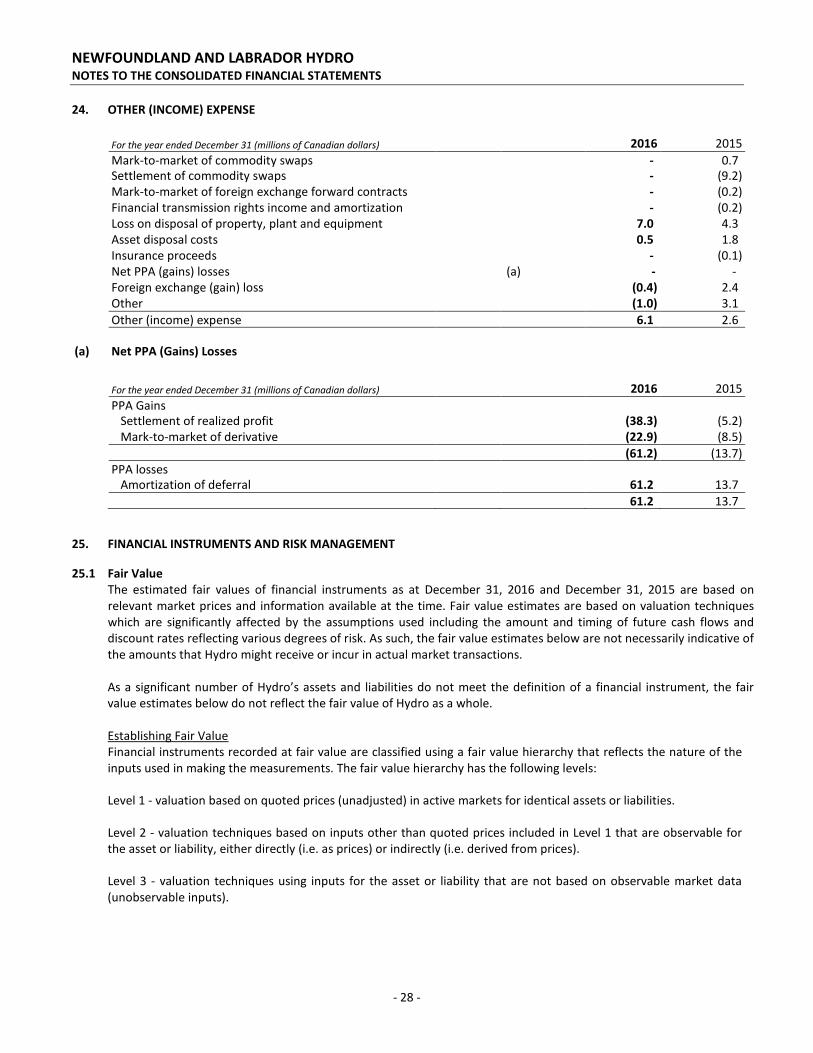
NEWFOUNDLAND AND LABRADOR HYDRO NOTES TO THE CONSOLIDATED FINANCIAL STATEMENTS
24. OTHER (INCOME) EXPENSE For the year ended December 31 (millions of Canadian dollars) 2016 2015 Mark-to-market of commodity swaps - 0.7 Settlement of commodity swaps - (9.2) Mark-to-market of foreign exchange forward contracts - (0.2) Financial transmission rights income and amortization - (0.2) Loss on disposal of property, plant and equipment 7.0 4.3 Asset disposal costs 0.5 1.8 Insurance proceeds - (0.1) Net PPA (gains) losses (a)
- -
Foreign exchange (gain) loss (0.4) 2.4 Other (1.0) 3.1 Other (income) expense 6.1 2.6 (a) Net PPA (Gains) Losses For the year ended December 31 (millions of Canadian dollars) 2016 2015 PPA Gains Settlement of realized profit (38.3) (5.2) Mark-to-market of derivative (22.9) (8.5) (61.2) (13.7) PPA losses Amortization of deferral 61.2 13.7 61.2 13.7 25. FINANCIAL INSTRUMENTS AND RISK MANAGEMENT
25.1 Fair Value The estimated fair values of financial instruments as at December 31, 2016 and December 31, 2015 are based on relevant market prices and information available at the time. Fair value estimates are based on valuation techniques which are significantly affected by the assumptions used including the amount and timing of future cash flows and discount rates reflecting various degrees of risk. As such, the fair value estimates below are not necessarily indicative of the amounts that Hydro might receive or incur in actual market transactions.
As a significant number of Hydro’s assets and liabilities do not meet the definition of a financial instrument, the fair value estimates below do not reflect the fair value of Hydro as a whole. Establishing Fair Value Financial instruments recorded at fair value are classified using a fair value hierarchy that reflects the nature of the inputs used in making the measurements. The fair value hierarchy has the following levels:
Level 1 - valuation based on quoted prices (unadjusted) in active markets for identical assets or liabilities.
Level 2 - valuation techniques based on inputs other than quoted prices included in Level 1 that are observable for the asset or liability, either directly (i.e. as prices) or indirectly (i.e. derived from prices).
Level 3 - valuation techniques using inputs for the asset or liability that are not based on observable market data (unobservable inputs).
- 28 -

NEWFOUNDLAND AND LABRADOR HYDRO NOTES TO THE CONSOLIDATED FINANCIAL STATEMENTS
The fair value hierarchy requires the use of observable market inputs whenever such inputs exist. A financial instrument is classified to the lowest level of the hierarchy for which a significant input has been considered in measuring fair value. For assets and liabilities that are recognized at fair value on a recurring basis, the Company determines whether transfers have occurred between levels in the hierarchy by reassessing categorization (based on the lowest level input that is significant to the fair value measurement as a whole) at the end of each reporting period. There were no transfers between Level 1, 2 and 3 fair value measurement for the year ended December 31, 2016 and the year ended December 31, 2015.
Carrying Fair Carrying Fair Level Value Value Value Value As at December 31 (millions of Canadian dollars) 2016 2015 Financial assets Derivative assets 3 - - 1.9 1.9 Sinking funds - investments in Hydro debt issue 2 57.3 71.3 55.8 69.9 Sinking funds - other investments 2 267.0 267.0 242.6 242.6 Reserve fund 2 14.9 14.9 30.9 30.9 Long-term receivables 2 0.5 0.5 0.3 0.3 Financial liabilities Derivative liabilities 3 51.1 51.1 61.2 61.2 Long-term debt (including amount due within one year before sinking funds) 2 1,071.6 1,333.7 1,296.2 1,650.0 The fair value of cash and cash equivalents, trade and other receivables, long-term investments, short-term
borrowings and trade and other payables, approximates their carrying values due to their short-term maturity. The fair values of Level 2 financial instruments are determined using quoted prices in active markets, which in some
cases are adjusted for factors specific to the asset or liability. Level 2 derivative instruments are valued based on observable commodity future curves, broker quotes or other publicly available data. Level 2 fair values of other risk management assets and liabilities and long-term debt are determined using observable inputs other than unadjusted quoted prices, such as interest rate yield curves and currency rates.
The following table summarizes quantitative information about the valuation techniques and unobservable inputs used in the fair value measurement of Level 3 financial instruments as at December 31, 2016:
(millions of Canadian dollars) Carrying
Value Valuation
Techniques Significant Unobservable
Input(s) Range Derivative liability (PPA) 51.1 Modelled
pricing Volumes (MWh) 35-48% of available
generation The derivative liability arising under the PPA is designated as a Level 3 instrument as certain forward market prices and related volumes are not readily determinable to estimate a portion of the fair value of the derivative liability. Hence, fair value measurement of this instrument is based upon a combination of internal and external pricing and volume estimates. As at December 31, 2016, the effect of using reasonable alternative assumptions for volume inputs to valuation techniques may have resulted in a +$0.1 million to a +$6.6 million change in the carrying value of the power purchase derivative liability.
25.2 Risk Management Hydro is exposed to certain credit, liquidity and market price risks through its operating, investing and financing activities. Financial risk is managed in accordance with a Board-approved policy, which outlines the objectives and strategies for the management of financial risk, including the use of derivative contracts. Permitted financial risk management strategies are aimed at minimizing the volatility of Hydro’s expected future cash flows.
- 29 -
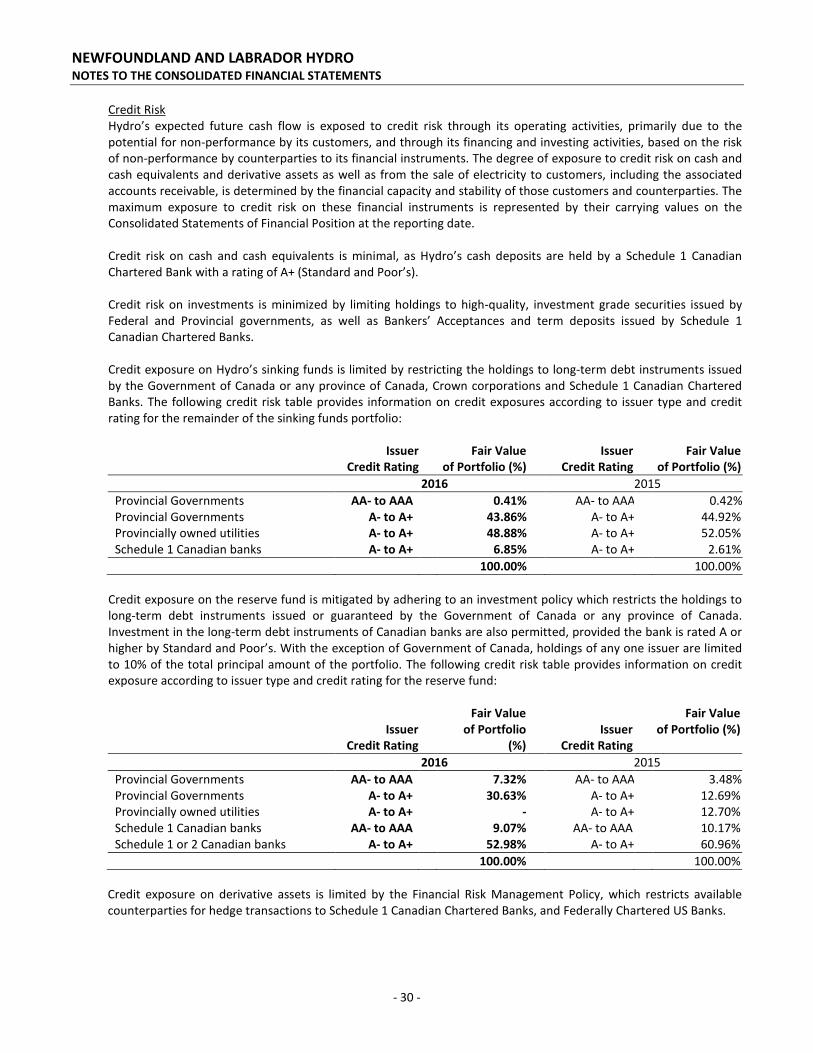
NEWFOUNDLAND AND LABRADOR HYDRO NOTES TO THE CONSOLIDATED FINANCIAL STATEMENTS
Credit Risk Hydro’s expected future cash flow is exposed to credit risk through its operating activities, primarily due to the potential for non-performance by its customers, and through its financing and investing activities, based on the risk of non-performance by counterparties to its financial instruments. The degree of exposure to credit risk on cash and cash equivalents and derivative assets as well as from the sale of electricity to customers, including the associated accounts receivable, is determined by the financial capacity and stability of those customers and counterparties. The maximum exposure to credit risk on these financial instruments is represented by their carrying values on the Consolidated Statements of Financial Position at the reporting date.
Credit risk on cash and cash equivalents is minimal, as Hydro’s cash deposits are held by a Schedule 1 Canadian Chartered Bank with a rating of A+ (Standard and Poor’s). Credit risk on investments is minimized by limiting holdings to high-quality, investment grade securities issued by Federal and Provincial governments, as well as Bankers’ Acceptances and term deposits issued by Schedule 1 Canadian Chartered Banks. Credit exposure on Hydro’s sinking funds is limited by restricting the holdings to long-term debt instruments issued by the Government of Canada or any province of Canada, Crown corporations and Schedule 1 Canadian Chartered Banks. The following credit risk table provides information on credit exposures according to issuer type and credit rating for the remainder of the sinking funds portfolio:
Issuer Credit Rating
Fair Value of Portfolio (%)
Issuer Credit Rating
Fair Value of Portfolio (%)
2016 2015 Provincial Governments AA- to AAA 0.41% AA- to AAA 0.42% Provincial Governments A- to A+ 43.86% A- to A+ 44.92% Provincially owned utilities A- to A+ 48.88% A- to A+ 52.05% Schedule 1 Canadian banks A- to A+ 6.85% A- to A+ 2.61% 100.00% 100.00%
Credit exposure on the reserve fund is mitigated by adhering to an investment policy which restricts the holdings to long-term debt instruments issued or guaranteed by the Government of Canada or any province of Canada. Investment in the long-term debt instruments of Canadian banks are also permitted, provided the bank is rated A or higher by Standard and Poor’s. With the exception of Government of Canada, holdings of any one issuer are limited to 10% of the total principal amount of the portfolio. The following credit risk table provides information on credit exposure according to issuer type and credit rating for the reserve fund:
Issuer
Credit Rating
Fair Value of Portfolio
(%)
Issuer
Credit Rating
Fair Value of Portfolio (%)
2016 2015 Provincial Governments AA- to AAA 7.32% AA- to AAA 3.48% Provincial Governments A- to A+ 30.63% A- to A+ 12.69% Provincially owned utilities A- to A+ - A- to A+ 12.70% Schedule 1 Canadian banks AA- to AAA 9.07% AA- to AAA 10.17% Schedule 1 or 2 Canadian banks A- to A+ 52.98% A- to A+ 60.96% 100.00% 100.00%
Credit exposure on derivative assets is limited by the Financial Risk Management Policy, which restricts available counterparties for hedge transactions to Schedule 1 Canadian Chartered Banks, and Federally Chartered US Banks.
- 30 -
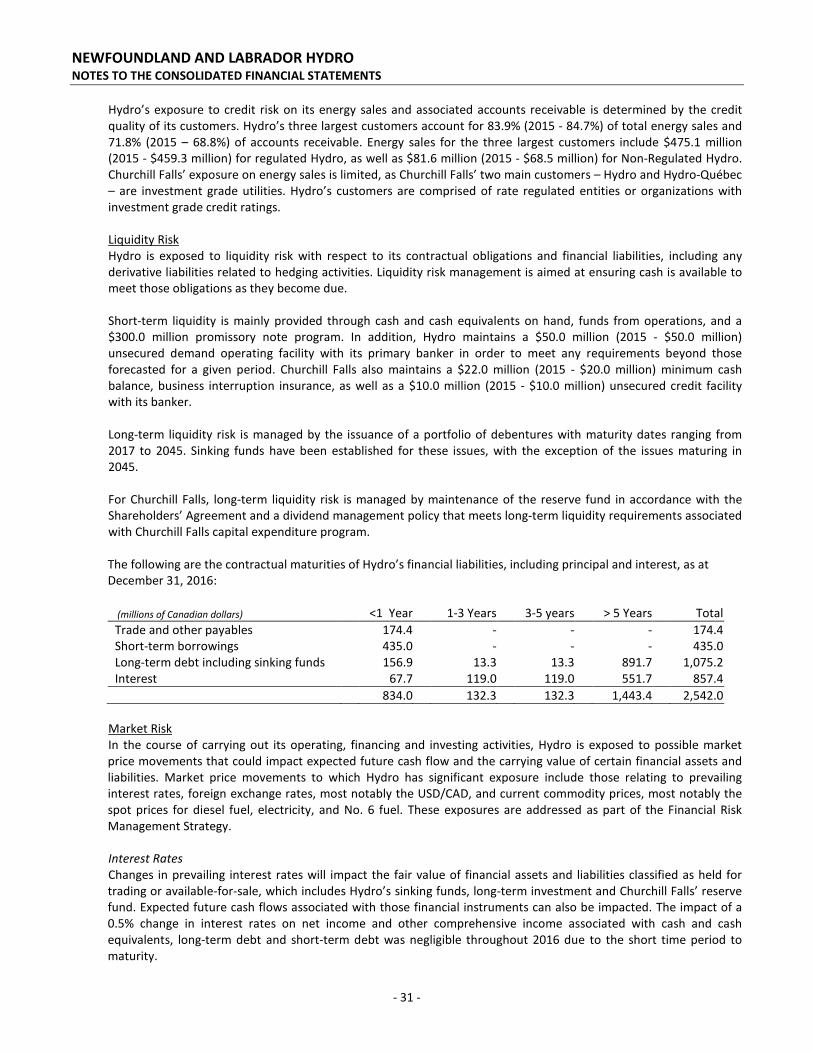
NEWFOUNDLAND AND LABRADOR HYDRO NOTES TO THE CONSOLIDATED FINANCIAL STATEMENTS
Hydro’s exposure to credit risk on its energy sales and associated accounts receivable is determined by the credit quality of its customers. Hydro’s three largest customers account for 83.9% (2015 - 84.7%) of total energy sales and 71.8% (2015 – 68.8%) of accounts receivable. Energy sales for the three largest customers include $475.1 million (2015 - $459.3 million) for regulated Hydro, as well as $81.6 million (2015 - $68.5 million) for Non-Regulated Hydro. Churchill Falls’ exposure on energy sales is limited, as Churchill Falls’ two main customers – Hydro and Hydro-Québec – are investment grade utilities. Hydro’s customers are comprised of rate regulated entities or organizations with investment grade credit ratings.
Liquidity Risk Hydro is exposed to liquidity risk with respect to its contractual obligations and financial liabilities, including any derivative liabilities related to hedging activities. Liquidity risk management is aimed at ensuring cash is available to meet those obligations as they become due. Short-term liquidity is mainly provided through cash and cash equivalents on hand, funds from operations, and a $300.0 million promissory note program. In addition, Hydro maintains a $50.0 million (2015 - $50.0 million) unsecured demand operating facility with its primary banker in order to meet any requirements beyond those forecasted for a given period. Churchill Falls also maintains a $22.0 million (2015 - $20.0 million) minimum cash balance, business interruption insurance, as well as a $10.0 million (2015 - $10.0 million) unsecured credit facility with its banker. Long-term liquidity risk is managed by the issuance of a portfolio of debentures with maturity dates ranging from 2017 to 2045. Sinking funds have been established for these issues, with the exception of the issues maturing in 2045. For Churchill Falls, long-term liquidity risk is managed by maintenance of the reserve fund in accordance with the Shareholders’ Agreement and a dividend management policy that meets long-term liquidity requirements associated with Churchill Falls capital expenditure program.
The following are the contractual maturities of Hydro’s financial liabilities, including principal and interest, as at December 31, 2016:
(millions of Canadian dollars) <1 Year 1-3 Years 3-5 years > 5 Years Total Trade and other payables 174.4 - - - 174.4 Short-term borrowings 435.0 - - - 435.0 Long-term debt including sinking funds 156.9 13.3 13.3 891.7 1,075.2 Interest 67.7 119.0 119.0 551.7 857.4 834.0 132.3 132.3 1,443.4 2,542.0
Market Risk In the course of carrying out its operating, financing and investing activities, Hydro is exposed to possible market price movements that could impact expected future cash flow and the carrying value of certain financial assets and liabilities. Market price movements to which Hydro has significant exposure include those relating to prevailing interest rates, foreign exchange rates, most notably the USD/CAD, and current commodity prices, most notably the spot prices for diesel fuel, electricity, and No. 6 fuel. These exposures are addressed as part of the Financial Risk Management Strategy. Interest Rates Changes in prevailing interest rates will impact the fair value of financial assets and liabilities classified as held for trading or available-for-sale, which includes Hydro’s sinking funds, long-term investment and Churchill Falls’ reserve fund. Expected future cash flows associated with those financial instruments can also be impacted. The impact of a 0.5% change in interest rates on net income and other comprehensive income associated with cash and cash equivalents, long-term debt and short-term debt was negligible throughout 2016 due to the short time period to maturity.
- 31 -
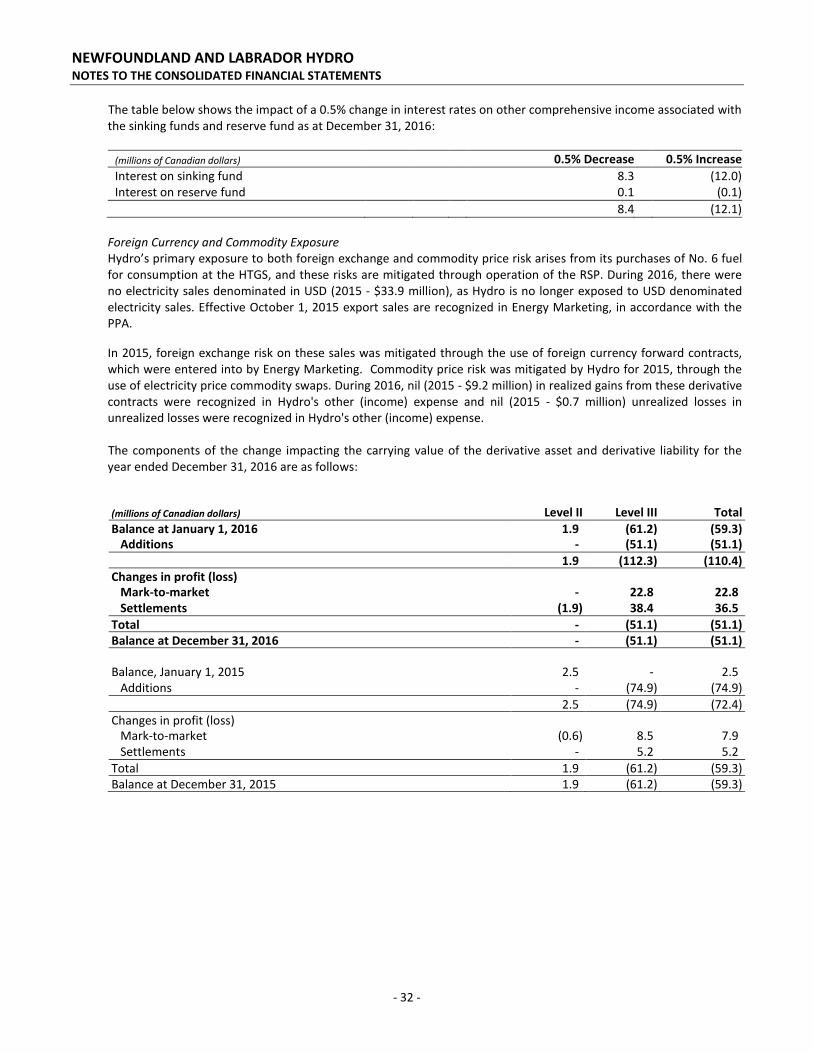
NEWFOUNDLAND AND LABRADOR HYDRO NOTES TO THE CONSOLIDATED FINANCIAL STATEMENTS
The table below shows the impact of a 0.5% change in interest rates on other comprehensive income associated with the sinking funds and reserve fund as at December 31, 2016:
(millions of Canadian dollars) 0.5% Decrease 0.5% Increase Interest on sinking fund 8.3 (12.0) Interest on reserve fund 0.1 (0.1) 8.4 (12.1)
Foreign Currency and Commodity Exposure Hydro’s primary exposure to both foreign exchange and commodity price risk arises from its purchases of No. 6 fuel for consumption at the HTGS, and these risks are mitigated through operation of the RSP. During 2016, there were no electricity sales denominated in USD (2015 - $33.9 million), as Hydro is no longer exposed to USD denominated electricity sales. Effective October 1, 2015 export sales are recognized in Energy Marketing, in accordance with the PPA. In 2015, foreign exchange risk on these sales was mitigated through the use of foreign currency forward contracts, which were entered into by Energy Marketing. Commodity price risk was mitigated by Hydro for 2015, through the use of electricity price commodity swaps. During 2016, nil (2015 - $9.2 million) in realized gains from these derivative contracts were recognized in Hydro's other (income) expense and nil (2015 - $0.7 million) unrealized losses in unrealized losses were recognized in Hydro's other (income) expense. The components of the change impacting the carrying value of the derivative asset and derivative liability for the year ended December 31, 2016 are as follows:
(millions of Canadian dollars) Level II Level III Total Balance at January 1, 2016 1.9 (61.2) (59.3) Additions - (51.1) (51.1) 1.9 (112.3) (110.4) Changes in profit (loss) Mark-to-market - 22.8 22.8 Settlements (1.9) 38.4 36.5 Total - (51.1) (51.1) Balance at December 31, 2016 - (51.1) (51.1) Balance, January 1, 2015 2.5 - 2.5 Additions - (74.9) (74.9) 2.5 (74.9) (72.4) Changes in profit (loss) Mark-to-market (0.6) 8.5 7.9 Settlements - 5.2 5.2 Total 1.9 (61.2) (59.3) Balance at December 31, 2015 1.9 (61.2) (59.3)
- 32 -

NEWFOUNDLAND AND LABRADOR HYDRO NOTES TO THE CONSOLIDATED FINANCIAL STATEMENTS
26. RELATED PARTY TRANSACTIONS
Hydro enters into various transactions with its parent and other affiliates. These transactions occur within the normal course of operations and are measured at the exchange amount, which is the amount of consideration agreed to by the related parties. Related parties with which Hydro transacts are as follows:
Related Party Relationship Nalcor 100.0% shareholder of Hydro Churchill Falls Joint arrangement of Hydro The Province 100.0% shareholder of Nalcor Twin Falls Joint venture of Churchill Falls Labrador-Island Link Limited Partnership Partnership in which Nalcor owns 75 Class A Units Energy Marketing Wholly owned subsidiary of Nalcor Labrador-Island Link Operating Corporation (LIL Opco) Wholly owned subsidiary of Nalcor LCMC Wholly owned subsidiary of Nalcor Muskrat Falls Corporation (Muskrat Falls) Wholly owned subsidiary of Nalcor Nalcor Energy – Bull Arm Fabrication Inc. Wholly owned subsidiary of Nalcor Nalcor Energy – Oil and Gas Inc. Wholly owned subsidiary of Nalcor PUB Agency of the Province The Trust Created by the Province with Churchill Falls as the beneficiary
Routine operating transactions with related parties are settled at prevailing market prices under normal trade terms. Outstanding balances due to or from related parties are non-interest bearing with no set terms of repayment, unless otherwise stated.
(a) Hydro is required to incur the costs of operations of the PUB as well as the cost of hearings and application costs.
During 2016, Hydro incurred $1.3 million (2015 - $3.9 million) in costs related to the PUB and has included $2.1 million (2015 - $4.0 million) in trade and other payables.
(b) As at December 31, 2016, Hydro has a payable to related parties of $6.5 million (2015 - $3.8 million) and a
receivable from related parties for $5.7 million (2015 - $6.2 million). This payable/receivable consists of various intercompany operating costs and power purchases.
(c) The debt guarantee fee for 2016 was $4.5 million (2015 - $4.5 million). It was paid to the Province on March 31,
2016.
(d) Hydro recognized contributions in aid of construction totaling $0.1 million (2015 - $0.2 million) from the Province related to wind feasibility studies. As at December 31, 2016, $0.4 million (2015 - $0.4 million) has been recorded in deferred credits.
(e) For the year ended December 31, 2016, Hydro recovered $3.2 million (2015 - $6.3 million) of operating costs
from related parties representing the provision of administrative services.
(f) For the year ended December 31, 2016, Hydro incurred costs of $3.3 million (2015 - $nil) in operating costs from related parties representing the provision for administrative services.
(g) For the year ended December 31, 2016, Hydro has purchased $25.2 million (2015 - $27.8 million) of power generated from assets related to Exploits Generation, which are held by the Province. In addition, Hydro operates these assets on behalf of Nalcor and recovered costs in the amount of $29.1 million (2015 - $19.2 million).
(h) For the year ended December 31, 2016, Hydro has incurred intercompany labour expense of $2.1 million (2015 -
$1.7 million).
- 33 -

NEWFOUNDLAND AND LABRADOR HYDRO NOTES TO THE CONSOLIDATED FINANCIAL STATEMENTS
(i) Hydro received $0.9 million (2015 - $0.9 million) from Nalcor associated with the Upper Churchill Redress Agreement to be used to reduce the electricity accounts of each residential Innu customer in Innu Communities or to Mushuau Innu First Nation.
(j) Hydro recorded $0.2 million (2015 - $0.4 million) as a rate subsidy for rural isolated customers from the Province
and $1.8 million (2015 – $2.0 million) as an energy rebate to offset the cost of basic electricity consumption for Labrador rural isolated residential customers under the Northern Strategic Plan. As at December 31, 2016, there is a balance of $1.3 million (2015 - $0.7 million) outstanding in trade and other receivables.
(k) Hydro recorded $0.2 million (2015 - $0.4 million) in relation to the isolated diesel subsidy received from the
Province for rural customers.
(l) Hydro received $1.3 million (2015 - $1.2 million) from other lines of business as a contribution in aid of construction for Information Systems assets.
(m) Churchill Falls has entered into long-term power contracts with its shareholders for the sale of substantially all of
the power produced by the generating plant. During 2016, revenue from Hydro-Québec and $102.4 million (2015 - $109.6 million) has recognized its share of $67.4 million (2015 - $72.1 million).
(n) Under the terms of the Lease and amendments thereto, Churchill Falls is required to pay the Province an annual
rental of 8% of the consolidated net profits before income taxes and an annual royalty of $0.50 per horsepower year generated, as defined in the Lease. At December 31, 2016, $7.5 million (2015 - $7.9 million) was payable to the Province. Hydro has recognized its share of $4.9 million (2015 - $5.1 million).
(o) Churchill Falls tracks the value of differences between energy delivered and the Annual Energy Base over a four
year period. The difference is then recovered from or refunded to Hydro-Québec.
The payable to Hydro-Québec as at December 31, 2016 is the accumulation of differences between energy delivered and the AEB during the four year period from September 1, 2008 to August 31, 2012 and the four year period September 1, 2012 to August 31, 2016. The current portion of $nil (2015 - $1.0 million) is included in trade and other payables. For the year ended December 31, 2016, net finance (income) expense on the related party payable/receivable was $0.2 million (2015 - $0.1 million), of which Hydro has recognized its share of $0.1 million (2015 - $0.1 million).
(p) On February 3, 2010, the Province established the Trust with Churchill Falls as the beneficiary. The purpose of the Trust is to fund the external costs and expenses incurred in relation to the motion filed by Churchill Falls seeking a modification to the pricing terms of the 1969 Power Contract. To date, $5.3 million (2015 - $4.9 million) has been received and $13.0 thousand (2015 - $17.0 thousand) has been accrued as receivable from the Trust. Hydro has recognized its share of $3.5 million (2015 - $3.2 million) as received and $8.6 thousand (2015 - $11.2 thousand) accrued as receivable from the Trust.
(q) As at December 31, 2016, Churchill Falls capacity penalty payable was $0.4 million (2015 - $0.4 million), of which Hydro has recorded its share of $0.3 million (2105 - $0.3 million). The capacity penalty relates to the supply of power to Hydro-Québec. Churchill Falls did not incur a capacity penalty in 2016 (2015 - $nil).
(r) During 2016, Churchill Falls received contributions related to property, plant and equipment from Lower
Churchill Management Corporation of $0.1 million (2015 – $nil).
- 34 -
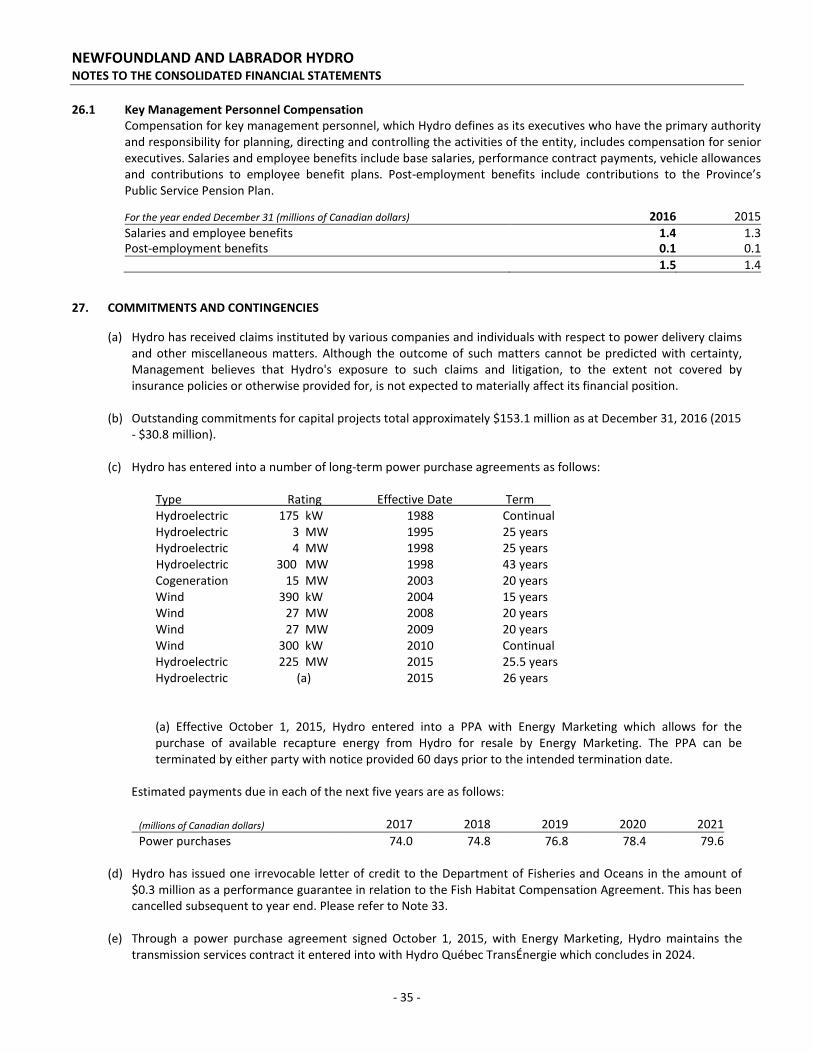
NEWFOUNDLAND AND LABRADOR HYDRO NOTES TO THE CONSOLIDATED FINANCIAL STATEMENTS
26.1 Key Management Personnel Compensation
Compensation for key management personnel, which Hydro defines as its executives who have the primary authority and responsibility for planning, directing and controlling the activities of the entity, includes compensation for senior executives. Salaries and employee benefits include base salaries, performance contract payments, vehicle allowances and contributions to employee benefit plans. Post-employment benefits include contributions to the Province’s Public Service Pension Plan.
For the year ended December 31 (millions of Canadian dollars) 2016 2015 Salaries and employee benefits 1.4 1.3 Post-employment benefits 0.1 0.1 1.5 1.4 27. COMMITMENTS AND CONTINGENCIES
(a) Hydro has received claims instituted by various companies and individuals with respect to power delivery claims and other miscellaneous matters. Although the outcome of such matters cannot be predicted with certainty, Management believes that Hydro's exposure to such claims and litigation, to the extent not covered by insurance policies or otherwise provided for, is not expected to materially affect its financial position.
(b) Outstanding commitments for capital projects total approximately $153.1 million as at December 31, 2016 (2015 - $30.8 million).
(c) Hydro has entered into a number of long-term power purchase agreements as follows:
Type Rating Effective Date Term Hydroelectric 175 kW 1988 Continual Hydroelectric 3 MW 1995 25 years Hydroelectric 4 MW 1998 25 years
Hydroelectric 300 MW 1998 43 years Cogeneration 15 MW 2003 20 years Wind 390 kW 2004 15 years Wind 27 MW 2008 20 years Wind 27 MW 2009 20 years Wind 300 kW 2010 Continual Hydroelectric 225 MW 2015 25.5 years Hydroelectric (a) 2015 26 years (a) Effective October 1, 2015, Hydro entered into a PPA with Energy Marketing which allows for the purchase of available recapture energy from Hydro for resale by Energy Marketing. The PPA can be terminated by either party with notice provided 60 days prior to the intended termination date.
Estimated payments due in each of the next five years are as follows:
(millions of Canadian dollars) 2017 2018 2019 2020 2021 Power purchases 74.0 74.8 76.8 78.4 79.6
(d) Hydro has issued one irrevocable letter of credit to the Department of Fisheries and Oceans in the amount of
$0.3 million as a performance guarantee in relation to the Fish Habitat Compensation Agreement. This has been cancelled subsequent to year end. Please refer to Note 33.
(e) Through a power purchase agreement signed October 1, 2015, with Energy Marketing, Hydro maintains the transmission services contract it entered into with Hydro Québec TransÉnergie which concludes in 2024.
- 35 -

NEWFOUNDLAND AND LABRADOR HYDRO NOTES TO THE CONSOLIDATED FINANCIAL STATEMENTS
The transmission rental payments for the next five years are estimated to be as follows: 2017 $20.6 million 2018 $20.8 million 2019 $21.0 million 2021 $21.3 million 2021 $21.5 million
(f) In 2013, Hydro entered into a Power Purchase Agreement with Muskrat Falls for the purchase of energy and capacity from the Muskrat Falls Plant. The supply period under the agreement is 50 years and commences at the date of commissioning of the Muskrat Falls plant.
(g) In 2013, Hydro entered into the Transmission Funding Agreement (TFA) with LIL Opco, in which Hydro has committed to make payments which will be sufficient for LIL Opco to recover all costs associated with rent payments under the LIL Lease and payments to cover operating and maintenance costs incurred by LIL Opco. Hydro will be required to begin mandatory payments associated with the TFA upon commissioning of the LIL assets. The term of the TFA is anticipated to continue until the service life of the LIL assets has expired.
(h) In 2016, Hydro purchased Wabush Mines' rights to the land and assets that comprise the Wabush Terminal Station and a short section of two 230 kV transmission lines that supply this station. As part of this transaction, Wabush Mines also disclaimed its Crown lease on which another section of 230 kV transmission corridor is located, and Hydro has since applied for a Crown lease for this corridor. All other transmission infrastructure which supplies Labrador West is on land currently subject to a Crown lease to Churchill Falls. Hydro will be filing an application with the PUB for approval of long-term Crown leases and subleases from Churchill Falls for the two 230 kV transmission lines and some terminal equipment serving Labrador West and for the acquisition from Churchill Falls and Twin Falls of some associated terminal station equipment and spares.
(i) In 2014, Hydro entered into three Capacity Assistance Agreements, one with Vale Newfoundland & Labrador
Limited (Vale) and two with Corner Brook Pulp and Paper Limited (CBPP) for the purchase of relief power up to 15.8 MW, 60 MW and 30 MW, respectively, during the winter period. In 2016, Hydro also entered into two new Capacity Assistance Agreements, one with Praxair and a second agreement with Vale for the purchase of relief power up to 5MW and 6MW, respectively. All five agreements have a supply period defined in the agreements as December 1 to March 31 for each contract year, concluding March 2018. Payment for services will be dependent on the successful provision of capacity assistance for the winter period by Vale, CBPP and Praxair.
(j) The arrangements under which Churchill Falls supplies the 225 MW Twinco Block to Twin Falls expired on
December 31, 2014. As a result, a new power purchase agreement (PPA) between Churchill Falls and Hydro for the sale of up to 225 MW of power produced by the Churchill Falls Generating Station was signed by Churchill Falls and Hydro and was effective January 1, 2015 and is in effect to August 31, 2041.
The Sub-lease between Twin Falls and Churchill Falls dated November 15, 1961 giving Twin Falls the right to develop hydroelectric power on the Unknown River expired on December 31, 2014. A sub-lease was signed between Hydro, Churchill Falls and Twin Falls naming Hydro as the sub-lessee of the transmission lines and related assets from Churchill Falls to Labrador West, covering the period of January 1 to June 30, 2015. The term of this Sub-lease between Hydro and Churchill Falls has been extended to March 31, 2017. Discussions continue between Churchill Falls, Twin Falls and Hydro regarding the commercial matters arising from the expiration of the Sub-lease, including the ownership of assets and the assumption of liabilities related thereto (including any environmental liabilities). The financial statements of Twin Falls for the year ended December 31, 2016 do not include adjustments to the carrying values and classification of assets and liabilities as they are undeterminable at this time. These adjustments could be material.
- 36 -
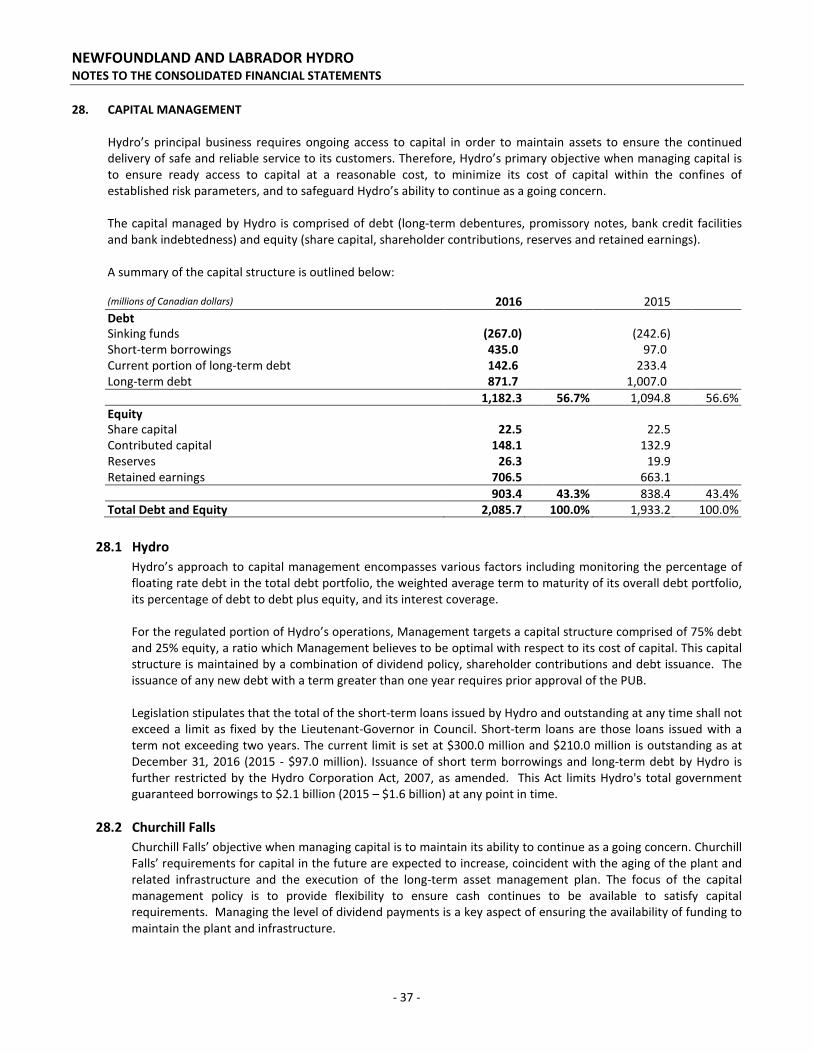
NEWFOUNDLAND AND LABRADOR HYDRO NOTES TO THE CONSOLIDATED FINANCIAL STATEMENTS
28. CAPITAL MANAGEMENT Hydro’s principal business requires ongoing access to capital in order to maintain assets to ensure the continued delivery of safe and reliable service to its customers. Therefore, Hydro’s primary objective when managing capital is to ensure ready access to capital at a reasonable cost, to minimize its cost of capital within the confines of established risk parameters, and to safeguard Hydro’s ability to continue as a going concern.
The capital managed by Hydro is comprised of debt (long-term debentures, promissory notes, bank credit facilities
and bank indebtedness) and equity (share capital, shareholder contributions, reserves and retained earnings). A summary of the capital structure is outlined below: (millions of Canadian dollars) 2016 2015 Debt Sinking funds (267.0) (242.6) Short-term borrowings 435.0 97.0 Current portion of long-term debt 142.6 233.4 Long-term debt 871.7 1,007.0 1,182.3 56.7% 1,094.8 56.6% Equity Share capital 22.5 22.5 Contributed capital 148.1 132.9 Reserves 26.3 19.9 Retained earnings 706.5 663.1 903.4 43.3% 838.4 43.4% Total Debt and Equity 2,085.7 100.0% 1,933.2 100.0%
28.1 Hydro
Hydro’s approach to capital management encompasses various factors including monitoring the percentage of floating rate debt in the total debt portfolio, the weighted average term to maturity of its overall debt portfolio, its percentage of debt to debt plus equity, and its interest coverage. For the regulated portion of Hydro’s operations, Management targets a capital structure comprised of 75% debt and 25% equity, a ratio which Management believes to be optimal with respect to its cost of capital. This capital structure is maintained by a combination of dividend policy, shareholder contributions and debt issuance. The issuance of any new debt with a term greater than one year requires prior approval of the PUB.
Legislation stipulates that the total of the short-term loans issued by Hydro and outstanding at any time shall not exceed a limit as fixed by the Lieutenant-Governor in Council. Short-term loans are those loans issued with a term not exceeding two years. The current limit is set at $300.0 million and $210.0 million is outstanding as at December 31, 2016 (2015 - $97.0 million). Issuance of short term borrowings and long-term debt by Hydro is further restricted by the Hydro Corporation Act, 2007, as amended. This Act limits Hydro's total government guaranteed borrowings to $2.1 billion (2015 – $1.6 billion) at any point in time.
28.2 Churchill Falls Churchill Falls’ objective when managing capital is to maintain its ability to continue as a going concern. Churchill
Falls’ requirements for capital in the future are expected to increase, coincident with the aging of the plant and related infrastructure and the execution of the long-term asset management plan. The focus of the capital management policy is to provide flexibility to ensure cash continues to be available to satisfy capital requirements. Managing the level of dividend payments is a key aspect of ensuring the availability of funding to maintain the plant and infrastructure.
- 37 -

NEWFOUNDLAND AND LABRADOR HYDRO NOTES TO THE CONSOLIDATED FINANCIAL STATEMENTS
At present, the capital position of Churchill Falls is comprised entirely of equity capital (issued capital, shareholder contributions, reserves and retained earnings). The capital structure is adjusted through the amount of dividends paid to shareholders.
Churchill Falls maintains a $10.0 million Canadian or US equivalent unsecured operating credit facility with its banker. Advances may take the form of a Prime Rate advance or the issuance of a Bankers' Acceptance (BA) with interest calculated at the Prime Rate or prevailing Government BA Fee. The facility provides coverage for overdrafts on Churchill Falls' bank accounts, with interest calculated at the Prime Rate. There were no amounts drawn on this facility as at December 31, 2016 (2015 - $nil).
Churchill Falls has issued three irrevocable letters of credit totalling $2.0 million (2015 - $2.0 million), $1.0 million of which does not impact the borrowing limit of the operating credit facility (2015 - $1.0 million). The letters of credit ensure satisfactory management of its waste management system and compliance with a certificate of approval for the transportation of special and hazardous wastes, granted by the Provincial Department of Environment and Conservation.
29. SUPPLEMENTARY CASH FLOW INFORMATION As at December 31 (millions of Canadian dollars) 2016 2015 Trade and other receivables (10.2) (3.6) Inventories (11.0) 19.2 Prepayments 0.3 - Trade and other payables 41.0 (17.8) Changes in non-cash working capital balances 20.1 (2.2) Related to: Operating activities (1.6) 3.1 Investing activities 21.7 (5.3) 20.1 (2.2)
- 38 -

NEWFOUNDLAND AND LABRADOR HYDRO NOTES TO THE CONSOLIDATED FINANCIAL STATEMENTS
30. SEGMENT INFORMATION
Hydro operates in four business segments. Hydro regulated activities encompass sales of electricity to customers within the Province. Churchill Falls operates a hydroelectric generating facility and sells electricity primarily to Hydro-Québec. Energy marketing includes the sale of electricity to markets outside the Province and other non-regulated electricity sales. The designation of segments has been based on a combination of regulatory status and Management accountability. The segments’ accounting policies are the same as those previously described in Note 2 of the annual audited consolidated financial statements.
Hydro Churchill Energy Inter- Regulated Falls Marketing Other Segment Total (millions of Canadian dollars) For the year ended December 31, 2016 Energy sales 511.2 96.4 43.8 - (3.7) 647.7 Other revenue 3.8 0.5 19.2 - 4.3 27.8 Revenue 515.0 96.9 63.0 - 0.6 675.5 Fuels 167.5 - - - - 167.5 Power purchased 60.2 - 42.6 - (3.7) 99.1 Operating costs 124.5 44.4 3.0 1.4 - 173.3 Transmission rental and market fees - - 19.2 - - 19.2 Depreciation and amortization 68.0 16.7 - - - 84.7 Net finance (income) expense 70.9 (1.0) - 0.2 - 70.1 Other (income) expense 5.7 0.4 - - - 6.1 Preferred dividends - (4.3) - - 4.3 - Profit (loss) before regulatory adjustments 18.2 40.7 (1.8) (1.6) - 55.5 Regulatory adjustments (0.8) - - - - (0.8) Profit (loss) for the year 19.0 40.7 (1.8) (1.6) - 56.3 Capital expenditures 218.8 40.9 - 1.0 - 260.7 Total assets 2,442.4 559.8 57.2 - - 3,059.4 Hydro Churchill Energy Inter- Regulated Falls Marketing Other Segment Total (millions of Canadian dollars) For the year ended December 31, 2015 Energy sales 582.1 100.8 81.1 - (3.9) 760.1 Other revenue 3.4 0.5 4.9 - 4.7 13.5 Revenue 585.5 101.3 86.0 - 0.8 773.6 Fuels 192.8 - - - - 192.8 Power purchased 60.7 - 42.1 - (3.9) 98.9 Operating costs 151.7 45.2 2.2 2.2 - 201.3 Transmission rental and market fees - - 21.5 - - 21.5 Depreciation and amortization 63.8 15.1 - - - 78.9 Net finance (income) expense 73.7 (1.1) (0.1) 0.2 - 72.7 Other (income) expense 10.4 1.9 (8.9) (0.8) - 2.6 Preferred dividends - (4.7) - - 4.7 - Share of loss of joint arrangement - 0.3 - - - 0.3 Profit (loss) before regulatory adjustments 32.4 44.6 29.2 (1.6) - 104.6 Regulatory adjustments 58.2 - - - - 58.2 (Loss) profit for the year (25.8) 44.6 29.2 (1.6) - 46.4 Capital expenditures 135.1 36.0 - 0.3 - 171.4 Total assets 2,244.5 532.1 68.1 - - 2,844.7
- 39 -

NEWFOUNDLAND AND LABRADOR HYDRO NOTES TO THE CONSOLIDATED FINANCIAL STATEMENTS
31. PRIOR PERIOD ADJUSTMENTS
The January 1, 2015 and December 31, 2015 figures have been restated as a result of a misstatement relating to the calculation of the other post-employment benefit health and dental liabilities for retirees. The December 31, 2015 figures have been restated to reduce employee future benefits liability by $18.1 million and increase opening retained earnings by $8.7 million and reserves by $9.3 million. In addition, January 1, 2015 and December 31, 2015 balances have been restated for contributions received from LCMC that were previously netted. This presentation adjustment has resulted in an increase in property, plant and equipment and contributed capital of $14.2 million.
The following table summarizes the adjustments to the affected accounts from the previously issued 2015 audited consolidated financial statements to the current year comparative figures:
Previously stated Adjustment Restated (millions of Canadian dollars) 2015 2015 2015 Statement of Financial Position Property, plant and equipment 2,108.6 14.2 2,122.8 Employee future benefits (120.5) 18.1 (102.4) Reserves (10.6) (9.3) (19.9) Contributed capital (118.7) (14.2) (132.9) Retained earnings (654.4) (8.7) (663.1) Statement of Profit and Comprehensive Income Operating costs* 224.9 (2.1) 222.8 Regulatory adjustments 59.5 (1.3) 58.2 Profit for the year 43.2 3.2 46.4 Statement of Changes in Equity Contributed Capital, Balance at January 1, 2015 118.6 4.2 122.8 Employee Future Benefits Reserve, Balance at January 1, 2015 (46.1) 21.4 (24.7) Retained Earnings, Balance at January 1, 2015 (655.9) (5.5) (661.4) Actuarial gain on employee future benefits 13.6 (10.8) 2.8 Regulatory adjustment 1.7 (1.3) 0.4 Consolidated Statement of Cash Flows Employee future benefits 7.0 (2.4) 4.6 Other (11.1) (0.8) (11.9) * See Note 32 for additional comparative figures changes impacting operating
- 40 -
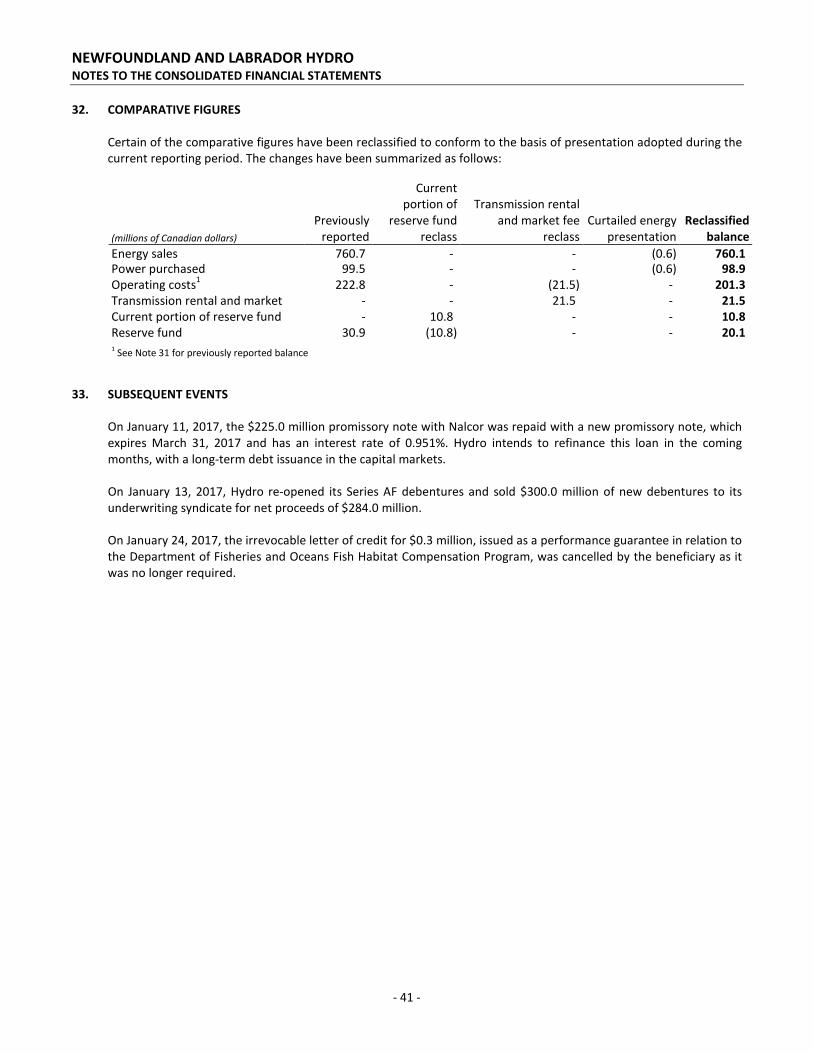
NEWFOUNDLAND AND LABRADOR HYDRO NOTES TO THE CONSOLIDATED FINANCIAL STATEMENTS
32. COMPARATIVE FIGURES
Certain of the comparative figures have been reclassified to conform to the basis of presentation adopted during the current reporting period. The changes have been summarized as follows:
Current
portion of reserve fund
reclass
Transmission rental and market fee
reclass Curtailed energy
presentation Reclassified
balance (millions of Canadian dollars) Previously
reported Energy sales 760.7 - - (0.6) 760.1 Power purchased 99.5 - - (0.6) 98.9 Operating costs1 222.8 - (21.5) - 201.3 Transmission rental and market
- - 21.5 - 21.5
Current portion of reserve fund - 10.8 - - 10.8 Reserve fund 30.9 (10.8) - - 20.1 1 See Note 31 for previously reported balance 33. SUBSEQUENT EVENTS
On January 11, 2017, the $225.0 million promissory note with Nalcor was repaid with a new promissory note, which expires March 31, 2017 and has an interest rate of 0.951%. Hydro intends to refinance this loan in the coming months, with a long-term debt issuance in the capital markets. On January 13, 2017, Hydro re-opened its Series AF debentures and sold $300.0 million of new debentures to its underwriting syndicate for net proceeds of $284.0 million. On January 24, 2017, the irrevocable letter of credit for $0.3 million, issued as a performance guarantee in relation to the Department of Fisheries and Oceans Fish Habitat Compensation Program, was cancelled by the beneficiary as it was no longer required.
- 41 -