nagios xi host and service detail overview · the service detail page displays a complete list of...
TRANSCRIPT

Purpose
This document explains how to utilize the different features of the Nagios® XI™ interface to
view detail information about hosts and services. The Details menu offers many different ways
to view the status of your hosts and services. In larger environments users may want to view
status by host or service group, yet smaller environments may prefer to view status by device.
Target Audience
This document is intended for use by Nagios Administrators and Users.
Details Menu Overview
Nagios XI provides several options for viewing host and service details in
your monitoring environment. Details can be viewed by:
• Individual Hosts or Services
• Host or Service Group Summaries
• Host or Service Group Overviews
• Host or Service Group Grids
You can access the Details menu by clicking on the Home menu item,
then select the Details sub-menu to select your different viewing options.
Service Detail
The Service Detail page displays a complete list of all services currently being monitored in a table format.
Services are color-coded based on their status.
To see more information about a particular service, click a link in the Service column to access the Service
Status Detail page.
1295 Bandana Blvd N, St. Paul, MN 55108 [email protected] US: 1-888-624-4671 INTL: 1-651-204-9102
© 2017 Nagios Enterprises, LLC. All rights reserved. Nagios, the Nagios logo, and Nagios graphics are the servicemarks, trademarks, or registered trademarks owned by Nagios Enterprises. All other servicemarks and trademarks are the property of their respective owner.
www.nagios.comPage 1 / 20
Updated – April, 2018
Nagios XI
The Industry Standard In Infrastructure Monitoring
Host And Service Details Overview

To view the Host Details of a particular host, click a link under the Host column.
The Service Status Detail page gives access to all of
the statistics for that service, accessible via multiple
tabs. The Overview is the first tab that is displayed.
Overview
Displays basic service information such as state,
duration service has been in this state, stability (hard or
soft state), last check time and next check time.
Quick Actions allows Disable/Enable notifications as
well as being able to force an immediate check. Other
actions defined in the Actions component will appear in
this list.
Any Acknowledgments or Comments will appear on the Overview tab.
1295 Bandana Blvd N, St. Paul, MN 55108 [email protected] US: 1-888-624-4671 INTL: 1-651-204-9102
© 2017 Nagios Enterprises, LLC. All rights reserved. Nagios, the Nagios logo, and Nagios graphics are the servicemarks, trademarks, or registered trademarks owned by Nagios Enterprises. All other servicemarks and trademarks are the property of their respective owner.
www.nagios.comPage 2 / 20
Updated – April, 2018
Nagios XI
The Industry Standard In Infrastructure Monitoring
Host And Service Details Overview

Performance Graphs
Displays graph for the service (Last 24 Hours by
default).
A Gauge will also be displayed if the performance
data contains warning and/or critical thresholds.
The graph data is pulled from the round robin
database (RRD), hence values will be averaged as
you look at performance graphs for larger time
periods (weeks, months).
The gauge data is taken from the last check result
received by the service when it was populated into
the RRD file. The data is in an accompanying XML
file in the same directory as the RRD file.
If the service does not produce performance data,
the tab will still appear but no graphs will be shown.
Advanced
The Advanced Status Details table shows more detailed information about the service.
The Service Attributes table displays the current state of each attribute as well as the ability to enable or
disable the attributes. In the state column, if an attribute is:
• Enabled then the circle will be a green color AND in the Action column the can be clicked to disable the
attribute
• Disabled then the circle will be a gray or red color AND in the Action column the can be clicked to
enable the attribute
1295 Bandana Blvd N, St. Paul, MN 55108 [email protected] US: 1-888-624-4671 INTL: 1-651-204-9102
© 2017 Nagios Enterprises, LLC. All rights reserved. Nagios, the Nagios logo, and Nagios graphics are the servicemarks, trademarks, or registered trademarks owned by Nagios Enterprises. All other servicemarks and trademarks are the property of their respective owner.
www.nagios.comPage 3 / 20
Updated – April, 2018
Nagios XI
The Industry Standard In Infrastructure Monitoring
Host And Service Details Overview

The Commands table allows you to:
• Add comment
◦ Create a comment that will appear on the Overview tab.
• Schedule downtime
◦ Define scheduled downtime for the service.
• Submit passive check result
◦ Allows you to manually define the state of the service, most useful with Passive services. If this is an
active service then the check result you submit will be overwritten by the check results of the next
service check interval.
• Send custom notification
◦ This will send a custom notification to all the contacts configured to receive notifications for this
service.
• Delay next notification
◦ This allows you to delay the next problem notification that is sent out for the specified service. The
notification delay will be disregarded if the service changes state before the next notification is
scheduled to be sent out. This has no effect if the service is currently in an OK state.
Under More Options there is also a
link View in Nagios Core for those
more familiar with the Nagios Core
layout.
1295 Bandana Blvd N, St. Paul, MN 55108 [email protected] US: 1-888-624-4671 INTL: 1-651-204-9102
© 2017 Nagios Enterprises, LLC. All rights reserved. Nagios, the Nagios logo, and Nagios graphics are the servicemarks, trademarks, or registered trademarks owned by Nagios Enterprises. All other servicemarks and trademarks are the property of their respective owner.
www.nagios.comPage 4 / 20
Updated – April, 2018
Nagios XI
The Industry Standard In Infrastructure Monitoring
Host And Service Details Overview

Configure
For standard services you have the ability to re-configure or
delete the service.
If the service utilizes any advanced features, such as being
assigned to multiple hosts then you will not be able to use either
option, you will receive an error. You will need to use Core
Config Manager (CCM) to make any changes instead.
When using re-configure the options available are similar to a configuration wizard.
1295 Bandana Blvd N, St. Paul, MN 55108 [email protected] US: 1-888-624-4671 INTL: 1-651-204-9102
© 2017 Nagios Enterprises, LLC. All rights reserved. Nagios, the Nagios logo, and Nagios graphics are the servicemarks, trademarks, or registered trademarks owned by Nagios Enterprises. All other servicemarks and trademarks are the property of their respective owner.
www.nagios.comPage 5 / 20
Updated – April, 2018
Nagios XI
The Industry Standard In Infrastructure Monitoring
Host And Service Details Overview

Capacity Planning
Capacity planning allows you to predict future
trends based on the existing performance
data.
Use the gear icon on the far right to change
options such as Time Period and
Extrapolation Method.
Capacity planning is only available for
services that have performance graphs.
Free Variables
Free variables are an advanced feature of Nagios Core that
allows custom directives with values to be stored in a service
object.
If your service has any free variables defined then they will
appear here in a table for your reference.
Network Traffic Analysis
This tab connects to Nagios Network Analyzer to provide
traffic reporting.
1295 Bandana Blvd N, St. Paul, MN 55108 [email protected] US: 1-888-624-4671 INTL: 1-651-204-9102
© 2017 Nagios Enterprises, LLC. All rights reserved. Nagios, the Nagios logo, and Nagios graphics are the servicemarks, trademarks, or registered trademarks owned by Nagios Enterprises. All other servicemarks and trademarks are the property of their respective owner.
www.nagios.comPage 6 / 20
Updated – April, 2018
Nagios XI
The Industry Standard In Infrastructure Monitoring
Host And Service Details Overview

Host Detail
The Host Detail page displays a complete list of all hosts currently being monitored in a table format. Hosts
are color-coded based on their status. To see more information about a particular host, click a link in the Host
column to access the Host Status Detail page.
The Host Status Detail page gives access to all of the
statistics for that service, accessible via multiple tabs. The
Overview is the first tab that is displayed.
Overview
Displays basic host information such as state, duration
host has been in this state, stability (hard or soft state), last
check time and next check time.
1295 Bandana Blvd N, St. Paul, MN 55108 [email protected] US: 1-888-624-4671 INTL: 1-651-204-9102
© 2017 Nagios Enterprises, LLC. All rights reserved. Nagios, the Nagios logo, and Nagios graphics are the servicemarks, trademarks, or registered trademarks owned by Nagios Enterprises. All other servicemarks and trademarks are the property of their respective owner.
www.nagios.comPage 7 / 20
Updated – April, 2018
Nagios XI
The Industry Standard In Infrastructure Monitoring
Host And Service Details Overview

Quick Actions allows:
• Disable/Enable notifications
• Force an immediate check
• Ping the host
• Connect to the host (RDP, VCN, Telnet, SSH)
• Traceroute the host
Other actions defined in the Actions component will appear in this list.
Any Acknowledgments or Comments will appear on the Overview tab.
Performance Graphs
Displays graph for the host object and the first four
services for the host (Last 24 Hours by default). There
is a link at the bottom More Performance Graphs
that will allow you to browse all the performance
graphs of the services assigned to the host.
A Gauge will also be displayed if the host object
performance data contains warning and/or critical
thresholds.
The graph data is pulled from the round robin
database (RRD), hence values will be averaged as
you look at performance graphs for larger time
periods (weeks, months).
The gauge data is taken from the last check result
received by the host when it was populated into the
RRD file. The data is in an accompanying XML file in the same directory as the RRD file.
1295 Bandana Blvd N, St. Paul, MN 55108 [email protected] US: 1-888-624-4671 INTL: 1-651-204-9102
© 2017 Nagios Enterprises, LLC. All rights reserved. Nagios, the Nagios logo, and Nagios graphics are the servicemarks, trademarks, or registered trademarks owned by Nagios Enterprises. All other servicemarks and trademarks are the property of their respective owner.
www.nagios.comPage 8 / 20
Updated – April, 2018
Nagios XI
The Industry Standard In Infrastructure Monitoring
Host And Service Details Overview

If the host does not produce performance data, the tab will still appear but no host graphs will be shown
(service graphs will be shown if they exist).
Advanced
The Advanced Status Details table shows more detailed information about the host.
The Host Attributes table displays the current state of each attribute as well as the ability to enable or
disable the attributes. In the state column, if an attribute is:
• Enabled then the circle will be a green color AND in the Action column the can be clicked to disable the
attribute
• Disabled then the circle will be a gray or red color AND in the Action column the can be clicked to
enable the attribute
1295 Bandana Blvd N, St. Paul, MN 55108 [email protected] US: 1-888-624-4671 INTL: 1-651-204-9102
© 2017 Nagios Enterprises, LLC. All rights reserved. Nagios, the Nagios logo, and Nagios graphics are the servicemarks, trademarks, or registered trademarks owned by Nagios Enterprises. All other servicemarks and trademarks are the property of their respective owner.
www.nagios.comPage 9 / 20
Updated – April, 2018
Nagios XI
The Industry Standard In Infrastructure Monitoring
Host And Service Details Overview

The Commands table allows you to:
• Add comment
◦ Create a comment that will appear on the Overview tab.
• Schedule downtime
◦ Define scheduled downtime for the host.
• Schedule downtime for all services on this host
◦ Define scheduled downtime for all the services on the host (saves having to schedule each service
individually).
• Forced immediate check for host and all services
◦ Force Nagios XI to immediately perform the host check and all service checks.
• Submit passive check result
◦ Allows you to manually define the state of the host, most useful with Passive hosts. If this is an active
host then the check result you submit will be overwritten by the check results of the next host check
interval.
• Send custom notification
◦ This will send a custom notification to all the contacts configured to receive notifications for this host.
• Delay next notification
◦ This allows you to delay the next problem notification that is sent out for the specified host. The
notification delay will be disregarded if the host changes state before the next notification is scheduled
to be sent out. This has no effect if the host is currently in an UP state.
Under More Options there is also a link View in Nagios Core for those more familiar with the Nagios Core
layout.
1295 Bandana Blvd N, St. Paul, MN 55108 [email protected] US: 1-888-624-4671 INTL: 1-651-204-9102
© 2017 Nagios Enterprises, LLC. All rights reserved. Nagios, the Nagios logo, and Nagios graphics are the servicemarks, trademarks, or registered trademarks owned by Nagios Enterprises. All other servicemarks and trademarks are the property of their respective owner.
www.nagios.comPage 10 / 20
Updated – April, 2018
Nagios XI
The Industry Standard In Infrastructure Monitoring
Host And Service Details Overview

Configure
For standard hosts you have the ability to re-configure or
delete the host.
If the host utilizes any advanced features then you may not
be able to use either option, you will receive an error. You will
need to use Core Configuration Manager (CCM) to make any
changes instead.
A host object cannot be deleted until all of the services
assigned to it have also been deleted.
When using re-configure the options available are similar to a
configuration wizard.
1295 Bandana Blvd N, St. Paul, MN 55108 [email protected] US: 1-888-624-4671 INTL: 1-651-204-9102
© 2017 Nagios Enterprises, LLC. All rights reserved. Nagios, the Nagios logo, and Nagios graphics are the servicemarks, trademarks, or registered trademarks owned by Nagios Enterprises. All other servicemarks and trademarks are the property of their respective owner.
www.nagios.comPage 11 / 20
Updated – April, 2018
Nagios XI
The Industry Standard In Infrastructure Monitoring
Host And Service Details Overview

Capacity Planning
Capacity planning allows you to predict
future trends based on the existing
performance data.
Use the gear icon on the far right to change
options such as Time Period and
Extrapolation Method.
Capacity planning is only available for host
and services that have performance graphs.
Each capacity planning graph is one data source from the performance graphs. For example a host ping
check by default has rta / pl / rtmax /rtmin. In this example there will be four capacity planning graphs for the
host object.
1295 Bandana Blvd N, St. Paul, MN 55108 [email protected] US: 1-888-624-4671 INTL: 1-651-204-9102
© 2017 Nagios Enterprises, LLC. All rights reserved. Nagios, the Nagios logo, and Nagios graphics are the servicemarks, trademarks, or registered trademarks owned by Nagios Enterprises. All other servicemarks and trademarks are the property of their respective owner.
www.nagios.comPage 12 / 20
Updated – April, 2018
Nagios XI
The Industry Standard In Infrastructure Monitoring
Host And Service Details Overview

There will be capacity planning graphs created for the first five data sources available (host and service
objects). There is a link at the bottom See the rest of the capacity planning graphs that will allow you to
browse all the capacity planning graphs available.
Free Variables
Free variables are an advanced feature of Nagios Core that
allows custom directives with values to be stored in a host
object.
If your service has any free variables defined then they will
appear here in a table for your reference.
Network Traffic Analysis
This tab connects to Nagios Network Analyzer to provide
traffic reporting.
To see the more information about a particular host,
select a link from the Host column to access the Host
Status Detail page. You can also access the Service
Status Detail page by selecting the service status icon.
1295 Bandana Blvd N, St. Paul, MN 55108 [email protected] US: 1-888-624-4671 INTL: 1-651-204-9102
© 2017 Nagios Enterprises, LLC. All rights reserved. Nagios, the Nagios logo, and Nagios graphics are the servicemarks, trademarks, or registered trademarks owned by Nagios Enterprises. All other servicemarks and trademarks are the property of their respective owner.
www.nagios.comPage 13 / 20
Updated – April, 2018
Nagios XI
The Industry Standard In Infrastructure Monitoring
Host And Service Details Overview
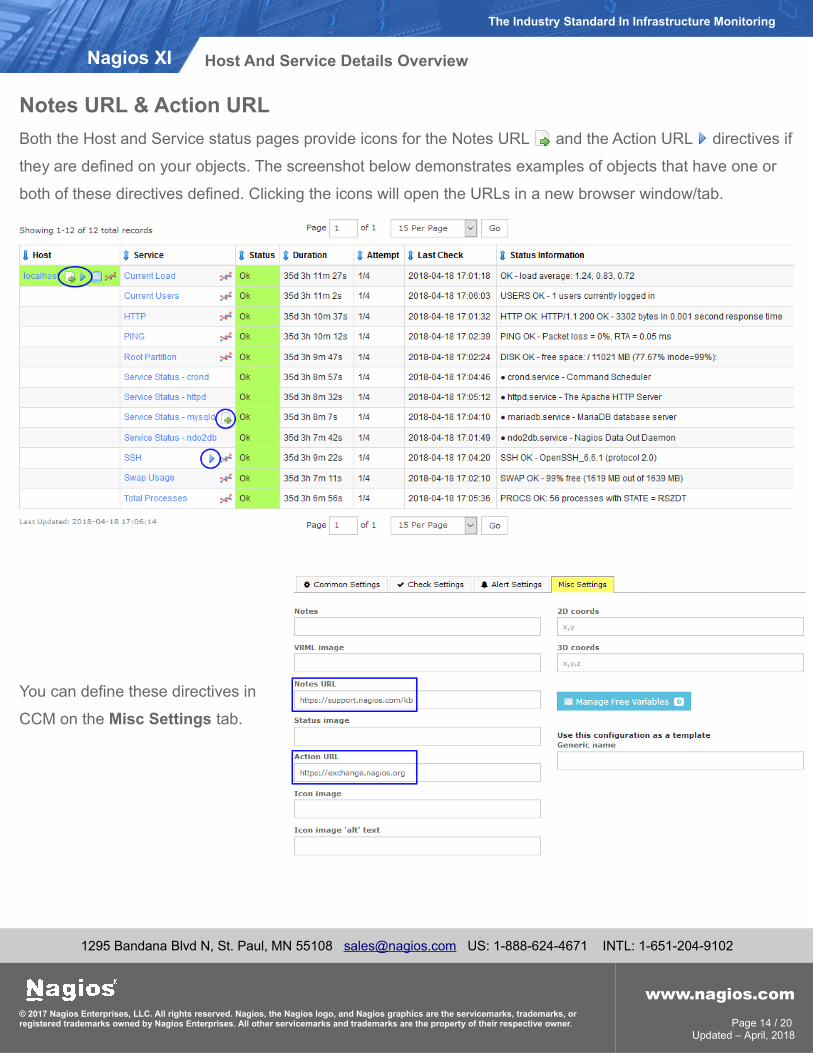
Notes URL & Action URL
Both the Host and Service status pages provide icons for the Notes URL and the Action URL directives if
they are defined on your objects. The screenshot below demonstrates examples of objects that have one or
both of these directives defined. Clicking the icons will open the URLs in a new browser window/tab.
You can define these directives in
CCM on the Misc Settings tab.
1295 Bandana Blvd N, St. Paul, MN 55108 [email protected] US: 1-888-624-4671 INTL: 1-651-204-9102
© 2017 Nagios Enterprises, LLC. All rights reserved. Nagios, the Nagios logo, and Nagios graphics are the servicemarks, trademarks, or registered trademarks owned by Nagios Enterprises. All other servicemarks and trademarks are the property of their respective owner.
www.nagios.comPage 14 / 20
Updated – April, 2018
Nagios XI
The Industry Standard In Infrastructure Monitoring
Host And Service Details Overview
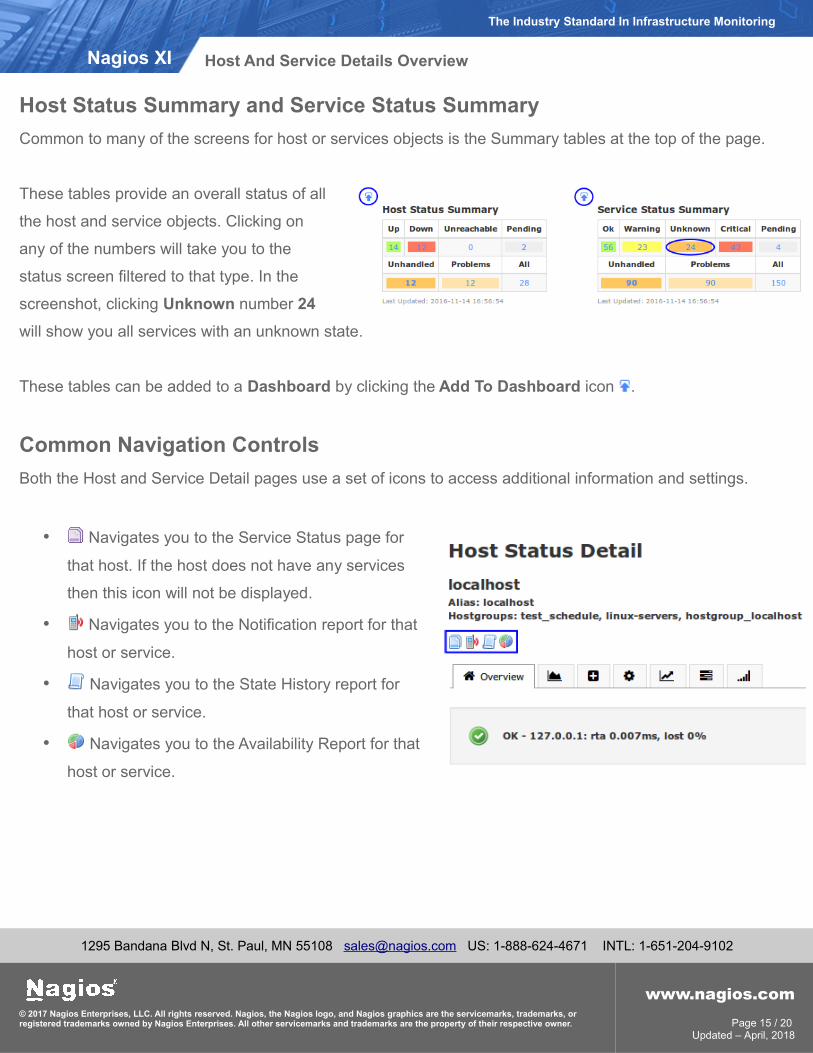
Host Status Summary and Service Status Summary
Common to many of the screens for host or services objects is the Summary tables at the top of the page.
These tables provide an overall status of all
the host and service objects. Clicking on
any of the numbers will take you to the
status screen filtered to that type. In the
screenshot, clicking Unknown number 24
will show you all services with an unknown state.
These tables can be added to a Dashboard by clicking the Add To Dashboard icon .
Common Navigation Controls
Both the Host and Service Detail pages use a set of icons to access additional information and settings.
• Navigates you to the Service Status page for
that host. If the host does not have any services
then this icon will not be displayed.
• Navigates you to the Notification report for that
host or service.
• Navigates you to the State History report for
that host or service.
• Navigates you to the Availability Report for that
host or service.
1295 Bandana Blvd N, St. Paul, MN 55108 [email protected] US: 1-888-624-4671 INTL: 1-651-204-9102
© 2017 Nagios Enterprises, LLC. All rights reserved. Nagios, the Nagios logo, and Nagios graphics are the servicemarks, trademarks, or registered trademarks owned by Nagios Enterprises. All other servicemarks and trademarks are the property of their respective owner.
www.nagios.comPage 15 / 20
Updated – April, 2018
Nagios XI
The Industry Standard In Infrastructure Monitoring
Host And Service Details Overview

Hostgroup Summary and Servicegroup Summary
Host groups and Service groups created in CCM will be presented in a summary table. The Hosts and
Services columns provide a breakdown of the objects, clicking the numbers will take you to the status screen
filtered to that type.
There are two icons that provide the following functionality:
• Navigates you to the Service Status page for that host group or service group.
• Navigates you to the available Commands that can be performed against the members, such as:
◦ Schedule Downtime For All Hosts or Services
◦ Enable / Disable Notifications For All Hosts
◦ Enable / Disable Notifications For All Services
◦ Enable / Disable Active Checks Of All Services
1295 Bandana Blvd N, St. Paul, MN 55108 [email protected] US: 1-888-624-4671 INTL: 1-651-204-9102
© 2017 Nagios Enterprises, LLC. All rights reserved. Nagios, the Nagios logo, and Nagios graphics are the servicemarks, trademarks, or registered trademarks owned by Nagios Enterprises. All other servicemarks and trademarks are the property of their respective owner.
www.nagios.comPage 16 / 20
Updated – April, 2018
Nagios XI
The Industry Standard In Infrastructure Monitoring
Host And Service Details Overview

Hostgroup Summary and Servicegroup Overview
Host groups and Service groups created in CCM will be presented in a summary table per group.
The Services column provides a breakdown of the objects, clicking the numbers will take you to the status
screen filtered to that type.
The icons provide the same functionality as described in the Summary section.
1295 Bandana Blvd N, St. Paul, MN 55108 [email protected] US: 1-888-624-4671 INTL: 1-651-204-9102
© 2017 Nagios Enterprises, LLC. All rights reserved. Nagios, the Nagios logo, and Nagios graphics are the servicemarks, trademarks, or registered trademarks owned by Nagios Enterprises. All other servicemarks and trademarks are the property of their respective owner.
www.nagios.comPage 17 / 20
Updated – April, 2018
Nagios XI
The Industry Standard In Infrastructure Monitoring
Host And Service Details Overview

Hostgroup Grid and Servicegroup Grid
Host groups and Service groups created in CCM will be presented in a summary table per group.
The Services column shows all of the objects in that hostgroup or servicegroup, clicking a host or service will
take you to the status screen for that object.
The icons provide the same functionality as described in the Summary section.
Common Navigation Controls
Each Summary page also has an additional set of navigation control icons
to quickly access different detail views for the service or host group.
• Navigates you to the Service Status page
• Navigates you to the Hostgroup or Servicegroup Summary page
• Navigates you to the Hostgroup or Servicegroup Overview page
• Navigates you to the Hostgroup or Servicegroup Grid page
1295 Bandana Blvd N, St. Paul, MN 55108 [email protected] US: 1-888-624-4671 INTL: 1-651-204-9102
© 2017 Nagios Enterprises, LLC. All rights reserved. Nagios, the Nagios logo, and Nagios graphics are the servicemarks, trademarks, or registered trademarks owned by Nagios Enterprises. All other servicemarks and trademarks are the property of their respective owner.
www.nagios.comPage 18 / 20
Updated – April, 2018
Nagios XI
The Industry Standard In Infrastructure Monitoring
Host And Service Details Overview

BPI
The BPI menu option navigates you to the Nagios Business Process Intelligence component. Please refer to
the Using Nagios BPI documentation for full details.
Metrics
The Metrics menu option navigates you to the Metrics component. This component allows you to view
common metrics from all available services (with valid data).
Metrics Summary
On the screenshot above you can see the Summary tab is being displayed (the default). At the top of the
screen are drop down lists so you can filter the summary results, in this case the Disk Usage metric is shown.
The Metrics component will only display services in the list that it can corrected detect as being a disk usage
based service, hence why some services will not be displayed in this list.
1295 Bandana Blvd N, St. Paul, MN 55108 [email protected] US: 1-888-624-4671 INTL: 1-651-204-9102
© 2017 Nagios Enterprises, LLC. All rights reserved. Nagios, the Nagios logo, and Nagios graphics are the servicemarks, trademarks, or registered trademarks owned by Nagios Enterprises. All other servicemarks and trademarks are the property of their respective owner.
www.nagios.comPage 19 / 20
Updated – April, 2018
Nagios XI
The Industry Standard In Infrastructure Monitoring
Host And Service Details Overview

Metrics Graphs
The Graphs tab will display the services in a
graph format. In the following screenshot you
can see that a timeframe of Last 24 Hours looks
static due to the nature of disk usage however
the screenshot gives you an example of what to
expect.
Metrics Gauges
The Gauges tab will display the services as
dashlets that show the metric along a horizontal
line. The current state of the service will be the
background color of the line and you can see
that the warning and critical thresholds are
indicated with a vertical line.
Any one of these metrics can be added to a Dashboard by clicking the Add To Dashboard icon .
Finishing Up
This completes the overview for host and service details in Nagios XI.
If you have additional questions or other support related questions, please visit us at our Nagios Support
Forums:
https://support.nagios.com/forum
The Nagios Support Knowledgebase is also a great support resource:
https://support.nagios.com/kb
1295 Bandana Blvd N, St. Paul, MN 55108 [email protected] US: 1-888-624-4671 INTL: 1-651-204-9102
© 2017 Nagios Enterprises, LLC. All rights reserved. Nagios, the Nagios logo, and Nagios graphics are the servicemarks, trademarks, or registered trademarks owned by Nagios Enterprises. All other servicemarks and trademarks are the property of their respective owner.
www.nagios.comPage 20 / 20
Updated – April, 2018
Nagios XI
The Industry Standard In Infrastructure Monitoring
Host And Service Details Overview