nagios® version 2.x documentation last updated: 11-27-2006...
TRANSCRIPT

Nagios® Version 2.xDocumentation
Copyright © 1999-2006 Ethan Galstadwww.nagios.org
Last Updated: 11-27-2006
[ Table of Contents ]
Nagios and the Nagios logo are registered trademarks of Ethan Galstad. All other trademarks,servicemarks, registered trademarks, and registered servicemarks mentioned herein may be theproperty of their respective owner(s). The information contained herein is provided AS IS with NOWARRANTY OF ANY KIND, INCLUDING THE WARRANTY OF DESIGN, MERCHANTABILITY,AND FITNESS FOR A PARTICULAR PURPOSE.
1

Version 2.0 Documentation
Table of Contents
About
What is Nagios?System requirementsLicensingDownloading the latest versionOther monitoring utilities
Release Notes
What’s new in this versionChange log
Support
Self-service and commercial support
Getting Started
Advice for beginners
Installing Nagios
Compiling and installing NagiosSetting up the web interface
Configuring Nagios
Configuration overviewMain configuration file optionsObject configuration file optionsCGI configuration file optionsConfiguring authorization for the CGIs
Running Nagios
Verifying the configurationStarting NagiosStopping and restarting Nagios
Nagios Plugins
Standard pluginsWriting your own plugins
2

Nagios Addons
NRPE - Daemon and plugin for executing plugins on remote hostsNSCA- Daemon and client program for sending passive check results across the network
Theory Of Operation
Determing status and reachability of network hostsNetwork outagesNotificationsPlugin theoryService check schedulingState typesTime periods
Advanced Topics
Event handlersExternal commandsIndirect host and service checksPassive service checksVolatile servicesService and host result freshness checksDistributed monitoringRedundant and failover monitoringDetection and handling of state flappingService check parallelizationNotification escalationsMonitoring service and host clustersHost and service dependenciesState stalkingPerformance dataScheduled host and service downtimeUsing the embedded Perl interpreterAdaptive monitoringObject inheritanceTime-saving tips for object definitions
Integration With Other Software
SNMP TrapsTCP Wrappers
Miscellaneous
Securing NagiosTuning Nagios for maximum performanceUsing the nagiostats utilityUsing macros in commandsInformation on the CGIsCustom CGI headers and footers
3

About Nagios®
What Is This?
Nagios® is a system and network monitoring application. It watches hosts and services that you specify,alerting you when things go bad and when they get better.
Nagios was originally designed to run under Linux, although it should work under most other unices as well.
Some of the many features of Nagios® include:
Monitoring of network services (SMTP, POP3, HTTP, NNTP, PING, etc.)
Monitoring of host resources (processor load, disk usage, etc.)
Simple plugin design that allows users to easily develop their own service checks
Parallelized service checks
Ability to define network host hierarchy using "parent" hosts, allowing detection of and distinctionbetween hosts that are down and those that are unreachable
Contact notifications when service or host problems occur and get resolved (via email, pager, oruser-defined method)
Ability to define event handlers to be run during service or host events for proactive problemresolution
Automatic log file rotation
Support for implementing redundant monitoring hosts
Optional web interface for viewing current network status, notification and problem history, logfile, etc.
System Requirements
The only requirement of running Nagios is a machine running Linux (or UNIX variant) and a C compiler. Youwill probably also want to have TCP/IP configured, as most service checks will be performed over the network.
You are not required to use the CGIs included with Nagios. However, if you do decide to use them, youwill need to have the following software installed...
1. A web server (preferrably Apache)
2. Thomas Boutell’s gd library version 1.6.3 or higher (required by the statusmap and trends CGIs)
Licensing
Nagios® is licensed under the terms of the GNU General Public License Version 2 as published by the Free Software Foundation. This gives you legal permission to copy, distribute and/or modify Nagiosunder certain conditions. Read the ’LICENSE’ file in the Nagios distribution or read the online version ofthe license for more details.
Nagios® is provided AS IS with NO WARRANTY OF ANY KIND, INCLUDING THE WARRANTY OFDESIGN, MERCHANTABILITY, AND FITNESS FOR A PARTICULAR PURPOSE.
Acknowledgements
4

Several people have contributed to Nagios by either reporting bugs, suggesting improvements, writingplugins, etc. A list of some of the many contributors to the development of Nagios can be found at http://www.nagios.org.
Downloading The Latest Version
You can check for new versions of Nagios at http://www.nagios.org.
Nagios and the Nagios logo are trademarks of Ethan Galstad. All other trademarks, servicemarks,registered trademarks, and registered servicemarks may be the property of their respective owner(s).
5

What’s New in Version 2.0
Important: Make sure you read through the documentation before sending a question to the mailing lists.
Change Log
The change log for Nagios can be found online at http://www.nagios.org/development/changelog.phpor in the Changelog file in the root directory of the source code distribution.
Known Issues
There is a known issue that can affect Nagios 2.0 on FreeBSD systems. Hopefully this problem can befixed in a 2.x release...
1. FreeBSD and threads. On FreeBSD there’s a native user-level implementation of threads called’pthread’ and there’s also an optional ports collection ’linuxthreads’ that uses kernel hooks. Somefolks from Yahoo! have reported that using the pthread library causes Nagios to pause under heavyI/O load, causing some service check results to be lost. Switching to linuxthreads seems to help thisproblem, but not fix it. The lock happens in liblthread’s __pthread_acquire() - it can’t ever acquirethe spinlock. It happens when the main thread forks to execute an active check. On the second forkto create the grandchild, the grandchild is created by fork, but never returns from liblthread’s forkwrapper, because it’s stuck in __pthread_acquire(). Maybe some FreeBSD users can help out withthis problem.
Changes and New Features
1. Macro Changes - Macros have undergone a major overhaul. You will have to update most of yourcommand definitions to match the new macros. Most macros are now available as environmentvariables. Also, "on-demand" host and service macros have been added. See the documentation on macros for more information.
2. Hostgroup Changes
Hostgroup escalations removed - Hostgroup escalations have been removed. Theirfunctionality can be duplicated by using the hostgroup_name directive in hostgroup definitions.
Member directive changes - Hostgroup definitions can now contain multiple membersdirectives, which should make editing the config files easier when you have a lot of memberhosts. Alternatively, you may use the hostgroups directive in host definitions to specify whathostgroup(s) a particular host is a member of.
Contact group changes - The contact_groups directive has been moved from hostgroupdefinitions to host definitions. This was done in order to maintain consistency with the wayservice contacts are specified. Make sure to update your config files!
Authorization changes - Authorization for access to hostgroups in the CGIs has been changed.You must now be authorized for all hosts that are members of the hostgroup in order to beauthorized for the hostgroup.
3. Host Changes
Host freshness checking - Freshness checking has been added for host checks. This iscontrolled by the check_host_freshness option, along with the check_freshness directive in host definitions.
OCHP Command - Host checks can now be obsessed over, just as services can be. The OCHP command is run for all hosts that have the obsess_over_host directive enabled in their host definition.
4. Host Check Changes
Regularly scheduled checks - You can now schedule regular checks of hosts by using the
6

check_interval directive in host definitions. NOTE: Listen up! You should use regularlyscheduled host checks rather sparingly. They are not necessary for normal operation (on-demand checks
are already performed when necessary) and can negatively affect performance if usedimproperly. You’ve been warned.
Passive host checks - Passive host checks are now supported if you’ve enabled them with the accept_passive_host_checks option in the main config file and the accept_passive_host_checksdirective in the host definition. Passive host checks can make setting up redundant or distributed monitoring environments easier. NOTE: There are some problems with passivehost checks that you should be aware of - read more about them here.
5. Retention Changes
Retention of scheduling information - Host and service check scheduling information (nextcheck times) can now be retained across program restarts using the use_retained_scheduling_info directive.
Smarter retention - Values of various host and service directives that can be retained acrossprogram restarts are now only retained if they are changed during runtime by an external command. This should make things less confusing to people when they try and modify hostand service directive values and then restart Nagios, expecting to see some changes.
More stuff retained - More information is now retained across program restarts, including flap detection history. Hoorah!
6. Extended Info Changes
New location - Extended host info and service info definitions are now stored in object configfiles along with host definitions, etc. As a result, extended info definitions are now parsed andvalidated by the Nagios daemon before startup.
New directives - Extended host info and service info definitions now have two new directives: notes and action_url.
7. Embedded Perl Changes
p1.pl location - You can now specify the location of the embedded Perl "helper" file (p1.pl)using the p1_file directive.
8. Notification Changes
Flapping notifications - Notifications are now sent out when flapping starts and stops for hostsand services. This feature can be controlled using the f option in the notification_options for contacts, hosts and services.
Better logic - Notification logic has been improved a bit. This should prevent recoverynotifications getting sent out when no problem notification was sent out to begin with.
Service notifications - Before service notifications are sent out, notification dependencies forthe host are now checked. If host notifications are not deemed to be viable, notifications for theservice will not be sent out either.
Escalation options - Time period and state options have been added to host and serviceescalations. This gives you more control in determining when escalations can be used. Moreinformation on escalations can be found here.
9. Service Groups Added - Service groups have now been added. They allow you to group servicestogether for display purposes in the CGIs and can be referenced in service dependency and serviceescalation definitions to make configuration a bit easier.
10. Triggered Downtime Added - Support for what’s called "triggered" downtime has been added forhost and service downtime. Triggered downtime allows you to define downtime that should start atthe same time another downtime starts (very useful for scheduling downtime for child hosts whenthe parent host is scheduled for flexible downtime). More information on triggered downtime canbe found here.
11. New Stats Utility - A new utility called ’nagiostats’ is now included in the Nagios distribution. Its acommand-line utility that allows you to view current statistics for a running Nagios process. It canalso produce data compatible with MRTG, so you can graph statistical information. Moreinformation on how to use the utility can be found here.
7

12. Adaptive Monitoring - You can now change certain attributes relating to host and service checks(check command, check interval, max check attempts etc.) during runtime by submitting the appropriateexternal commands. This kind of adaptive monitoring will probably not be of much use to the majorityof users out there, but it does provide a way for doing some neat stuff. More information on adaptivemonitoring can be found here.
13. Performance Data Changes - The methods for processing performance data have changed slightly.You can now process performance data by executing external commands and/or writing to files withoutrecompiling Nagios. Read the documentation on performance data for more information.
14. Native DB Support Dropped - Native support for storing various types of data (status, retention,comment, downtime, etc.) in MySQL and PostgreSQL has been dropped. Stop whining. I expectsomeone will develop an alternative using the new event broker sometime in the near future. Besides,DB support was not well implemented and dropping native DB support will make things easier fornewbies to understand (one less thing to figure out).
15. Event Broker API - An API has been created to allow individual developers to create addons thatintegrate with the core Nagios daemon. Documentation on the event broker API will be created as the2.x code matures and will be available on the Nagios website.
16. Misc Changes
All commands can contain arguments - All command types (host checks, notifications,performance data processors, event handlers, etc.) can contain arguments (seperated from thecommand name by ! characters). Arguments are substituted in the command line using $ARGx macros.
Config directory recursion - Nagios now recursively processes all config files found insubdirectories of the directories specified by the cfg_dir directive.
Old config file support dropped - Support for older (non-template) style object and extendedinfo config files has been dropped.
Faster searches - Objects are now stored in a chained hash in order to speed searches. Thisshould greatly improve the performance of the CGIs.
Worker threads - A few worker threads have been added in order to artificially buffer data forthe external command file and the internal pipe used to process service check results. Thisshould substantially increase performance in larger setups.
Logging changes - Initial host and service states are now logged a bit differently. Also, theinitial states of all hosts and services are logged immediately after all log rotations. This shouldhelp with all those "undetermined time" problems in the availability and trends CGIs.
Cached object config file - An object cache file is now created by Nagios at startup. It shouldhelp speed up the CGIs a bit and allow you to edit you object config files while Nagios isrunning without affecting the CGI output.
Initial check limits - You can now specify timeframes in which the initial checks of all hostsand services should be performed after Nagios start. These timeframes are controlled by the max_host_check_spread and max_service_check_spread variables.
"Sticky" acknowledgements - You can now designate host and service acknowledgements asbeing "sticky" or not. Sticky acknowledgements suppress notifications until a host or servicefully recovers to an UP or OK state. Non-sticky acknowledgements only suppress notificationsuntil a host or service changes state.
Changed in checking clusters - The way you monitor service and host "clusters" has nowchanged and is more reliable than before. This is due to the incorporation of on-demand macrosand a new plugin (check_cluster2). Read more about checking clusters here.
Regular expression matching - Regular expression matching of various object directives can beenabled using the use_regexp_matching and use_true_regexp_matching variables. Informationon how and where regular expression matching can be used can be found in the template tipsand tricks documentation.
Service pseudo-states - Support for some redundant service pseudo-states have been removedfrom the status CGI. This will affect any hardcoded URLs which use the servicestatustypes=Xparameter for the CGI. Check include/statusdata.h for the new list of service states that you can
8

use.
Freshness check changes - The freshness check logic has been changed slightly. Freshnesschecks will not occur if the current time is not valid for the host or service check_timeperiod.Also, freshness checks will no longer occur if both the host or service check_interval and freshness_threshold variables are set to zero (0).
9

Advice for Beginners
Congrats on choosing to try Nagios! Nagios is quite powerful and flexible, but unfortunately its not veryfriendly to newbies. Why? Because it takes a lot of work to get it installed and configured properly. Thatbeing said, if you stick with it and manage to get it up and running, you’ll never want to be without it. :-)Here are some very important things to keep in mind for those of you who are first-time users of Nagios:
1. Relax - its going to take some time. Don’t expect to be able to compile Nagios and start it up rightoff the bat. Its not that easy. In fact, its pretty difficult. If you don’t want to spend time learning howthings work and getting things running smoothly, don’t bother using this software. Instead, paysomeone to monitor your network for you or hire someone to install Nagios for you. :-)
2. Read the documentation. Nagios is difficult enough to configure when you’ve got a good grasp ofwhat’s going on, and nearly impossible if you don’t. Do yourself a favor and read before blindlyattempting to install and run Nagios. If you’re the type who doesn’t want to take the time to readthe documentation, you’ll probably find that others won’t find the time to help you out when youhave problems. RTFM.
3. Use the sample config files. Sample configuration files are provided with Nagios. Look at them,modify them for your particular setup and test them! The sample files are just that - samples.There’s a very good chance that they won’t work for you without modifications. Sample config filescan be found in the sample-config/ subdirectory of the Nagios distribution.
4. Seek the help of others. If you’ve read the documentation, reviewed the sample config files, and arestill having problems, try sending a descriptive email message describing your problems to the nagios-users mailing list. Due to the amount of work that I have to do for this project, I am unable toanswer most of the questions that get sent directly to me, so your best source of help is going to bethe mailing list. If you’ve done some background reading and you provide a good problemdescription, odds are that someone will give you some pointers on getting things working properly.
10

Installing Nagios
Important: Installing and configuring Nagios is rather involved. You can’t just compile the binaries, runthe program and sit back. There’s a lot to setup before you can actually start monitoring anything. Relax,take your time and read all the documentation - you’re going to need it. Okay, let’s get started...
Become Root
You’ll need to have root access to install Nagios as described in this documentation, as you’ll be creatingusers and group, modifying your web server config files, etc. Either login as root before you begin or usethe su command to change to the root user from another account.
Getting The Latest Version
You can download the latest version of Nagios from http://www.nagios.org/download.
Unpacking The Distribution
To unpack the Nagios distribution, use the following command:
tar xzf nagios-version.tar.gz
When you have finished executing these commands, you should find a nagios-version directory that hasbeen created in your current directory. Inside that directory you will find all the files that comprise thecore Nagios distribution.
Create Nagios User/Group
You’re probably going to want to run Nagios under a normal user account, so add a new user (andgroup) to your system with the following command (this will vary depending on what OS you’re running):
adduser nagios
Create Installation Directory
Create the base directory where you would like to install Nagios as follows...
mkdir /usr/local/nagios
Change the owner of the base installtion directory to be the Nagios user and group you added earlier as follows:
chown nagios.nagios /usr/local/nagios
Identify Web Server User
You’re probably going to want to issue external commands (like acknowledgements and scheduleddowntime) from the web interface. To do so, you need to identify the user your web server runs as(typically apache, although this may differ on your system). This setting is found in your web serverconfiguration file. The following command can be used to quickly determine what user Apache isrunning as (paths may differ on your system):
11

grep "^User" /etc/httpd/conf/httpd.conf
Add Command File Group
Next we’re going to create a new group whose members include the user your web server is running asand the user Nagios is running as. Let’s say we call this new group ’nagcmd’ (you can name itdifferently if you wish). On RedHat Linux you can use the following command to add a new group(other systems may differ):
/usr/sbin/groupadd nagcmd
Next, add the users that your web server and Nagios run as to the newly created group with thefollowing commands (I’ll assume apache and nagios are the respective users):
/usr/sbin/usermod -G nagcmd apache/usr/sbin/usermod -G nagcmd nagios
Run the Configure Script
Run the configure script to initialize variables and create a Makefile as follows...(the last two options: --with-command-xxx are optional, but needed if you want to issue external commands)
./configure --prefix=prefix --with-cgiurl=cgiurl --with-htmurl=htmurl --with-nagios-user=someuser --with-nagios-group=somegroup --with-command-group=cmdgroup
Replace prefix with the installation directory that you created in the step above (default is /usr/local/nagios)
Replace cgiurl with the actual url you will be using to access the CGIs (default is /nagios/cgi-bin). DoNOT append a slash at the end of the url.
Replace htmurl with the actual url you will be using to access the HTML for the main interface anddocumentation (default is /nagios/)
Replace someuser with the name of a user on your system that will be used for setting permissionson the installed files (default is nagios)
Replace somegroup with the name of a group on your system that will be used for settingpermissions on the installed files (default is nagios)
Replace cmdgroup with the name of the group running the web server (default is nagios, in theexample above it was nagcmd). This will allow group members (i.e. your web server) to be able tosubmit external commands to Nagios.
Compile Binaries
Compile Nagios and the CGIs with the following command:
make all
Installing The Binaries And HTML Files
Install the binaries and HTML files (documentation and main web page) with the following command:
make install
Installing An Init Script
If you wish, you can also install the sample init script to /etc/rc.d/init.d/nagios with the following command:
12

make install-init
You may have to edit the init script to make sense with your particular OS and Nagios installation byediting paths, etc.
Directory Structure And File Locations
Change to the root of your Nagios installation directory with the following command...
cd /usr/local/nagios
You should see five different subdirectories. A brief description of what each directory contains is givenin the table below.
Sub-Directory Contents
bin/ Nagios core program
etc/ Main, resource, object, and CGI configuration files should be put here
sbin/ CGIs
share/ HTML files (for web interface and online documentation)
var/ Empty directory for the log file, status file, retention file, etc.
var/archives Empty directory for the archived logs
var/rw Empty directory for the external command file
Installing The Plugins
In order for Nagios to be of any use to you, you’re going to have to download and install some plugins.Plugins are usually installed in the libexec/ directory of your Nagios installation (i.e. /usr/local/nagios/libexec). Plugins are scripts or binaries which perform all the service and host checks thatconstitute monitoring. You can grab the latest release of the plugins from the Nagios downloads page ordirectly from the SourceForge project page.
Setup The Web Interface
You’re probably going to want to use the web interface, so you’ll also have to read the instructions on setting up the web interface and configuring web authentication, etc. next.
Configuring Nagios
So now you have things compiled and installed, but you still haven’t configured Nagios or definedobjects (hosts, services, etc.) that should be monitored. Information on configuring Nagios and definingobjects can be found here. There’s a lot to configure, but don’t let it discourage you - its well worth it.
13

Setting Up The Web Interface
Notes
In these instructions I will assume that you are running the Apache web server on your machine. If youare using some other web server, you’ll have to make changes where appropriate. I am also assumingthat you used the /usr/local/nagios as the installation prefix.
Sample Configuration
A sample Apache config file snippet is created when you run the configure script - you can find thesample config file (named httpd.conf) in the sample-config/ subdirectory of the Nagios distribution. Youwill need to add the contents of this file to your Apache configuration files before you can access theNagios web interface. The instructions found below detail how to manually add the appropriateconfiguration entries to Apache.
Configure Aliases and Directory Options For The Web Interface
First you’ll need to create appropriate entries for the Nagios web interface (HTML and CGIs) in yourweb server config file. Add the following snippet to your web server configuration file (i.e. httpd.conf),changing it to match any directory differences on your system.
ScriptAlias /nagios/cgi-bin /usr/local/nagios/sbin
<Directory "/usr/local/nagios/sbin"> Options ExecCGI AllowOverride None Order allow,deny Allow from all AuthName "Nagios Access" AuthType Basic AuthUserFile /usr/local/nagios/etc/htpasswd.users Require valid-user</Directory>
Alias /nagios /usr/local/nagios/share
<Directory "/usr/local/nagios/share"> Options None AllowOverride None Order allow,deny Allow from all AuthName "Nagios Access" AuthType Basic AuthUserFile /usr/local/nagios/etc/htpasswd.users Require valid-user</Directory>
Note: The default Nagios installation expects to find the HTML files and CGIs at http://yourmachine/nagios/ and http://yourmachine/nagios/cgi-bin/, respectively. These locations canbe changed using the --with-htmurl and --with-cgiurl options in the configure script.
Important! If you are installing Nagios on a multi-user system, you may want use CGIWrap to provideadditional security between the CGIs and the external command file. If you decide to use CGIWrap, theScriptAlias you’ll end up using will most likely be different from that mentioned above. Moreinformation on doing this can be found here.
14

Restart The Web Server
Once you’ve finished editing the Apache configuration file, you’ll need to restart the web server with acommand like this...
/etc/rc.d/init.d/httpd restart
Configure Web Authentication
Once you have installed the web interface properly, you’ll need to specify who can access the Nagiosweb interface. Follow these instructions to do this.
Verify Your Changes
Don’t forget to check and see if the changes you made to Apache work. You should be able to point yourweb browser at http://yourmachine/nagios/ and get the web interface for Nagios. The CGIs may notdisplay any information, but this will be remedied once you configure everything and start Nagios.
15

Configuring Nagios
Configuration Overview
There are several different configuration files that you’re going to need to create or edit before you startmonitoring anything. They are described below...
Main Configuration File
The main configuration file (usually /usr/local/nagios/etc/nagios.cfg) contains a number of directives thataffect how Nagios operates. This config file is read by both the Nagios process and the CGIs. This is thefirst configuration file you’re going to want to create or edit.
Documentation for the main configuration file can be found here.
A sample main configuration file is generated automatically when you run the configure script beforecompiling the binaries. Look for it either in the distribution directory or the etc/ subdirectory of yourinstallation. When you install the sample config files using the make install-config command, a samplemain configuration file will be placed into your settings directory (usually /usr/local/nagios/etc). Thedefault name of the main configuration file is nagios.cfg.
Resource File(s)
Resource files can be used to store user-defined macros. Resource files can also contain otherinformation (like database connection settings), although this will depend on how you’ve compiledNagios. The main point of having resource files is to use them to store sensitive configurationinformation and not make them available to the CGIs.
You can specify one or more optional resource files by using the resource_file directive in the mainconfiguration file.
Object Definition Files
Object definition files are used to define hosts, services, hostgroups, contacts, contactgroups, commands,etc. This is where you define what things you want monitor and how you want to monitor them.
Documentation for the object definition files can be found here.
CGI Configuration File
The CGI configuration file (usually /usr/local/nagios/etc/cgi.cfg) contains a number of directives that affectthe operation of the CGIs.
Documentation for the CGI configuration file can be found here.
A sample CGI configuration file is generated automatically when you run the configure script beforecompiling the binaries. When you install the sample config files using the make install-configcommand, the CGI configuration file will be placed in the same directory as the main and host configfiles (usually /usr/local/nagios/etc). The default name of the CGI configuration file is cgi.cfg.
16

Main Configuration File Options
Notes
When creating and/or editing configuration files, keep the following in mind:
1. Lines that start with a ’#’ character are taken to be comments and are not processed
2. Variables names must begin at the start of the line - no white space is allowed before the name
3. Variable names are case-sensitive
Sample Configuration
A sample main configuration file is created in the base directory of the Nagios distribution when yourun the configure script. The default name of the main configuration file is nagios.cfg - its usually placedin the etc/ subdirectory of you Nagios installation (i.e. /usr/local/nagios/etc/).
Index
Log fileObject configuration fileObject configuration directoryObject cache fileResource fileTemp fileStatus fileAggregated status updates optionAggregated status data update intervalNagios userNagios groupNotifications optionService check execution optionPassive service check acceptance optionHost check execution optionPassive host check acceptance optionEvent handler optionLog rotation methodLog archive pathExternal command check optionExternal command check intervalExternal command fileComment fileDowntime fileLock fileState retention optionState retention fileAutomatic state retention update intervalUse retained program state optionUse retained scheduling info optionSyslog logging optionNotification logging optionService check retry logging optionHost retry logging optionEvent handler logging option
17

Initial state logging optionExternal command logging optionPassive check logging optionGlobal host event handlerGlobal service event handlerInter-check sleep timeService inter-check delay methodMaximum service check spreadService interleave factorMaximum concurrent service checksService reaper frequencyHost inter-check delay methodMaximum host check spreadTiming interval lengthAuto-rescheduling optionAuto-rescheduling intervalAuto-rescheduling windowAggressive host checking optionFlap detection optionLow service flap thresholdHigh service flap thresholdLow host flap thresholdHigh host flap thresholdSoft service dependencies optionService check timeoutHost check timeoutEvent handler timeoutNotification timeoutObsessive compulsive service processor timeoutObsessive compulsive host processor timeoutPerformance data processor command timeoutObsess over services optionObsessive compulsive service processor commandObsess over hosts optionObsessive compulsive host processor commandPerformance data processing optionHost performance data processing commandService performance data processing commandHost performance data fileService performance data fileHost performance data file templateService performance data file templateHost performance data file modeService performance data file modeHost performance data file processing intervalService performance data file processing intervalHost performance data file processing commandService performance data file processing commandOrphaned service check optionService freshness checking optionService freshness check intervalHost freshness checking optionHost freshness check intervalDate format
18

Illegal object name charactersIllegal macro output charactersRegular expression matching optionTrue regular expression matching optionAdministrator email addressAdministrator pager
Log File
Format: log_file=<file_name>
Example: log_file=/usr/local/nagios/var/nagios.log
This variable specifies where Nagios should create its main log file. This should be the first variable thatyou define in your configuration file, as Nagios will try to write errors that it finds in the rest of yourconfiguration data to this file. If you have log rotation enabled, this file will automatically be rotatedevery hour, day, week, or month.
Object Configuration File
Format: cfg_file=<file_name>
Example:cfg_file=/usr/local/nagios/etc/hosts.cfgcfg_file=/usr/local/nagios/etc/services.cfgcfg_file=/usr/local/nagios/etc/commands.cfg
This directive is used to specify an object configuration file containing object definitions that Nagiosshould use for monitoring. Object configuration files contain definitions for hosts, host groups, contacts,contact groups, services, commands, etc. You can seperate your configuration information into severalfiles and specify multiple cfg_file= statements to have each of them processed.
Object Configuration Directory
Format: cfg_dir=<directory_name>
Example:cfg_dir=/usr/local/nagios/etc/commandscfg_dir=/usr/local/nagios/etc/servicescfg_dir=/usr/local/nagios/etc/hosts
This directive is used to specify a directory which contains object configuration files that Nagios shoulduse for monitoring. All files in the directory with a .cfg extension are processed as object config files.Additionally, Nagios will recursively process all config files in subdirectories of the directory youspecify here. You can seperate your configuration files into different directories and specify multiple cfg_dir= statements to have all config files in each directory processed.
Object Cache File
Format: object_cache_file=<file_name>
Example: object_cache_file_file=/usr/local/nagios/var/objects.cache
19

This directive is used to specify a file in which a cached copy of object definitions should be stored. Thecache file is (re)created every time Nagios is (re)started and is used by the CGIs. It is intended to speedup config file caching in the CGIs and allow you to edit the source object config files while Nagios isrunning without affecting the output displayed in the CGIs.
Resource File
Format: resource_file=<file_name>
Example: resource_file=/usr/local/nagios/etc/resource.cfg
This is used to specify an optional resource file that can contain $USERn$ macro definitions. $USERn$macros are useful for storing usernames, passwords, and items commonly used in command definitions(like directory paths). The CGIs will not attempt to read resource files, so you can set restrictivepermissions (600 or 660) on them to protect sensitive information. You can include multiple resourcefiles by adding multiple resource_file statements to the main config file - Nagios will process them all.See the sample resource.cfg file in the base of the Nagios directory for an example of how to define$USERn$ macros.
Temp File
Format: temp_file=<file_name>
Example: temp_file=/usr/local/nagios/var/nagios.tmp
This is a temporary file that Nagios periodically creates to use when updating comment data, statusdata, etc. The file is deleted when it is no longer needed.
Status File
Format: status_file=<file_name>
Example: status_file=/usr/local/nagios/var/status.dat
This is the file that Nagios uses to store the current status of all monitored services. The status of allhosts associated with the service you monitor are also recorded here. This file is used by the CGIs so thatcurrent monitoring status can be reported via a web interface. The CGIs must have read access to this filein order to function properly. This file is deleted every time Nagios stops and recreated when it starts.
Aggregated Status Updates Option
Format: aggregate_status_updates=<0/1>
Example: aggregate_status_updates=1
This option determines whether or not Nagios will aggregate updates of host, service, and programstatus data. If you do not enable this option, status data is updated every time a host or service checksoccurs. This can result in high CPU loads and file I/O if you are monitoring a lot of services. If you wantNagios to only update status data (in the status file) every few seconds (as determined by the status_update_interval option), enable this option. If you want immediate updates, disable it. I would
20

highly recommend using aggregated updates (even at short intervals) unless you have good reason notto. Values are as follows:
0 = Disable aggregated updates
1 = Enabled aggregated updates (default)
Aggregated Status Update Interval
Format: status_update_interval=<seconds>
Example: status_update_interval=15
This setting determines how often (in seconds) that Nagios will update status data in the status file. Theminimum update interval is five seconds. If you have disabled aggregated status updates (with the aggregate_status_updates option), this option has no effect.
Nagios User
Format: nagios_user=<username/UID>
Example: nagios_user=nagios
This is used to set the effective user that the Nagios process should run as. After initial program startupand before starting to monitor anything, Nagios will drop its effective privileges and run as this user.You may specify either a username or a UID.
Nagios Group
Format: nagios_group=<groupname/GID>
Example: nagios_group=nagios
This is used to set the effective group that the Nagios process should run as. After initial programstartup and before starting to monitor anything, Nagios will drop its effective privileges and run as thisgroup. You may specify either a groupname or a GID.
Notifications Option
Format: enable_notifications=<0/1>
Example: enable_notifications=1
This option determines whether or not Nagios will send out notifications when it initially (re)starts. Ifthis option is disabled, Nagios will not send out notifications for any host or service. Note: If you have state retention enabled, Nagios will ignore this setting when it (re)starts and use the last known settingfor this option (as stored in the state retention file), unless you disable the use_retained_program_stateoption. If you want to change this option when state retention is active (and the use_retained_program_state is enabled), you’ll have to use the appropriate external command or changeit via the web interface. Values are as follows:
21

0 = Disable notifications
1 = Enable notifications (default)
Service Check Execution Option
Format: execute_service_checks=<0/1>
Example: execute_service_checks=1
This option determines whether or not Nagios will execute service checks when it initially (re)starts. Ifthis option is disabled, Nagios will not actively execute any service checks and will remain in a sort of"sleep" mode (it can still accept passive checks unless you’ve disabled them). This option is most oftenused when configuring backup monitoring servers, as described in the documentation on redundancy,or when setting up a distributed monitoring environment. Note: If you have state retention enabled,Nagios will ignore this setting when it (re)starts and use the last known setting for this option (as storedin the state retention file), unless you disable the use_retained_program_state option. If you want tochange this option when state retention is active (and the use_retained_program_state is enabled), you’llhave to use the appropriate external command or change it via the web interface. Values are as follows:
0 = Don’t execute service checks
1 = Execute service checks (default)
Passive Service Check Acceptance Option
Format: accept_passive_service_checks=<0/1>
Example: accept_passive_service_checks=1
This option determines whether or not Nagios will accept passive service checks when it initially(re)starts. If this option is disabled, Nagios will not accept any passive service checks. Note: If you have state retention enabled, Nagios will ignore this setting when it (re)starts and use the last known settingfor this option (as stored in the state retention file), unless you disable the use_retained_program_stateoption. If you want to change this option when state retention is active (and the use_retained_program_state is enabled), you’ll have to use the appropriate external command or changeit via the web interface. Values are as follows:
0 = Don’t accept passive service checks
1 = Accept passive service checks (default)
Host Check Execution Option
Format: execute_host_checks=<0/1>
Example: execute_host_checks=1
This option determines whether or not Nagios will execute on-demand and regularly scheduled hostchecks when it initially (re)starts. If this option is disabled, Nagios will not actively execute any hostchecks, although it can still accept passive host checks unless you’ve disabled them). This option is mostoften used when configuring backup monitoring servers, as described in the documentation on redundancy, or when setting up a distributed monitoring environment. Note: If you have state retentionenabled, Nagios will ignore this setting when it (re)starts and use the last known setting for this option
22

(as stored in the state retention file), unless you disable the use_retained_program_state option. If youwant to change this option when state retention is active (and the use_retained_program_state isenabled), you’ll have to use the appropriate external command or change it via the web interface. Valuesare as follows:
0 = Don’t execute host checks
1 = Execute host checks (default)
Passive Host Check Acceptance Option
Format: accept_passive_host_checks=<0/1>
Example: accept_passive_host_checks=1
This option determines whether or not Nagios will accept passive host checks when it initially (re)starts.If this option is disabled, Nagios will not accept any passive host checks. Note: If you have state retention enabled, Nagios will ignore this setting when it (re)starts and use the last known setting forthis option (as stored in the state retention file), unless you disable the use_retained_program_stateoption. If you want to change this option when state retention is active (and the use_retained_program_state is enabled), you’ll have to use the appropriate external command or changeit via the web interface. Values are as follows:
0 = Don’t accept passive host checks
1 = Accept passive host checks (default)
Event Handler Option
Format: enable_event_handlers=<0/1>
Example: enable_event_handlers=1
This option determines whether or not Nagios will run event handlers when it initially (re)starts. If thisoption is disabled, Nagios will not run any host or service event handlers. Note: If you have state retention enabled, Nagios will ignore this setting when it (re)starts and use the last known setting forthis option (as stored in the state retention file), unless you disable the use_retained_program_stateoption. If you want to change this option when state retention is active (and the use_retained_program_state is enabled), you’ll have to use the appropriate external command or changeit via the web interface. Values are as follows:
0 = Disable event handlers
1 = Enable event handlers (default)
Log Rotation Method
Format: log_rotation_method=<n/h/d/w/m>
Example: log_rotation_method=d
This is the rotation method that you would like Nagios to use for your log file. Values are as follows:
23

n = None (don’t rotate the log - this is the default)
h = Hourly (rotate the log at the top of each hour)
d = Daily (rotate the log at midnight each day)
w = Weekly (rotate the log at midnight on Saturday)
m = Monthly (rotate the log at midnight on the last day of the month)
Log Archive Path
Format: log_archive_path=<path>
Example: log_archive_path=/usr/local/nagios/var/archives/
This is the directory where Nagios should place log files that have been rotated. This option is ignored ifyou choose to not use the log rotation functionality.
External Command Check Option
Format: check_external_commands=<0/1>
Example: check_external_commands=1
This option determines whether or not Nagios will check the command file for commands that shouldbe executed. This option must be enabled if you plan on using the command CGI to issue commands viathe web interface. More information on external commands can be found here.
0 = Don’t check external commands (default)
1 = Check external commands
External Command Check Interval
Format: command_check_interval=<xxx>[s]
Example: command_check_interval=1
If you specify a number with an "s" appended to it (i.e. 30s), this is the number of seconds to wait betweenexternal command checks. If you leave off the "s", this is the number of "time units" to wait betweenexternal command checks. Unless you’ve changed the interval_length value (as defined below) from thedefault value of 60, this number will mean minutes.
Note: By setting this value to -1, Nagios will check for external commands as often as possible. Each timeNagios checks for external commands it will read and process all commands present in the command file before continuing on with its other duties. More information on external commands can be found here.
External Command File
Format: command_file=<file_name>
Example: command_file=/usr/local/nagios/var/rw/nagios.cmd
24

This is the file that Nagios will check for external commands to process. The command CGI writescommands to this file. Other third party programs can write to this file if proper file permissions havebeen granted as outline in here. The external command file is implemented as a named pipe (FIFO),which is created when Nagios starts and removed when it shuts down. If the file exists when Nagiosstarts, the Nagios process will terminate with an error message. More information on externalcommands can be found here.
Downtime File
Format: downtime_file=<file_name>
Example: downtime_file=/usr/local/nagios/var/downtime.dat
This is the file that Nagios will use for storing scheduled host and service downtime information.Comments can be viewed and added for both hosts and services through the extended information CGI.
Comment File
Format: comment_file=<file_name>
Example: comment_file=/usr/local/nagios/var/comment.dat
This is the file that Nagios will use for storing service and host comments. Comments can be viewed andadded for both hosts and services through the extended information CGI.
Lock File
Format: lock_file=<file_name>
Example: lock_file=/tmp/nagios.lock
This option specifies the location of the lock file that Nagios should create when it runs as a daemon(when started with the -d command line argument). This file contains the process id (PID) number of therunning Nagios process.
State Retention Option
Format: retain_state_information=<0/1>
Example: retain_state_information=1
This option determines whether or not Nagios will retain state information for hosts and servicesbetween program restarts. If you enable this option, you should supply a value for the state_retention_file variable. When enabled, Nagios will save all state information for hosts and servicebefore it shuts down (or restarts) and will read in previously saved state information when it starts up again.
0 = Don’t retain state information
1 = Retain state information (default)
25

State Retention File
Format: state_retention_file=<file_name>
Example: state_retention_file=/usr/local/nagios/var/retention.dat
This is the file that Nagios will use for storing service and host state information before it shuts down.When Nagios is restarted it will use the information stored in this file for setting the initial states ofservices and hosts before it starts monitoring anything. This file is deleted after Nagios reads in initialstate information when it (re)starts. In order to make Nagios retain state information between programrestarts, you must enable the retain_state_information option.
Automatic State Retention Update Interval
Format: retention_update_interval=<minutes>
Example: retention_update_interval=60
This setting determines how often (in minutes) that Nagios will automatically save retention data duringnormal operation. If you set this value to 0, Nagios will not save retention data at regular intervals, but itwill still save retention data before shutting down or restarting. If you have disabled state retention(with the retain_state_information option), this option has no effect.
Use Retained Program State Option
Format: use_retained_program_state=<0/1>
Example: use_retained_program_state=1
This setting determines whether or not Nagios will set various program-wide state variables based onthe values saved in the retention file. Some of these program-wide state variables that are normallysaved across program restarts if state retention is enabled include the enable_notifications, enable_flap_detection, enable_event_handlers, execute_service_checks, and accept_passive_service_checks options. If you do not have state retention enabled, this option has no effect.
0 = Don’t use retained program state
1 = Use retained program state (default)
Use Retained Scheduling Info Option
Format: use_retained_scheduling_info=<0/1>
Example: use_retained_scheduling_info=1
This setting determines whether or not Nagios will retain scheduling info (next check times) for hostsand services when it restarts. If you are adding a large number (or percentage) of hosts and services, Iwould recommend disabling this option when you first restart Nagios, as it can adversely skew thespread of initial checks. Otherwise you will probably want to leave it enabled.
26

0 = Don’t use retained scheduling info
1 = Use retained scheduling info (default)
Syslog Logging Option
Format: use_syslog=<0/1>
Example: use_syslog=1
This variable determines whether messages are logged to the syslog facility on your local host. Valuesare as follows:
0 = Don’t use syslog facility
1 = Use syslog facility
Notification Logging Option
Format: log_notifications=<0/1>
Example: log_notifications=1
This variable determines whether or not notification messages are logged. If you have a lot of contacts orregular service failures your log file will grow relatively quickly. Use this option to keep contactnotifications from being logged.
0 = Don’t log notifications
1 = Log notifications
Service Check Retry Logging Option
Format: log_service_retries=<0/1>
Example: log_service_retries=1
This variable determines whether or not service check retries are logged. Service check retries occurwhen a service check results in a non-OK state, but you have configured Nagios to retry the service morethan once before responding to the error. Services in this situation are considered to be in "soft" states.Logging service check retries is mostly useful when attempting to debug Nagios or test out service event handlers.
0 = Don’t log service check retries
1 = Log service check retries
Host Check Retry Logging Option
Format: log_host_retries=<0/1>
Example: log_host_retries=1
27

This variable determines whether or not host check retries are logged. Logging host check retries ismostly useful when attempting to debug Nagios or test out host event handlers.
0 = Don’t log host check retries
1 = Log host check retries
Event Handler Logging Option
Format: log_event_handlers=<0/1>
Example: log_event_handlers=1
This variable determines whether or not service and host event handlers are logged. Event handlers areoptional commands that can be run whenever a service or hosts changes state. Logging event handlers ismost useful when debugging Nagios or first trying out your event handler scripts.
0 = Don’t log event handlers
1 = Log event handlers
Initial States Logging Option
Format: log_initial_states=<0/1>
Example: log_initial_states=1
This variable determines whether or not Nagios will force all initial host and service states to be logged,even if they result in an OK state. Initial service and host states are normally only logged when there is aproblem on the first check. Enabling this option is useful if you are using an application that scans thelog file to determine long-term state statistics for services and hosts.
0 = Don’t log initial states (default)
1 = Log initial states
External Command Logging Option
Format: log_external_commands=<0/1>
Example: log_external_commands=1
This variable determines whether or not Nagios will log external commands that it receives from the external command file. Note: This option does not control whether or not passive service checks (whichare a type of external command) get logged. To enable or disable logging of passive checks, use the log_passive_checks option.
0 = Don’t log external commands
1 = Log external commands (default)
Passive Check Logging Option
28

Format: log_passive_checks=<0/1>
Example: log_passive_checks=1
This variable determines whether or not Nagios will log passive host and service checks that it receivesfrom the external command file. If you are setting up a distributed monitoring environment or plan onhandling a large number of passive checks on a regular basis, you may wish to disable this option soyour log file doesn’t get too large.
0 = Don’t log passive checks
1 = Log passive checks (default)
Global Host Event Handler Option
Format: global_host_event_handler=<command>
Example: global_host_event_handler=log-host-event-to-db
This option allows you to specify a host event handler command that is to be run for every host statechange. The global event handler is executed immediately prior to the event handler that you haveoptionally specified in each host definition. The command argument is the short name of a command thatyou define in your object configuration file. The maximum amount of time that this command can run iscontrolled by the event_handler_timeout option. More information on event handlers can be found here.
Global Service Event Handler Option
Format: global_service_event_handler=<command>
Example: global_service_event_handler=log-service-event-to-db
This option allows you to specify a service event handler command that is to be run for every servicestate change. The global event handler is executed immediately prior to the event handler that you haveoptionally specified in each service definition. The command argument is the short name of a commandthat you define in your object configuration file. The maximum amount of time that this command canrun is controlled by the event_handler_timeout option. More information on event handlers can befound here.
Inter-Check Sleep Time
Format: sleep_time=<seconds>
Example: sleep_time=1
This is the number of seconds that Nagios will sleep before checking to see if the next service or hostcheck in the scheduling queue should be executed. Note that Nagios will only sleep after it "catches up"with queued service checks that have fallen behind.
Service Inter-Check Delay Method
29

Format: service_inter_check_delay_method=<n/d/s/x.xx>
Example: service_inter_check_delay_method=s
This option allows you to control how service checks are initially "spread out" in the event queue. Usinga "smart" delay calculation (the default) will cause Nagios to calculate an average check interval andspread initial checks of all services out over that interval, thereby helping to eliminate CPU load spikes.Using no delay is generally not recommended unless you are testing the service check parallelizationfunctionality. Using no delay will cause all service checks to be scheduled for execution at the same time.This means that you will generally have large CPU spikes when the services are all executed in parallel.More information on how to estimate how the inter-check delay affects service check scheduling can befound here. Values are as follows:
n = Don’t use any delay - schedule all service checks to run immediately (i.e. at the same time!)
d = Use a "dumb" delay of 1 second between service checks
s = Use a "smart" delay calculation to spread service checks out evenly (default)
x.xx = Use a user-supplied inter-check delay of x.xx seconds
Maximum Service Check Spread
Format: max_service_check_spread=<minutes>
Example: max_service_check_spread=30
This option determines the maximum number of minutes from when Nagios starts that all services (thatare scheduled to be regularly checked) are checked. This option will automatically adjust the serviceinter-check delay (if necessary) to ensure that the initial checks of all services occur within the timeframeyou specify. In general, this option will not have an affect on service check scheduling if schedulinginformation is being retained using the use_retained_scheduling_info option. Default value is 30 (minutes).
Service Interleave Factor
Format: service_interleave_factor=<s|x>
Example: service_interleave_factor=s
This variable determines how service checks are interleaved. Interleaving allows for a more evendistribution of service checks, reduced load on remote hosts, and faster overall detection of hostproblems. With the introduction of service check parallelization, remote hosts could get bombarded withchecks if interleaving was not implemented. This could cause the service checks to fail or returnincorrect results if the remote host was overloaded with processing other service check requests. Settingthis value to 1 is equivalent to not interleaving the service checks (this is how versions of Nagiosprevious to 0.0.5 worked). Set this value to s (smart) for automatic calculation of the interleave factorunless you have a specific reason to change it. The best way to understand how interleaving works is towatch the status CGI (detailed view) when Nagios is just starting. You should see that the service checkresults are spread out as they begin to appear. More information on how interleaving works can befound here.
30

x = A number greater than or equal to 1 that specifies the interleave factor to use. An interleavefactor of 1 is equivalent to not interleaving the service checks.
s = Use a "smart" interleave factor calculation (default)
Maximum Concurrent Service Checks
Format: max_concurrent_checks=<max_checks>
Example: max_concurrent_checks=20
This option allows you to specify the maximum number of service checks that can be run in parallel atany given time. Specifying a value of 1 for this variable essentially prevents any service checks frombeing parallelized. Specifying a value of 0 (the default) does not place any restrictions on the number ofconcurrent checks. You’ll have to modify this value based on the system resources you have available onthe machine that runs Nagios, as it directly affects the maximum load that will be imposed on the system(processor utilization, memory, etc.). More information on how to estimate how many concurrent checksyou should allow can be found here.
Service Reaper Frequency
Format: service_reaper_frequency=<frequency_in_seconds>
Example: service_reaper_frequency=10
This option allows you to control the frequency in seconds of service "reaper" events. "Reaper" eventsprocess the results from parallelized service checks that have finished executing. These events consitutethe core of the monitoring logic in Nagios.
Host Inter-Check Delay Method
Format: host_inter_check_delay_method=<n/d/s/x.xx>
Example: host_inter_check_delay_method=s
This option allows you to control how host checks that are scheduled to be checked on a regular basis areinitially "spread out" in the event queue. Using a "smart" delay calculation (the default) will causeNagios to calculate an average check interval and spread initial checks of all hosts out over that interval,thereby helping to eliminate CPU load spikes. Using no delay is generally not recommended. Using nodelay will cause all host checks to be scheduled for execution at the same time. More information onhow to estimate how the inter-check delay affects host check scheduling can be found here.Values are as follows:
n = Don’t use any delay - schedule all host checks to run immediately (i.e. at the same time!)
d = Use a "dumb" delay of 1 second between host checks
s = Use a "smart" delay calculation to spread host checks out evenly (default)
x.xx = Use a user-supplied inter-check delay of x.xx seconds
Maximum Host Check Spread
31

Format: max_host_check_spread=<minutes>
Example: max_host_check_spread=30
This option determines the maximum number of minutes from when Nagios starts that all hosts (thatare scheduled to be regularly checked) are checked. This option will automatically adjust the hostinter-check delay (if necessary) to ensure that the initial checks of all hosts occur within the timeframeyou specify. In general, this option will not have an affect on host check scheduling if schedulinginformation is being retained using the use_retained_scheduling_info option. Default value is 30 (minutes).
Timing Interval Length
Format: interval_length=<seconds>
Example: interval_length=60
This is the number of seconds per "unit interval" used for timing in the scheduling queue,re-notifications, etc. "Units intervals" are used in the object configuration file to determine how often torun a service check, how often of re-notify a contact, etc.
Important: The default value for this is set to 60, which means that a "unit value" of 1 in the objectconfiguration file will mean 60 seconds (1 minute). I have not really tested other values for this variable,so proceed at your own risk if you decide to do so!
Auto-Rescheduling Option
Format: auto_reschedule_checks=<0/1>
Example: auto_reschedule_checks=1
This option determines whether or not Nagios will attempt to automatically reschedule active host andservice checks to "smooth" them out over time. This can help to balance the load on the monitoringserver, as it will attempt to keep the time between consecutive checks consistent, at the expense ofexecuting checks on a more rigid schedule.
WARNING: THIS IS AN EXPERIMENTAL FEATURE AND MAY BE REMOVED IN FUTUREVERSIONS. ENABLING THIS OPTION CAN DEGRADE PERFORMANCE - RATHER THANINCREASE IT - IF USED IMPROPERLY!
Auto-Rescheduling Interval
Format: auto_rescheduling_interval=<seconds>
Example: auto_rescheduling_interval=30
This option determines how often (in seconds) Nagios will attempt to automatically reschedule checks.This option only has an effect if the auto_reschedule_checks option is enabled. Default is 30 seconds.
32

WARNING: THIS IS AN EXPERIMENTAL FEATURE AND MAY BE REMOVED IN FUTUREVERSIONS. ENABLING THE AUTO-RESCHEDULING OPTION CAN DEGRADE PERFORMANCE -RATHER THAN INCREASE IT - IF USED IMPROPERLY!
Auto-Rescheduling Window
Format: auto_rescheduling_window=<seconds>
Example: auto_rescheduling_window=180
This option determines the "window" of time (in seconds) that Nagios will look at when automaticallyrescheduling checks. Only host and service checks that occur in the next X seconds (determined by thisvariable) will be rescheduled. This option only has an effect if the auto_reschedule_checks option isenabled. Default is 180 seconds (3 minutes).
WARNING: THIS IS AN EXPERIMENTAL FEATURE AND MAY BE REMOVED IN FUTUREVERSIONS. ENABLING THE AUTO-RESCHEDULING OPTION CAN DEGRADE PERFORMANCE -RATHER THAN INCREASE IT - IF USED IMPROPERLY!
Aggressive Host Checking Option
Format: use_aggressive_host_checking=<0/1>
Example: use_aggressive_host_checking=0
Nagios tries to be smart about how and when it checks the status of hosts. In general, disabling thisoption will allow Nagios to make some smarter decisions and check hosts a bit faster. Enabling thisoption will increase the amount of time required to check hosts, but may improve reliability a bit. Unlessyou have problems with Nagios not recognizing that a host recovered, I would suggest not enabling this option.
0 = Don’t use aggressive host checking (default)
1 = Use aggressive host checking
Flap Detection Option
Format: enable_flap_detection=<0/1>
Example: enable_flap_detection=0
This option determines whether or not Nagios will try and detect hosts and services that are "flapping".Flapping occurs when a host or service changes between states too frequently, resulting in a barrage ofnotifications being sent out. When Nagios detects that a host or service is flapping, it will temporarilysuppress notifications for that host/service until it stops flapping. Flap detection is very experimental atthis point, so use this feature with caution! More information on how flap detection and handling workscan be found here. Note: If you have state retention enabled, Nagios will ignore this setting when it(re)starts and use the last known setting for this option (as stored in the state retention file), unless youdisable the use_retained_program_state option. If you want to change this option when state retention isactive (and the use_retained_program_state is enabled), you’ll have to use the appropriate external command or change it via the web interface.
33

0 = Don’t enable flap detection (default)
1 = Enable flap detection
Low Service Flap Threshold
Format: low_service_flap_threshold=<percent>
Example: low_service_flap_threshold=25.0
This option is used to set the low threshold for detection of service flapping. For more information onhow flap detection and handling works (and how this option affects things) read this.
High Service Flap Threshold
Format: high_service_flap_threshold=<percent>
Example: high_service_flap_threshold=50.0
This option is used to set the low threshold for detection of service flapping. For more information onhow flap detection and handling works (and how this option affects things) read this.
Low Host Flap Threshold
Format: low_host_flap_threshold=<percent>
Example: low_host_flap_threshold=25.0
This option is used to set the low threshold for detection of host flapping. For more information on howflap detection and handling works (and how this option affects things) read this.
High Host Flap Threshold
Format: high_host_flap_threshold=<percent>
Example: high_host_flap_threshold=50.0
This option is used to set the low threshold for detection of host flapping. For more information on howflap detection and handling works (and how this option affects things) read this.
Soft Service Dependencies Option
Format: soft_state_dependencies=<0/1>
Example: soft_state_dependencies=0
This option determines whether or not Nagios will use soft service state information when checking service dependencies. Normally Nagios will only use the latest hard service state when checkingdependencies. If you want it to use the latest state (regardless of whether its a soft or hard state type),enable this option.
34

0 = Don’t use soft service state dependencies (default)
1 = Use soft service state dependencies
Service Check Timeout
Format: service_check_timeout=<seconds>
Example: service_check_timeout=60
This is the maximum number of seconds that Nagios will allow service checks to run. If checks exceedthis limit, they are killed and a CRITICAL state is returned. A timeout error will also be logged.
There is often widespread confusion as to what this option really does. It is meant to be used as a lastditch mechanism to kill off plugins which are misbehaving and not exiting in a timely manner. It shouldbe set to something high (like 60 seconds or more), so that each service check normally finishes executingwithin this time limit. If a service check runs longer than this limit, Nagios will kill it off thinking it is arunaway processes.
Host Check Timeout
Format: host_check_timeout=<seconds>
Example: host_check_timeout=60
This is the maximum number of seconds that Nagios will allow host checks to run. If checks exceed thislimit, they are killed and a CRITICAL state is returned and the host will be assumed to be DOWN. Atimeout error will also be logged.
There is often widespread confusion as to what this option really does. It is meant to be used as a lastditch mechanism to kill off plugins which are misbehaving and not exiting in a timely manner. It shouldbe set to something high (like 60 seconds or more), so that each host check normally finishes executingwithin this time limit. If a host check runs longer than this limit, Nagios will kill it off thinking it is arunaway processes.
Event Handler Timeout
Format: event_handler_timeout=<seconds>
Example: event_handler_timeout=60
This is the maximum number of seconds that Nagios will allow event handlers to be run. If an eventhandler exceeds this time limit it will be killed and a warning will be logged.
There is often widespread confusion as to what this option really does. It is meant to be used as a lastditch mechanism to kill off commands which are misbehaving and not exiting in a timely manner. Itshould be set to something high (like 60 seconds or more), so that each event handler commandnormally finishes executing within this time limit. If an event handler runs longer than this limit, Nagioswill kill it off thinking it is a runaway processes.
35

Notification Timeout
Format: notification_timeout=<seconds>
Example: notification_timeout=60
This is the maximum number of seconds that Nagios will allow notification commands to be run. If anotification command exceeds this time limit it will be killed and a warning will be logged.
There is often widespread confusion as to what this option really does. It is meant to be used as a lastditch mechanism to kill off commands which are misbehaving and not exiting in a timely manner. Itshould be set to something high (like 60 seconds or more), so that each notification command finishesexecuting within this time limit. If a notification command runs longer than this limit, Nagios will kill itoff thinking it is a runaway processes.
Obsessive Compulsive Service Processor Timeout
Format: ocsp_timeout=<seconds>
Example: ocsp_timeout=5
This is the maximum number of seconds that Nagios will allow an obsessive compulsive serviceprocessor command to be run. If a command exceeds this time limit it will be killed and a warning willbe logged.
Obsessive Compulsive Host Processor Timeout
Format: ochp_timeout=<seconds>
Example: ochp_timeout=5
This is the maximum number of seconds that Nagios will allow an obsessive compulsive host processor command to be run. If a command exceeds this time limit it will be killed and a warning will be logged.
Performance Data Processor Command Timeout
Format: perfdata_timeout=<seconds>
Example: perfdata_timeout=5
This is the maximum number of seconds that Nagios will allow a host performance data processor command or service performance data processor command to be run. If a command exceeds this timelimit it will be killed and a warning will be logged.
Obsess Over Services Option
Format: obsess_over_services=<0/1>
Example: obsess_over_services=1
36

This value determines whether or not Nagios will "obsess" over service checks results and run the obsessive compulsive service processor command you define. I know - funny name, but it was all Icould think of. This option is useful for performing distributed monitoring. If you’re not doingdistributed monitoring, don’t enable this option.
0 = Don’t obsess over services (default)
1 = Obsess over services
Obsessive Compulsive Service Processor Command
Format: ocsp_command=<command>
Example: ocsp_command=obsessive_service_handler
This option allows you to specify a command to be run after every service check, which can be useful in distributed monitoring. This command is executed after any event handler or notification commands.The command argument is the short name of a command definition that you define in your objectconfiguration file. The maximum amount of time that this command can run is controlled by the ocsp_timeout option. More information on distributed monitoring can be found here. This command isonly executed if the obsess_over_services option is enabled globally and if the obsess_over_servicedirective in the service definition is enabled.
Obsess Over Hosts Option
Format: obsess_over_hosts=<0/1>
Example: obsess_over_hosts=1
This value determines whether or not Nagios will "obsess" over host checks results and run the obsessive compulsive host processor command you define. I know - funny name, but it was all I couldthink of. This option is useful for performing distributed monitoring. If you’re not doing distributedmonitoring, don’t enable this option.
0 = Don’t obsess over hosts (default)
1 = Obsess over hosts
Obsessive Compulsive Host Processor Command
Format: ochp_command=<command>
Example: ochp_command=obsessive_host_handler
This option allows you to specify a command to be run after every host check, which can be useful in distributed monitoring. This command is executed after any event handler or notification commands.The command argument is the short name of a command definition that you define in your objectconfiguration file. The maximum amount of time that this command can run is controlled by the ochp_timeout option. More information on distributed monitoring can be found here. This command isonly executed if the obsess_over_hosts option is enabled globally and if the obsess_over_host directive inthe host definition is enabled.
37

Performance Data Processing Option
Format: process_performance_data=<0/1>
Example: process_performance_data=1
This value determines whether or not Nagios will process host and service check performance data.
0 = Don’t process performance data (default)
1 = Process performance data
Host Performance Data Processing Command
Format: host_perfdata_command=<command>
Example: host_perfdata_command=process-host-perfdata
This option allows you to specify a command to be run after every host check to process host performance data that may be returned from the check. The command argument is the short name of a command definition that you define in your object configuration file. This command is only executed ifthe process_performance_data option is enabled globally and if the process_perf_data directive in the host definition is enabled.
Service Performance Data Processing Command
Format: service_perfdata_command=<command>
Example: service_perfdata_command=process-service-perfdata
This option allows you to specify a command to be run after every service check to process service performance data that may be returned from the check. The command argument is the short name of a command definition that you define in your object configuration file. This command is only executed ifthe process_performance_data option is enabled globally and if the process_perf_data directive in the service definition is enabled.
Host Performance Data File
Format: host_perfdata_file=<file_name>
Example: host_perfdata_file=/usr/local/nagios/var/host-perfdata.dat
This option allows you to specify a file to which host performance data will be written after every hostcheck. Data will be written to the performance file as specified by the host_perfdata_file_templateoption. Performance data is only written to this file if the process_performance_data option is enabledglobally and if the process_perf_data directive in the host definition is enabled.
Service Performance Data File
38

Format: service_perfdata_file=<file_name>
Example: service_perfdata_file=/usr/local/nagios/var/service-perfdata.dat
This option allows you to specify a file to which service performance data will be written after everyservice check. Data will be written to the performance file as specified by the service_perfdata_file_template option. Performance data is only written to this file if the process_performance_data option is enabled globally and if the process_perf_data directive in the service definition is enabled.
Host Performance Data File Template
Format: host_perfdata_file_template=<template>
Example: host_perfdata_file_template=[HOSTPERFDATA]\t$TIMET$\t$HOSTNAME$\t$HOSTEXECUTIONTIME$\t$HOSTOUTPUT$\t$HOSTPERFDATA$
This option determines what (and how) data is written to the host performance data file. The templatemay contain macros, special characters (\t for tab, \r for carriage return, \n for newline) and plain text.A newline is automatically added after each write to the performance data file.
Service Performance Data File Template
Format: service_perfdata_file_template=<template>
Example: service_perfdata_file_template=[SERVICEPERFDATA]\t$TIMET$\t$HOSTNAME$\t$SERVICEDESC$\t$SERVICEEXECUTIONTIME$\t$SERVICELATENCY$\t$SERVICEOUTPUT$\t$SERVICEPERFDATA$
This option determines what (and how) data is written to the service performance data file. The templatemay contain macros, special characters (\t for tab, \r for carriage return, \n for newline) and plain text.A newline is automatically added after each write to the performance data file.
Host Performance Data File Mode
Format: host_perfdata_file_mode=<mode>
Example: host_perfdata_file_mode=a
This option determines whether the host performance data file is opened in write or append mode.Unless the file is a named pipe, you will probably want to use the default mode of append.
a = Open file in append mode (default)
w = Open file in write mode
Service Performance Data File Mode
Format: service_perfdata_file_mode=<mode>
Example: service_perfdata_file_mode=a
This option determines whether the service performance data file is opened in write or append mode.Unless the file is a named pipe, you will probably want to use the default mode of append.
39

a = Open file in append mode (default)
w = Open file in write mode
Host Performance Data File Processing Interval
Format: host_perfdata_file_processing_interval=<seconds>
Example: host_perfdata_file_processing_interval=0
This option allows you to specify the interval (in seconds) at which the host performance data file isprocessed using the host performance data file processing command. A value of 0 indicates that theperformance data file should not be processed at regular intervals.
Service Performance Data File Processing Interval
Format: service_perfdata_file_processing_interval=<seconds>
Example: service_perfdata_file_processing_interval=0
This option allows you to specify the interval (in seconds) at which the service performance data file isprocessed using the service performance data file processing command. A value of 0 indicates that theperformance data file should not be processed at regular intervals.
Host Performance Data File Processing Command
Format: host_perfdata_file_processing_command=<command>
Example: host_perfdata_file_processing_command=process-host-perfdata-file
This option allows you to specify the command that should be executed to process the host performancedata file. The command argument is the short name of a command definition that you define in yourobject configuration file. The interval at which this command is executed is determined by the host_perfdata_file_processing_interval directive.
Service Performance Data File Processing Command
Format: service_perfdata_file_processing_command=<command>
Example: service_perfdata_file_processing_command=process-service-perfdata-file
This option allows you to specify the command that should be executed to process the serviceperformance data file. The command argument is the short name of a command definition that you definein your object configuration file. The interval at which this command is executed is determined by the service_perfdata_file_processing_interval directive.
Orphaned Service Check Option
40

Format: check_for_orphaned_services=<0/1>
Example: check_for_orphaned_services=1
This option allows you to enable or disable checks for orphaned service checks. Orphaned service checksare checks which have been executed and have been removed from the event queue, but have not hadany results reported in a long time. Since no results have come back in for the service, it is notrescheduled in the event queue. This can cause service checks to stop being executed. Normally it is veryrare for this to happen - it might happen if an external user or process killed off the process that wasbeing used to execute a service check. If this option is enabled and Nagios finds that results for aparticular service check have not come back, it will log an error message and reschedule the servicecheck. If you start seeing service checks that never seem to get rescheduled, enable this option and see ifyou notice any log messages about orphaned services.
0 = Don’t check for orphaned service checks
1 = Check for orphaned service checks (default)
Service Freshness Checking Option
Format: check_service_freshness=<0/1>
Example: check_service_freshness=0
This option determines whether or not Nagios will periodically check the "freshness" of service checks.Enabling this option is useful for helping to ensure that passive service checks are received in a timelymanner. More information on freshness checking can be found here.
0 = Don’t check service freshness
1 = Check service freshness (default)
Service Freshness Check Interval
Format: service_freshness_check_interval=<seconds>
Example: service_freshness_check_interval=60
This setting determines how often (in seconds) Nagios will periodically check the "freshness" of servicecheck results. If you have disabled service freshness checking (with the check_service_freshness option),this option has no effect. More information on freshness checking can be found here.
Host Freshness Checking Option
Format: check_host_freshness=<0/1>
Example: check_host_freshness=0
This option determines whether or not Nagios will periodically check the "freshness" of host checks.Enabling this option is useful for helping to ensure that passive host checks are received in a timelymanner. More information on freshness checking can be found here.
41

0 = Don’t check host freshness
1 = Check host freshness (default)
Host Freshness Check Interval
Format: host_freshness_check_interval=<seconds>
Example: host_freshness_check_interval=60
This setting determines how often (in seconds) Nagios will periodically check the "freshness" of hostcheck results. If you have disabled host freshness checking (with the check_host_freshness option), thisoption has no effect. More information on freshness checking can be found here.
Date Format
Format: date_format=<option>
Example: date_format=us
This option allows you to specify what kind of date/time format Nagios should use in the web interfaceand date/time macros. Possible options (along with example output) include:
Option Output Format Sample Output
us MM/DD/YYYY HH:MM:SS 06/30/2002 03:15:00
euro DD/MM/YYYY HH:MM:SS 30/06/2002 03:15:00
iso8601 YYYY-MM-DD HH:MM:SS 2002-06-30 03:15:00
strict-iso8601 YYYY-MM-DDTHH:MM:SS 2002-06-30T03:15:00
Illegal Object Name Characters
Format: illegal_object_name_chars=<chars...>
Example: illegal_object_name_chars=‘~!$%^&*"|’<>?,()=
This option allows you to specify illegal characters that cannot be used in host names, servicedescriptions, or names of other object types. Nagios will allow you to use most characters in objectdefinitions, but I recommend not using the characters shown in the example above. Doing may give youproblems in the web interface, notification commands, etc.
Illegal Macro Output Characters
Format: illegal_macro_output_chars=<chars...>
Example: illegal_macro_output_chars=‘~$^&"|’<>
42

This option allows you to specify illegal characters that should be stripped from macros before beingused in notifications, event handlers, and other commands. This DOES NOT affect macros used inservice or host check commands. You can choose to not strip out the characters shown in the exampleabove, but I recommend you do not do this. Some of these characters are interpreted by the shell (i.e. thebacktick) and can lead to security problems. The following macros are stripped of the characters youspecify:
$HOSTOUTPUT$, $HOSTPERFDATA$, $HOSTACKAUTHOR$, $HOSTACKCOMMENT$, $SERVICEOUTPUT$, $SERVICEPERFDATA$, $SERVICEACKAUTHOR$, and $SERVICEACKCOMMENT$
Regular Expression Matching Option
Format: use_regexp_matching=<0/1>
Example: use_regexp_matching=0
This option determines whether or not various directives in your object definitions will be processed asregular expressions. More information on how this works can be found here.
0 = Don’t use regular expression matching (default)
1 = Use regular expression matching
True Regular Expression Matching Option
Format: use_true_regexp_matching=<0/1>
Example: use_true_regexp_matching=0
If you’ve enabled regular expression matching of various object directives using the use_regexp_matching option, this option will determine when object directives are treated as regularexpressions. If this option is disabled (the default), directives will only be treated as regular expressionsif the contain a * or ? wildcard character. If this option is enabled, all appropriate directives will betreated as regular expression - be careful when enabling this! More information on how this works canbe found here.
0 = Don’t use true regular expression matching (default)
1 = Use true regular expression matching
Administrator Email Address
Format: admin_email=<email_address>
Example: [email protected]
This is the email address for the administrator of the local machine (i.e. the one that Nagios is runningon). This value can be used in notification commands by using the $ADMINEMAIL$ macro.
Administrator Pager
43

Format: admin_pager=<pager_number_or_pager_email_gateway>
Example: [email protected]
This is the pager number (or pager email gateway) for the administrator of the local machine (i.e. the onethat Nagios is running on). The pager number/address can be used in notification commands by usingthe $ADMINPAGER$ macro.
44

Object Definitions
What is Object Data?
Object data is simply a generic term I use to describe various data definitions you need in order tomonitor anything. Types of object definitions include:
Services
Service Groups
Hosts
Host Groups
Contacts
Contact Groups
Commands
Time Periods
Service Escalations
Service Dependencies
Host Escalations
Host Dependencies
Extended Host Information
Extended Service Information
Where Is Object Data Defined?
Object data is defined in one or more configuration files that you specify using the cfg_file and/or cfg_dir directives in the main configuration file. You can include multiple object configuration filesand/or directories by using multiple cfg_file and/or cfg_dir directives.
How Is Object Data Defined?
Object definitions are defined in a template format. Click here for more information on defining objectdata using this method.
45

CGI Configuration File Options
Notes
When creating and/or editing configuration files, keep the following in mind:
1. Lines that start with a ’#’ character are taken to be comments and are not processed
2. Variables names must begin at the start of the line - no white space is allowed before the name
3. Variable names are case-sensitive
Sample Configuration
A sample CGI configuration file is created when you run the configure script - you can find the sampleconfig file in the sample-config/ subdirectory of the Nagios distribution.
Config File Location
By default, Nagios expects the CGI configuration file to be named cgi.cfg and located in the config filedirectory along with the main config file. If you need to change the name of the file or its location, youcan configure Apache to pass an environment variable named NAGIOS_CGI_CONFIG (which points tothe correct location) to the CGIs. See the Apache documentation for information on how to do this.
Index
Main configuration file locationPhysical HTML pathURL HTML pathAuthentication usageDefault user nameSystem/process information accessSystem/process command accessConfiguration information accessGlobal host information accessGlobal host command accessGlobal service information accessGlobal service command accessStatusmap CGI background imageDefault statusmap layout methodStatuswrl CGI include worldDefault statuswrl layout methodCGI refresh rateAudio alertsPing syntax
Main Configuration File Location
Format: main_config_file=<file_name>
Example: main_config_file=/usr/local/nagios/etc/nagios.cfg
46

This specifies the location of your main configuration file. The CGIs need to know where to find this filein order to get information about configuration information, current host and service status, etc.
Physical HTML Path
Format: physical_html_path=<path>
Example: physical_html_path=/usr/local/nagios/share
This is the physical path where the HTML files for Nagios are kept on your workstation or server. Nagiosassumes that the documentation and images files (used by the CGIs) are stored in subdirectories called docs/ and images/, respectively.
URL HTML Path
Format: url_html_path=<path>
Example: url_html_path=/nagios
If, when accessing Nagios via a web browser, you point to an URL like http://www.myhost.com/nagios,this value should be /nagios. Basically, its the path portion of the URL that is used to access the NagiosHTML pages.
Authentication Usage
Format: use_authentication=<0/1>
Example: use_authentication=1
This option controls whether or not the CGIs will use the authentication and authorization functionalitywhen determining what information and commands users have access to. I would strongly suggest thatyou use the authentication functionality for the CGIs. If you decide not to use authentication, make sureto remove the command CGI to prevent unauthorized users from issuing commands to Nagios. The CGIwill not issue commands to Nagios if authentication is disabled, but I would suggest removing italtogether just to be on the safe side. More information on how to setup authentication and configureauthorization for the CGIs can be found here.
0 = Don’t use authentication functionality
1 = Use authentication and authorization functionality (default)
Default User Name
Format: default_user_name=<username>
Example: default_user_name=guest
Setting this variable will define a default username that can access the CGIs. This allows people within asecure domain (i.e., behind a firewall) to access the CGIs without necessarily having to authenticate tothe web server. You may want to use this to avoid having to use basic authentication if you are not usinga secure server, as basic authentication transmits passwords in clear text over the Internet.
47

Important: Do not define a default username unless you are running a secure web server and are surethat everyone who has access to the CGIs has been authenticated in some manner! If you define thisvariable, anyone who has not authenticated to the web server will inherit all rights you assign to this user!
System/Process Information Access
Format: authorized_for_system_information=<user1>,<user2>,<user3>,...<usern>
Example: authorized_for_system_information=nagiosadmin,theboss
This is a comma-delimited list of names of authenticated users who can view system/process informationin the extended information CGI. Users in this list are not automatically authorized to issuesystem/process commands. If you want users to be able to issue system/process commands as well, youmust add them to the authorized_for_system_commands variable. More information on how to setupauthentication and configure authorization for the CGIs can be found here.
System/Process Command Access
Format: authorized_for_system_commands=<user1>,<user2>,<user3>,...<usern>
Example: authorized_for_system_commands=nagiosadmin
This is a comma-delimited list of names of authenticated users who can issue system/process commandsvia the command CGI. Users in this list are not automatically authorized to view system/processinformation. If you want users to be able to view system/process information as well, you must addthem to the authorized_for_system_information variable. More information on how to setupauthentication and configure authorization for the CGIs can be found here.
Configuration Information Access
Format: authorized_for_configuration_information=<user1>,<user2>,<user3>,...<usern>
Example: authorized_for_configuration_information=nagiosadmin
This is a comma-delimited list of names of authenticated users who can view configuration information inthe configuration CGI. Users in this list can view information on all configured hosts, host groups,services, contacts, contact groups, time periods, and commands. More information on how to setupauthentication and configure authorization for the CGIs can be found here.
Global Host Information Access
Format: authorized_for_all_hosts=<user1>,<user2>,<user3>,...<usern>
Example: authorized_for_all_hosts=nagiosadmin,theboss
This is a comma-delimited list of names of authenticated users who can view status and configurationinformation for all hosts. Users in this list are also automatically authorized to view information for allservices. Users in this list are not automatically authorized to issue commands for all hosts or services. Ifyou want users able to issue commands for all hosts and services as well, you must add them to the
48

authorized_for_all_host_commands variable. More information on how to setup authentication andconfigure authorization for the CGIs can be found here.
Global Host Command Access
Format: authorized_for_all_host_commands=<user1>,<user2>,<user3>,...<usern>
Example: authorized_for_all_host_commands=nagiosadmin
This is a comma-delimited list of names of authenticated users who can issue commands for all hosts viathe command CGI. Users in this list are also automatically authorized to issue commands for all services.Users in this list are not automatically authorized to view status or configuration information for allhosts or services. If you want users able to view status and configuration information for all hosts andservices as well, you must add them to the authorized_for_all_hosts variable. More information on howto setup authentication and configure authorization for the CGIs can be found here.
Global Service Information Access
Format: authorized_for_all_services=<user1>,<user2>,<user3>,...<usern>
Example: authorized_for_all_services=nagiosadmin,theboss
This is a comma-delimited list of names of authenticated users who can view status and configurationinformation for all services. Users in this list are not automatically authorized to view information for allhosts. Users in this list are not automatically authorized to issue commands for all services. If you wantusers able to issue commands for all services as well, you must add them to the authorized_for_all_service_commands variable. More information on how to setup authentication andconfigure authorization for the CGIs can be found here.
Global Service Command Access
Format: authorized_for_all_service_commands=<user1>,<user2>,<user3>,...<usern>
Example: authorized_for_all_service_commands=nagiosadmin
This is a comma-delimited list of names of authenticated users who can issue commands for all servicesvia the command CGI. Users in this list are not automatically authorized to issue commands for all hosts.Users in this list are not automatically authorized to view status or configuration information for allhosts. If you want users able to view status and configuration information for all services as well, youmust add them to the authorized_for_all_services variable. More information on how to setupauthentication and configure authorization for the CGIs can be found here.
Statusmap CGI Background Image
Format: statusmap_background_image=<image_file>
Example: statusmap_background_image=smbackground.gd2
49

This option allows you to specify an image to be used as a background in the statusmap CGI if you usethe user-supplied coordinates layout method. The background image is not be available in any otherlayout methods. It is assumed that the image resides in the HTML images path (i.e./usr/local/nagios/share/images). This path is automatically determined by appending "/images" tothe path specified by the physical_html_path directive. Note: The image file can be in GIF, JPEG, PNG,or GD2 format. However, GD2 format (preferably in uncompressed format) is recommended, as it willreduce the CPU load when the CGI generates the map image.
Default Statusmap Layout Method
Format: default_statusmap_layout=<layout_number>
Example: default_statusmap_layout=4
This option allows you to specify the default layout method used by the statusmap CGI. Valid options are:
<layout_number> Value Layout Method
0 User-defined coordinates
1 Depth layers
2 Collapsed tree
3 Balanced tree
4 Circular
5 Circular (Marked Up)
6 Circular (Balloon)
Statuswrl CGI Include World
Format: statuswrl_include=<vrml_file>
Example: statuswrl_include=myworld.wrl
This option allows you to include your own objects in the generated VRML world. It is assumed that thefile resides in the path specified by the physical_html_path directive. Note: This file must be a fullyqualified VRML world (i.e. you can view it by itself in a VRML browser).
Default Statuswrl Layout Method
Format: default_statuswrl_layout=<layout_number>
Example: default_statuswrl_layout=4
50

This option allows you to specify the default layout method used by the statuswrl CGI. Valid options are:
<layout_number> Value Layout Method
0 User-defined coordinates
2 Collapsed tree
3 Balanced tree
4 Circular
CGI Refresh Rate
Format: refresh_rate=<rate_in_seconds>
Example: refresh_rate=90
This option allows you to specify the number of seconds between page refreshes for the status, statusmap, and extinfo CGIs.
Audio Alerts
Formats: host_unreachable_sound=<sound_file>host_down_sound=<sound_file>service_critical_sound=<sound_file>service_warning_sound=<sound_file>service_unknown_sound=<sound_file>
Examples: host_unreachable_sound=hostu.wavhost_down_sound=hostd.wavservice_critical_sound=critical.wavservice_warning_sound=warning.wavservice_unknown_sound=unknown.wav
These options allow you to specify an audio file that should be played in your browser if there areproblems when you are viewing the status CGI. If there are problems, the audio file for the most criticaltype of problem will be played. The most critical type of problem is on or more unreachable hosts, whilethe least critical is one or more services in an unknown state (see the order in the example above). Audiofiles are assumed to be in the media/ subdirectory in your HTML directory (i.e. /usr/local/nagios/share/media).
Ping Syntax
Format: ping_syntax=<command>
Example: ping_syntax=/bin/ping -n -U -c 5 $HOSTADDRESS$
51

This option determines what syntax should be used when attempting to ping a host from the WAPinterface (using the statuswml CGI. You must include the full path to the ping binary, along with allrequired options. The $HOSTADDRESS$ macro is substituted with the address of the host before thecommand is executed.
52

Authentication And Authorization In The CGIs
Notes
Throughout these instructions I will be assuming that you are running the Apache web server on yourmachine. If you are running some other web server, you will have to make some adjustments.
Definitions
Throughout these instructions I will be using the following terms, so you should understand what they mean...
An authenticated user is an someone who has authenticated to the web server with a username andpassword and has been granted access to the Nagios web interface.
An authenticated contact is an authenticated user whose username matches the short name of acontact definition in your object configuration file(s).
Index
Setting up authenticated usersEnabling authentication/authorization functionality in the CGIsDefault permissions to CGI informationGranting additional permissions to CGI informationAuthentication on secure web servers
Setting Up Authenticated Users
If you haven’t done so already, you’ll need to add the appropriate entries to your web server config fileto enable basic authentication for the CGI and HTML portions of the Nagios web interface. Instructionsfor doing so can be found here.
Now that you’ve configured your web server to require authentication for the Nagios web interface,you’ll need to specify who has access. This is done by using the htpasswd command supplied with Apache.
Running the following command will create a new file called htpasswd.users in the /usr/local/nagios/etcdirectory. It will also create an username/password entry for nagiosadmin. You will be asked to providea password that will be used when nagiosadmin authenticates to the web server.
htpasswd -c /usr/local/nagios/etc/htpasswd.users nagiosadmin
Continue adding more users until you’ve created an account for everyone you want to access the CGIs.Use the following command to add additional users, replacing <username> with the actual usernameyou want to add. Note that the -c option is not used, since you already created the initial file.
htpasswd /usr/local/nagios/etc/htpasswd.users <username>
Okay, so you’re done with the first part of what needs to be done. At this point you should be promptedfor a username and password if you point your web browser to the Nagios web interface. If you haveproblems getting user authentication to work at this point, read your webserver documentation for more info.
53

Enabling Authentication/Authorization Functionality In The CGIs
The next thing you need to do is make sure that the CGIs are configured to use the authentication andauthorization functionality in determining what information and/or commands users have access to.This is done be setting the use_authentication variable in the CGI configuration file to a non-zero value. Example:
use_authentication=1
Okay, you’re now done with setting up basic authentication/authorization functionality in the CGIs.
Default Permissions To CGI Information
So what default permissions do users have in the CGIs by default when theauthentication/authorization functionality is enabled?
CGI Data Authenticated Contacts * Other Authenticated Users *
Host Status Information Yes No
Host Configuration Information Yes No
Host History Yes No
Host Notifications Yes No
Host Commands Yes No
Service Status Information Yes No
Service Configuration Information Yes No
Service History Yes No
Service Notifications Yes No
Service Commands Yes No
All Configuration Information No No
System/Process Information No No
System/Process Commands No No
Authenticated contacts * are granted the following permissions for each service for which they are contacts(but not for services for which they are not contacts)...
Authorization to view service status information
Authorization to view service configuration information
Authorization to view history and notifications for the service
Authorization to issue service commands
Authenticated contacts * are granted the following permissions for each host for which they are contacts(but not for hosts for which they are not contacts)...
Authorization to view host status information
Authorization to view host configuration information
Authorization to view history and notifications for the host
54

Authorization to issue host commands
Authorization to view status information for all services on the host
Authorization to view configuration information for all services on the host
Authorization to view history and notification information for all services on the host
Authorization to issue commands for all services on the host
It is important to note that by default no one is authorized for the following...
Viewing the raw log file via the showlog CGI
Viewing Nagios process information via the extended information CGI
Issuing Nagios process commands via the command CGI
Viewing host group, contact, contact group, time period, and command definitions via the configuration CGI
You will undoubtably want to access this information, so you’ll have to assign additional rights foryourself (and possibly other users) as described below...
Granting Additional Permissions To CGI Information
You can grant authenticated contacts or other authenticated users permission to additional information inthe CGIs by adding them to various authorization variables in the CGI configuration file. I realize thatthe available options don’t allow for getting really specific about particular permissions, but its betterthan nothing..
Additional authorization can be given to users by adding them to the following variables in the CGIconfiguration file...
authorized_for_system_information
authorized_for_system_commands
authorized_for_configuration_information
authorized_for_all_hosts
authorized_for_all_host_commands
authorized_for_all_services
authorized_for_all_service_commands
CGI Authorization Requirements
If you are confused about the authorization needed to access various information in the CGIs, read the Authorization Requirements section for each CGI as described here.
Authentication On Secured Web Servers
If your web server is located in a secure domain (i.e., behind a firewall) or if you are using SSL, you candefine a default username that can be used to access the CGIs. This is done by defining the default_user_name option in the CGI configuration file. By defining a default username that can accessthe CGIs, you can allow users to access the CGIs without necessarily having to authenticate to the webserver.. You may want to use this to avoid having to use basic web authentication, as basicauthentication transmits passwords in clear text over the Internet.
Important: Do not define a default username unless you are running a secure web server and are surethat everyone who has access to the CGIs has been authenticated in some manner! If you define thisvariable, anyone who has not authenticated to the web server will inherit all rights you assign to this user!
55

56

Verifying Your Nagios Configuration
Verifying The Configuration From The Command Line
Once you’ve entered all the necessary data into the configuration files, its time to do a sanity check.Everyone make mistakes from time to time, so its best to verify what you’ve entered. Nagiosautomatically runs a "pre-flight check" before before it starts monitoring, but you also have the option ofrunning this check manually before attempting to start Nagios. In order to do this, you must start Nagioswith the -v command line argument as follows...
/usr/local/nagios/bin/nagios -v <main_config_file>
Note that you should be entering the path/filename of your main configuration file (i.e. /usr/local/nagios/etc/nagios.cfg) as the second argument. Nagios will read your main configuration file andall object configuration files and verify that they contain valid data.
Relationships Verified During The Pre-Flight Check
During the "pre-flight check", Nagios verifies that you have defined the data relationships necessary formonitoring. Objects are all related and need to be setup properly in order for things to run. This is a listof the basic things that Nagios attempts to check before it will start monitoring...
1. Verify that all contacts are a member of at least one contact group.
2. Verify that all contacts specified in each contact group are valid.
3. Verify that all hosts are a member of at least one host group.
4. Verify that all hosts specified in each host group are valid.
5. Verify that all hosts have at least one service associated with them.
6. Verify that all commands used in service and host checks are valid.
7. Verify that all commands used in service and host event handlers are valid.
8. Verify that all commands used in contact service and host notifications are valid.
9. Verify that all notification time periods specified for services, hosts, and contact are valid.
10. Verify that all service check time periods specified for services are valid.
Fixing Configuration Errors
If you’ve forgotten to enter some critical data or just plain screwed things up, Nagios will spit out awarning or error message that should point you to the location of the problem. Error messages generallyprint out the line in the configuration file that seems to be the source of the problem. On errors, Nagioswill often exit the pre-flight check and return to the command prompt after printing only the first errorthat it has encountered. This is done so that one error does not cascade into multiple errors as theremainder of the configuration data is verified. If you get any error messages you’ll need to go and edityour configuration files to remedy the problem. Warning messages can generally be safely ignored, sincethey are only recommendations and not requirements.
Where To Go From Here
Once you’ve verified your configuration files and fixed any errors, you can be reasonably sure thatNagios will start monitoring the services you’ve specified. On to starting Nagios!
57

Starting Nagios
IMPORTANT: Before you actually start Nagios, you’ll have to make sure that you have configured itproperly and verified the config data!
Methods For Starting Nagios
There are basically four different ways you can start Nagios:
1. Manually, as a foreground process (useful for initial testing and debugging)
2. Manually, as a background process
3. Manually, as a daemon
4. Automatically at system boot
Let’s examine each method briefly...
Running Nagios Manually as a Foreground Process
If you enabled the debugging options when running the configure script (and recompiled Nagios), thiswould be your first choice for testing and debugging. Running Nagios as a foreground process at a shellprompt will allow you to more easily view what’s going on in the monitoring and notification processes.To run Nagios as a foreground process for testing, invoke Nagios like this...
/usr/local/nagios/bin/nagios <main_config_file>
Note that you must specify the path/filename of the main configuration file (i.e. /usr/local/nagios/etc/nagios.cfg) on the command line.
To stop Nagios at any time, just press CTRL-C. If you’ve enabled the debugging options you’ll probablywant to redirect the output to a file for easier review later.
Running Nagios Manually as a Background Process
To run Nagios as a background process, invoke it with an ampersand as follows...
/usr/local/nagios/bin/nagios <main_config_file> &
Note that you must specify the path/filename of the main configuration file (i.e. /usr/local/nagios/etc/nagios.cfg) on the command line.
Running Nagios Manually as a Daemon
In order to run Nagios in daemon mode you must supply the -d switch on the command line as follows...
/usr/local/nagios/bin/nagios -d <main_config_file>
Note that you must specify the path/filename of the main configuration file (i.e. /usr/local/nagios/etc/nagios.cfg) on the command line.
Running Nagios Automatically at System Boot
When you have tested Nagios and are reasonably sure that it is not going to crash, you will probablywant to have it start automatically at boot time. To do this (in Linux) you will have to create a startupscript in your /etc/rc.d/init.d/ directory. You will also have to create a link to the script in the runlevel(s)
58

that you wish to have Nagios to start in. I’ll assume that you know what I’m talking about and are ableto do this.
A sample init script (named daemon-init) is created in the base directory of the Nagios distributionwhen you run the configure script. You can install the sample script to your /etc/rc.d/init.d directoryusing the ’make install-init’ command, as outlined in the installation instructions.
The sample init scripts are designed to work under Linux, so if you want to use them under FreeBSD,Solaris, etc. you may have to do a little hacking...
Stopping and Restarting Nagios
Directions on how to stop and restart Nagios can be found here.
59

Stopping And Restarting Nagios
Once you have Nagios up and running, you may need to stop the process or reload the configurationdata "on the fly". This section describes how to do just that.
IMPORTANT: Before you restart Nagios, make sure that you have verified the configuration data usingthe -v command line switch, especially if you have made any changes to your config files. If Nagiosencounters problem with one of the config files when it restarts, it will log an error and terminate.
Stopping And Restarting With The Init Script
If you have installed the sample init script to your /etc/rc.d/init.d directory you can stop and restartNagios easily. If you haven’t, skip this section and read how to do it manually below. I’ll assume thatyou named the init script Nagios in the examples below...
Desired Action Command Description
Stop Nagios /etc/rc.d/init.d/nagios stop This kills the Nagios process
Restart Nagios /etc/rc.d/init.d/nagios restartThis kills the current Nagios process and then startsNagios up again
ReloadConfiguration Data
/etc/rc.d/init.d/nagios reloadSends a SIGHUP to the Nagios process, causing it toflush its current configuration data, reread theconfiguration files, and start monitoring again
Stopping, restarting, and reloading Nagios are fairly simple with an init script and I would highlyrecommend you use one if at all possible.
Stopping and Restarting Nagios Manually
If you aren’t using an init script to start Nagios, you’ll have to do things manually. First you’ll have tofind the process ID that Nagios is running under and then you’ll have to use the kill command toterminate the application or make it reload the configuration data by sending it the proper signal.Directions for doing this are outlined below...
Finding The Nagios Process ID
First off, you will need to know the process id that Nagios is running as. To do that, just type thefollowing command at a shell prompt:
ps axu | grep nagios
The output should look something like this:
nagios 6808 0.0 0.7 840 352 p3 S 13:44 0:00 grep nagiosnagios 11149 0.2 1.0 868 488 ? S Feb 27 6:33 /usr/local/nagios/bin/nagios nagios.cfg
From the program output, you will notice that Nagios was started by user nagios and is running asprocess id 11149.
Manually Stopping Nagios
60

In order to stop Nagios, use the kill command as follows...
kill 11149
You should replace 11149 with the actual process id that Nagios is running as on your machine.
Manually Restarting Nagios
If you have modified the configuration data, you will want to restart Nagios and have it re-read the newconfiguration. If you have changed the source code and recompiled the main Nagios executable youshould not use this method. Instead, stop Nagios by killing it (as outlined above) and restart it manually.Restarting Nagios using the method below does not actually reload Nagios - it just causes Nagios toflush its current configuration, re-read the new configuration, and start monitoring all over again. Torestart Nagios, you need to send the SIGHUP signal to Nagios. Assuming that the process id for Nagiosis 11149 (taken from the example above), use the following command:
kill -HUP 11149
Remember, you will need to replace 11149 with the actual process id that Nagios is running as on your machine.
61

Nagios Plugins
What Are Plugins?
Plugins are compiled executables or scripts (Perl, shell, etc.) that can be run from a command line tocheck the status or a host or service. Nagios uses the results from plugins to determine the current statusor hosts and services on your network. No, you can’t get away without using plugins - Nagios is uselesswithout them.
Obtaining Plugins
Plugin development for Nagios is being done at SourceForge. The Nagios plugin development projectpage (where the latest version of by plugins can always be found) is located at http://sourceforge.net/projects/nagiosplug/.
How Do I Use Plugin X?
Documentation on how to use individual plugins is not supplied with the core Nagios distribution. Youshould refer to the latest plugin distribution for information on using plugins. Karl DeBisschop, leadplugin developer/maintainer points out the following:
All plugins that comply with minimal development guideline for this project include internaldocumentation. The documentation can be read executing plugin with the ’-h’ option (’--help’ iflong options are enabled). If the ’-h’ option does not work, that is a bug.
For example, if you want to know how the check_http plugin works or what options it accepts, youshould try executing one of the following commands:
./check_http --help
or
./check_http -h
Command Definition Examples For Services
It is important to note that command definitions found in sample config files in the core Nagiosdistribution are probably not accurate as to command line parameters, etc when it comes to the plugins.They are simply provided as examples of how to define commands.
Creating Custom Plugins
Creating your own plugins to perform custom host or service checks is easy. You can find informationon how to write plugins at http://sourceforge.net/projects/nagiosplug/. The developer guidelines canbe found at http://nagiosplug.sourceforge.net/developer-guidelines.html.
62

Nagios Addons
Several "addons" are available for Nagios on the Nagios downloads page - http://www.nagios.org/download/.
Addons are available for:
Managing the config files through a web interface
Monitoring remote hosts (*NIX, Windows, etc.)
Submitting passive checks from remote hosts
Simplifying/extending the notification logic
...and much more
63

Determining Status and Reachability of Network Hosts
Monitoring Services on Down or Unreachable Hosts
The main purpose of Nagios is to monitor services that run on or are provided by physical hosts ordevices on your network. It should be obvious that if a host or device on your network goes down, allservices that it offers will also go down with it. Similarly, if a host becomes unreachable, Nagios will notbe able to monitor the services associated with that host.
Nagios recognizes this fact and attempts to check for such a scenario when there are problems with aservice. Whenever a service check results in a non-OK status level, Nagios will attempt to check and seeif the host that the service is running on is "alive". Typically this is done by pinging the host and seeing ifany response is received. If the host check commmand returns a non-OK state, Nagios assumes thatthere is a problem with the host. In this situation Nagios will "silence" all potential alerts for servicesrunning on the host and just notify the appropriate contacts that the host is down or unreachable. If thehost check command returns an OK state, Nagios will recognize that the host is alive and will send outan alert for the service that is misbehaving.
Local Hosts
"Local" hosts are hosts that reside on the same network segment as the host running Nagios - no routersor firewalls lay between them. Figure 1 shows an example network layout. Host A is running Nagiosand monitoring all other hosts and routers depicted in the diagram. Hosts B, C, D, E and F are allconsidered to be "local" hosts in relation to host A.
The <parents> option in the host definition for a "local" host should be left blank, as local hosts have nodepencies or "parents" - that’s why they’re local.
Monitoring Local Hosts
Checking hosts that are on your local network is fairly simple. Short of someone accidentally (orintentially) unplugging the network cable from one of your hosts, there isn’t too much that can go wrongas far as checking network connectivity is concerned. There are no routers or external networks betweenthe host doing the monitoring and the other hosts on the local network.
If Nagios needs to check to see if a local host is "alive" it will simply run the host check command for thathost. If the command returns an OK state, Nagios assumes the host is up. If the command returns anyother status level, Nagios will assume the host is down.
Figure 1.
64

Remote Hosts
"Remote" hosts are hosts that reside on a different network segment than the host running Nagios. In thefigure above, hosts G, H, I, J, K, L and M are all considered to be "remote" hosts in relation to host A.
Notice that some hosts are "farther away" than others. Hosts H, I and J are one hop further away fromhost A than host G (the router) is. From this observation we can construct a host dependency tree asshow below in Figure 2. This tree diagram will help us in deciding how to configure each host in Nagios.
The <parents> option in the host definition for a "remote" host should be the short name(s) of the host(s)directly above it in the tree diagram (as show below). For example, the parent host for host H would behost G. The parent host for host G is host F. Host F has no parent host, since it is on the network segmentas host A - it is a "local" host.
Figure 2.
65
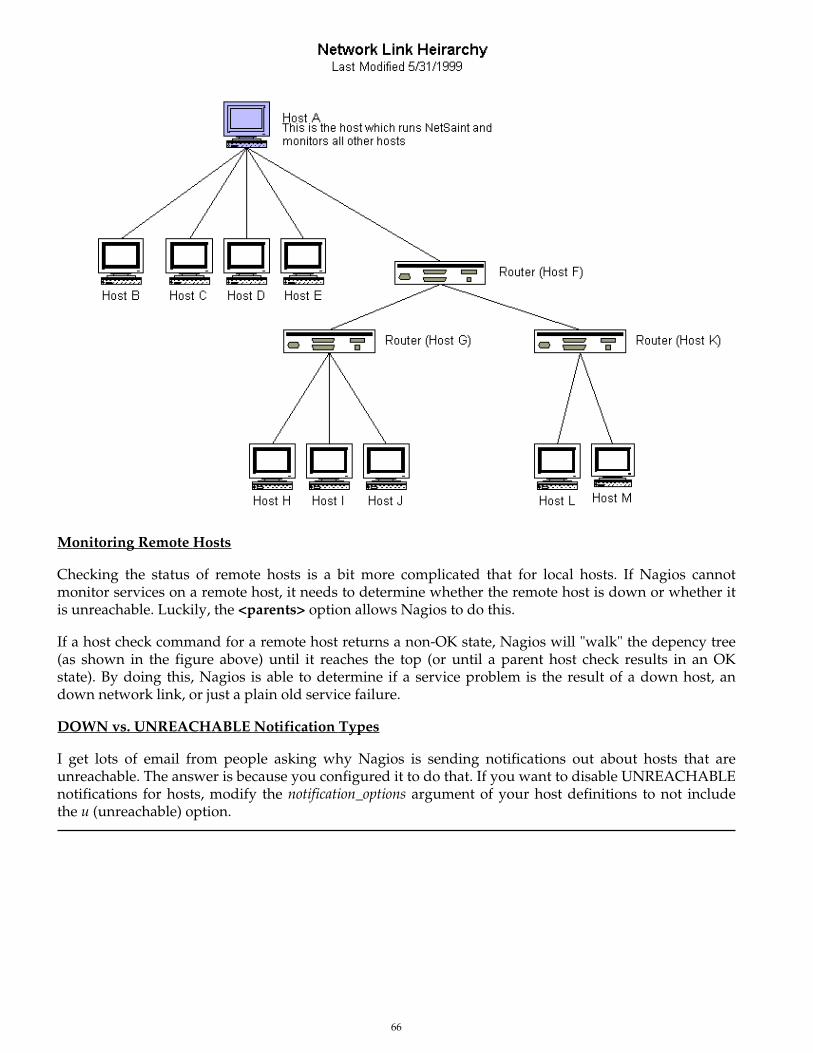
Monitoring Remote Hosts
Checking the status of remote hosts is a bit more complicated that for local hosts. If Nagios cannotmonitor services on a remote host, it needs to determine whether the remote host is down or whether itis unreachable. Luckily, the <parents> option allows Nagios to do this.
If a host check command for a remote host returns a non-OK state, Nagios will "walk" the depency tree(as shown in the figure above) until it reaches the top (or until a parent host check results in an OKstate). By doing this, Nagios is able to determine if a service problem is the result of a down host, andown network link, or just a plain old service failure.
DOWN vs. UNREACHABLE Notification Types
I get lots of email from people asking why Nagios is sending notifications out about hosts that areunreachable. The answer is because you configured it to do that. If you want to disable UNREACHABLEnotifications for hosts, modify the notification_options argument of your host definitions to not includethe u (unreachable) option.
66

Network Outages
Introduction
The outages CGI is designed to help pinpoint the cause of network outages. For small networks this CGImay not be particularly useful, but for larger ones it will be. Pinpointing the cause of outages will helpadmins to more quickly find and resolve problems which are causing the biggest impact on the network.
It should be noted that the outages CGI will not attempt to find the exact cause of the problem, but willrather locate the hosts on your network which seem to be causing the most problems. Delving into theproblem at a deeper level is left to the user, as there are any number of things which might actually bethe cause of the problem.
Diagrams
The diagrams below help to show how the outages CGI goes about determining the cause of networkoutages. You can click on either image for a larger version...
67

Diagram 1
This diagram will serve as the basis for our example. All hosts shows in red are either down or unreachable (from the view of Nagios). All other hosts are up.
Diagram 2
This diagram pinpoints the causes of the network outages (from the view of Nagios), and shows various groups of hosts which are affected by the outages.
68

Determining The Cause Of Network Outages
So how does the outages CGI determine which hosts are the source of problems? "Problem" hosts must beeither in a DOWN or UNREACHABLE state and at least one of their immediate parent hosts must be UP. Hostswhich fit this criteria are flagged as being potential problem hosts.
In order to determine whether these flagged hosts are causing network outages, we must performs someother tests...
If all of the immediate child hosts of one of these flagged hosts is DOWN or UNREACHABLE and has noimmediate parent host that is up, the flagged host is the cause of a network outage. If even one of theimmediate children of a flagged host does not pass this test, then the flagged host is not the cause of anetwork outage.
Determining The Effects Of Network Outages
Along with telling you what hosts are causing problem on your network, the outages CGI will also tellyou how many hosts and services are affected by a particular problem host. How is this determined?Take a look at diagram 2 above...
From the diagram it is clear that host 1 is blocking two child hosts (in domain A). Host 2 is solelyresponsbile for blocking only itself (domain B) and host 3 is solely responsibly for blocking 7 hosts(domain C). The outage effects of the two hosts in domain D are "shared" between hosts 2 and 3, since itis unclear as to which host is actually the cause of the outage. If either host 2 or 3 was UP, the these hostsmight not be blocked.
The numbers of affected hosts for each problem host are as follows (the problem host is also included inthese figures):
Host 1: 3 affected hosts
Host 2: 3 affected hosts
Host 3: 10 affected hosts
Ranking Problems Based On Severity Level
The outages CGI will display all problem hosts, whether they are causing network outages or not.However, the CGI will tell you how many of the problem hosts (if any) are causing network outages.
In order to display the problem hosts in a somewhat useful manner, they are sorted by the severity ofthe effect they are having on the network. The severity level is determined by two things: The number ofhosts which are affected by problem host and the number of services which are affected. Hosts hold ahigher weight than services when it comes to calculating severity. The current code sets this weight ratioat 4:1 (i.e. hosts are 4 times more important than individual services).
Assuming that all hosts in diagram 2 have an equal number of services associated with them, host 3would be ranked as the most severe problem, while hosts 1 and 2 would have the same severity level.
69

Notifications
Introduction
I’ve had a lot of questions as to exactly how notifications work. This will attempt to explain exactly whenand how host and service notifications are sent out, as well as who receives them.
When Do Notifications Occur?
The decision to send out notifications is made in the service check and host check logic. Host and servicenotifications occur in the following instances...
When a hard state change occurs. More information on state types and hard state changes can befound here.
When a host or service remains in a hard non-OK state and the time specified by the <notification_interval> option in the host or service definition has passed since the last notificationwas sent out (for that specified host or service). If you don’t like the idea of recurring notifications,set the <notification_interval> value to 0 - this prevents notifications from getting sent out more thanonce for any given problem.
Who Gets Notified?
Each service definition has a <contact_groups> option that specifies what contact groups receivenotifications for that particular service. Each contact group can contain one or more individual contacts.When Nagios sends out a service notification, it will notify each contact that is a member of any contactgroups specified in the <contactgroups> option of the service definition. Nagios realizes that any givencontact may be a member of more than one contact group, so it removes duplicate contact notificationsbefore it does anything.
Each host definition has a <contact_groups> option that specifies what contact groups receivenotifications for that particular host. When Nagios sends out a host notification, it will notify contactsthat are members of all the contact groups that that should be notified for that host. Nagios removes anyduplicate contacts from the notification list before it does anything.
What Filters Must Be Passed In Order For Notifications To Be Sent?
Just because there is a need to send out a host or service notification doesn’t mean that any contacts aregoing to get notified. There are several filters that potential notifications must pass before they aredeemed worthy enough to be sent out. Even then, specific contacts may not be notified if theirnotification filters do not allow for the notification to be sent to them. Let’s go into the filters that have tobe passed in more detail...
Program-Wide Filter:
The first filter that notifications must pass is a test of whether or not notifications are enabled on aprogram-wide basis. This is initially determined by the enable_notifications directive in the main configfile, but may be changed during runtime from the web interface. If notifications are disabled on aprogram-wide basis, no host or service notifications can be sent out - period. If they are enabled on aprogram-wide basis, there are still other tests that must be passed...
Service and Host Filters:
70

The first filter for host or service notifications is a check to see if the host or service is in a period of scheduled downtime. It it is in a scheduled downtime, no one gets notified. If it isn’t in a period ofdowntime, it gets passed on to the next filter. As a side note, notifications for services are suppressed ifthe host they’re associated with is in a period of scheduled downtime.
The second filter for host or service notification is a check to see if the host or service is flapping (if youenabled flap detection). If the service or host is currently flapping, no one gets notified. Otherwise itgets passed to the next filter.
The third host or service filter that must be passed is the host- or service-specific notification options.Each service definition contains options that determine whether or not notifications can be sent out forwarning states, critical states, and recoveries. Similiarly, each host definition contains options thatdetermine whether or not notifications can be sent out when the host goes down, becomes unreachable,or recovers. If the host or service notification does not pass these options, no one gets notified. If it doespass these options, the notification gets passed to the next filter... Note: Notifications about host orservice recoveries are only sent out if a notification was sent out for the original problem. It doesn’t makesense to get a recovery notification for something you never knew was a problem.
The fourth host or service filter that must be passed is the time period test. Each host and servicedefinition has a <notification_period> option that specifies which time period contains valid notificationtimes for the host or service. If the time that the notification is being made does not fall within a validtime range in the specified time period, no one gets contacted. If it falls within a valid time range, thenotification gets passed to the next filter... Note: If the time period filter is not passed, Nagios willreschedule the next notification for the host or service (if its in a non-OK state) for the next valid timepresent in the time period. This helps ensure that contacts are notified of problems as soon as possiblewhen the next valid time in time period arrives.
The last set of host or service filters is conditional upon two things: (1) a notification was already sentout about a problem with the host or service at some point in the past and (2) the host or service hasremained in the same non-OK state that it was when the last notification went out. If these two criteriaare met, then Nagios will check and make sure the time that has passed since the last notification wentout either meets or exceeds the value specified by the <notification_interval> option in the host or servicedefinition. If not enough time has passed since the last notification, no one gets contacted. If eitherenough time has passed since the last notification or the two criteria for this filter were not met, thenotification will be sent out! Whether or not it actually is sent to individual contacts is up to another setof filters...
Contact Filters:
At this point the notification has passed the program mode filter and all host or service filters andNagios starts to notify all the people it should. Does this mean that each contact is going to receive thenotification? No! Each contact has their own set of filters that the notification must pass before theyreceive it. Note: Contact filters are specific to each contact and do not affect whether or not other contactsreceive notifications.
The first filter that must be passed for each contact are the notification options. Each contact definitioncontains options that determine whether or not service notifications can be sent out for warning states,critical states, and recoveries. Each contact definition also contains options that determine whether ornot host notifications can be sent out when the host goes down, becomes unreachable, or recovers. If thehost or service notification does not pass these options, the contact will not be notified. If it does passthese options, the notification gets passed to the next filter... Note: Notifications about host or servicerecoveries are only sent out if a notification was sent out for the original problem. It doesn’t make senseto get a recovery notification for something you never knew was a problem...
71

The last filter that must be passed for each contact is the time period test. Each contact definition has a <notification_period> option that specifies which time period contains valid notification times for thecontact. If the time that the notification is being made does not fall within a valid time range in thespecified time period, the contact will not be notified. If it falls within a valid time range, the contactgets notified!
What Aren’t Any Notification Methods Incorporated Directly Into Nagios?
I’ve gotten several questions about why notification methods (paging, etc.) are not directly incorporatedinto the Nagios code. The answer is simple - it just doesn’t make much sense. The "core" of Nagios is notdesigned to be an all-in-one application. If service checks were embedded in Nagios’ core it would bevery difficult for users to add new check methods, modify existing checks, etc. Notifications work in asimiliar manner. There are a thousand different ways to do notifications and there are already a lot ofpackages out there that handle the dirty work, so why re-invent the wheel and limit yourself to a biketire? Its much easier to let an external entity (i.e. a simple script or a full-blown messaging system) do themessy stuff. Some messaging packages that can handle notifications for pagers and cellphones are listedbelow in the resource section.
Notification Type Macro
When crafting your notification commands, you need to take into account what type of notification isoccurring. The $NOTIFICATIONTYPE$ macro contains a string that identifies exactly that. The tablebelow lists the possible values for the macro and their respective descriptions:
Value Description
PROBLEM
A service or host has just entered (or is still in) a problem state. If this is aservice notification, it means the service is either in a WARNING,UNKNOWN or CRITICAL state. If this is a host notification, it means thehost is in a DOWN or UNREACHABLE state.
RECOVERYA service or host recovery has occurred. If this is a service notification, itmeans the service has just returned to an OK state. If it is a host notification,it means the host has just returned to an UP state.
ACKNOWLEDGEMENTThis notification is an acknowledgement notification for a host or serviceproblem. Acknowledgement notifications are initiated via the web interfaceby contacts for the particular host or service.
FLAPPINGSTART The host or service has just started flapping.
FLAPPINGSTOP The host or service has just stopped flapping.
Helpful Resources
There are many ways you could configure Nagios to send notifications out. Its up to you to decidewhich method(s) you want to use. Once you do that you’ll have to install any necessary software andconfigure notification commands in your config files before you can use them. Here are just a fewpossible notification methods:
Pager
Phone (SMS)
WinPopup message
Yahoo, ICQ, or MSN instant message
72

Audio alerts
etc...
Basically anything you can do from a command line can be tailored for use as a notification command.
If you’re interested in sending an alphanumeric notification to your pager or cellphone via email, youmay be find the following information useful. Here are a few links to various messaging serviceproviders’ websites that contain information on how to send alphanumeric messages to pagers and phones...
Cigular
PageNet
SprintPCS (SMS phones)
If you’re looking for an alternative to using email for sending messages to your pager or cellphone,check out these packages. They could be used in conjuction with Nagios to send out a notification via amodem when a problem arises. That way you don’t have to rely on email to send notifications out(remember, email may *not* work if there are network problems). I haven’t actually tried these packagesmyself, but others have reported success using them...
Gnokii (SMS software for contacting Nokia phones via GSM network)
QuickPage (alphanumeric pager software)
Sendpage (paging software)
SMS Client (command line utility for sending messages to pagers and mobile phones)
If you want to try out a non-traditional method of notification, you might want to mess around withaudio alerts. If you want to have audio alerts played on the monitoring server (with synthesized speech),check out Festival. If you’d rather leave the monitoring box alone and have audio alerts played onanother box, check out the Network Audio System (NAS) and rplay projects.
Lastly, there in an area in the contrib downloads section on the Nagios homepage for notification scriptsthat have been contributed by users. You might find these scripts useful, as they take care of a lot of thedirty work needed to send out alphanumeric notifications...
73

Plugin Theory
Introduction
Unlike many other monitoring tools, Nagios does not include any internal mechanisms for checking thestatus of services, hosts, etc. Instead, Nagios relies on external programs (called plugins) to do the all thedirty work. Nagios will execute a plugin whenever there is a need to check a service or host that is beingmonitored. The plugin does something (notice the very general term) to perform the check and thensimply returns the results to Nagios. Nagios will process the results that it receives from the plugin andtake any necessary actions (running event handlers, sending out notifications, etc).
The image below show how plugins are separated fromt the core program logic in Nagios. Nagiosexecutes the plugins which then check local or remote resources or services of some type. When theplugins have finished checking the resource or service, they simply pass the results of the check back toNagios for processing. A more complex diagram on how plugins work can be found in thedocumentation on passive service checks.
The Upside
The good thing about the plugin architecture is that you can monitor just about anything you can thinkof. If you can automate the process of checking something, you can monitor it with Nagios. There arealready a lot of plugins that have been created in order to monitor basic resources such as processorload, disk usage, ping rates, etc. If you want to monitor something else, take a look at the documentationon writing plugins and roll your own. Its simple!
The Downside
The only real downside to the plugin architecture is the fact that Nagios has absolutely no idea what it isthat you’re monitoring. You could be monitoring network traffic statistics, data error rates, roomtemperate, CPU voltage, fan speed, processor load, disk space, or the ability of your super-fantastictoaster to properly brown your bread in the morning... As such, Nagios cannot produce graphs ofchanges to the exact values of resources you’re monitoring over time. It can only track changes in the state of those resources. Only the plugins themselves know exactly what they’re monitoring and how toperform checks. However, plugins can return optional performance data along with status information.This performance data can then be passed on to external applications which could produce graphs ofservice-specific information (i.e. disk space usage, processor load, etc.). More information onperformance data can be found here.
74

Using Plugins For Service Checks
The correlation between plugins and service checks should be fairly obvious. When Nagios needs tocheck the status of a particular service that you have defined, it will execute the plugin you specified inthe <check_command> argument of the service definition. The plugin will check the status of the serviceor resource you specify and return the results to Nagios.
Using Plugins For Host Checks
Using plugins to check the status of hosts may be a bit more difficult to understand. In each hostdefinition you use the <host_check_command> argument to specify a plugin that should be executed tocheck the status of the host. Host checks are not performed on a regular basis - they are executed only asneeded, usually when there are problems with one or more services that are associated with the host.
Host checks can use the same plugins as service checks. The only real difference between the two typesof checks is in the interpretation of the plugin results. If a plugin that is used for a host check results in anon-OK status, Nagios will believe that the host is down.
In most situations, you’ll want to use a plugin which checks to see if the host can be pinged, as this is themost common method of telling whether or not a host is up. However, if you were monitoring somekind of super-fantastic toaster, you might want to use a plugin that would check to see if the heatingelements turned on when the handle was pushed down. That would give a decent indication as towhether or not the toaster was "alive".
75

Service Check Scheduling
Index
IntroductionConfiguration optionsInitial schedulingInter-check delayService interleavingMax concurrent service checksTime restraintsNormal schedulingScheduling during problemsHost checksScheduling delaysScheduling exampleService definition options that affect scheduling
Introduction
I’ve gotten a lot of questions regarding how service checks are scheduled in certain situations, alongwith how the scheduling differs from when the checks are actually executed and their results areprocessed. I’ll try to go into a little more detail on how this all works...
Configuration Options
Before we begin, there are several configuration options that affect how service checks are scheduled,executed, and processed. For starters, each service definition contains three options that determine whenand how each specific service check is scheduled and executed. Those three options include:
normal_check_interval
retry_check_interval
check_period
There are also four configuration options in the main configuration file that affect service checks. These include:
service_inter_check_delay_method
service_interleave_factor
max_concurrent_checks
service_reaper_frequency
We’ll go into more detail on how all these options affect service check scheduling as we progress. Firstoff, let’s see how services are initially scheduled when Nagios first starts or restarts...
Initial Scheduling
When Nagios (re)starts, it will attempt to schedule the initial check of all services in a manner that willminimize the load imposed on the local and remote hosts. This is done by spacing the initial servicechecks out, as well as interleaving them. The spacing of service checks (also known as the inter-checkdelay) is used to minimize/equalize the load on the local host running Nagios and the interleaving isused to minimize/equalize load imposed on remote hosts. Both the inter-check delay and interleavefunctions are discussed below.
76

Even though service checks are initially scheduled to balance the load on both the local and remotehosts, things will eventually give in to the ensuing chaos and be a bit random. Reasons for this includethe fact that services are not all checked at the same interval, some services take longer to execute thanothers, host and/or service problems can alter the timing of one or more service checks, etc. At least wetry to get things off to a good start. Hopefully the initial scheduling will keep the load on the local andremote hosts fairly balanced as time goes by...
Note: If you want to view the initial service check scheduling information, start Nagios using the -scommand line option. Doing so will display basic scheduling information (inter-check delay, interleavefactor, first and last service check time, etc) and will create a new status log that shows the exact timethat all services are initially scheduled. Because this option will overwrite the status log, you should notuse it when another copy of Nagios is running. Nagios does not start monitoring anything when thisargument is used.
Inter-Check Delay
As mentioned before, Nagios attempts to equalize the load placed on the machine that is running Nagiosby equally spacing out initial service checks. The spacing between consecutive service checks is calledthe inter-check delay. By giving a value to the service_inter_check_delay_method variable in the mainconfig file, you can modify how this delay is calculated. I will discuss how the "smart" calculation works,as this is the setting you will want to use for normal operation.
When using the "smart" setting of the service_inter_check_delay_method variable, Nagios will calculate aninter-check delay value by using the following calculation:
inter-check delay = (average check interval for all services) / (total number of services)
Let’s take an example. Say you have 1,000 services that each have a normal check interval of 5 minutes (obviouslysome services are going to be checked at different intervals, but let’s look at an easy case...). The total check interaltime for all services is 5,000 (1,000 * 5). That means that the average check interval for each service is 5 minutes(5,000 / 1,000). Give that information, we realize that (on average) we need to re-check 1,000 services every 5minutes. This means that we should use an inter-check delay of 0.005 minutes (0.3 seconds) when spacing out theinitial service checks. By spacing each service check out by 0.3 seconds, we can somewhat guarantee that Nagios isscheduling and/or executing 3 new service checks every second. By spacing the checks out evenly over time likethis, we can hope that the load on the local server that is running Nagios remains somewhat balanced.
Service Interleaving
As discussed above, the inter-check delay helps to equalize the load that Nagios imposes on the local host. Whatabout remote hosts? Is it necessary to equalize load on remote hosts? Why? Yes, it is important and yes, Nagioscan help out with this. Equalizing load on remote hosts is especially important with the advent of service check parallelization. If you monitor a large number of services on a remote host and the checks were not spread out, theremote host might think that it was the victim of a SYN attack if there were a lot of open connections on the sameport. Plus, attempting to equalize the load on hosts is just a nice thing to do...
By giving a value to the service_interleave_factor variable in the main config file, you can modify how theinterleave factor is calculated. I will discuss how the "smart" calculation works, as this will probably be the settingyou will want to use for normal operation. You can, however, use a pre-set interleave factor instead of havingNagios calculate one for you. Also of note, if you use an interleave factor of 1, service check interleaving is basically disabled.
When using the "smart" setting of the service_interleave_factor variable, Nagios will calculate an interleave factorby using the following calculation:
77

interleave factor = ceil ( total number of services / total number of hosts )
Let’s take an example. Say you have a total of 1,000 services and 150 hosts that you monitor. Nagios wouldcalculate the interleave factor to be 7. This means that when Nagios schedules initial service checks it will schedulethe first one it finds, skip the next 6, schedule the next one, and so on... This process will keep repeating until allservice checks have been scheduled. Since services are sorted (and thus scheduled) by the name of the host they areassociated with, this will help with minimizing/equalizing the load placed upon remote hosts.
The images below depict how service checks are scheduled when they are not interleaved (service_interleave_factor=1) and when they are interleaved with the service_interleave_factor variable equal to 4.
Non-Interleaved Checks: Interleaved Checks:
Maximum Concurrent Service Checks
In order to prevent Nagios from consuming all of your CPU resources, you can restrict the maximum number ofconcurrent service checks that can be running at any given time. This is controlled by using the max_concurrent_checks option in the main config file.
The good thing about this setting is that you can regulate Nagios’ CPU usage. The down side is that service checksmay fall behind if this value is set too low. When it comes time to execute a service check, Nagios will make surethat no more than x service checks are either being executed or waiting to have their results processed (where x isthe number of checks you specified for the max_concurrent_checks option). If that limit has been reached, Nagioswill postpone the execution of any pending checks until some of the previous checks have completed. So how doesone determine a reasonable value for the max_concurrent_checks option?
First off, you need to know the following things...
The inter-check delay that Nagios uses to initially schedule service checks (use the -s command line argumentto check this)
The frequency (in seconds) of service reaper events, as specified by the service_reaper_frequency variable in the
78

main config file.
A general idea of the average time that service checks actually take to execute (most plugins timeout after 10seconds, so the average is probably going to be lower)
Next, use the following calculation to determine a reasonable value for the maximum number of concurrent checksthat are allowed...
max. concurrent checks = ceil( max( service reaper frequency , average check execution time ) / inter-check delay )
The calculated number should provide a reasonable starting point for the max_concurrent_checks variable. Youmay have to increase this value a bit if service checks are still falling behind schedule or decrease it if Nagios ishogging too much CPU time.
Let’s say you are monitoring 875 services, each with an average check interval of 2 minutes. That means that yourinter-check delay is going to be 0.137 seconds. If you set the service reaper frequency to be 10 seconds, you cancalculate a rough value for the max. number of concurrent checks as follows (I’ll assume that the average executiontime for service checks is less than 10 seconds) ...
max. concurrent checks = ceil( 10 / 0.137 )
In this case, the calculated value is going to be 73. This makes sense because (on average) Nagios are going to beexecuting just over 7 new service checks per second and it only processes service check results every 10 seconds.That means at given time there will be a just over 70 service checks that are either being executed or waiting tohave their results processed. In this case, I would probably recommend bumping the max. concurrent checks valueup to 80, since there will be delays when Nagios processes service check results and does its other work. Obviously,you’re going to have test and tweak things a bit to get everything running smoothly on your system, but hopefullythis provided some general guidelines...
Time Restraints
The check_period option determines the time period during which Nagios can run checks of the service. Regardlessof what status a particular service is in, if the time that it is actually executed is not a vaid time within the timeperiod that has been specified, the check will not be executed. Instead, Nagios will reschedule the service check forthe next valid time in the time period. If the check can be run (e.g. the time is valid within the time period), theservice check is executed.
Note: Even though a service check may not be able to be executed at a given time, Nagios may still schedule it to berun at that time. This is most likely to happen during the initial scheduling of services, although it may happen inother instances as well. This does not mean that Nagios will execute the check! When it comes time to actually execute a service check, Nagios will verify that the check can be run at the current time. If it cannot, Nagios willnot execute the service check, but will instead just reschedule it for a later time. Don’t let this one throw youconfuse you! The scheduling and execution of service checks are two distinctly different (although related) things.
Normal Scheduling
In an ideal world you wouldn’t have network problems. But if that were the case, you wouldn’t need a networkmonitoring tool. Anyway, when things are running smoothly and a service is in an OK state, we’ll call that"normal". Service checks are normally scheduled at the frequency specified by the check_interval option. That’s it.Simple, huh?
Scheduling During Problems
So what happens when there are problems with a service? Well, one of the things that happens is the service checkscheduling changes. If you’ve configured the max_attempts option of the service definition to be something greaterthan 1, Nagios will recheck the service before deciding that a real problem exists. While the service is beingrechecked (up to max_attempts times) it is considered to be in a "soft" state (as described here) and the service
79

checks are rescheduled at a frequency determined by the retry_interval option.
If Nagios rechecks the service max_attempts times and it is still in a non-OK state, Nagios will put the service intoa "hard" state, send out notifications to contacts (if applicable), and start rescheduling future checks of the serviceat a frequency determined by the check_interval option.
As always, there are exceptions to the rules. When a service check results in a non-OK state, Nagios will check thehost that the service is associated with to determine whether or not is up (see the note below for info on how this isdone). If the host is not up (i.e. it is either down or unreachable), Nagios will immediately put the service into ahard non-OK state and it will reset the current attempt number to 1. Since the service is in a hard non-OK state,the service check will be rescheduled at the normal frequency specified by the check_interval option instead of the retry_interval option.
Host Checks
Unlike service checks, host checks are not scheduled on a regular basis. Instead they are run on demand, as Nagiossees a need. This is a common question asked by users, so it needs to be clarified.
One instance where Nagios checks the status of a host is when a service check results in a non-OK status. Nagioschecks the host to decide whether or not the host is up, down, or unreachable. If the first host check returns anon-OK state, Nagios will keep pounding out checks of the host until either (a) the maximum number of hostchecks (specified by the max_attempts option in the host definition) is reached or (b) a host check results in an OK state.
Also of note - when Nagios is check the status of a host, it holds off on doing anything else (executing new servicechecks, processing other service check results, etc). This can slow things down a bit and cause pending servicechecks to be delayed for a while, but it is necessary to determine the status of the host before Nagios can take anyfurther action on the service(s) that are having problems.
Scheduling Delays
It should be noted that service check scheduling and execution is done on a best effort basis. Individual servicechecks are considered to be low priority events in Nagios, so they can get delayed if high priority events need to beexecuted. Examples of high priority events include log file rotations, external command checks, and service reaperevents. Additionally, host checks will slow down the execution and processing of service checks.
Scheduling Example
The scheduling of service checks, their execution, and the processing of their results can be a bit difficult tounderstand, so let’s look at a simple example. Look at the diagram below - I’ll refer to it as I explain how things are done.
Image 5.
80

First off, the Xn events are service reaper events that are scheduled at a frequency specified by the
service_reaper_frequency option in the main config file. Service reaper events do the work of gathering andprocessing service check results. They serve as the core logic for Nagios, kicking off host checks, event handlers andnotifications as necessary.
For the example here, a service has been scheduled to be executed at time A. However, Nagios got behind in itsevent queue, so the check was not actually executed until time B. The service check finished executing at time C, sothe difference between points C and B is the actual amount of time that the check was running.
The results of the service check are not processed immediately after the check is done executing. Instead, the resultsare saved for later processing by a service reaper event. The next service reaper event occurs at time D, so that isapproximately the time that the results are processed (the actual time may be later than D since other service checkresults may be processed before this one).
At the time that the service reaper event processes the service check results, it will reschedule the next service checkand place it into Nagios’ event queue. We’ll assume that the service check resulted in an OK status, so the nextcheck at time E is scheduled after the originally scheduled check time by a length of time specified by the check_interval option. Note that the service is not rescheduled based off the time that it was actually executed!There is one exception to this (isn’t there always?) - if the time that the service check is actually executed (point B)occurs after the next service check time (point E), Nagios will compensate by adjusting the next check time. This isdone to ensure that Nagios doesn’t go nuts trying to keep up with service checks if it comes under heavy load.Besides, what’s the point of scheduling something in the past...?
Service Definition Options That Affect Scheduling
Each service definition contains a normal_check_interval and retry_check_interval option. Hopefully this willclarify what these two options do, how they relate to the max_check_attempts option in the service definition, andhow they affect the scheduling of the service.
First off, the normal_check_interval option is the interval at which the service is checked under "normal"circumstances. "Normal" circumstances mean whenever the service is in an OK state or when its in a hardnon-OK state.
When a service first changes from an OK state to a non-OK state, Nagios gives you the ability to temporarily slowdown or speed up the interval at which subsequent checks of that service will occur. When the service first changesstate, Nagios will perform up to max_check_attempts-1 retries of the service check before it decides its a realproblem. While the service is being retried, it is scheduled according to the retry_check_interval option, whichmight be faster or slower than the normal normal_check_interval option. While the service is being rechecked (up to max_check_attempts-1 times), the service is in a soft state. If the service is rechecked max_check_attempts-1 timesand it is still in a non-OK state, the service turns into a hard state and is subsequently rescheduled at the normalrate specified by the check_interval option.
On a side note, it you specify a value of 1 for the max_check_attempts option, the service will not ever be checked atthe interval specified by the retry_check_interval option. Instead, it immediately turns into a hard state and issubsequently rescheduled at the rate specified by the normal_check_interval option.
81

State Types
Introduction
The current state of services and hosts is determined by two components: the status of the service or host(i.e. OK, WARNING, UP, DOWN, etc.) and the type of state it is in. There are two state types in Nagios -"soft" states and "hard" states. State types are a crucial part of Nagios’ monitoring logic. They are used todetermine when event handlers are executed and when notifications are sent out.
Service and Host Check Retries
In order to prevent false alarms, Nagios allows you to define how many times a service or host checkwill be retried before the service or host is considered to have a real problem. The maximum number ofretries before a service or host check is considered to have a real problem is controlled by the <max_check)attempts> option in the service and host definitions, respectively. Depending on whatattempt a service or host check is currently on determines what type of state it is is. There are a fewexceptions to this in the service monitoring logic, but we’ll ignore those for now. Let’s take a look at thedifferent service state types...
Soft States
Soft states occur for services and hosts in the following situations...
When a service or host check results in a non-OK state and it has not yet been (re)checked thenumber of times specified by the <max_check_attempts> option in the service or host definition. Let’scall this a soft error state...
When a service or host recovers from a soft error state. This is considered to be a soft recovery.
Soft State Events
What happens when a service or host is in a soft error state or experiences a soft recovery?
The soft error or recovery is logged if you enabled the log_service_retries or log_host_retries optionsin the main configuration file.
Event handlers are executed (if you defined any) to handle the soft error or recovery for the serviceor host. (Before any event handler is executed, the $HOSTSTATETYPE$ or $SERVICESTATETYPE$ macro is set to "SOFT").
Nagios does not send out notifications to any contacts because there is (or was) no "real" problemwith the service or host.
As can be seen, the only important thing that really happens during a soft state is the execution of eventhandlers. Using event handlers can be particularly useful if you want to try and proactively fix aproblem before it turns into a hard state. More information on event handlers can be found here.
Hard States
Hard states occur for services in the following situations (hard host states are discussed later)...
When a service check results in a non-OK state and it has been (re)checked the number of timesspecified by the <max_check_attempts> option in the service definition. This is a hard error state.
When a service recovers from a hard error state. This is considered to be a hard recovery.
When a service check results in a non-OK state and its corresponding host is either DOWN orUNREACHABLE. This is an exception to the general monitoring logic, but makes perfect sense. Ifthe host isn’t up why should we try and recheck the service?
82

Hard states occur for hosts in the following situations...
When a host check results in a non-OK state and it has been (re)checked the number of timesspecified by the <max_check_attempts> option in the host definition. This is a hard error state.
When a host recovers from a hard error state. This is considered to be a hard recovery.
Hard State Changes
Before I discuss what happens when a host or service is in a hard state, you need to know about hardstate changes. Hard state changes occur when a service or host...
changes from a hard OK state to a hard non-OK state
changes from a hard non-OK state to a hard OK-state
changes from a hard non-OK state of some kind to a hard non-OK state of another kind (i.e. from ahard WARNING state to a hard UNKNOWN state)
Hard State Events
What happens when a service or host is in a hard error state or experiences a hard recovery? Well, thatdepends on whether or not a hard state change (as described above) has occurred.
If a hard state change has occurred and the service or host is in a non-OK state the following things will occur..
The hard service or host problem is logged.
Event handlers are executed (if you defined any) to handle the hard problem for the service or host.(Before any event handler is executed, the $HOSTSTATETYPE$ or $SERVICESTATETYPE$ macrois set to "HARD").
Contacts will be notified of the service or host problem (if the notification logic allows it).
If a hard state change has occurred and the service or host is in an OK state the following things will occur..
The hard service or host recovery is logged.
Event handlers are executed (if you defined any) to handle the hard recovery for the service or host.(Before any event handler is executed, the $HOSTSTATETYPE$ or $SERVICESTATETYPE$ macrois set to "HARD").
Contacts will be notified of the service or host recovery (if the notification logic allows it).
If a hard state change has NOT occurred and the service or host is in a non-OK state the following thingswill occur..
Contacts will be re-notified of the service or host problem (if the notification logic allows it).
If a hard state change has NOT occurred and the service or host is in an OK state nothing happens. Thisis because the service or host is in an OK state and was the last time it was checked as well.
83

Time Periodsor...
"Is This a Good Time?"
Introduction
Time periods allow you to have greater control over when service checks may be run, when host andservice notifications may be sent out, and when contacts may receive notifications. With this newlyadded power come some potential problems, as I will describe later. I was initially very hesitant tointroduce time periods because of these snafus. I’ll leave it up to you to decide what it right for yourparticular situation...
How Time Periods Work With Service Checks
Without the implementation of time periods, Nagios would monitor all services that you had defined 24hours a day, 7 days a week. While this is fine for most services that need monitoring, it doesn’t work outso well for others. For instance, do you really need to monitor printers all the time when they’re reallyonly used during normal business hours? Perhaps you have development servers which you wouldprefer to have up, but aren’t "mission critical" and therefore don’t have to be monitored for problemsover the weekend. Time period definitions now allow you to have more control over when such servicesmay be checked...
The <check_period> argument of each service definition allows you to specify a time period that tellsNagios when the service can be checked. When Nagios attempts to reschedule a service check, it willmake sure that the next check falls within a valid time range within the defined time period. If it doesn’t,Nagios will adjust the next service check time to coincide with the next "valid" time in the specified timeperiod. This means that the service may not get checked again for another hour, day, or week, etc.
Potential Problems With Service Checks
If you use time periods which do not cover a 24x7 range, you will run into problems, especially if aservice (or its corresponding host) is down when the check is delayed until the next valid time in thetime period. Here are some of those problems...
1. Contacts will not get re-notified of problems with a service until the next service check can be run.
2. If a service recovers during a time that has been excluded from the check period, contacts will not benotified of the recovery.
3. The status of the service will appear unchanged (in the status log and CGI) until it can be checkednext.
4. If all services associated with a particular host are on the same check time period, host problems orrecoveries will not be recognized until one of the services can be checked (and thereforenotifications may be delayed or not get sent out at all).
Limiting the service check period to anything other than a 24 hour a day, 7 days a week basis can cause alot of problems. Well, not really problems so much as annoyances and inaccuracies... Unless you havegood reason to do so, I would strongly suggest that you set the <check_period> argument of each servicedefinition to a "24x7" type of time period.
How Time Periods Work With Contact Notifications
Probably the best use of time periods is to control when notifications can be sent out to contacts. Byusing the <service_notification_period> and <host_notification_period> arguments in contact definitions,you’re able to essentially define an "on call" period for each contact. Note that you can specify different
84

time periods for host and service notifications. This is helpful if you want host notifications to go out tothe contact any day of the week, but only have service notifications get sent to the contact on weekdays.It should be noted that these two notification periods should cover any time that the contact can benotified. You can control notification times for specific services and hosts on a one-by-one basis as follows...
By setting the <notification_period> argument of the host definition, you can control when Nagios isallowed to send notifications out regarding problems or recoveries for that host. When a hostnotification is about to get sent out, Nagios will make sure that the current time is within a valid range inthe <notification_period> time period. If it is a valid time, then Nagios will attempt to notify each contactof the host problem. Some contacts may not receive the host notification if their <host_notification_period>does not allow for host notifications at that time. If the time is not valid within the <notification_period>defined for the host, Nagios will not send the notification out to any contacts.
You can control notification times for services in a similiar manner to host notification times. By settingthe <notification_period> argument of the service definition, you can control when Nagios is allowed tosend notifications out regarding problems or recoveries for that service. When a service notification isabout to get sent out, Nagios will make sure that the current time is within a valid range in the <notification_period> time period. If it is a valid time, then Nagios will attempt to notify each contact ofthe service problem. Some contacts may not receive the service notification if their <svc_notification_period> does not allow for service notifications at that time. If the time is not validwithin the <notification_period> defined for the service, Nagios will not send the notification out to any contacts.
Potential Problems With Contact Notifications
There aren’t really any major problems that you’ll run into with using time periods to create customcontact notification times. You do, however, need to be aware that contacts may not always be notifiedof a service or host problem or recovery. If the time isn’t right for both the host or service notificationperiod and the contact notification period, the notification won’t go through. Once you weigh thepotential problems of time-restricted notifications against your needs, you should be able to come upwith a configuration that works well for your situation.
Conclusion
Time periods allow you to have greater control of how Nagios performs its monitoring and notificationfunctions, but can lead to problems. If you are unsure of what type of time periods to implement, or ifyou are having problems with your current implementation, I would suggest using "24x7" time periods(where all times are valid for each day of the week). Feel free to contact me if you have questions or arerunning into problems.
85

Event Handlers
Introduction
Event handlers are optional commands that are executed whenever a host or service state change occurs.An obvious use for event handlers (especially with services) is the ability for Nagios to proactively fixproblems before anyone is notified. Another potential use for event handlers might be to log service orhost events to an external database.
Event Handler Types
There are two main types of event handlers than can be defined - service event handlers and host eventhandlers. Event handler commands are (optionally) defined in each host and service definition. Becausethese event handlers are only associated with particular services or hosts, I will call these "local" eventhandlers. If a local event handler has been defined for a service or host, it will be executed when thathost or service changes state.
You may also specify global event handlers that should be run for every host or service state change byusing the global_host_event_handler and global_service_event_handler options in your mainconfiguration file. Global event handlers are run immediately prior to running a local service or hostevent handler.
When Are Event Handler Commands Executed?
Service and host event handler commands are executed when a service or host:
is in a "soft" error state
initially goes into a "hard" error state
recovers from a "soft" or "hard" error state
What are "soft" and "hard" states you ask? They are described here .
Event Handler Execution Order
Global event handlers are executed before any local event handlers that you have configured for specifichosts or services.
Writing Event Handler Commands
In most cases, event handler commands will be shell or perl scripts. At a minimum, the scripts shouldtake the following macros as arguments:
Service event handler macros: $SERVICESTATE$, $SERVICESTATETYPE$, $SERVICEATTEMPT$Host event handler macros: $HOSTSTATE$, $HOSTSTATETYPE$, $HOSTATTEMPT$
The scripts should examine the values of the arguments passed in and take any necessary action basedupon those values. The best way to understand how event handlers should work is to see and example.Lucky for you, one is provided below. There are also some sample event handler scripts included in the eventhandlers/ subdirectory of the Nagios distribution. Some of these sample scripts demonstrate theuse of external commands to implement redundant monitoring hosts.
Permissions For Event Handler Commands
86

Any event handler commands you configure will execute with the same permissions as the user underwhich Nagios is running on your machine. This presents a problem with scripts that attempt to restartsystem services, as root privileges are generally required to do these sorts of tasks.
Ideally you should evaluate the types of event handlers you will be implementing and grant just enoughpermissions to the Nagios user for executing the necessary system commands. You might want to tryusing sudo to accomplish this. Implementation of this is your job, so read the docs and decide if its whatyou need.
Debugging Event Handler Commands
When you are debugging event handler commands, I would highly recommend that you enable loggingof service retries, host retries, and event handler commands. All of these logging options are configuredin the main configuration file. Enabling logging for these options will allow you to see exactly when andwhy event handler commands are being executed.
When you’re done debugging your event handler commands you’ll probably want to disable logging ofservice and host retries. They can fill up your log file fast, but if you have enabled log rotation you mightnot care.
Service Event Handler Example
The example below assumes that you are monitoring the HTTP server on the local machine and havespecified restart-httpd as the event handler command for the HTTP service definition. Also, I will beassuming that you have set the <max_check_attempts> option for the service to be a value of 4 or greater(i.e. the service is checked 4 times before it is considered to have a real problem). An example servicedefinition (w/ only the fields we discuss) might look like this...
define service{ host_name somehost service_description HTTP max_check_attempts 4 event_handler restart-httpd ...other service variables... }
Once the service has been defined with an event handler, we must define that event handler as acommand. Notice the macros in the command line that I am passing to the event handler - these are important!
define command{ command_name restart-httpd command_line /usr/local/nagios/libexec/eventhandlers/restart-httpd $SERVICESTATE$ $SERVICESTATETYPE$ $SERVICEATTEMPT$ }
Now, let’s actually write the event handler script (this is the /usr/local/nagios/libexec/eventhandlers/restart-httpd file).
87

#!/bin/sh## Event handler script for restarting the web server on the local machine## Note: This script will only restart the web server if the service is# retried 3 times (in a "soft" state) or if the web service somehow# manages to fall into a "hard" error state.#
# What state is the HTTP service in?case "$1" inOK) # The service just came back up, so don’t do anything... ;;WARNING) # We don’t really care about warning states, since the service is probably still running... ;;UNKNOWN) # We don’t know what might be causing an unknown error, so don’t do anything... ;;CRITICAL) # Aha! The HTTP service appears to have a problem - perhaps we should restart the server...
# Is this a "soft" or a "hard" state? case "$2" in # We’re in a "soft" state, meaning that Nagios is in the middle of retrying the # check before it turns into a "hard" state and contacts get notified... SOFT) # What check attempt are we on? We don’t want to restart the web server on the first # check, because it may just be a fluke! case "$3" in # Wait until the check has been tried 3 times before restarting the web server. # If the check fails on the 4th time (after we restart the web server), the state # type will turn to "hard" and contacts will be notified of the problem. # Hopefully this will restart the web server successfully, so the 4th check will # result in a "soft" recovery. If that happens no one gets notified because we # fixed the problem! 3) echo -n "Restarting HTTP service (3rd soft critical state)..." # Call the init script to restart the HTTPD server /etc/rc.d/init.d/httpd restart ;; esac ;; # The HTTP service somehow managed to turn into a hard error without getting fixed. # It should have been restarted by the code above, but for some reason it didn’t. # Let’s give it one last try, shall we? # Note: Contacts have already been notified of a problem with the service at this # point (unless you disabled notifications for this service) HARD) echo -n "Restarting HTTP service..." # Call the init script to restart the HTTPD server /etc/rc.d/init.d/httpd restart ;; esac ;;esacexit 0
The sample script provided above will attempt to restart the web server on the local machine in twodifferent instances - after the HTTP service is being retried for the 3rd time (in an "soft" error state) andafter the service falls into a "hard" state. The "hard" state situation shouldn’t really occur, since the scriptshould restart the service when its still in a "soft" state (i.e. the 3rd check retry), but its left as a fallback anyway.
It should be noted that the service event handler will only be execute the first time that the service fallsinto a "hard" state. This will prevent Nagios from continuously executing the script to restart the webserver when it is in a "hard" state.
88

89

External Commands
Introduction
Nagios can process commands from external applications (including CGIs - see the command CGI for anexample) and alter various aspects of its monitoring functions based on the commands it receives.
Enabling External Commands
By default, Nagios does not check for or process any external commands. If you want to enable externalcommand processing, you’ll have to do the following...
Enable external command checking with the check_external_commands option
Set the frequency of command checks with the command_check_interval option
Specify the location of the command file with the command_file option. Its best to put the externalcommand file in its own directory (i.e. /usr/local/nagios/var/rw).
Setup proper permissions on the directory containing the external command file. Details on how todo this can be found here.
When Does Nagios Check For External Commands?
At regular intervals specified by the command_check_interval option in the main configuration file
Immediately after event handlers are executed. This is in addtion to the regular cycle of externalcommand checks and is done to provide immediate action if an event handler submits commands to Nagios.
Using External Commands
External commands can be used to accomplish a variety of things while Nagios is running. Example ofwhat can be done include temporarily disabling notifications for services and hosts, temporarilydisabling service checks, forcing immediate service checks, adding comments to hosts and services, etc.
Command Format
External commands that are written to the command file have the following format...
[time] command_id;command_arguments
...where time is the time (in time_t format) that the external application or CGI committed the externalcommand to the command file. Some of the commands that are available are described in the tablebelow, along with their command_id and a description of their command_arguments.
Implemented Commands
A full listing of external commands that can be used (along with examples of how to use them) can befound online at the following URL:
http://www.nagios.org/developerinfo/externalcommands/
90

Indirect Host and Service Checks
Introduction
Chances are, many of the services that you’re going to be monitoring on your network can be checkeddirectly by using a plugin on the host that runs Nagios. Examples of services that can be checked directlyinclude availability of web, email, and FTP servers. These services can be checked directly by a pluginfrom the Nagios host because they are publicly accessible resources. However, there are a number ofthings you may be interested in monitoring that are not as publicly accessible as other services. These"private" resources/services include things like disk usage, processor load, etc. on remote machines.Private resources like these cannot be checked without the use of an intermediary agent. Service checkswhich require an intermediary agent of some kind to actually perform the check are called indirect checks.
Indirect checks are useful for:
Monitoring "local" resources (such as disk usage, processer load, etc.) on remote hosts
Monitoring services and hosts behind firewalls
Obtaining more realistic results from checks of time-sensitive services between remote hosts (i.e.ping response times between two remote hosts)
There are several methods for performing indirect active checks (passive checks are not discussed here),but I will only talk about how they can be done by using the nrpe addon.
Indirect Service Checks
The diagram below shows how indirect service checks work. Click the image for a larger version...
91

Multiple Indirected Service Checks
If you are monitoring servers that lie behind a firewall (and the host running Nagios is outside thatfirewall), checking services on those machines can prove to be a bit of a pain. Chances are that you areblocking most incoming traffic that would normally be required to perform the monitoring. Onesolution for performing active checks (passive checks could also be used) on the hosts behind thefirewall would be to poke a tiny hold in the firewall filters that allow the Nagios host to make calls to the
92

nrpe daemon on one host inside the firewall. The host inside the firewall could then be used as anintermediary in performing checks on the other servers inside the firewall.
The diagram below show how multiple indirect service checks work. Notice how the nrpe daemon isrunning on hosts #1 and #2. The copy that runs on host #2 is used to allow the nrpe agent on host #1 toperform a check of a "private" service on host #2. "Private" services are things like process load, diskusage, etc. that are not directly exposed like SMTP, FTP, and web services. Click on the diagram for alarger image...
93

94

Indirect Host Checks
Indirect host checks work on the same principle as indirect service checks. Basically, the plugin used inthe host check command asks an intermediary agent (i.e. a daemon running on a remote host) toperform the host check for it. Indirect host checks are useful when the remote hosts being monitored arelocated behind a firewall and you want to restrict inbound monitoring traffic to a particular machine.That machine (remote host #1 in the diagram below) performs will perform the host check and returnthe results back to the top level check_nrpe plugin (on the central server). It should be noted that with thissetup comes potential problems. If remote host #1 goes down, the check_nrpe plugin will not be able tocontact the nrpe daemon and Nagios will believe that remote hosts #2, #3, and #4 are down, even thoughthis may not be the case. If host #1 is your firewall machine, then the problem isn’t really an issuebecause Nagios will detect that it is down and mark hosts #2, #3, and #4 as being unreachable.
The diagram below shows how an indirect host check can be performed by using the nrpe daemon and check_nrpe plugin. Click the image for a larger version.
95

96

Passive Host and Service Checks
Introduction
On of the features of Nagios is that is can process host and service check results that are submitted byexternal applications. Host and service checks which are performed and submitted to Nagios by externalapps are called passive checks. Passive checks can be contrasted with active checks, which are host orservice checks that have been initiated by Nagios.
Why The Need For Passive Checks?
Passive checks are useful for monitoring services that are:
located behind a firewall, and can therefore not be checked actively from the host running Nagios
asynchronous in nature and can therefore not be actively checked in a reliable manner (e.g. SNMPtraps, security alerts, etc.)
Passive host and service checks are also useful when configured a distributed monitoring setup.
Passive Service Checks vs. Passive Host Checks
Passive host and service checks function in a similiar manner, but there are some important limitationsin regards to passive host checks. Read below for more information about the limitations with passivehost checks.
How Do Passive Service Checks Work?
The only real difference between active and passive checks is that active checks are initiated by Nagios,while passive checks are performed by external applications. Once an external application hasperformed a service check (either actively or by having received an synchronous event like an SNMPtrap or security alert), it submits the results of the service "check" to Nagios through the externalcommand file.
The next time Nagios processes the contents of the external command file, it will place the results of allpassive service checks into a queue for later processing. The same queue that is used for storing resultsfrom active checks is also used to store the results from passive checks.
Nagios will periodically execute a service reaper event and scan the service check result queue. Eachservice check result, regardless of whether the check was active or passive, is processed in the samemanner. The service check logic is exactly the same for both types of checks. This provides a seamlessmethod for handling both active and passive service check results.
How Do External Apps Submit Service Check Results?
External applications can submit service check results to Nagios by writing aPROCESS_SERVICE_CHECK_RESULT external command to the external command file.
The format of the command is as follows:
[<timestamp>] PROCESS_SERVICE_CHECK_RESULT;<host_name>;<description>;<return_code>;<plugin_output>
where...
97

timestamp is the time in time_t format (seconds since the UNIX epoch) that the service check wasperfomed (or submitted). Please note the single space after the right bracket.
host_name is the short name of the host associated with the service in the service definition
description is the description of the service as specified in the service definition
return_code is the return code of the check (0=OK, 1=WARNING, 2=CRITICAL, 3=UNKNOWN)
plugin_output is the text output of the service check (i.e. the plugin output)
Note that in order to submit service checks to Nagios, a service must have already been defined in the object configuration file! Nagios will ignore all check results for services that had not been configuredbefore it was last (re)started.
If you only want passive results to be provided for a specific service (i.e. active checks should not beperformed), simply set the active_checks_enabled member of the service definition to 0. This will preventNagios from ever actively performing a check of the service. Make sure that the passive_checks_enabledmember of the service definition is set to 1. If it isn’t, Nagios won’t process passive checks for the service!
An example shell script of how to submit passive service check results to Nagios can be found in thedocumentation on volatile services.
Submitting Passive Service Check Results From Remote Hosts
If an application that resides on the same host as Nagios is sending passive service check results, it cansimply write the results directly to the external command file as outlined above. However, applicationson remote hosts can’t do this so easily. In order to allow remote hosts to send passive service checkresults to the host that runs Nagios, I’ve developed the nsca addon. The addon consists of a daemon thatruns on the Nagios hosts and a client that is executed from remote hosts. The daemon will listen forconnections from remote clients, perform some basic validation on the results being submitted, and thenwrite the check results directly into the external command file (as described above). More informationon the nsca addon can be found here...
Using Both Active And Passive Service Checks
Unless you’re implementing a distributed monitoring environment with the central server acceptingonly passive service checks (and not performing any active checks), you’ll probably be using both typesof checks in your setup. As mentioned before, active checks are more suited for services that lendthemselves to periodic checks (availability of an FTP or web server, etc), whereas passive checks arebetter off at handling asynchronous events that occur at variable intervals (security alerts, etc.).
The image below gives a visual representation of how active and passive service checks can both be usedto monitor network resources (click on the image for a larger version).
The orange bubbles on the right side of the image are third-party applications that submit passive checkresults to Nagios’ external command file. One of the applications resides on the same host as Nagios, soit can write directly to the command file. The other application resides on a remote host and makes usedof the nsca client program and daemon to transfer the passive check results to Nagios.
The items on the left side of the image represent active service checks that Nagios is performing. I’veshown how the checks can be made for local resources (disk usage, etc.), "exposed" resources on remotehosts (web server, FTP server, etc.), and "private" resources on remote hosts (remote host disk usage,processor load, etc.). In this example, the private resources on the remote hosts are actually checked bymaking use of the nrpe addon, which facilitates the execution of plugins on remote hosts.
98

How Do Passive Host Checks Work?
Passive host checks work in a similiar manner to passive service checks. Once an external applicationhas performed a host check, it submits the results of that host "check" to Nagios through the externalcommand file. The next time Nagios processes the contents of the external command file, it will processthe host check result that was submitted.
99

WARNING! Passive host checks have some limitations. Unlike active host checks, Nagios does notattempt to determine whether or host is DOWN or UNREACHABLE with passive checks. Rather,Nagios takes the passive check result to be the actual state the host is in and doesn’t try to determine theactual state. In contrast, Nagios attempts to determine the proper status (DOWN or UNREACHABLE)for hosts that are not UP when the host check is active (initiated by Nagios). This can cause problems ifyou are submitting passive checks from a remote host or you have a distributed monitoring setup wherethe parent/child host relationships are different. See the documentation on host reachability for moreinformation on how DOWN and UNREACHABLE states are determined for active host checks.
How Do External Apps Submit Host Check Results?
External applications can submit host check results to Nagios by writing aPROCESS_HOST_CHECK_RESULT external command to the external command file.
The format of the command is as follows:
[<timestamp>] PROCESS_HOST_CHECK_RESULT;<host_name>;<host_status>;<plugin_output>
where...
timestamp is the time in time_t format (seconds since the UNIX epoch) that the host check wasperfomed (or submitted). Please note the single space after the right bracket.
host_name is the short name of the host (as defined in the host definition)
host_status is the status of the host (0=UP, 1=DOWN, 2=UNREACHABLE)
plugin_output is the text output of the host check
Note that in order to submit host checks to Nagios, a host must have already been defined in the objectconfiguration file! Nagios will ignore all check results for hosts that had not been configured before itwas last (re)started.
Submitting Passive Host Check Results From Remote Hosts
If an application that resides on the same host as Nagios is sending passive service check results, it cansimply write the results directly to the external command file as outlined above. However, applicationson remote hosts can’t do this so easily. In order to allow remote hosts to send passive host check resultsto the host that runs Nagios, you can use the nsca addon. The addon consists of a daemon that runs onthe Nagios hosts and a client that is executed from remote hosts. The daemon will listen for connectionsfrom remote clients, perform some basic validation on the results being submitted, and then write thecheck results directly into the external command file (as described above). More information on the nscaaddon can be found here.
100

Volatile Services
Introduction
Nagios has the ability to distinguish between "normal" services and "volatile" services. The is_volatileoption in each service definition allows you to specify whether a specific service is volatile or not. Formost people, the majority of all monitored services will be non-volatile (i.e. "normal"). However, volatileservices can be very useful when used properly...
What Are They Useful For?
Volatile services are useful for monitoring...
things that automatically reset themselves to an "OK" state each time they are checked
events such as security alerts which require attention every time there is a problem (and not just thefirst time)
What’s So Special About Volatile Services?
Volatile services differ from "normal" services in three important ways. Each time they are checked whenthey are in a hard non-OK state, and the check returns a non-OK state (i.e. no state change has occurred)...
the non-OK service state is logged
contacts are notified about the problem (if that’s what should be done)
the event handler for the service is run (if one has been defined)
These events normally only occur for services when they are in a non-OK state and a hard state changehas just occurred. In other words, they only happen the first time that a service goes into a non-OK state.If future checks of the service result in the same non-OK state, no hard state change occurs and none ofthe events mentioned take place again.
The Power Of Two
If you combine the features of volatile services and passive service checks, you can do some very usefulthings. Examples of this include handling SNMP traps, security alerts, etc.
How about an example... Let’s say you’re running PortSentry to detect port scans on your machine andautomatically firewall potential intruders. If you want to let Nagios know about port scans, you coulddo the following..
In Nagios:
Configure a service called Port Scans and associate it with the host that PortSentry is running on.
Set the max_check_attempts option in the service definition to 1. This will tell Nagios to immediateforce the service into a hard state when a non-OK state is reported.
Either set the active_checks_enabled option to 0 or set the check_time option in the service definition toa timeperiod that contains no valid time ranges. Doing either of these will prevent Nagios from everactively checking the service. Even though the service check will get scheduled, it will neveractually be checked.
In PortSentry:
101

Edit your PortSentry configuration file (portsentry.conf), define a command for the KILL_RUN_CMD directive as follows:KILL_RUN_CMD="/usr/local/Nagios/libexec/eventhandlers/submit_check_result <host_name>’Port Scans’ 2 ’Port scan from host $TARGET$ on port $PORT$. Host has been firewalled.’" Make sure to replace <host_name> with the short name of the host that the service is associated with.
Create a shell script in the /usr/local/nagios/libexec/eventhandlers directory named submit_check_result. Thecontents of the shell script should be something similiar to the following...
#!/bin/sh # Write a command to the Nagios command file to cause # it to process a service check result echocmd="/bin/echo" CommandFile="/usr/local/nagios/var/rw/nagios.cmd" # get the current date/time in seconds since UNIX epoch datetime=‘date +%s‘ # create the command line to add to the command file cmdline="[$datetime] PROCESS_SERVICE_CHECK_RESULT;$1;$2;$3;$4" # append the command to the end of the command file ‘$echocmd $cmdline >> $CommandFile‘
Note that if you are running PortSentry as root, you will have to make additions to the script to reset fileownership and permissions so that Nagios and the CGIs can read/modify the command file.
So what happens when PortSentry detects a port scan on the machine?
It blocks the host (this is a function of the PortSentry software)
It executes the submit_check_result shell script to send the security alert info to Nagios
Nagios reads the command file, recognized the port scan entry as a passive service check
Nagios processes the results of the service by logging the CRITICAL state, sending notifications tocontacts (if configured to do so), and executes the event handler for the Port Scans service (if one is defined)
102

Service and Host Result Freshness Checks
Introduction
Nagios supports a feature that does "freshness" checking on the results of host and service checks. Thisfeature is useful when you want to ensure that passive checks are being received as frequently as youwant. Although freshness checking can be used in a number of situations, it is primarily useful whenattempting to configure a distributed monitoring environment.
The purpose of "freshness" checking is to ensure that host and service checks are being providedpassively by external applications on a regular basis. If the results of a particular host or service check(for which freshness checking has been enabled) is determined to be "stale", Nagios will force an activecheck of that host or service.
Host vs. Service Freshness Checking
The documentation below discusses service freshness checking. Host freshness checking (which is notdocumented seperately) works in a similiar way to service freshness checking - except, of course, that itsfor hosts instead of services. If you need to configure host freshness checking, adjust the directions givenbelow appropriately.
Configuring Service Freshness Checking
Before you configure per-service freshness threshold, you must enable freshness checking using the check_service_freshness and service_freshness_check_interval directives in the main config file. If youwere configuring host freshness checking, you would use the check_host_freshness and host_freshness_check_interval directives.
So how do you go about enabling freshness checking for a particular service? You need to configure service definitions as follows.
The check_freshness option in the service definition should be set to 1. This enables "freshness"checking for the service.
The freshness_threshold option in the service definition should be set to a value (in seconds) whichreflects how "fresh" the results for the service should be.
The check_command option in the service definition should reflect valid command that should beused to actively check the service when it is detected as being "stale".
The normal_check_interval option in the service definition needs to be greater than zero (0) if the freshness_threshold option is setup to zero (0).
The check_period option in the service definitions needs to be set to a valid timeperiod. The timesallowed by the specified timeperiod determine when freshness checks can be performed for the service.
How The Freshness Threshold Works
Nagios periodically checks the "freshness" of the results for all services that have freshness checkingenabled. The freshness_threshold option in each service definition is used to determine how "fresh" theresults for each service should be. For example, if you set the freshness_threshold option to 60 for one ofyour services, Nagios will consider that service to be "stale" if its results are older than 60 seconds (1minute). If you do not specify a value for the freshness_threshold option (or you set it to zero), Nagios willautomatically calculate a "freshness" threshold to use by looking at either the normal_check_interval or retry_check_interval options (depending on what type of state the service is currently in).
103

What Happens When A Service Check Result Becomes "Stale"
If the check results of a service are found to be "stale" (as described above), Nagios will force an activecheck of the service by executing the command specified by the check_command option in the servicedefinition. It is important to note that an active service check which is being forced because the servicewas detected as being "stale" gets executed even if active service checks are disabled on a program-wide orservice-specific basis.
Working With Passive-Only Checks
As I mentioned earlier, freshness checking is of most use when you are dealing with services that gettheir results from passive checks. More often than not (as in the case with distributed monitoring setups), these services may not be getting all of their results from passive checks - no results are obtainedfrom active checks.
An example of a passive-only service might be one that reports the status of your nightly backup jobs.Perhaps you have a external script that submit the results of the backup job to Nagios once the backup iscompleted. In this case, all of the checks/results for the service are provided by an external applicationusing passive checks. In order to ensure that the status of the backup job gets reported every day, youmay want to enable freshness checking for the service. If the external script doesn’t submit the results ofthe backup job, you can have Nagios fake a critical result by doing something like this...
Here’s what the definition for the service might look like (some required options are omitted)...
define service{ host_name backup-server service_description ArcServe Backup Job active_checks_enabled 0 ; active checks are NOT enabled passive_checks_enabled 1 ; passive checks are enabled (this is how results are reported) check_freshness 1 freshness_threshold 93600 ; 26 hour threshold, since backups may not always finish at the same time check_command no-backup-report ; this command is run only if the service results are "stale" ...other options... }
Notice that active checks are disabled for the service. This is because the results for the service are onlymade by an external application using passive checks. Freshness checking is enabled and the freshnessthreshold has been set to 26 hours. This is a bit longer than 24 hours because backup jobs sometimes runlate from day to day (depending on how much data there is to backup, how much network traffic ispresent, etc.). The no-backup-report command is executed only if the results of the service are determinedto be "stale". The definition of the no-backup-report command might look like this...
define command{ command_name no-backup-report command_line /usr/local/nagios/libexec/nobackupreport.sh }
The nobackupreport.sh script in your /usr/local/nagios/libexec directory might look something like this:
#!/bin/sh
/bin/echo "CRITICAL: Results of backup job were not reported!"
exit 2
If Nagios detects that the service results are stale, it will run the no-backup-report command as an activeservice check (even though active checks are disabled for this specific service - remember that this is aspecial case). This causes the /usr/local/nagios/libexec/nobackupreport.sh script to be executed, which returnsa critical state. The service go into to a critical state (if it isn’t already there) and someone will probablyget notified of the problem.
104

105

Distributed Monitoring
Introduction
Nagios can be configured to support distributed monitoring of network services and resources. I’ll try tobriefly explan how this can be accomplished...
Goals
The goal in the distributed monitoring environment that I will describe is to offload the overhead (CPUusage, etc.) of performing service checks from a "central" server onto one or more "distributed" servers.Most small to medium sized shops will not have a real need for setting up such an environment.However, when you want to start monitoring hundreds or even thousands of hosts (and several timesthat many services) using Nagios, this becomes quite important.
Reference Diagram
The diagram below should help give you a general idea of how distributed monitoring works withNagios. I’ll be referring to the items shown in the diagram as I explain things...
106

Central Server vs. Distributed Servers
When setting up a distributed monitoring environment with Nagios, there are differences in the way thecentral and distributed servers are configured. I’ll show you how to configure both types of servers andexplain what effects the changes being made have on the overall monitoring. For starters, lets describe
107

the purpose of the different types of servers...
The function of a distributed server is to actively perform checks all the services you define for a "cluster"of hosts. I use the term "cluster" loosely - it basically just mean an arbitrary group of hosts on yournetwork. Depending on your network layout, you may have several cluters at one physical location, oreach cluster may be separated by a WAN, its own firewall, etc. The important thing to remember to thatfor each cluster of hosts (however you define that), there is one distributed server that runs Nagios andmonitors the services on the hosts in the cluster. A distributed server is usually a bare-bones installationof Nagios. It doesn’t have to have the web interface installed, send out notifications, run event handlerscripts, or do anything other than execute service checks if you don’t want it to. More detailedinformation on configuring a distributed server comes later...
The purpose of the central server is to simply listen for service check results from one or more distributedservers. Even though services are occassionally actively checked from the central server, the activechecks are only performed in dire circumstances, so lets just say that the central server only acceptspassive check for now. Since the central server is obtaining passive service check results from one ormore distributed servers, it serves as the focal point for all monitoring logic (i.e. it sends outnotifications, runs event handler scripts, determines host states, has the web interface installed, etc).
Obtaining Service Check Information From Distributed Monitors
Okay, before we go jumping into configuration detail we need to know how to send the service checkresults from the distributed servers to the central server. I’ve already discussed how to submit passivecheck results to Nagios from same host that Nagios is running on (as described in the documentation on passive checks), but I haven’t given any info on how to submit passive check results from other hosts.
In order to facilitate the submission of passive check results to a remote host, I’ve written the nsca addon. The addon consists of two pieces. The first is a client program (send_nsca) which is run from aremote host and is used to send the service check results to another server. The second piece is the nscadaemon (nsca) which either runs as a standalone daemon or under inetd and listens for connectionsfrom client programs. Upon receiving service check information from a client, the daemon will sumbitthe check information to Nagios (on the central server) by inserting a PROCESS_SVC_CHECK_RESULTcommand into the external command file, along with the check results. The next time Nagios checks for external commands, it will find the passive service check information that was sent from the distributedserver and process it. Easy, huh?
Distributed Server Configuration
So how exactly is Nagios configured on a distributed server? Basically, its just a bare-bones installation.You don’t need to install the web interface or have notifications sent out from the server, as this will allbe handled by the central server.
Key configuration changes:
Only those services and hosts which are being monitored directly by the distributed server aredefined in the object configuration file.
The distributed server has its enable_notifications directive set to 0. This will prevent anynotifications from being sent out by the server.
The distributed server is configured to obsess over services.
The distributed server has an ocsp command defined (as described below).
In order to make everything come together and work properly, we want the distributed server to reportthe results of all service checks to Nagios. We could use event handlers to report changes in the state of aservice, but that just doesn’t cut it. In order to force the distributed server to report all service checkresults, you must enabled the obsess_over_services option in the main configuration file and provide a
108

ocsp_command to be run after every service check. We will use the ocsp command to send the results ofall service checks to the central server, making use of the send_nsca client and nsca daemon (asdescribed above) to handle the tranmission.
In order to accomplish this, you’ll need to define an ocsp command like this:
ocsp_command=submit_check_result
The command definition for the submit_check_result command looks something like this:
define command{ command_name submit_check_result command_line /usr/local/nagios/libexec/eventhandlers/submit_check_result $HOSTNAME$ ’$SERVICEDESC$’ $SERVICESTATE$ ’$SERVICEOUTPUT$’ }
The submit_check_result shell scripts looks something like this (replace central_server with the IP addressof the central server):
#!/bin/sh
# Arguments: # $1 = host_name (Short name of host that the service is # associated with) # $2 = svc_description (Description of the service) # $3 = state_string (A string representing the status of # the given service - "OK", "WARNING", "CRITICAL" # or "UNKNOWN") # $4 = plugin_output (A text string that should be used # as the plugin output for the service checks) #
# Convert the state string to the corresponding return code return_code=-1
case "$3" in OK) return_code=0 ;; WARNING) return_code=1 ;; CRITICAL) return_code=2 ;; UNKNOWN) return_code=-1 ;; esac
# pipe the service check info into the send_nsca program, which # in turn transmits the data to the nsca daemon on the central # monitoring server
/bin/printf "%s\t%s\t%s\t%s\n" "$1" "$2" "$return_code" "$4" | /usr/local/nagios/bin/send_nsca central_server -c /usr/local/nagios/etc/send_nsca.cfg
The script above assumes that you have the send_nsca program and it configuration file (send_nsca.cfg)located in the /usr/local/nagios/bin/ and /usr/local/nagios/etc/ directories, respectively.
That’s it! We’ve sucessfully configured a remote host running Nagios to act as a distributed monitoringserver. Let’s go over exactly what happens with the distributed server and how it sends service checkresults to Nagios (the steps outlined below correspond to the numbers in the reference diagram above):
1. After the distributed server finishes executing a service check, it executes the command you definedby the ocsp_command variable. In our example, this is the /usr/local/nagios/libexec/eventhandlers/submit_check_result script. Note that the definition for the submit_check_result command passed four pieces of information to the script: the name of the hostthe service is associated with, the service description, the return code from the service check, andthe plugin output from the service check.
2. The submit_check_result script pipes the service check information (host name, description, returncode, and output) to the send_nsca client program.
3. The send_nsca program transmits the service check information to the nsca daemon on the centralmonitoring server.
4. The nsca daemon on the central server takes the service check information and writes it to theexternal command file for later pickup by Nagios.
5. The Nagios process on the central server reads the external command file and processes the passive
109

service check information that originated from the distributed monitoring server.
Central Server Configuration
We’ve looked at hot distributed monitoring servers should be configured, so let’s turn to the centralserver. For all intensive purposes, the central is configured as you would normally configure astandalone server. It is setup as follows:
The central server has the web interface installed (optional, but recommended)
The central server has its enable_notifications directive set to 1. This will enable notifications.(optional, but recommended)
The central server has active service checks disabled (optional, but recommended - see notes below)
The central server has external command checks enabled (required)
The central server has passive service checks enabled (required)
There are three other very important things that you need to keep in mind when configuring the central server:
The central server must have service definitions for all services that are being monitored by all thedistributed servers. Nagios will ignore passive check results if they do not correspond to a servicethat has been defined.
If you’re only using the central server to process services whose results are going to be provided bydistributed hosts, you can simply disable all active service checks on a program-wide basis bysetting the execute_service_checks directive to 0. If you’re using the central server to activelymonitor a few services on its own (without the aid of distributed servers), the enable_active_checksoption of the defintions for service being monitored by distributed servers should be set to 0. Thiswill prevent Nagios from actively checking those services.
It is important that you either disable all service checks on a program-wide basis or disable the enable_active_checks option in the definitions for each service that is monitored by a distributed server.This will ensure that active service checks are never executed under normal circumstances. The serviceswill keep getting rescheduled at their normal check intervals (3 minutes, 5 minutes, etc...), but the won’tactually be executed. This rescheduling loop will just continue all the while Nagios is running. I’llexplain why this is done in a bit...
That’s it! Easy, huh?
Problems With Passive Checks
For all intensive purposes we can say that the central server is relying solely on passive checks formonitoring. The main problem with relying completely on passive checks for monitoring is the fact thatNagios must rely on something else to provide the monitoring data. What if the remote host that issending in passive check results goes down or becomes unreachable? If Nagios isn’t actively checkingthe services on the host, how will it know that there is a problem?
Fortunately, there is a way we can handle these types of problems...
Freshness Checking
Nagios supports a feature that does "freshness" checking on the results of service checks. Moreinformation freshness checking can be found here. This features gives some protection against situationswhere remote hosts may stop sending passive service checks into the central monitoring server. Thepurpose of "freshness" checking is to ensure that service checks are either being provided passively bydistributed servers on a regular basis or performed actively by the central server if the need arises. If theservice check results provided by the distributed servers get "stale", Nagios can be configured to force
110

active checks of the service from the central monitoring host.
So how do you do this? On the central monitoring server you need to configure services that are beingmonitoring by distributed servers as follows...
The check_freshness option in the service definitions should be set to 1. This enables "freshness"checking for the services.
The freshness_threshold option in the service definitions should be set to a value (in seconds) whichreflects how "fresh" the results for the services (provided by the distributed servers) should be.
The check_command option in the service definitions should reflect valid commands that can be usedto actively check the service from the central monitoring server.
Nagios periodically checks the "freshness" of the results for all services that have freshness checkingenabled. The freshness_threshold option in each service definition is used to determine how "fresh" theresults for each service should be. For example, if you set this value to 300 for one of your services,Nagios will consider the service results to be "stale" if they’re older than 5 minutes (300 seconds). If youdo not specify a value for the freshness_threshold option, Nagios will automatically calculate a "freshness"threshold by looking at either the normal_check_interval or retry_check_interval options (depending onwhat type of state the service is in). If the service results are found to be "stale", Nagios will run theservice check command specified by the check_command option in the service definition, thereby activelychecking the service.
Remember that you have to specify a check_command option in the service definitions that can be used toactively check the status of the service from the central monitoring server. Under normal circumstances,this check command is never executed (because active checks were disabled on a program-wide basis orfor the specific services). When freshness checking is enabled, Nagios will run this command to activelycheck the status of the service even if active checks are disabled on a program-wide or service-specific basis.
If you are unable to define commands to actively check a service from the central monitoring host (or ifturns out to be a major pain), you could simply define all your services with the check_command optionset to run a dummy script that returns a critical status. Here’s an example... Let’s assume you define acommand called ’service-is-stale’ and use that command name in the check_command option of yourservices. Here’s what the definition would look like...
define command{ command_name service-is-stale command_line /usr/local/nagios/libexec/staleservice.sh }
The staleservice.sh script in your /usr/local/nagios/libexec directory might look something like this:
#!/bin/sh
/bin/echo "CRITICAL: Service results are stale!"
exit 2
When Nagios detects that the service results are stale and runs the service-is-stale command, the /usr/local/nagios/libexec/staleservice.sh script is executed and the service will go into a critical state. Thiswould likely cause notifications to be sent out, so you’ll know that there’s a problem.
Performing Host Checks
At this point you know how to obtain service check results passivly from distributed servers. This meansthat the central server is not actively checking services on its own. But what about host checks? You stillneed to do them, so how?
111

Since host checks usually compromise a small part of monitoring activity (they aren’t done unlessabsolutely necessary), I’d recommend that you perform host checks actively from the central server. Thatmeans that you define host checks on the central server the same way that you do on the distributedservers (and the same way you would in a normal, non-distributed setup).
Passive host checks are available (read here), so you could use them in your distributed monitoringsetup, but they suffer from a few problems. The biggest problem is that Nagios does not translatepassive host check problem states (DOWN and UNREACHABLE) when they are processed. This meansthat if your monitoring servers have a different parent/child host structure (and they will, if youmonitoring servers are in different locations), the central monitoring server will have an inaccurate viewof host states.
If you do want to send passive host checks to a central server in your distributed monitoring setup,make sure:
The central server has passive host checks enabled (required)
The distributed server is configured to obsess over hosts.
The distributed server has an ochp command defined.
The ochp command, which is used for processing host check results, works in a similiar manner to theocsp command, which is used for processing service check results (see documentation above). In orderto make sure passive host check results are up to date, you’ll want to enable freshness checking for hosts(similiar to what is described above for services).
112

Redundant and Failover Network Monitoring
Introduction
This section describes a few scenarios for implementing redundant monitoring hosts an various types ofnetwork layouts. With redundant hosts, you can maintain the ability to monitor your network when theprimary host that runs Nagios fails or when portions of your network become unreachable.
Note: If you are just learning how to use Nagios, I would suggest not trying to implement redudancyuntil you have becoming familiar with the prerequisites I’ve laid out. Redundancy is a relativelycomplicated issue to understand, and even more difficult to implement properly.
Index
PrerequisitesSample scriptsScenario 1 - Redundant monitoringScenario 2 - Failover monitoring
Prerequisites
Before you can even think about implementing redundancy with Nagios, you need to be familiar withthe following...
Implementing event handlers for hosts and services
Issuing external commands to Nagios via shell scripts
Executing plugins on remote hosts using either the nrpe addon or some other method
Checking the status of the Nagios process with the check_nagios plugin
Sample Scripts
All of the sample scripts that I use in this documentation can be found in the eventhandlers/ subdirectoryof the Nagios distribution. You’ll probably need to modify them to work on your system...
Scenario 1 - Redundant Monitoring
Introduction
This is an easy (and naive) method of implementing redundant monitoring hosts on your network and itwill only protect against a limited number of failures. More complex setups are necessary in order toprovide smarter redundancy, better redundancy across different network segments, etc.
Goals
The goal of this type of redundancy implementation is simple. Both the "master" and "slave" hostsmonitor the same hosts and service on the network. Under normal circumstances only the "master" hostwill be sending out notifications to contacts about problems. We want the "slave" host running Nagios totake over the job of notifying contacts about problems if:
1. The "master" host that runs Nagios is down or..
2. The Nagios process on the "master" host stops running for some reason
113

Network Layout Diagram
The diagram below shows a very simple network setup. For this scenario I will be assuming that hosts Aand E are both running Nagios and are monitoring all the hosts shown. Host A will be considered the"master" host and host E will be considered the "slave" host.
Initial Program Settings
The slave host (host E) has its initial enable_notifications directive disabled, thereby preventing it fromsending out any host or service notifications. You also want to make sure that the slave host has its check_external_commands directive enabled. That was easy enough...
Initial Configuration
Next we need to consider the differences between the object configuration file(s) on the master and slave hosts...
I will assume that you have the master host (host A) setup to monitor services on all hosts shown in thediagram above. The slave host (host E) should be setup to monitor the same services and hosts, with thefollowing additions in the configuration file...
The host definition for host A (in the host E configuration file) should have a host event handlerdefined. Lets say the name of the host event handler is handle-master-host-event.
The configuration file on host E should have a service defined to check the status of the Nagiosprocess on host A. Lets assume that you define this service check to run the check_nagios plugin onhost A (using NRPE, SSH, etc.).
The service definition for the Nagios process check on host A should have an event handler defined.Lets say the name of the service event handler is handle-master-proc-event.
It is important to note that host A (the master host) has no knowledge of host E (the slave host). In thisscenario it simply doesn’t need to. Of course you may be monitoring services on host E from host A, butthat has nothing to do with the implementation of redundancy...
Event Handler Command Definitions
We need to stop for a minute and describe what the command definitions for the event handlers on theslave host look like. Here is an example...
114

define command{ command_name handle-master-host-event command_line /usr/local/nagios/libexec/eventhandlers/handle-master-host-event $HOSTSTATE$ $HOSTSTATETYPE$ } define command{ command_name handle-master-proc-event command_line /usr/local/nagios/libexec/eventhandlers/handle-master-proc-event $SERVICESTATE$ $SERVICESTATETYPE$ }
This assumes that you have placed the event handler scripts in the /usr/local/nagios/libexec/eventhandlersdirectory. You may place them anywhere you wish, but you’ll need to modify the examples I’ve given here.
Event Handler Scripts
Okay, now lets take a look at what the event handler scripts look like...
Host Event Handler (handle-master-host-event):
#!/bin/sh
# Only take action on hard host states...case "$2" inHARD) case "$1" in DOWN) # The master host has gone down! # We should now become the master host and take # over the responsibilities of monitoring the # network, so enable notifications... /usr/local/nagios/libexec/eventhandlers/enable_notifications ;; UP) # The master host has recovered! # We should go back to being the slave host and # let the master host do the monitoring, so # disable notifications... /usr/local/nagios/libexec/eventhandlers/disable_notifications ;; esac ;;esacexit 0
Service Event Handler (handle-master-proc-event):
#!/bin/sh
# Only take action on hard service states...case "$2" inHARD) case "$1" in CRITICAL) # The master Nagios process is not running! # We should now become the master host and # take over the responsibility of monitoring # the network, so enable notifications... /usr/local/nagios/libexec/eventhandlers/enable_notifications ;; WARNING) UNKNOWN) # The master Nagios process may or may not # be running.. We won’t do anything here, but # to be on the safe side you may decide you # want the slave host to become the master in
115

# these situations... ;; OK) # The master Nagios process running again! # We should go back to being the slave host, # so disable notifications... /usr/local/nagios/libexec/eventhandlers/disable_notifications ;; esac ;;esacexit 0
What This Does For Us
The slave host (host E) initially has notifications disabled, so it won’t send out any host or servicenotifications while the Nagios process on the master host (host A) is still running.
The Nagios process on the slave host (host E) becomes the master host when...
The master host (host A) goes down and the handle-master-host-event host event handler is executed.
The Nagios process on the master host (host A) stops running and the handle-master-proc-eventservice event handler is executed.
When the Nagios process on the slave host (host E) has notifications enabled, it will be able to send outnotifications about any service or host problems or recoveries. At this point host E has effectively takenover the responsibility of notifying contacts of host and service problems!
The Nagios process on host E returns to being the slave host when...
Host A recovers and the handle-master-host-event host event handler is executed.
The Nagios process on host A recovers and the handle-master-proc-event service event handler is executed.
When the Nagios process on host E has notifications disabled, it will not send out notifications about anyservice or host problems or recoveries. At this point host E has handed over the responsibilities ofnotifying contacts of problems to the Nagios process on host A. Everything is now as it was when wefirst started!
Time Lags
Redundancy in Nagios is by no means perfect. One of the more obvious problems is the lag timebetween the master host failing and the slave host taking over. This is affected by the following...
The time between a failure of the master host and the first time the slave host detects a problem
The time needed to verify that the master host really does have a problem (using service or hostcheck retries on the slave host)
The time between the execution of the event handler and the next time that Nagios checks forexternal commands
You can minimize this lag by...
Ensuring that the Nagios process on host E (re)checks one or more services at a high frequency. Thisis done by using the check_interval and retry_interval arguments in each service definition.
Ensuring that the number of host rechecks for host A (on host E) allow for fast detection of hostproblems. This is done by using the max_check_attempts argument in the host definition.
Increase the frequency of external command checks on host E. This is done by modifying the
116

command_check_interval option in the main configuration file.
When Nagios recovers on the host A, there is also some lag time before host E returns to being a slavehost. This is affected by the following...
The time between a recovery of host A and the time the Nagios process on host E detects therecovery
The time between the execution of the event handler on host B and the next time the Nagios processon host E checks for external commands
The exact lag times between the transfer of monitoring responsibilities will vary depending on howmany services you have defined, the interval at which services are checked, and a lot of pure chance. Atany rate, its definitely better than nothing.
Special Cases
Here is one thing you should be aware of... If host A goes down, host E will have notifications enabledand take over the responsibilities of notifying contacts of problems. When host A recovers, host E willhave notifications disabled. If - when host A recovers - the Nagios process on host A does not start upproperly, there will be a period of time when neither host is notifying contacts of problems! Fortunately,the service check logic in Nagios accounts for this. The next time the Nagios process on host E checks thestatus of the Nagios process on host A, it will find that it is not running. Host E will then havenotifications enabled again and take over all responsibilities of notifying contacts of problems.
The exact amount of time that neither host is monitoring the network is hard to determine. Obviously,this period can be minimized by increasing the frequency of service checks (on host E) of the Nagiosprocess on host A. The rest is up to pure chance, but the total "blackout" time shouldn’t be too bad.
Scenario 2 - Failover Monitoring
Introduction
Failover monitoring is similiar to, but slightly different than redundant monitoring (as discussed abovein scenario 1).
Goals
The basic goal of failover monitoring is to have the Nagios process on the slave host sit idle while theNagios process on the master host is running. If the process on the master host stops running (or if thehost goes down), the Nagios process on the slave host starts monitoring everything.
While the method described in scenario 1 will allow you to continue receive notifications if the mastermonitoring hosts goes down, it does have some pitfalls. The biggest problem is that the slave host ismonitoring the same hosts and servers as the master at the same time as the master! This can causeproblems with excessive traffic and load on the machines being monitored if you have a lot of servicesdefined. Here’s how you can get around that problem...
Initial Program Settings
Disable active service checks and notifications on the slave host using the execute_service_checks and enable_notifications directives. This will prevent the slave host from monitoring hosts and services andsending out notifications while the Nagios process on the master host is still up and running. Make sureyou also have the check_external_commands directive enabled on the slave host.
117

Master Process Check
Set up a cron job on the slave host that periodically (say every minute) runs a script that checks the stausof the Nagios process on the master host (using the check_nrpe plugin on the slave host and the nrpe daemon and check_nagios plugin on the master host). The script should check the return code of the check_nrpe plugin . If it returns a non-OK state, the script should send the appropriate commands to the external command file to enable both notifications and active service checks. If the plugin returns an OKstate, the script should send commands to the external command file to disable both notifications andactive checks.
By doing this you end up with only one process monitoring hosts and services at a time, which is muchmore efficient that monitoring everything twice.
Also of note, you don’t need to define host and service handlers as mentioned in scenario 1 becausethings are handled differently.
Additional Issues
At this point, you have implemented a very basic failover monitoring setup. However, there is one morething you should consider doing to make things work smoother.
The big problem with the way things have been setup thus far is the fact that the slave host doesn’t havethe current status of any services or hosts at the time it takes over the job of monitoring. One way tosolve this problem is to enable the ocsp command on the master host and have it send all service checkresults to the slave host using the nsca addon. The slave host will then have up-to-date statusinformation for all services at the time it takes over the job of monitoring things. Since active servicechecks are not enabled on the slave host, it will not actively run any service checks. However, it willexecute host checks if necessary. This means that both the master and slave hosts will be executing hostchecks as needed, which is not really a big deal since the majority of monitoring deals with service checks.
That’s pretty much it as far as setup goes.
118

Detection and Handling of State Flapping
Introduction
Nagios supports optional detection of hosts and services that are "flapping". Flapping occurs when aservice or host changes state too frequently, resulting in a storm of problem and recovery notifications.Flapping can be indicative of configuration problems (i.e. thresholds set too low) or real network problems.
Before I go any futher, let me say that flapping detection has been a little difficult to implement. Howexactly does one determine what "too frequently" means in regards to state changes for a particular hostor service? When I first started looking into flap detection I tried to find some information on howflapping could/should be detected. After I couldn’t find any, I decided to settle with what seemed to bea reasonable solution. The methods by which Nagios detects service and host state flapping aredescribed below...
Service Flap Detection
Whenever a service check is performed that results in a hard state or a soft recovery state, Nagios checksto see if the services has started or stopped flapping. It does this by storing the results of the last 21checks of the service in an array. Older check results in the array are overwritten by newer check results.
The contents of the historical state array are examined (in order from oldest result to newest result) todetermine the total percentage of change in state that has occurred during the last 21 service checks. Astate change occurs when an archived state is different from the archived state that immediatelyprecedes it in the array. Since we keep the results of the last 21 service checks in the array, there is apossibility of having 20 state changes.
Image 1 below shows a chronological array of service states. OK states are shown in green, WARNINGstates in yellow, CRITICAL states in red, and UNKNOWN states in orange. Blue arrows have beenplaced over periods of time where state changes occur.
Image 1.
Services that rarely change between states will have a lower total percentage of change than those thatdo change between states a lot. Since flapping is associated with frequent state changes, we can use thecalculated amount of change in state over a period of time (in this case, the last 21 service checks) todetermine whether or not a service is flapping. That’s not quite good enough though...
119

It stands to reason that newer state changes should carry more weight than older state changes, so wereally need to recalculate the total percent change in state for the service on some sort of curve... To makethings simple, I’ve decided to make the relationship between time and weight linear for calculation ofpercent state change. The flap detection routines are currently designed to make the newest possiblestate change carry 50% more weight than the oldest possible state change. Image 2 shows how morerecent state changes are given more weight than older state changes when calculating the overall or totalpercent state change for a particular service. If you really want to see exactly how the weightedcalculation is done, look at the code in base/flapping.c...
Image 2.
Let’s look at a quick example of how flap detection is done. Image 1 above depicts the array of historicalservice check results for a particular service. The oldest result is on the left and the newest result is onthe right. We see that in the example below there were a total of 7 state changes (at t3 , t4 , t5 , t9 , t12 , t16 ,
and t19 ). Without any weighting of the state changes over time, this would give us a total state change of
35% (7 state changes out of a possible 20 state changes). When the individual state changes are weightedrelative to the time at which they occurred, the resulting total percent state change for the service is lessthan 35%. This makes sense since most of the state changes occurred earlier rather than later. Let’s justsay that the weighted percent of state change turned out to be 31%...
So what significance does the 31% state change have? Well, if the service was previously not flappingand 31% is equal to or greater than the value specified by the high_service_flap_threshold option in theservice definition, Nagios considers the service to have just started flapping. If the service was previouslyflapping and 31% is less than or equal to the value specified by the low_service_flap_threshold value inthe service definition, Nagios considers the service to have just stopped flapping. If either of those twoconditions are not met, Nagios does nothing else with the service, since it is either not currently flappingor it is still flapping...
Host Flap Detection
Host flap detection works in a similiar manner to service flap detection, with one important difference:Nagios will attempt to check to see if a host is flapping whenever the status of the host is checked andwhenever a service associated with that host is checked. Why is this done? Well, with services we knowthat the minimum amount of time between consecutive flap detection routines is going to be equal to theservice check interval. With hosts, we don’t have a check interval, since hosts are not monitored on aregular basis - they are only checked as necessary. A host will be checked for flapping if its state haschanged since the last time the flap detection was performed for that host or if its state has not changedbut at least x amount of time has passed since the flap detection was performed. The x amount of time isequal to the average check interval of all services associated with the host. That’s the best method I couldcome up with for determining how often flap detection could be performed on a host...
120

Just as with services, Nagios stores the results of the last 21 of these host checks in an array for the flapdetection logic. State changes are weighted based on the time at which they occurred, and the totalpercent change in state is calculated in the same manner that it is in the service flapping logic.
If a host was previously not flapping and its total computed state change percentage is equal to or greater than the value specified by the high_host_flap_threshold option, Nagios considers the host to have juststarted flapping. If the host was previously flapping and its total computed state change percentage is less than or equal to the value specified by the low_host_flap_threshold value, Nagios considers the hostto have just stopped flapping. If either of those two conditions are not met, Nagios does nothing elsewith the host, since it is either not currently flapping or it is still flapping...
Host- and Service-Specific Flap Detection Thresholds
If you’re using the template-based object definition files, you can specify host- and service-specific flapdetection thresholds by adding low_flap_threshold and high_flap_threshold directives to individualhost and service definitions. If these directives are not present in the host or service definitions, theglobal host and service flap detection thresholds will be used.
On a similiar note, you can also enable/disable flap detection for specific hosts and services by using the flap_detection_enabled directive in each object definition. Note that flap detection must be enabled on aprogram-wide basis (using the enable_flap_detection directive in the main config file) in order for anyhost or service to have flap detection enabled.
Flap Handling
When a service or host is first detected as flapping, Nagios will do three things:
1. Log a message indicating that the service or host is flapping
2. Add a non-persistent comment to the host or service indicating that it is flapping
3. Suppress notifications for the service or host (this is one of the filters in the notification logic)
When a service or host stops flapping, Nagios will do the following:
1. Log a message indicating that the service or host has stopped flapping
2. Delete the comment that was originally added to the service or host when it started flapping
3. Remove the block on notifications for the service or host (notifications will still be bound to thenormal notification logic)
121

Service Check Parallelization
Introduction
One of the features of Nagios is its ability to execute service checks in parallel. This documentation willattempt to explain in detail what that means and how it affects services that you have defined.
How The Parallelization Works
Before I can explain how the service check parallelization works, you first have to understand a bit abouthow Nagios schedules events. All internal events in Nagios (i.e. log file rotations, external commandchecks, service checks, etc.) are placed in an event queue. Each item in the event queue has a time atwhich it is scheduled to be executed. Nagios does its best to ensure that all events get executed whenthey should, although events may fall behind schedule if Nagios is busy doing other things.
Service checks are one type of event that get scheduled in Nagios’ event queue. When it comes time for aservice check to be executed, Nagios will kick off another process (using a call to fork()) to go out andrun the service check (i.e. a plugin of some sort). Nagios does not, however, wait for the service check tofinish! Instead, Nagios will immediately go back to servicing other events that reside in the event queue...
So what happens when the service check finishes executing? Well, the process that was started byNagios to run the service check sends a message back to Nagios containing the results of the servicecheck. It is then up to Nagios to check for and process the results of that service check when it gets a chance.
In order for Nagios to actually do any monitoring, it must process the results of service checks that havefinished executing. This is done via a service check "reaper" process. Service "reapers" are another type ofevent that get scheduled in Nagios’ event queue. The frequency of these "reaper" events is determinedby the service_reaper_frequency option in the main configuration file. When a "reaper" event isexecuted, it will check for any messages that contain the result of service checks that have finishedexecuting. These service check results are then handled by the core service monitoring logic. From thereNagios determines whether or not hosts should be checked, notifications should be sent out, etc. Whenthe service check results have been processed, Nagios will reschedule the next check of the service andplace it in the event queue for later execution. That completes the service check/monitoring cycle!
For those of you who really want to know, but haven’t looked at the code, Nagios uses message queuesto handle communication between Nagios and the process that actually runs the service check...
Potential Gotchas...
You should realize that there are potential drawbacks to having service checks parallelized. Since morethan one service check may be running at the same time, they have may interfere with one another.You’ll have to evaluate what types of service checks you’re running and take appropriate steps to guardagainst any unfriendly outcomes. This is particularly important if you have more than one service checkthat accesses any hardware (like a modem). Also, if two or more service checks connect to daemon on aremote host to check some information, make sure that daemon can handle multiple simultaneous connections.
Fortunately, there are some things you can do to protect against problems with having some types ofservice checks "collide"...
122

1. The easiest thing you can do to prevent service check collisions to to use the service_interleave_factor variable. Interleaving services will help to reduce the load imposed uponremote hosts by service checks. Set the variable to use "smart" interleave factor calculation and thenadjust it manually if you find it necessary to do so.
2. The second thing you can do is to set the max_check_attempts argument in each service definition tosomething greater than one. If the service check does happen to collide with another running check,Nagios will retry the service check max_check_attempts-1 times before notifying anyone of a problem.
3. You could try is to implement some kind of "back-off and retry" logic in the actual service checkcode, although you may find it difficult or too time-consuming
4. If all else fails you can effectively prevent service checks from being parallelized by setting the max_concurrent_checks option to 1. This will allow only one service to be checked at a time, so itisn’t a spectacular solution. If there is enough demand, I will add an option to the service definitionswhich will allow you to specify on a per-service basis whether or not a service check can beparallelized. If there isn’t enough demand, I won’t...
One other thing to note is the effect that parallelization of service checks can have on system resourceson the machine that runs Nagios. Running a lot of service checks in parallel can be taxing on the CPUand memory. The inter_check_delay_method will attempt to minimize the load imposed on yourmachine by spreading the checks out evenly over time (if you use the "smart" method), but it isn’t asurefire solution. In order to have some control over how many service checks can be run at any giventime, use the max_concurrent_checks variable. You’ll have to tweak this value based on the total numberof services you check, the system resources you have available (CPU speed, memory, etc.), and otherprocesses which are running on your machine. For more information on how to tweak the max_concurrent_checks variable for your setup, read the documentation on check scheduling.
What Isn’t Parallelized
It is important to remember that only the execution of service checks has been parallelized. There is goodreason for this - other things cannot be parallelized in a very safe or sane manner. In particular, eventhandlers, contact notifications, processing of service checks, and host checks are not parallelized. Here’s why...
Event handlers are not parallelized because of what they are designed to do. Much of the power of eventhandlers comes from the ability to do proactive problem resultion. An example of this is restarting theweb server when the HTTP service on the local machine is detected as being down. In order to preventmore than one event handler from trying to "fix" problems in parallel (without any knowledge of whateach other is doing), I have decided to not parallelize them.
Contact notifications are not parallelized because of potential notification methods you may be using. If,for example, a contact notification uses a modem to dial out and send a message to your pager, itrequires exclusive access to the modem while the notification is in progress. If two or more suchnotifications were being executed in parallel, all but one would fail because the others could not getaccess to the modem. There are ways to get around this, like providing some kind of "back-off and retry"method in the notification script, but I’ve decided not to rely on users having implemented this type offeature in their scripts. One quick note - if you have service checks which use a modem, make sure thatany notification scripts that dial out have some method of retrying access to the modem. This isnecessary because a service check may be running at the same time a notification is!
Processing of service check results has not been parallelized. This has been done to prevent situations wheremultiple notifications about host problems or recoveries may be sent out if a host goes down, becomesunreachable, or recovers.
123

Notification Escalations
Introduction
Nagios supports optional escalation of contact notifications for hosts and services. I’ll explain quicklyhow they work, although they should be fairly self-explanatory...
Service Notification Escalations
Escalation of service notifications is accomplished by defining service escalations in your objectconfiguration file. Service escalation definitions are used to escalate notifications for a particular service.
Host Notification Escalations
Escalation of host notifications is accomplished by defining host escalations in your object configuration file. The examples I provide below all use service escalation definitions, but host escalations work thesame way (except for the fact that they are used for host notifications and not service notifications).
When Are Notifications Escalated?
Notifications are escalated if and only if one or more escalation definitions matches the currentnotification that is being sent out. If a host or service notification does not have any valid escalationdefinitions that applies to it, the contact group(s) specified in either the host group or service definitionwill be used for the notification. Look at the example below:
define serviceescalation{ host_name webserver service_description HTTP first_notification 3 last_notification 5 notification_interval 90 contact_groups nt-admins,managers }
define serviceescalation{ host_name webserver service_description HTTP first_notification 6 last_notification 10 notification_interval 60 contact_groups nt-admins,managers,everyone }
Notice that there are "holes" in the notification escalation definitions. In particular, notifications 1 and 2are not handled by the escalations, nor are any notifications beyond 10. For the first and secondnotification, as well as all notifications beyond the tenth one, the default contact groups specified in theservice definition are used. For all the examples I’ll be using, I’ll be assuming that the default contactgroups for the service definition is called nt-admins.
Contact Groups
When defining notification escalations, it is important to keep in mind that any contact groups that weremembers of "lower" escalations (i.e. those with lower notification number ranges) should also beincluded in "higher" escalation definitions. This should be done to ensure that anyone who gets notifiedof a problem continues to get notified as the problem is escalated. Example:
124

define serviceescalation{ host_name webserver service_description HTTP first_notification 3 last_notification 5 notification_interval 90 contact_groups nt-admins,managers }
define serviceescalation{ host_name webserver service_description HTTP first_notification 6 last_notification 0 notification_interval 60 contact_groups nt-admins,managers,everyone }
The first (or "lowest") escalation level includes both the nt-admins and managers contact groups. The last(or "highest") escalation level includes the nt-admins, managers, and everyone contact groups. Notice thatthe nt-admins contact group is included in both escalation definitions. This is done so that they continueto get paged if there are still problems after the first two service notifications are sent out. The managerscontact group first appears in the "lower" escalation definition - they are first notified when the thirdproblem notification gets sent out. We want the managers group to continue to be notified if the problemcontinues past five notifications, so they are also included in the "higher" escalation definition.
Overlapping Escalation Ranges
Notification escalation definitions can have notification ranges that overlap. Take the following example:
define serviceescalation{ host_name webserver service_description HTTP first_notification 3 last_notification 5 notification_interval 20 contact_groups nt-admins,managers }
define serviceescalation{ host_name webserver service_description HTTP first_notification 4 last_notification 0 notification_interval 30 contact_groups on-call-support }
In the example above:
The nt-admins and managers contact groups get notified on the third notification
All three contact groups get notified on the fourth and fifth notifications
Only the on-call-support contact group gets notified on the sixth (or higher) notification
Recovery Notifications
Recovery notifications are slightly different than problem notifications when it comes to escalations.Take the following example:
125

define serviceescalation{ host_name webserver service_description HTTP first_notification 3 last_notification 5 notification_interval 20 contact_groups nt-admins,managers }
define serviceescalation{ host_name webserver service_description HTTP first_notification 4 last_notification 0 notification_interval 30 contact_groups on-call-support }
If, after three problem notifications, a recovery notification is sent out for the service, who gets notified?The recovery is actually the fourth notification that gets sent out. However, the escalation code is smartenough to realize that only those people who were notified about the problem on the third notificationshould be notified about the recovery. In this case, the nt-admins and managers contact groups would benotified of the recovery.
Notification Intervals
You can change the frequency at which escalated notifications are sent out for a particular host or serviceby using the notification_interval option of the hostgroup or service escalation definition. Example:
define serviceescalation{ host_name webserver service_description HTTP first_notification 3 last_notification 5 notification_interval 45 contact_groups nt-admins,managers }
define serviceescalation{ host_name webserver service_description HTTP first_notification 6 last_notification 0 notification_interval 60 contact_groups nt-admins,managers,everyone }
In this example we see that the default notification interval for the services is 240 minutes (this is thevalue in the service definition). When the service notification is escalated on the 3rd, 4th, and 5thnotifications, an interval of 45 minutes will be used between notifications. On the 6th and subsequentnotifications, the notification interval will be 60 minutes, as specified in the second escalation definition.
Since it is possible to have overlapping escalation definitions for a particular hostgroup or service, andthe fact that a host can be a member of multiple hostgroups, Nagios has to make a decision on what todo as far as the notification interval is concerned when escalation definitions overlap. In any case wherethere are multiple valid escalation definitions for a particular notification, Nagios will choose thesmallest notification interval. Take the following example:
define serviceescalation{ host_name webserver service_description HTTP first_notification 3
126

last_notification 5 notification_interval 45 contact_groups nt-admins,managers }
define serviceescalation{ host_name webserver service_description HTTP first_notification 4 last_notification 0 notification_interval 60 contact_groups nt-admins,managers,everyone }
We see that the two escalation definitions overlap on the 4th and 5th notifications. For thesenotifications, Nagios will use a notification interval of 45 minutes, since it is the smallest interval presentin any valid escalation definitions for those notifications.
One last note about notification intervals deals with intervals of 0. An interval of 0 means that Nagiosshould only sent a notification out for the first valid notification during that escalation definition. Allsubsequent notifications for the hostgroup or service will be suppressed. Take this example:
define serviceescalation{ host_name webserver service_description HTTP first_notification 3 last_notification 5 notification_interval 45 contact_groups nt-admins,managers }
define serviceescalation{ host_name webserver service_description HTTP first_notification 4 last_notification 6 notification_interval 0 contact_groups nt-admins,managers,everyone } define serviceescalation{ host_name webserver service_description HTTP first_notification 7 last_notification 0 notification_interval 30 contact_groups nt-admins,managers }
In the example above, the maximum number of problem notifications that could be sent out about theservice would be four. This is because the notification interval of 0 in the second escalation definitionindicates that only one notification should be sent out (starting with and including the 4th notification)and all subsequent notifications should be repressed. Because of this, the third service escalationdefinition has no effect whatsoever, as there will never be more than four notifications.
Time Period Restrictions
Under normal circumstances, escalations can be used at any time that a notification could normally besent out for the service. This "notification time window" is determined by the notification_period directivein the service definition.
127

You can optionally restrict escalations so that they are only used during specific time periods by usingthe escalation_period directive in the service escalation definition. If you use the escalation_period directiveto specify a timeperiod during which the escalation can be used, the escalation will only be used duringthat time. If you do not specify any escalation_period directive, the escalation can be used at any timewithin the "notification time window" for the service.
Note that the notification is still subject to the normal time restrictions imposed by the notification_perioddirective in the service escalation, so the timeperiod you specify in the escalation should be a subset ofthat larger "notification time window".
State Restrictions
If you would like to restrict the escalation definition so that it is only used when the service is in aparticular state, you can use the escalation_options directive in the service escalation definition. If you donot use the escalation_options directive, the escalation can be used when the service is in any state.
128

Monitoring Service and Host Clusters
Introduction
Several people have asked how to go about monitoring clusters of hosts or services, so I decided to writeup a little documentation on how to do this. Its fairly straightforward, so hopefully you find things easyto understand...
First off, we need to define what we mean by a "cluster". The simplest way to understand this is with anexample. Let’s say that your organization has five hosts which provide redundant DNS services to yourorganization. If one of them fails, its not a major catastrophe because the remaining servers will continueto provide name resolution services. If you’re concerned with monitoring the availability of DNS serviceto your organization, you will want to monitor five DNS servers. This is what I consider to be a servicecluster. The service cluster consists of five separate DNS services that you are monitoring. Although youdo want to monitor each individual service, your main concern is with the overall status of the DNSservice cluster, rather than the availability of any one particular service.
If your organization has a group of hosts that provide a high-availability (clustering) solution, I wouldconsider those to be a host cluster. If one particular host fails, another will step in to take over all theduties of the failed server. As a side note, check out the High-Availability Linux Project for informationon providing host and service redundancy with Linux.
Plan of Attack
There are several ways you could potentially monitor service or host clusters. I’ll describe the methodthat I believe to be the easiest. Monitoring service or host clusters involves two things:
Monitoring individual cluster elements
Monitoring the cluster as a collective entity
Monitoring individual host or service cluster elements is easier than you think. In fact, you’re probablyalready doing it. For service clusters, just make sure that you are monitoring each service element of thecluster. If you’ve got a cluster of five DNS servers, make sure you have five separate service definitions(probably using the check_dns plugin). For host clusters, make sure you have configured appropriatehost definitions for each member of the cluster (you’ll also have to define at least one service to bemonitored for each of the hosts). Important: You’re going to want to disable notifications for theindividual cluster elements (host or service definitions). Even though no notifications will be sent aboutthe individual elements, you’ll still get a visual display of the individual host or service status in the status CGI. This will be useful for pinpointing the source of problems within the cluster in the future.
Monitoring the overall cluster can be done by using the previously cached results of cluster elements.Although you could re-check all elements of the cluster to determine the cluster’s status, why wastebandwidth and resources when you already have the results cached? Where are the results cached?Cached results for cluster elements can be found in the status file (assuming you are monitoring eachelement). The check_cluster plugin is designed specifically for checking cached host and service states inthe status file. Important: Although you didn’t enable notifications for individual elements of the cluster,you will want them enabled for the overall cluster status check.
Using the check_cluster Plugin
The check_cluster plugin is designed to report the overall status of a host or service cluster by checkingthe status information of each individual host or service cluster elements.
129

More to come... The check_cluster plugin can be found in the contrib directory of the Nagios Pluginsrelease at http://sourceforge.net/projects/nagiosplug/.
Monitoring Service Clusters
Let’s say you have three DNS servers that provide redundant services on your network. First off, youneed to be monitoring each of these DNS servers seperately before you can monitor them as a cluster. I’llassume that you already have three seperate services (all called "DNS Service") associated with yourDNS hosts (called "host1", "host2" and "host3").
In order to monitor the services as a cluster, you’ll need to create a new "cluster" service. However,before you do that, make sure you have a service cluster check command configured. Let’s assume thatyou have a command called check_service_cluster defined as follows:
define command{ command_name check_service_cluster command_line /usr/local/nagios/libexec/check_cluster --service -l $ARG1$ -w $ARG2$ -c $ARG3$ -d $ARG4$ }
Now you’ll need to create the "cluster" service and use the check_service_cluster command you justcreated as the cluster’s check command. The example below gives an example of how to do this. Theexample below will generate a CRITICAL alert if 2 or more services in the cluster are in a non-OK state,and a WARNING alert if only 1 of the services is in a non-OK state. If all the individual service membersof the cluster are OK, the cluster check will return an OK state as well.
define service{ ... check_command check_service_cluster!"DNS Cluster"!1!2!$SERVICESTATEID:host1:DNS Service$,$SERVICESTATEID:host2:DNS Service$,$SERVICESTATEID:host3:DNS Service$ ... }
It is important to notice that we are passing a comma-delimited list of on-demand service state macros tothe $ARG4$ macro in the cluster check command. That’s important! Nagios will fill those on-demandmacros in with the current service state IDs (numerical values, rather than text strings) of the individualmembers of the cluster.
Monitoring Host Clusters
Monitoring host clusters is very similiar to monitoring service clusters. Obviously, the main difference isthat the cluster members are hosts and not services. In order to monitor the status of a host cluster, youmust define a service that uses the check_cluster plugin. The service should not be associated with any ofthe hosts in the cluster, as this will cause problems with notifications for the cluster if that host goesdown. A good idea might be to associate the service with the host that Nagios is running on. After all, ifthe host that Nagios is running on goes down, then Nagios isn’t running anymore, so there isn’tanything you can do as far as monitoring (unless you’ve setup redundant monitoring hosts)...
Anyway, let’s assume that you have a check_host_cluster command defined as follows:
define command{ command_name check_host_cluster command_line /usr/local/nagios/libexec/check_cluster --host -l $ARG1$ -w $ARG2$ -c $ARG3$ -d $ARG4$ }
Let’s say you have three hosts (named "host1", "host2" and "host3") in the host cluster. If you wantNagios to generate a warning alert if one host in the cluster is not UP or a critical alert if two or morehosts are not UP, the the service you define to monitor the host cluster might look something like this:
130

define service{ ... check_command check_host_cluster!"Super Host Cluster"!1!2!$HOSTSTATEID:host1$,$HOSTSTATEID:host2$,$HOSTSTATEID:host3$ ... }
It is important to notice that we are passing a comma-delimited list of on-demand host state macros to the$ARG4$ macro in the cluster check command. That’s important! Nagios will fill those on-demandmacros in with the current host state IDs (numerical values, rather than text strings) of the individualmembers of the cluster.
That’s it! Nagios will periodically check the status of the host cluster and send notifications to you whenits status is degraded (assuming you’ve enabled notification for the service). Note that for thehostdefinitions of each cluster member, you will most likely want to disable notifications when the host goesdown . Remeber that you don’t care as much about the status of any individual host as you do theoverall status of the cluster. Depending on your network layout and what you’re trying to accomplish,you may wish to leave notifications for unreachable states enabled for the host definitions.
131

Host and Service Dependencies
Introduction
Service and host dependencies are an advanced feature that allow you to control the behavior of hostsand services based on the status of one or more other hosts or services. I’ll explain how dependencieswork, along with the differences between host and service dependencies.
Service Dependencies Overview
The image below shows an example logical layout of service dependencies. There are a few things youshould notice:
1. A service can be dependent on one or more other services
2. A service can be dependent on services which are not associated with the same host
3. Service dependencies are not inherited (unless specifically configured to)
4. Service dependencies can be used to cause service execution and service notifications to besuppressed under different circumstances (OK, WARNING, UNKNOWN, and/or CRITICAL states)
132

Defining Service Dependencies
First, the basics. You create service dependencies by adding service dependency definitions in your object config file(s). In each definition you specify the dependent service, the service you are depending on,and the criteria (if any) that cause the execution and notification dependencies to fail (these are described later).
You can create several dependencies for a given service, but you must add a separate servicedependency definition for each dependency you create.
In the image above, the dependency definitions for Service F on Host C would be defined as follows:
define servicedependency{ host_name Host B service_description Service D dependent_host_name Host C
133

dependent_service_description Service F execution_failure_criteria o notification_failure_criteria w,u }
define servicedependency{ host_name Host B service_description Service E dependent_host_name Host C dependent_service_description Service F execution_failure_criteria n notification_failure_criteria w,u,c }
define servicedependency{ host_name Host B service_description Service C dependent_host_name Host C dependent_service_description Service F execution_failure_criteria w notification_failure_criteria c }
The other dependency definitions shown in the image above would be defined as follows:
define servicedependency{ host_name Host A service_description Service A dependent_host_name Host B dependent_service_description Service D execution_failure_criteria u notification_failure_criteria n }
define servicedependency{ host_name Host A service_description Service B dependent_host_name Host B dependent_service_description Service E execution_failure_criteria w,u notification_failure_criteria c }
define servicedependency{ host_name Host B service_description Service C dependent_host_name Host B dependent_service_description Service E execution_failure_criteria n notification_failure_criteria w,u,c }
How Service Dependencies Are Tested
Before Nagios executes a service check or sends notifications out for a service, it will check to see if theservice has any dependencies. If it doesn’t have any dependencies, the check is executed or thenotification is sent out as it normally would be. If the service does have one or more dependencies,Nagios will check each dependency entry as follows:
1. Nagios gets the current status * of the service that is being depended upon.
2. Nagios compares the current status of the service that is being depended upon against either theexecution or notification failure options in the dependency definition (whichever one is relevant atthe time).
134

3. If the current status of the service that is being depended upon matches one of the failure options, thedependency is said to have failed and Nagios will break out of the dependency check loop.
4. If the current state of the service that is being depended upon does not match any of the failureoptions for the dependency entry, the dependency is said to have passed and Nagios will go on andcheck the next dependency entry.
This cycle continues until either all dependencies for the service have been checked or until onedependency check fails.
* One important thing to note is that by default, Nagios will use the most current hard state of theservice(s) that is/are being depended upon when it does the dependeny checks. If you want Nagios touse the most current state of the services (regardless of whether its a soft or hard state), enable the soft_service_dependencies option.
Execution Dependencies
Execution dependencies are used to restrict when active checks of a service can be performed. Passivechecks are not restricted by execution dependencies.
If all of the execution dependency tests for the service passed, Nagios will execute the check of the serviceas it normally would. If even just one of the execution dependencies for a service fails, Nagios willtemporarily prevent the execution of checks for that (dependent) service. At some point in the future theexecution dependency tests for the service may all pass. If this happens, Nagios will start checking theservice again as it normally would. More information on the check scheduling logic can be found here.
In the example above, Service E would have failed execution dependencies if Service B is in aWARNING or UNKNOWN state. If this was the case, the service check would not be performed and thecheck would be scheduled for (potential) execution at a later time.
Notification Dependencies
If all of the notification dependency tests for the service passed, Nagios will send notifications out for theservice as it normally would. If even just one of the notification dependencies for a service fails, Nagioswill temporarily repress notifications for that (dependent) service. At some point in the future thenotification dependency tests for the service may all pass. If this happens, Nagios will start sending outnotifications again as it normally would for the service. More information on the notification logic can befound here.
In the example above, Service F would have failed notification dependencies if Service C is in aCRITICAL state, and/or Service D is in a WARNING or UNKNOWN state, and/or if Service E is in aWARNING, UNKNOWN, or CRITICAL state. If this were the case, notifications for the service wouldnot be sent out.
Dependency Inheritance
As mentioned before, service dependencies are not inherited by default. In the example above you cansee that Service F is dependent on Service E. However, it does not automatically inherit Service E’sdependencies on Service B and Service C. In order to make Service F dependent on Service C we had toadd another service dependency definition. There is no dependency definition for Service B, so Service Fis not dependent on Service B.
If you do wish to make service dependencies inheritable, you must use the inherits_parent directive in the service dependency definition. When this directive is enabled, it indicates that the dependency inheritsdependencies of the service that is being depended upon (also referred to as the master service). In otherwords, if the master service is dependent upon other services and any one of those dependencies fail,this dependency will also fail.
135

In the example above, imagine that you want to add a new dependency for service F to make itdependent on service A. You could create a new dependency definition that specified service F as the dependent service and service A as being the master service (i.e. the service that is being dependend on). Youcould alternatively modify the dependency definition for services D and F to look like this:
define servicedependency{ host_name Host B service_description Service D dependent_host_name Host C dependent_service_description Service F execution_failure_criteria o notification_failure_criteria n inherits_parent 1 }
Since the inherits_parent directive is enabled, the dependency between services A and D will be testedwhen the dependency between services F and D are being tested.
Dependencies can have multiple levels of inheritence. If the dependency definition between A and Dhad its inherits_parent directive enable and service A was dependent on some other service (let’s call itservice G), the service F would be dependent on services D, A, and G (each with potentially different criteria).
Host Dependencies
As you’d probably expect, host dependencies work in a similiar fashion to service dependencies. The bigdifference is that they’re for hosts, not services. Another difference is that host dependencies only workfor suppressing host notifications, not host checks.
BEWARE! Do not confuse host dependencies with parent/child host relationships. You should be usingparent/child host relationships (defined with the parents directive in host definitions) for most cases,rather than host dependencies.
The image below shows an example of the logical layout of host dependencies.
136

In the image above, the dependency definitions for Host C would be defined as follows:
define hostdependency{ host_name Host A dependent_host_name Host C notification_failure_criteria d }
define hostdependency{ host_name Host B dependent_host_name Host C notification_failure_criteria d,u }
As with service dependencies, host dependencies are not inherited. In the example image you can seethat Host C does not inherit the host dependencies of Host B. In order for Host C to be dependent onHost A, a new host dependency definition must be defined.
Host notification dependencies work in a similiar manner to service notification dependencies. If all ofthe notification dependency tests for the host pass, Nagios will send notifications out for the host as itnormally would. If even just one of the notification dependencies for a host fails, Nagios will
137

temporarily repress notifications for that (dependent) host. At some point in the future the notificationdependency tests for the host may all pass. If this happens, Nagios will start sending out notificationsagain as it normally would for the host. More information on the notification logic can be found here.
NOTE: Host execution dependencies work in a similiar manner to service execution dependencies.However, they only have an affect on regularly scheduled host checks. On-demand host checks are notaffected by host execution dependencies.
138

State Stalking
Introduction
State "stalking" is a feature which is probably not going to used by most users. When enabled, it allowsyou to log changes in service and host checks even if the state of the host or service does not change.When stalking is enabled for a particular host or service, Nagios will watch that service very carefullyand log any changes it sees. As you’ll see, it can be very helpful to you in later analysis of the log files.
How Does It Work?
Under normal circumstances, the result of a host or service check is only logged if the host or service haschanged state since it was last checked. There are a few exceptions to this, but for the most part, that’sthe rule.
If you enable stalking for one or more states of a particular host or service, Nagios will log the results ofthe host or service check if the output from the check differs from the output from the previous check.Take the following example of eight consecutive checks of a service:
Service Check #:
Service State:
Service Check Output:
x OK RAID array optimal
x+1 OK RAID array optimal
x+2 WARNING RAID array degraded (1 drive bad, 1 hot spare rebuilding)
x+3 CRITICALRAID array degraded (2 drives bad, 1 host spare online, 1 hot spare rebuilding)
x+4 CRIICAL RAID array degraded (3 drives bad, 2 hot spares online)
x+5 CRITICAL RAID array failed
x+6 CRITICAL RAID array failed
x+7 CRITICAL RAID array failed
Given this sequence of checks, you would normally only see two log entries for this catastrophe. Thefirst one would occur at service check x+2 when the service changed from an OK state to a WARNINGstate. The second log entry would occur at service check x+3 when the service changed from aWARNING state to a CRITICAL state.
For whatever reason, you may like to have the complete history of this catasrophe in your log files.Perhaps to help explain to your manager how quickly the situation got out of control, perhaps just tolaugh at over a couple of drinks at the local pub, whatever...
Well, if you had enabled stalking of this service for CRITICAL states, you would have events at x+4 andx+5 logged in addition to the events at x+2 and x+3. Why is this? With state stalking enabled, Nagioswould have examined the output from each service check to see if it differed from the output of theprevious check. If the output differed and the state of the service didn’t change between the two checks,the result of the newer service check would get logged.
139

A similiar example of stalking might be on a service that checks your web server. If the check_httpplugin first returns a WARNING state because of a 404 error and on subsequent checks returns aWARNING state because of a particular pattern not being found, you might want to know that. If youdidn’t enable state stalking for WARNING states of the service, only the first WARNING state event (the404 error) would be logged and you wouldn’t have any idea (looking back in the archived logs) thatfuture problems were not due to a 404, but rather a missing pattern in the returned web page.
Should I Enable Stalking?
First, you must decide if you have a real need to analyze archived log data to find the exact cause of aproblem. You may decide you need this feature for some hosts or services, but not for all. You may alsofind that you only have a need to enable stalking for some host or service states, rather than all of them.For example, you may decide to enable stalking for WARNING and CRITICAL states of a service, butnot for OK and UNKNOWN states.
The decision to to enable state stalking for a particular host or service will also depend on the plugin thatyou use to check that host or service. If the plugin always returns the same text output for a particularstate, there is no reason to enable stalking for that state.
How Do I Enable Stalking?
You can enable state stalking for hosts and services by using the stalking_options directive in host andservice definitions.
Caveats
You should be aware that there are some potential pitfalls with enabling stalking. These all relate to thereporting functions found in various CGIs (histogram, alert summary, etc.). Because state stalking willcause additional alert entries to be logged, the data produced by the reports will show evidence ofinflated numbers of alerts.
As a general rule, I would suggest that you not enable stalking for hosts and services without thinkingthings through. Still, its there if you need and want it.
140

Performance Data
Introduction
Nagios is designed to allow plugins to return optional performance data in addition to normal statusdata, as well as allow you to pass that performance data to external applications for processing. Adescription of the different types of performance data, as well as information on how to go aboutprocessing that data is described below...
Types of Performance Data
There are two basic categories of performance data that can be obtained from Nagios:
1. Check performance data
2. Plugin performance data
Check performance data is internal data that relates to the actual execution of a host or service check. Thismight include things like service check latency (i.e. how "late" was the service check from its scheduledexecution time) and the number of seconds a host or service check took to execute. This type ofperformance data is available for all checks that are performed. The $HOSTEXECUTIONTIME$ and$SERVICEEXECUTIONTIME$ macros can be used to determine the number of seconds a host or servicecheck was running and the $HOSTLATENCY$ and $SERVICELATENCY$ macros can be used todetermine how "late" a regularly-scheduled host or service check was.
Plugin performance data is external data specific to the plugin used to perform the host or service check.Plugin-specific data can include things like percent packet loss, free disk space, processor load, numberof current users, etc. - basically any type of metric that the plugin is measuring when it executes.Plugin-specific performance data is optional and may not be supported by all plugins. As of this writing,no plugins return performance data, although they mostly likely will in the near future. Plugin-specificperformance data (if available) can be obtained by using the $HOSTPERFDATA$ and$SERVICEPERFDATA$ macros. See below for more information on how plugins can returnperformance data to Nagios for inclusion in the $HOSTPERFDATA$ and $SERVICEPERFDATA$ macros.
Performance Data Support For Plugins
Normally plugins return a single line of text that indicates the status of some type of measurable data.For example, the check_ping plugin might return a line of text like the following:
PING ok - Packet loss = 0%, RTA = 0.80 ms
With this type of output, the entire line of text is available in the $HOSTOUTPUT$ or$SERVICEOUTPUT$ macros (depending on whether this plugin was used as a host check or service check).
In order to facilitate the passing of plugin-specific performance data to Nagios, the plugin specificationhas been expanded. If a plugin wishes to pass performance data back to Nagios, it does so by sendingthe normal text string that it usually would, followed by a pipe character (|), and then a stringcontaining one or more performance data metrics. Let’s take the check_ping plugin as an example andassume that it has been enhanced to return percent packet loss and average round trip time asperformance data metrics. A sample plugin output might look like this:
141

PING ok - Packet loss = 0%, RTA = 0.80 ms | percent_packet_loss=0, rta=0.80
When Nagios seems this format of plugin output it will split the output into two parts: everything beforethe pipe character is considered to be the "normal" plugin output and everything after the pipe characteris considered to be the plugin-specific performance data. The "normal" output gets stored in the$HOSTOUTPUT$ or $SERVICEOUTPUT$ macro, while the optional performance data gets stored in the$HOSTPERFDATA$ or $SERVICEPERFDATA$ macro. In the example above, the $HOSTOUTPUT$ or$SERVICEOUTPUT$ macro would contain "PING ok - Packet loss = 0%, RTA = 0.80 ms" (without quotes)and the $HOSTPERFDATA$ or $SERVICEPERFDATA$ macro would contain "percent_packet_loss=0, rta=0.80" (without quotes).
Format of Performance Data Output
The Nagios daemon doesn’t directly process performance data, so it doesn’t really care what theperformance data looks like. There aren’t really any inherent limitations on the format or content of theperformance data. However, if you are using an external addon to process the performance data (i.e.PerfParse), the addon may be expecting that the plugin returns performance data in a specific format.Check the documentation that comes with the addon for more information. Also, make sure to check theplugin developer guidelines at SourceForge (http://nagiosplug.sourceforge.net/) for information onwriting plugins.
Enabling Performance Data Processing
If you want to process the performance data that is available from Nagios and the plugins, you’ll need todo the following:
1. Enable the process_performance_data option.
2. Configure Nagios so that performance data is written to files and/or processed by executing commands.
Writing Performance Data To Files
You can have Nagios write all host and service performance data to files using the host_perfdata_fileand service_perfdata_file options. You can control how the data is written to those files using the host_perfdata_file_template and service_perfdata_file_template options. Additionally, you can haveNagios periodically execute commands to process the performance data files using the host_perfdata_file_processing_command and service_perfdata_file_processing_command options.
Processing Performance Data Using Commands
You can have Nagios process host and service performance data by executing commands by using the host_perfdata_command or service_perfdata_command options. An example command definition thatsimply writes service performance data to a file is shown below:
define command{ command_name process-service-perfdata command_line /bin/echo -e "$LASTSERVICECHECK$\t$HOSTNAME$\t$SERVICEDESC$\t$SERVICESTATE$\t$SERVICEATTEMPT$\t$SERVICESTATETYPE$\t$SERVICEEXECUTIONTIME$\t$SERVICELATENCY$\t$SERVICEOUTPUT$\t$S... }
142

Scheduled Downtime
Introduction
Nagios allows you to schedule periods of planned downtime for hosts and service that you’remonitoring. This is useful in the event that you actually know you’re going to be taking a server downfor an upgrade, etc. When a host a service is in a period of scheduled downtime, notifications for thathost or service will be suppressed.
Downtime File
Scheduled host and service downtime is stored in the file you specify by the downtime_file directive inyour main configuration file.
Downtime Retention
Scheduled host and service downtime is automatically preserved across program restarts. When Nagiosstarts up, it will scan the downtime file, delete any old or invalid entries, and schedule downtime for allvalid host and service entries.
Scheduling Downtime
You can schedule downtime for hosts and service through the extinfo CGI (either when viewing host orservice information). Click in the "Schedule downtime for this host/service" link to actually schedule the downtime.
Once you schedule downtime for a host or service, Nagios will add a comment to that host/serviceindicating that it is scheduled for downtime during the period of time you indicated. When that periodof downtime passes, Nagios will automatically delete the comment that it added. Nice, huh?
Fixed vs. Flexible Downtime
When you schedule downtime for a host or service through the web interface you’ll be asked if thedowntime is fixed or flexible. Here’s an explanation of how "fixed" and "flexible" downtime differs:
"Fixed" downtime starts and stops at the exact start and end times that you specify when you scheduleit. Okay, that was easy enough...
"Flexible" downtime is intended for times when you know that a host or service is going to be down forX minutes (or hours), but you don’t know exactly when that’ll start. When you schedule flexibledowntime, Nagios will start the scheduled downtime sometime between the start and end times youspecified. The downtime will last for as long as the duration you specified when you scheduled thedowntime. This assumes that the host or service for which you scheduled flexible downtime either goesdown (or becomes unreachable) or goes into a non-OK state sometime between the start and end timesyou specified. The time at which a host or service transitions to a problem state determines the time atwhich Nagios actually starts the downtime. The downtime will then last for the duration you specified,even if the host or service recovers before the downtime expires. This is done for a very good reason. Aswe all know, you can think you’ve got a problem fixed (and restart a server) ten times before it actuallyworks right. Smart, eh?
Triggered Downtime
143

When scheduling host or service downtime you have the option of making it "triggered" downtime.What is triggered downtime, you ask? With triggered downtime the start of the downtime is triggeredby the start of some other scheduled host or service downtime. This is extremely useful if you’rescheduling downtime for a large number or hosts or services and the start time of the downtime perioddepends on the start time of another downtime entry. For instance, if you schedule flexible downtime fora particular host (because its going down for maintenance), you might want to schedule triggereddowntime for all of that hosts’s "children".
How Scheduled Downtime Affects Notifications
When a host or service is in a period of scheduled downtime, Nagios will not allow notifications to besent out for the host or service. suppression of notifications is accomplished by adding an additionalfilter to the notification logic. You will not see an icon in the CGIs indicating that notifications for thathost/service are disabled. When the scheduled downtime has passed, Nagios will allow notifications tobe sent out for the host or service as it normally would.
Overlapping Scheduled Downtime
I like to refer to this as the "Oh crap, its not working" syndrome. You know what I’m talking about. Youtake a server down to perform a "routine" hardware upgrade, only to later realize that the OS driversaren’t working, the RAID array blew up, or the drive imaging failed and left your original disks uselessto the world. Moral of the story is that any routine work on a server is quite likely to take three or fourtimes as long as you had originally planned...
Let’s take the following scenario:
1. You schedule downtime for host A from 7:30pm-9:30pm on a Monday
2. You bring the server down about 7:45pm Monday evening to start a hard drive upgrade
3. After wasting an hour and a half battling with SCSI errors and driver incompatabilities, you finallyget the machine to boot up
4. At 9:15 you realize that one of your partitions is either hosed or doesn’t seem to exist anywhere onthe drive
5. Knowing you’re in for a long night, you go back and schedule additional downtime for host A from9:20pm Monday evening to 1:30am Tuesday Morning.
If you schedule overlapping periods of downtime for a host or service (in this case the periods were7:40pm-9:30pm and 9:20pm-1:30am), Nagios will wait until the last period of scheduled downtime isover before it allows notifications to be sent out for that host or service. In this example notificationswould be suppressed for host A until 1:30am Tuesday morning.
144

Using The Embedded Perl Interpreter
Introduction
Stephen Davies has contributed code that allows you to compile Nagios with an embedded Perlinterpreter. This may be of interest to you if you rely heavily on plugins written in Perl.
Stanley Hopcroft has worked with the embedded Perl interpreter quite a bit and has commented on theadvantages/disadvanges of using it. He has also given several helpful hints on creating Perl plugins thatwork properly with the embedded interpreter. The majority of this documentation comes from his comments.
It should be noted that "ePN", as used in this documentation, refers to embedded Perl Nagios, or if youprefer, Nagios compiled with an embedded Perl interpreter.
Advantages
Some advantages of ePN (embedded Perl Nagios) include:
Nagios will spend much less time running your Perl plugins because it no longer forks to executethe plugin (each time loading the Perl interpreter). Instead, it executes your plugin by making alibrary call.
It greatly reduces the system impact of Perl plugins and/or allows you to run more checks with Perlplugin than you otherwise would be able to. In other words, you have less incentive to writeplugins in other languages such as C/C++, or Expect/TCL, that are generally recognised to havedevelopment times at least an order of magnitude slower than Perl (although they do run about tentimes faster also - TCL being an exception).
If you are not a C programmer, then you can still get a huge amount of mileage out of Nagios byletting Perl do all the heavy lifting without having Nagios slow right down. Note however, that theePN will not speed up your plugin (apart from eliminating the interpreter load time). If you wantfast plugins then consider Perl XSUBs (XS), or C after you are sure that your Perl is tuned and thatyou have a suitable algorithm (Benchmark.pm is invaluable for comparing the performance of Perllanguage elements).
Using the ePN is an excellent opportunity to learn more about Perl.
Disadvantages
The disadvantages of ePN (embedded Perl Nagios) are much the same as Apache mod_perl (i.e. Apachewith an embedded interpreter) compared to a plain Apache:
A Perl program that works fine with plain Nagios may not work with the ePN. You may have tomodify your plugins to get them to work.
Perl plugins are harder to debug under an ePN than under a plain Nagios.
Your ePN will have a larger SIZE (memory footprint) than a plain Nagios.
Some Perl constructs cannot be used or may behave differently than what you would expect.
You may have to be aware of ’more than one way to do it’ and choose a way that seems lessattractive or obvious.
You will need greater Perl knowledge (but nothing very esoteric or stuff about Perl internals -unless your plugin uses XSUBS).
Target Audience
145

Average Perl developers; those with an appreciation of the languages powerful features withoutknowledge of internals or an in depth knowledge of those features.
Those with a utilitarian appreciation rather than a great depth of understanding.
If you are happy with Perl objects, name management, data structures, and the debugger, that’sprobably sufficient.
Things you should do when developing a Perl Plugin (ePN or not)
Always always generate some output
Use ’use utils’ and import the stuff it exports ($TIMEOUT %ERRORS &print_revision &support)
Have a look at how the standard Perl plugins do their stuff e.g.
Always exit with $ERRORS{CRITICAL}, $ERRORS{OK}, etc.
Use getopt to read command line arguments
Manage timeouts
Call print_usage (supplied by you) when there are no command line arguments
Use standard switch names (eg H ’host’, V ’version’)
Things you must do to develop a Perl plugin for ePN
1. <DATA> can not be used; use here documents instead e.g.
my $data = <<DATA;portmapper 100000portmap 100000sunrpc 100000rpcbind 100000rstatd 100001rstat 100001rup 100001..DATA
%prognum = map { my($a, $b) = split; ($a, $b) } split(/\n/, $data) ;
2. BEGIN blocks will not work as you expect. May be best to avoid.
3. Ensure that it is squeaky clean at compile time i.e.
use strict
use perl -w (other switches [T notably] may not help)
use perl -c
4. Avoid lexical variables (my) with global scope as a means of passing __variable__ data intosubroutines. In fact this is __fatal__ if the subroutine is called by the plugin more than once whenthe check is run. Such subroutines act as ’closures’ that lock the global lexicals first value intosubsequent calls of the subroutine. If however, your global is read-only (a complicated structure forexample) this is not a problem. What Bekman recommends you do instead, is any of the following:
make the subroutine anonymous and call it via a code ref e.g.
turn this into
my $x = 1 ; my $x = 1 ;sub a { .. Process $x ... } $a_cr = sub { ... Process $x ... } ;. .. .a ; &$a_cr ;$x = 2 $x = 2 ;a ; &$a_cr ;
# anon closures __always__ rebind the current lexical value
146

put the global lexical and the subroutine using it in their own package (as an object or amodule)
pass info to subs as references or aliases (\$lex_var or $_[n])
replace lexicals with package globals and exclude them from ’use strict’ objections with ’usevars qw(global1 global2 ..)’
5. Be aware of where you can get more information.
Useful information can be had from the usual suspects (the O’Reilly books, plus DamienConways "Object Oriented Perl") but for the really useful stuff in the right context start at StasBekman’s mod_perl guide at http://perl.apache.org/guide/.
This wonderful book sized document has nothing whatsoever about Nagios, but all aboutwriting Perl programs for the embedded Perl interpreter in Apache (ie Doug MacEacherns mod_perl).
The perlembed manpage is essential for context and encouragement.
On the basis that Lincoln Stein and Doug MacEachern know a thing or two about Perl andembedding Perl, their book ’Writing Apache Modules with Perl and C’ is almost certainlyworth looking at.
6. Be aware that your plugin may return strange values with an ePN and that this is likely to be causedby the problem in item #4 above
7. Be prepared to debug via:
having a test ePN and
adding print statements to your plugin to display variable values to STDERR (can’t useSTDOUT)
adding print statements to p1.pl to display what ePN thinks your plugin is before it tries to runit (vi)
running the ePN in foreground mode (probably in conjunction with the formerrecommendations)
use the ’Deparse’ module on your plugin to see how the parser has optimised it and what theinterpreter will actually get. (see ’Constants in Perl’ by Sean M. Burke, The Perl Journal, Fall 2001)perl -MO::Deparse <your_program>
8. Be aware of what ePN is transforming your plugin too, and if all else fails try and debug thetransformed version.
As you can see below p1.pl rewrites your plugin as a subroutine called ’hndlr’ in the packagenamed ’Embed::<something_related_to_your_plugin_file_name>’.
Your plugin may be expecting command line arguments in @ARGV so pl.pl also assigns @_ to @ARGV.
This in turn gets ’eval’ ed and if the eval raises an error (any parse error and run error), theplugin gets chucked out.
The following output shows how a test ePN transformed the check_rpc plugin before attemptingto execute it. Most of the code from the actual plugin is not shown, as we are interested in onlythe transformations that the ePN has made to the plugin). For clarity, transformations areshown in red:
147

package main; use subs ’CORE::GLOBAL::exit’; sub CORE::GLOBAL::exit { die "ExitTrap: $_[0] (Embed::check_5frpc)"; } package Embed::check_5frpc; sub hndlr { shift(@_);@ARGV=@_;#! /usr/bin/perl -w## check_rpc plugin for Nagios## usage:# check_rpc host service## Check if an rpc serice is registered and running# using rpcinfo - $proto $host $prognum 2>&1 |";## Use these hosts.cfg entries as examples## command[check_nfs]=/some/path/libexec/check_rpc $HOSTADDRESS$ nfs# service[check_nfs]=NFS;24x7;3;5;5;unix-admin;60;24x7;1;1;1;;check_rpc## initial version: 3 May 2000 by Truongchinh Nguyen and Karl DeBisschop# current status: $Revision: 1.26.2.2 $## Copyright Notice: GPL#... rest of plugin code goes here (it was removed for brevity) ...}
9. Don’t use ’use diagnostics’ in a plugin run by your production ePN. I think it causes__all__ the Perlplugins to return CRITICAL.
10. Consider using a mini embedded Perl C program to check your plugin. This is not sufficient toguarantee your plugin will perform Ok with an ePN but if the plugin fails this test it will ceratinlyfail with your ePN. [ A sample mini ePN is included in the contrib/ directory of the Nagiosdistribution for use in testing Perl plugins. Change to the contrib/ directory and type ’makemini_epn’ to compile it. It must be executed from the same directory that the p1.pl file resides in(this file is distributed with Nagios). ]
Compiling Nagios With The Embedded Perl Interpreter
Okay, you can breathe again now. So do you still want to compile Nagios with the embedded Perlinterpreter? ;-)
If you want to compile Nagios with the embedded Perl interpreter you need to rerun the configure scriptwith the addition of the --enable-embedded-perl option. If you want the embedded interpreter to cacheinternally compiled scripts, add the --with-perlcache option as well. Example:
./configure --enable-embedded-perl --with-perlcache ...other options...
Once you’ve rerun the configure script with the new options, make sure to recompile Nagios. You cancheck to make sure that Nagios has been compile with the embedded Perl interpreter by executing itwith the -m command-line argument. Output from executing the command will look something like this(notice that the embedded perl interpreter is listed in the options section):
[nagios@firestore ]# ./nagios -m
Nagios 1.0a0 Copyright (c) 1999-2001 Ethan Galstad ([email protected]) Last Modified: 07-03-2001 License: GPL
148

External Data I/O ----------------- Object Data: DEFAULT Status Data: DEFAULT Retention Data: DEFAULT Comment Data: DEFAULT Downtime Data: DEFAULT Performance Data: DEFAULT
Options ------- * Embedded Perl compiler (With caching)
149

Adaptive Monitoring
Introduction
Nagios allows you to change certain commands and host and service check attributes during runtime.I’ll refer to this feature as "adaptive monitoring". Please note that the adaptive monitoring features foundin Nagios will probably not be of much use to 99% of users, but they do allow you to do some neat things.
What Can Be Changed?
The following service check attributes can be changed during runtime:
Check command (and command arguments)
Event handler command (and command arguments)
Check interval
Max check attempts
The following host check attributes can be changed during runtime:
Check command (and command arguments)
Event handler command (and command arguments)
Check interval
Max check attempts
The following global attributes can be changed during runtime:
Global host event handler command (and command arguments)
Global service event handler command (and command arguments)
External Commands For Adaptive Monitoring
In order to change global or host- or service-specific attributes during runtime, you must submit theappropriate external command to Nagios via the external command file. The table below lists thedifferent attributes that may be changed during runtime, along with the external command toaccomplish the job.
NOTE: When changing check commands or event handler commands, it is important to note that thesecommands must have been configured using command definitions before Nagios was started. Anyrequest to change an check or event event handler command to use a command which has not beendefined is ignore. Also of note, you specify command arguments along with the actual command name -just seperate individual arguments from the command name (and from each other) using bang (!)characters. More information on how arguments in command definitions are processed during runtimecan be found in the documentation on macros.
Attribute External Command Notes
150

Service check command CHANGE_SVC_CHECK_COMMAND:command_name
Changes theservice’scurrent checkcommand towhatever youspecify in the command_name argument.
Service event handler CHANGE_SVC_EVENT_HANDLER:command_name
Changes theservice’scurrent eventhandlercommand towhatever youspecify in the command_name argument.
Service check interval CHANGE_NORMAL_SVC_CHECK_INTERVAL:interval
Changes theservice’snormal checkinterval to bewhatever youspecify in the interval argument.
Service check retry interval CHANGE_RETRY_SVC_CHECK_INTERVAL:interval
Changes theservices’ retrycheck intervalto be whateveryou specify inthe interval argument.
Max service check attempts CHANGE_MAX_SVC_CHECK_ATTEMPTS:attempts
Changes themaximumnumber ofcheckattempts forthe service towhatever youspecify in the attempts argument.
Host check command CHANGE_HOST_CHECK_COMMAND:command_name
Changes thehost’s currentcheckcommand towhatever youspecify in the command_name argument.
151

Host event handler CHANGE_HOST_EVENT_HANDLER:command_name
Changes thehost’s currentevent handlercommand towhatever youspecify in the command_name argument.
Host check interval CHANGE_NORMAL_HOST_CHECK_INTERVAL:interval
Changes thehost’s checkinterval to bewhatever youspecify in the interval argument.
Max host check attempts CHANGE_MAX_HOST_CHECK_ATTEMPTS:attempts
Changes themaximumnumber ofcheckattempts forthe host towhatever youspecify in the attempts argument.
Global host event handler CHANGE_GLOBAL_HOST_EVENT_HANDLER;command_name
Changes thecurrent globalhost eventhandler command towhatever youspecify in the command_name argument.
Global service event handler CHANGE_GLOBAL_SVC_EVENT_HANDLER;command_name
Changes thecurrent globalservice eventhandler command towhatever youspecify in the command_name argument.
152

Object Inheritance
Introduction
This documentation attempts to explain object inheritance and how it can be used in template-basedobject definitions.
One of my primary motivations for adding support for template-based object data was its ability toeasily allow object definitions to inherit various properties from other object definitions. Object propertyinheritance is accomplished through recursion when Nagios processes your configuration files.
If you are still confused about how recursion and inheritance work after reading this, take a look at thesample object config files provided in the distribution. If that still doesn’t help, drop an email messagewith a detailed description of your problem to the nagios-users mailing list.
Basics
There are three variables affecting recursion and inheritance that are present in all object definitions.They are indicated in red as follows...
define someobjecttype{ object-specific variables ... name template_name use name_of_template_to_use register [0/1] }
The first variable is name. Its just a "template" name that can be referenced in other object definitions sothey can inherit the objects properties/variables. Template names must be unique amongst objects of thesame type, so you can’t have two or more host definitions that have "hosttemplate" as their template name.
The second variable is use. This is where you specify the name of the template object that you want toinherit properties/variables from. The name you specify for this variable must be defined as anotherobject’s template named (using the name variable).
The third variable is register. This variable is used to indicate whether or not the object definition shouldbe "registered" with Nagios. By default, all object definitions are registered. If you are using a partialobject definition as a template, you would want to prevent it from being registered (an example of this isprovided later). Values are as follows: 0 = do NOT register object definition, 1 = register object definition(this is the default). This variable is NOT inherited; every (partial) object definition used as a templatemust explicitly set the register directive to be 0. This prevents the need to override an inherited registerdirective with a value of 1 for every object that should be registered.
Local Variables vs. Inherited Variables
One important thing to understand with inheritance is that "local" object variables always takeprecedence over variables defined in the template object. Take a look at the following example of twohost definitions (not all required variables have been supplied):
153

define host{ host_name bighost1 check_command check-host-alive notification_options d,u,r max_check_attempts 5 name hosttemplate1 }
define host{ host_name bighost2 max_check_attempts 3 use hosttemplate1 }
You’ll note that the definition for host bighost1 has been defined as having hosttemplate1 as its templatename. The definition for host bighost2 is using the definition of bighost1 as its template object. OnceNagios processes this data, the resulting definition of host bighost2 would be equivalent to this definition:
define host{ host_name bighost2 check_command check-host-alive notification_options d,u,r max_check_attempts 3 }
You can see that the check_command and notification_options variables were inherited from the templateobject (where host bighost1 was defined). However, the host_name and max_check_attempts variables werenot inherited from the template object because they were defined locally. Remember, locally definedvariables override variables that would normally be inherited from a template object. That should be afairly easy concept to understand.
inheritance Chaining
Objects can inherit properties/variables from multiple levels of template objects. Take the following example:
define host{ host_name bighost1 check_command check-host-alive notification_options d,u,r max_check_attempts 5 name hosttemplate1 }
define host{ host_name bighost2 max_check_attempts 3 use hosttemplate1 name hosttemplate2 }
define host{ host_name bighost3 use hosttemplate2 }
You’ll notice that the definition of host bighost3 inherits variables from the definition of host bighost2,which in turn inherits variables from the definition of host bighost1. Once Nagios processes thisconfiguration data, the resulting host definitions are equivalent to the following:
154

define host{ host_name bighost1 check_command check-host-alive notification_options d,u,r max_check_attempts 5 }
define host{ host_name bighost2 check_command check-host-alive notification_options d,u,r max_check_attempts 3 }
define host{ host_name bighost3 check_command check-host-alive notification_options d,u,r max_check_attempts 3 }
There is no inherent limit on how "deep" inheritance can go, but you’ll probably want to limit yourself toat most a few levels in order to maintain sanity.
Using Incomplete Object Definitions as Templates
It is possible to use imcomplete object definitions as templates for use by other object definitions. By"incomplete" definition, I mean that all required variables in the object have not been supplied in theobject definition. It may sound odd to use incomplete definitions as templates, but it is in factrecommended that you use them. Why? Well, they can serve as a set of defaults for use in all other objectdefinitions. Take the following example:
define host{ check_command check-host-alive notification_options d,u,r max_check_attempts 5 name generichosttemplate register 0 }
define host{ host_name bighost1 address 192.168.1.3 use generichosthosttemplate }
define host{ host_name bighost2 address 192.168.1.4 use generichosthosttemplate }
Notice that the first host definition is incomplete because it is missing the required host_name variable.We don’t need to supply a host name because we just want to use this definition as a generic hosttemplate. In order to prevent this definition from being registered with Nagios as a normal host, we setthe register variable to 0.
The definitions of hosts bighost1 and bighost2 inherit their values from the generic host definition. Theonly variable we’ve chosed to override is the address variable. This means that both hosts will have theexact same properties, except for their host_name and address variables. Once Nagios processes the configdata in the example, the resulting host definitions would be equivalent to specifying the following:
155

define host{ host_name bighost1 address 192.168.1.3 check_command check-host-alive notification_options d,u,r max_check_attempts 5 }
define host{ host_name bighost2 address 192.168.1.4 check_command check-host-alive notification_options d,u,r max_check_attempts 5 }
At the very least, using a template definition for default variables will save you a lot of typing. It’ll alsosave you a lot of headaches later if you want to change the default values of variables for a large numberof hosts.
156

Time-Saving Tricks For Object Definitionsor...
"How To Preserve Your Sanity"
Introduction
This documentation attempts to explain how you can exploit the (somewhat) hidden features of template-based object definitions to save your sanity. How so, you ask? Several types of objects allowyou to specify multiple host names and/or hostgroup names in definitions, allowing you to "copy" theobject defintion to multiple hosts or services. I’ll cover each type of object that supports these featuresseperately. For starters, the object types which support this time-saving feature are as follows:
Services
Service escalations
Service dependencies
Host escalations
Host dependencies
Hostgroups
Object types that are not listed above (i.e. timeperiods, commands, etc.) do not support the features I’mabout to describe.
Regular Expression Matching
The examples I give below use "standard" matching of object names. If you wish, you can enable regularexpression matching for object names by using the use_regexp_matching config option. By default,regular expression matching will only be used in object names that contain the * and ? wildcardcharacters. If you want regular expression matching to be used on all object names (regardless ofwhether or not they contain the * and ? wildcard characters), enable the use_true_regexp_matchingconfig option.
Regular expressions can be used in any of the fields used in the examples below (host names, hostgroupnames, service names, and servicegroup names).
NOTE: Be careful when enabling regular expression matching - you may have to change your config file,since some directives that you might not want to be interpreted as a regular expression just might be!Any problems should become evident once you verify your configuration.
Service Definitions
Multiple Hosts: If you want to create identical services that are assigned to multiple hosts, you canspecify multiple hosts in the host_name directive as follows:
define service{ host_name HOST1,HOST2,HOST3,...,HOSTN service_description SOMESERVICE other service directives ... }
The definition above would create a service called SOMESERVICE on hosts HOST1 through HOSTN. Allthe instances of the SOMESERVICE service would be identical (i.e. have the same check command, maxcheck attempts, notification period, etc.).
157

All Hosts In Multiple Hostgroups: If you want to create identical services that are assigned to all hostsin one or more hostgroups, you can do so by creating a single service definition. How? The hostgroup_name directive allows you to specify the name of one or more hostgroups that the serviceshould be created for:
define service{ hostgroup_name HOSTGROUP1,HOSTGROUP2,...,HOSTGROUPN service_description SOMESERVICE other service directives ... }
The definition above would create a service called SOMESERVICE on all hosts that are members ofhostgroups HOSTGROUP1 through HOSTGROUPN. All the instances of the SOMESERVICE servicewould be identical (i.e. have the same check command, max check attempts, notification period, etc.).
All Hosts: If you want to create identical services that are assigned to all hosts that are defined in yourconfiguration files, you can use a wildcard in the host_name directive as follows:
define service{ host_name * service_description SOMESERVICE other service directives ... }
The definition above would create a service called SOMESERVICE on all hosts that are defined in yourconfiguration files. All the instances of the SOMESERVICE service would be identical (i.e. have the samecheck command, max check attempts, notification period, etc.).
Service Escalation Definitions
Multiple Hosts: If you want to create service escalations for services of the same name/description thatare assigned to multiple hosts, you can specify multiple hosts in the host_name directive as follows:
define serviceescalation{ host_name HOST1,HOST2,HOST3,...,HOSTN service_description SOMESERVICE other escalation directives ... }
The definition above would create a service escalation for services called SOMESERVICE on hosts HOST1 through HOSTN. All the instances of the service escalation would be identical (i.e. have the samecontact groups, notification interval, etc.).
All Hosts In Multiple Hostgroups: If you want to create service escalations for services of the samename/description that are assigned to all hosts in in one or more hostgroups, you can do use the hostgroup_name directive as follows:
define serviceescalation{ hostgroup_name HOSTGROUP1,HOSTGROUP2,...,HOSTGROUPN service_description SOMESERVICE other escalation directives ... }
The definition above would create a service escalation for services called SOMESERVICE on all hoststhat are members of hostgroups HOSTGROUP1 through HOSTGROUPN. All the instances of the serviceescalation would be identical (i.e. have the same contact groups, notification interval, etc.).
158

All Hosts: If you want to create identical service escalations for services of the same name/descriptionthat are assigned to all hosts that are defined in your configuration files, you can use a wildcard in the host_name directive as follows:
define serviceescalation{ host_name * service_description SOMESERVICE other escalation directives ... }
The definition above would create a service escalation for all services called SOMESERVICE on all hoststhat are defined in your configuration files. All the instances of the service escalation would be identical(i.e. have the same contact groups, notification interval, etc.).
All Services On Same Host: If you want to create service escalations for all services assigned to aparticular host, you can use a wildcard in the service_description directive as follows:
define serviceescalation{ host_name HOST1 service_description * other escalation directives ... }
The definition above would create a service escalation for all services on host HOST1. All the instancesof the service escalation would be identical (i.e. have the same contact groups, notification interval, etc.).
If you feel like being particularly adventurous, you can specify a wildcard in both the host_name and service_description directives. Doing so would create a service escalation for all services that you’vedefined in your configuration files.
Multiple Services On Same Host: If you want to create service escalations for all multiple servicesassigned to a particular host, you can use a specify more than one service description in the service_description directive as follows:
define serviceescalation{ host_name HOST1 service_description SERVICE1,SERVICE2,...,SERVICEN other escalation directives ... }
The definition above would create a service escalation for services SERVICE1 through SERVICEN onhost HOST1. All the instances of the service escalation would be identical (i.e. have the same contactgroups, notification interval, etc.).
All Services In Multiple Servicegroups: If you want to create service escalations for all services thatbelong in one or more servicegroups, you can do use the servicegroup_name directive as follows:
define serviceescalation{ servicegroup_name SERVICEGROUP1,SERVICEGROUP2,...,SERVICEGROUPN other escalation directives ... }
The definition above would create service escalations for all services that are members of servicegroups SERVICEGROUP1 through SERVICEGROUPN. All the instances of the service escalation would beidentical (i.e. have the same contact groups, notification interval, etc.).
Service Dependency Definitions
159

Multiple Hosts: If you want to create service dependencies for services of the same name/descriptionthat are assigned to multiple hosts, you can specify multiple hosts in the host_name and or dependent_host_name directives as follows:
define servicedependency{ host_name HOST1,HOST2 service_description SERVICE1 dependent_host_name HOST3,HOST4 dependent_service_description SERVICE2 other dependency directives ... }
In the example above, service SERVICE2 on hosts HOST3 and HOST4 would be dependent on service SERVICE1 on hosts HOST1 and HOST2. All the instances of the service dependencies would be identicalexcept for the host names (i.e. have the same notification failure criteria, etc.).
All Hosts In Multiple Hostgroups: If you want to create service dependencies for services of the samename/description that are assigned to all hosts in in one or more hostgroups, you can do use the hostgroup_name and/or dependent_hostgroup_name directives as follows:
define servicedependency{ hostgroup_name HOSTGROUP1,HOSTGROUP2 service_description SERVICE1 dependent_hostgroup_name HOSTGROUP3,HOSTGROUP4 dependent_service_description SERVICE2 other dependency directives ... }
In the example above, service SERVICE2 on all hosts in hostgroups HOSTGROUP3 and HOSTGROUP4would be dependent on service SERVICE1 on all hosts in hostgroups HOSTGROUP1 and HOSTGROUP2. Assuming there were five hosts in each of the hostgroups, this definition would beequivalent to creating 100 single service dependency definitions! All the instances of the servicedependency would be identical except for the host names (i.e. have the same notification failure criteria, etc.).
All Services On Same Host: If you want to create service dependencies for all services assigned to aparticular host, you can use a wildcard in the service_description and/or dependent_service_descriptiondirectives as follows:
define servicedependency{ host_name HOST1 service_description * dependent_host_name HOST2 dependent_service_description * other dependency directives ... }
In the example above, all services on host HOST2 would be dependent on all services on host HOST1.All the instances of the service dependencies would be identical (i.e. have the same notification failurecriteria, etc.).
Multiple Services On Same Host: If you want to create service dependencies for multiple servicesassigned to a particular host, you can specify more than one service description in the service_descriptionand/or dependent_service_description directives as follows:
160

define servicedependency{ host_name HOST1 service_description SERVICE1,SERVICE2,...,SERVICEN dependent_host_name HOST2 dependent_service_description SERVICE1,SERVICE2,...,SERVICEN other dependency directives ... }
All Services In Multiple Servicegroups: If you want to create service dependencies for all services thatbelong in one or more servicegroups, you can do use the servicegroup_name and/or dependent_servicegroup_name directive as follows:
define servicedependency{ servicegroup_name SERVICEGROUP1,SERVICEGROUP2,...,SERVICEGROUPN dependent_servicegroup_name SERVICEGROUP3,SERVICEGROUP4,...SERVICEGROUPN other escalation directives ... }
Host Escalation Definitions
Multiple Hosts: If you want to create host escalations for multiple hosts, you can specify multiple hostsin the host_name directive as follows:
define hostescalation{ host_name HOST1,HOST2,HOST3,...,HOSTN other escalation directives ... }
The definition above would create a host escalation for hosts HOST1 through HOSTN. All the instancesof the host escalation would be identical (i.e. have the same contact groups, notification interval, etc.).
All Hosts In Multiple Hostgroups: If you want to create host escalations for all hosts in in one or morehostgroups, you can do use the hostgroup_name directive as follows:
define hostescalation{ hostgroup_name HOSTGROUP1,HOSTGROUP2,...,HOSTGROUPN other escalation directives ... }
The definition above would create a host escalation on all hosts that are members of hostgroups HOSTGROUP1 through HOSTGROUPN. All the instances of the host escalation would be identical (i.e.have the same contact groups, notification interval, etc.).
All Hosts: If you want to create identical host escalations for all hosts that are defined in yourconfiguration files, you can use a wildcard in the host_name directive as follows:
define hostescalation{ host_name * other escalation directives ... }
The definition above would create a hosts escalation for all hosts that are defined in your configurationfiles. All the instances of the host escalation would be identical (i.e. have the same contact groups,notification interval, etc.).
Host Dependency Definitions
Multiple Hosts: If you want to create host dependencies for multiple hosts, you can specify multiplehosts in the host_name and/or dependent_host_name directives as follows:
161

define hostdependency{ host_name HOST1,HOST2 dependent_host_name HOST3,HOST4,HOST5 other dependency directives ... }
The definition above would be equivalent to creating six seperate host dependencies. In the exampleabove, hosts HOST3, HOST4 and HOST5 would be dependent upon both HOST1 and HOST2. All theinstances of the host dependencies would be identical except for the host names (i.e. have the samenotification failure criteria, etc.).
All Hosts In Multiple Hostgroups: If you want to create host escalations for all hosts in in one or morehostgroups, you can do use the hostgroup_name and /or dependent_hostgroup_name directives as follows:
define hostdependency{ hostgroup_name HOSTGROUP1,HOSTGROUP2 dependent_hostgroup_name HOSTGROUP3,HOSTGROUP4 other dependency directives ... }
In the example above, all hosts in hostgroups HOSTGROUP3 and HOSTGROUP4 would be dependenton all hosts in hostgroups HOSTGROUP1 and HOSTGROUP2. All the instances of the hostdependencies would be identical except for host names (i.e. have the same notification failure criteria, etc.).
Hostgroups
All Hosts: If you want to create a hostgroup that has all hosts that are defined in your configuration filesas members, you can use a wildcard in the members directive as follows:
define hostgroup{ hostgroup_name HOSTGROUP1 members * other hostgroup directives ... }
The definition above would create a hostgroup called HOSTGROUP1 that has all all hosts that aredefined in your configuration files as members.
162

UCD-SNMP (NET-SNMP) Integration
Note: Nagios is not designed to be a replacement for a full-blown SNMP management application likeHP OpenView or OpenNMS. However, you can set things up so that SNMP traps received by a host onyour network can generate alerts in Nagios. Here’s how...
Introduction
This example explains how to easily generate alerts in Nagios for SNMP traps that are received by the UCD-SNMP snmptrapd daemon. These directions assume that the host which is receiving SNMP traps isnot the same host on which Nagios is running. If your monitoring box is the same box that is receivingSNMP traps you will need to make a few modifications to the examples I provide. Also, I am assumingthat you having installed the nsca daemon on your monitoring server and the nsca client (send_nsca) onthe machine that is receiving SNMP traps.
For the purposes of this example, I will be describing how I setup Nagios to generate alerts from SNMPtraps received by the ArcServe backup jobs running on my Novell servers. I wanted to get notified whenbackups failed, so this worked very nicely for me. You’ll have to tweak the examples in order to make itsuit your needs.
Additional Software
Translating SNMP traps into Nagios events can be a bit tedious. If you’d like to make it easier, youmight want to check out Alex Burger’s SNMP Trap Translator project located at http://www.snmptt.orgwhich, combined with Net-SNMP, provides a more enhanced trap handling system. The snmpttdocumentation includes integration details for Nagios.
Defining The Service
First off you’re going to have to define a service in your object configuration file for the SNMP traps (inthis example, I am defining a service for ArcServe backup jobs). Assuming that the host that the alertsare originating from is called novellserver, a sample service definition might look something like this:
define service{ host_name novellserver service_description ArcServe Backup is_volatile 1 active_checks_enabled 0 passive_checks_enabled 1 max_check_attempts 1 contact_groups novell-backup-admins notification_interval 120 notification_period 24x7 notification_options w,u,c,r check_command check_none }
Important things to note are the fact that this service has the volatile option enabled. We want this optionenabled because we want a notification to be generated for every alert that comes in. Also of note is thefact that active checks are disabled for the service, while passive checks are enabled. This means that theservice will never be actively checked - all alert information will have to be sent in passively by the nsca client on the SNMP management host (in my example, it will be called firestorm).
ArcServe and Novell SNMP Configuration
163

In order to get ArcServe (and my Novell server) to send SNMP traps to my management host, I had todo the following:
1. Modify the ArcServe autopilot job to send SNMP traps on job failures, successes, etc.
2. Edit SYS:\ETC\TRAPTARG.CFG and add the IP address of my management host (the onereceiving the SNMP traps)
3. Load SNMP.NLM
4. Load ALERT.NLM to facilitate the actual sending of the SNMP traps
SNMP Management Host Configuration
On my Linux SNMP management host (firestorm), I installed the UCD-SNMP (NET-SNMP) software.Once the software was installed I had to do the following:
1. Install the ArcServe MIBs (included on the ArcServe installation CD)
2. Edit the snmptrapd configuration file (/etc/snmp/snmptrapd.conf) to define a trap handler forArcServe alerts. This is detailed below.
3. Start the snmptrapd daemon to listen for incoming SNMP traps
In order to have the snmptrapd daemon route ArcServe SNMP traps to our Nagios host, we’ve got todefine a traphandler in the /etc/snmp/snmptrapd.conf file. In my setup, the config file looked somethinglike this:
############################## ArcServe SNMP Traps#############################
# Tape format failurestraphandle ARCserve-Alarm-MIB::arcServetrap9 /usr/local/nagios/libexec/eventhandlers/handle-arcserve-trap 9
# Failure to read tape headertraphandle ARCserve-Alarm-MIB::arcServetrap10 /usr/local/nagios/libexec/eventhandlers/handle-arcserve-trap 10
# Failure to position tapetraphandle ARCserve-Alarm-MIB::arcServetrap11 /usr/local/nagios/libexec/eventhandlers/handle-arcserve-trap 11
# Cancelled jobstraphandle ARCserve-Alarm-MIB::arcServetrap12 /usr/local/nagios/libexec/eventhandlers/handle-arcserve-trap 12
# Successful jobstraphandle ARCserve-Alarm-MIB::arcServetrap13 /usr/local/nagios/libexec/eventhandlers/handle-arcserve-trap 13
# Imcomplete jobstraphandle ARCserve-Alarm-MIB::arcServetrap14 /usr/local/nagios/libexec/eventhandlers/handle-arcserve-trap 14
# Job failurestraphandle ARCserve-Alarm-MIB::arcServetrap15 /usr/local/nagios/libexec/eventhandlers/handle-arcserve-trap 15
This example assumes that you have a /usr/local/nagios/libexec/eventhandlers/ directory on your SNMPmangement host and that the handle-arcserve-trap script exists there. You can modify these to fit yoursetup. Anyway, the handle-arcserve-trap script on my management host looked something like this:
#!/bin/sh
# Arguments:# $1 = trap type
# First line passed from snmptrapd is FQDN of host that sent the trap read host
# Given a FQDN, get the short name of the host as it is setup in Nagios hostname="unknown" case $host in novellserver.mylocaldomain.com) hostname="novellserver" ;;
164

nt.mylocaldomain.com) hostname="ntserver" ;; esac # Get severity level (OK, WARNING, UNKNOWN, or CRITICAL) and plugin output based on trape type state=-1 output="No output" case "$1" in
# failed to format tape - critical 11) output="Critical: Failed to format tape" state=2 ;;
# failed to read tape header - critical 10) output="Critical: Failed to read tape header" state=2 ;;
# failed to position tape - critical 11) output="Critical: Failed to position tape" state=2 ;;
# backup cancelled - warning 12) output="Warning: ArcServe backup operation cancelled" state=1 ;;
# backup success - ok 13) output="Ok: ArcServe backup operation successful" state=0 ;;
# backup incomplete - warning 14) output="Warning: ArcServe backup operation incomplete" state=1 ;;
# backup failure - critical 15) output="Critical: ArcServe backup operation failed" state=2 ;; esac
# Submit passive check result to monitoring host /usr/local/nagios/libexec/eventhandlers/submit_check_result $hostname "ArcServe Backup" $state "$output"
exit 0
Notice that the handle-arcserve-trap script calls the submit_check_result script to actually send the alert backto the monitoring host. Assuming your monitoring host is called monitor, the submit check_result scriptmight look like this (you’ll have to modify this to specify the proper location of the send_nsca programon your management host):
#!/bin/sh
# Arguments# $1 = name of host in service definition# $2 = name/description of service in service definition# $3 = return code# $4 = output
/bin/echo -e "$1\t$2\t$3\t$4\n" | /usr/local/nagios/bin/send_nsca monitor -c /usr/local/nagios/etc/send_nsca.cfg
165

Finishing Up
You’ve now configured everything you need to, so all you have to do is restart the Nagios on yourmonitoring server. That’s it! You should be getting alerts in Nagios whenever ArcServe jobs fail,succeed, etc.
166

TCP Wrapper Integration
Introduction
This example explains how to easily generate alerts in Nagios for connection attempts that are rejectedby TCP wrappers. These directions assume that the host which you are generating alerts for (i.e. the hostyou are using TCP wrappers on) is not the same host on which Nagios is running. If you want togenerate alerts on the same host that Nagios is running you will need to make a few modifications to theexamples I provide. Also, I am assuming that you having installed the nsca daemon on your monitoringserver and the nsca client (send_nsca) on the machine that you are generating TCP wrapper alerts from.
Defining The Service
First off you’re going to have to define a service in your object configuration file for the TCP wrapperalerts. Assuming that the host that the alerts are originating from is called firestorm, a sample servicedefinition might look something like this:
define service{ host_name firestorm service_description TCP Wrappers is_volatile 1 active_checks_enabled 0 passive_checks_enabled 1 max_check_attempts 1 contact_groups security-admins notification_interval 120 notification_period 24x7 notification_options w,u,c,r check_command check_none }
Important things to note are the fact that this service has the volatile option enabled. We want this optionenabled because we want a notification to be generated for every alert that comes in. Also of note is thefact that active checks of the service as disabled, while passive checks are enabled. This means that theservice will never be actively checked - all alert information will have to be sent in passively by the nsca client on the firestorm host.
Configuring TCP Wrappers
Now you’re going to have to modify the /etc/hosts.deny file on the host called firestorm. In order to havethe TCP wrappers send an alert to the monitoring host whenever a connection attempt is denied, you’llhave to add a line similiar to the following:
ALL: ALL: RFC931: twist (/usr/local/nagios/libexec/eventhandlers/handle_tcp_wrapper %h %d) &
This line assumes that there is a script called handle_tcp_wrapper in the /usr/local/nagios/libexec/eventhandlers/ directory on firestorm. The directory and script name can bechanged to whatever you want.
Writing The Script
The last thing you need to do is write the handle_tcp_wrapper script on firestorm that will send the alertback to the monitoring host. It might look something like this:
#!/bin/sh
/usr/local/nagios/libexec/eventhandlers/submit_check_result firestorm "TCP Wrappers" 2 "Denied $2-$1" > /dev/null 2> /dev/null
167

Notice that the handle_tcp_wrapper script calls the submit_check_result script to actually send the alert backto the monitoring host. Assuming your monitoring host is called monitor, the submit check_result scriptmight look like this (you’ll have to modify this to specify the proper location of the send_nsca programon firestorm):
#!/bin/sh
# Arguments# $1 = name of host in service definition# $2 = name/description of service in service definition# $3 = return code# $4 = output
/bin/echo -e "$1\t$2\t$3\t$4\n" | /usr/local/nagios/bin/send_nsca monitor -c /usr/local/nagios/etc/send_nsca.cfg
Finishing Up
You’ve now configured everything you need to, so all you have to do is restart the inetd process on firestorm and restart Nagios on your monitoring server. That’s it! When the TCP wrappers on firestormdeny a connection attempt, you should be getting alerts in Nagios. The plugin output for the alert willlook something like the following:
Denied sshd2-sdn-ar-002mnminnP321.dialsprint.net
168

Securing Nagios
Introduction
This is intended to be a brief overview of some things you should keep in mind when installing Nagios,so as to not set it up in an insecure manner. This document is new, so if anyone has additional notes orcomments on securing Nagios, please drop me a note at [email protected]
Do Not Run Nagios As Root!
Nagios doesn’t need to run as root, so don’t do it. Even if you start Nagios at boot time with an initscript, you can force it to drop privileges after startup and run as another user/group by using the nagios_user and nagios_group directives in the main config file.
If you need to execute event handlers or plugins which require root access, you might want to try using sudo.
Enable External Commands Only If Necessary
By default, external commands are disabled. This is done to prevent an admin from setting up Nagiosand unknowingly leaving its command interface open for use by "others".. If you are planning on using event handlers or issuing commands from the web interface, you will have to enable externalcommands. If you aren’t planning on using event handlers or the web interface to issue commands, Iwould recommend leaving external commands disabled.
Set Proper Permissions On The External Command File
If you enable external commands, make sure you set proper permissions on the /usr/local/nagios/var/rwdirectory. You only want the Nagios user (usually nagios) and the web server user (usually nobody) tohave permissions to write to the command file. If you’ve installed Nagios on a machine that is dedicatedto monitoring and admin tasks and is not used for public accounts, that should be fine.
If you’ve installed it on a public or multi-user machine, allowing the web server user to have writeaccess to the command file can be a security problem. After all, you don’t want just any user on yoursystem controlling Nagios through the external command file. In this case, I would suggest onlygranting write access on the command file to the nagios user and using something like CGIWrap to runthe CGIs as the nagios user instead of nobody.
Instructions on setting up permissions for the external command file can be found here.
Require Authentication In The CGIs
I would strongly suggest requiring authentication for accessing the CGIs. Once you do that, read thedocumentation on the default rights that authenticated contacts have, and only authorize specificcontacts for additional rights as necessary. Instructions on setting up authentication and configuringauthorization rights can be found here. If you disable the CGI authentication features using the use_authentication directive in the CGI config file, the command CGI will refuse to write any commandsto the external command file. After all, you don’t want the world to be able to control Nagios do you?
Use Full Paths In Command Definitions
When you define commands, make sure you specify the full path to any scripts or binaries you’re executing.
169

Hide Sensitive Information With $USERn$ Macros
The CGIs read the main config file and object config file(s), so you don’t want to keep any sensitiveinformation (usernames, passwords, etc) in there. If you need to specify a username and/or password ina command definition use a $USERn$ macro to hide it. $USERn$ macros are defined in one or more resource files. The CGIs will not attempt to read the contents of resource files, so you can set morerestrictive permissions (600 or 660) on them. See the sample resource.cfg file in the base of the Nagiosdistribution for an example of how to define $USERn$ macros.
Strip Dangerous Characters From Macros
Use the illegal_macro_output_chars directive to strip dangerous characters from the $HOSTOUTPUT$,$SERVICEOUTPUT$, $HOSTPERFDATA$, and $SERVICEPERFDATA$ macros before they’re used innotifications, etc. Dangerous characters can be anything that might be interpreted by the shell, therebyopening a security hole. An example of this is the presence of backtick (‘) characters in the$HOSTOUTPUT$, $SERVICEOUTPUT$, $HOSTPERFDATA$, and/or $SERVICEPERFDATA$ macros,which could allow an attacker to execute an arbitrary command as the nagios user (one good reason notto run Nagios as the root user).
170

Tuning Nagios For Maximum Performance
Introduction
So you’ve finally got Nagios up and running and you want to know how you can tweak it a bit... Hereare a few things to look at for optimizing Nagios. Let me know if you think of any others...
Optimization Tips:
1. Use aggregated status updates. Enabling aggregated status updates (with the aggregate_status_updates option) will greatly reduce the load on your monitoring host because itwon’t be constantly trying to update the status log. This is especially recommended if you aremonitoring a large number of services. The main trade-off with using aggregated status updates isthat changes in the states of hosts and services will not be reflected immediately in the status file.This may or may not be a big concern for you.
2. Use a ramdisk for holding status data. If you’re using the standard status log and you’re not usingaggregated status updates, consider putting the directory where the status log is stored on aramdisk. This will speed things up quite a bit (in both the core program and the CGIs) because itsaves a lot of interrupts and disk thrashing.
3. Check service latencies to determine best value for maximum concurrent checks. Nagios canrestrict the number of maximum concurrently executing service checks to the value you specifywith the max_concurrent_checks option. This is good because it gives you some control over howmuch load Nagios will impose on your monitoring host, but it can also slow things down. If you areseeing high latency values (> 10 or 15 seconds) for the majority of your service checks (via the extinfo CGI), you are probably starving Nagios of the checks it needs. That’s not Nagios’s fault - itsyours. Under ideal conditions, all service checks would have a latency of 0, meaning they wereexecuted at the exact time that they were scheduled to be executed. However, it is normal for somechecks to have small latency values. I would recommend taking the minimum number of maximumconcurrent checks reported when running Nagios with the -s command line argument and doublingit. Keep increasing it until the average check latency for your services is fairly low. Moreinformation on service check scheduling can be found here.
4. Use passive checks when possible. The overhead needed to process the results of passive service checks is much lower than that of "normal" active checks, so make use of that piece of info if you’remonitoring a slew of services. It should be noted that passive service checks are only really useful ifyou have some external application doing some type of monitoring or reporting, so if you’re havingNagios do all the work, this won’t help things.
5. Avoid using interpreted plugins. One thing that will significantly reduce the load on yourmonitoring host is the use of compiled (C/C++, etc.) plugins rather than interpreted script (Perl, etc)plugins. While Perl scripts and such are easy to write and work well, the fact that they arecompiled/interpreted at every execution instance can significantly increase the load on yourmonitoring host if you have a lot of service checks. If you want to use Perl plugins, considercompiling them into true executables using perlcc(1) (a utility which is part of the standard Perldistribution) or compiling Nagios with an embedded Perl interpreter (see below).
6. Use the embedded Perl interpreter. If you’re using a lot of Perl scripts for service checks, etc., youwill probably find that compiling an embedded Perl interpreter into the Nagios binary will speedthings up. In order to compile in the embedded Perl interpreter, you’ll need to supply the --enable-embedded-perl option to the configure script before you compile Nagios. Also, if you use the --with-perlcache option, the compiled version of all Perl scripts processed by the embeddedinterpreter will be cached for later reuse.
7. Optimize host check commands. If you’re checking host states using the check_ping plugin you’llfind that host checks will be performed much faster if you break up the checks. Instead of specifyinga max_attempts value of 1 in the host definition and having the check_ping plugin send 10 ICMP
171

packets to the host, it would be much faster to set the max_attempts value to 10 and only send out 1ICMP packet each time. This is due to the fact that Nagios can often determine the status of a host afterexecuting the plugin once, so you want to make the first check as fast as possible. This method does haveits pitfalls in some situations (i.e. hosts that are slow to respond may be assumed to be down), but Iyou’ll see faster host checks if you use it. Another option would be to use a faster plugin (i.e.check_fping) as the host_check_command instead of check_ping.
8. Don’t schedule regular host checks. Do NOT schedule regular checks of hosts unless absolutelynecessary. There are not many reasons to do this, as host checks are performed on-demand as needed.To disable regular checks of a host, set the check_interval directive in the host definition to 0. If youdo need to have regularly scheduled host checks, try to use a longer check interval and make sure yourhost checks are optimized (see above).
9. Don’t use agressive host checking. Unless you’re having problems with Nagios recognizing hostrecoveries, I would recommend not enabling the use_aggressive_host_checking option. With thisoption turned off host checks will execute much faster, resulting in speedier processing of service checkresults. However, host recoveries can be missed under certain circumstances when this it turned off. Forexample, if a host recovers and all of the services associated with that host stay in non-OK states (anddon’t "wobble" between different non-OK states), Nagios may miss the fact that the host has recovered.A few people may need to enable this option, but the majority don’t and I would recommend notusing it unless you find it necessary...
10. Increase external command check interval. If you’re processing a lot of external commands (i.e.passive checks in a distributed setup, you’ll probably want to set the command_check_intervalvariable to -1. This will cause Nagios to check for external commands as often as possible. This isimportant because most systems have small pipe buffer sizes (i.e. 4KB). If Nagios doesn’t read the datafrom the pipe fast enough, applications that write to the external command file (i.e. the NSCA daemon) will block and wait until there is enough free space in the pipe to write their data.
11. Optimize hardware for maximum performance. Your system configuration and your hardwaresetup are going to directly affect how your operating system performs, so they’ll affect how Nagiosperforms. The most common hardware optimization you can make is with your hard drives. CPU andmemory speed are obviously factors that affect performance, but disk access is going to be your biggestbottlenck. Don’t store plugins, the status log, etc on slow drives (i.e. old IDE drives or NFS mounts). Ifyou’ve got them, use UltraSCSI drives or fast IDE drives. An important note for IDE/Linux users is thatmany Linux installations do not attempt to optimize disk access. If you don’t change the disk accessparameters (by using a utility like hdparam), you’ll loose out on a lot of the speedy features of thenew IDE drives.
172

Using The Nagiostats Utility
Introduction
A utility called nagiostats is included in the Nagios distribution. It is compiled and installed along withthe main Nagios daemon.
The nagiostats utility allows you to obtain various information about a running Nagios process. You canobtain information either in human-readable or MRTG-compatible format.
Usage Information
You can run the nagiostats utility with the --help option to get usage information:
[nagios@lanman ~]# /usr/local/nagios/bin/nagiostats --help
Nagios Stats 2.0a1Copyright (c) 2003 Ethan Galstad ([email protected])Last Modified: 11-18-2003License: GPL
Usage: /usr/local/nagios/bin/nagiostats [options]
Startup: -V, --version display program version information and exit. -L, --license display license information and exit. -h, --help display usage information and exit.
Input file: -c, --config=FILE specifies location of main Nagios config file.
Output: -m, --mrtg display output in MRTG compatible format. -d, --data=VARS comma-seperated list of variables to output in MRTG (or compatible) format. See possible values below. Percentages are rounded, times are in milliseconds.
MRTG DATA VARIABLES (-d option): NUMSERVICES total number of services. NUMHOSTS total number of services. NUMSVCOK number of services OK. NUMSVCWARN number of services WARNING. NUMSVCUNKN number of services UNKNOWN. NUMSVCCRIT number of services CRITICAL. NUMSVCPROB number of service problems (WARNING, UNKNOWN or CRITIAL). NUMHSTUP number of hosts UP. NUMHSTDOWN number of hosts DOWN. NUMHSTUNR number of hosts UNREACHABLE. NUMHSTPROB number of host problems (DOWN or UNREACHABLE). xxxACTSVCLAT MIN/MAX/AVG active service check latency (ms). xxxACTSVCEXT MIN/MAX/AVG active service check execution time (ms). xxxACTSVCPSC MIN/MAX/AVG active service check % state change. xxxPSVSVCPSC MIN/MAX/AVG passive service check % state change. xxxSVCPSC MIN/MAX/AVG service check % state change. xxxACTHSTLAT MIN/MAX/AVG active host check latency (ms). xxxACTHSTEXT MIN/MAX/AVG active host check execution time (ms). xxxACTHSTPSC MIN/MAX/AVG active host check % state change. xxxPSVHSTPSC MIN/MAX/AVG passive host check % state change. xxxHSTPSC MIN/MAX/AVG host check % state change. NUMACTHSTCHKxM number of active host checks in last 1/5/15/60 minutes. NUMPSVHSTCHKxM number of passive host checks in last 1/5/15/60 minutes. NUMACTSVCCHKxM number of active service checks in last 1/5/15/60 minutes.
173

NUMPSVSVCCHKxM number of passive service checks in last 1/5/15/60 minutes.
Note: Replace x’s in MRTG variable names with ’MIN’, ’MAX’, ’AVG’, or the the appropriate number (i.e. ’1’, ’5’, ’15’, or ’60’).
[nagios@lanman ~]#
Human-Readable Output
For normal operation, run the nagiostats utility, specifying only the config file location as an argument, as follows:
[nagios@lanman ~]# /usr/local/nagios/bin/nagiostats -c /usr/local/nagios/etc/nagios.cfg
Nagios Stats 2.0a1Copyright (c) 2003 Ethan Galstad ([email protected])Last Modified: 11-18-2003License: GPL
CURRENT STATUS DATA----------------------------------------------------Status File: /usr/local/nagios/var/status.datStatus File Age: 0d 0h 0m 13sStatus File Version: 2.0-very-pre-alpha
Program Running Time: 14d 17h 19m 13s
Total Services: 32Services Checked: 32Services Scheduled: 29Active Service Checks: 29Passive Service Checks: 3Total Service State Change: 0.000 / 65.530 / 2.930 %Active Service Latency: 0.048 / 14.837 / 1.035 %Active Service Execution Time: 0.076 / 60.006 / 4.301 secActive Service State Change: 0.000 / 10.530 / 0.762 %Active Services Last 1/5/15/60 min: 1 / 13 / 29 / 29Passive Service State Change: 0.000 / 65.530 / 23.883 %Passive Services Last 1/5/15/60 min: 0 / 0 / 0 / 0Services Ok/Warn/Unk/Crit: 23 / 5 / 1 / 3Services Flapping: 1Services In Downtime: 0
Total Hosts: 9Hosts Checked: 9Hosts Scheduled: 9Active Host Checks: 9Passive Host Checks: 0Total Host State Change: 0.000 / 28.420 / 4.034 %Active Host Latency: 0.000 / 15.741 / 5.443 %Active Host Execution Time: 1.022 / 10.032 / 3.047 secActive Host State Change: 0.000 / 28.420 / 4.034 %Active Hosts Last 1/5/15/60 min: 0 / 8 / 9 / 9Passive Host State Change: 0.000 / 0.000 / 0.000 %Passive Hosts Last 1/5/15/60 min: 0 / 0 / 0 / 0Hosts Up/Down/Unreach: 7 / 1 / 1Hosts Flapping: 0Hosts In Downtime: 0
[nagios@lanman ~]#
174

As you can see, the utility displays a number of different metrics pertaining to the Nagios process.Metrics which have multiple values are (unless otherwise specified) min, max and average values forthat partciular metric.
MRTG Integration
You can use the nagiostats utility to display various Nagios metrics using MRTG (or other compatibleprogram). To do so, run the nagiostats utility using the --mrtg and --data arguments. The --data argumentis used to specify what statistics should be graphed. Possible values for the --data argument can befound by running the nagiostats utility with the --help option.
Here’s an MRTG config file snippet for using the nagiostats utility for graphing average service latencyand execution time.
# Service Latency and Execution TimeTarget[nagios-a]: ‘/usr/local/nagios/bin/nagiostats --mrtg --data=AVGACTSVCLAT,AVGACTSVCEXT‘MaxBytes[nagios-a]: 100000Title[nagios-a]: Average Service Check Latency and Execution TimePageTop[nagios-a]: <H1>Average Service Check Latency and Execution Time</H1>Options[nagios-a]: growright,gauge,nopercentYLegend[nagios-a]: MillisecondsShortLegend[nagios-a]: LegendI[nagios-a]: Latency:LegendO[nagios-a]: Execution Time:Legend1[nagios-a]: LatencyLegend2[nagios-a]: Execution TimeLegend3[nagios-a]: Maximal 5 Minute LatencyLegend4[nagios-a]: Maximal 5 Minute Execution Time
The MRTG graphs generated from the above config snippet look like this:
175

176

Using Macros In Commands
Macros
One of the features available in Nagios is the ability to use macros in command defintions. Immediatelyprior to the execution of a command, Nagios will replace all macros in the command with theircorresponding values. This allows you to define a few generic commands to handle all your needs.
Macro Substitution
Before any commands (host and service checks, notifications, event handlers, etc.) are executed, Nagioswill replace any macros it finds in the command definition with their corresponding values.
When you use host and service macros in command definitions, they refer to values for the host orservice for which the command is being run. Let’s try an example. Assuming we are using a hostdefinition and a check_ping command defined like this:
define host{ host_name linuxbox address 192.168.1.2 check_command check_ping ... } define command{ command_name check_ping command_line /usr/local/nagios/libexec/check_ping -H $HOSTADDRESS$ -w 100.0,90% -c 200.0,60% }
the expanded/final command line to be executed for the host’s check command would look like this:
/usr/local/nagios/libexec/check_ping -H 192.168.1.2 -w 100.0,90% -c 200.0,60%
You can pass arguments to commands as well, which is quite handy if you’d like to keep your commanddefinitions rather generic. Arguments are specified in the object (i.e. host or service) definition, byseperating them from the command name with exclamation points (!) like so:
define service{ host_name linuxbox service_description PING ... check_command check_ping!200.0,80%!400.0,40% ... }
In the example above, the service check command has two arguments (which can be referenced with $ARGn$ macros). The $ARG1$ macro will be "200.0,80%" and $ARG2$ will be "400.0,40%" (both withoutquotes). Assuming we are using the host definition given earlier and a check_ping command defined like this:
define command{ command_name check_ping command_line /usr/local/nagios/libexec/check_ping -H $HOSTADDRESS$ -w $ARG1$ -c $ARG2$ }
the expanded/final command line to be executed for the service’s check command would look like this:
177

/usr/local/nagios/libexec/check_ping -H 192.168.1.2 -w 200.0,80% -c 400.0,40%
On-Demand Macros
Normally when you use host and service macros in command definitions, they refer to values for thehost or service for which the command is being run. For instance, if a host check command is beingexecuted for a host named "linuxbox", all the host macros listed in the table below will refer to values forthat host ("linuxbox").
If you would like to reference values for another host or service in a command (for which the commandis not being run), you can use what are called "on-demand" macros. On-demand macros look likenormal macros, except for the fact that they contain an identifier for the host or service from which theyshould get their value. Here’s the basic format for on-demand macros:
$HOSTMACRO:host_name$
$SERVICEMACRO:host_name:service_description$
Note that the macro name is seperated from the host or service identifier by a colon (:). For on-demandservice macros, the service identifier consists of both a host name and a service description - these areseperated by a colon (:) as well.
Examples of on-demand host and service macros follow:
$HOSTDOWNTIME:myhost$$SERVICESTATEID:novellserver:DS Database$
Macro Cleansing
Some macros are stripped of potentially dangerous shell metacharacters before being substituted intocommands to be executed. Which characters are stripped from the macros depends on the setting of the illegal_macro_output_chars directive. The following macros are stripped of potentially dangerous characters:
1. $HOSTOUTPUT$
2. $HOSTPERFDATA$
3. $HOSTACKAUTHOR$
4. $HOSTACKCOMMENT$
5. $SERVICEOUTPUT$
6. $SERVICEPERFDATA$
7. $SERVICEACKAUTHOR$
8. $SERVICEACKCOMMENT$
Macros as Environment Variables
Starting with Nagios 2.0, most macros have been made available as environment variables. This meansthat scripts that are run from Nagios (i.e. service and host check commands, notification commands, etc.)can reference these macros directly as standard environment variables. For purposes of security andsanity, $USERn$ and "on-demand" host and service macros are not made available as environmentvariables. Environment variables that contain macros are named the same as their corresponding macronames (listed below), with "NAGIOS_" prepended to their names. For example, the $HOSTNAME$macro would be available as an environment variable named "NAGIOS_HOSTNAME".
Macro Validity
178

Although macros can be used in all commands you define, not all macros may be "valid" in a particulartype of command. For example, some macros may only be valid during service notification commands,whereas other may only be valid during host check commands. There are ten types of commands thatNagios recognizes and treats differently. They are as follows:
1. Service checks
2. Service notifications
3. Host checks
4. Host notifications
5. Service event handlers and/or a global service event handler
6. Host event handlers and/or a global host event handler
7. OCSP command
8. OCHP command
9. Service performance data commands
10. Host performance data commands
The tables below list all macros currently available in Nagios, along with a brief description of each andthe types of commands in which they are valid. If a macro is used in a command in which it is invalid, itis replaced with an empty string. It should be noted that macros consist of all uppercase characters andare enclosed in $ characters.
Macro Availability Chart
Legend:
No The macro is not available
Yes The macro is available
Macro NameService Checks
Service Notifications
Host Checks
Host Notifications
ServiceEvent
Handlers,GlobalServiceEvent
Handler, OCSP
Command
HostEvent
Handlers,GlobalHostEvent
Handler, OCHP
Command
ServicePerformance
Data Commands
HostPerformance
Data Commands
Host Macros: 3
$HOSTNAME$ Yes Yes Yes Yes Yes Yes Yes Yes
$HOSTALIAS$ Yes Yes Yes Yes Yes Yes Yes Yes
$HOSTADDRESS$ Yes Yes Yes Yes Yes Yes Yes Yes
$HOSTSTATE$ Yes Yes Yes 1 Yes Yes Yes Yes Yes
$HOSTSTATEID$ Yes Yes Yes 1 Yes Yes Yes Yes Yes
$HOSTSTATETYPE$ Yes Yes Yes 1 Yes Yes Yes Yes Yes
$HOSTATTEMPT$ Yes Yes Yes Yes Yes Yes Yes Yes
$HOSTLATENCY$ Yes Yes Yes Yes Yes Yes Yes Yes
$HOSTEXECUTIONTIME$ Yes Yes Yes 1 Yes Yes Yes Yes Yes
$HOSTDURATION$ Yes Yes Yes Yes Yes Yes Yes Yes
$HOSTDURATIONSEC$ Yes Yes Yes Yes Yes Yes Yes Yes
$HOSTDOWNTIME$ Yes Yes Yes Yes Yes Yes Yes Yes
$HOSTPERCENTCHANGE$ Yes Yes Yes Yes Yes Yes Yes Yes
179

$HOSTGROUPNAME$ Yes Yes Yes Yes Yes Yes Yes Yes
$HOSTGROUPALIAS$ Yes Yes Yes Yes Yes Yes Yes Yes
$LASTHOSTCHECK$ Yes Yes Yes Yes Yes Yes Yes Yes
$LASTHOSTSTATECHANGE$ Yes Yes Yes Yes Yes Yes Yes Yes
$LASTHOSTUP$ Yes Yes Yes Yes Yes Yes Yes Yes
$LASTHOSTDOWN$ Yes Yes Yes Yes Yes Yes Yes Yes
$LASTHOSTUNREACHABLE$ Yes Yes Yes Yes Yes Yes Yes Yes
$HOSTOUTPUT$ Yes Yes Yes 1 Yes Yes Yes Yes Yes
$HOSTPERFDATA$ Yes Yes Yes 1 Yes Yes Yes Yes Yes
$HOSTCHECKCOMMAND$ Yes Yes Yes Yes Yes Yes Yes Yes
$HOSTACKAUTHOR$ No No No Yes No No No No
$HOSTACKCOMMENT$ No No No Yes No No No No
$HOSTACTIONURL$ Yes Yes Yes Yes Yes Yes Yes Yes
$HOSTNOTESURL$ Yes Yes Yes Yes Yes Yes Yes Yes
$HOSTNOTES$ Yes Yes Yes Yes Yes Yes Yes Yes
Service Macros:
$SERVICEDESC$ Yes Yes No No Yes No Yes No
$SERVICESTATE$ Yes 2 Yes No No Yes No Yes No
$SERVICESTATEID$ Yes 2 Yes No No Yes No Yes No
$SERVICESTATETYPE$ Yes Yes No No Yes No Yes No
$SERVICEATTEMPT$ Yes Yes No No Yes No Yes No
$SERVICELATENCY$ Yes Yes No No Yes No Yes No
$SERVICEEXECUTIONTIME$ Yes 2 Yes No No Yes No Yes No
$SERVICEDURATION$ Yes Yes No No Yes No Yes No
$SERVICEDURATIONSEC$ Yes Yes No No Yes No Yes No
$SERVICEDOWNTIME$ Yes Yes No No Yes No Yes No
$SERVICEPERCENTCHANGE$ Yes Yes No No Yes No Yes No
$SERVICEGROUPNAME$ Yes Yes No No Yes No Yes No
$SERVICEGROUPALIAS$ Yes Yes No No Yes No Yes No
$LASTSERVICECHECK$ Yes Yes No No Yes No Yes No
$LASTSERVICESTATECHANGE$ Yes Yes No No Yes No Yes No
$LASTSERVICEOK$ Yes Yes No No Yes No Yes No
$LASTSERVICEWARNING$ Yes Yes No No Yes No Yes No
$LASTSERVICEUNKNOWN$ Yes Yes No No Yes No Yes No
$LASTSERVICECRITICAL$ Yes Yes No No Yes No Yes No
$SERVICEOUTPUT$ Yes 2 Yes No No Yes No Yes No
$SERVICEPERFDATA$ Yes 2 Yes No No Yes No Yes No
$SERVICECHECKCOMMAND$ Yes Yes No No Yes No Yes No
$SERVICEACKAUTHOR$ No Yes No No No No No No
$SERVICEACKCOMMENT$ No Yes No No No No No No
$SERVICEACTIONURL$ Yes Yes No No Yes No Yes No
$SERVICENOTESURL$ Yes Yes No No Yes No Yes No
$SERVICENOTES$ Yes Yes No No Yes No Yes No
Summary Macros:
$TOTALHOSTSUP$ Yes Yes 4 Yes Yes 4 Yes Yes Yes Yes
180

$TOTALHOSTSDOWN$ Yes Yes 4 Yes Yes 4 Yes Yes Yes Yes
$TOTALHOSTSUNREACHABLE$ Yes Yes 4 Yes Yes 4 Yes Yes Yes Yes
$TOTALHOSTSDOWNUNHANDLED$ Yes Yes 4 Yes Yes 4 Yes Yes Yes Yes
$TOTALHOSTSUNREACHABLEUNHANDLED$ Yes Yes 4 Yes Yes 4 Yes Yes Yes Yes
$TOTALHOSTPROBLEMS$ Yes Yes 4 Yes Yes 4 Yes Yes Yes Yes
$TOTALHOSTPROBLEMSUNHANDLED$ Yes Yes 4 Yes Yes 4 Yes Yes Yes Yes
$TOTALSERVICESOK$ Yes Yes 4 Yes Yes 4 Yes Yes Yes Yes
$TOTALSERVICESWARNING$ Yes Yes 4 Yes Yes 4 Yes Yes Yes Yes
$TOTALSERVICESCRITICAL$ Yes Yes 4 Yes Yes 4 Yes Yes Yes Yes
$TOTALSERVICESUNKNOWN$ Yes Yes 4 Yes Yes 4 Yes Yes Yes Yes
$TOTALSERVICESWARNINGUNHANDLED$ Yes Yes 4 Yes Yes 4 Yes Yes Yes Yes
$TOTALSERVICESCRITICALUNHANDLED$ Yes Yes 4 Yes Yes 4 Yes Yes Yes Yes
$TOTALSERVICESUNKNOWNUNHANDLED$ Yes Yes 4 Yes Yes 4 Yes Yes Yes Yes
$TOTALSERVICEPROBLEMS$ Yes Yes 4 Yes Yes 4 Yes Yes Yes Yes
$TOTALSERVICEPROBLEMSUNHANDLED$ Yes Yes 4 Yes Yes 4 Yes Yes Yes Yes
Notification Macros:
$NOTIFICATIONTYPE$ No Yes No Yes No No No No
$NOTIFICATIONNUMBER$ No Yes No Yes No No No No
Contact Macros:
$CONTACTNAME$ No Yes No Yes No No No No
$CONTACTALIAS$ No Yes No Yes No No No No
$CONTACTEMAIL$ No Yes No Yes No No No No
$CONTACTPAGER$ No Yes No Yes No No No No
$CONTACTADDRESSn$ No Yes No Yes No No No No
Date Macros:
$LONGDATETIME$ Yes Yes Yes Yes Yes Yes Yes Yes
$SHORTDATETIME$ Yes Yes Yes Yes Yes Yes Yes Yes
$DATE$ Yes Yes Yes Yes Yes Yes Yes Yes
$TIME$ Yes Yes Yes Yes Yes Yes Yes Yes
$TIMET$ Yes Yes Yes Yes Yes Yes Yes Yes
File Macros:
$MAINCONFIGFILE$ Yes Yes Yes Yes Yes Yes Yes Yes
$STATUSDATAFILE$ Yes Yes Yes Yes Yes Yes Yes Yes
$COMMENTDATAFILE$ Yes Yes Yes Yes Yes Yes Yes Yes
$DOWNTIMEDATAFILE$ Yes Yes Yes Yes Yes Yes Yes Yes
$RETENTIONDATAFILE$ Yes Yes Yes Yes Yes Yes Yes Yes
$OBJECTCACHEFILE$ Yes Yes Yes Yes Yes Yes Yes Yes
$TEMPFILE$ Yes Yes Yes Yes Yes Yes Yes Yes
$LOGFILE$ Yes Yes Yes Yes Yes Yes Yes Yes
$RESOURCEFILE$ Yes Yes Yes Yes Yes Yes Yes Yes
$COMMANDFILE$ Yes Yes Yes Yes Yes Yes Yes Yes
$HOSTPERFDATAFILE$ Yes Yes Yes Yes Yes Yes Yes Yes
$SERVICEPERFDATAFILE$ Yes Yes Yes Yes Yes Yes Yes Yes
Misc Macros:
181

$PROCESSSTARTTIME$ Yes Yes Yes Yes Yes Yes Yes Yes
$ADMINEMAIL$ Yes Yes Yes Yes Yes Yes Yes Yes
$ADMINPAGER$ Yes Yes Yes Yes Yes Yes Yes Yes
$ARGn$ Yes Yes Yes Yes Yes Yes Yes Yes
$USERn$ Yes Yes Yes Yes Yes Yes Yes Yes
Macro Descriptions
Host Macros: 3
$HOSTNAME$
Short name for the host (i.e."biglinuxbox"). This value is takenfrom the host_name directive in the host definition.
$HOSTALIAS$Long name/description for thehost. This value is taken from the alias directive in the host definition.
$HOSTADDRESS$Address of the host. This value istaken from the address directive inthe host definition.
$HOSTSTATE$A string indicating the current stateof the host ("UP", "DOWN", or "UNREACHABLE").
$HOSTSTATEID$A number that corresponds to thecurrent state of the host: 0=UP,1=DOWN, 2=UNREACHABLE.
$HOSTSTATETYPE$
A string indicating the state typefor the current host check ("HARD"or "SOFT"). Soft states occur whenhost checks return a non-OK(non-UP) state and are in theprocess of being retried. Hardstates result when host checks havebeen checked a specified maximumnumber of times.
$HOSTATTEMPT$
The number of the current hostcheck retry. For instance, if this isthe second time that the host isbeing rechecked, this will be thenumber two. Current attemptnumber is really only useful whenwriting host event handlers for"soft" states that take a specificaction based on the host retry number.
182

$HOSTLATENCY$
A (floating point) numberindicating the number of secondsthat a scheduled host check laggedbehind its scheduled check time.For instance, if a check wasscheduled for 03:14:15 and it didn’tget executed until 03:14:17, therewould be a check latency of 2.0seconds. On-demand host checkshave a latency of zero seconds.
$HOSTEXECUTIONTIME$
A (floating point) numberindicating the number of secondsthat the host check took to execute(i.e. the amount of time the checkwas executing).
$HOSTDURATION$
A string indicating the amount oftime that the host has spent in itscurrent state. Format is "XXh YYmZZs", indicating hours, minutesand seconds.
$HOSTDURATIONSEC$A number indicating the number ofseconds that the host has spent inits current state.
$HOSTDOWNTIME$
A number indicating the current"downtime depth" for the host. Ifthis host is currently in a period of scheduled downtime, the valuewill be greater than zero. If the hostis not currently in a period ofdowntime, this value will be zero.
$HOSTPERCENTCHANGE$
A (floating point) numberindicating the percent state changethe host has undergone. Percentstate change is used by the flap detection algorithm.
$HOSTGROUPNAME$
The short name of the hostgroupthat this host belongs to. This valueis taken from the hostgroup_namedirective in the hostgroup definition. If the host belongs tomore than one hostgroup thismacro will contain the name of justone of them.
183

$HOSTGROUPALIAS$
The longer name/alias of thehostgroup that this host belongs to.This value is taken from the aliasdirective in the hostgroup definition. If the host belongs tomore than one hostgroup, thismacro contains the alias of just oneof them.
$LASTHOSTCHECK$
This is a timestamp in time_tformat (seconds since the UNIXepoch) indicating the time at whicha check of the host was last performed.
$LASTHOSTSTATECHANGE$
This is a timestamp in time_tformat (seconds since the UNIXepoch) indicating the time the hostlast changed state.
$LASTHOSTUP$
This is a timestamp in time_tformat (seconds since the UNIXepoch) indicating the time at whichthe host was last detected as beingin an UP state.
$LASTHOSTDOWN$
This is a timestamp in time_tformat (seconds since the UNIXepoch) indicating the time at whichthe host was last detected as beingin a DOWN state.
$LASTHOSTUNREACHABLE$
This is a timestamp in time_tformat (seconds since the UNIXepoch) indicating the time at whichthe host was last detected as beingin an UNREACHABLE state.
$HOSTOUTPUT$The text output from the last hostcheck (i.e. "Ping OK").
$HOSTPERFDATA$
This macro contains any performance data that may havebeen returned by the last host check.
$HOSTCHECKCOMMAND$
This macro contains the name ofthe command (along with anyarguments passed to it) used toperform the host check.
184

$HOSTACKAUTHOR$
A string containing the name of theuser who acknowledged the hostproblem. This macro is only validin notifications where the$NOTIFICATIONTYPE$ macro isset to "ACKNOWLEDGEMENT".
$HOSTACKCOMMENT$
A string containing theacknowledgement comment thatwas entered by the user whoacknowledged the host problem.This macro is only valid innotifications where the$NOTIFICATIONTYPE$ macro isset to "ACKNOWLEDGEMENT".
$HOSTACTIONURL$
Action URL for the host. This valueis taken from the action_urldirective in the extended hostinformation definition.
$HOSTNOTESURL$
Notes URL for the host. This valueis taken from the notes_url directivein the extended host information definition.
$HOSTNOTES$
Notes for the host. This value istaken from the notes directive in the extended host information definition.
Service Macros:
$SERVICEDESC$
The long name/description of theservice (i.e. "Main Website"). Thisvalue is taken from the descriptiondirective of the service definition.
$SERVICESTATE$A string indicating the current stateof the service ("OK", "WARNING","UNKNOWN", or "CRITICAL").
$SERVICESTATEID$
A number that corresponds to thecurrent state of the service: 0=OK,1=WARNING, 2=CRITICAL, 3=UNKNOWN.
185

$SERVICESTATETYPE$
A string indicating the state typefor the current service check("HARD" or "SOFT"). Soft statesoccur when service checks return anon-OK state and are in the processof being retried. Hard states resultwhen service checks have beenchecked a specified maximumnumber of times.
$SERVICEATTEMPT$
The number of the current servicecheck retry. For instance, if this isthe second time that the service isbeing rechecked, this will be thenumber two. Current attemptnumber is really only useful whenwriting service event handlers for"soft" states that take a specificaction based on the service retry number.
$SERVICELATENCY$
A (floating point) numberindicating the number of secondsthat a scheduled service checklagged behind its scheduled checktime. For instance, if a check wasscheduled for 03:14:15 and it didn’tget executed until 03:14:17, therewould be a check latency of 2.0 seconds.
$SERVICEEXECUTIONTIME$
A (floating point) numberindicating the number of secondsthat the service check took toexecute (i.e. the amount of time thecheck was executing).
$SERVICEDURATION$
A string indicating the amount oftime that the service has spent in itscurrent state. Format is "XXh YYmZZs", indicating hours, minutesand seconds.
$SERVICEDURATIONSEC$A number indicating the number ofseconds that the service has spentin its current state.
186

$SERVICEDOWNTIME$
A number indicating the current"downtime depth" for the service. Ifthis service is currently in a periodof scheduled downtime, the valuewill be greater than zero. If theservice is not currently in a periodof downtime, this value will be zero.
$SERVICEPERCENTCHANGE$
A (floating point) numberindicating the percent state changethe service has undergone. Percentstate change is used by the flap detection algorithm.
$SERVICEGROUPNAME$
The short name of the servicegroupthat this service belongs to. Thisvalue is taken from the servicegroup_name directive in the servicegroup definition. If theservice belongs to more than oneservicegroup this macro willcontain the name of just one of them.
$SERVICEGROUPALIAS$
The long name/alias of theservicegroup that this servicebelongs to. This value is taken fromthe alias directive in the servicegroup definition. If theservice belongs to more than oneservicegroup this macro willcontain the name of just one of them.
$LASTSERVICECHECK$
This is a timestamp in time_tformat (seconds since the UNIXepoch) indicating the time at whicha check of the service was last performed.
$LASTSERVICESTATECHANGE$
This is a timestamp in time_tformat (seconds since the UNIXepoch) indicating the time theservice last changed state.
$LASTSERVICEOK$
This is a timestamp in time_tformat (seconds since the UNIXepoch) indicating the time at whichthe service was last detected asbeing in an OK state.
187

$LASTSERVICEWARNING$
This is a timestamp in time_tformat (seconds since the UNIXepoch) indicating the time at whichthe service was last detected asbeing in a WARNING state.
$LASTSERVICEUNKNOWN$
This is a timestamp in time_tformat (seconds since the UNIXepoch) indicating the time at whichthe service was last detected asbeing in an UNKNOWN state.
$LASTSERVICECRITICAL$
This is a timestamp in time_tformat (seconds since the UNIXepoch) indicating the time at whichthe service was last detected asbeing in a CRITICAL state.
$SERVICEOUTPUT$The text output from the lastservice check (i.e. "Ping OK").
$SERVICEPERFDATA$
This macro contains any performance data that may havebeen returned by the last service check.
$SERVICECHECKCOMMAND$
This macro contains the name ofthe command (along with anyarguments passed to it) used toperform the service check.
$SERVICEACKAUTHOR$
A string containing the name of theuser who acknowledged theservice problem. This macro is onlyvalid in notifications where the$NOTIFICATIONTYPE$ macro isset to "ACKNOWLEDGEMENT".
$SERVICEACKCOMMENT$
A string containing theacknowledgement comment thatwas entered by the user whoacknowledged the service problem.This macro is only valid innotifications where the$NOTIFICATIONTYPE$ macro isset to "ACKNOWLEDGEMENT".
$SERVICEACTIONURL$
Action URL for the service. Thisvalue is taken from the action_urldirective in the extended serviceinformation definition.
188
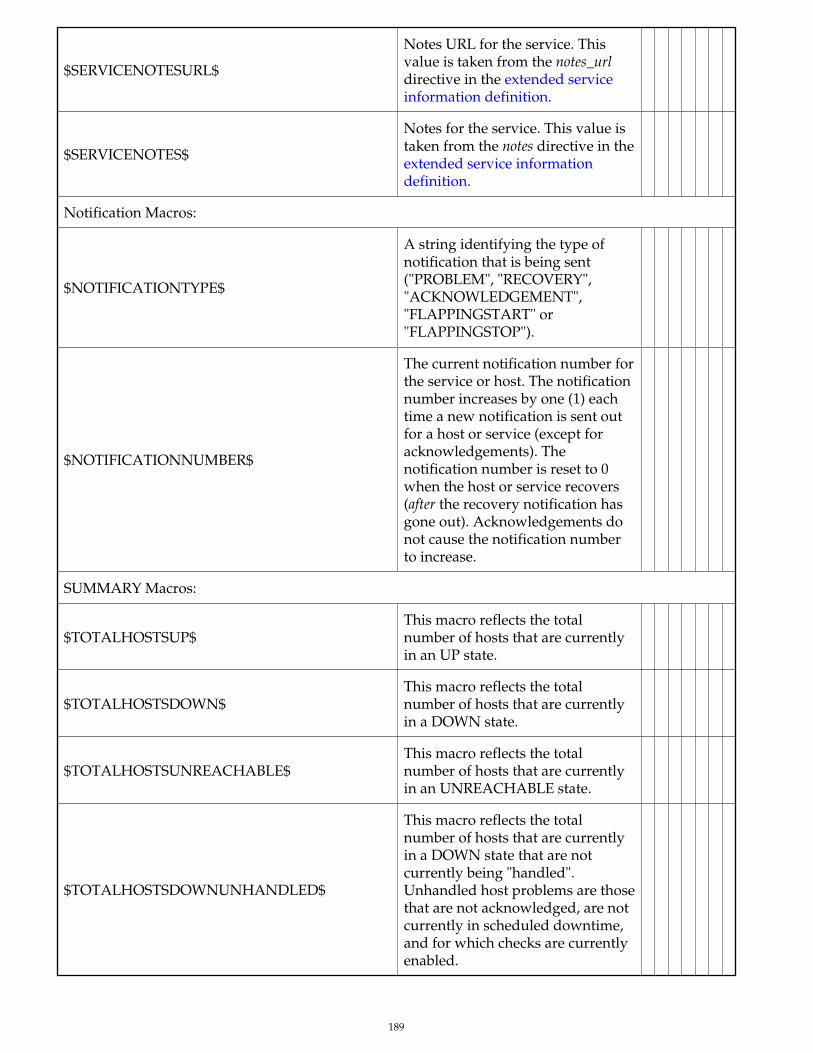
$SERVICENOTESURL$
Notes URL for the service. Thisvalue is taken from the notes_urldirective in the extended serviceinformation definition.
$SERVICENOTES$
Notes for the service. This value istaken from the notes directive in the extended service information definition.
Notification Macros:
$NOTIFICATIONTYPE$
A string identifying the type ofnotification that is being sent("PROBLEM", "RECOVERY","ACKNOWLEDGEMENT","FLAPPINGSTART" or "FLAPPINGSTOP").
$NOTIFICATIONNUMBER$
The current notification number forthe service or host. The notificationnumber increases by one (1) eachtime a new notification is sent outfor a host or service (except foracknowledgements). Thenotification number is reset to 0when the host or service recovers (after the recovery notification hasgone out). Acknowledgements donot cause the notification numberto increase.
SUMMARY Macros:
$TOTALHOSTSUP$This macro reflects the totalnumber of hosts that are currentlyin an UP state.
$TOTALHOSTSDOWN$This macro reflects the totalnumber of hosts that are currentlyin a DOWN state.
$TOTALHOSTSUNREACHABLE$This macro reflects the totalnumber of hosts that are currentlyin an UNREACHABLE state.
$TOTALHOSTSDOWNUNHANDLED$
This macro reflects the totalnumber of hosts that are currentlyin a DOWN state that are notcurrently being "handled".Unhandled host problems are thosethat are not acknowledged, are notcurrently in scheduled downtime,and for which checks are currently enabled.
189

$TOTALHOSTSUNREACHABLEUNHANDLED$
This macro reflects the totalnumber of hosts that are currentlyin an UNREACHABLE state thatare not currently being "handled".Unhandled host problems are thosethat are not acknowledged, are notcurrently in scheduled downtime,and for which checks are currently enabled.
$TOTALHOSTPROBLEMS$
This macro reflects the totalnumber of hosts that are currentlyeither in a DOWN or anUNREACHABLE state.
$TOTALHOSTPROBLEMSUNHANDLED$
This macro reflects the totalnumber of hosts that are currentlyeither in a DOWN or anUNREACHABLE state that are notcurrently being "handled".Unhandled host problems are thosethat are not acknowledged, are notcurrently in scheduled downtime,and for which checks are currently enabled.
$TOTALSERVICESOK$This macro reflects the totalnumber of services that arecurrently in an OK state.
$TOTALSERVICESWARNING$This macro reflects the totalnumber of services that arecurrently in a WARNING state.
$TOTALSERVICESCRITICAL$This macro reflects the totalnumber of services that arecurrently in a CRITICAL state.
$TOTALSERVICESUNKNOWN$This macro reflects the totalnumber of services that arecurrently in an UNKNOWN state.
$TOTALSERVICESWARNINGUNHANDLED$
This macro reflects the totalnumber of services that arecurrently in a WARNING state thatare not currently being "handled".Unhandled services problems arethose that are not acknowledged,are not currently in scheduleddowntime, and for which checksare currently enabled.
190

$TOTALSERVICESCRITICALUNHANDLED$
This macro reflects the totalnumber of services that arecurrently in a CRITICAL state thatare not currently being "handled".Unhandled services problems arethose that are not acknowledged,are not currently in scheduleddowntime, and for which checksare currently enabled.
$TOTALSERVICESUNKNOWNUNHANDLED$
This macro reflects the totalnumber of services that arecurrently in an UNKNOWN statethat are not currently being"handled". Unhandled servicesproblems are those that are notacknowledged, are not currently inscheduled downtime, and forwhich checks are currently enabled.
$TOTALSERVICEPROBLEMS$
This macro reflects the totalnumber of services that arecurrently either in a WARNING,CRITICAL, or UNKNOWN state.
$TOTALSERVICEPROBLEMSUNHANDLED$
This macro reflects the totalnumber of services that arecurrently either in a WARNING,CRITICAL, or UNKNOWN statethat are not currently being"handled". Unhandled servicesproblems are those that are notacknowledged, are not currently inscheduled downtime, and forwhich checks are currently enabled.
Contact Macros:
$CONTACTNAME$
Short name for the contact (i.e."jdoe") that is being notified of ahost or service problem. This valueis taken from the contact_namedirective in the contact definition.
$CONTACTALIAS$
Long name/description for thecontact (i.e. "John Doe") beingnotified. This value is taken fromthe alias directive in the contact definition.
191

$CONTACTEMAIL$
Email address of the contact beingnotified. This value is taken fromthe email directive in the contact definition.
$CONTACTPAGER$
Pager number/address of thecontact being notified. This value istaken from the pager directive inthe contact definition.
$CONTACTADDRESSn$
Address of the contact beingnotified. Each contact can have sixdifferent addresses (in addition toemail address and pager number).The macros for these addresses are$CONTACTADDRESS1$ -$CONTACTADDRESS6$. Thisvalue is taken from the addressxdirective in the contact definition.
Date Macros:
$LONGDATETIME$
Current date/time stamp (i.e. FriOct 13 00:30:28 CDT 2000). Formatof date is determined by date_format directive.
$SHORTDATETIME$
Current date/time stamp (i.e. 10-13-2000 00:30:28). Format of dateis determined by date_format directive.
$DATE$Date stamp (i.e. 10-13-2000).Format of date is determined by date_format directive.
$TIME$ Current time stamp (i.e. 00:30:28).
$TIMET$Current time stamp in time_tformat (seconds since the UNIX epoch).
File Macros:
$MAINCONFIGFILE$ The location of the main config file.
$STATUSDATAFILE$ The location of the status data file.
$COMMENTDATAFILE$The location of the comment data file.
$DOWNTIMEDATAFILE$The location of the downtime data file.
$RETENTIONDATAFILE$The location of the retention data file.
192

$OBJECTCACHEFILE$ The location of the object cache file.
$TEMPFILE$ The location of the temp file.
$LOGFILE$ The location of the log file.
$RESOURCEFILE$ The location of the resource file.
$COMMANDFILE$ The location of the command file.
$HOSTPERFDATAFILE$The location of the hostperformance data file (if defined).
$SERVICEPERFDATAFILE$The location of the serviceperformance data file (if defined).
Misc Macros:
$PROCESSSTARTTIME$
Time stamp in time_t format(seconds since the UNIX epoch)indicating when the Nagios processwas last (re)started. You candetermine the number of secondsthat Nagios has been running(since it was last restarted) bysubtracting$PROCESSSTARTTIME$ from $TIMET$.
$ADMINEMAIL$Global administrative emailaddress. This value is taken fromthe admin_email directive.
$ADMINPAGER$
Global administrative pagernumber/address. This value istaken from the admin_pager directive.
$ARGn$
The nth argument passed to thecommand (notification, eventhandler, service check, etc.). Nagiossupports up to 32 argument macros($ARG1$ through $ARG32$).
$USERn$
The nth user-definable macro. Usermacros can be defined in one ormore resource files. Nagiossupports up to 32 user macros($USER1$ through $USER32$).
Notes
1 These macros are not valid for the host they are associated with when that host is being checked (i.e.they make no sense, as they haven’t been determined yet).
193

2 These macros are not valid for the service they are associated with when that service is being checked(i.e. they make no sense, as they haven’t been determined yet).
3 When host macros are used in service-related commands (i.e. service notifications, event handlers, etc)they refer to they host that they service is associated with.
4 When host and service summary macros are used in notification commands, the totals are filtered toreflect only those hosts and services for which the contact is authorized (i.e. hosts and services they areconfigured to receive notifications for).
194

Information On The CGIs
Introduction
The various CGIs distributed with Nagios are described here, along with the authorization requirementsfor accessing and using each CGI. By default the CGIs require that you have authenticated to the webserver and are authorized to view any information you are requesting. For more information onconfiguring your web server and CGI configuration file to allow for this, read the sections on setting upthe web interface and CGI authorization.
Index
Status CGIStatus map CGIWAP interface CGIStatus world CGI (VRML)Tactical overview CGINetwork outages CGIConfiguration CGICommand CGIExtended information CGIEvent log CGIAlert history CGINotifications CGITrends CGIAvailability reporting CGIAlert histogram CGIAlert summary CGI
Status CGI
File Name: status.cgi
195

Description:This is the most important CGI included with Nagios. It allows you to view the current status of allhosts and services that are being monitored. The status CGI can produce two main types of output - astatus overview of all host groups (or a particular host group) and a detailed view of all services (orthose associated with a particular host). Pretty icons can be associated with hosts by defining extended host and service information entries.
Authorization Requirements:
If you are authorized for all hosts you can view all hosts and all services.
If you are authorized for all services you can view all services.
If you are an authenticated contact you can view all hosts and services for which you are a contact.
Status Map CGI
File Name: statusmap.cgi
Description:This CGI creates a map of all hosts that you have defined on your network. The CGI uses ThomasBoutell’s gd library (version 1.6.3 or higher) to create a PNG image of your network layout. Thecoordinates used when drawing each host (along with the optional pretty icons) are taken from extended host information definitions. If you’d prefer to let the CGI automatically generate drawingcoordinates for you, use the default_statusmap_layout directive to specify a layout algorithm thatshould be used.
Authorization Requirements:
If you are authorized for all hosts you can view all hosts.
If you are an authenticated contact you can view hosts for which you are a contact.
Note: Users who are not authorized to view specific hosts will see unknown nodes in those positions. Irealize that they really shouldn’t see anything there, but it doesn’t make sense to even generate themap if you can’t see all the host dependencies...
WAP Interface CGI
196

File Name: statuswml.cgi
Description:This CGI serves as a WAP interface to network status information. If you have a WAP-enable device(i.e. an Internet-ready cellphone), you can view status information while you’re on the go. Differentstatus views include hostgroup summary, hostgroup overview, host detail, service detail, allproblems, and unhandled problems. In addition to viewing status information, you can also disablenotifications and checks and acknowledge problems from your cellphone. Pretty cool, huh?
Authorization Requirements:
If you are authorized for system information you can view Nagios process information.
If you are authorized for all hosts you can view status data for all hosts and services.
If you are authorized for all services you can view status data for all services.
If you are an authenticated contact you can view status data for all hosts and services for whichyou are a contact.
Status World CGI (VRML)
File Name: statuswrl.cgi
197
Description:This CGI creates a 3-D VRML model of all hosts that you have defined on your network. Coordinatesused when drawing the hosts (as well as pretty texture maps) are defined using extended host information definitions. If you’d prefer to let the CGI automatically generate drawing coordinates foryou, use the default_statuswrl_layout directive to specify a layout algorithm that should be used.You’ll need a VRML browser (like Cortona, Cosmo Player or WorldView) installed on your systembefore you can actually view the generated model.
Authorization Requirements:
If you are authorized for all hosts you can view all hosts.
If you are an authenticated contact you can view hosts for which you are a contact.
Note: Users who are not authorized to view specific hosts will see unknown nodes in those positions. Irealize that they really shouldn’t see anything there, but it doesn’t make sense to even generate themap if you can’t see all the host dependencies...
Tactical Overview CGI
File Name: tac.cgi
Description:This CGI is designed to server as a "birds-eye view" of all network monitoring activity. It allows youto quickly see network outages, host status, and service status. It distinguishes between problemsthat have been "handled" in some way (i.e. been acknowledged, had notifications disabled, etc.) andthose which have not been handled, and thus need attention. Very useful if you’ve got a lot ofhosts/services you’re monitoring and you need to keep a single screen up to alert you of problems.
Authorization Requirements:
If you are authorized for all hosts you can view all hosts and all services.
If you are authorized for all services you can view all services.
If you are an authenticated contact you can view all hosts and services for which you are a contact.
Network Outages CGI
198

File Name: outages.cgi
Description:This CGI will produce a listing of "problem" hosts on your network that are causing network outages.This can be particularly useful if you have a large network and want to quickly identify the source ofthe problem. Hosts are sorted based on the severity of the outage they are causing. More informationon how the network outage CGI works can be found here.
Authorization Requirements:
If you are authorized for all hosts you can view all hosts.
If you are an authenticated contact you can view hosts for which you are a contact.
Configuration CGI
File Name: config.cgi
Description:This CGI allows you to view objects (i.e. hosts, host groups, contacts, contact groups, time periods,services, etc.) that you have defined in your object configuration file(s).
Authorization Requirements:
You must be authorized for configuration information in order to any kind of configuration information.
Command CGI
199

File Name: cmd.cgi
Description:This CGI allows you to send commands to the Nagios process. Although this CGI has severalarguments, you would be better to leave them alone. Most will change between different revisions ofNagios. Use the extended information CGI as a starting point for issuing commands.
Authorization Requirements:
You must be authorized for system commands in order to issue commands that affect the Nagiosprocess (restarts, shutdowns, mode changes, etc.).
If you are authorized for all host commands you can issue commands for all hosts and services.
If you are authorized for all service commands you can issue commands for all services.
If you are an authenticated contact you can issue commands for all hosts and services for whichyou are a contact.
Notes:
If you have chosen not to use authentication with the CGIs, this CGI will not allow anyone toissue commands to Nagios. This is done for your own protection. I would suggest removing thisCGI altogether if you decide not to use authentication with the CGIs.
Extended Information CGI
File Name: extinfo.cgi
200

Description:This CGI allows you to view Nagios process information, host and service state statistics, host andservice comments, and more. It also serves as a launching point for sending commands to Nagios viathe command CGI. Although this CGI has several arguments, you would be better to leave themalone - they are likely to change between different releases of Nagios. You can access this CGI byclicking on the ’Network Health’ and ’Process Information’ links on the side navigation bar, or byclicking on a host or service link in the output of the status CGI.
Authorization Requirements:
You must be authorized for system information in order to view Nagios process information.
If you are authorized for all hosts you can view extended information for all hosts and services.
If you are authorized for all services you can view extended information for all services.
If you are an authenticated contact you can view extended information for all hosts and servicesfor which you are a contact.
Event Log CGI
File Name: showlog.cgi
Description:This CGI will display the log file. If you have log rotation enabled, you can browse notificationspresent in archived log files by using the navigational links near the top of the page.
Authorization Requirements:
You must be authorized for system information in order to view the log file.
Alert History CGI
File Name: history.cgi
201

Description:This CGI is used to display the history of problems with either a particular host or all hosts. Theoutput is basically a subset of the information that is displayed by the log file CGI. You have theability to filter the output to display only the specific types of problems you wish to see (i.e. hardand/or soft alerts, various types of service and host alerts, all types of alerts, etc.). If you have log rotation enabled, you can browse history information present in archived log files by using thenavigational links near the top of the page.
Authorization Requirements:
If you are authorized for all hosts you can view history information for all hosts and all services.
If you are authorized for all services you can view history information for all services.
If you are an authenticated contact you can view history information for all services and hosts forwhich you are a contact.
Notifications CGI
File Name: notifications.cgi
Description:This CGI is used to display host and service notifications that have been sent to various contacts. Theoutput is basically a subset of the information that is displayed by the log file CGI. You have theability to filter the output to display only the specific types of notifications you wish to see (i.e.service notifications, host notifications, notifications sent to specific contacts, etc). If you have log rotation enabled, you can browse notifications present in archived log files by using the navigationallinks near the top of the page.
Authorization Requirements:
If you are authorized for all hosts you can view notifications for all hosts and all services.
If you are authorized for all services you can view notifications for all services.
If you are an authenticated contact you can view notifications for all services and hosts for whichyou are a contact.
Trends CGI
202

File Name: trends.cgi
Description:This CGI is used to create a graph of host or service states over an arbitrary period of time. In orderfor this CGI to be of much use, you should enable log rotation and keep archived logs in the pathspecified by the log_archive_path directive. The CGI uses Thomas Boutell’s gd library (version 1.6.3or higher) to create the trends image.
Authorization Requirements:
If you are authorized for all hosts you can view trends for all hosts and all services.
If you are authorized for all services you can view trends for all services.
If you are an authenticated contact you can view trends for all services and hosts for which you area contact.
Availability Reporting CGI
File Name: avail.cgi
Description:This CGI is used to report on the availability of hosts and services over a user-specified period oftime. In order for this CGI to be of much use, you should enable log rotation and keep archived logsin the path specified by the log_archive_path directive.
Authorization Requirements:
If you are authorized for all hosts you can view availability data for all hosts and all services.
If you are authorized for all services you can view availability data for all services.
If you are an authenticated contact you can view availability data for all services and hosts forwhich you are a contact.
203
Alert Histogram CGI
File Name: histogram.cgi
Description:This CGI is used to report on the availability of hosts and services over a user-specified period oftime. In order for this CGI to be of much use, you should enable log rotation and keep archived logsin the path specified by the log_archive_path directive. The CGI uses Thomas Boutell’s gd library(version 1.6.3 or higher) to create the histogram image.
Authorization Requirements:
If you are authorized for all hosts you can view histograms for all hosts and all services.
If you are authorized for all services you can view histograms for all services.
If you are an authenticated contact you can view histograms for all services and hosts for whichyou are a contact.
Alert Summary CGI
File Name: summary.cgi
Description:This CGI provides some generic reports about host and service alert data, including alert totals, topalert producers, etc.
Authorization Requirements:
If you are authorized for all hosts you can view summary information for all hosts and all services.
If you are authorized for all services you can view summary information for all services.
If you are an authenticated contact you can view summary information for all services and hostsfor which you are a contact.
204

205

Custom CGI Headers and Footers
Introduction
If you’re doing custom installs of Nagios for clients, you may want to have a custom header and/orfooter displayed in the output of the CGIs. This is particularly useful for displaying support contactinformation, etc. to the end user.
It is important to note that, unless the custom header and footer files are executable, they are notprocessed in any way before they are displayed. The contents of the header and footer include files aresimply read and displayed in the CGI output. That means they can only contain information a webbrowser can understand (HTML, JavaScript, etc.).
If the custom header and footer files are executable, then the files are executed and their output returnedto the user, so they should output valid HTML. Using this you can run your own custom designed CGIto insert data into the nagios display. This has been used to insert graphs from rrdtool using ddraw andcommand menus into the nagios display pane. The execuable customer header and footer files are runwith the same CGI environment as the main nagios cgi, so your files can parse the query information,authenticated user information etc. to produce appropriate output.
How Does It Work?
You can include custom headers and footers in the output of the CGIs by dropping some appropriatelynamed HTML files in the ssi/ subdirectory of the Nagios HTML directory (i.e. /usr/local/nagios/share/ssi).
Custom headers are included immediately after the <BODY> tag in the CGI output, while customfooters are included immediately before the closing </BODY> tag.
There are two types of customer headers and footers:
Global headers/footers. These files should be named common-header.ssi and common-footer.ssi,respectively. If these files exist, they will be included in the output of all CGIs.
CGI-specific headers/footers. These files should be named in the format CGINAME-header.ssi and CGINAME-footer.ssi, where CGINAME is the physical name of the CGI without the .cgi extension.For example, the header and footer files for the alert summary CGI (summary.cgi) would be named summary-header.ssi and summary-footer.ssi, respectively.
You are not required to use any custom headers or footers. You can use only a global header if you wish.You can use only CGI-specific headers and a global footer if you wish. Whatever you want. Really.
206

Template-Based Object Configuration
Notes
When creating and/or editing configuration files, keep the following in mind:
1. Lines that start with a ’#’ character are taken to be comments and are not processed
2. Directive names are case-sensitive
Introduction
One of the benefits of using the template-based config file format is that you can create object definitionsthat have some of their properties inherited from other object definitions. The notion of objectinheritence, along with documentation on how to do it, is described here. I strongly suggest that youfamiliarize yourself with object inheritence once you read over the documentation presented below, asinheritence will make the job of creating and maintaining object definitions much easier than itotherwise would be.
Time-Saving Tricks
There are several things you can do with template-based object definitions that allow you to create largenumbers of objects using just a small number of definitions in your config file(s). One example of such atrick is the ability to define a single service object that creates a service for multiple hosts and/orhostgroups. These tricks are described here.
Retention Notes
It is important to point out that several directives in host and service definitions may not be picked upby Nagios when you change them. Host and service directives that can exhibit this behavior are markedwith an asterisk (*). The reason for this behavior is due to the fact that Nagios chooses to honor valuesstored in the state retention file over values found in the config files, assuming you have state retentionenabled on a program-wide basis and the value of the directive is changed during runtime (bysubmitting an external command).
One way to get around this problem is to disable the retention of non-status information using the retain_nonstatus_information directive in the host and service definitions. Disabling this directive willcause Nagios to take the initial values for these directives from your config files, rather than from thestate retention file when it (re)starts. Using this option is not recommended, as it may result in someunexpected (from your point of view) results.
Alternatively, you can issue the appropriate external command or change the value of the host or servicedirective via the web interface, so that it matches what you’ve changed it to in the config files. This isusually done by using the extended information CGI. This option takes a bit more work, but ispreferable to disabling the retention of non-status information (mentioned above).
Sample Configuration
A few sample object configuration files are created when you run the configure script - you can findthem in the sample-config/template-object/ subdirectory of the Nagios distribution.
Object Types
207

Host definitionsHost group definitionsService definitionsService group definitionsContact definitionsContact group definitionsTime period definitionsCommand definitionsService dependency definitionsService escalation definitionsHost dependency definitionsHost escalation definitionsExtended host information definitionsExtended service information definitions
Host Definition
Description:
A host definition is used to define a physical server, workstation, device, etc. that resides on your network.
Definition Format:
Note: Directives in red are required, while those in black are optional.
208

define host{
host_name host_name
alias alias
address address
parents host_names
hostgroups hostgroup_names
check_command command_name
max_check_attempts #
check_interval #
active_checks_enabled [0/1]
passive_checks_enabled [0/1]
check_period timeperiod_name
obsess_over_host [0/1]
check_freshness [0/1]
freshness_threshold #
event_handler command_name
event_handler_enabled [0/1]
low_flap_threshold #
high_flap_threshold #
flap_detection_enabled [0/1]
process_perf_data [0/1]
retain_status_information [0/1]
retain_nonstatus_information [0/1]
contact_groups contact_groups
notification_interval #
notification_period timeperiod_name
notification_options [d,u,r,f]
notifications_enabled [0/1]
stalking_options [o,d,u]
}
Example Definition:
209

define host{ host_name bogus-router alias Bogus Router #1 address 192.168.1.254 parents server-backbone check_command check-host-alive max_check_attempts 5 check_period 24x7 process_perf_data 0 retain_nonstatus_information 0 contact_groups router-admins notification_interval 30 notification_period 24x7 notification_options d,u,r }
Directive Descriptions:
host_name: This directive is used to define a short name used to identify thehost. It is used in host group and service definitions to referencethis particular host. Hosts can have multiple services (which aremonitored) associated with them. When used properly, the$HOSTNAME$ macro will contain this short name.
alias: This directive is used to define a longer name or description usedto identify the host. It is provided in order to allow you to moreeasily identify a particular host. When used properly, the$HOSTALIAS$ macro will contain this alias/description.
address: This directive is used to define the address of the host. Normally,this is an IP address, although it could really be anything youwant (so long as it can be used to check the status of the host). Youcan use a FQDN to identify the host instead of an IP address, but ifDNS services are not availble this could cause problems. Whenused properly, the $HOSTADDRESS$ macro will contain thisaddress. Note: If you do not specify an address directive in a hostdefinition, the name of the host will be used as its address. A wordof caution about doing this, however - if DNS fails, most of yourservice checks will fail because the plugins will be unable toresolve the host name.
parents: This directive is used to define a comma-delimited list of shortnames of the "parent" hosts for this particular host. Parent hostsare typically routers, switches, firewalls, etc. that lie between themonitoring host and a remote hosts. A router, switch, etc. which isclosest to the remote host is considered to be that host’s "parent".Read the "Determining Status and Reachability of Network Hosts"document located here for more information. If this host is on thesame network segment as the host doing the monitoring (withoutany intermediate routers, etc.) the host is considered to be on thelocal network and will not have a parent host. Leave this valueblank if the host does not have a parent host (i.e. it is on the samesegment as the Nagios host). The order in which you specifyparent hosts has no effect on how things are monitored.
210

hostgroups: This directive is used to identify the short name(s) of the hostgroup(s) that the host belongs to. Multiple hostgroups shouldare seperated by commas. This directive may be used as analternative to (or in addition to) using the members directive in hostgroup definitions.
check_command: This directive is used to specify the short name of the commandthat should be used to check if the host is up or down. Typically,this command would try and ping the host to see if it is "alive".The command must return a status of OK (0) or Nagios willassume the host is down. If you leave this argument blank, thehost will not be checked - Nagios will always assume the host isup. This is useful if you are monitoring printers or other devicesthat are frequently turned off. The maximum amount of time thatthe notification command can run is controlled by the host_check_timeout option.
max_check_attempts: This directive is used to define the number of times that Nagioswill retry the host check command if it returns any state other thanan OK state. Setting this value to 1 will cause Nagios to generatean alert without retrying the host check again. Note: If you do notwant to check the status of the host, you must still set this to aminimum value of 1. To bypass the host check, just leave the check_command option blank.
check_interval: NOTE: Do NOT enable regularly scheduled checks of a host unless youabsolutely need to! Host checks are already performed on-demand whennecessary, so there are few times when regularly scheduled checks wouldbe needed. Regularly scheduled host checks can negatively impactperformance - see the performance tuning tips for more information. Thisdirective is used to define the number of "time units" betweenregularly scheduled checks of the host. Unless you’ve changed the interval_length directive from the default value of 60, this numberwill mean minutes. More information on this value can be foundin the check scheduling documentation.
active_checks_enabled *: This directive is used to determine whether or not active checks(either regularly scheduled or on-demand) of this host areenabled. Values: 0 = disable active host checks, 1 = enable activehost checks.
passive_checks_enabled *: This directive is used to determine whether or not passive checksare enabled for this host. Values: 0 = disable passive host checks, 1= enable passive host checks.
check_period: This directive is used to specify the short name of the time periodduring which active checks of this host can be made.
obsess_over_host *: This directive determines whether or not checks for the host willbe "obsessed" over using the ochp_command.
check_freshness *: This directive is used to determine whether or not freshness checks are enabled for this host. Values: 0 = disable freshnesschecks, 1 = enable freshness checks.
211

freshness_threshold: This directive is used to specify the freshness threshold (inseconds) for this host. If you set this directive to a value of 0,Nagios will determine a freshness threshold to use automatically.
event_handler: This directive is used to specify the short name of the commandthat should be run whenever a change in the state of the host isdetected (i.e. whenever it goes down or recovers). Read thedocumentation on event handlers for a more detailed explanationof how to write scripts for handling events. The maximum amountof time that the event handler command can run is controlled bythe event_handler_timeout option.
event_handler_enabled *: This directive is used to determine whether or not the eventhandler for this host is enabled. Values: 0 = disable host eventhandler, 1 = enable host event handler.
low_flap_threshold: This directive is used to specify the low state change thresholdused in flap detection for this host. More information on flapdetection can be found here. If you set this directive to a value of 0,the program-wide value specified by the low_host_flap_thresholddirective will be used.
high_flap_threshold: This directive is used to specify the high state change thresholdused in flap detection for this host. More information on flapdetection can be found here. If you set this directive to a value of 0,the program-wide value specified by the high_host_flap_thresholddirective will be used.
flap_detection_enabled *: This directive is used to determine whether or not flap detection isenabled for this host. More information on flap detection can befound here. Values: 0 = disable host flap detection, 1 = enable hostflap detection.
process_perf_data *: This directive is used to determine whether or not the processingof performance data is enabled for this host. Values: 0 = disableperformance data processing, 1 = enable performance data processing.
retain_status_information: This directive is used to determine whether or not status-relatedinformation about the host is retained across program restarts.This is only useful if you have enabled state retention using the retain_state_information directive. Value: 0 = disable statusinformation retention, 1 = enable status information retention.
retain_nonstatus_information: This directive is used to determine whether or not non-statusinformation about the host is retained across program restarts.This is only useful if you have enabled state retention using the retain_state_information directive. Value: 0 = disable non-statusinformation retention, 1 = enable non-status information retention.
contact_groups: This is a list of the short names of the contact groups that should benotified whenever there are problems (or recoveries) with thishost. Multiple contact groups should be separated by commas.
212

notification_interval: This directive is used to define the number of "time units" to waitbefore re-notifying a contact that this server is still down orunreachable. Unless you’ve changed the interval_length directivefrom the default value of 60, this number will mean minutes. Ifyou set this value to 0, Nagios will not re-notify contacts aboutproblems for this host - only one problem notification will be sent out.
notification_period: This directive is used to specify the short name of the time periodduring which notifications of events for this host can be sent out tocontacts. If a host goes down, becomes unreachable, or recoveriesduring a time which is not covered by the time period, nonotifications will be sent out.
notification_options: This directive is used to determine when notifications for the hostshould be sent out. Valid options are a combination of one or moreof the following: d = send notifications on a DOWN state, u = sendnotifications on an UNREACHABLE state, r = send notificationson recoveries (OK state), and f = send notifications when the hoststarts and stops flapping. If you specify n (none) as an option, nohost notifications will be sent out. Example: If you specify d,r inthis field, notifications will only be sent out when the host goesDOWN and when it recovers from a DOWN state.
notifications_enabled *: This directive is used to determine whether or not notifications forthis host are enabled. Values: 0 = disable host notifications, 1 =enable host notifications.
stalking_options: This directive determines which host states "stalking" is enabledfor. Valid options are a combination of one or more of thefollowing: o = stalk on UP states, d = stalk on DOWN states, and u= stalk on UNREACHABLE states. More information on statestalking can be found here.
Host Group Definition
Description:
A host group definition is used to group one or more hosts together for display purposes in the CGIs.
Definition Format:
Note: Directives in red are required, while those in black are optional.
define hostgroup{
hostgroup_name hostgroup_name
alias alias
members members
}
213

Example Definition:
define hostgroup{ hostgroup_name novell-servers alias Novell Servers members netware1,netware2,netware3,netware4 }
Directive Descriptions:
hostgroup_name: This directive is used to define a short name used to identify the host group.
alias: This directive is used to define is a longer name or description used to identifythe host group. It is provided in order to allow you to more easily identify aparticular host group.
members: This is a list of the short names of hosts that should be included in this group.Multiple host names should be separated by commas. This directive may beused as an alternative to (or in addition to) the hostgroups directive in host definitions.
Service Definition
Description:
A service definition is used to identify a "service" that runs on a host. The term "service" is used veryloosely. It can mean an actual service that runs on the host (POP, SMTP, HTTP, etc.) or some other typeof metric associated with the host (response to a ping, number of logged in users, free disk space, etc.).The different arguments to a service definition are outlined below.
Definition Format:
Note: Directives in red are required, while those in black are optional.
214

define service{
host_name host_name
service_description service_description
servicegroups servicegroup_names
is_volatile [0/1]
check_command command_name
max_check_attempts #
normal_check_interval #
retry_check_interval #
active_checks_enabled [0/1]
passive_checks_enabled [0/1]
check_period timeperiod_name
parallelize_check [0/1]
obsess_over_service [0/1]
check_freshness [0/1]
freshness_threshold #
event_handler command_name
event_handler_enabled [0/1]
low_flap_threshold #
high_flap_threshold #
flap_detection_enabled [0/1]
process_perf_data [0/1]
retain_status_information [0/1]
retain_nonstatus_information [0/1]
notification_interval #
notification_period timeperiod_name
notification_options [w,u,c,r,f]
notifications_enabled [0/1]
contact_groups contact_groups
stalking_options [o,w,u,c]
}
215

Example Definition:
define service{ host_name linux-server service_description check-disk-sda1 check_command check-disk!/dev/sda1 max_check_attempts 5 normal_check_interval 5 retry_check_interval 3 check_period 24x7 notification_interval 30 notification_period 24x7 notification_options w,c,r contact_groups linux-admins }
Directive Descriptions:
host_name: This directive is used to specify the short name of the host that theservice "runs" on or is associated with.
service_description;: This directive is used to define the description of the service,which may contain spaces, dashes, and colons (semicolons,apostrophes, and quotation marks should be avoided). No twoservices associated with the same host can have the samedescription. Services are uniquely identified with their host_nameand service_description directives.
servicegroups: This directive is used to identify the short name(s) of the servicegroup(s) that the service belongs to. Multiple servicegroupsshould are seperated by commas. This directive may be used as analternative to using the members directive in servicegroup definitions.
is_volatile: This directive is used to denote whether the service is "volatile".Services are normally not volatile. More information on volatileservice and how they differ from normal services can be found here. Value: 0 = service is not volatile, 1 = service is volatile.
check_command: This directive is used to specify the short name of the commandthat Nagios will run in order to check the status of the service. Themaximum amount of time that the service check command canrun is controlled by the service_check_timeout option.
max_check_attempts: This directive is used to define the number of times that Nagioswill retry the service check command if it returns any state otherthan an OK state. Setting this value to 1 will cause Nagios togenerate an alert without retrying the service check again.
normal_check_interval: This directive is used to define the number of "time units" to waitbefore scheduling the next "regular" check of the service. "Regular"checks are those that occur when the service is in an OK state orwhen the service is in a non-OK state, but has already beenrechecked max_attempts number of times. Unless you’ve changedthe interval_length directive from the default value of 60, thisnumber will mean minutes. More information on this value can befound in the check scheduling documentation.
216

retry_check_interval: This directive is used to define the number of "time units" to waitbefore scheduling a re-check of the service. Services arerescheduled at the retry interval when the have changed to anon-OK state. Once the service has been retried max_attemptstimes without a change in its status, it will revert to beingscheduled at its "normal" rate as defined by the check_intervalvalue. Unless you’ve changed the interval_length directive fromthe default value of 60, this number will mean minutes. Moreinformation on this value can be found in the check scheduling documentation.
active_checks_enabled *: This directive is used to determine whether or not active checks ofthis service are enabled. Values: 0 = disable active service checks, 1= enable active service checks.
passive_checks_enabled *: This directive is used to determine whether or not passive checksof this service are enabled. Values: 0 = disable passive servicechecks, 1 = enable passive service checks.
check_period: This directive is used to specify the short name of the time periodduring which active checks of this service can be made.
parallelize_check: This directive is used to determine whether or not the servicecheck can be parallelized. By default, all service checks areparallelized. Disabling parallel checks of services can result inserious performance problems. More information on service checkparallelization can be found here. Values: 0 = service check cannotbe parallelized (use with caution!), 1 = service check can be parallelized.
obsess_over_service *: This directive determines whether or not checks for the servicewill be "obsessed" over using the ocsp_command.
check_freshness *: This directive is used to determine whether or not freshness checks are enabled for this service. Values: 0 = disable freshnesschecks, 1 = enable freshness checks.
freshness_threshold: This directive is used to specify the freshness threshold (inseconds) for this service. If you set this directive to a value of 0,Nagios will determine a freshness threshold to use automatically.
event_handler_enabled *: This directive is used to determine whether or not the eventhandler for this service is enabled. Values: 0 = disable serviceevent handler, 1 = enable service event handler.
low_flap_threshold: This directive is used to specify the low state change thresholdused in flap detection for this service. More information on flapdetection can be found here. If you set this directive to a value of 0,the program-wide value specified by the low_service_flap_threshold directive will be used.
high_flap_threshold: This directive is used to specify the high state change thresholdused in flap detection for this service. More information on flapdetection can be found here. If you set this directive to a value of 0,the program-wide value specified by the high_service_flap_threshold directive will be used.
217

flap_detection_enabled *: This directive is used to determine whether or not flap detection isenabled for this service. More information on flap detection can befound here. Values: 0 = disable service flap detection, 1 = enableservice flap detection.
process_perf_data *: This directive is used to determine whether or not the processingof performance data is enabled for this service. Values: 0 = disableperformance data processing, 1 = enable performance data processing.
retain_status_information: This directive is used to determine whether or not status-relatedinformation about the service is retained across program restarts.This is only useful if you have enabled state retention using the retain_state_information directive. Value: 0 = disable statusinformation retention, 1 = enable status information retention.
retain_nonstatus_information: This directive is used to determine whether or not non-statusinformation about the service is retained across program restarts.This is only useful if you have enabled state retention using the retain_state_information directive. Value: 0 = disable non-statusinformation retention, 1 = enable non-status information retention.
notification_interval: This directive is used to define the number of "time units" to waitbefore re-notifying a contact that this service is still in a non-OKstate. Unless you’ve changed the interval_length directive fromthe default value of 60, this number will mean minutes. If you setthis value to 0, Nagios will not re-notify contacts about problemsfor this service - only one problem notification will be sent out.
notification_period: This directive is used to specify the short name of the time periodduring which notifications of events for this service can be sent outto contacts. No service notifications will be sent out during timeswhich is not covered by the time period.
notification_options: This directive is used to determine when notifications for theservice should be sent out. Valid options are a combination of oneor more of the following: w = send notifications on a WARNINGstate, u = send notifications on an UNKNOWN state, c = sendnotifications on a CRITICAL state, r = send notifications onrecoveries (OK state), and f = send notifications when the servicestarts and stops flapping. If you specify n (none) as an option, noservice notifications will be sent out. Example: If you specify w,r inthis field, notifications will only be sent out when the service goesinto a WARNING state and when it recovers from a WARNING state.
notifications_enabled *: This directive is used to determine whether or not notifications forthis service are enabled. Values: 0 = disable service notifications, 1= enable service notifications.
contact_groups: This is a list of the short names of the contact groups that should benotified whenever there are problems (or recoveries) with thisservice. Multiple contact groups should be separated by commas.
218

stalking_options: This directive determines which service states "stalking" is enabledfor. Valid options are a combination of one or more of thefollowing: o = stalk on OK states, w = stalk on WARNING states, u = stalk on UNKNOWN states, and c = stalk on CRITICAL states.More information on state stalking can be found here.
Service Group Definition
Description:
A service group definition is used to group one or more services together for display purposes in the CGIs.
Definition Format:
Note: Directives in red are required, while those in black are optional.
define servicegroup{
servicegroup_name servicegroup_name
alias alias
members members
}
Example Definition:
define servicegroup{ servicegroup_name dbservices alias Database Services members ms1,SQL Server,ms1,SQL Server Agent,ms1,SQL DTC }
Directive Descriptions:
servicegroup_name: This directive is used to define a short name used to identify the service group.
alias: This directive is used to define is a longer name or description used toidentify the service group. It is provided in order to allow you to more easilyidentify a particular service group.
members: This is a list of the descriptions of services (and the names of theircorresponding hosts) that should be included in this group. Host and servicenames should be separated by commas. This directive may be used as analternative to the servicegroups directive in service definitions. The format ofthe member directive is as follows (note that a host name must precede aservice name/description):
members=<host1>,<service1>,<host2>,<service2>,...,<hostn>,<servicen>
219

Contact Definition
Description:
A contact definition is used to identify someone who should be contacted in the event of a problem onyour network. The different arguments to a contact definition are described below.
Definition Format:
Note: Directives in red are required, while those in black are optional.
define contact{
contact_name contact_name
alias alias
contactgroups contactgroup_names
host_notification_period timeperiod_name
service_notification_period timeperiod_name
host_notification_options [d,u,r,f,n]
service_notification_options [w,u,c,r,f,n]
host_notification_commands command_name
service_notification_commands command_name
email email_address
pager pager_number or pager_email_gateway
addressx additional_contact_address
}
Example Definition:
define contact{ contact_name jdoe alias John Doe service_notification_period 24x7 host_notification_period 24x7 service_notification_options w,u,c,r host_notification_options d,u,r service_notification_commands notify-by-email host_notification_commands host-notify-by-email email [email protected] pager [email protected] address1 [email protected] address2 555-555-5555 }
Directive Descriptions:
220

contact_name: This directive is used to define a short name used to identify thecontact. It is referenced in contact group definitions. Under theright circumstances, the $CONTACTNAME$ macro will containthis value.
alias: This directive is used to define a longer name or description forthe contact. Under the rights circumstances, the$CONTACTALIAS$ macro will contain this value.
contactgroups: This directive is used to identify the short name(s) of the contactgroup(s) that the contact belongs to. Multiplecontactgroups should are seperated by commas. This directivemay be used as an alternative to (or in addition to) using the members directive in contactgroup definitions.
host_notification_period: This directive is used to specify the short name of the time period during which the contact can be notified about hostproblems or recoveries. You can think of this as an "on call" timefor host notifications for the contact. Read the documentation on time periods for more information on how this works andpotential problems that may result from improper use.
service_notification_period: This directive is used to specify the short name of the time period during which the contact can be notified about serviceproblems or recoveries. You can think of this as an "on call" timefor service notifications for the contact. Read the documentationon time periods for more information on how this works andpotential problems that may result from improper use.
host_notification_commands: This directive is used to define a list of the short names of the commands used to notify the contact of a host problem orrecovery. Multiple notification commands should be separatedby commas. All notification commands are executed when thecontact needs to be notified. The maximum amount of time thata notification command can run is controlled by the notification_timeout option.
host_notification_options: This directive is used to define the host states for whichnotifications can be sent out to this contact. Valid options are acombination of one or more of the following: d = notify onDOWN host states, u = notify on UNREACHABLE host states, r= notify on host recoveries (UP states), and f = notify when thehost starts and stops flapping. If you specify n (none) as anoption, the contact will not receive any type of host notifications.
service_notification_options: This directive is used to define the service states for whichnotifications can be sent out to this contact. Valid options are acombination of one or more of the following: w = notify onWARNING service states, u = notify on UNKNOWN servicestates, c = notify on CRITICAL service states, r = notify onservice recoveries (OK states), and f = notify when the servucestarts and stops flapping. If you specify n (none) as an option,the contact will not receive any type of service notifications.
221

service_notification_commands: This directive is used to define a list of the short names of the commands used to notify the contact of a service problem orrecovery. Multiple notification commands should be separatedby commas. All notification commands are executed when thecontact needs to be notified. The maximum amount of time thata notification command can run is controlled by the notification_timeout option.
email: This directive is used to define an email address for the contact.Depending on how you configure your notification commands,it can be used to send out an alert email to the contact. Under theright circumstances, the $CONTACTEMAIL$ macro will containthis value.
pager: This directive is used to define a pager number for the contact. Itcan also be an email address to a pager gateway ([email protected]). Depending on how you configure yournotification commands, it can be used to send out an alert pageto the contact. Under the right circumstances, the$CONTACTPAGER$ macro will contain this value.
addressx: Address directives are used to define additional "addresses" forthe contact. These addresses can be anything - cell phonenumbers, instant messaging addresses, etc. Depending on howyou configure your notification commands, they can be used tosend out an alert o the contact. Up to six addresses can bedefined using these directives (address1 through address6). The $CONTACTADDRESSx$ macro will contain this value.
Contact Group Definition
Description:
A contact group definition is used to group one or more contacts together for the purpose of sending outalert/recovery notifications. When a host or service has a problem or recovers, Nagios will find theappropriate contact groups to send notifications to, and notify all contacts in those contact groups. Thismay sound complex, but for most people it doesn’t have to be. It does, however, allow for flexibility indetermining who gets notified for particular events. The different arguments to a contact groupdefinition are outlined below.
Definition Format:
Note: Directives in red are required, while those in black are optional.
define contactgroup{
contactgroup_name contactgroup_name
alias alias
members members
}
222

Example Definition:
define contactgroup{ contactgroup_name novell-admins alias Novell Administrators members jdoe,rtobert,tzach }
Directive Descriptions:
contactgroup_name: This directive is a short name used to identify the contact group.
alias: This directive is used to define a longer name or description used to identifythe contact group.
members: This directive is used to define a list of the short names of contacts that shouldbe included in this group. Multiple contact names should be separated bycommas. This directive may be used as an alternative to (or in addition to)using the contactgroups directive in contact definitions.
Time Period Definition
Description:
A time period is a list of times during various days that are considered to be "valid" times fornotifications and service checks. It consists one or more time periods for each day of the week that"rotate" once the week has come to an end. Exceptions to the normal weekly time range rotations are not suported.
Definition Format:
Note: Directives in red are required, while those in black are optional.
define timeperiod{
timeperiod_name timeperiod_name
alias alias
sunday timeranges
monday timeranges
tuesday timeranges
wednesday timeranges
thursday timeranges
friday timeranges
saturday timeranges
}
223

Example Definition:
define timeperiod{ timeperiod_name nonworkhours alias Non-Work Hours sunday 00:00-24:00 monday 00:00-09:00,17:00-24:00 tuesday 00:00-09:00,17:00-24:00 wednesday 00:00-09:00,17:00-24:00 thursday 00:00-09:00,17:00-24:00 friday 00:00-09:00,17:00-24:00 saturday 00:00-24:00 }
Directive Descriptions:
timeperiod_name: This directives is the short name used to identify the time period.
alias: This directive is a longer name or description used to identify the time period.
someday: The sunday through saturday directives are comma-delimited lists of timeranges that are "valid" times for a particular day of the week. Notice that thereare seven different days for which you can define time ranges (Sunday throughSaturday). Each time range is in the form of HH:MM-HH:MM, where hoursare specified on a 24 hour clock. For example, 00:15-24:00 means 12:15am in themorning for this day until 12:20am midnight (a 23 hour, 45 minute total timerange). If you wish to exclude an entire day from the timeperiod, simply do notinclude it in the timeperiod definition.
Command Definition
Description:
A command definition is just that. It defines a command. Commands that can be defined include servicechecks, service notifications, service event handlers, host checks, host notifications, and host eventhandlers. Command definitions can contain macros, but you must make sure that you include onlythose macros that are "valid" for the circumstances when the command will be used. More informationon what macros are available and when they are "valid" can be found here. The different arguments to acommand definition are outlined below.
Definition Format:
Note: Directives in red are required, while those in black are optional.
define command{
command_name command_name
command_line command_line
}
Example Definition:
224

define command{ command_name check_pop command_line /usr/local/nagios/libexec/check_pop -H $HOSTADDRESS$ }
Directive Descriptions:
command_name: This directive is the short name used to identify the command. It is referenced in contact, host, and service definitions (in notification, check, and event handlerdirectives), among other places.
command_line: This directive is used to define what is actually executed by Nagios when thecommand is used for service or host checks, notifications, or event handlers.Before the command line is executed, all valid macros are replaced with theirrespective values. See the documentation on macros for determining when youcan use different macros. Note that the command line is not surrounded inquotes. Also, if you want to pass a dollar sign ($) on the command line, youhave to escape it with another dollar sign.
NOTE: You may not include a semicolon (;) in the command_line directive,because everything after it will be ignored as a config file comment. You canwork around this limitation by setting one of the $USER$ macros in your resource file to a semicolon and then referencing the appropriate $USER$ macroin the command_line directive in place of the semicolon.
If you want to pass arguments to commands during runtime, you can use $ARGn$ macros in the command_line directive of the command definition andthen seperate individual arguments from the command name (and from eachother) using bang (!) characters in the object definition directive (host checkcommand, service event handler command, etc) that references the command.More information on how arguments in command definitions are processedduring runtime can be found in the documentation on macros.
Service Dependency Definition
Description:
Service dependencies are an advanced feature of Nagios that allow you to suppress notifications andactive checks of services based on the status of one or more other services. Service dependencies areoptional and are mainly targeted at advanced users who have complicated monitoring setups. Moreinformation on how service dependencies work (read this!) can be found here.
Definition Format:
Note: Directives in red are required, while those in black are optional. However, you must supply atleast one type of criteria for the definition to be of much use.
225

define servicedependency{
dependent_host_name host_name
dependent_service_description service_description
host_name host_name
service_description service_description
inherits_parent [0/1]
execution_failure_criteria [o,w,u,c,p,n]
notification_failure_criteria [o,w,u,c,p,n]
}
Example Definition:
define servicedependency{ host_name WWW1 service_description Apache Web Server dependent_host_name WWW1 dependent_service_description Main Web Site execution_failure_criteria n notification_failure_criteria w,u,c }
Directive Descriptions:
226

dependent_host: This directive is used to identify the short name of the host thatthe dependent service "runs" on or is associated with.
dependent_service_description: This directive is used to identify the description of the dependent service.
host_name: This directive is used to identify the short name of the host thatthe service that is being depended upon (also referred to as themaster service) "runs" on or is associated with.
service_description: This directive is used to identify the description of the service thatis being depended upon (also referred to as the master service).
inherits_parent: This directive indicates whether or not the dependency inheritsdependencies of the service that is being depended upon (alsoreferred to as the master service). In other words, if the masterservice is dependent upon other services and any one of thosedependencies fail, this dependency will also fail.
execution_failure_criteria: This directive is used to specify the criteria that determine whenthe dependent service should not be actively checked. If the master service is in one of the failure states we specify, the dependent service will not be actively checked. Valid options are acombination of one or more of the following (multiple optionsare seperated with commas): o = fail on an OK state, w = fail on aWARNING state, u = fail on an UNKNOWN state, c = fail on aCRITICAL state, and p = fail on a pending state (e.g. the servicehas not yet been checked). If you specify n (none) as an option,the execution dependency will never fail and checks of thedependent service will always be actively checked (if otherconditions allow for it to be). Example: If you specify o,c,u in thisfield, the dependent service will not be actively checked if the master service is in either an OK, a CRITICAL, or an UNKNOWN state.
notification_failure_criteria: This directive is used to define the criteria that determine whennotifications for the dependent service should not be sent out. Ifthe master service is in one of the failure states we specify,notifications for the dependent service will not be sent to contacts.Valid options are a combination of one or more of the following: o = fail on an OK state, w = fail on a WARNING state, u = fail onan UNKNOWN state, c = fail on a CRITICAL state, and p = failon a pending state (e.g. the service has not yet been checked). Ifyou specify n (none) as an option, the notification dependencywill never fail and notifications for the dependent service willalways be sent out. Example: If you specify w in this field, thenotifications for the dependent service will not be sent out if the master service is in a WARNING state.
Service Escalation Definition
Description:
227

Service escalations are completely optional and are used to escalate notifications for a particular service.More information on how notification escalations work can be found here.
Definition Format:
Note: Directives in red are required, while those in black are optional.
define serviceescalation{
host_name host_name
service_description service_description
contact_groups contactgroup_name
first_notification #
last_notification #
notification_interval #
escalation_period timeperiod_name
escalation_options [w,u,c,r]
}
Example Definition:
define serviceescalation{ host_name nt-3 service_description Processor Load first_notification 4 last_notification 0 notification_interval 30 contact_groups all-nt-admins,themanagers }
Directive Descriptions:
228

host_name: This directive is used to identify the short name of the host that the servicethe escalation should apply to is associated with.
service_description: This directive is used to identify the description of the service the escalationshould apply to.
first_notification: This directive is a number that identifies the first notification for which thisescalation is effective. For instance, if you set this value to 3, this escalationwill only be used if the service is in a non-OK state long enough for a thirdnotification to go out.
last_notification: This directive is a number that identifies the last notification for which thisescalation is effective. For instance, if you set this value to 5, this escalationwill not be used if more than five notifications are sent out for the service.Setting this value to 0 means to keep using this escalation entry forever (nomatter how many notifications go out).
contact_groups: This directive is used to identify the short name of the contact group thatshould be notified when the service notification is escalated. Multiplecontact groups should be separated by commas.
notification_interval: This directive is used to determine the interval at which notifications shouldbe made while this escalation is valid. If you specify a value of 0 for theinterval, Nagios will send the first notification when this escalationdefinition is valid, but will then prevent any more problem notificationsfrom being sent out for the host. Notifications are sent out again until thehost recovers. This is useful if you want to stop having notifications sent outafter a certain amount of time. Note: If multiple escalation entries for a hostoverlap for one or more notification ranges, the smallest notification intervalfrom all escalation entries is used.
escalation_period: This directive is used to specify the short name of the time period duringwhich this escalation is valid. If this directive is not specified, the escalationis considered to be valid during all times.
escalation_options: This directive is used to define the criteria that determine when this serviceescalation is used. The escalation is used only if the service is in one of thestates specified in this directive. If this directive is not specified in a serviceescalation, the escalation is considered to be valid during all service states.Valid options are a combination of one or more of the following: r = escalateon an OK (recovery) state, w = escalate on a WARNING state, u = escalateon an UNKNOWN state, and c = escalate on a CRITICAL state. Example: Ifyou specify w in this field, the escalation will only be used if the service is ina WARNING state.
Host Dependency Definition
Description:
Host dependencies are an advanced feature of Nagios that allow you to suppress notifications for hostsbased on the status of one or more other hosts. Host dependencies are optional and are mainly targetedat advanced users who have complicated monitoring setups. More information on how hostdependencies work (read this!) can be found here.
229

Definition Format:
Note: Directives in red are required, while those in black are optional.
define hostdependency{
dependent_host_name host_name
host_name host_name
inherits_parent [0/1]
execution_failure_criteria [o,d,u,p,n]
notification_failure_criteria [o,d,u,p,n]
}
Example Definition:
define hostdependency{ host_name WWW1 dependent_host_name DBASE1 notification_failure_criteria d,u }
Directive Descriptions:
230

dependent_host: This directive is used to identify the short name of the dependent host.
host_name: This directive is used to identify the short name of the host that isbeing depended upon (also referred to as the master host).
inherits_parent: This directive indicates whether or not the dependency inheritsdependencies of the host that is being depended upon (also referred toas the master host). In other words, if the master host is dependentupon other hosts and any one of those dependencies fail, thisdependency will also fail.
execution_failure_criteria: This directive is used to specify the criteria that determine when thedependent host should not be actively checked. If the master host is inone of the failure states we specify, the dependent host will not beactively checked. Valid options are a combination of one or more ofthe following (multiple options are seperated with commas): o = failon an UP state, d = fail on a DOWN state, u = fail on anUNREACHABLE state, and p = fail on a pending state (e.g. the hosthas not yet been checked). If you specify n (none) as an option, theexecution dependency will never fail and the dependent host willalways be actively checked (if other conditions allow for it to be).Example: If you specify u,d in this field, the dependent host will notbe actively checked if the master host is in either an UNREACHABLEor DOWN state.
notification_failure_criteria: This directive is used to define the criteria that determine whennotifications for the dependent host should not be sent out. If the master host is in one of the failure states we specify, notifications forthe dependent host will not be sent to contacts. Valid options are acombination of one or more of the following: o = fail on an UP state, d = fail on a DOWN state, u = fail on an UNREACHABLE state, and p = fail on a pending state (e.g. the host has not yet been checked). Ifyou specify n (none) as an option, the notification dependency willnever fail and notifications for the dependent host will always besent out. Example: If you specify d in this field, the notifications forthe dependent host will not be sent out if the master host is in aDOWN state.
Host Escalation Definition
Description:
Host escalations are completely optional and are used to escalate notifications for a particular host. Moreinformation on how notification escalations work can be found here.
Definition Format:
Note: Directives in red are required, while those in black are optional.
231

define hostescalation{
host_name host_name
hostgroup_name hostgroup_name
contact_groups contactgroup_name
first_notification #
last_notification #
notification_interval #
escalation_period timeperiod_name
escalation_options [d,u,r]
}
Example Definition:
define hostescalation{ host_name router-34 first_notification 5 last_notification 8 notification_interval 60 contact_groups all-router-admins }
Directive Descriptions:
232

host_name: This directive is used to identify the short name of the host that the escalationshould apply to.
hostgroup_name: This directive is used to identify the short name(s) of the hostgroup(s) thatthe escalation should apply to. Multiple hostgroups should are seperated bycommas. If this is used, the escalation will apply to all hosts that aremembers of the specified hostgroup(s).
first_notification: This directive is a number that identifies the first notification for which thisescalation is effective. For instance, if you set this value to 3, this escalationwill only be used if the host is down or unreachable long enough for a thirdnotification to go out.
last_notification: This directive is a number that identifies the last notification for which thisescalation is effective. For instance, if you set this value to 5, this escalationwill not be used if more than five notifications are sent out for the host.Setting this value to 0 means to keep using this escalation entry forever (nomatter how many notifications go out).
contact_groups: This directive is used to identify the short name of the contact group thatshould be notified when the host notification is escalated. Multiple contactgroups should be separated by commas.
notification_interval: This directive is used to determine the interval at which notifications shouldbe made while this escalation is valid. If you specify a value of 0 for theinterval, Nagios will send the first notification when this escalationdefinition is valid, but will then prevent any more problem notificationsfrom being sent out for the host. Notifications are sent out again until thehost recovers. This is useful if you want to stop having notifications sent outafter a certain amount of time. Note: If multiple escalation entries for a hostoverlap for one or more notification ranges, the smallest notification intervalfrom all escalation entries is used.
escalation_period: This directive is used to specify the short name of the time period duringwhich this escalation is valid. If this directive is not specified, the escalationis considered to be valid during all times.
escalation_options: This directive is used to define the criteria that determine when this hostescalation is used. The escalation is used only if the host is in one of thestates specified in this directive. If this directive is not specified in a hostescalation, the escalation is considered to be valid during all host states.Valid options are a combination of one or more of the following: r = escalateon an UP (recovery) state, d = escalate on a DOWN state, and u = escalateon an UNREACHABLE state. Example: If you specify d in this field, theescalation will only be used if the host is in a DOWN state.
Extended Host Information Definition
Description:
Extended host information entries are basically used to make the output from the status, statusmap, statuswrl, and extinfo CGIs look pretty. They have no effect on monitoring and are completely optional.
233

Definition Format:
Note: Variables in red are required, while those in black are optional. However, you need to supply atleast one optional variable in each definition for it to be of much use.
define hostextinfo{
host_name host_name
notes note_string
notes_url url
action_url url
icon_image image_file
icon_image_alt alt_string
vrml_image image_file
statusmap_image image_file
2d_coords x_coord,y_coord
3d_coords x_coord,y_coord,z_coord
}
Example Definition:
define hostextinfo{ host_name netware1 notes This is the primary Netware file server notes_url http://webserver.localhost.localdomain/hostinfo.pl?host=netware1 icon_image novell40.png icon_image_alt IntranetWare 4.11 vrml_image novell40.png statusmap_image novell40.gd2 2d_coords 100,250 3d_coords 100.0,50.0,75.0 }
Variable Descriptions:
host_name: This variable is used to identify the short name of the host which the data isassociated with.
notes: This directive is used to define an optional string of notes pertaining to thehost. If you specify a note here, you will see the it in the extended informationCGI (when you are viewing information about the specified host).
234

notes_url: This variable is used to define an optional URL that can be used to providemore information about the host. If you specify an URL, you will see a link thatsays "Extra Host Notes" in the extended information CGI (when you areviewing information about the specified host). Any valid URL can be used. Ifyou plan on using relative paths, the base path will the the same as what isused to access the CGIs (i.e. /cgi-bin/nagios/). This can be very useful if you wantto make detailed information on the host, emergency contact methods, etc.available to other support staff.
action_url: This directive is used to define an optional URL that can be used to providemore actions to be performed on the host. If you specify an URL, you will see alink that says "Extra Host Actions" in the extended information CGI (when youare viewing information about the specified host). Any valid URL can be used.If you plan on using relative paths, the base path will the the same as what isused to access the CGIs (i.e. /cgi-bin/nagios/).
icon_image: This variable is used to define the name of a GIF, PNG, or JPG image thatshould be associated with this host. This image will be displayed in the statusand extended information CGIs. The image will look best if it is 40x40 pixels insize. Images for hosts are assumed to be in the logos/ subdirectory in yourHTML images directory (i.e. /usr/local/nagios/share/images/logos).
icon_image_alt: This variable is used to define an optional string that is used in the ALT tag ofthe image specified by the <icon_image> argument. The ALT tag is used in the status, extended information and statusmap CGIs.
vrml_image: This variable is used to define the name of a GIF, PNG, or JPG image thatshould be associated with this host. This image will be used as the texture mapfor the specified host in the statuswrl CGI. Unlike the image you use for the <icon_image> variable, this one should probably not have any transparency. If itdoes, the host object will look a bit wierd. Images for hosts are assumed to be inthe logos/ subdirectory in your HTML images directory (i.e. /usr/local/nagios/share/images/logos).
statusmap_image: This variable is used to define the name of an image that should be associatedwith this host in the statusmap CGI. You can specify a JPEG, PNG, and GIFimage if you want, although I would strongly suggest using a GD2 formatimage, as other image formats will result in a lot of wasted CPU time when thestatusmap image is generated. GD2 images can be created from PNG images byusing the pngtogd2 utility supplied with Thomas Boutell’s gd library. The GD2images should be created in uncompressed format in order to minimize CPUload when the statusmap CGI is generating the network map image. The imagewill look best if it is 40x40 pixels in size. You can leave these option blank if youare not using the statusmap CGI. Images for hosts are assumed to be in the logos/ subdirectory in your HTML images directory (i.e. /usr/local/nagios/share/images/logos).
235

2d_coords: This variable is used to define coordinates to use when drawing the host in the statusmap CGI. Coordinates should be given in positive integers, as thecorrespond to physical pixels in the generated image. The origin for drawing(0,0) is in the upper left hand corner of the image and extends in the positive xdirection (to the right) along the top of the image and in the positive y direction(down) along the left hand side of the image. For reference, the size of the iconsdrawn is usually about 40x40 pixels (text takes a little extra space). Thecoordinates you specify here are for the upper left hand corner of the host iconthat is drawn. Note: Don’t worry about what the maximum x and y coordinatesthat you can use are. The CGI will automatically calculate the maximumdimensions of the image it creates based on the largest x and y coordinates you specify.
3d_coords: This variable is used to define coordinates to use when drawing the host in the statuswrl CGI. Coordinates can be positive or negative real numbers. Theorigin for drawing is (0.0,0.0,0.0). For reference, the size of the host cubesdrawn is 0.5 units on each side (text takes a little more space). The coordinatesyou specify here are used as the center of the host cube.
Extended Service Information Definition
Description:
Extended service information entries are basically used to make the output from the status and extinfoCGIs look pretty. They have no effect on monitoring and are completely optional.
Definition Format:
Note: Variables in red are required, while those in black are optional. However, you need to supply atleast one optional variable in each definition for it to be of much use.
define serviceextinfo{
host_name host_name
service_description service_description
notes note_string
notes_url url
action_url url
icon_image image_file
icon_image_alt alt_string
}
Example Definition:
236

define serviceextinfo{ host_name linux2 service_description Log Anomalies notes Security-related log anomalies on secondary Linux server notes_url http://webserver.localhost.localdomain/serviceinfo.pl?host=linux2&service=Log+Anomalies icon_image security.png icon_image_alt Security-Related Alerts }
Variable Descriptions:
host_name: This directive is used to identify the short name of the host that the service isassociated with.
service_description: This directive is description of the service which the data is associated with.
notes: This directive is used to define an optional string of notes pertaining to theservice. If you specify a note here, you will see the it in the extended information CGI (when you are viewing information about the specified service).
notes_url: This directive is used to define an optional URL that can be used to providemore information about the service. If you specify an URL, you will see a linkthat says "Extra Service Notes" in the extended information CGI (when youare viewing information about the specified service). Any valid URL can beused. If you plan on using relative paths, the base path will the the same aswhat is used to access the CGIs (i.e. /cgi-bin/nagios/). This can be very useful ifyou want to make detailed information on the service, emergency contactmethods, etc. available to other support staff.
action_url: This directive is used to define an optional URL that can be used to providemore actions to be performed on the service. If you specify an URL, you willsee a link that says "Extra Service Actions" in the extended information CGI(when you are viewing information about the specified service). Any validURL can be used. If you plan on using relative paths, the base path will thethe same as what is used to access the CGIs (i.e. /cgi-bin/nagios/).
icon_image: This variable is used to define the name of a GIF, PNG, or JPG image thatshould be associated with this host. This image will be displayed in the statusand extended information CGIs. The image will look best if it is 40x40 pixelsin size. Images for hosts are assumed to be in the logos/ subdirectory in yourHTML images directory (i.e. /usr/local/nagios/share/images/logos).
icon_image_alt: This variable is used to define an optional string that is used in the ALT tagof the image specified by the <icon_image> argument. The ALT tag is used inthe status, extended information and statusmap CGIs.
237

External Command File Permissions
Notes
These instructions assume that you’ve installed Nagios on a dedicated monitoring/admin box thatdoesn’t contain normal user accounts (i.e. isn’t a public machine). If you’ve installed Nagios on apublic/multi-user machine, I would suggest setting more restrictive permissions on the externalcommand file and using something like CGIWrap to run the CGIs as a specific user. Failing to do so mayallow normal users to control Nagios through the external command file! I’m guessing you don’t wantthat. More information on securing Nagios can be found here.
Introduction
One of the most common problems people have seems to be with setting proper permissions for theexternal command file. You need to set the proper permission on the /usr/local/nagios/var/rw directory (orwhatever the path portion of the command_file directive in your main configuration file is set to). I’llshow you how to do this. Note: You must be root in order to do some of these steps...
Users and Groups
First, find the user that your web server process is running as. On many systems this is the user nobody,although it will vary depending on what OS/distribution you are running. You’ll also need to knowwhat user Nagios is effectively running as - this is specified with the nagios_user variable in the mainconfig file.
Next we’re going to create a new group whose members include the user the web server is running asand the user Nagios is running as. Let’s say we call this new group ’nagiocmd’ (you can name itdifferently if you wish). On RedHat Linux you can use the following command to add a new group(other systems may differ):
/usr/sbin/groupadd nagiocmd
Next, add the web server user (nobody or apache, etc) and the Nagios user (nagios) to the newly createdgroup with the following commands:
/usr/sbin/usermod -G nagiocmd nagios/usr/sbin/usermod -G nagiocmd nobody
Creating the directory
Next, create the directory where the command file should be stored. By default, this is /usr/local/nagios/var/rw, although it can be changed by modifying the path specified in thecommand_file directory.
mkdir /usr/local/nagios/var/rw
Setting directory permissions
Next, change the ownership of the directory that will be used to hold the command file...
chown nagios.nagiocmd /usr/local/nagios/var/rw
Make sure the Nagios user has full permissions on the directory...
238

chmod u+rwx /usr/local/nagios/var/rw
Make sure the group we created has full permissions on the directory.
chmod g+rwx /usr/local/nagios/var/rw
In order to force newly created files in the directory to inherit the group permissions from the directory,we need to enable the group sticky bit on the directory...
chmod g+s /usr/local/nagios/var/rw
Verifying the permissions
Check the permissions on the rw/ subdirectory by running ’ls -al /usr/local/nagios/var’. You should seesomething similiar to the following:
drwxrws--- 2 nagios nagiocmd 1024 Aug 11 16:30 rw
Note that the user nagios is the owner of the directory and the group nagiocmd is the group owner of thedirectory. The nagios user has rwx permissions and group nagiocmd has rw permissions on the directory.Also, note that the group sticky bit is enabled. That’s what we want...
Restart your web server
Once you set the proper permission on the directory containing the external command file, make sure torestart your web server. If you fail to do this, Apache will not be able to write to the external commandfile, even though the user it runs as is a member of the nagiocmd group.
Additional notes...
If you supplied the --with-command-grp=somegroup option when running the configure script, you cancreate the directory to hold the command file and set the proper permissions automatically by running ’make install-commandmode’.
239

Extended Information Configuration
What is Extended Information?
Extended information consists of optional definitions for hosts and services that is used by the CGIs inthe following ways:
to provide URLs to additional information about the host or service
to add pretty icons to the hosts and services displayed in the web interface
to draw hosts in the statusmap and statuswrl CGIs at user-defined 2-D and 3-D coordinates
Where is Extended Information Defined?
Extended information definitions are stored in object configuration files along with definitions for hosts,services, contacts, etc. You can use templates to define entries for multiple hosts and services quicklyand easily.
240