nad& protects against eae by regulating cd4& t-cell differentiation · c d4þ t helper (th)...
TRANSCRIPT

ARTICLE
Received 9 Jan 2014 | Accepted 28 Aug 2014 | Published 7 Oct 2014
NADþ protects against EAE by regulating CD4þ
T-cell differentiationStefan G. Tullius1,*, Hector Rodriguez Cetina Biefer1,2,*, Suyan Li3, Alexander J. Trachtenberg4, Karoline Edtinger1,
Markus Quante1, Felix Krenzien1, Hirofumi Uehara1, Xiaoyong Yang1, Haydn T. Kissick5, Winston P. Kuo4,
Ionita Ghiran6, Miguel A. de la Fuente7, Mohamed S. Arredouani5, Virginia Camacho8, John C. Tigges8,
Vasilis Toxavidis8, Rachid El Fatimy9, Brian D. Smith10, Anju Vasudevan3 & Abdallah ElKhal1
CD4þ T cells are involved in the development of autoimmunity, including multiple sclerosis
(MS). Here we show that nicotinamide adenine dinucleotide (NADþ) blocks experimental
autoimmune encephalomyelitis (EAE), a mouse model of MS, by inducing immune
homeostasis through CD4þ IFNgþ IL-10þ T cells and reverses disease progression by
restoring tissue integrity via remyelination and neuroregeneration. We show that
NADþ regulates CD4þ T-cell differentiation through tryptophan hydroxylase-1 (Tph1),
independently of well-established transcription factors. In the presence of NADþ , the
frequency of T-bet� /� CD4þ IFNgþ T cells was twofold higher than wild-type CD4þ T cells
cultured in conventional T helper 1 polarizing conditions. Our findings unravel a new pathway
orchestrating CD4þ T-cell differentiation and demonstrate that NADþ may serve as a
powerful therapeutic agent for the treatment of autoimmune and other diseases.
DOI: 10.1038/ncomms6101 OPEN
1 Division of Transplant Surgery and Transplantation Surgery Research Laboratory, Department of Surgery, Brigham and Women’s Hospital, Harvard MedicalSchool, Boston, Massachusetts 02115, USA. 2 Clinic for Cardiovascular Surgery, University Hospital Zurich, Zurich 8091, Switzerland. 3 Angiogenesis and BrainDevelopment Laboratory, Division of Basic Neuroscience, McLean Hospital/Harvard Medical School, Belmont, Massachusetts 02478, USA. 4 HarvardCatalyst-Laboratory for Innovative Translational Technologies, Harvard Medical School, Boston, Massachusetts 02115, USA. 5 Department of Surgery, BethIsrael Deaconess Medical Center, Harvard Medical School, Boston, Massachusetts 02115, USA. 6 Department of Medicine, Beth Israel Deaconess MedicalCenter, Harvard Medical School, Boston, Massachusetts 02115, USA. 7 Instituto de Biologıa y Genetica Molecular, University of Valladolid, Valladolid 47003,Spain. 8 Flow Cytometry Core Facility, Beth Israel Deaconess Medical Center, Harvard Stem Cell Institute, Boston, Massachusetts 02115, USA. 9 Center forNeurological Diseases, Brigham and Women’s Hospital, Harvard Medical School, Boston, Massachusetts 02115, USA. 10 Transplantation Research Center,Renal Division, Brigham and Women’s Hospital and Children’s Hospital, Harvard Medical School, Boston, Massachusetts 02115, USA. * These authorscontributed equally to this work. Correspondence and requests for materials should be addressed to A.E. (email: [email protected]).
NATURE COMMUNICATIONS | 5:5101 | DOI: 10.1038/ncomms6101 | www.nature.com/naturecommunications 1
& 2014 Macmillan Publishers Limited. All rights reserved.

CD4þ T helper (Th) cells play a central role in regulatingthe adaptive immune response associated with pathogeninvasion. To date, several CD4þ Th cell subsets have been
described. Th1 and Th2 subsets were the first described1–4,whereas Th17 and induced regulatory T cells were characterizedmore recently5–7. Each distinct CD4þ T-cell subset has a specificfunction and can mainly be distinguished by its cytokine profile,the expression pattern of cell surface molecules, and theactivation of specific transcription factors8. However, thefunction of CD4þ T cells can be impaired resulting innumerous diseases, including allergic responses, tumourimmunity and autoimmunity9,10. In multiple sclerosis (MS),Th1 and Th17 subsets have been shown to play a central role11.MS is an inflammatory-mediated demyelinating disease that hasbeen associated with production of interferon (IFN)-g andinterleukin (IL)-17, two cytokines that are produced by Th1and Th17 cells, respectively12. More recently, the role of Th1and Th17 CD4þ cells in the pathogenesis of experimentalautoimmune encephalomyelitis (EAE), the most commonly usedexperimental model for human MS, has been challenged, and ithas been demonstrated that the transcription factor T-bet(also known as Tbx21) is critical for controlling Th1/Th17-mediated autoimmunity12. In contrast, regulatory T cells (Tregs)play a cardinal role in protecting against autoimmune diseases,inflammation and tissue damage13 through secretion of IL-10(ref. 14) and other mechanisms. Although differentiation of naıveCD4þ T cells has been considered to be an irreversible process,accumulating evidence suggests that T cells are much moreflexible than initially believed with the ability to interchangebetween helper phenotypes15. For instance, Th17 cells are able toco-produce IFN-g, initially considered exclusively a Th1cytokine16,17. It has been shown that Th17 cells can also co-express Foxp3 or T-bet18–19, which are the master regulators ofTregs and Th1 cells, respectively. Moreover, Th1 IFN-g-producing cells have been shown to have the capacity toproduce the immunosuppressive cytokine IL-10, initiallyconsidered a Th2 cytokine20. Studies have shown that Th1 IFN-g-producing cells that co-produce IL-10 have immunosuppressiveproperties and can protect from tissue damage21,22. In addition, itwas recently shown that Th17 cells that were generated withtransforming growth factor (TGF)-b and IL-6 were notpathogenic and did not induce EAE without exposure to IL-23(ref. 23). Thus, these reports suggest the existence of broadplasticity of Th1 and Th17 cells.
In EAE, it was reported that nicotinamide (Nam), a precursorof nicotinamide adenine dinucleotide (NADþ ) biosynthesis,plays an important role in the disease. This study reported thatNam reduced CD4þ T cell infiltration and demyelination24, butfailed to identify the protective mechanisms of action. In contrast,a different study found that inhibition of NADþ synthesis byFK866, an inhibitor of nicotinamide phosphoribosyltransferase
(Nampt), protected against EAE25. In this latter study, it wasreported that FK866 treatment was associated with a massivedepletion of NADþ in activated CD3þ T lymphocytes andimpaired their proliferation and cytokine production25.Furthermore, numerous studies have underscored the role ofNADþ , a co-factor found in all living cells and in nutrients, inT-cell regulation. In vivo, NADþ has been shown to induceapoptosis in naıve CD4þCD62Lhigh T cells and Foxp3þ
regulatory T cells26,27. Conversely, activated CD44highCD69high
T cells were more resistant to NADþ -induced cell death26.Moreover, it was reported that NADþ regulates cytokineproduction of peripheral blood lymphocytes and monocytes25,28.
These studies provided a strong rationale to investigate the roleof NADþ in CD4þ T cells and its impact on EAE. Here we showthat administration of NADþ protects against EAE and reversesdisease progression by regulating CD4þ T-cell differentiationand apoptosis through a novel signalling pathway and bypromoting myelin and axonal regeneration.
ResultsNADþ restores tissue integrity and induces homeostasis.Increasing evidence indicates that NADþ may play an active rolein protecting against EAE24,29. Consequently, we used the widelyutilized EAE mouse model that recapitulates human MS, to studythe impact of NADþ on EAE. Our results showed that onset ofclinical signs of EAE in mice injected with myelinolygodendrocyte glycoprotein (MOG) peptide occurred after 11days, and severe EAE was exhibited after 18 days with bilateralhindlimb paralysis (Fig. 1a and Supplementary Movie 1a and 1b).In contrast, mice treated daily with NADþ were protectedagainst EAE and exhibited no signs of paralysis (Fig. 1a andSupplementary Movie 1c). Moreover, NADþ -treated mice didnot develop EAE even after 25 days (Fig. 1a and SupplementaryMovie 1f), whereas non-treated mice exhibited severe symptoms(Fig. 1a and Supplementary Movie 1d). Furthermore, to assess theclinical efficacy of NADþ and its therapeutic potential, a groupof mice that had developed severe clinical symptoms of EAE (thatis, bilateral hindlimb paralysis) was subjected to daily NADþ
treatment starting 15 days after MOG immunization. As shownin Fig. 1a and Supplementary Movie 1e, daily treatment withNADþ starting 15 days after MOG immunization reversed theprogression of the disease when compared with the group of micethat had been treated with a placebo solution (Fig. 1a andSupplementary Movie 1d and e). Treatment with NADþ starting15 days after MOG immunization rapidly resolved (within 10days of treatment) the bilateral hindlimb paralysis, whereas amajority of the non-treated mice continued to exhibit bilateralhindlimb paralysis or weakness (Fig. 1a and SupplementaryMovie 1d and 1e). Taken together, these results indicate thatNADþ treatment is not only able to block EAE progression, but
Figure 1 | NADþ prevents demyelination and axon loss. (a) Behavioural scores of EAE in C57BL/6 mice treated at the day of MOG immunization daily
with intraperitoneal injection of 60 mg of NADþ or a placebo solution (PBS). An additional group of mice was treated with intraperitoneal injection of
60 mg of NADþ 15 days after MOG immunization (n¼ 8–11 per group). (b–i) Myelin and neurofilament (NF) assessment in spinal cord of: (b) mice
that were treated daily with a placebo solution (PBS), (c) mice that were treated daily with NADþ and (d) mice that were treated with NADþ 15 days after
MOG immunization (when mice developed hindlimb paralysis). (b–d) Paraffin sections were stained with luxol fast blue (LFB) to assess demyelination,
H&E for lymphocyte infiltration, myelin basic protein (MBP) to assess demyelination, NF 200 for axon loss and DAPI to label nuclei. Merged images of
MBP, NF and DAPI are also shown. The boxed regions in a–c for LFB and H&E staining have been magnified in d–f, respectively. The white stars in a–c for
MBP, NF, DAPI and merged images depict regions that are shown in higher magnification in d–f. Scale bars: a, 100mm (applies to b–d), d, 50mm (applies to
e–g). (h,i) Quantification of myelination and NF-positive areas showing a significant protection and recovery of (h) myelin and (i) NFs following daily
NADþ treatment and administration 15 days after MOG immunization. (j,k) Vimentin/Ki67 (j) and Vimentin/Musashi (k) co-labelling revealed increased
ependymal cell proliferation in NADþ -treated spinal cord when compared with PBS-treated spinal cord. Scale bars: (b), 100mm (applies to c,d); (e), 50mm
(applies to f,g); (j), 20mm (applies to k); n¼8–11; data derived from three independent experiments. Data represent mean±s.d. *Po0.05; **Po0.01;
***Po0.001, NS, not significant. Student’s t-test and Mann–Whitney U-test were used accordingly to compare between groups.
ARTICLE NATURE COMMUNICATIONS | DOI: 10.1038/ncomms6101
2 NATURE COMMUNICATIONS | 5:5101 | DOI: 10.1038/ncomms6101 | www.nature.com/naturecommunications
& 2014 Macmillan Publishers Limited. All rights reserved.

4.0
3.5
3.0
2.5
2.0
1.5
1.0
0.5
0.0
NAD+
NAD+
1,750,000
LFBPBS -treated
NAD+ -treated
PBS -treated
NAD+ -treated
Vimentin + Ki67
Vimentin + Musashi
Neurofilament
***
******
***
0
9,0008,0007,0006,0005,0004,0003,0002,0001,000
0
250,000500,000750,000
1,000,0001,250,0001,500,000
MOG
MOG + NAD+ at day 1 post-immunization
MOG + NAD+ at day 15 post-immunization
MOGMOG + NAD+
MOG + late NAD+
EA
E s
core
** ** ** ****
** **** ** **** **** ****
***
*
Days post-immunization
PBS -treated
LFB
H&E
MBP
NF
DAPI
Merged
H&E
MBP
NF
DAPI
Merged
H&E
MBP
NF
DAPI
Merged
H&E
MBP
NF
DAPI
Merged
H&E
MBP
NF
DAPI
Merged
H&E
MBP
NF
DAPI
Merged
* *
*
* *
* *
*
***
LFB LFB LFB LFB LFB
NAD+ -treated NAD+ late -treated PBS -treated NAD+ -treated NAD+ late-treated
0 1 2 3 4 5 6 7 8 9 10 11 12 13 14 15 16 17 18 19 20 21 22 23 24 25 26
Inte
grat
ed o
ptic
alde
nsity
(IO
D)
Inte
grat
ed o
ptic
alde
nsity
(IO
D)
NATURE COMMUNICATIONS | DOI: 10.1038/ncomms6101 ARTICLE
NATURE COMMUNICATIONS | 5:5101 | DOI: 10.1038/ncomms6101 | www.nature.com/naturecommunications 3
& 2014 Macmillan Publishers Limited. All rights reserved.

can also rapidly reverse it. Thus, we next investigated howNADþ treatment was able to arrest and reverse EAE progressionand assessed whether NADþ was able to reverse the clinicalsymptoms of EAE by protecting axons from degeneration andwhether NADþ had the capacity to promote myelinregeneration. Luxol fast blue (LFB) staining showed dramaticmyelin loss, and haematoxylin and eosin (H&E) staining revealedextensive inflammatory infiltrates of mononuclear cells in thespinal cords of mice treated with a placebo solution (Fig. 1b,e). Incontrast, the spinal cords of mice treated daily with NADþ
remained free of myelin loss and inflammatory infiltrates(Fig. 1c,f) in LFB and H&E staining. More importantly, thespinal cords of mice treated with NADþ starting 15 days afterMOG immunization (that is, treated after hindlimb paralysis) didnot show myelin loss and inflammatory infiltrate (Fig. 1d,g) inLFB and H&E staining. In addition, demyelination and axon losswere assessed with antibodies to myelin basic protein (MBP/SMI-9) and neurofilament (NF) 200, respectively, in all three groups(Fig. 1b–g). Consistent with H&E and LFB findings, a significantreduction in both MBP staining depicting demyelination andaxon loss evidenced by reduced NF 200 staining was veryprominent in the group of mice treated with a placebo solution(Fig. 1b,e) when compared with the daily NADþ -treated group(Fig. 1c,f) and with mice treated with NADþ after developinghindlimb paralysis (15 days after MOG immunization; Fig. 1d,g).Furthermore, areas and degree of demyelination and axon losswere quantified in mice treated with placebo solution and thegroup of mice treated with NADþ daily or 15 days after MOGimmunization (Fig. 1h,i). The results indicated a higher opticaldensity of LFB and NF immunofluorescence in the two groups ofNADþ -treated mice when compared with the control group(Fig. 1h,i). Of note, optical density of LFB immunostaining wasmore pronounced in the group of mice treated with NADþ dailywhen compared with the late-treated group; this was lesspronounced in the NF immunofluorescence (Fig. 1h,i). A recentstudy has shown that NADþ precursor Nam) plays an importantrole in governing stem cell pluripotency30. In the adult spinalcord, neural stem cells have been reported to reside close to thecentral canal—in the ependymal layer31,32, subependymally33 orin the white matter parenchyma34. In mice treated daily withNADþ , the ependymal cell population showed significant Ki67immunoreactivity indicating ependymal proliferation whencompared with mice treated with placebo solution (Fig. 1j).Ependymal cells were also strongly immunoreactive for neuralstem cell marker Musashi upon NADþ treatment whencompared with the respective control (Fig. 1k). Increased Ki67and Musashi labelling were also observed subependymally andin the outer white matter in NADþ -treated spinal cords(Supplementary Fig. 1). Collectively, these results indicate thatNADþ blocks EAE progression by protecting against myelinand axonal damage, and more importantly, that NADþ
reverses EAE progression by promoting myelin and axonalregeneration.
EAE is a well-established mouse model that mimics manyimportant features of MS in humans including the immuneresponse. It is well established that Th1 and Th17 CD4þ cellsplay a critical role in the pathogenesis of EAE, and thetranscription factor T-bet has been shown to play a critical rolein controlling Th1/Th17-mediated autoimmunity12. In contrast,Tregs and IL-10 have been shown to play a major role inprotection against and recovery from EAE35. Our resultsdemonstrate that NADþ acts on the central nervous system(CNS) by promoting myelin and axonal regeneration. However,its role on the immune response in EAE remains unknown. Thus,we next investigated whether NADþ treatment protected againstEAE by modifying the systemic immune response. Consistent
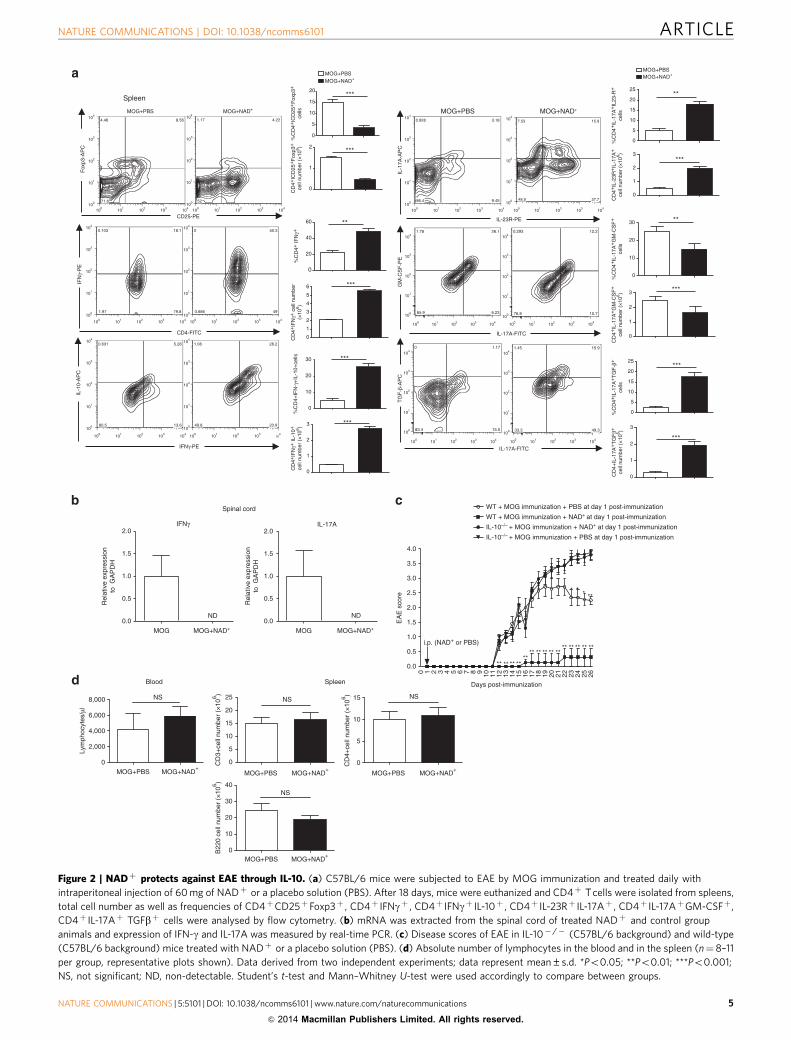
with a previous report27, we found that NADþ treatmentreduced the number of CD4þCD25þFoxp3þ cells (Fig. 2a).Furthermore, although mice treated with NADþ were resistantto EAE, we found that NADþ promoted a robust Th17 and Th1systemic response (Fig. 2a). These findings were unexpected asTh1 and Th17 cells are known to play a critical role in thedevelopment of EAE. However, increasing evidence indicates thatin the presence of TGF-b1, Th17 cells are non-pathogenic and ithas been shown that TGF-b1 inhibits T-bet expression, atranscription factor that regulates Th1/Th17-mediatedautoimmunity23,36. IL-10 has been shown to protect againstEAE and more importantly Th1 IFN-g-producing cells that co-express IL-10 have been reported to display immunosuppressiveproperties21,22,35,37. Thus, we further investigated Th1 and Th17responses associated with NADþ . Flow cytometry resultsindicated that NADþ treatment enhanced IL-10 and TGF-b byTh1 and Th17 cells, respectively (Fig. 2a and SupplementaryFig. 2). As control group, CD4þ T cells were isolated from naıvemice and treated with PMA/ionomycin. As shown inSupplementary Fig. 3, naıve CD4þ T cells did not have anycytokine increase. Furthermore, granulocyte–macrophage colony-stimulating factor (GM-CSF), TGF-b3 and IL-23 have beenshown to play a critical role in Th17 pathogenicity23,38,39. Ourresults indicated that NADþ treatment reduced GM-CSFexpression by CD4þ IL-17Aþ -producing cells, whereas IL-23Rexpression was increased when compared with the control group(Fig. 2a). However, ELISA results indicated that only TGF-b1 wasincreased systemically, no differences in GM-CSF, TGF-b3 andIL-23 were noted between the group of mice that was treated withNADþ treatment and the control group (Supplementary Fig. 4).Furthermore, to assess the level of inflammation in the spinalcord, IFN-g and IL-17A mRNA levels in the spinal cord werequantified by real-time PCR. In contrast to the control group, wecould not detect IFN-g or IL-17A mRNA in the spinal cord ofNADþ -treated mice (Fig. 2b). These findings suggest thatNADþ promotes homeostasis, despite the reduced frequency ofCD4þCD25þFoxp3þ Tregs, by promoting immunosuppressiveTh1 and Th17 cells. Therefore, we next sought to test whetherNADþ protective properties were mediated in part via IL-10production. Consistent with a previous report35, our resultsindicated that IL-10� /� mice were very susceptible to EAE whencompared with their wild-type (WT) counterparts (Fig. 2c).Interestingly, NADþ did not confer protection against EAE toMOG-immunized IL-10� /� mice (Fig. 2c). Of note, NADþ
treatment of mice did not affect the absolute number ofcirculating lymphocytes in the blood or spleen (Fig. 2d). Takentogether, our results suggest that NADþ treatment alters thesystemic immune response associated with EAE and induceshomeostasis by inducing IL-10 and TGF-b1 production by Th1and Th17 cells, respectively.
NADþ regulates CD4þ T-cell apoptosis and differentiation.Although NADþ has been previously shown to regulate T-celldeath and cytokine production27,28,40–42, its role in T-celldifferentiation remains unknown. Our in vivo findings indicatethat NADþ alters the systemic immune response in EAE.Therefore, we next sought to dissect the effect of NADþ onCD4þ T-cell death and differentiation in vitro under Th0, Th1,Th2, Th17 and induced regulatory T cells (iTreg) polarizingconditions. To assess the role of NADþ on CD4þ T-celldeath, naıve CD4þ T cells were isolated from spleens of 5C.C7Rag2� /� mice, and cultured under Th0, Th1, Th2, Th17 oriTreg polarizing conditions and in the presence of increasingconcentrations of NADþ . After 4 days of culture, the toxicity ofNADþ was assessed by quantification of apoptotic cells using
ARTICLE NATURE COMMUNICATIONS | DOI: 10.1038/ncomms6101
4 NATURE COMMUNICATIONS | 5:5101 | DOI: 10.1038/ncomms6101 | www.nature.com/naturecommunications
& 2014 Macmillan Publishers Limited. All rights reserved.
0 1 2 3 4 5 6 7 8 9 10 11 12 13 14 15 16 17 18 19 20 21 22 23 24 25 26
0.0
0.5
1.0
1.5
2.0
2.5
3.0
3.5
4.0
WT + MOG immunization + PBS at day 1 post-immunization
IL-10–/– + MOG immunization + NAD+ at day 1 post-immunization
WT + MOG immunization + NAD+ at day 1 post-immunization
**
** **** **
** ** ** **** ** ** ** **
**
*
**
** *
IL-10–/– + MOG immunization + PBS at day 1 post-immunization
i.p. (NAD+ or PBS)
Days post-immunization
EA
E s
core
0
10
20
30
40
B22
0 ce
ll nu
mbe
r (×
106 )
0
2,000
4,000
6,000
8,000
Lym
phoc
ytes
/μl
0
5
10
15
20
25
CD
3+ce
ll nu
mbe
r (×
106 )
0
5
10
15
CD
4+ce
ll nu
mbe
r (×
106 )
SpleenBlood
MOG+PBS MOG+NAD+
MOG+PBS MOG+NAD+
MOG+PBS MOG+NAD+
MOG+PBS MOG+NAD+
FL4
-H: F
oxp3
AP
C
1.17 4.22
52
FL2
-H: I
FN
g P
E
0 50.3
490.686
FL4
-H: I
L-10
AP
C
1.08 28.2
20.949.8
104
104
103
103
102
102
101
101100
104
103
102
101
100
104
103
102
101
100
104
103
102
101
100
104
103
102
101
100
104
103
102
101
100
100
104103102101100 104103102101100
104103102101100104103102101100
104103102101100
4.46 8.56
71.6
0.103 18.1
79.81.97
0.631 5.28
13.680.5
Fox
p3-A
PC
IF
Nγ-
PE
IFNγ-PE
IL-1
0-A
PC
CD25-PE
CD4-FITC
MOG+PBS MOG+NAD+
Spleen
AP
C-A
1.45 15.9
49.333.3
0 1.17
15.583.4
0.928 3.18
9.4586.4
7.53 15.9
27.748.9
TG
F-β
-AP
C
PE
-A
0.293 12.2
10.776.8
104
103
102
101
100
104
103
102
101
100
104
103
102
101
100
104
103
102
101
100
104
103
102
101
100
104
103
102
101
100
104103102101100
104103102101100 104103102101100
104103102101100104103102101100
104103102101100
1.78 26.1
6.2365.9
IL-1
7A-A
PC
IL-23R-PE
GM
-CS
F-P
E
MOG+PBS MOG+NAD+
IL-17A-FITC
IL-17A-FITC
Spinal cord
0.0
0.5
1.0
1.5
2.0
Rel
ativ
e ex
pres
sion
to G
AP
DH
0.0
0.5
1.0
1.5
2.0
Rel
ativ
e ex
pres
sion
to G
AP
DH
MOG+NAD+MOG
ND ND
MOG+NAD+MOG
IFNγ IL-17A
NSNSNS
NS
0
0
1
2
3
4
5
6
20
40
60
%C
D4+
IFN
γ+
0
10
3
2
1
0
20
30
%C
D4+
IFN
-γ+
IL-1
0+ce
lls
0
2
1
0
5
10
15
20
%C
D4+
ICD
25+
Fox
p3+
cells
CD
4+IC
D25
+F
oxp3
+
cell
num
ber
(×10
6 )C
D4+
IFN
γ+ c
ell n
umbe
r(×
106 )
CD
4+IF
Nγ+
IL-1
0+
cell
num
ber
(×10
6 )
MOG+NAD+MOG+PBS
***
***
**
***
***
***
0
10
20
30
0
10
5
20
15
0
2
1
3
0
2
1
3
10
5
0
20
15
25
0
2
1
3
25
%C
D4+
IL-1
7A+
IL23
-R+
cells
CD
4+IL
-23R
+IL
-17A
+
cell
num
ber
(×10
6 )
MOG+NAD+MOG+PBS
***
**
**
***
***
***
%C
D4+
IL-1
7A+
GM
-CS
F+
cells
CD
4+IL
-17A
+G
M-C
SF
+
cell
num
ber
(×10
6 )%
CD
4+IL
-17A
+T
GF
-β+
cells
CD
4+IL
-17A
+T
GF
β+ce
ll nu
mbe
r (×
106 )
Figure 2 | NADþ protects against EAE through IL-10. (a) C57BL/6 mice were subjected to EAE by MOG immunization and treated daily with
intraperitoneal injection of 60 mg of NADþ or a placebo solution (PBS). After 18 days, mice were euthanized and CD4þ T cells were isolated from spleens,
total cell number as well as frequencies of CD4þCD25þFoxp3þ , CD4þ IFNgþ , CD4þ IFNgþ IL-10þ , CD4þ IL-23Rþ IL-17Aþ , CD4þ IL-17AþGM-CSFþ,
CD4þ IL-17Aþ TGFbþ cells were analysed by flow cytometry. (b) mRNA was extracted from the spinal cord of treated NADþ and control group
animals and expression of IFN-g and IL-17A was measured by real-time PCR. (c) Disease scores of EAE in IL-10� /� (C57BL/6 background) and wild-type
(C57BL/6 background) mice treated with NADþ or a placebo solution (PBS). (d) Absolute number of lymphocytes in the blood and in the spleen (n¼8–11
per group, representative plots shown). Data derived from two independent experiments; data represent mean±s.d. *Po0.05; **Po0.01; ***Po0.001;
NS, not significant; ND, non-detectable. Student’s t-test and Mann–Whitney U-test were used accordingly to compare between groups.
NATURE COMMUNICATIONS | DOI: 10.1038/ncomms6101 ARTICLE
NATURE COMMUNICATIONS | 5:5101 | DOI: 10.1038/ncomms6101 | www.nature.com/naturecommunications 5
& 2014 Macmillan Publishers Limited. All rights reserved.

0 μM NAD+ (PBS) 50 μM NAD+ 250 μM NAD+5 μM NAD+CD3/CD28 (no IL-2)
Caspases-FITC
Cel
l num
ber
Th0
Th1
Th2
Th17
iTreg
Th0
Th1
Th2
Th17
iTreg
Th0
Th1
Th2
Th17
iTreg
Th0
Th1
Th2
Th17
iTreg
Non-polarizingconditions Polarizing conditions
CD3/CD28
0 5 50 2500
5
10
15
20
25Th0
*** ***
% C
aspa
ses
CD3/CD28
0 5 50 2500
10
20
30
40Th1
***
**
CD3/CD28
0 5 50 2500
5
10
15
20
25Th2 Th17 iTreg
***
**
CD3/CD28
0 5 50 2500
5
10
15
20
25***
NS
CD3/CD28
0 5 50 2500
5
10
15
20
25***
**
NAD+ μM NAD+ μM NAD+ μM NAD+ μM NAD+ μM
+ rlL-2 (50 ng ml–1)
200300
200
100
0
150
10076.94%
68.86%
76.85%
31.14%
23.15%
77.92%
80.04
19.93
22.0894.72%
96.25 97.98 97.27%
2.71%2.013.74
5.28
22.92%
88.26%
87%
87.40%
12.60%
13%
11.58%
50
0
200
150
100
50
0
95.97%
97.21%
2.79%
78.30%
21.30%
4.03%
800
600
400
200
0
99.47%0.53%
700
600
500
400
300
200
100
0
600
500
400
300
400
100
0
400
300
100
0
200
400
300
200
100
0
77.21% 80.70%
96.17%
3.83%
95.40%
4.60%
0.37%
97.87%
2.12%
18.90%22.40%
200
150
100
50
0
200
150
100
50
0
93.81%
94.56%
98.99 99.63%1.01
5.44%
6.19%
400
300
200
100
0
800
600
400
200
0
2,500
2,000
1,500
1,000
500
0
10–1 100 101 102 103 10–1 100 101 102 103 10–1 100 101 102 10310–1 100 101 102 103 10–1 100 101 102 103
10–1 100 101 102 103 10–1 100 101 102 103 10–1 100 101 102 103
10–1 100 101 102 103 10–1 100 101 102 103
10–1 100 101 102 103
10–1 100 101 102 103 10–1 100 101 102 103
10–1 100 101 102 103 10–1 100 101 102 103 10–1 100 101 102 103
10–1 100 101 102 10310–1 100 101 102 103 10–1 100 101 102 103
10–1 100 101 102 103
10–1 100 101 102 103
10–1 100 101 102 103
10–1 100 101 102 103
10–1 100 101 102 103
10–1 100 101 102 103
300
200
100
0
300
200
100
0
200
250
150
100
50
0
200
250
0
100
80
60
40
20
3,000
2,500
2,000
1,500
1,000
500
0
1400
1,000
800
600
400
200
0
2000
1500
1000
500
0
1200
1000
800
600
400
200
0
500
1,000
1,500
2,000
0
400
350
300
250
200
150
100
50
0
150
100
50
0
150
100
50
0
Figure 3 | NADþ prevents differentiating CD4þ T cell from apoptosis. Sorted naıve CD4þ T cells were isolated from spleens of 5C.C7 Rag2� /� mice
(C57BL/6 background) and activated with a-CD3/a-CD28 antibodies only or in Th0 (recombinant IL-2 cytokine at a concentration of 50 ng ml� 1),
Th1, Th2, Th17 or iTreg-polarizing conditions. Cells that were cultured in Th0, Th1, Th2, Th17 and iTreg polarizing conditions were stimulated with increasing
concentrations of NADþ (0, 5, 50 and 250 mM). After 96 h, percentage of apoptotic cells was assessed by flow cytometry by caspase activity
measurements (n¼ 15; data derived from three independent experiments). Data represent mean±s.d. NS; not significant; **Po0.01; ***Po0.001 as
determined by Student’s t-test, comparing the indicated groups.
ARTICLE NATURE COMMUNICATIONS | DOI: 10.1038/ncomms6101
6 NATURE COMMUNICATIONS | 5:5101 | DOI: 10.1038/ncomms6101 | www.nature.com/naturecommunications
& 2014 Macmillan Publishers Limited. All rights reserved.
fluorochrome-labelled inhibitors of caspases (FLICA) method43.Our results show that treatment with NADþ of naıve CD4þ
T cells in Th0 conditions resulted in a significant increase inapoptosis when compared with cells that were treated with acontrol solution (PBS; Fig. 3). These findings were consistent witha previous study that showed increased cell death of naıve CD4þ
T cells in mice treated with NADþ (ref. 26). In contrast, CD4þ
T cells that were differentiated into Th1, Th2, Th17 and iTregwere protected by NADþ against apoptosis, unlike cells that werestimulated with a-CD3/a-CD28 antibodies alone or incubatedunder Th0 polarizing conditions, consistent with a previous studyshowing that effector/memory T cells were more resistant to celldeath in vivo26 (Fig. 3).
Furthermore, to determine the role of NADþ on CD4þ T-celldifferentiation, cytokine profiles of 5C.C7 Rag2� /� naıve CD4þ
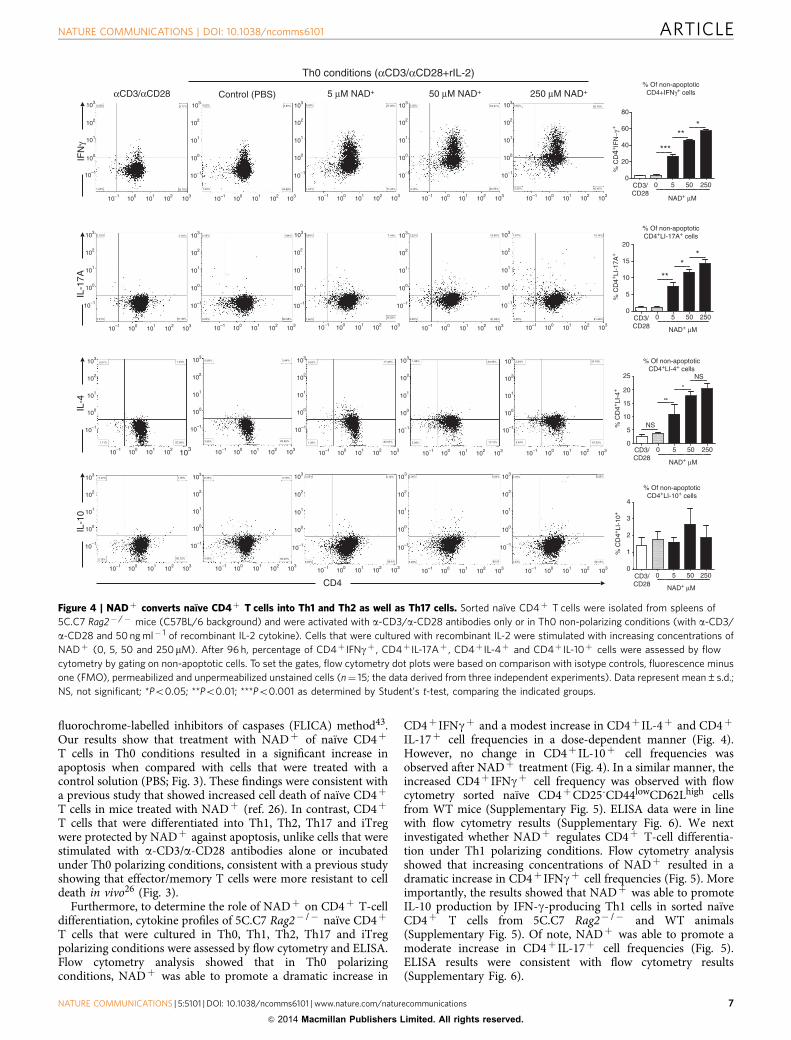
T cells that were cultured in Th0, Th1, Th2, Th17 and iTregpolarizing conditions were assessed by flow cytometry and ELISA.Flow cytometry analysis showed that in Th0 polarizingconditions, NADþ was able to promote a dramatic increase in
CD4þ IFNgþ and a modest increase in CD4þ IL-4þ and CD4þ
IL-17þ cell frequencies in a dose-dependent manner (Fig. 4).However, no change in CD4þ IL-10þ cell frequencies wasobserved after NADþ treatment (Fig. 4). In a similar manner, theincreased CD4þ IFNgþ cell frequency was observed with flowcytometry sorted naıve CD4þCD25-CD44lowCD62Lhigh cellsfrom WT mice (Supplementary Fig. 5). ELISA data were in linewith flow cytometry results (Supplementary Fig. 6). We nextinvestigated whether NADþ regulates CD4þ T-cell differentia-tion under Th1 polarizing conditions. Flow cytometry analysisshowed that increasing concentrations of NADþ resulted in adramatic increase in CD4þ IFNgþ cell frequencies (Fig. 5). Moreimportantly, the results showed that NADþ was able to promoteIL-10 production by IFN-g-producing Th1 cells in sorted naıveCD4þ T cells from 5C.C7 Rag2� /� and WT animals(Supplementary Fig. 5). Of note, NADþ was able to promote amoderate increase in CD4þ IL-17þ cell frequencies (Fig. 5).ELISA results were consistent with flow cytometry results(Supplementary Fig. 6).
Th0 conditions (αCD3/αCD28+rIL-2)
Control (PBS) 50 μM NAD+ 250 μM NAD+5 μM NAD+αCD3/αCD28
CD4
IFN
γIL
-4IL
-17A
IL-1
0
CD3/CD28
0 5 50 2500
20
40
60
80
***
***
% C
D4+
IFN
−γ+
% C
D4+
LI-1
7A+
% C
D4+
LI-4
+%
CD
4+LI-
10
+
0
5
10
15
20
***
*
0
1
2
3
4
0
5
10
15
20
25
**
*
NS
NS
NAD+ μM
% Of non-apoptoticCD4+IFNγ+ cells
% Of non-apoptoticCD4+LI-17A+ cells
% Of non-apoptoticCD4+LI-4+ cells
% Of non-apoptoticCD4+LI-10+ cells
1030.08% 0.02% 3.80% 0.04% 27.05% 0.39% 45.91%
71.24%1.67%
3.17%
1.00% 95.75% 1.30% 94.88%
103
102
102
101
101
100
10–1
103
102
101
100
10–1
103
102
101
100
10–1
10–1 100
103102101
103
102
101
100
10–1
103
102
101
100
10–1
10–1 100 10310210110–1 100
103
102
101
100
10–1
10310210110–1 100
103
102
101
100
10–1
10310210110–1 100
103
102
101
100
10–1
10310210110–1 100
10310210110–1 100 10310210110–1 100
103
102
101
100
10–1
10310210110–1 100
103
102
101
100
10–1
10310210110–1 100
50.55% 3.20% 40.45%3.16%
0.60% 55.76%
0.12% 0.18% 1.84% 0.84% 7.44% 1.22% 1.91% 13.14%13.60%
90.52%3.29% 81.89% 3.46% 81.48%94.98%3.00% 1.56%
1.91%
0.61% 97.36%
103
102
101
100
10–1
103
102
101
100
10–1
10310210110–1 100 10310210110–1 100
103
102
101
100
10–1
10310210110–1 100
103
102
101
100
10–1
10310210110–1 100
103
102
101
100
10–1
10310210110–1 100
0.07%0.58% 2.44%
0.62% 17.46% 1.85% 2.64% 24.18%20.95%
80.54% 5.09% 72.12% 5.64% 67.53%93.62%3.35% 1.39%
1.24%
1.71% 97.36%
103
102
101
100
10–1
103
102
101
100
10–1
10310210110–1 100 10310210110–1 100
103
102
101
100
10–1
10310210110–1 100
103
102
101
100
10–1
10310210110–1 100
103
102
101
100
10–1
10310210110–1 100
0.07% 0.36% 2.79% 0.05% 2.12% 0.36% 0.16% 3.29%4.63%
94.61 5.48% 89.52 4.43% 92.12%92.49%4.36%
3.22%
1.06%
2.15% 96.72%
CD3/CD28
0 5 50 250
NAD+ μM
CD3/CD28
0 5 50 250
NAD+ μM
CD3/CD28
0 5 50 250
NAD+ μM
Figure 4 | NADþ converts naıve CD4þ T cells into Th1 and Th2 as well as Th17 cells. Sorted naıve CD4þ T cells were isolated from spleens of
5C.C7 Rag2� /� mice (C57BL/6 background) and were activated with a-CD3/a-CD28 antibodies only or in Th0 non-polarizing conditions (with a-CD3/
a-CD28 and 50 ng ml� 1 of recombinant IL-2 cytokine). Cells that were cultured with recombinant IL-2 were stimulated with increasing concentrations of
NADþ (0, 5, 50 and 250mM). After 96 h, percentage of CD4þ IFNgþ , CD4þ IL-17Aþ , CD4þ IL-4þ and CD4þ IL-10þ cells were assessed by flow
cytometry by gating on non-apoptotic cells. To set the gates, flow cytometry dot plots were based on comparison with isotype controls, fluorescence minus
one (FMO), permeabilized and unpermeabilized unstained cells (n¼ 15; the data derived from three independent experiments). Data represent mean±s.d.;
NS, not significant; *Po0.05; **Po0.01; ***Po0.001 as determined by Student’s t-test, comparing the indicated groups.
NATURE COMMUNICATIONS | DOI: 10.1038/ncomms6101 ARTICLE
NATURE COMMUNICATIONS | 5:5101 | DOI: 10.1038/ncomms6101 | www.nature.com/naturecommunications 7
& 2014 Macmillan Publishers Limited. All rights reserved.

Under Th2 polarizing conditions, cultured naıve CD4þ T cellsfrom 5C.C7 Rag2� /� mice in the presence of NADþ resulted ina strong increase in CD4þ IL-4þ IL-10þ and a modest increasein CD4þ IL-4þ IL-17Aþ cell frequency (Fig. 6), consistent withIL-10 and IL-17A secretion levels (Supplementary Fig. 6). Ofnote, increased cell frequency of CD4þ IL-4þ IL-10þ wasobserved with naıve WT CD4þ cells as well (SupplementaryFig. 5). Under Th17 polarizing conditions, addition of NADþ didnot alter T-cell differentiation (Supplementary Fig. 7) andcytokine production levels (Supplementary Fig. 6). In contrast,under iTreg polarizing conditions, fluorescence-activated cellsorting analysis revealed a robust increase in the frequency ofCD4þTGFbþ IL-17Aþ in naıve CD4þ T cells from both 5C.C7Rag2� /� (Supplementary Fig. 8) and WT mice (Supplementary
Fig. 5). However, we found no changes in the frequency ofCD4þ IL-10þ IL-17Aþ cells. ELISA findings were consistentwith flow cytometry (Supplementary Fig. 6).
Although our data indicate that NADþ plays an importantrole in naıve CD4þ T-cell differentiation/apoptosis, it is howeverunclear how NADþ can protect against EAE 15 days after MOGimmunization when CD4þ T cells have already polarized into aspecific Th phenotype. Thus, we next investigated the impact ofNADþ on differentiated CD4þ T cells. Naıve CD4þCD25�
CD44lowCD62Lhigh T cells were cultured (0.5� 106 cells) in Th1or Th2 polarizing conditions. After 1 week, polarized Th1 andTh2 CD4þ T cells were incubated in the presence of NADþ
during 72 h, rested and re-incubated in Th1 or Th2 polarizingconditions (Fig. 7a,b). Cell number counts indicated that after
5CD3/CD28 25050
*Control (PBS) 5 μM NAD+αCD3/αCD282.49%
103
103
102
102
101
101
100
100
10–1
103
102
101
100
10–2
10–1
10–1
10310210110010–1
103
102
101
100
10–2
10–1
10310210110010–1
103
102
101
100
10–2
10–1
10310210110010–1
103
102
101
100
10–2
10–1
10310210110010–1
103
102
101
100
10–2
10–1
10310210110010–1
103
103
102
102
101
101
100
100
10–1
10–1
103
103
102
102
101
101
100
100
10–1
10–1
103
103
102
102
101
101
100
100
10–1
103
102
101
100
10–1
10–1 10310210110010–1
93.22% 4.04% 54.51% 41.92% 18.82% 68.26% 17.74% 65.48% 10.41% 70.31%
19.08%0.20%16.52%0.27%12.17%0.75%2.22%1.36%0.26%
Th1 conditions (αCD3/αCD28+αIL-4+rIL12+rIL-2)
50 μM NAD+ 250 μM NAD+
5 250500 0
CD3/CD28 0 0
**
% C
D4+
IL-1
0+
% C
D4+
IFN
-γ+
IL-1
7A
IFNγ
IL-1
0% Of non-apoptotic
CD4+IL-10+ cells% Of non-apoptotic
CD4+IFNγ + cells
6.12%93.72%
0.06% 0.10%
20.26%76.36%
0.88% 2.49%
77.39%13.89%
0.94% 7.78%
77.41%9.50%
1.40% 11.70% 14.06%
80.57%4.95%
0.42%
30
20
10
80
60
40
20
***
***
*****
NAD+ μM
% C
D4+
IL-1
7A+
0CD3/CD28 5 50 2500
5
10
15 ***
NS
% Of non-apoptoticCD4+IL-17A+ cells
NAD+ μM
NAD+ μM
Figure 5 | NADþ promotes IL-10 under Th1 conditions. Sorted naıve CD4þ T cells were isolated from spleens of 5C.C7 Rag2� /� mice (C57BL/6
background) and were activated with a-CD3/a-CD28 antibodies only or in Th1 polarizing conditions (with a-CD3/a-CD28, 20 ng ml� 1 of recombinant
IL-12, 50 ng ml� 1 of recombinant IL-2 cytokine and 10mg ml� 1 of anti-IL-4). Cells in Th1 polarizing conditions were cultured in the presence of increasing
concentrations of NADþ . After 96 h, percentage of CD4þ IFNgþ IL-10þ and CD4þ IFNgþ IL-17Aþ cells was measured by flow cytometry by gating on
non-apoptotic CD4þ cells. To set the gates, flow cytometry dot plots were based on comparison with isotype controls, fluorescence minus one (FMO),
permeabilized and unpermeabilized unstained cells (n¼ 15; the data derived from three independent experiments). Data represent mean±s.d. NS, not
significant *Po0.05; **Po0.01; ***Po0.001 as determined by Student’s t-test, comparing the indicated groups.
CD3/CD28 0 5
NAD+ μM
250500
50
% Of non-apoptoticCD4+ IL-4+IL-10+ cells
% Of non-apoptoticCD4+ IL4+IL-17A+ cells
40302010
**
***
**
*
CD3/CD28 0 5
NAD+ μM
25050
% IL
-4+IL
-10+
IL-17A
IL-10
IL-4
Control (PBS) 5 μM NAD+ 50 μM NAD+ 250 μM NAD+αCD3/αCD28103
103
102
102
101
101
100
100
10–1
10–1
10–2
10–3
103
102
101
100
10–1
10–2
10–3
10–3
10–2
10–1
100
101
103
102
103
103
102
102
101
101
100
100
10–1
10–1
10–2
10–3
103
102
101
100
10–1
10–2
10–3
10–3
10–2
10–1
100
101
103
102
103
103
102
102
101
101
100
100
10–1
10–1
10–2
10–3
103
102
101
100
10–1
10–2
10–3
10–3
10–2
10–1
100
101
103
102
103
103
102
102
101
101
100
100
10–1
10–1
10–2
10–3
103
102
101
100
10–1
10–2
10–3
10–3
10–2
10–1
100
101
103
102
103
103
102
102
101
101
100
100
10–1
10–1
10–2
10–3
103
102
101
100
10–1
10–2
10–3
10–3
10–2
10–1
100
101
103
102
0
1
2
3
4
5
*
**
% IL
-10+
IL-1
7A+
Th2 conditions (αCD3/αCD28+αIFNγ+αIL-12+rIL-4+rIL-2)
1.47% 0.14% 19.57% 0.42% 37.44% 13.46% 41.65% 18.0%
4.54%35.80%5.51%43.58%0.75%79.27%0.50%97.89%
2.17% 0.10%31.81% 8.85% 26.71% 19.55% 19.9% 39.73% 28.55% 45.10%
16.88%9.48%27.95%12.42%25.65%28.09%16.34%43.00%2.68%95.05%
33.22% 7.31%
3.86%55.61%
Figure 6 | NADþ promotes IL-10 and IL-17A in Th2 polarizing conditions. Sorted naıve CD4þ T cells were isolated from spleens of 5C.C7 Rag2� /�
mice (C57BL/6 background) and were activated with a-CD3/a-CD28 antibodies only or in Th2 polarizing conditions (with a-CD3/a-CD28, 20 ng ml� 1 of
recombinant IL-4, 50 ng ml� 1 of recombinant IL-2, 10mg ml� 1 of anti-IL-12 and anti-IFN-g antibodies). Cells in Th2 polarizing conditions were cultured in
the presence of increasing concentrations of NADþ . After 96 h, percentage of CD4þ IL-4þ IL-10þ and CD4þ IL-4þ IL-17Aþ cells was measured by flow
cytometry by gating on non-apoptotic CD4þ cells. To set the gates, flow cytometry dot plots were based on comparison with isotype controls,
fluorescence minus one (FMO), permeabilized and unpermeabilized unstained cells (n¼ 15; the data derived from three independent experiments).
Data represent mean±s.d. NS, not significant. *Po0.05; **Po0.01; ***Po0.001 as determined by Student’s t-test, comparing the indicated groups.
ARTICLE NATURE COMMUNICATIONS | DOI: 10.1038/ncomms6101
8 NATURE COMMUNICATIONS | 5:5101 | DOI: 10.1038/ncomms6101 | www.nature.com/naturecommunications
& 2014 Macmillan Publishers Limited. All rights reserved.
IL-4-PE
0
0
1
2
3
4
0
1
2
3
4
20
40
60
80
100
0
20
40
60
80
100
Th2
020406080
100
Th1***
***
**
0 42.4
57.60
0 13.8
86.20
0 86.3
13.70
0
0
105
104
103
102
102 103 104 105 0 102 103 104 105 0 102 103 104 105 0 102 103 104 105
0 102 103 104 105 0 102 103 104 105 0 102 103 104 105 0 102 103 104 105
0 4.99
950
22.8 0.156
0.051977
0.71 1.36
10.887.1
9.69 89.5
00.773
102
103
104
105
0
0.254 0.681
0.37498.7
IL-1
0-A
PC
CD4-PECy7
Th2
** ** ***
* * **
* *** ***
*** ***
**
**
*** **
*** ****
*** *** **
αCD3+αCD28
Th2 1
st sti
mula
tion
Th2 fo
llowed
by N
AD+
Th2 2d st
imula
tion
αCD3+αCD28
Th2 1
st sti
mula
tion
Th2 fo
llowed
by N
AD+
Th2 2d st
imula
tion
αCD3+αCD28
Th2 1
st sti
mula
tion
Th2 fo
llowed
by N
AD+
Th2 2d st
imula
tion
αCD3+αCD28
Th2 1
st sti
mula
tion
Th2 fo
llowed
by N
AD+
Th2 2d st
imula
tion
αCD3+αCD28
Th2 1
st sti
mula
tion
Th2 fo
llowed
by N
AD+
Th2 2d st
imula
tion
αCD3+αCD28
Th2 1
st sti
mula
tion
Th2 fo
llowed
by N
AD+
Th2 2d st
imula
tion
10
8
6
4
2
0
1086420
IFN
γ-eF
450
αCD3+αCD28 Th1 1st stimulation Th1 followed by NAD+ Th1 2d stimulation
αCD3+αCD28 Th2 1st stimulation Th2 followed by NAD+ Th2 2d stimulation
%C
D4+
IL-4
+ ce
lls
%C
D4+
IL-1
0+ c
ells
%C
D4+
IL-4
+ c
ell
num
ber
(×10
4 )
0
1
2
3
4
%C
D4+
IL-1
0+
cell
num
ber
(×10
6 )
Tot
al c
ell
num
ber
(×10
6 )
%C
D4+
IFN
γ+ ce
lls
%C
D4+
IFN
γ+
cell
num
ber
(×10
6 )
Tot
al c
ell n
umbe
r (×
106 )
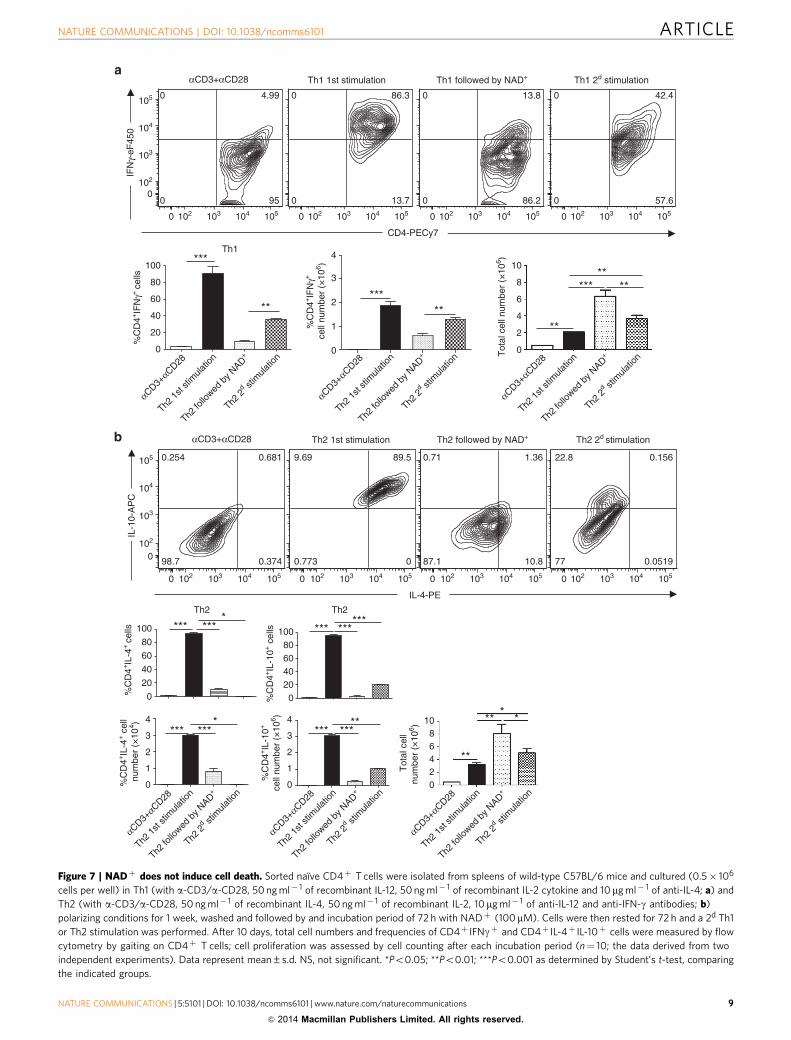
Figure 7 | NADþ does not induce cell death. Sorted naıve CD4þ T cells were isolated from spleens of wild-type C57BL/6 mice and cultured (0.5� 106
cells per well) in Th1 (with a-CD3/a-CD28, 50 ng ml� 1 of recombinant IL-12, 50 ng ml� 1 of recombinant IL-2 cytokine and 10 mg ml� 1 of anti-IL-4; a) and
Th2 (with a-CD3/a-CD28, 50 ng ml� 1 of recombinant IL-4, 50 ng ml� 1 of recombinant IL-2, 10mg ml� 1 of anti-IL-12 and anti-IFN-g antibodies; b)
polarizing conditions for 1 week, washed and followed by and incubation period of 72 h with NADþ (100mM). Cells were then rested for 72 h and a 2d Th1
or Th2 stimulation was performed. After 10 days, total cell numbers and frequencies of CD4þ IFNgþ and CD4þ IL-4þ IL-10þ cells were measured by flow
cytometry by gaiting on CD4þ T cells; cell proliferation was assessed by cell counting after each incubation period (n¼ 10; the data derived from two
independent experiments). Data represent mean±s.d. NS, not significant. *Po0.05; **Po0.01; ***Po0.001 as determined by Student’s t-test, comparing
the indicated groups.
NATURE COMMUNICATIONS | DOI: 10.1038/ncomms6101 ARTICLE
NATURE COMMUNICATIONS | 5:5101 | DOI: 10.1038/ncomms6101 | www.nature.com/naturecommunications 9
& 2014 Macmillan Publishers Limited. All rights reserved.

1 week naıve CD4þ T cells proliferated from 0.5� 106 to 2� 106
and 3.5� 106 cells in Th1 and Th2 polarizing conditions,respectively (Fig. 7a,b). More importantly, when incubated inthe presence of NADþ for only 72 h, Th1 and Th2 polarized cellsproliferated dramatically and the number of Th1 (2� 106 cells)and Th2 (3.5� 106 cells) CD4þ cells increased significantly(46� 106 for Th1 cells and 48� 106 for Th2 cells). AlthoughNADþ promoted Th1 and Th2 cell proliferation, flow cytometryanalysis (Fig. 7a,b) indicated that NADþ reduced dramaticallyTh1 (IFN-g) and Th2 (IL-4 and IL-10) cytokine expression levelsas shown by frequency and total number of cells. To furtherassess how NADþ altered CD4þ T-cell differentiation, Th1 andTh2 cultured in the presence of NADþ were rested in media for72 h and re-stimulated in Th1 or Th2 polarizing conditions. After10 days of culture, only 35% of CD4þ T cells were able toproduce IFN-g after Th1 re-stimulation (Fig. 7a). Similarly, uponTh2 re-stimulation only 20% of CD4þ T cells were able toproduce IL-10. More importantly, CD4þ T cells were not able toproduce IL-4 even 10 days after Th2 re-stimulation (Fig. 7b). Ofnote, after only 1 week and in similar Th1 or Th2 polarizingconditions, more than 90% of CD4þ T cells were IFNgþ orIL4þ IL10þ , respectively. Collectively, these results demonstratethat NADþ alters CD4þ T-cell apoptosis/proliferation anddifferentiation in polarized CD4þ T cells and suggest thatNADþ may reverse the diseases progression by alteringdifferentiated CD4þ T cells. Moreover, the fact that NADþ
induces a robust cytokine production in naıve CD4þ T cells butblocks cytokine production in differentiated cells suggests thatNADþ regulates CD4þ T-cell differentiation through analternative pathway that is distinct from the classical cytokinepathway4,16,44–47.
NADþ signals and protects against EAE via Tph1. Our findingsclearly demonstrate that NADþ is able to alter CD4þ T-celldifferentiation in vitro and in vivo. More importantly, in vitroresults indicated that NADþ is able to override Th1, Th2 andiTreg, but not Th17 polarizing conditions. Therefore, we soughtto profile NADþ -induced perturbations in gene expressionprofile of Th0, Th1, Th2 and iTreg polarized cells. Althoughincreasing concentrations of NADþ promoted IFN-g-producingcells in a dose-dependent manner in Th0 and Th1 polarizingconditions, the results indicated that gene expression of T-bet, themaster regulator of Th1 development44,47, was reduced(Supplementary Fig. 9). Of note, no changes in the expressionlevel of master regulators of Th2 (GATA3, STAT5a, STAT6) orTh17 (RORgt) were observed under Th0 polarizing conditions(Supplementary Fig. 9). Furthermore, a dramatic decrease(410-fold) in expression of GATA3, a transcription factor thatregulates Th2 cell differentiation, occurred under Th2 polarizingconditions. More importantly, in the presence of NADþ , Foxp3,the master regulator of Tregs development was not detectedunder iTreg polarizing conditions (Supplementary Fig. 9).Collectively, these findings suggest that NADþ inhibits theexpression of well-established master regulators of CD4þ T-celldevelopment and may induce CD4þ T-cell differentiationthrough an alternative, unconventional pathway. Therefore, toidentify potential molecules involved in NADþ -mediated CD4þ
T-cell regulation, genome-wide gene expression profiles wereassessed by microarray analysis. Interestingly, Tph1, a geneencoding for an enzyme that is mostly described as a mast cellproduct48, was found among the top 20 upregulated genes in Th0,Th1, Th2 and iTreg-polarized cells (Supplementary Fig. 10a).Tph1 upregulation was confirmed by real-time PCR in naıveCD4þ T cells isolated from both, WT and 5C.C7 Rag2� /� mice(Supplementary Fig. 10b). Similar to naıve CD4þ T cells thatwere cultured under Th0, Th1, Th2 and iTreg polarizing
conditions with NADþ , polarized Th1 and Th2 CD4þ T cellshad a decreased mRNA levels of T-bet and GATA3, whereas Tph1was dramatically increased (Supplementary Fig. 11). AlthoughRORgt expression was reduced in Th17 polarizing conditions inthe presence of 50 and 250mM of NADþ , the decrease wassignificant only for the latter concentration (SupplementaryFig. 9). Furthermore, Ingenuity Pathway Analysis predictedsignificant perturbations by NADþ of other pathwaysinvolved in T-cell differentiation, IL-17 and IL-10 signalling(Supplementary Table 1).
Because Tph1 has recently been reported to prevent allograftrejection and EAE48, we interrogated its involvement in vivo inmediating the protection from EAE and regulation of CD4þ
T-cell differentiation by NADþ . Mice were subjected to EAE andwere treated daily with PBS or NADþ . Half of the animals ineach group also received p-chlorophenylalanine, a specificinhibitor of Tph1. Onset of clinical signs of EAE in miceimmunized with MOG peptide and treated with a placebosolution appeared after 11 days (Fig. 8a). Similar to the resultsdescribed above (Fig. 1a and Supplementary Movie 1d and f),mice treated with NADþ were protected from EAE (Fig. 8a).However, when NADþ -treated mice were administered the Tph1inhibitor, onset of clinical signs of EAE appeared after 12 days(Fig. 8a). Furthermore, on day 12 after MOG immunization, micetreated with NADþ and p-chlorophenylalanine exhibited moresevere clinical signs of EAE than did immunized mice thatwere treated with a placebo solution (Fig. 8a). Mice treated withTph1 inhibitor exhibited hindlimb paralysis and becamerapidly lethargic. Flow cytometry showed that the combinationof NADþ treatment with Tph1 inhibition caused a systemicreduction in the number of CD4þ IL-17Aþ and CD4þ
IL-10þ IFNgþ and CD4þCD25þFoxp3þ cells (Fig. 8b).Collectively, these results indicate that Tph1 plays a critical rolein NADþ protective properties against EAE and CD4þ T helpercell and differentiation.
NADþ protects against EAE through IL-10 and Tr1 cells. It iswell established that Th1 IL-10-producing cells are robustimmunosuppressive cells that promote homeostasis20,22,37 and wefound that NADþ induces IL-10 production by Th1 cells in vitroand in vivo. Thus, to investigate whether NADþ protectiveproperties were mediated through IL-10 production by Th1 cells,naıve CD4þCD25�CD44lowCD62Lhigh T cells were obtained bycell sorting and cultured during 4 days in Th1 polarizingconditions in the presence of NADþ (250 mM) or vehicle (PBS)and used in an adoptive transfer experiment. After 4 days ofculture, cells were collected and injected intravenously (2� 106
cells per injection) at days 3, 6 and 9 in WT mice that weresubjected to EAE. Similar to our previous results, mice treatedwith NADþ were protected against EAE, whereas mice treatedwith PBS and mice that received CD4þ T cells that were culturedin the presence of a placebo solution did develop severe EAE withclinical onset at day 11 (Fig. 8c). In contrast, mice that receivedCD4þ T cells that were cultured in the presence of NADþ had asignificant delayed clinical onset (day 13) and developed a lesssevere EAE than the control groups (Fig. 8c). In addition, ourdata indicate that NADþ promotes IL-10 production by Th1cells through Tph1. Thus, to assess the role of Tph1 in IL-10production by Th1 cells and its role in NADþ mediatedprotective properties, an additional group of mice receivedintravenous injections of CD4þ T cells that were previouslycultured with NADþ (250 mM) and Tph1 inhibitor (200 mM).Similar to mice that received CD4þ T cells that were cultured inthe presence of a placebo solution did develop severe EAE withclinical onset at day 11 (Fig. 8c). Taken together, these results
ARTICLE NATURE COMMUNICATIONS | DOI: 10.1038/ncomms6101
10 NATURE COMMUNICATIONS | 5:5101 | DOI: 10.1038/ncomms6101 | www.nature.com/naturecommunications
& 2014 Macmillan Publishers Limited. All rights reserved.

indicate that NADþ protective properties are mediated viaIL-10- and Th1-IL-10-producing cells and that Tph1 signallingpathway plays an important role.
NADþ enhances IFN-c production independently of T-bet.Our previous results indicated that NADþ overrides thecytokine environment and alters CD4þ T-cell differentiation.
0 1 2 3 4 5 6 7 8 9 10 11 12 13
3.5
4.0
2.5
3.0
1.5
2.0
o.5
1.0
0.0
MOG
MOG + NAD+
Days post-immunization
EA
E s
core
MOG+Tph-1 inhibitor
MOG+NAD+Tph-1 inhibitor
Lethargy onset
***
***
IL-17A+
0
10
20
30 *
% o
f CD
4+
NAD+ NAD++Tph1-I
25.9 9.76
CD4
IL-1
7A
NAD+ NAD+ + Tph1-I NAD+ NAD+ + Tph1-I
05
101520 *
NAD+ NAD++Tph1-I
% o
f CD
4+
IFN-γ+
18.3 11.6
CD4
IFN
γ
05
101520 *
% o
f CD
4+
NAD+ NAD++Tph1-I
CD25+ Foxp3+
19.1 10
Fox
p3
CD25
0
5
10
15 *
NAD+ NAD++Tph1-I
% o
f CD
4+
IFN- γ+ IL-10+
14.8
IL-10
9.09IFN
γ
0 1 2 3 4 5 6 7 8 9 10 11 12 13 14 15 16 17 18 19 20
0.0
0.5
1.0
1.5
2.0
2.5
3.0
3.5
4.0
WT+ MOG immunization + i.v. injections ofCD4+ in Th1 polarizing conditions in presence ofPBS
WT + MOG immunization + i.v. injections of CD4+
in Th1 polarizing conditions in presence of 250 μMNAD+
WT + MOG immunization + i.v. injections of CD4+
in Th1 polarizing conditions in presence of 250 μMNAD+ and Tph-1 inhibitor (200 μM)
**
**** ** ** **
** ** **
**
**
**
**
*
**
i.v. i.v. i.v.
Days post-immunization
EA
E s
core
WT+ MOG immunization + i.v. injections of PBSWT+ MOG immunization + i.v. injections of NAD+
a
b
c
Figure 8 | NADþ regulates CD4þ T-cell differentiation through Tph1. (a) Behavioural scores of EAE in wild-type C57BL/6 mice treated either with
intraperitoneal injection of 60 mg of NADþ or a placebo solution (PBS). An additional group of mice was treated with intraperitoneal injections of NADþ
and p-chlorophenylalanin (Tph1 inhibitor). As a control group, wild-type mice were treated with Tph1 inhibitor alone (n¼ 5 per group). (b) CD4þ T cells
were isolated from spleens 13 days after EAE induction and CD4þ frequencies of CD25þFoxp3þ , IL-17Aþ , IFNgþ and IFNgþ IL-10þ cells were analysed
by flow cytometry. (c) Behavioural scores of EAE in wild-type mice (C57BL/6 background) treated at days 3, 6 and 9 with intravenous injections of sorted
naıve CD4þCD25þCD44lowCD62Lhigh T cells (2� 106 cells) that were cultured during 4 days in Th1 polarizing conditions in the presence of NADþ
(250mM) or a placebo solution (PBS). As control groups, wild-type mice were subjected to EAE and treated with NADþ (60 mg) or PBS intravenously at
days 3, 6 and 9 (n¼ 8–11 per group). Data derived from two independent experiments; data represent mean±s.d. *Po0.05; **Po0.01; ***Po0.001
significant as determined by Student’s t-test and Mann–Whitney U-test were used accordingly to compare between groups. i.p., intraperitoneal; i.v.
intravenous.
NATURE COMMUNICATIONS | DOI: 10.1038/ncomms6101 ARTICLE
NATURE COMMUNICATIONS | 5:5101 | DOI: 10.1038/ncomms6101 | www.nature.com/naturecommunications 11
& 2014 Macmillan Publishers Limited. All rights reserved.
WT Th1
WT Th1 + NAD+
0
105
104
103
102
0 0.81
99.20
0 24.6
75.40
0 72.3
27.70
0 8.67
91.30
0 60
400
0.972 0.198
0.6398.2
23.5 3.14
0.67372.7
47.7 32.6
1.6418.1
0
7.97 1.47
0.87589.7
40.5 23.8
4.4731.1
CD4-PECy7 IL-10-APC
0
20
αCD3+αCD28 Th1 Th1
Th1+N
AD+
Th1+N
AD+
40
60
80
0
10
20
30
40
***
******
***
***
***
WT Tbet–/– WT
αCD3+αCD28
Tbet–/– Th1
Tbet–/– Th1 + NAD+
%C
D4+
IFN
γ+ c
ells
αCD3+αCD28 Th1 Th1
Th1+N
AD+
Th1+N
AD+
Tbet–/–
0
105
104
103
102
0
105
104
103
102
0
105
104
103
102
0
105
104
103
102
0
105
104
103
102
0
105
104
103
102
0
105
104
103
102
0
105
104
103
102
0
105
104
103
102
IFN
γ-eF
450
0 105104103102 0 105104103102
%C
D4+
IFN
-γ+IL
-10+
cel
ls
IFN
γ-eF
450
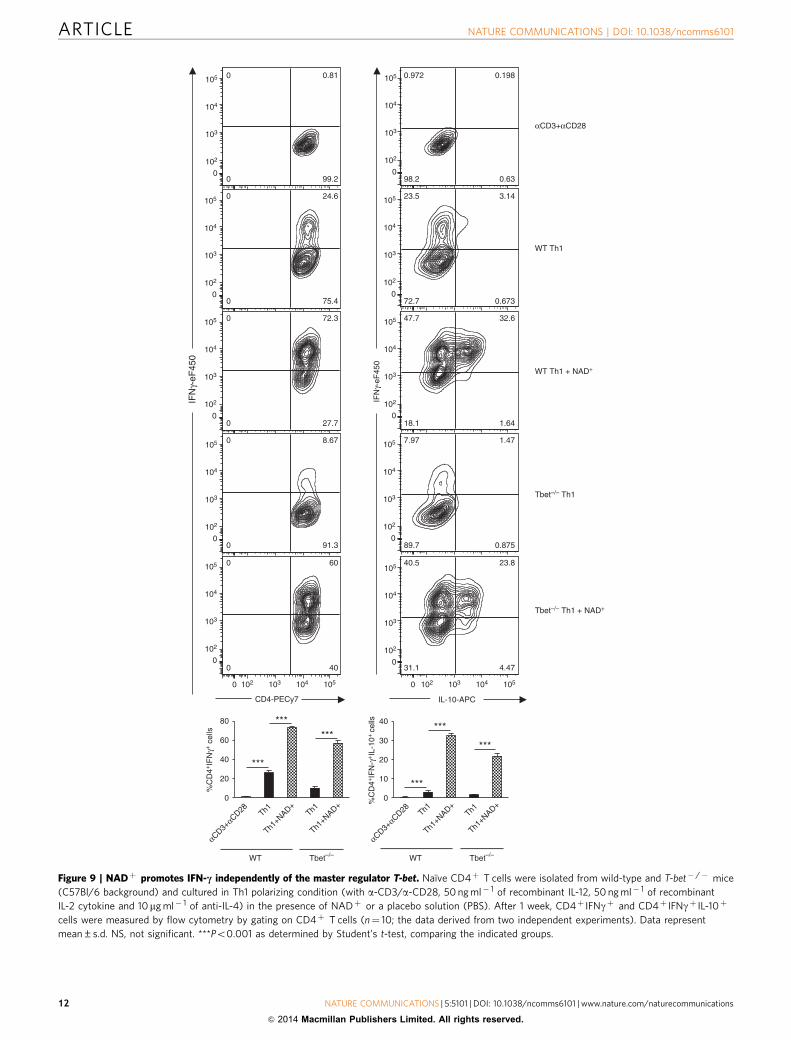
Figure 9 | NADþ promotes IFN-c independently of the master regulator T-bet. Naıve CD4þ T cells were isolated from wild-type and T-bet� /� mice
(C57Bl/6 background) and cultured in Th1 polarizing condition (with a-CD3/a-CD28, 50 ng ml� 1 of recombinant IL-12, 50 ng ml� 1 of recombinant
IL-2 cytokine and 10mg ml� 1 of anti-IL-4) in the presence of NADþ or a placebo solution (PBS). After 1 week, CD4þ IFNgþ and CD4þ IFNgþ IL-10þ
cells were measured by flow cytometry by gating on CD4þ T cells (n¼ 10; the data derived from two independent experiments). Data represent
mean±s.d. NS, not significant. ***Po0.001 as determined by Student’s t-test, comparing the indicated groups.
ARTICLE NATURE COMMUNICATIONS | DOI: 10.1038/ncomms6101
12 NATURE COMMUNICATIONS | 5:5101 | DOI: 10.1038/ncomms6101 | www.nature.com/naturecommunications
& 2014 Macmillan Publishers Limited. All rights reserved.

Our findings indicate that in Th0 polarizing conditions NADþ
was able to promote IFN-g production. In addition, we haveshown that NADþ inhibits cytokine production of polarized Th1and Th2 CD4þ T cells and inhibits the expression of severalmajor transcription factors that have been shown to play a centralrole in CD4þ T-cell differentiation such as T-bet, GATA3 andFoxp3 (refs 44,45,49). In contrast, microarray analysis and real-time PCR results showed an increased Tph1 mRNA levelssuggesting that NADþ regulates CD4þ T-cell differentiationthrough Tph1 and more importantly independently of well-established transcription factors. Thus, we next investigatedwhether NADþ was able to regulate CD4þ T-cell differentiationand promote cytokine production in the absence of majortranscription factors. Naıve CD4þCD25�CD44lowCD62Lhigh
T cells were isolated from WT and T-bet� /� mice andcultured in Th1 polarizing condition in the presence of NADþ
or a placebo solution (PBS). After 1 week, cells were analysed byflow cytometry. As shown in Fig. 9, NADþ induced a very robustIFN-g production by WT naıve CD4þ T cells (B73%) culturedin Th1 polarizing conditions when compared with the controlgroup of WT naıve CD4þ T cells that were cultured in Th1polarizing conditions and PBS (B25%). Furthermore, NADþ
treatment of naıve CD4þ T cells isolated from T-bet� /� miceresulted in a dramatic increase of CD4þ IFNgþ cells (B58%)when compared with Th1 polarizing conditions (B8%).More importantly, B58% of T-bet� /�CD4þ T cells were ableto produce IFN-g, whereas only B25% of WT CD4þ
T cells were able to produce IFNg in Th1 polarizing conditions(Fig. 9). Taken together, these results demonstrate that NADþ is
a robust IFN-g inducer and more importantly that NADþ reg-ulates cytokine production independently of the classical tran-scription factors.
DiscussionIn the present work, we report that NADþ is able to regulateCD4þ T-cell differentiation (Fig. 10). In addition, our dataindicate that NADþ promotes a robust systemic IL-10 andTGF-b1 production by Th1 and Th17 cells, respectively. IL-10and TGF-b1 are two prominent immunosuppressive cytokinesthat were shown to protect from EAE35. The central role of IL-10in NADþ -mediated protection against EAE was demonstratedwhen IL-10� /� mice treated with NADþ and subjected to EAEdeveloped severe clinical symptoms. More importantly,Th1 cells that co-express IL-10 have been shown to haveimmunosuppressive properties and to prevent from exaggeratedimmune responses and concomitant tissue damage. Because oftheir anti-inflammatory properties, IL-10-producing Th1 cellswere termed Tr1 cells22. Here we show that adoptive transfer ofCD4þ T cells that were differentiated in vitro under Th1polarizing conditions in the presence of NADþ significantlydelayed the clinical onset and reduced the severity of the disease.These findings are in line with previous studies that have shownthat IL-10 production by IFN-g-producing Th1 cells can preventtissue damage and autoimmune diseases21,37. Nevertheless, micethat received CD4þ T cells that were differentiated in vitro underTh1 polarizing conditions in the presence of NADþ stilldeveloped mild EAE. A recent study showed that in the
NAD+
T H0
cond
itions
T H1 co
nditions
TH 17 conditions
iTreg conditions
IL-2
IL-12, IL-2, αIL-4
Tph-1
Tph-1
Tph-1
TH1/TH2 cell
NAD+
NAD+
NAD+
NAD+
Foxp3
TH17 cell
IL-4IFN-γ
IL-17AIFN-γIL-4
IFN-γ
IL-4IL-13IL-10
TNF-αIL-6
TGF-βIL-10
iTreg cell
IL-17A
TH2 cell
TH1 cell
TH0 cell
GATA-3GATA-3
TH2 IL-4+/IL-17+ cell
Tph-1
Tph-1
TH17 cell
TH17 TGFβ+ cell
T-bet
T-bet
T-bet
Regulatory type I cell
Immunosuppressive
Non-pathogenic
IL-10IFN-γ
IL-17A
IL-4IL-17AIL-10
IL-17ATGF-β
IL-17A
TH2 conditions
NaïveCD4+ T cell
IL-4, IL-2, αIL-12, αIFN-γ
TGF-β, IL-6, αIL-4, αIL-12 αIFN-γ
TGF-β, IL-2, αIL-4, αIL-12 αIFN-γ
Figure 10 | NADþ a master regulator of CD4þ T-cell differentiation. After T-cell antigen receptor (TCR) engagement, NADþ promotes naıve
CD4þ T cell into Th1, Th2 and Th17 cells. NADþ promotes the conversion of Th1-IFN-g-producing cells into regulatory type 1 cells that co-produce
IFN-g and IL-10 with immunosuppressive properties. NADþ promotes IL-10 and IL-17A cytokines by Th2 cells. NADþ does not affect Th17 cytokine
conditions but drives the switch of iTreg into Th17 TGF-b-producing cells. NADþ regulates CD4þ T-cell differentiation through Tph1.
NATURE COMMUNICATIONS | DOI: 10.1038/ncomms6101 ARTICLE
NATURE COMMUNICATIONS | 5:5101 | DOI: 10.1038/ncomms6101 | www.nature.com/naturecommunications 13
& 2014 Macmillan Publishers Limited. All rights reserved.
presence of TGF-b1, Th17 cells are non-pathogenic23 and it iswell known that TGF-b1 is a robust immunosuppressivecytokine50. Thus, we cannot rule out that the increased level ofTGF-b1 by Th17 cells following NADþ treatment may attenuateTh17 pathogenicity and/or promote homeostasis. In addition,IL-23, TGF-b3 and GM-CSF have been shown to play a criticalrole in Th17 pathogenicity and EAE23,38. In our study, we couldnot detect differences in IL-23, TGF-b3 and GM-CSF systemiclevels between the NADþ -treated mice and the control group.Although flow cytometry analysis showed that NADþ treatmentresulted in a modest decrease of GM-CSF production byCD4þ IL-17Aþ cells and an increased expression of IL-23R, wedo not believe that IL-23, TGF-b3 or GM-CSF play a role inNADþ signalling machinery.
T-bet has been shown to play a critical role in controllingTh1/Th17-mediated autoimmunity12. T-bet-deficient mice havebeen shown to be resistant to autoimmunity, whereas IFN-g-,IFN-g receptor- and IL-17-deficient mice remain susceptibleto EAE12. Our study demonstrates that NADþ reduces theexpression level of T-bet under Th0, Th1 polarizing conditionsand in differentiated Th1 cells, suggesting that NADþ mayprotect against EAE by inhibiting T-bet expression and thusaltering Th1/Th17-mediated autoimmunity. Bruzzone et al. haveshown that depletion of NADþ using FK866, an inhibitor of akey enzyme for NADþ biosynthesis, reduced clinical symptomsin EAE. The study showed that NADþ depletion with FK866spared resting T lymphocytes and targeted specifically activatedT lymphocytes resulting in increased apoptosis, reducedproliferation and cytokine production25. In contrast, in ourstudy, we showed that treatment with NADþ -protected activatedCD4þ T cells from apoptosis and instead regulated theirdifferentiation. Thus, we believe that NADþ depletion byFK866 reduced EAE clinical symptoms mainly by inducing celldeath of activated cells, whereas treatment with NADþ protectedagainst EAE by inducing homeostasis and by promoting myelinregeneration and neuroregeneration.
Furthermore, NADþ was able not only to block but also toreverse EAE progression by restoring myelin and favouringaxonal regeneration, suggesting that NADþ may promote thisprocess by inhibiting the inflammatory response or might actdirectly on other pathways involved in the CNS in particular inmaintaining pluripotency30. Initially, NADþ was used as atherapeutic agent to treat schizophrenic patients51,52. Although amore recent study suggested that NADþ might prevent fromaxonal degeneration24, the direct impact of NADþ on the CNSremains unclear and warrants further investigation. Of note, lowdose of NADþ such as 10 mg was effective in protecting againstEAE. According to many reports and the Food and DrugAdministration53 guidelines, injection of 10 mg in our animalmodel corresponds to a dose of 1.6 g for an individual of 70 kg,which is a reasonable daily dose for patients.
Moreover, our study has uncovered a new role of NADþ inCD4þ T-cell differentiation. Under Th1 polarizing conditionsand in the presence of NADþ , CD4þ T helper cells were able torapidly secrete high amounts of IL-10, conventionally consideredas a Th2 cytokine. Interestingly, previous studies have shown thatTh1 cells are able to produce IL-10 in culture when providedlonger incubation time (2–5 weeks) and high T-cell antigenreceptor stimulation54 or chronic Th1 activation20. In our hands,NADþ was able to induce IL-10 secretion by IFN-g-producingTh1 cells within hours without high T-cell antigen receptorstimulation, indicating that NADþ is a robust inducer. Althoughit is well accepted that IL-4 inhibits IL-17A production under Th2polarizing conditions5,7,15, Wang et al. have described a CD4þ
Th2 subset that co-produces IL-4 and IL-17A and have shownthat these cells were the main cause of lung inflammation in the
chronic stage of asthma55. However, the mechanisms thatpromote CD4þ IL-4þ IL-17Aþ cell development remainunknown. The mechanism of action of NADþ was confirmed,in vitro, with its capacity to convert iTregs into Th17 cells even inthe presence of IL-2, a cytokine that is known to prevent Th17lineage commitment56,57. More importantly, T-bet and GATA3,two transcription factors that regulate CD4þ T cell Th1/Th2 fatedecision were downregulated by NADþ , whereas Foxp3, themaster regulator of Tregs, was not detected, suggesting thatNADþ regulates CD4þ T-cell differentiation through analternative pathway. This alternative pathway was demonstratedusing naıve T-bet� /�CD4þ T cells. In the presence of NADþ ,B58% of T-bet� /�CD4þ T cells were able to produce IFN-g,whereas only B8% were able to produce IFN-g in solely Th1polarizing conditions. More importantly, only 25% of WT CD4þ
T cells were IFN-g in Th1 polarizing conditions, indicating thatNADþ not only promotes IFN-g production independently ofT-bet but also underscoring NADþ as a more potent IFN-ginducer than Th1 polarizing conditions. In parallel to thedecreased expression of T-bet, GATA3 and Foxp3, NADþ
induced a robust increase in Tph1 expression by CD4þ Thelper cells under Th polarizing conditions, suggesting a centralrole in NADþ -mediated CD4þ T-cell differentiation. Indeed,treatment with a Tph1 inhibitor dampened the systemic IL-17Aand IL-10/IFN-g responses observed after NADþ administration,confirming that Tph1 is critical in NADþ -mediated T-celldifferentiation. Moreover, mice treated with NADþ and Tph1inhibitor simultaneously developed a more severe EAE than micethat were subjected to MOG immunization and treated with aplacebo solution, indicating that Tph1 signalling pathway plays acritical role in NADþ protective properties against EAE. Thesefindings were in line with a previous study that showed thatTph1-deficient mice were more susceptible to EAE48. In addition,the combination of NADþ and Tph1 inhibitor developed severelethargy 13 days following MOG immunization and animals hadto be euthanized. The cause of death was not due to MOGimmunization but was most likely the result of heart failure andbreathing difficulties. Indeed, Tph1 inhibition has been shown topromote serotonin depletion, a crucial neurotransmitter58,causing breathing difficulties and inducing heart failure59.
In conclusion, our study underscores NADþ as a majorregulator of CD4þ T-cell differentiation that signals through anovel pathway that is distinct from the classical pathwaydescribed almost three decades ago2–4. Furthermore, our studydemonstrates that NADþ acts independently of the majortranscription factors described16,44–47,49 and signals throughTph1 enzymatic pathway. On a clinical aspect, our studyunravels the therapeutic potential of NADþ as a homeostaticagent in a myriad of diseases. The unique property of NADþ
in inducing homeostasis that is not mediated byCD4þCD25þFoxp3þ regulatory T cells may benefitimmunodeficient patients that result from mutations in theFoxp3 gene60. In addition to its antitumour properties27, NADþ
may be the ideal molecule to treat autoimmune diseases such asMS, type 1 diabetes and inflammatory bowel disease in whichIL-10 has been shown to play a central role61. Moreover,NADþ homeostatic properties could be used as therapy beyondautoimmune diseases, including acute and chronic inflammatorydiseases62.
MethodsAnimals. Eight- to ten-week old female B10.A-Rag2tm1FwaH2-T18aTg orwild-type (WT) mice on a C57BL/6 background were purchased from Taconic.B6.129P2-IL10tm1Cgn/J and B6.129S6-Tbx21tm1Glm/J mice were purchased fromthe Jackson Laboratory. Animal use and care were in accordance with theNational Institutes of Health and Institutional Animal Care and Use Committeeguidelines.
ARTICLE NATURE COMMUNICATIONS | DOI: 10.1038/ncomms6101
14 NATURE COMMUNICATIONS | 5:5101 | DOI: 10.1038/ncomms6101 | www.nature.com/naturecommunications
& 2014 Macmillan Publishers Limited. All rights reserved.

Cell isolation. Single-cell leukocyte suspensions were obtained from spleens of5- to 10-week-old 5C.C7 Rag2� /� , T-bet� /� or WT mice. Depletion ofnon-CD4þ T cells was done using biotin-conjugated monoclonal anti-mouseantibodies against CD8a, CD11b, CD45R, CD49b, Ter-119 and anti-biotinmagnetic beads (Miltenyi Biotec). Cells were further sorted using a-CD4-PE anda-PE magnetic beads (Miltenyi Biotec) and CD4þCD25-CD44lowCD62Lhigh(all eBioscience) cells were sorted by flow cytometry. All antibodies were usedat a concentration of 1–2 mg per 1� 106 cells. Purities of CD4þCD25-
CD44lowCD62Lhigh T cells after isolation were 499.2%.
Cell culture. Isolated CD4þ T cells were cultured in 24-well flat bottom plates(0.5� 106 cells per well) in 0.5 ml of complete RPMI 1640 media (supplementedwith 10% FCS, 200 mM L-glutamine, 100 U ml� 1 penicillin/streptomycin and5� 10-5 M 2-mercaptoethanol (RP-10) in the presence of 10 mg ml� 1 plate-boundanti-mouse a-CD3 (17A2) and 2 mg ml� 1 soluble a-CD28 (37.51) in addition to50 ng ml� 1 recombinant mouse IL-2 (all eBioscience). NADþ (Sigma-Aldrich)was diluted in PBS and added as indicated. Cells were cultured in polarizing Th1(50 ng ml� 1 of recombinant IL-12 and 10 mg ml� 1 of anti-IL-4), Th2 (50 ng ml� 1
of recombinant IL-4, 10 mg ml� 1 of anti-IFN-g), Th17 (10 ng ml� 1 of recombi-nant TGF-b, 100 ng ml� 1 of recombinant IL-6, 10 mg ml� 1 of anti-IFN-g and10mg ml� 1 of anti-IL4) or iTreg (10 ng ml� 1 of recombinant TGF-b, 10mg ml� 1
of anti-IFN-g and 10mg ml� 1 of anti-IL4) conditions. All recombinant cytokinesand antibodies were purchased from eBioscience except recombinant TGF-bcytokine (R&D Systems). After 96 h of culture supernatants and cells were collectedand analysed by ELISA and flow cytometry, respectively.
To investigate the impact of NADþ on polarized CD4þ T cells, naıve CD4þ
T cells were isolated and cultured in Th1 or Th2 polarizing conditions as describedabove. After 1 week, cells were washed and incubated in the presence of NADþ
(100 mM) or PBS. After 72 h, cells were rested during an additional 72 h andre-stimulated with Th1 or Th2 polarizing conditions. After 10 days, cells werestained and analysed by flow cytometry.
Flow cytometry. Fluorescence-labelled anti-mouse a-CD4 (GK1.5), a-CD25(PC61), a-IFN-g (XMG1.2) and unlabelled a-CD16/CD32 (2.4G2) antibodies wereobtained from BD Biosciences. Fluorescence-labelled anti-mouse a-IL-4 (FJK-16s),a-IL-10 (JES5-16E3), a-IL-17A (eBio17B7), anti-GM-CSF (MP1-22E9), anti-Foxp3(FJK-16s) and anti-TGFb1 (TW7-16B4) were obtained from eBioscience. Anti-mouse anti-IL23R (753317) was purchased from R&D systems. All antibodies wereused at a concentration of 2–5mg per 1� 106 cells. To set the gates, flow cytometrydot plots were based on comparison with isotype controls, fluorescence minus one,permeabilized and unpermeabilized unstained cells. Intracellular staining for IL-4,IL-10, IL-17A, IFN-g, GM-CSF and TGF-b was performed according to themanufacturers’ protocols. Splenocytes were re-stimulated in complete media(RPMI media containing 10% FCS, 1% L-glutamine, 1% penicillin/streptomycin;all from Bio Whittaker) for 4 h at 37 �C with ionomycin, phorbol 12-myristate13-acetate and Brefeldin A (eBioscience). Cells were fixed and permeabilized usingCytofix/Cytoperm solution (BD Biosciences). Flow cytometry measurements ofsingle-cell suspensions for in vivo experiments were performed on a FACSCaliburusing standard procedures and data were analysed using FlowJo software (TreeStar). Flow cytometry measurements for in vitro experiments were performed onMoFlo Astrios (Beckman Coulter) and data were analysed using Kaluza software(Beckman Coulter).
Apoptosis. Apoptosis was assessed by caspase (caspase-1, -3, -4, -5, -6, -7, -8and -9) activity measurements. Caspases activities were determined by flowcytometry using FAM-fluorochrome inhibitor of caspases (FLICA) Poly CaspaseAssay Kit (Immunochemistry Technologies) all dilutions and staining protocolswere performed according to the manufacturer’s instruction. Briefly, after 96 h ofculture in Th0, Th1, Th2, Th17 or iTreg polarizing condition, sorted naıve CD4þ
T cells were incubated with a 30� FLICA solution for 1 h at 37 �C. Followingincubation time, cells were washed with apoptosis wash buffer included in the kit.Cells were then analysed on a MoFlo flow cytometer (Beckman Coulter), gating onthe live cells and measuring the fluorescence due to the presence of FAM-FLICAbound to several caspases (caspase-1, -3, -4, -5, -6, -7, -8 and -9).
ELISA. Mouse IL-4, IL-10, IL-17A, IFN-g, GM-CSF, IL-23 and TGF-b1 weremeasured using commercial kits (eBioscience). Mouse TGF-b3 was measured usingcommercial kit (Catalog# SEB949Mu) from Cloud-clone. Briefly, ELISA plateswere coated with 100 ml of anti-cytokine capture antibody at 4 �C overnight. Plateswere then washed � 5 with 0.05% PBS-Tween (PBST) and coated for 1 h with theblocking buffer provided by the manufacturer. Samples or standards were added induplicates (100 ml per well) and incubated at 4 �C overnight. Wells were washed� 5 with PBST and incubated with 100 ml of anti-cytokine detection antibody at4 �C overnight. Wells were then washed � 5 with PBST and incubated with 100 mlof avidin-HRP at room temperature for 30 min. Thereafter, wells were washed � 7with PBST and incubated with 100 ml per well of a substrate. The reaction wasstopped after 15 min with 1 M H2SO4 and absorbance was measured using amultiplate microplate fluorescence reader (Synergy HT, Biotek) at 405 nm.
RNA extraction, real-time PCR and microarray analyses. CD4þ T cells wereisolated from WT mice (isolated with anti-biotin magnetic beads (Miltenyi Biotec),cultured in Th0, Th1, Th2 and iTreg polarizing conditions and used for microarrayanalyses and real-time PCR reactions. CD4þ T cells from 5C.C7 Rag2� /� micewere cultured in Th0, Th1, Th2 and iTreg polarizing conditions and used exclu-sively for real-time PCR reactions. After 96 h of culture, cells were collected andRNA was extracted using the RNAqueous extraction kit according to the manu-facturer’s protocols (Applied Biosystems). Briefly, cells were homogenized in lysisbuffer (total volume of 0.5 ml) and passed through a column. After successivewashes, RNA was eluted. For real-time PCR reactions, T-bet (Mm00450960_m1),GATA3 (Mm00484683_m1), STAT5a (Mm03053818_s1), STAT6(Mm00447411_m1), RORgt (Mm01261022_m1), Foxp3 (Mm00475162_m1)and tryptophan hydroxylase-1 (Tph1) (Mm00493794_m1) measurements wereperformed with Taqman primers and probes from Applied Biosystems. Thehousekeeping gene GAPDH (Mm99999915_g1) was used as control. Microarrayanalyses were performed using affymetrix genechip. Briefly, the cDNA (10 mg) wasfragmented and labelled and then hybridized to a GeneChip Mouse Genome 4302.1 array (Affymetrix). Affymetrix microarray data analysis was performed usingPartek Genomics Suite software (Partek Inc.). Default settings were used forquantile normalization and RMA summarization. The samples were grouped andstatistics were applied using the analysis of variance model employing linearcontrast. Linear contrast was established for each pair of grouped samples forwhich the analysis was appropriate. Gene lists were then created for each analysisfor downstream pathway analysis using threshold values of FDR-adjusted P-valuer0.05 and fold change Z2 and r2. The Ingenuity Pathways Analysis (IngenuitySystems) applications were used to generate canonical pathways associated with thedifferentially expressed gene profiles extracted from the transcriptome data.
RNA extraction from spinal cord tissue was performed using RNAqueousextraction kit according to the manufacturer’s protocol (Applied Biosystems).Briefly, 1 mg of spinal cord tissue was homogenized in lysis buffer (total volume of0.5 ml) and passed through a column. After successive washes, RNA was eluted andreverse transcription was performed using i-Script cDNA synthesis kit (Bio-RadLaboratories). PCR reactions were performed with IFN-g (Mm01168134_m1) andIL-17A (Mm00439619_m1) Taqman primers and probes from Applied Biosystems.Relative gene expression was determined using the housekeeping gene GAPDH(Mm99999915_g1) as control.
EAE mouse model. EAE was induced in 8- to 10-week-old WT or IL-10� /� miceusing Hooke Labs EAE induction kit (EK-2110) according to the manufacturer’sinstructions (Hooke Laboratories Inc.). Mice were scored daily on a scale of 0–5 ina double-blind manner with the following criteria: score 0, no signs of neurologicaldisease; score 1, flaccid paralysis of the tail; partial or no tail muscle tone, mouse isunable to curl tail around finger or pencil; score 2, weak hindlimb paralysis orwobbling gait and/or impaired righting reflex; score 3, bilateral hindlimb paralysis,mouse drags its hindlimbs over flat surface and/or exhibits incontinence; score 4,hind- and forelimb paralysis, mouse barely moves around; score 5, moribundanimal). For NADþ treatment, mice received a daily intraperitoneal injection(60 mg in 100ml in PBS) or a placebo solution (100 ml of PBS) at the same day thanMOG immunization. Mice were killed at day 18 and single-cell suspension wasobtained from spleens for flow cytometry analysis. To test whether NADþ wasable to reverse the development of EAE, another group of mice was treated daily(for a period of 10 days) with NADþ (60 mg per mouse) or a placebo solution(PBS) 15 days after MOG immunization when mice were scored 3 with a bilateralhindlimb paralysis. EAE disease progression was monitored. For Tph1 inhibition,mice were subjected to MOG immunization and treated daily with NADþ . Oneweek after MOG immunization, mice received daily intraperitoneal injections(simultaneous to NADþ ) of p-Chlorophenylalanine (1 ml of a 10 mM stocksolution, catalogue number 0938, Tocris Bioscience).
Adoptive transfer. Naıve sorted CD4þCD25�CD44lowCD62Lhigh cells werecultured in Th1 polarizing in the presence of NADþ (250 mM), PBS or a cocktailof NADþ (250 mM) and Tph1 inhibitor (200 mM). After 4 days of culture, cellswere collected, washed and 2� 106 cells were re-suspended in 100 ml of PBS andinjected intravenously in mice that were subjected to EAE at days 3, 6 and 9 postMOG-immunization.
Histology, immunohistochemistry and quantification. Animals used to assessEAE clinical symptoms (n¼ 6 per group) were killed 25 days after MOGimmunization. After transcardial perfusion with 4% paraformaldehyde, lumbarspinal cord was isolated from the three groups of mice: (i) mice that were treateddaily with a placebo solution (PBS), (ii) mice that were treated daily with NADþ
and (iii) mice that were treated 15 days with NADþ after MOG immunization(when mice developed hindlimb paralysis). Spinal cords from the three groupswere fixed in 4% paraformaldehyde for 24 h and processed for paraffin histology.Histological stainings with LFB (American MasterTech Scientific Inc.) andH&E (Sigma) were performed on 8-mm-thick transverse paraffin sections andimmunohistochemistry was performed on 20-mm-thick paraffin sections. Primaryantibodies used for immunohistochemistry were: monoclonal antibody to MBP(SMI-94) (1:400, Millipore) and rabbit polyclonal antibody to NF 200 (1:50,
NATURE COMMUNICATIONS | DOI: 10.1038/ncomms6101 ARTICLE
NATURE COMMUNICATIONS | 5:5101 | DOI: 10.1038/ncomms6101 | www.nature.com/naturecommunications 15
& 2014 Macmillan Publishers Limited. All rights reserved.

Sigma), Ki67 (1:30, Sigma) and Musashi (1:50, Millipore) followed by secondarydetection with Alexa Fluor conjugates (Molecular Probes). DAPI (VectorLaboratories) was used to label nuclei. Brightfield and fluorescent images wereobtained from an FSX100 microscope (Olympus). The areas of demyelination werequantified either by immunocytochemistry or immune fluorescence microcopyusing ImagePro Plus 7.0 software (Media Cybernetics). For brightfield immuno-histochemistry analysis, before quantification, each RGB image was converted intoan image representing exclusively the saturation channel, and then the segmen-tation values established on a region of interest corresponding to the white matterin the untreated group was applied to all sections. The results represent opticaldensity and area. Staining artefacts were removed manually following automaticquantification. Total areas measured represent three full transverse spinal cordsections per animal for each group. For fluorescence determination of NFþ area,monochrome images were analysed by quantifying intensity values using anautomated segmentation script based on values obtained on the untreated group.
Count of absolute number of lymphocytes. C57BL/6 mice (8- to 10-week old)were administered daily 60 mg of NADþ or a placebo solution (PBS) intaper-itoneally during 4 days. Blood and spleen were collected after 4 days of treatment.Absolute number of lymphocytes in the blood was determined using a haemo-cytometer (model 850 FS, Drew Scientific). To determine absolute lymphocytenumber in spleens, cells were isolated and counted with a haemocytometer, thenstained with anti-CD4þ , anti-CD3þ or anti-B220þ antibodies and percentageswere determined by flow analysis.
Statistical analysis. Data are presented as the mean±s.d. Statistical analysiscompared the groups with a two-tailed Student’s t-test or Mann–Whitney test wereappropriate. Only P-values o0.05 were considered statistically significant.
References1. Killar, L., MacDonald, G., West, J., Woods, A. & Bottomly, K. Cloned,
Ia-restricted T cells that do not produce interleukin 4(IL 4)/B cell stimulatoryfactor 1(BSF-1) fail to help antigen-specific B cells. J. Immunol. 138, 1674–1679(1987).
2. Mosmann, T. R., Cherwinski, H., Bond, M. W., Giedlin, M. A. & Coffman, R. L.Two types of murine helper T cell clone. I. Definition according to profiles oflymphokine activities and secreted proteins. J. Immunol. 136, 2348–2357(1986).
3. Mosmann, T. R. & Coffman, R. L. Heterogeneity of cytokine secretion patternsand functions of helper T cells. Adv. Immunol. 46, 111–147 (1989).
4. Mosmann, T. R. & Coffman, R. L. TH1 and TH2 cells: different patterns oflymphokine secretion lead to different functional properties. Annu. Rev.Immunol. 7, 145–173 (1989).
5. Harrington, L. E. et al. Interleukin 17-producing CD4þ effector T cellsdevelop via a lineage distinct from the T helper type 1 and 2 lineages. Nat.Immunol. 6, 1123–1132 (2005).
6. Josefowicz, S. Z., Lu, L. F. & Rudensky, A. Y. Regulatory T cells: mechanisms ofdifferentiation and function. Annu. Rev. Immunol. 30, 531–564 (2012).
7. Park, H. et al. A distinct lineage of CD4 T cells regulates tissue inflammation byproducing interleukin 17. Nat. Immunol. 6, 1133–1141 (2005).
8. Zhu, J., Yamane, H. & Paul, W. E. Differentiation of effector CD4 T cellpopulations (*). Annu. Rev. Immunol. 28, 445–489 (2010).
9. Martinez, G. J., Nurieva, R. I., Yang, X. O. & Dong, C. Regulation and functionof proinflammatory TH17 cells. Ann. N.Y. Acad. Sci. 1143, 188–211 (2008).
10. Sakaguchi, S. Regulatory T cells: mediating compromises between host andparasite. Nat. Immunol. 4, 10–11 (2003).
11. Dardalhon, V., Korn, T., Kuchroo, V. K. & Anderson, A. C. Role of Th1 andTh17 cells in organ-specific autoimmunity. J. Autoimmun. 31, 252–256 (2008).
12. Duhen, R. et al. Cutting Edge: the pathogenicity of IFN-gamma-producingTh17 cells is independent of T-bet. J. Immunol. 190, 4478–4482 (2013).
13. Buckner, J. H. Mechanisms of impaired regulation by CD4(þ )CD25(þ )FOXP3(þ ) regulatory T cells in human autoimmune diseases. Nat. Rev.Immunol. 10, 849–859 (2010).
14. Passerini, L. et al. Functional type 1 regulatory T cells develop regardlessof FOXP3 mutations in patients with IPEX syndrome. Eur. J. Immunol. 41,1120–1131 (2011).
15. O’Shea, J. J. & Paul, W. E. Mechanisms underlying lineage commitment andplasticity of helper CD4þ T cells. Science 327, 1098–1102 (2010).
16. Ivanov, I. I. et al. The orphan nuclear receptor RORgammat directs thedifferentiation program of proinflammatory IL-17þ T helper cells. Cell 126,1121–1133 (2006).
17. Luger, D. et al. Either a Th17 or a Th1 effector response can driveautoimmunity: conditions of disease induction affect dominant effectorcategory. J. Exp. Med. 205, 799–810 (2008).
18. Ayyoub, M. et al. Human memory FOXP3þ Tregs secrete IL-17 ex vivoand constitutively express the T(H)17 lineage-specific transcription factorRORgamma t. Proc. Natl Acad. Sci. USA 106, 8635–8640 (2009).
19. Kryczek, I. et al. IL-17þ regulatory T cells in the microenvironments ofchronic inflammation and cancer. J. Immunol. 186, 4388–4395 (2011).
20. Motomura, Y. et al. The transcription factor E4BP4 regulates theproduction of IL-10 and IL-13 in CD4þ T cells. Nat. Immunol. 12, 450–459(2011).
21. Cardone, J. et al. Complement regulator CD46 temporally regulates cytokineproduction by conventional and unconventional T cells. Nat. Immunol. 11,862–871 (2010).
22. Kemper, C. et al. Activation of human CD4þ cells with CD3 and CD46induces a T-regulatory cell 1 phenotype. Nature 421, 388–392 (2003).
23. Lee, Y. et al. Induction and molecular signature of pathogenic TH17 cells. Nat.Immunol. 13, 991–999 (2012).
24. Kaneko, S. et al. Protecting axonal degeneration by increasing nicotinamideadenine dinucleotide levels in experimental autoimmune encephalomyelitismodels. J. Neurosci. 26, 9794–9804 (2006).
25. Bruzzone, S. et al. Catastrophic NADþ depletion in activated T lymphocytesthrough Nampt inhibition reduces demyelination and disability in EAE. PLoSONE 4, e7897 (2009).
26. Adriouch, S. et al. NADþ released during inflammation participates in T cellhomeostasis by inducing ART2-mediated death of naive T cells in vivo. J.Immunol. 179, 186–194 (2007).
27. Hubert, S. et al. Extracellular NADþ shapes the Foxp3þ regulatory T cellcompartment through the ART2-P2X7 pathway. J. Exp. Med. 207, 2561–2568(2010).
28. Van Gool, F. et al. Intracellular NAD levels regulate tumor necrosis factorprotein synthesis in a sirtuin-dependent manner. Nat. Med. 15, 206–210 (2009).
29. Penberthy, W. T. & Tsunoda, I. The importance of NAD in multiple sclerosis.Curr. Pharm. Des. 15, 64–99 (2009).
30. Son, M. J. et al. Nicotinamide overcomes pluripotency deficits andreprogramming barriers. Stem Cells 31, 1121–1135 (2013).
31. Johansson, C. B. et al. Identification of a neural stem cell in the adultmammalian central nervous system. Cell 96, 25–34 (1999).
32. Meletis, K. et al. Spinal cord injury reveals multilineage differentiation ofependymal cells. PLoS Biol. 6, e182 (2008).
33. Martens, D. J., Seaberg, R. M. & van der Kooy, D. In vivo infusions ofexogenous growth factors into the fourth ventricle of the adult mousebrain increase the proliferation of neural progenitors around the fourthventricle and the central canal of the spinal cord. Eur. J. Neurosci. 16,1045–1057 (2002).
34. Horner, P. J. et al. Proliferation and differentiation of progenitor cellsthroughout the intact adult rat spinal cord. J. Neurosci. 20, 2218–2228 (2000).
35. Bettelli, E. et al. IL-10 is critical in the regulation of autoimmuneencephalomyelitis as demonstrated by studies of IL-10- and IL-4-deficient andtransgenic mice. J. Immunol. 161, 3299–3306 (1998).
36. Park, I. K., Shultz, L. D., Letterio, J. J. & Gorham, J. D. TGF-beta1 inhibits T-betinduction by IFN-gamma in murine CD4þ T cells through the proteintyrosine phosphatase Src homology region 2 domain-containing phosphatase-1. J. Immunol. 175, 5666–5674 (2005).
37. Karsten, C. M. & Kohl, J. The complement receptor CD46 tips the scales inT(H)1 self-control. Nat. Immunol. 11, 775–777 (2010).
38. El-Behi, M. et al. The encephalitogenicity of T(H)17 cells is dependent onIL-1- and IL-23-induced production of the cytokine GM-CSF. Nat. Immunol.12, 568–575 (2011).
39. Codarri, L. et al. RORgammat drives production of the cytokine GM-CSF inhelper T cells, which is essential for the effector phase of autoimmuneneuroinflammation. Nat. Immunol. 12, 560–567 (2011).
40. Haag, F. et al. T cells of different developmental stages differ insensitivity to apoptosis induced by extracellular NAD. Dev. Immunol. 9,197–202 (2002).
41. Magnone, M. et al. NADþ levels control Ca2þ store replenishment andmitogen-induced increase of cytosolic Ca2þ by Cyclic ADP-ribose-dependentTRPM2 channel gating in human T lymphocytes. J. Biol. Chem. 287,21067–21081 (2012).
42. Seman, M. et al. NAD-induced T cell death: ADP-ribosylation of cell surfaceproteins by ART2 activates the cytolytic P2X7 purinoceptor. Immunity 19,571–582 (2003).
43. Darzynkiewicz, Z., Pozarowski, P., Lee, B. W. & Johnson, G. L. Fluorochrome-labeled inhibitors of caspases: convenient in vitro and in vivo markersof apoptotic cells for cytometric analysis. Methods Mol. Biol. 682, 103–114(2011).
44. Szabo, S. J. et al. A novel transcription factor, T-bet, directs Th1 lineagecommitment. Cell 100, 655–669 (2000).
45. Zheng, W. & Flavell, R. A. The transcription factor GATA-3 is necessary andsufficient for Th2 cytokine gene expression in CD4 T cells. Cell 89, 587–596(1997).
46. Zhang, D. H., Cohn, L., Ray, P., Bottomly, K. & Ray, A. Transcriptionfactor GATA-3 is differentially expressed in murine Th1 and Th2 cells and
ARTICLE NATURE COMMUNICATIONS | DOI: 10.1038/ncomms6101
16 NATURE COMMUNICATIONS | 5:5101 | DOI: 10.1038/ncomms6101 | www.nature.com/naturecommunications
& 2014 Macmillan Publishers Limited. All rights reserved.
controls Th2-specific expression of the interleukin-5 gene. J. Biol. Chem. 272,21597–21603 (1997).
47. Hwang, E. S., Szabo, S. J., Schwartzberg, P. L. & Glimcher, L. H. T helper cellfate specified by kinase-mediated interaction of T-bet with GATA-3. Science307, 430–433 (2005).
48. Nowak, E. C. et al. Tryptophan hydroxylase-1 regulates immune tolerance andinflammation. J. Exp. Med. 209, 2127–2135 (2012).
49. Hori, S., Nomura, T. & Sakaguchi, S. Control of regulatory T cell developmentby the transcription factor Foxp3. Science 299, 1057–1061 (2003).
50. Littman, D. R. & Rudensky, A. Y. Th17 and regulatory T cells in mediating andrestraining inflammation. Cell 140, 845–858 (2010).
51. Hoffer, A. & Osmond, H. Nicotinamide adenine dinucleotide in the treatmentof chronic schizophrenic patients. Br. J. Psychiatry 114, 915–917 (1968).
52. Hoffer, A., Osmond, H., Callbeck, M. J. & Kahan, I. Treatment of schizophreniawith nicotinic acid and nicotinamide. J. Clin. Exp. Psychopathol. 18, 131–158(1957).
53. Reagan-Shaw, S., Nihal, M. & Ahmad, N. Dose translation from animal tohuman studies revisited. FASEB J. 22, 659–661 (2008).
54. Saraiva, M. et al. Interleukin-10 production by Th1 cells requires interleukin-12-induced STAT4 transcription factor and ERK MAP kinase activation byhigh antigen dose. Immunity 31, 209–219 (2009).
55. Wang, Y. H. et al. A novel subset of CD4(þ ) T(H)2 memory/effector cells thatproduce inflammatory IL-17 cytokine and promote the exacerbation of chronicallergic asthma. J. Exp. Med. 207, 2479–2491 (2010).
56. Laurence, A. et al. Interleukin-2 signaling via STAT5 constrains T helper 17 cellgeneration. Immunity 26, 371–381 (2007).
57. Liao, W., Lin, J. X., Wang, L., Li, P. & Leonard, W. J. Modulation of cytokinereceptors by IL-2 broadly regulates differentiation into helper T cell lineages.Nat. Immunol. 12, 551–559 (2011).
58. Berger, U. V., Grzanna, R. & Molliver, M. E. Depletion of serotonin usingp-chlorophenylalanine (PCPA) and reserpine protects against the neurotoxiceffects of p-chloroamphetamine (PCA) in the brain. Exp. Neurol. 103, 111–115(1989).
59. Cote, F. et al. Disruption of the nonneuronal tph1 gene demonstrates theimportance of peripheral serotonin in cardiac function. Proc. Natl Acad. Sci.USA 100, 13525–13530 (2003).
60. Rudensky, A. Y. Regulatory T cells and Foxp3. Immunol. Rev. 241, 260–268(2011).
61. Asadullah, K., Sterry, W. & Volk, H. D. Interleukin-10 therapy--review of a newapproach. Pharmacol. Rev. 55, 241–269 (2003).
62. Umapathy, N. S. et al. beta-Nicotinamide adenine dinucleotide attenuateslipopolysaccharide-induced inflammatory effects in a murine model of acutelung injury. Exp. Lung. Res. 38, 223–232 (2012).
AcknowledgementsThis research received no specific grant from any funding agency in the public,commercial, or not-for-profit sectors.
Author contributionsV.T., J.C.T., A.E., H.R.C.B., B.D.S. and V.C. performed experiments with flow cytometry.H.R.C.B., A.E. and K.E. performed experiments with ELISA and real-time PCR. I.G.performed immunohistochemistry quantification. A.J.T., W.P.K., M.S.A. and H.T.K.performed microarray analysis and critically reviewed the manuscript. M.Q., H.U., F.K.and X.Y. critically reviewed the manuscript. A.E. and H.R.C.B. performed in vivoexperiments. A.V., S.L. and R.El. performed immunohistochemistry experiments. S.G.T.,M.A.de la F. and A.V. helped writing the manuscript. A.E. designed experiments,supervised and directed the work, interpreted data and wrote the manuscript. All authorsdiscussed the results and contributed to the manuscript.
Additional informationSupplementary Information accompanies this paper at http://www.nature.com/naturecommunications
Competing financial interests: The authors declare no competing financial interests.
Reprints and permission information is available online at http://npg.nature.com/reprintsandpermissions/
How to cite this article: Tullius, S. G. et al. NADþ protects against EAE byregulating CD4þ T cell differentiation. Nat. Commun. 5:5101 doi: 10.1038/ncomms6101(2014).
This work is licensed under a Creative Commons Attribution-NonCommercial-NoDerivs 4.0 International License. The images or
other third party material in this article are included in the article’s Creative Commonslicense, unless indicated otherwise in the credit line; if the material is not included underthe Creative Commons license, users will need to obtain permission from the licenseholder to reproduce the material. To view a copy of this license, visit http://creativecommons.org/licenses/by-nc-nd/4.0/
NATURE COMMUNICATIONS | DOI: 10.1038/ncomms6101 ARTICLE
NATURE COMMUNICATIONS | 5:5101 | DOI: 10.1038/ncomms6101 | www.nature.com/naturecommunications 17
& 2014 Macmillan Publishers Limited. All rights reserved.