naclim deliverable d13.38 identification of most relevant ... · it started in ca. 2004. the...
TRANSCRIPT

Page 1
NACLIM Deliverable D13.38
Identification of most relevant ocean mechanisms controlling S2D variability North Atlantic / Arctic Ocean surface Report on identification of most relevant ocean mechanisms controlling the S2D variability of the Arctic/North Atlantic ocean surface state The report will provide and discuss the statistical relationships between the surface state variability and the ocean variability based on a variety of model simulations and reanalyses and on available observations
WP No. 1.3 WP title: Mechanisms of ocean surface state variability
Work duration1) 18 Due delivery deadline: 31 October 2015
Nature of the
deliverable
X R = report
P = prototype
D = demonstrator
O = Other
Dissemination
level
X PU = public
PP = restricted to other programme participants, incl. the Commission services
RE = restricted to a group specified by the consortium, incl. the Commission services
CO = confidential, only for members of the consortium, incl. the Commission services
1) Work duration = project month
Authors of this report
UPMC (lead beneficiary): Marie-Noelle HOUSSAIS, Sally CLOSE, Claude FRANKIGNOUL, Christophe HERBAUT
UHAM Armin KÖHL NERSC Helen LANGEHAUG NACLIM project is financed by the European Commission
through the 7th Framework Programme for Research Theme 6 Environment
Grant Agreement 308299

Page 2
Index 1. Executive summary ......................................................................................................................................... 3
2. Project objectives ........................................................................................................................................... 6
3. Detailed report on the deliverable ................................................................................................................. 7
3.1 Ocean mechanisms responsible for the time evolution and spatial distribution of the sea ice
concentration trends over the satellite period (UPMC) ............................................................................7
3.2 Impact of ocean heat transport on the winter sea ice variability in the Barents Sea (UPMC) ........ 10
3.3 Regime shifts in the Atlantic water circulation in the Arctic-Nordic Seas and their potential impact on
the temperature and sea ice anomalies in the Nordic Seas (UPMC) ..................................................... 12
3.4 Poleward propagation of SST anomalies in CMIP5 models and relation to predictive skill (NERSC) 14
3.5 Impact of oceanic transport variability on the ocean surface state in the GECCO2 Ocean Synthesis
(UHAM) .................................................................................................................................................. 17
3.6 Influence of THE deep oceanic circulation on the climatic impact of the AMOC (UPMC) ............... 20
4. References (Bibliography) ............................................................................................................................. 22
5. Publications .................................................................................................................................................. 24
6. The delivery is delayed: No .................................................................................................................. 25
7. Changes made and difficulties encountered, if any ..................................................................................... 25
8. Efforts for this deliverable ............................................................................................................................ 25
9. Sustainability ................................................................................................................................................. 25
10. Dissemination and uptake activities (May 2014 – October 2015) .............................................................. 26

Page 3
1. Executive summary
Research activities leading to Deliverable 13.38 focused on investigating more particularly the
ocean mechanisms which are involved in the variability of the sea surface temperature (SST) or sea
ice cover (SIC) in the Arctic-North Atlantic domain (as described in D13.19) and their impact on the
atmosphere. The different studies were based on a variety of approaches using information from
ocean and sea ice observations, ocean reanalyses, regional forced ocean-sea ice simulations and
coupled climate models. The different analyses basically addressed two main topics : (i) the
characterization of anomalies in the upper ocean heat content and transport to the Arctic and
their link to the interannual to decadal variability of the Arctic sea ice and northern North Atlantic
SST during the last decades (LOCEAN, NERSC), and (ii) the decadal variability associated with the
Atlantic meridional overturning circulation and its coupling to the North Atlantic SST and Arctic sea
ice cover (UHAM, LOCEAN).
The decadal trends in Arctic sea ice area (SIA) in summer and fall deduced from satellite passive
microwave measurements were found to be highly nonlinear over the satellite period in most of
the Arctic region (to the exception of the central Arctic Ocean) and the spatial patterns associated
with the onset time of this recent acceleration of the decline suggest regionally coherent
responses of the sea ice to ocean or atmosphere forcing mechanisms (Close et al., 2015). The
different regional responses translate into contrasts of up to 20 years between the Atlantic sector
(beginning in 2003) and the much earlier onset times associated with the Pacific sector (beginning
as early as 1992). In certain regions such as the Nansen Basin slope or the Pacific sector of the
Arctic (Chukchi Sea), the onset times of the decline are consistent with an increased influence of a
warmer Atlantic layer (as evidenced by the World Ocean Database observations in the region) or
Pacific water (in agreement with the increase in the Bering Strait heat transport since 2001,
Woodgate et al. 2012), respectively.
The recent decline in Arctic SIA was found to be the largest in the Barents Sea in all seasons where
it started in ca. 2004. The acceleration of the winter decline is a noticeable distinctive feature of
this region compared to others where no onset time could be detected in winter. In this season,
model results suggest that heat content anomalies generated in the Atlantic layer in the western
Barents Sea have a significant impact on SIA anomalies detected a year later in the northern
Barents Sea (through a mechanism of ocean reemergence) but little influence on the sea ice in the
eastern Barents Sea (the separation into two distinct sub-regions of variability of the Barents Sea

Page 4
ice margin has been discussed in D13.19) (Herbaut et al., 2015). This lagged influence of the ocean
was found to be potentially enhanced by an ocean-to-atmosphere feedback which would be
initiated by October SST anomalies in the central Barents Sea. The latter would promote the
formation of meridional wind anomalies conducive of wind-driven SIA anomalies of the same sign
as the ocean-driven anomalies.
As upper ocean heat content or transport anomalies are suspected to control part of the variability
of the sea ice cover in the Atlantic sector of the Arctic, possible northward propagation of surface
temperature (SST) anomalies in the eastern Nordic Seas has been looked for, and some coherent
behaviour along the Atlantic water pathway up to Fram Strait has been identified in both
observations (HadISST dataset) and CMIP5 historical simulations (Langehaug et al., in prep.). The
travel times differ between models but predictive skills of up to 6-8 years were found for
anomalies observed at the entrance of the Nordic Seas. The exact lead time appears to be related
the time lag between changes in the Atlantic Meridional Overturning Circulation (AMOC)
northward transport at 48°N and the Nordic Seas SST. A detailed analysis of the Atlantic water heat
transport in the Nordic Sea based on forced sea ice-ocean simulations has revealed substantial
variability in this transport over the recent decades, and most notably a regime shift characterized
by a loss of coherency of the variability along the AW pathway across the eastern Nordic Seas after
the mid-90’s (Herbaut et al. in prep.). The observed shift appears to be linked to the relative
contributions of the two branches (the slope and the off-shore branches) of the Norwegian
Atlantic Current to the current variability, with some links to the wind-stress which are currently
under investigation.
As expected from the observations, AMOC intensification was found to force a negative NAO
response of the atmosphere in CCSM4 simulations through a meridional dipolar pattern of SST
anomalies. A detailed analysis of the mechanisms responsible for the ca. 7 year delay of the
response revealed the influence of bottom topography and deep ocean dynamics on the surface
state changes through strengthening of the western subpolar gyre and bottom torque at the
crossover of the deep branches of the AMOC with the North Atlantic Current on the western flank
of the Mid-Atlantic Ridge (Frankignoul et al., 2015), a mechanism which could explain the
predictability found for the temperature of the upper oceanic layers in CCSM4 (Branstator et al.
2012).
Page 5
The relation which links the AMOC to the SST variability in the North Atlantic through propagation
of heat content anomalies around the subpolar gyre was confirmed in the GECCO2 reanalysis and
extended to a change of sign in the correlation when the AMOC lags the SST by several years (Kohl,
2015). The change of sign in the correlation with the AMOC depending on the sign of the lag is also
found for the Arctic SIC showing that the AMOC changes reach into the Arctic and affect the sea
ice. The correlation of the transports in the Arctic and Nordic Seas are thus mostly driven by their
relation to the NAO or AO. The latter also mainly drives the relation between the Canadian
Archipelago fresh water export and the convection in the Labrador Sea but the damping effect of
this export on the convection was found to be small (Khöl and Serra, in prep.)

Page 6
2. Project objectives {Standard Input} With this deliverable, the project has contributed to the achievement of the following
objectives (see DOW Section B.1.1):
Nr. Objective Yes No
1 Assessing the predictability and quantifying the uncertainty in forecasts of
the North Atlantic/Arctic Ocean surface state X
2 Assessing the atmospheric predictability related to the North Atlantic/Arctic
Ocean surface state X
3 Monitoring of volume, heat and fresh water transports across key sections in
the North Atlantic X
4 Quantifying the benefit of the different ocean observing system components
for the initialization of decadal climate predictions X
5 Establishing the impact of an Arctic initialization on the forecast skill in the
North Atlantic/European sector X
6 Quantifying the impact of predicted North Atlantic upper ocean state
changes on the oceanic ecosystem X
7 Quantifying the impact of predicted North Atlantic upper ocean state
changes on socioeconomic systems in European urban societies X
8 Providing recommendations for observational and prediction systems X
9 Providing recommendations for predictions of the oceanic ecosystem X
10 Disseminating the key results to the climate service community and relevant
endusers/stakeholders X
11 Constructing a dataset for sea surface and sea ice surface temperatures in
the Arctic X

Page 7
3. Detailed report on the deliverable
3.1 Ocean mechanisms responsible for the time evolution and spatial distribution of the sea ice concentration trends over the satellite period (UPMC) Close et al., Journal of Geophysiscal Research, manuscript in revision.
An objective method has been developed to characterise the year in which Arctic sea ice
concentration undergoes a significant change in state on a point-by-point basis. Whilst existing
regional-based analyses of Arctic sea ice concentration have largely employed the definitions of
Parkinson et al. (1999), these definitions are based on a geographical framework, and it is not clear
that such a basis should also define physically coherent areas. The application of the point-wise
algorithm developed here thus permits an analysis that does not demand any a priori
presumptions with regard to the identification of regional behaviour. One of the aims of this
analysis is thus that spatial patterns in the onset timing of the change in state can be identified;
this permits the formulation of hypotheses regarding the likely forcing mechanisms on a regional
basis, and hence the identification of regions in which it is likely that the ocean has played a
significant role in driving variability, particularly at the decadal scale.
In the following, we base our analysis on the results obtained by applying the method to three-
month seasonal mean data. This decision was taken since results obtained using monthly data are
compatible, and, furthermore, we consider the seasonal results to provide a more stable estimate.
Winter is defined as January-March, spring as April-June, summer as July-September and autumn
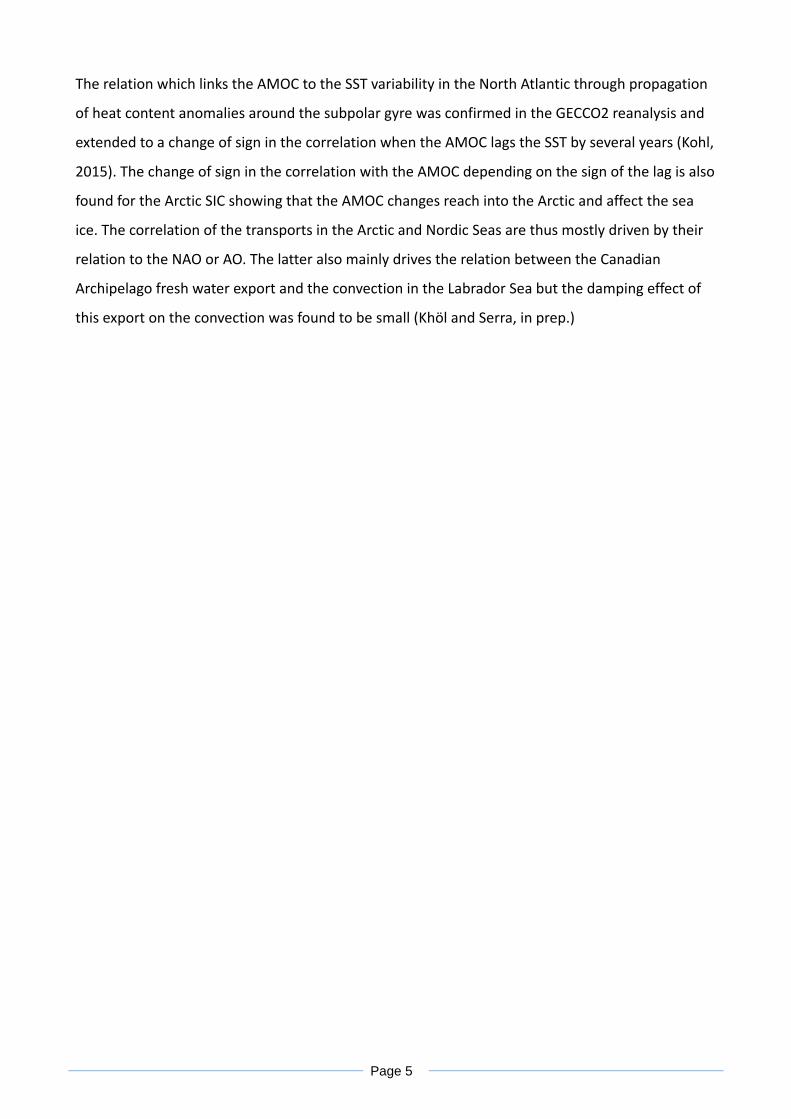
as October-December. Maps of the onset times detected are shown in Figure 3.1.1.
Page 8
Following the production of the maps of onset time, comparison was made with the literature to
assess the compatibility with existing suggestions of mechanisms. Where no compatible existing
mechanisms were suggested in the literature (namely the Barents Sea and the region lying along
the Alaskan coast where the transition year occurs in 1993/6) potential drivers were investigated
using atmospheric and oceanic data. The forcing for the transition in these two regions was not
found to be oceanic in either case, and so will not be discussed further here. For the remaining
regions, through comparison with the literature it was possible to identify potential linkages with
climatic events. These will be discussed below for the regions particularly influenced by the ocean.
In summer (JAS), a spatially coherent band where the transition year is relatively recent (i.e. post-
2009) can be seen spanning the Nansen Basin slope. The form of the time series associated with
this decline (Figure 3.1.2a) is rather unique across the Arctic region, being characterised by an
almost complete, stable ice coverage until the transition point, around 2010, after which loss of >
50% of the ice coverage occurs in less than 5 years. The alignment of this band with the
bathymetry of the slope hints at an oceanic influence in the transition. In support of this idea, the
spreading of the warming Atlantic Water (AW) signal along the continental margins has been
Page 9
reported by several studies (Schauer et al. 2004, Dmitrenko et al, 2008). Further, it has been
suggested that upward transport of heat from the warming subsurface Fram Strait AW branch
could play a role in controlling ice loss (Polyakov et al., 2010, 2011a, 2011b). It is noted in these
studies that this mechanism would be particularly applicable under weakening stratification, such
as that suggested by recent changes in the Eurasian Basin, where upper layer salinification
associated with a changing balance between the freshwater content distribution of the Canada
and Eurasian Basins (Morison et al, 2012) in conjunction with the warming of the inflowing AW
would combine to create these conditions.
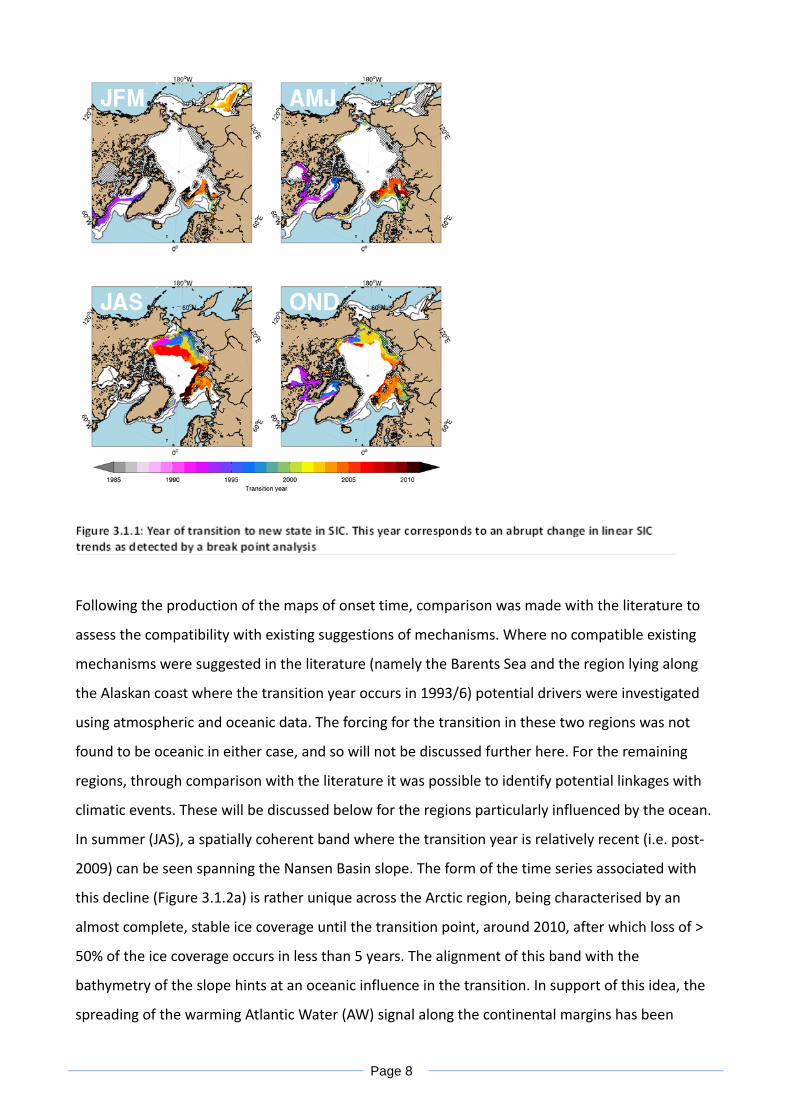
To investigate this link further, CTD, XCTD and XBT data have been extracted from the World Ocean
Database (Boyer et al, 2013). Only data with a quality flag of “good” are used, and a region is
chosen extending from 10-40°E, 80-82°N, covering the eastern part of the slope, where the data
volume is the most dense. Profiles containing a clear signal of the subsurface maximum associated
with AW are selected using a gradient criterion over the range 100-750m. The analysis is rather
crude, since all data over the region are simply averaged with no regard for spatial variability, and
our aim here is not to prove a substantive cause for the recent SIC variability, but simply to
examine whether oceanic conditions are compatible with the extreme ice loss noted here. Figure
3.1.2b shows the Hovmöller plot that results from this analysis, and hints at an increased presence
of warm water in the upper 400m of the water column that is coincident with the rapid decline in
SIC after 2010. Whilst a decrease in SIC might equally be a cause of increased upper ocean
temperature, rather than an effect, the timing of the increase in temperature precedes the most
rapid decline in ice coverage, with the SIC being > 90% in 2010, decreasing rapidly to 75% in 2011
(and continuing this decline in 2012). These results are further compatible with previous work by
Figure 3.1.2: (a) time series of summer SIC averaged along Nansen Basin slope. Red dot indicates the calculated transition time. (b) Hovmöller plot of temperature from WOD data over 10-40°E, 80-82°N over 2008-2013

Page 10
Alexeev et al. (2013) and Tverberg et al. (2014) who note a local relationship between AW and sea
ice in adjoining regions.
We hypothesize that the ocean may also play an influence in the Pacific sector, where the large
region spanning the Chukchi Sea and having a transition year ca. 2001 is compatible with mooring
results presented in Woodgate et al (2010) showing an increase in annual mean heat transport at
this time. However, this relationship has not yet been investigated in detail. A further influence of
the ocean appears to be in evidence in the Baffin Bay / Labrador Sea region, and forms the basis of
ongoing work.
3.2 Impact of ocean heat transport on the winter sea ice variability in the Barents Sea (UPMC) Herbaut et al., Deep-Sea Research, manuscript accepted
As described in deliverable 19, the sea ice concentration (SIC) in the Barents Sea is characterized by
two modes of variability: the northern mode is associated with the expansion/retreat of the
northern ice edge, while the eastern mode describes the variations of the SIC in the southeastern
Barents Sea. The northern mode emerges in response to northwesterly wind anomalies which
favor the export of ice and surface polar water from the Arctic between Svalbard and Franz Josef
Land. Atlantic Water temperature anomalies, formed concomitantly with northerly wind anomalies
in the western Barents Sea, also influence the northern mode in the following winter. The
regression of the winter SIC onto these temperature anomalies (fig 3.2.1) suggests that the
delayed influence of the ocean on the sea ice is found primarily in the northeastern Barents Sea
and occurs through the re-emergence of the Atlantic water temperature anomalies at the surface
in the following fall and winter.
October surface warming in the central Barents Sea, which are associated with a sea ice retreat,
might also initiate an ocean-to-atmosphere feedback which is hypothesized to enhance the sea ice
response in the northern Barents Sea by promoting the formation of meridional wind anomalies.
According to this scenario, warmer surface waters in October would drive a surface atmosphere
warming (Fig. 3.2.2a) and a decrease of the SLP (Fig. 3.2.2b) over the same region, the latter
extending over Eurasia in October-November. While the SAT anomaly pattern persists and
intensifies over the following winter (fig 3.2.2c), the SLP anomaly pattern switches sign (Fig.
3.2.2d). This evolution of the SLP from autumn to winter would be consistent with the
atmospheric response to sea ice retreat described by Jaiser et al (2012) in which the evolution of

Page 11
the SLP anomalies was attributed to a change from a baroclinic response of the atmosphere in
autumn to a barotropic one in winter. In our analysis, the DJF SLP anomalies trigger wind
anomalies with a dominant northward component which would reinforce the sea ice retreat in the
northwestern Barents Sea.
Figure 3.2.1: regression of the SIC at +12 months onto the winter AW temperature in the western Barents Sea.

Page 12
Figure 3.2.2 : Regression onto the October SST (from ERA-I dataset) in the central Barents Sea of (a) the October-
November SAT (in °C), (b) the SAT in the following DJF, (c) the October-November SLP (in hPa), (d) the SLP in the
following DJF. Black contours denote the 95% significance level.
3.3 Regime shifts in the Atlantic water circulation in the Arctic-Nordic Seas and their potential impact on the temperature and sea ice anomalies in the Nordic Seas (UPMC) Christophe Herbaut, Marie-Noelle Houssais and Sally Close, manuscript in preparation
The recent decline in the Arctic Sea ice cover has increased the attention paid to the effect of
Atlantic water (AW) on the sea ice variability. For example, in the Barents Sea, the
expansion/retreat of the sea ice edge has been linked either to AW temperature anomalies in the
western Barents Sea (Schlichtholz, 2011, Herbaut et al., 2015) or to the variations in AW heat
inflow (Årthun et al., 2012, Sandø et al., 2014) at BSO. In order to better understand the origin of
anomalies of the AW heat transport to the Arctic which potentially affect the sea ice, we

Page 13
investigated the variability of the AW circulation upstream in the Nordic Seas. Being fed by the
inflow through the Greenland Scotland Ridge, the AW flows poleward along the Norwegian coast
in two veins (Orvik and Niiler, 2002): the Norwegian Atlantic Slope Current (NwASC), which follows
the Norwegian shelf edge (Andersson et al., 2011), and the Norwegian Atlantic Front Current
(NwAFC), farther offshore and coinciding with the polar front (fig 3.3.1a). At the Barents Sea
Opening (BSO), the AW current separates into two branches: one bifurcates eastwards into the
Barents Sea, while the other flows northward to form the West Spitzbergen Current (WSC). Based
on currentmeter measurements, which started after 1995, various studies (Skagseth et al. 2008,
Richter et al., 2009) have examined the covariability between the branches of the AW. Weak co-
variabitily is found between the inflow through the Faroe Shetland Channel and the NwASC
(Richter al., 2009) on one hand, and between the NwASC and the AW inflow through BSO
(Skagseth et al., 2008), on the other hand. Using a regional ocean-sea ice coupled model, we
extended the previous analyses to the period 1979-2012. Analyzing mean winter data, a regime
shift in the variability of the AW circulation is detected in 1995. Before 1995, the first mode of
variability in the NwAC is associated with the variations in the slope current (fig 3.3.1b). These
variations highly correlate upstream with the AW inflow through the Faroe-Shetland Channel (FSC),
and downstream with the AW inflow in the Barents, describing a large scale pattern of circulation
anomalies linking altogether the NwASC, the AW inflow into the Barents Sea, the outflow to the
Arctic through the Barents Sea Exit and the West Spitsbergen Current (fig 3.3.2a). This circulation
emerges when the dominant mode of variability of the wind is characterized by strong
southwesterly wind anomalies along the Norwegian coast (fig 3.3.2b), and a large-scale wind curl
extending into Barents Sea. After 1995, the period 1996-2012 is characterized by a reduction of the
northeastward wind anomalies (fig 3.3.2d), the variations in the NwAFC then dominate the
variability of the NwAC (fig 3.3.1c), and the correlations between the NwASC and the inflow at FSC
on one hand, and the AW inflow at BSO on the other hand are reduced. In the northern Nordic
Seas, the dominant mode of variability appears to be more local and linked with the variations of
the westward outflow branch in northern BSO and, farther downstream, the current anomalies
along the shelf break to the west of Svalbard (fig 3.3.2c).

Page 14
Figure 3.3.1: (a) Mean simulated normal velocity at the Svinoy section. (b) EOF1 of the normal velocity at the Svinoy
section for the period 1979-1995. (c) same as (b) for the period 1996-2012.
Figure 3.3.2: (a) Regression of the circulation at 130 meters onto the outflow to the Arctic at the Barents Sea Exit for the period 1979-1995. (b) Eof1 of the 10 m wind for the period 1979-1995. (c) same as (a) for the period 1995-2012. (d) same as (b) for the period 1995-2012.
3.4 Poleward propagation of SST anomalies in CMIP5 models and relation to predictive skill (NERSC) Helene R. Langehaug (NERSC) and Marius Årthun (UiB, also part of the EPOCASA project), work in
progress.
In order to better understand the predictive skill on longer lead times in the eastern Nordic Seas –
along the pathway of Atlantic Water, we have investigated whether there is a northward
propagation of SST anomalies or not in historical experiments with three CMIP5 models. If
propagation exists, characteristics of the simulated propagation are compared with HadISST data.

Page 15
The method that has been used is the Complex Principal Component (CPC) analysis (e.g., Horel,
1984; Årthun and Eldevik, in review in Journal of Climate), which objectively detects travelling
waves in time series from selected stations.
Six stations were selected between the northeastern North Atlantic (outside Ireland) and to the
Fram Strait (see map in Figure 3.4.1). The SST time series from the stations were filtered by a 3-20
years band pass filter (energy on time scales less than 3 years and more than 20 years is removed
from the time series) before using the time series as input to the CPC analysis. The analysis shows
that two of the models have a continuous propagation of SST anomalies from the southernmost to
the northernmost station (Figure 3.4.1; the two central panels). The third model shows a
discontinuity in the propagation about halfway into the Nordic Seas (Figure 3.4.1; the last panel).
This could be due to two separate circulations schemes in the southern and northern part of the
Nordic Seas in this model.
The period of the SST anomalies, or how often SST anomalies occur along the stations, vary with
time, but appears to stabilize towards the end of the time period. If we calculate the travel time for
each model at the end of the time period, we find that, among the two models with continuous
propagation, one model has similar travel time with HadISST data (~2yrs) and the other has longer
travel time (~4.5yrs). Both of the models also have predictive skill in the eastern Nordic Seas on
longer lead times. This means that although the SST anomalies travel slower in one of the models,
there is predictive skill along the pathway of Atlantic Water. This could be related to the predictive
skill being calculated as a 3-yr average for each lead time, smearing out the SST signal. It is
important to note that although the SST anomalies are detectable all the way from the subpolar
region to the Fram Strait, we do not necessarily find predictive skill at all locations (such as in the
subpolar region for the slow model). Why this is so, remains to be investigated. In the third model,
where the SST signal does not travel continuously, there is no predictive skill north of the
discontinuity.
The three models also differ in when (or at which lead time) predictive skill is found at the
entrance of the Nordic Seas; which occurs at lead time 2-4yrs, 4-6yrs, and 6-8yrs, respectively. This
indicates that the skill in the different models is related to different SST anomalies in the HadISST
data. It appears that the timing is related to the time lag between the changes in AMOC at 48°N

Page 16
(i.e., integrated northward transport into the subpolar region) and changes in SST in the
northeastern Nordic Seas.
The above is based on preliminary results, and there are several things that need to be tested to
investigate the robustness of the results, such as: do a similar analysis for sea surface salinity,
include all ensemble members in the analysis, test sensitivity to filtering of the time series and
location of the stations, and include more models in the analysis. Furthermore, it would also be
interesting to investigate the relationship between the occurrence of SST anomalies and the
variability of the Subpolar Gyre strength, the North Atlantic Oscillation, and the volume and heat
transport across the Greenland-Scotland Ridge.
Figure 1.4.1. A complex principal component analysis is applied to detect northward propagation of SST anomalies
along the Atlantic Water pathway in the Nordic Seas. The upper panel shows the first mode based on HadISST data
(explaining 66% of the total variance in the full dataset of six time series), whereas the three other panels show the
similar analysis for three CMIP5 models. The unity of the colorbar is standardized anomalous SST.

Page 17
3.5 Impact of oceanic transport variability on the ocean surface state in the GECCO2 Ocean Synthesis (UHAM) Armin Köhl and Nuno Serra (manuscript in preparation)
The impact of variability of transports through major passages including the overturning transport
was estimated from the GECCO2 ocean synthesis (Köhl 2015), which has been completed in 2014
and was updated since then. We analyzed annual mean data after detrending. The Davis Strait
volume transport was shown by Köhl and Serra (2014) to determine the exchange of freshwater
between Arctic and North Atlantic and to be in phase with the Arctic Oscillation (AO) index. Since
the AO and the North Atlantic Oscillation NAO indices are highly correlated, the correlation of the
Davis Strait transport to the SST in the North Atlantic reveals the typical tripolar pattern (note the
transports are counted positive if northward) as it was shown e.g. by Czaja and Frankignoul (1999)
for the NAO (Fig. 3.5.1). The associated export of fresh water from the Arctic is therefore in phase
with the atmospheric conditions that favor deep convection. The exchange of freshwater between
Atlantic and Arctic thus damps the AMOC response to the NAO type of forcing. Köhl and Serra
(manuscript in preparation) demonstrate the damping by selectively turning the freshwater
transport anomalies through the Canadian Arctic Archipelago (CAA) off. However, these
experiments reveal that, differently from what has been previously suspected, the influence of the
freshwater transport through the CAA is very small.
Fig. 3.5.1 : Correlation Davis Strait transport (the only opening between the Arctic and North Atlantic of the Canadian Archipelago in GECCO2) and SST.

Page 18
Fig 3.5.2: (left) Correlation Denmark Strait overflow and sea ice concentration. (Right) Faroe Bank overflow and sea
ice concentration (overflow lagging by 5 years)
The correlation of the Denmark Strait overflow (DSO, counted negative southward) to the sea ice
concentration shows large correlation to the sea ice concentration in the Beaufort Gyre and
smaller correlation to the concentration in the East Greenland current and Labrador Current (Fig.
3.5.2). The overflow though Faroe bank (FBO) shows similar (but slightly higher) correlation with
the sea ice concentration. However, while the lagged correlation is lower for the DSO the
correlation is largest for FBO lagging by 5 years, which may suggest a much slower pathway from
water formation region to the overflow for the FBO.
Fig. 3.5.3 : Correlation between Denmark Strait overflow and (left) SST or net heat flux (right) at lag 0
The correlation to the SST suggests that atmospheric conditions in the Arctic and Nordic Sea
leading to colder temperature and larger sea ice concentration are also affecting the dense water
formation north of the ridges, particularly in the Iceland Sea (Fig. 3.5.3). An almost identical
correlation to SST exists for FBO (not shown), which shows that these conditions are important for
driving the strength of both overflows.

Page 19
The circulation around Greenland was shown to be wind driven and can be explained by the AO
variability (Köhl and Serra, 2014). As part of this circulation, the Fram Strait transports is roughly in
anti-phase with the transport through the CAA and shows thus at zero lag a similar but less clear
tripolar pattern of correlation to the SST, albeit with opposite sign (not shown). However, the Fram
Strait transport shows negative correlation to the SST over the entire North Atlantic roughly 10
years after and positive correlations roughly 13 years before (Fig.3.5.4).
Fig. 3.5.4: Correlation Fram Strait Transport and SST (left, transport leading 10 years and right, lagging by 13 years).
The propagation of SST anomalies in the subpolar gyre was found from observations by Curry et al.
(1998). The relation of the propagation of heat content anomalies to the AMOC variability in the
North Atlantic was suggested by Häkkinen (2001). From the GECCO2 synthesis this relation can be
confirmed for SST (not shown) along with this propagation a similar change in correlation from
negative to positive is observed for the change from similar negative to positive lags . The
correlation of the transports in the Arctic and Nordic Seas are thus mostly driven by the relation of
the transports to the AO or NAO. The delayed impact of the AMOC changes reach into the Arctic
and affect the sea ice concentration. Along with the change of the SST correlation from negative to
positive, a similar change in correlation with opposing sign can be observed for the sea ice
concentration in the Arctic (Fig. 3.5.5)

Page 20
Fig. 3.5.5 Correlation between AMOC at 25 N and sea ice concentration( left, leading by 5 years) (right, lagging by 14
years).
3.6 Influence of THE deep oceanic circulation on the climatic impact of the AMOC (UPMC) Frankignoul et al., Journal of Climate, 2015 : Wen et al., manuscript submitted to Climate dynamics
The statistical relationships between the surface state changes that most influence the atmosphere
on interannual to decadal time scales and ocean variability have primarily been investigated in
CCSM4, a state-of-the-art CMIP5 climate model, which shows a response to decadal AMOC
changes that is broadly consistent with what is inferred from the observations, namely a negative
NAO response during winter following an AMOC intensification (Frankignoul et al. 2015). In
CCSM4, the atmospheric response to the AMOC lags by about 7 years. The delay is due to the
cyclonic propagation along the North Atlantic Current (NAC) and the subpolar gyre of a SST
warming linked to a northward shift and intensification of the NAC, together with an increasing SST
cooling linked to increasing southward advection of subpolar water along the western boundary
and a southward shift of the Gulf Stream (GS). They result in a meridional SST dipole, which follows
the AMOC intensification after 6 or 7 years (Fig. 3.6.1). The SST changes were initiated by the
strengthening of the western subpolar gyre and by bottom torque at the crossover of the deep
branches of the AMOC with the NAC on the western flank of the Mid-Atlantic Ridge and the GS
near the Tail of the Grand Banks, respectively. This stresses the influence of bottom topography
and ocean dynamics on the surface state changes that most influence the atmosphere, and could
explain the predictability found for the temperature of the upper oceanic layers in CCSM4
(Branstator et al. 2012). A similar analysis is being conducted for the IPSL-CM5MR model (Wen et
al., submitted).

Page 21
Figure 3.6.1. Regressions of JFM SST (color, in K) in all panels and (left panels only) oceanic barotropic stream
function (black contours, dashed for cyclonic flow, contour interval 0.2 Sv, zero-line omitted) onto the AMOC time
series from the Maximum Covariance Analysis when AMOC leads the NAO by 7 years, lagging it by 0 to 12 yr, as
indicated. Hence, the atmospheric response was detected around lag 7. The green line indicates the mean Gulf
Stream-North Atlantic Current path, and the thick grey line the sea-ice edge. The thin contours in each right panel
show the mean barotropic stream function (contour interval 10 Sv, zero-line omitted). From Frankignoul et al.
(2015).

Page 22
4. References (Bibliography)
Alexeev, V. A., V. V. Ivanov, R. Kwok, and L. H. Smedsrud. North atlantic warming and declining volume of arctic sea ice.
The Cryosphere Discussions, 7(1):245–265, 2013.
Boyer, T., J. I. Antonov, O. K. Baranova, C. Coleman, H. E. Garcia, A. Grodsky, D. R. Johnson, R. A. Locarnini, A. V.
Mishonov, T. O’Brien, C. Paver, J. Reagan, D. Seidov, I. V. Smolyar, and M. M. Zweng. World ocean database 2013. In
S. Levitus, editor, NOAA Atlas NESDIS 72, page 209. Silver Spring, MD, 2013.
Branstator, G., Teng, H., Meehl, G. A., Kimoto, M., Knight, J. R., Latif, M., & Rosati, A. Systematic estimates of initial-
value decadal predictability for six AOGCMs. Journal of Climate, 25(6), 1827-1846, 2012.
Close, S., M-N. Houssais and C. Herbaut. Regional dependence in the timing of onset of rapid decline in Arctic sea ice
concentration. J. Geophys. Res. 2015, in revision.
Curry, R. G., M. S. McCartney, and T. M. Joyce. Oceanic transport of subpolar climate signals to mid-depth subtropical
waters. Nature 391.6667: 575-577, 1998.
Czaja, A., and C. Frankignoul. Influence of the North Atlantic SST on the atmospheric circulation. Geophysical Research
Letters 26.19:2969-2972, 1999.
Dmitrenko, I. A., I. V. Polyakov, S. A. Kirillov, L. A. Timokhov, I. E. Frolov, V. T. Sokolov, H. L. Simmons, V. V. Ivanov, and D.
Walsh. Toward a warmer arctic ocean: Spreading of the early 21st century atlantic water warm anomaly along the
eurasian basin margins. Journal of Geophysical Research: Oceans, 113(C5), 2008.
Frankignoul, C., G. Gastineau, and Y.-O. Kwon: Wintertime atmospheric response to North Atlantic ocean circulation
variability in a climate model. J. Climate, 28, 7659-7677.
Häkkinen, S.: Variability in sea surface height: A qualitative measure for the meridional overturning in the North
Atlantic. Journal of Geophysical Research: Oceans (1978–2012) 106.C7: 13837-13848, 2001.
Herbaut, C., M.-N. Houssais, S. Close and A.-C. Blaizot, 2015 : Two wind-driven modes of winter sea ice variability in
the Barents Sea. Deep-Sea Res. 2015, In press.
Köhl, A., and N. Serra: Causes of decadal changes of the freshwater content in the Arctic Ocean. Journal of Climate
27.9: 3461-3475, 2014.
Köhl, A.: Evaluation of the GECCO2 ocean synthesis: transports of volume, heat and freshwater in the Atlantic.
Quarterly Journal of the Royal Meteorological Society 141.686: 166-181, 2015.
Morison, J., R. Kwok, C. Peralta-Ferriz, M. Alkire, I. Rigor, R. Andersen, and M. Steele. Changing arctic ocean freshwater
pathways. Nature, 481(7379):66–70, 01 2012.
Parkinson, C. L., D. J. Cavalieri, P. Gloersen, H. J. Zwally, and J. C. Comiso. Arctic sea ice extents, areas, and trends,
1978–1996. Journal of Geophysical Research: Oceans, 104(C9):20837–20856, 1999.
Polyakov, I. V., V. A. Alexeev, I. M. Ashik, S. Bacon, A. Beszczynska-M ̈oller, E. C. Carmack, I. A. Dmitrenko, L. Fortier, J.-C.
Gascard, E. Hansen, J. H ̈olemann, V. V. Ivanov, T. Kikuchi, S. Kirillov, Y.- D. Lenn, F. A. McLaughlin, J. Piechura, I.
Repina, L. A. Timokhov, W. Walczowski, and R. Woodgate. Fate of early 2000s arctic warm water pulse. Bulletin of
the American Meteorological Society, 92(5):561– 566, 2014/11/04 2011a.
Polyakov, I. V., A. V. Pnyushkov, R. Rember, V. V. Ivanov, Y. D. Lenn, L. Padman, and E. C. Carmack. Mooring-based
observations of double-diffusive staircases over the laptev sea slope*. Journal of Physical Oceanography, 42(1):95–
109, 2014/06/02 2011b.

Page 23
Polyakov, I. V., L. A. Timokhov, V. A. Alexeev, S. Bacon, I. A. Dmitrenko, L. Fortier, I. E. Frolov, J.-C. Gascard, E. Hansen, V.
V. Ivanov, S. Laxon, C. Mauritzen, D. Perovich, K. Shimada, H. L. Simmons, V. T. Sokolov, M. Steele, and J. Toole.
Arctic ocean warming contributes to reduced polar ice cap. Journal of Physical Oceanography, 40(12):2743–2756,
2014/11/04 2010.
Schauer, U., E. Fahrbach, S. Osterhus, and G. Rohardt. Arctic warming through the fram strait: Oceanic heat transport
from 3 years of measurements. Journal of Geophysical Research: Oceans, 109(C6), 2004.
Tverberg, V., O. A. Nøst, C. Lydersen, and K. M. Kovacs. Winter sea ice melting in the Atlantic water subduction area,
Svalbard Norway. Journal of Geophysical Research: Oceans, 119(9):5945–5967, Systematic Estimates of Initial-Value
Decadal Predictability for Six AOGCMs
Page 24
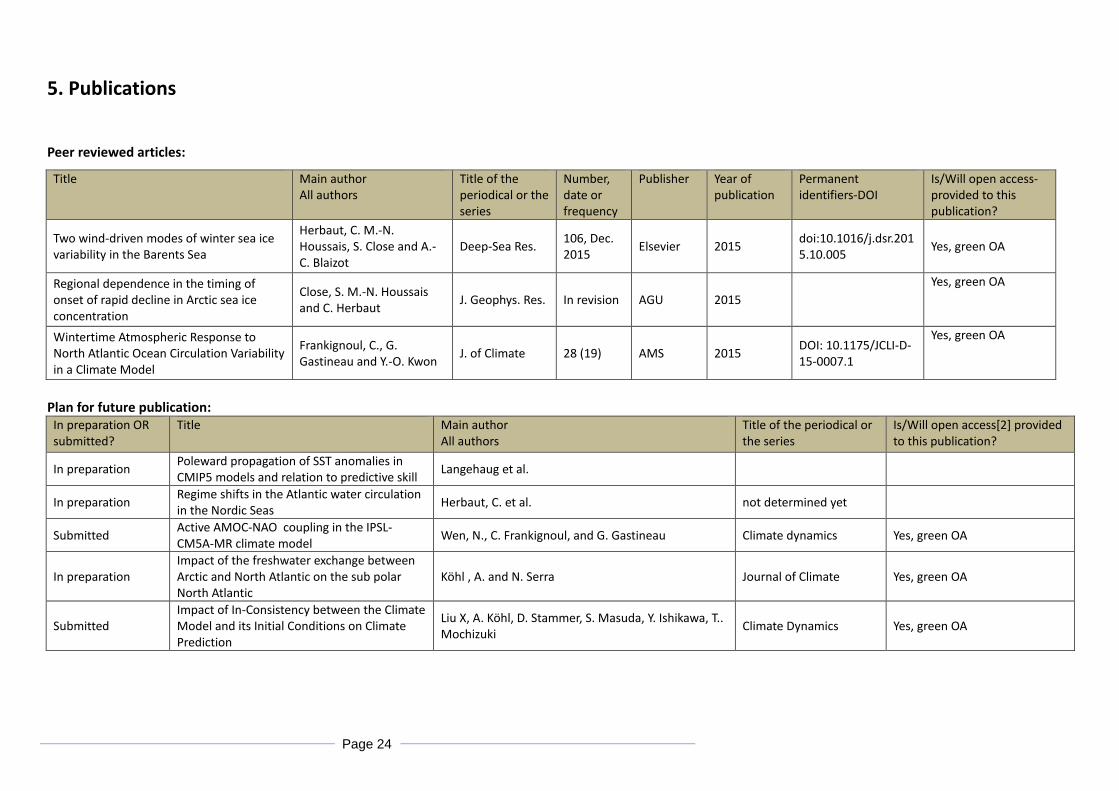
5. Publications
Peer reviewed articles:
Title Main author All authors
Title of the periodical or the series
Number, date or frequency
Publisher Year of publication
Permanent identifiers-DOI
Is/Will open access-provided to this publication?
Two wind-driven modes of winter sea ice variability in the Barents Sea
Herbaut, C. M.-N. Houssais, S. Close and A.-C. Blaizot
Deep-Sea Res. 106, Dec. 2015 Elsevier 2015 doi:10.1016/j.dsr.201
5.10.005 Yes, green OA
Regional dependence in the timing of onset of rapid decline in Arctic sea ice concentration
Close, S. M.-N. Houssais and C. Herbaut J. Geophys. Res. In revision AGU 2015
Yes, green OA
Wintertime Atmospheric Response to North Atlantic Ocean Circulation Variability in a Climate Model
Frankignoul, C., G. Gastineau and Y.-O. Kwon J. of Climate 28 (19) AMS 2015 DOI: 10.1175/JCLI-D-
15-0007.1
Yes, green OA
Plan for future publication:
In preparation OR submitted?
Title Main author All authors
Title of the periodical or the series
Is/Will open access[2] provided to this publication?
In preparation Poleward propagation of SST anomalies in CMIP5 models and relation to predictive skill Langehaug et al.
In preparation Regime shifts in the Atlantic water circulation in the Nordic Seas Herbaut, C. et al. not determined yet
Submitted Active AMOC-NAO coupling in the IPSL-CM5A-MR climate model Wen, N., C. Frankignoul, and G. Gastineau Climate dynamics Yes, green OA
In preparation Impact of the freshwater exchange between Arctic and North Atlantic on the sub polar North Atlantic
Köhl , A. and N. Serra Journal of Climate Yes, green OA
Submitted Impact of In-Consistency between the Climate Model and its Initial Conditions on Climate Prediction
Liu X, A. Köhl, D. Stammer, S. Masuda, Y. Ishikawa, T.. Mochizuki Climate Dynamics Yes, green OA

Page 25
6. The delivery is delayed: No
7. Changes made and difficulties encountered, if any None
8. Efforts for this deliverable Please estimate how many person-months have been used up for this deliverable
Partner Person-months Period covered
UPMC 30 1 May 2014 - 31 October 2015
UHAM 9 1 May 2014 - 31 October 2015
Total 39
Total estimated effort for this deliverable (DOW) was 39 person-months. The names of the scientist involved are
mentioned on the cover page of this report.
9. Sustainability Lessons learnt: both positive and negative that can be drawn from the experiences of the work to date
and
Links built with other deliverables, WPs, and synergies created with other projects
During the second period, links have been built with partners in WP11 and WP12 while addressing the
question of the predictive skill of sea surface temperature anomalies (work by NERSC partner) or sea ice
anomalies in relation to Atlantic water temperature anomalies or Atlantic multidecadal variability (work by
UPMC partner) and overturning circulation (work by UHAM partner). Intercomparison of results based on
multiple simulations and tools contribute to better assessment of the reliability of the model simulations
Links have also been established with CT2 partners with the aim to implement model-observations
intercomparison in key ocean regions. Pr. Svein Osterhus, from University of Bergen, has visited UPMC in
2015 for one month on an invited professorship grant to build collaboration on the validation of the UPMC-
LOCEAN Arctic-North Atlantic model using transport observations in the Greenland Scotland Ridge.
UPMC maintains strong collaboration with the FAMOS (Forum for Arctic Modelling and Observational
Synthesis) initiative led by US partners on activities closely related to NACLIM : Arctic ocean variability in
model and observations, model improvements and model-observation intercomparison.

Page 26
10. Dissemination and uptake activities (May 2014 – October 2015) Indicate here which type of activities from the following list: Publications, conferences, workshops, web, press releases, flyers, articles published in the popular press,
videos, media briefings, presentations, exhibitions, thesis, interviews, films, TV clips, posters, Other.
Indicate here which type of audience: Scientific Community (higher education, Research), Industry, Civil Society, Policy makers, Medias ('multiple choices' is possible.
Type of
activities
Main leader Title (+website reference) Date Place Type of audience Size of
audience
Countries
addressed
Poster Sally Close
(UPMC)
Large-scale patterns of Arctic sea ice variability and links to climatic forcing: a model / observation comparison http://www.ice-arc.eu/event/6th-international-workshop-on-sea-ice-modelling-and-data-assimilation/
September 15-
16, 2014
6th international workshop on
Sea Ice Modelling and Data
Assimilation. Toulouse, France
Research
community
40 International
Presentation Christophe
Herbaut (UPMC)
Atlantic water transports to the Arctic
and their impact on sea ice
October 15-
16, 2014
NACLIM General Assembly
Berlin, Germany
Scientists 50 Europe
Presentation Christophe
Herbaut (UPMC)
Variability of the sea ice in the Barents Sea
http://naclim.zmaw.de/Almada-2015.3219.0.html
September 30
- October 2,
2015
NACLIM General Assembly
Almada, Portugal
Scientists and
end-users
50 Europe
Poster Marie-Noelle
Houssais
(UPMC)
Atlantic water transports to the Arctic from hindcast
simulations http://web.whoi.edu/famos/workshop-3-2014/
October 21-
23, 2014
FAMOS 3rd annual workshop
Falmouth, USA
Research
community
80 International
Poster Christophe
Herbaut (UPMC)
Origin and fate of the AW anomalies in the Arctic
from tracer experiments
http://web.whoi.edu/famos/workshop-3-2014/
October 21-
23, 2014
FAMOS 3rd annual workshop
Falmouth, USA
Research
community
80 International

Page 27
{Additionally Standard Input}
The complete list of dissemination activities is also available on the NACLIM website @ http://naclim.zmaw.de/Dissemination.2509.0.html as well as the ECAS portal –
RP: section “List of Dissemination Activities”.
Uptake by the targeted audience: according to the DOW, your audience for this deliverable is:
The general public (PU)
X The project partners, incl. the Commission services (PP)
A group specified by the consortium, incl. the Commission services (RE)
This reports is confidential, only for members of the consortium, incl. the Commission services (CO)
The results described in section 3 have been presented to the project partners during the NACLIM annual project meetings and also have been/will be documented in
the periodic project reports. The actual module data run is not visible on NACLIM’s website, they can be made available upon request. Please refer to the data policy of
the project at http://naclim.zmaw.de/Data-Management.2387.0.html.