naca research memorandum · 2014-07-15 · naca em l52d23a national advisory committee for...
TRANSCRIPT
Copy 91 - RM L52D23a
NACA
RESEARCH MEMORANDUM CLASSIFICATION CHANGED TO_____________________
BY AUTHORITY
ONM/ OF
A THEORETICAL AND EXPERIMENTAL INVESTIGATION OF THE LIFT
AND DRAG CHARACTERISTICS OF A HYDROFOIL AT
SUBCRITICAL AND SUPERCRITICAL SPEEDS
By KennethL. Wadlin, Charles L. Shuford, Jr. and John R. McGehee
Langley Aeronautical Laboratoryv a.
ENGINEERING DEPT LIBRARY CIIANC VOUCH
A DALLAS, TEXAS
This material contains information altec; of the Uiste Otes aitbn the rr.nthng of the espionage laws, Title 18, U.S.C. .5:1 '4, nmomisslon or revelation :1 shieS in any tanner to an unauthorized person Is p lAW.
NATIONAL ADVISORY COMMITTEE FOR AERONAUTICS
WASHINGTON July 14, 1952
https://ntrs.nasa.gov/search.jsp?R=19930087216 2020-04-04T18:03:17+00:00Z
NACA EM L52D23a
NATIONAL ADVISORY COMMITTEE FOR AERONAUTICS
RESEARCH MEMORANDUM
A THEORETICAL AND EXPERIMENTAL INVESTIGATION OF THE LIFT
AND DRAG CHARACTERISTICS OF A HYDROFOIL AT
SUBCRITICAL AND SUPERCRITICAL SPEEDS
By Kenneth L. Wadlin, Charles L. Shuford, Jr. and John R. McGehee
SUMMARY
A theoretical and experimental investigation was made of the effect of the free-water surface and rigid boundaries on the lift and drag of an aspect-ratio-10 hydrofoil at both subcritical and super-critical speeds. The experimental investigation was made in Langley tank no. 1 and Langley tank no. 2 at 0.84 and 3.84 chords submergence at subcavitation speeds from 5 to 45 feet per second corresponding to Reynolds numbers from 0.18 x 10⁶ to 1.64 x i6.
Approximate theoretical solutions for the effects of the free-water surface and rigid boundaries on lift and drag at supercritical speeds are developed. An approximate theoretical solution for the effects of these boundaries on drag at subcritical speeds is also presented. The agreement between theory and experiment at both super-critical and subcritical speeds is satisfactory for engineering calculations of hydrofoil characteristics from aerodynamic data.
The experimental investigation indicated no appreciable effect of the limiting speed of wave propagation on lift-curve slope or angle of zero lift. It also showed that the increase in drag as the critical speed is approached from the supercritical range is gradual. This result is contrary to the abrupt increase at the critical speed pre-dicted by theory.
INTRODUCTION
Airfoils. and hydrofoils operate in fluids which differ principally in density and viscosity, properties that are readily treated by the concept of Reynolds number. Since such is true, the vast amount of
2 NACA RM L52D23a
aerodynamic data already accumulated becomes available for use in predicting hydrofoil characteristics. However, the airfoil generally operates in an essentially infinite medium, whereas hydrofoil applica-tions usually require operation in a limited medium, that is, in the proximity of the water surface. Aside from the effects of cavitation then, the principal difference between airfoil and hydrofoil applica-
tions is one of boundaries.
In restricted areas such as shallow harbors, canals, and towing tanks other boundaries are present besides the water surface, that is, the bottom and sides. Naturally these boundaries also influence the characteristics of a hydrofoil and their effects must be evaluated to use aerodynamic data for the prediction of the characteristics of
hydrofoils under such conditions.
In addition to the reflective influence of the bottom and sides the finite depth of water limits the speed of propagation of the transverse waves generated by the hydrofoil. This change in flow causes the lift and drag characteristics to be different at speeds below this limiting or "critical speed" than they are above it.
In the present paper available aerodynamic and hydrodynamic theories have been applied to develop an approximate method of eval-uating the influence of boundaries in order to apply existing aero-dynamic data to hydrofoils and to correct properly data obtained in, towing tanks to actual open-water conditions.
Experimental data were obtained in two water depths at two depths of submergence at both subcritical and supercritical. speeds and com-pared with aerodynamic data corrected for the boundaries. The boundary-correction methods employed are similar to the general methods used in wind-tunnel research with the additional consideration that the limiting speed of wave propagation is taken into account.
SYMBOLS
L lift of the hydrofoil, lb
L1 lift at infinite submergence, lb
L2 lift at finite submergence, lb
D drag, lb
Dl drag at infinite submergence, lb
c__.___
3____________ MIJMFI-
D2 drag at finite submergence, lb
wave drag, lb
CL lift coefficient,qS
L1 C L 1 lift coefficient at infinite submergence, -
qS
L2 C lift coefficient at finite submergence, L2 qS
CD drag coefficient,, D
CD1 drag coefficient at infiniteD1
submergence, -qS
C2
qS D2 drag coefficient at finite submergence, D --
CD wave drag coefficient, D3 - 3 qS
Cd section drag coefficient
CDi ' induced drag coefficient of a rectangular hydrofoil - in an infinite fluid
CDi induced drag coefficient due to the trailing-vortex images
LCDi induced drag coefficient due to the horseshoe-vortex images
S , area of hydrofoil, sq ft
q free-stream dynamic pressure, . p1T, lb/sq ft
V free-stream velocity, ft/sec
Vc limiting speed of wave propagation or "critical speed," ft/sec
P mass density, slugs/cu ft
V kinematic viscosity, ft2/sec
g acceleration due to gravity, ft/sec2

NACA RM L52D23a
C1 0 section lift coefficient at infinite submergence
C1 section lift coefficient at finite submergence
a01 section lift-curve slope at infinite submergence,
dc lo
dcLO
a02 section lift-curve slope at finite submergence, d.cj dao
d.0 L a1 slope of lift curve at infinite submergence,
d.0 a2 slope of lift curve at finite submergence,
da
a angle of attack, deg
ao section angle of attack, deg
V CCL r circulation strength of vortex,
2
rl circulation strength of vortex at infinite submergence
r2 circulation strength of vortex at finite submergence
induced vertical velocity at three-quarter chord due to bound vortex of hydrofoil (surface boundary only)
W2 induced vertical velocity at three-quarter chord due to hydrofoil image bound vortex (surface boundary only)
Induced vertical velocity at three-quarter chord due to two trailing vortices of hydrofoil (surface boundary only)
induced vertical velocity at three-quarter chord due to two hydrofoil-image trailing vortices (surface boundary only) -
W5 induced vertical velocity at three-quarter chord.d.ue to horseshoe vortex of the hydrofoil
- C(
1
NACA RN L52D23a
W6 induced vertical velocity at three-quarter chord due to hydrofoil-imge horseshoe vortex (surface boundary only)
induced vertical veloci-ty at three-quarter chord due to hydrofoil-image bound vortices (multiple boundaries)
induced vertical velocity at three-quarter chord due to hydrofoil-image trailing vortices (multiple boundaries)
c chord of hydrofoil, ft
h depth of water, ft
f depth of quarter chord of hydrofoil below free-water surface, ft
x distance of the bound vortex measured in free-étream direction from three-quarter chord of the hydrofoil, ft
y distance to center of image horseshoe vortex, measured parallel to the lifting line, from the center of the hydrofoil, ft
z distance of image bound vortex, measured normal to the water surface, from the hydrofoil quarter-chord point, ft
b semispan of hydrofoil, ft
A geometric aspect ratio,
plan-form correction factor for rectangular wings (see ref. 9)
E e effective edge-velocity correction for lift
R Reynolds number, Vc-v--
F Froude number based on depth of hydrofoil submergence, V2 gf
6 NACA RN L52D23a
DESCRIPTION OF MODEL
The experimental data were obtained by using an 8-inch-chord hydrofoil with an aspect ratio of 10 supported by an 8-inch-chord strut intersecting the upper surface of the hydrofoil without fillets. The strut was perpendicular to the chord of the hydrofoil. The hydrofoil and struts were made of stainless steel. They were polished to a smooth finish consistent with current wind-tunnel practice.
The sections of the hydrofoil and strut were the same as those used in references 1 and 2. The hydrofoil had an NACA 6 1A 1412 section
which differs from the NACA 641_412 section only by elimination of the
trailing-edge cusp; the section characteristics of these two are essentially the same (see ref. 3). The strut had an NACA 661-012
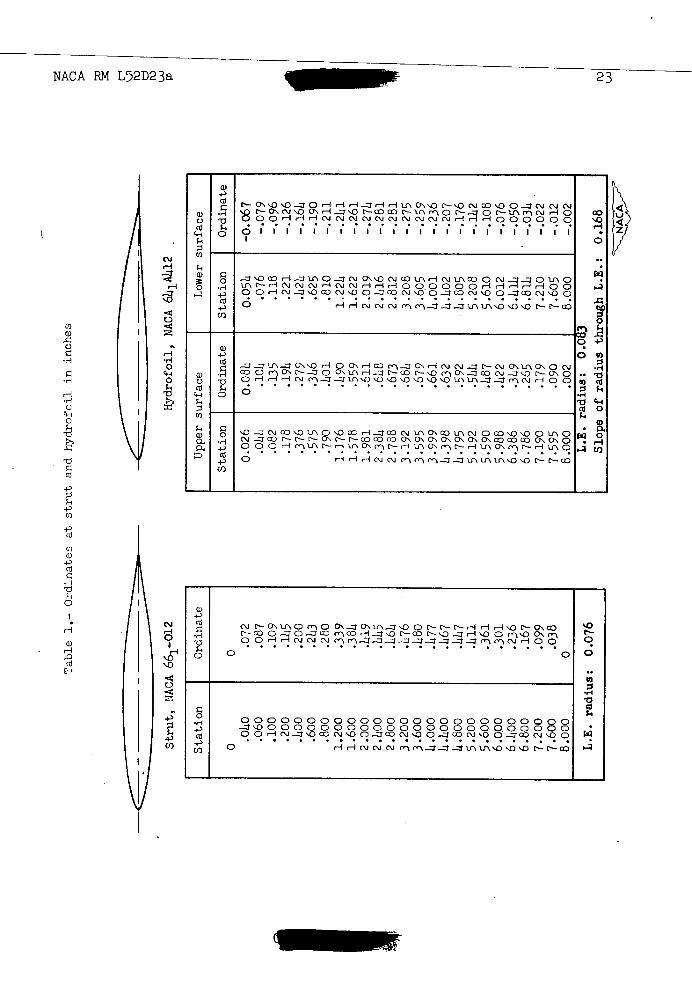
section. Table 1 gives the ordinates for the hydrofoil and strut sections as computed from references 3 and 4.
APPARATUS AND PROCEDURE
The tests were made in both Langley tank no. 1 and tank no. 2 to obtain two water depths. Figure 1 shows a view of the test setup with the hydrofoil and balance attached to the structure on the Langley tank no. 2 carriage. The setup in Langley tank no. 1 was similar except for the method of attachment to the carriage. Figure 2 shows the cross sections of the two tanks. Tank no.. 1 has a mean depth of 10.64 feet; tank no. 2 has a uniform depth of 6.0 feet.
The hydrofoil was moved vertically by means of a motor-driven jacking screw which moved the balance and hydrofoil as a unit. Change in angle of attack was obtained at the plate attaching the strut to the balance.
Measurements of lift and drag were made by means of electrical strain gages. The force measurements were made at constant speed, angle of attack, and depth of submergence. The depth of submergence is defined as the distance from the undisturbed water surface to the quarter-chord point on the chord line. This definition differs from that of references 1 and 2. The numerical difference is approximately 0.7 inch or 0.09 chord greater depth with the present definition than the previous one. The present definition is more suitable for use in the theory. Tests were made..at two submergences (o.84 chord and 3.84 chords), over a range of speeds from 5 to 15 feet per second, and a range of angles of attack from _3.50 to 6.00. The change in angle of

NACA RM L52D23a
attack due to structural deflection caused by the lift and drag forces on the hydrofoil was obtaine'd during the calibration of the balance and the test data were adjusted accordingly.
The supporting strut was run alone at the same range of speeds, depths, and angles as the combination. For these tests the end of the strut was fitted with a faired cap. The tares thus obtained were deducted from the test data to give the net forces. The net forces were converted to the usual aerodynamic lift and drag coefficients by using a measured value of p of 1.966 slugs per cubic foot at the testing temperatures which were 40 0 F for the tests at 0.84-chord. sub-mergence in Langley tank no. 1 and 44° F for all other tests in both tanks. All coefficients were based on the area of the hydrofoil. The area of the hydrofoil used in the present tests is 4.44 square feet. The measured kinematic viscosity of the water at the time of the tests in tank no. 1 at 40 0 F was 1.85 x 10⁻⁵ feet squared per second, in tank no. 1 at 440 F was 1.73 x 10⁻⁵ feet squared per second, and intank no. 2 at 44° F was 1.83 x 10⁻⁵ feet squared per second.
EXPERIMENTAL RESULTS
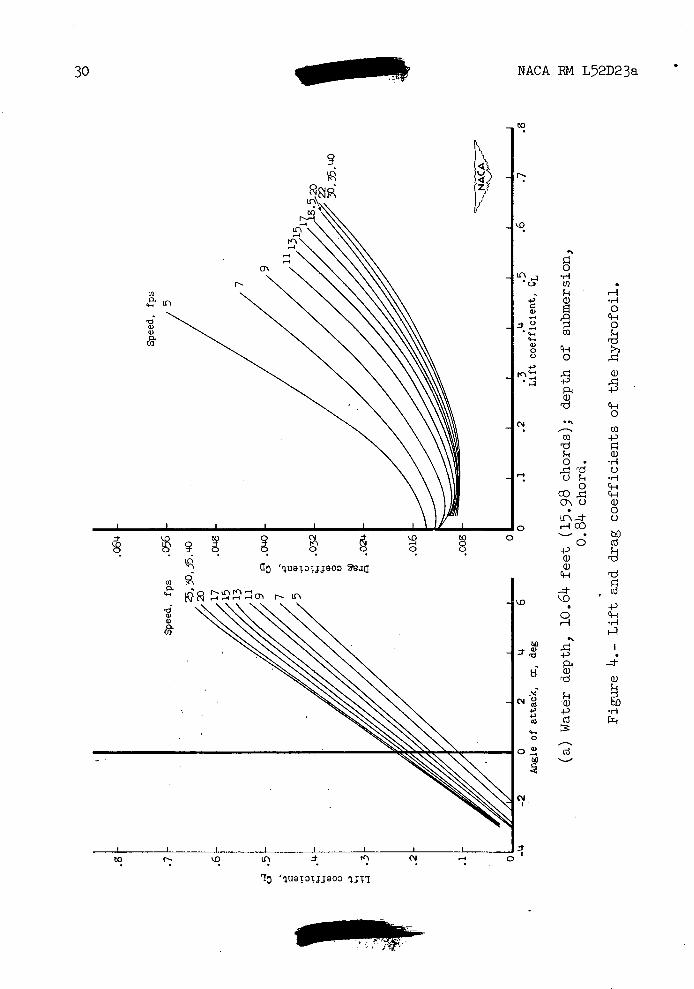
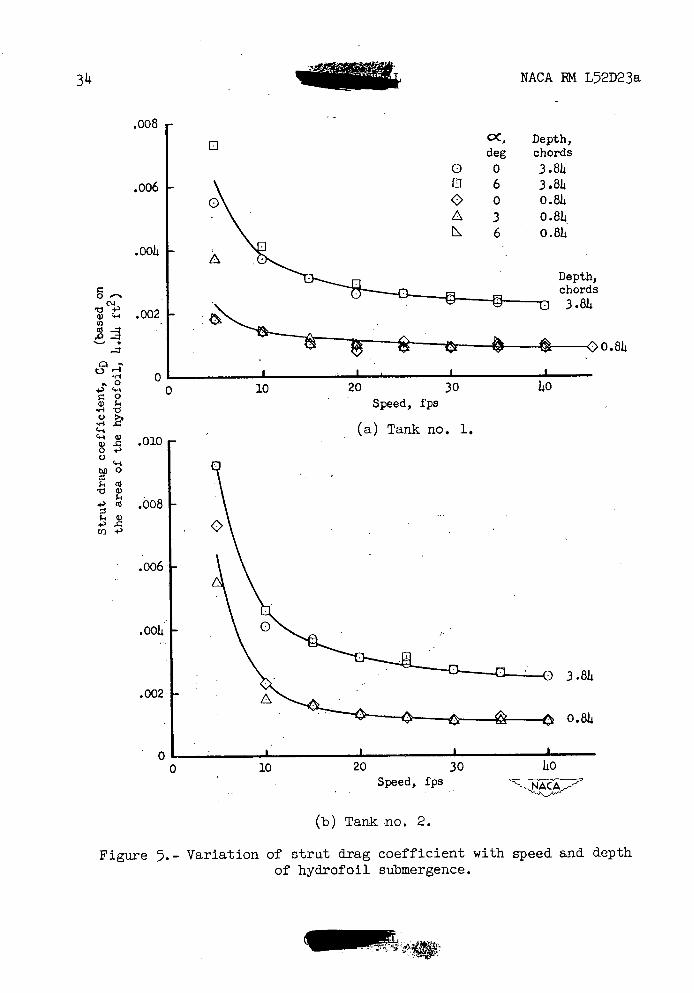
The basic experimental results corrected for strut deflection and, drag tares are presented in figure 3 as curves of lift and drag for each water depth and depth of hydrofoil submergence plotted against angle of attack with speed as the parameter. The data, converted to coefficients, are presented in figure 4 in the usual form for aero-dynamic data. The strut-drag coefficients (based on the area of the hydrofoil, 4.44 ft2 ) plotted against speed are shown in figure 5.
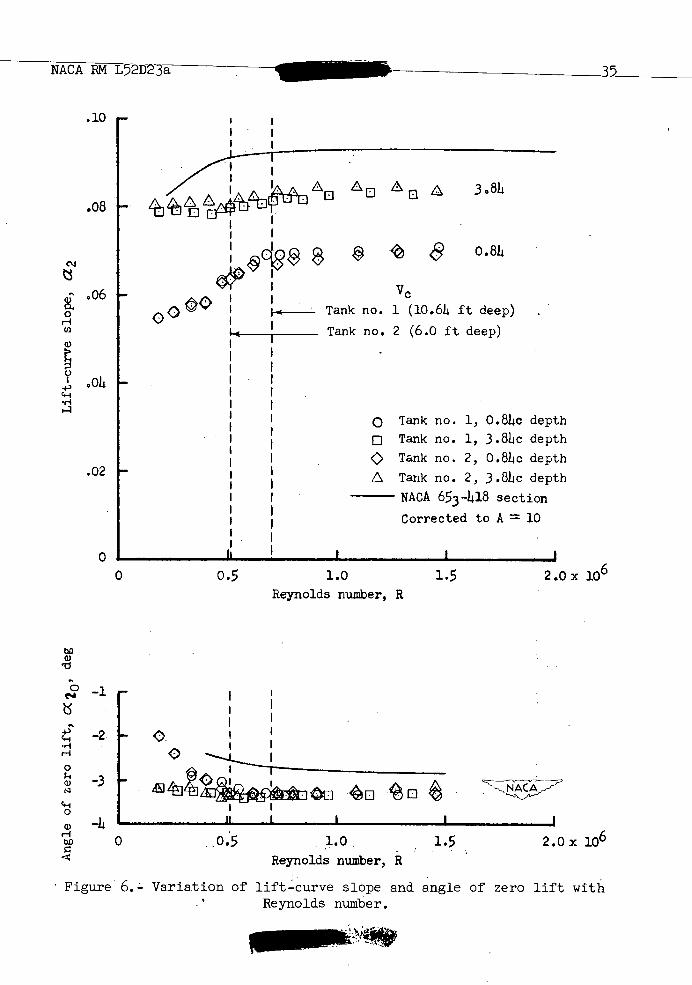
1? The lift-curve slopes and angles of zero lift from figure ( are
plotted against Reynolds number in figure 6. Also included in this figure are the corresponding aerodynamic data for the NACA 653-418
section. These data were taken from reference 5 and the lift-curve slopes were corrected to aspect ratio 10 by the equation
Aa01
a1 = AE+ 57,;3 a01
from reference 6 where Ee is an effective-edge-velocity correction from reference 7. The hydrofoil data show no significant effect of tank depth at either depth of submergence.. It is of particular interest to note that, where this effect would be expected to be most pronounced, that is, in the region between the dashed yertical lines of figure 6 where the speed in' tank no. 1 is subcritical while that in tank no. 2
(1)
8 .1fl NACA RM L52D23a
is supercritical, the lift-curve slope and angle of zero lift for a given Reynolds number are essentially the same for both tanks. In the region below the critical speeds the trends are not too apparent. The lift-curve slopes decrease and the angles of zero lift increase with decreasing Reynolds number, particularly at the shallower depth of submergence. Such a tendency is indicated by the corresponding low Reynolds number aerodynamic data for the NACA 653 _1I18 section. The reason for the variation of this tendency with depth of submergence is not fully understood; however, changes in pressure distribution due to changes in submergence would influence the Reynolds number effect. It appears therefore that if the lift-curve slopes and angles of zero lift are influenced by the critical speed the influence indicated by these tests is so small as to be masked by Reynolds number effects encountered in the tests and by the effects of submergence.
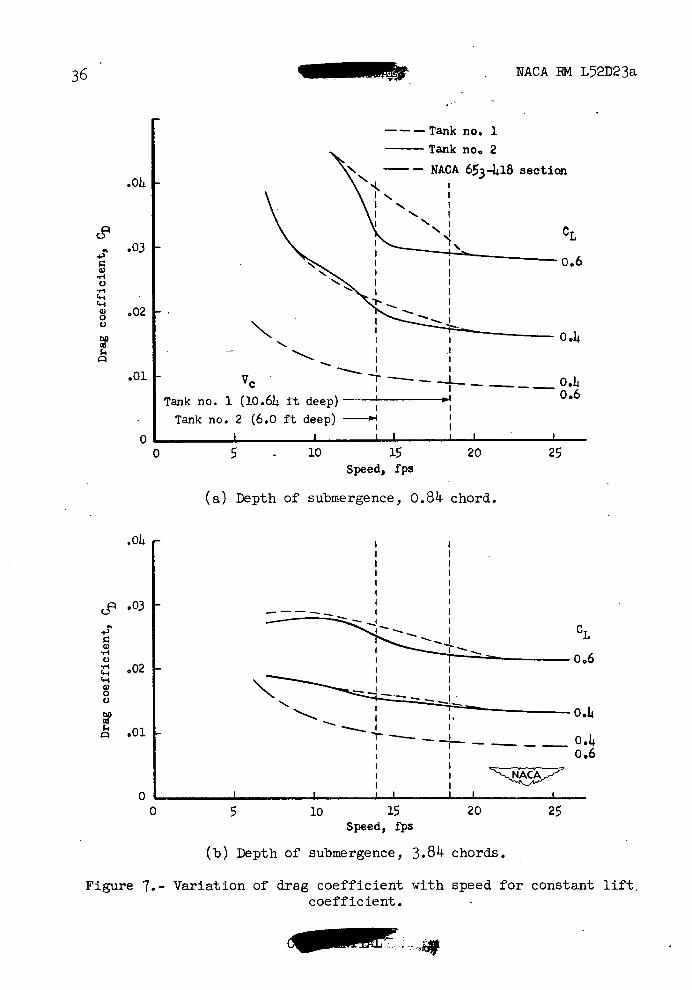
The variation of drag coefficient with speed for the 10.64 feet and the 6.0 feet water depths at lift coefficients of O.# and 0.6 and depths of submergence of 0.84 and 3.84 chords and aerodynamic section drag data at the same lift coefficients for the NACA 653_418 airfoil
section from reference 5 are shown in figure 7. A comparison of the drag coefficients for the two water depths at both lift coefficients and both depths of submergence shows that, with reducing speed, when the critical speed in the greater water depth (tank no. 1, 15.98 chords) was approached, a drag rise occurred whereas the drag in the shallower water depth (tank no. 2, 9 chords) did not rise until its lower critical speed was approached. It can be seen that the drag rise increases with lift coefficient and decreases with depth of submergence as is pre-dicted by the theory that will be discussed later. The trends at the low subcritical speeds are not too clear since they are masked by Reynolds number effects. An indication of the possible Reynolds number effects can be obtained from the aerodynamic data presented.
THEORETICAL BOUNDARY CORRECTIONS — SUPERCRITICAL
General
In order to use aerodynamic data for an airfoil in an infinite medium to predict the characteristics of a hydrofoil in the proximity of the water surface and perhaps also rigid boundaries as would be encountered in shallow water, canals, or towing tanks, the influence of these boundaries must be evaluated. The boundary condition to be satisfied at the free surface is that of constant pressure along the surface streamlines. The boundary condition to be satisfied at the rigid boundaries is zero normal velocity.
NACA RN L52D23a
Free-Surface Boundary
As a first approximation to the three-dimensional problem super-critical conditions are assumed, however with only the free-water-surface boundary present. The constant-pressure boundary at the free surface can be satisfied by the introduction of a horseshoe vortex above the surface which has the same direction of rotation as the one which represents the loading on the hydrofoil (fig. 8).
The presence of the image bound vortex does not change the direction of the flow relative to the hydrdfoil chord line in the vicinity of the center of pressure, but it does tend to curve the streamlines relative to the hydrofoil chord line. The curvature effect is equivalent to introducing camber of the hydrofoil in such a manner as to produce a negative lift increment. It would seem therefore that a reasonably close approximation to the effect of the free surface could be obtained by simply evaluating the effect of streamline curvature, in addition to the induced-angle effect of the trailing vortices, by applying a technique frequently used in approximate solutions of aero-dynamic problems (see ref. 8). This technique involves determination of the circulation F required to produce a downward velocity W 5 + W6
at the three-quarter-chord location which when combined with the free-stream velocity V produces a flow tangent to the mean camber line of the hydrofoil. Thus, if geometric camber is neglected, the hydrofoil angle of attack a. is equal to the sum of the angles at the three-quarter-chord point induced by the hydrofoil vortices and their images located at a distance directly above the hydrofoil equal to twice the depth of submergence.
By use of the Biot-Savart law and the notations defined in figure ,8 the following expressions for the separate contributions at the line of symmetry to the vertical component of the induced velocity at the three-quarter chord were obtained:
Wl1[bl(2)
due to the bound vortex of the hydrofoil,
W2 =
2+ (2f)
(cr -
rbc 1 (3)
+ (2f) +

10
NACA RM L72D23a
due to the image bound vortex,
W3 = + 27b)2 + b2 11
due to the two trailing vortices of the hydrofoil,
Pb c =
21t [b2
+ (2f) 2 (SL) [ ( 2
+ b2 + (2f)2
due to the two image trailing vortices,
W5 ()+b+!]
due to the horseshoe vortex of the hydrofoil and
b W6 =
(C)2 (2f)2 +
2b c
(2f)2+ b2 [ + 2()2 + (2f)2 + b211
dUe to the image horseshoe vortex.
By means of equations (6) and (7) a computation of the angle of attack a can be made..
Effect on lift. - In order to estimate the effect of depth of submergence on lift the ratio of the hydrofoil circulation in an infinite fluid to that of a hydrofoil at a finite depth of submergence for a given angle of attack is obtained. That Is:
P1 W+W,-0 -= -, =l+. (8)
W 5 W5
(1k)
(5)
(6)
(7)

NACA RM L72D23a
Therefore (for small angles),
-' bc 1
rl =
+ + (2f)2 + b2)2 + (2f)2 + I A C) 2 (2f) 2 + b2 4 (2f)' + b2
where
VcC
2
and
F2 F1 -
-
CL- - a1
when this equation is divided through by c to get f in terms of c and with
A 2b
81
a2 1
1+1
A -______
f4A
r! 4(cLy
++ 1 + (\2 ^ (f) 2 I 8ff 2 A
\c) ] AZ) ^
A2 + 1)
(9)
which is the ratio of lift-curve slope at finite depth to that at infinite depth when only the free surface is considered.

12 NACA EM L52D23a
For the two-dimensional case (see ref. i) the ratio of the lift-curve slope at finite depth to . that at infinite depth for a given angle of attack is
!!(
2
^ A 4 c) + 1
a, /
(r)2
Effect on drag. - In order to estimate the effect of depth of submergence on the drag of a finite-span rectangular hydrofoil the drag induced by the hydrofoil images at a given angle of attack is obtained
w6 = CL2
--1 + a)
This relation is not rigorous since it gives an induced drag in two-dimensional flow due to the influence , of the bound vortex at the three-quarter chord. However, for the aspect ratios under consideration when the drag correction is determined in the usual manner, that is by evaluating the downwash at the quarter-chord, the drag predicted is too low. This condition is true even when the spanwise distribution of downwash is considered.
From equation (7)
W6 r = K
where
C r b 1 2b.r c 1 K
= (C)2 + f2c2 + 1f2 + b2 + 1f2 + b2L + 2\f)2 + 1f2 + b2J
(10)
rA
NACA 1RM L52D23a
The drag coefficient of a rectangular hydrofoil in an infinite fluid is
CL12 CD1 = c + - (1 + a) irA
The total drag coefficient of a rectangular hydrofoil at a given depth of submergence and angle of attack, therefore, is
CD=cd+CL22(.!.+\(l+a) Air 8ir)
Restricted Area
In order to estimate the effect of depth of submergence on the lift and drag of a hydrofoil in a restricted area such as a shallow harbor, a canal, or towing tank, a system of images (fig. 9) that satisfied the boundary conditions of constant pressure at the free-water surface and zero normal velocity at the rigid boundaries is required. The boundary-induced vertical velocities at the three-quarter chord are obtained by computing the combined effect of sufficient images to give the desired accuracy. An infinite array of images is, of course, required to give an exact value. Sufficient accuracy, however, can be obtained with a finite array of images. For example, if another row of images were added to the top and bottom and another column of images to each side of the horseshoe vortex arrangement shown in figure 9 (A = 10, tank no. 2, submergence = 0.84 chord) the additional images would cause a change of'less than 1 percent in the total induced vertical velocity at the three-quarter chord of the hydrofoil. The general equation for this velocity for each image vortex (see ref. 9) is:
r y + b y - b 7 47T fx + 2 L + z2 + (y + b) 2 - x2 + z2 +
(12)
14 NACA RM L52D23a
due to the image bound vortex and
Wr y + b ____________ X
= 4v 2 + (y + b)2 L
+ z +_( y_+
y
x +
z2 +(y- 2+z2+(y_b)2(13)
due to two image trailing vortices where x, y, and z define the location of the image with respect to the intersection of the quarter-chord line and the line of symmetry of the hydrofoil (see fig. 8).
a2 V V
The ratio - and the drag coefficient CD are obtained as a1
previously discussed by substituting (w7 +w8 ) for W6 in equations (8)
and (10).
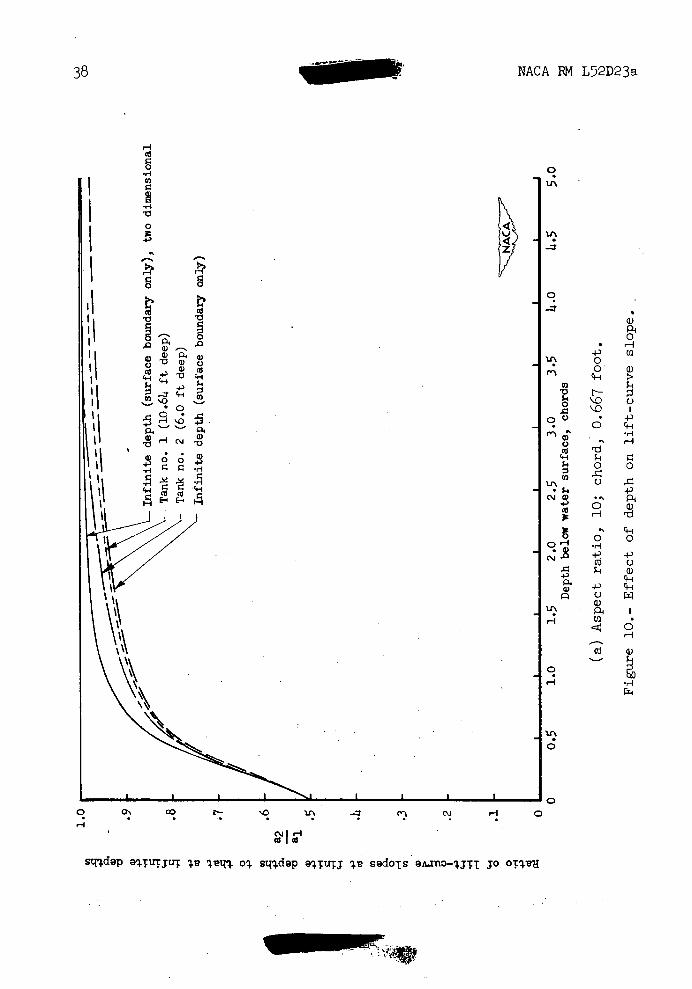
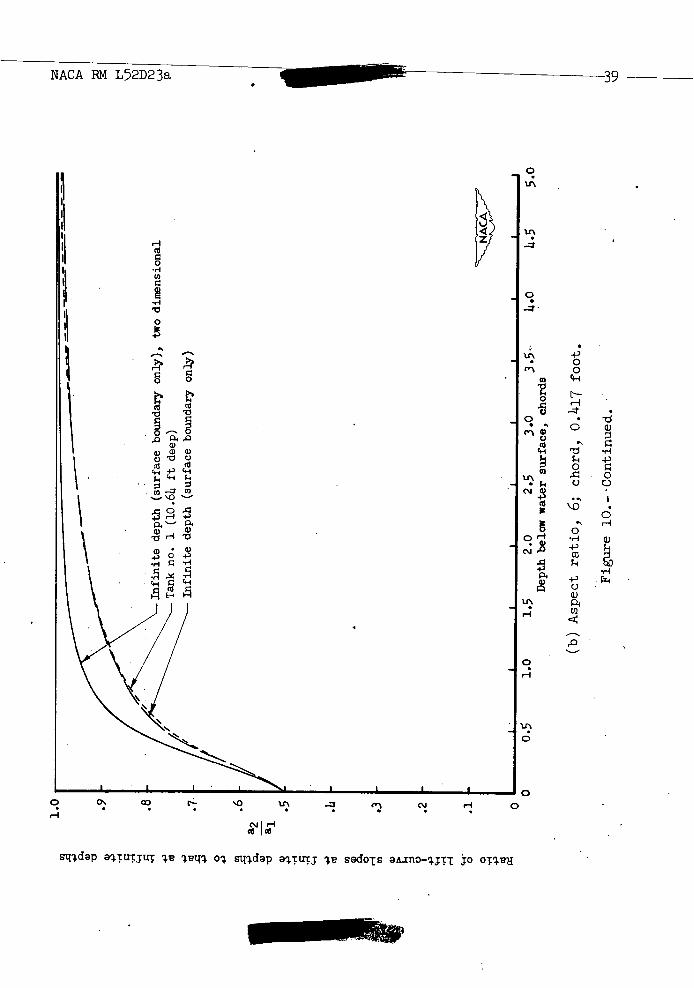
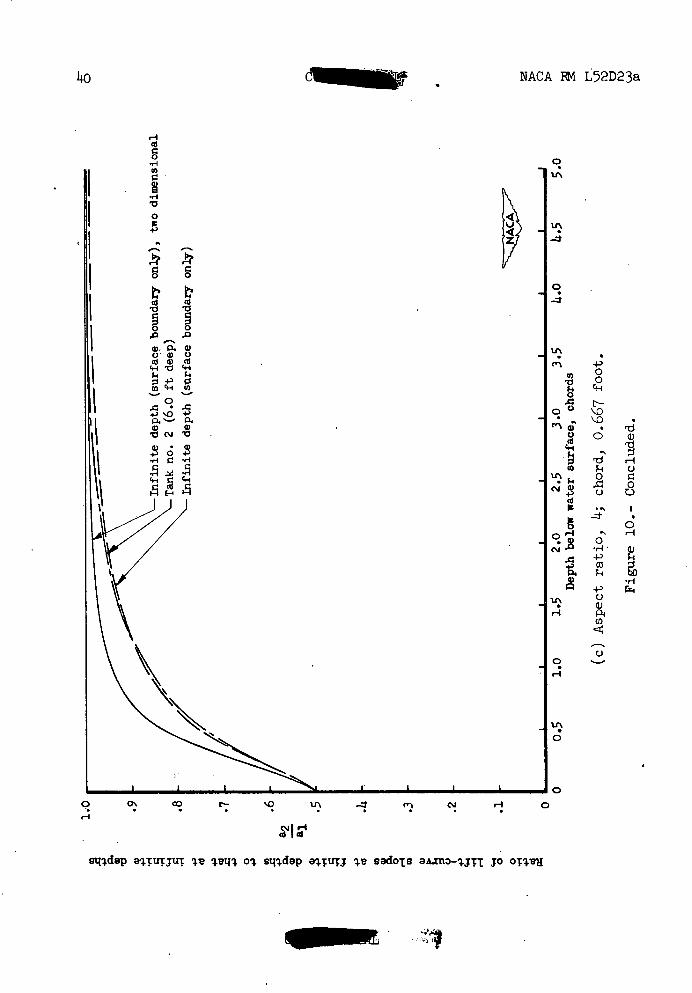
Some results calculated by applying the foregoing theoretical methOd to these tanks for estimating the effect of submergence on lift- curve slope are shown in figure 10 for three aspect ratios.
Comparison of Theory and Experiment
Lift.-The theoretical results presented in figure 10 are. compared in figure 11 with the present experimental results for a hydrofoil of aspect ratio 10 and with experimental results given in references 1, 2, and 10 for hydrofoils of aspect ratio 10, 14, and 6, respectively. The
ratio for the experimental lift-curve slopes for hydrofoils of aspect
ratios 6 and 10 is the ratio of . the lift_curve , slope obtained at a given depth of submergence to the lift-curve slope (corrected for aspect ratio by equation (1)) as obtained from airfoil data (see refs. 11
a2 and 12). The ratio for the experimental lift-curve slopes for the a1
aspect-ratio-4 hydrofoil is the ratio of the lift-curve slope obtained at a given depth of submergence to the lift-curve slope at the greatest depth of submergence. This ratio was chosen in the case of the aspect-ratio-4 hydrofoil because the experimental lift-curve slope at the greatest depth of submergence was higher than the lift-curve slope (corrected for aspect ratio by equation (1)) given by airfoil data. If
NACA FM L52D2 3a ______________
the method used for the hydrofoils of aspect ratios 6 and 10 had been used the ratios would be greater than 1.0. The difference in lift-curve slope causing this is about five percent.
The agreement of the experimental results with results given by the theoretical method is generally good.
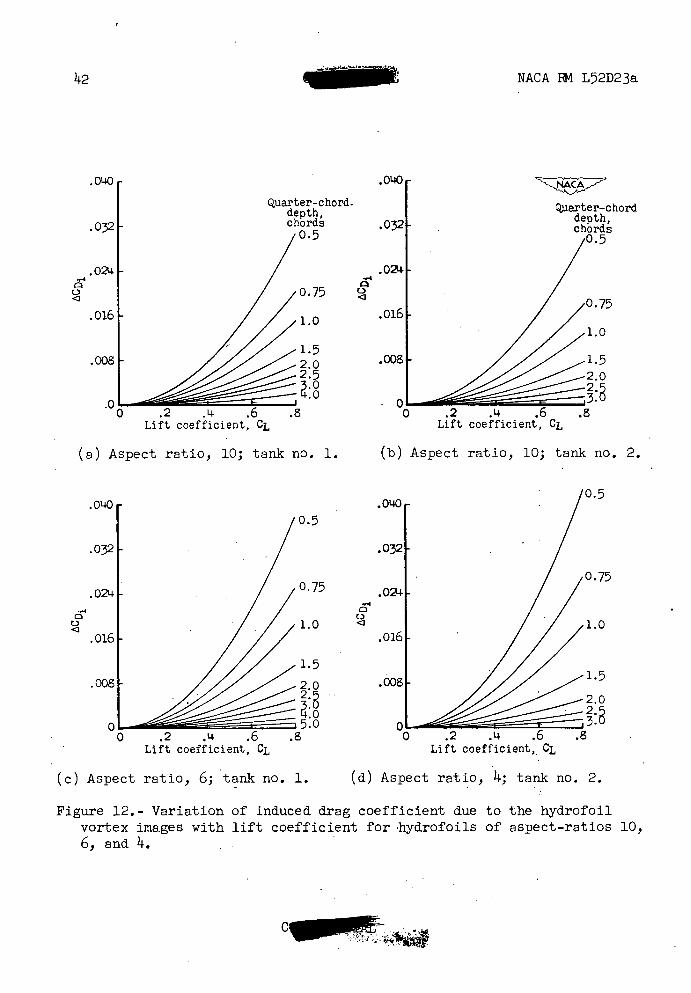
Drag. - Results calculated by the restricted-area theoretical method for estimating the effect of depth of submergence, on the drag coefficient are shown in figure 12 for hydrofoils of aspect ratio 10, 6, and 14 The magnitude of the increments indicates that a correction to airfoil drag coefficients must be made to predict hydrofoil characteristics at supercritical speeds.
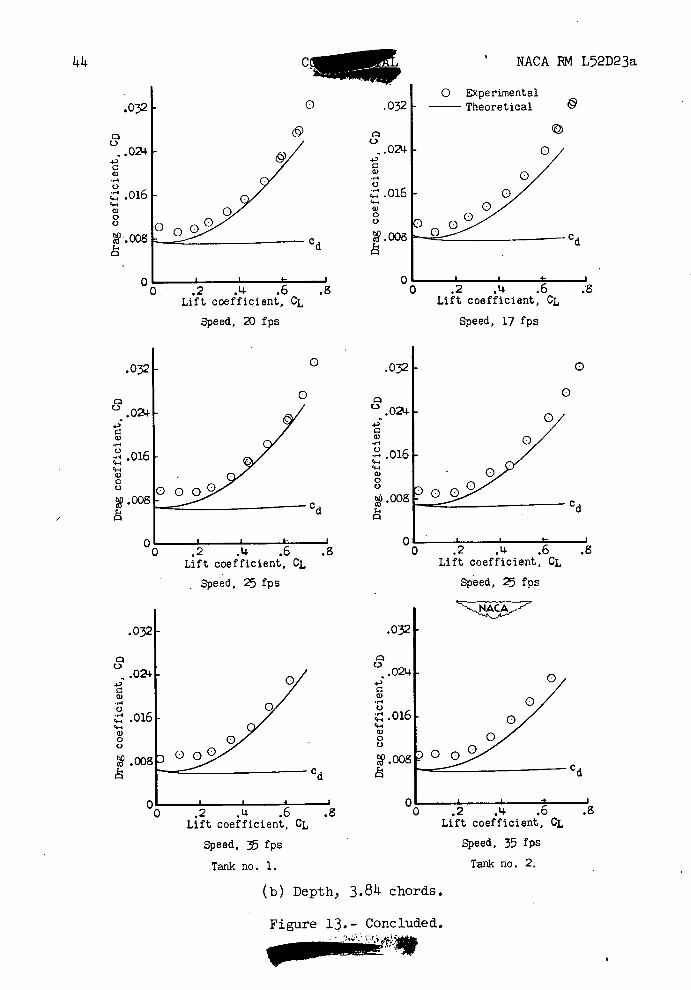
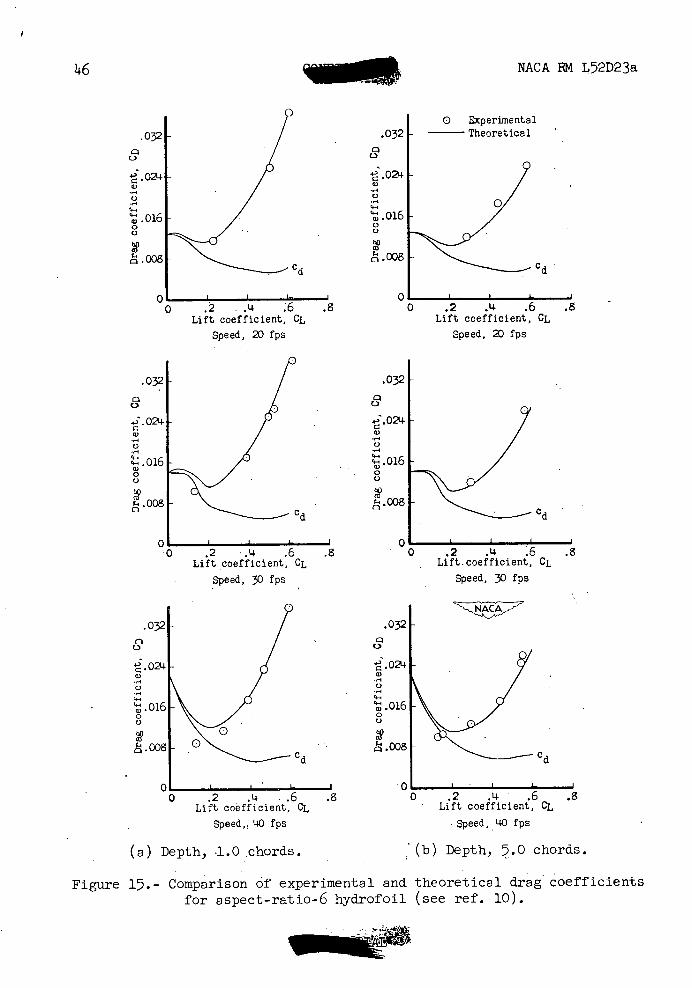
Results calculated by the restricted-area method for both tank no. 1 and tank no. 2 are compared in figure 13 with the present experimental results for a hydrofoil of aspect ratio 10 and in figures 1 1 , 15, and 16 with the experimental results given in references 1, 10, and 2 for hydrofoils of aspect ratios 10, 6, and 1, respectively. The agreement of the experimental results with results given by the theoretical method is in most cases good.
THEORETICAL BOUNDARY CORRECTIONS - SUBCRITICAL
General
The speed of propagation of transverse waves generated by the bound vortex of the hydrofoil is limited to a speed which is a function
of water depth. This speed is defined by /K where g is the gravitational constant and h is the water depth. When the hydrofoil operates below this limiting or "critical speed" the transverse waves travel along with the hydrofoil whereas aboie this speed the transverse waves no longer accompany the hydrofoil. It follows, therefore, that the induced effects on lift and drag due to these waves are present below critical speeds but not above. The diverging waves due to the trailing vortices are not subject to this limitation and their effect is present at both subcritical and supercritical speeds. The effect then, of the trailing vortices, may be computed to a first approximation in the same manner at subcritical and supercritical speeds. The effect of the bound vortex at subcritical speeds, however, is not the same as at supercritical speeds.
Figure 6 indicates that the expected effect of the critical speed on lift was either not present or so small as to be masked by the Reynolds number effects encountered in the tests and by the effects of

16 11 NACA RM L52D23a
submergence. It may therefore be assumed that to a first approximation the influence of the boundaries on lift will be the same as for the super-critical case and that only the influence on drag need be considered.
Since the condition generally encountered in actual applications is that of great water depth most of the theoretical work has considered only this case. Mathematical investigations of the wave drag of a submerged body were made by Lamb, who studied the motion of a circular cylinder and a spherical body. More exact solutions of these problems were given by Havelock, who solved further problems, for instance, that of the motion of a submerged ellipsoid. L. N. Sretensky (ref. 13) approached the problem of the submerged cylinder for both infinite and finite water depths by assuming the existence of circulation. Kotchin (ref. 14) gave general formulas for the hydrodynamic forces acting on profiles of arbitrary shape in water of infinite depth. Keldish and Lavrentiev (ref. 15) considered the case of a two-dimensional "thin" airfoil in water of infinite depth. Vladimirov (ref. 16) considered the case of a three-dimensional hydrofoil in water of infinite depth. Recent work by Meyer (reference 17) considered a two-dimensional hydrofoil in both infinite and finite water depths and in reference 18 the case of a three-dimensional hydrofoil in water of infinite depth.
Drag
In order to estimate the effect of depth of submergence on drag the induced drag due to the hydrofoil trailing-vortex images and wave drag must be added to the drag in an infinite fluid.
The boundary-induced drag coefficient due to the image trailing vortices is
CD = CL (i + a) - (lu)
From equation (5)
W4
V l4TtV

NACA 1RM L52D2 3a 17
where
2b C 1(1=
2 2) +
b2+(2f)22b2+(2f)2+(C
for a free surface, and from equation (13)
y + b x
K1 = 2 + (y + b)2
L + z + ( y + b)2]
y - b L+ x(15)
z2 +(y_ b) 2 1 2+z2+(yb)2
for a restricted area (tank no. 1 and tank no. 2).
The wave drag coefficient for a hydrofoil at a given depth of submergence and speed is (refs. 14, 17, and 18)
C 2 L
CD =
(16)
gc
where
2 'V = e-iF (17)
for a two-dimensional hydrofoil in water of infinite depth (refs. 14 and 17) and
sinh2 - OU_ 0]
OVM (18) cosh2 u0 -

18 NACA RN L52D23a - r
(the
tanh U0
parameter U0 is obtained from the relations - = gh
for a two-dimensional hydrofoil in water of finite depth (ref. ii) and
V2
fA2= gb
b
2b f
JA 2b i r -
*2(F. arc tan Al dA (19) 2)
and
[1+ cos2e)iHo(l)f_
T2 2 (l=
cos e)
(2 cos 0 + F cos 0 cos 20)ll cos2 0 cos 26}
where HO M and 111 (1) are Rankel functions and
e = arc tanf'L\ 2fJ
for a three-dimensional hydrofoil in water of infinite depth (ref. 18).
The drag coefficient of a rectangular hydrofoil in an infinite fluid is
CL2 - CD1=cd+ (l+a)
iTA
(20)
Therefore, the drag coefficient of a rectangular hydrofoil at a given depth of submergence, angle of attack, and speed is
CD = cd + CL2[a) 1 (21)
2 rrA 81T L2
gC
NACA RN L72D2 3a _Imwi&^19_
Comparison of Theory and Experiment
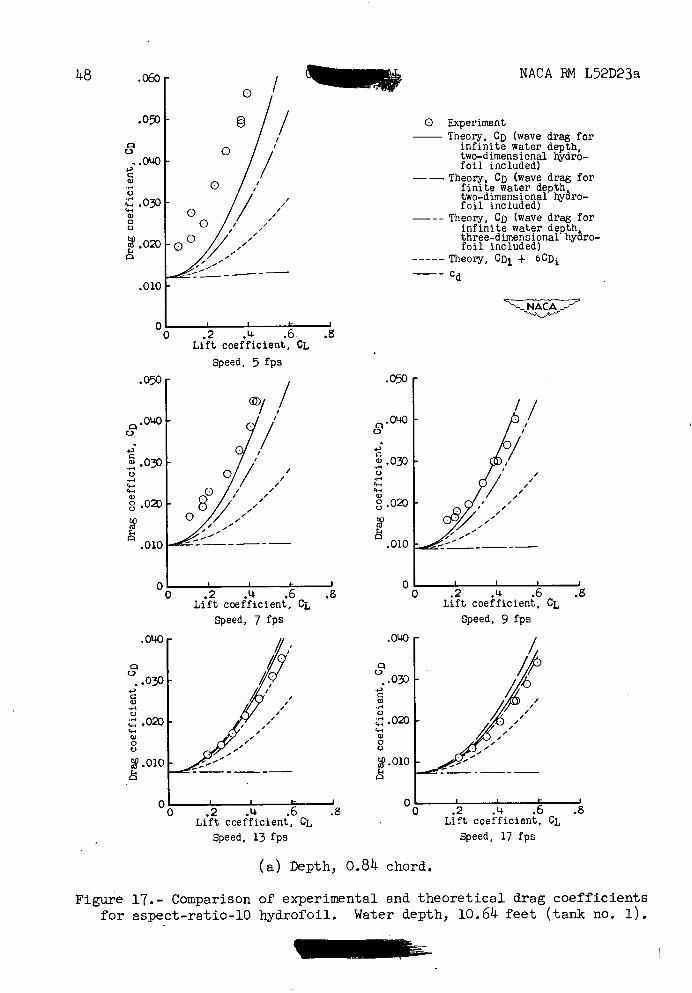
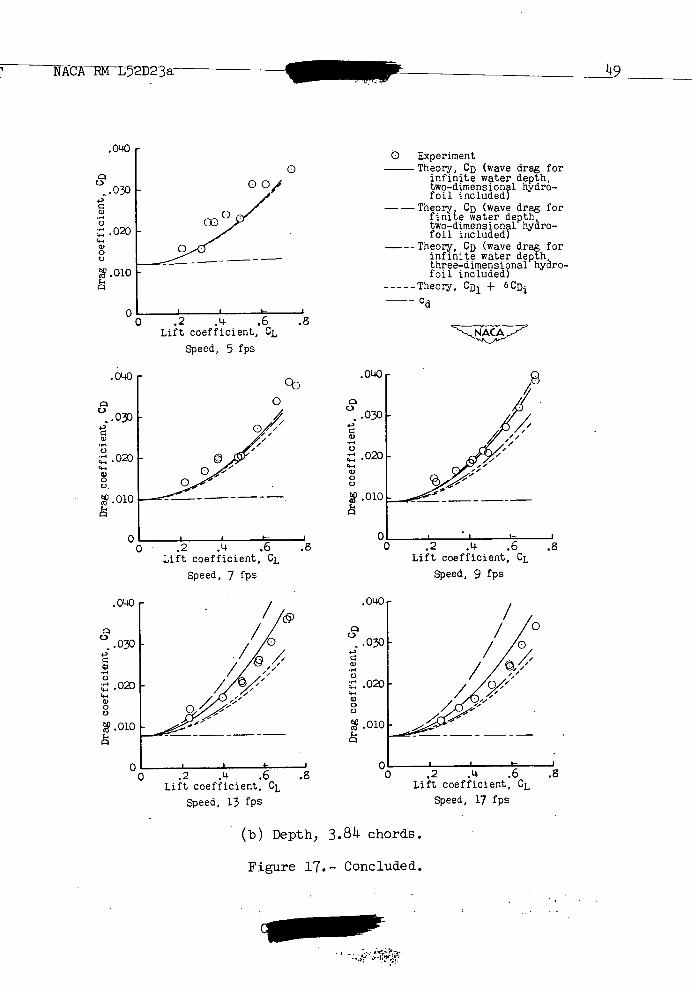
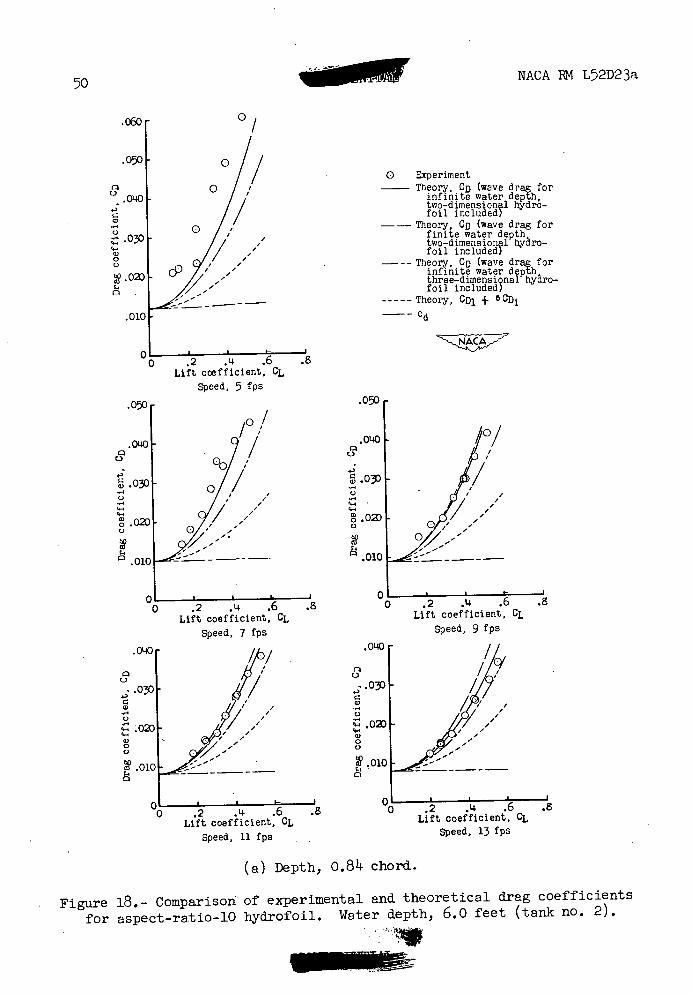
Figures 17 and 18 compare the present experimental results for a hydrofoil of aspect ratio 10 with the results calculated from equation (21). The theoretical results were obtained by estimating the section drag cd, and adding the calculated induced drag coefficient of a rectangular hydrofoil in an infinite fluid CD., the boundary
induced dragCD , and the wave drag coefficient CD I 3
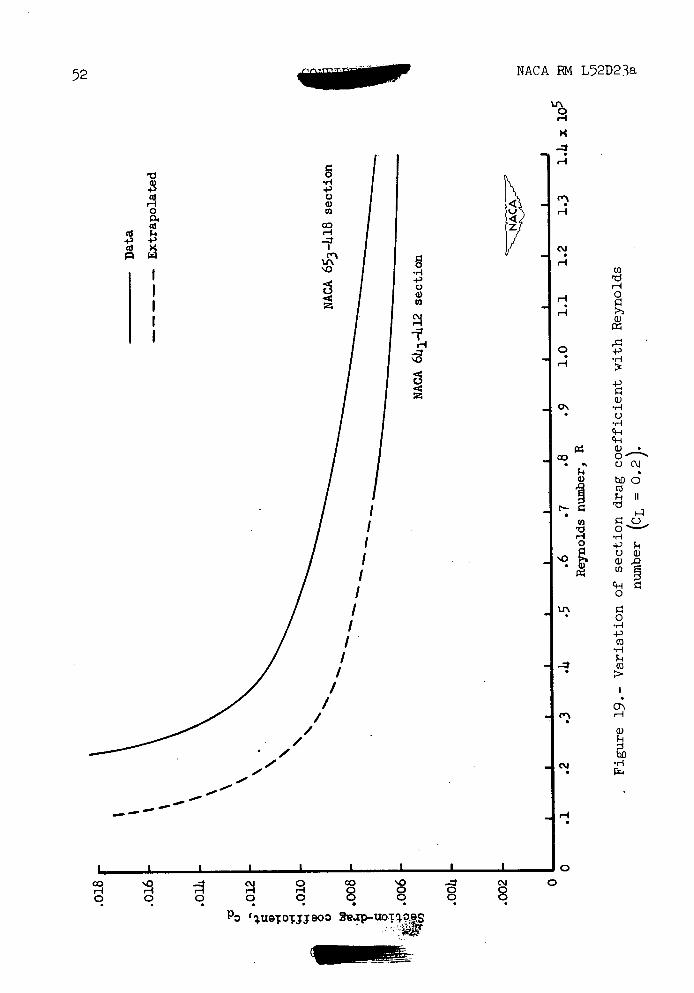
The drag coefficient cd at low Reynolds number was estimated by
extending the section drag data of the NACA 611-412 airfoil by comparison
(fig. 19) with low Reynolds number data for the NACA 653-18 airfoil
section. The boundary-induced drag coefficient CD 1
(equation (14))
was obtained by calculating K1 for tank no. 1 and K1 for tank no. 2
from equation (17). The wave drag coefficient was computed from equation (16), where the values for f were calculated from equation (17) (infinite water depth, two-dimensional hydrofoil), equation (18) (finite water depth, two-dimensional hydrofoil), and equation (19) (infinite water depth, three-dimensional hydrofoil). Thevalues for 4r. obtained from equations (17), (18),.and (19) are compared in figure 20.
Figures 17 and 18 indicate that the wave drag coefficient for water of infinite depth (two-dimensional hydrofoil) added to
CD1
+ 5CDi (where CD1 1/ = cd + CD gives a better approximation of the
experimental drag coefficient of a hydrofoil at a given depth of sub-mergence and speed than when wave drag is calculated for water of finite depth (two-dimensional hydrofoil) or for water of infinite depth (three-dimensional hydrofoil).
This result may be due to the fact that the wave-drag theories do not consider both the effect of water depth and the three-dimensional case simultaneously whereas the experimental, values were at a finite water depth for an aspect-ratio-10 hydrofoil. Suitable experimental data for other aspect ratios and water depths are not presently avail-able to aid in clarifying the discrepancy. The difference in the theoretical and experimental results at 7 feet per second could be an additional section drag increment since the section drag coefficient was estimated by an arbitrary method.
20 NACA RM L52D23a
CONCLUSIONS
The results of the tank tests of the aspect-ratio-10 hydrofoil and the results calculated by theory and compared to experiment my be summarized as follows:
1. A method has been developed which makes it possible to calculate at subcavitation speeds, to engineering accuracy, the lift and drag characteristics of a hydrofoil from aerodynamic data. The method accounts for the effects of submergence of the hydrofoil below the free-water surface, the proximity of fixed boundaries, and the limiting speed of wave propagation due to limited water depth.
2. There was no appreciable effect of the limiting speed of wave propagation on lift-curve slope or angle of zero lift at the two depths of submergence investigated.
3. The increase in drag as the critical speed is approached from the supercritical range Is gradual. This result Is contrary to the abrupt Increase at the critical speed predicted by theory.
Langley Aeronautical Laboratory National Advisory Committee for Aeronautics
Langley Field, Va.

NACA RM L52D23a INOMP
REFERENCES
1. Wadlin, Kenneth L., Fontana, Rudolph E., and Shuford, Charles L., Jr.: The Effect of End Plates, End Struts, and Depth of Submergence on the Characteristics of a Hydrofoil. NACA EM L51B13, 1971.
2. Wadlin, Kenneth L., Ramsen, John A., and McGehee, John R.: Tank Tests at Subcavitation Speeds of an Aspect-Ratio-10 Hydrofoil With a Single Strut. NACA RM L9K1 I4a, 1950.
3. Loftin, Laurence K., Jr.: Theoretical and Experimental Data for a Number of NACA 6A-Series Airfoil Sections. NACA Rep. 903, 1948. (Supersedes NACA TN 1368.)
i. Abbott, Ira H., Von Doenhoff, Albert E., and Stivers, Louis S., Jr.: Summary of Airfoil Data. NACA Rep. 82 14, 1945. (Supersedes NACA ACE L5CO5.)
5. Quinn, John H., Jr., and Tucker, Warren A.: Scale and Turbulence Effects on the Lift and Drag Characteristics of the NACA 653_1418,
a = 1.0 Airfoil Section. NACA ACR L14H11, 1944.
6. Swanson, Robert S., and Crandall, Stewart M.: Lifting-Surface-Theory Aspect-Ratio Corrections to the Lift and Hinge-Moment Parameters for Full-Span Elevators on Horizontal Tail Surfaces. NACA Rep. 911, 1948. (Supersedes NACA TN 1175.)
7. Swanson, Robert S., and Priddy, E. LaVerne: Lifting-Surface Theory Values of the Damping in Roll and of the Parameter Used in Estimating Aileron Stick Forces. NACA ARE L5F23, 1945.
8. Wieghardt, Karl: Chordwise Load Distribution of a Simple Rectangular Wing. NACA TM 963, 1940.
9. Glauert, H.: The Elements of Aerofoil and Airscrew Theory. Second ed., Cambridge Univ. Press, 1948, p. 159.
10. Benson, James M., and Land, Norman S.: An Investigation of Hydrofoils in the NACA Tank, I - Effect of Dihedral and Depth of Submersion. NACA ACR, Sept. 1942.
11. Stack, John: Tests of Airfoils Designed to Delay the Compressibility Burble. NACA Rep. 763, 1943 . (Supersedes NACA TN 976.)
22 NACA RM L52D23a
12. Loftin, Laurence K., Jr., and Smith, Hamilton A.: Aerodynamic Characteristics of 17 NACA Airfoil Sections at Seven Reynolds
Numbers From 0.7 x 10⁶ to 9.0 x 10⁶ . NACA TN 195, 199.
13. Sretensky, L. N.: Motion of a Cylinder Under the Surface of a Heavy Fluid. NACA TM 1337, 1952.
lt-. Kotchin, N.: On the Wave-Making Resistance and Lift of Bodies Submerged in Water. NACA TM 134O, 1952.
15. Keldish, M., and Lavrentiev, M.: The Motion of an Aerofoil Below the Surface of a Heavy Fluid. Rep. No. 352 (S. 365), British A.B.C., Mar. 17, 1938. (Translation of the Transactions of the Conference on the Theory of Wave Resistance, U.S.S.R. (Moscow) 1937.)
16. Vladimirov, A.: Approximate Hydrodynamic Design of a Finite Span Hydrofoil. NACA TM 1311, 1952.
17. Meyer, Rudolf X.: Two-Dimensional Vortex-Line Theory of a Hydrofoil Operating in Water of Finite Depth. Tech. Rep. HR-1, The Hydrofoil Corp., Nov. 29, 1950.
18. Meyer, B. X.: Three-Dimensional Vortex-Line Theory of a Hydrofoil Operating in-Water of Large Depth. Part I: The Wave Drag of a Single Hydrofoil With Prescribed Lift-Distribution. Tech. Rep. BR-4, The Hydrofoil Corp., Feb. 7, 1951.
U) a) C) H
H H C
CH 0
0 c1
+3
+3 U)
4D (Ti
U) ci)
4.) (Ti 0 tj
0
H U) H -D F-I
C') '—I
'-4
C)
.-1 0 0
C')
-0
0 z
+3
C')
NACA RM L72D23a
23
U) C)
W
U)
-
'.L) —'O 0N0N-i.rr'CsJH0 000HH (TJr-1Hr-1QQQQOQ 0 I I I I I I I I I I I I I I I I I I I I I I I I
'0ao
0 U)
s-I
o -
•r4 +3
HJ4HH0 00000Hr4,4Hr-I0O ' cli
0
C')
0+
'Ti OHOOHO H -\G0J a) r 0O -CH- tTOC\0N-0\Q 'U) C) V 0HH —Z1(VC\Jr-400
5-.
-L70
U)
'0T-f\0'O tA00\O\OQtf\Ofr P. H • H
4.)
Q (0
U) 4)
'0 H ' - 00 r1 H ('J c c'-j IV)
IV) C') .-5 0 0 CD 0 00
-I 'U) U)
0000000000000000000000000 4.) .-'O000000000000000000000Qo
0O 0 Q\ON-r-- cc) I
41 7

24
NACA RM L52D23a
V
Figure 1.- Test setup showing aspect-ratio-10 hydrofoil and balance attached to towing carriage.

H0
Cd
'-4
0
cJ
S
0V
H
S 0
i
Cd-P -Pa)
a)
Cda)
Cd cl—I
ow
(1)0
rd
.,-4 Cl) cd -Pa)
p
Cd
0
43 C-)
a)
(\J
NACA RM L52D23a
__ ___h*1f2
cm F- -
ni

06-1•
NACA FM L52D23a
0 C!)
4 o0
0
ci)
a) C!)
rd
o• rd 0
0
°°
Lcc:;l-c0 ro
o Cd
CH
a) 4)
a)
C; cv;
Q)
+ bfl
cd
1:L1
a) +

NACA RM L52D23.a 27
0
a)
c-i 0
4-,
rj
C!) a)
o • CQ 4-'
C)rd0
coo C)
co
.0 I
.-_;- (n
a) -4--)
Q)rj
rMl
0 H
P4
rd
a) -p

NACA RM L52D23a
0 r4 Co
C4-1
0
rd V
co rd
• •-i
rd + o
,0 0 0
G\aJ Cr)
o (1)
41) a)
r1
0
U rd
U) 4)
Cd

0 .-4
a)
c-i 0
+
a) Id
Id a)
rd. ,1 0
0 I 111.-1 0 00 0
00 I
G\- çr —CD
CH
a) cn
ci) a)
r4
0r.xi
a
+ p4 a)
a) +
NACA RM L52D23a
29
• •j !jUUj •• I iiIE!PIUhiiIãI4ii: • V
NONE MEMMEMME Sol .0 101,
1 MEMO ME oil 01, 0 -
MEMOMMEMIN ONE MOMIMMEM mommommm NEESE END am
JimM
- -
MrArNME No M EMOMMOMM MEN M MINES 00111IMEEMEM111111110 SEEEll
I flLflUfl1hWIIIII No ME M Ui • - ll••uuis•uu•u•u••.uuu• •
N.uarnuu.i••ui••u.iu •i'ia i. UIRUU•UU•UiU i UflflflftU. UPNUII
ME
----- I!_ - k It WI IU
I_u...... 'r' II••U UU U lom
1II.UU:
30
NACA RM L52D23a
'0
0 0• 0•bo
nn GO 9O3
0 r1
() t) - H
.' a)0
0 ..-. Ca
cs-I o o -
a) •: -'
pq -p r c-i
0
CO Ca -p rd
a) o •
-rd
o co CH c- O\O a)
• 0 1rzJ- C)
o H'O 0 1p L) 4)
a)
co
a)rd
ci5
o H r1
.t. I. p z-a) rd a)
- -I a)
.-' + &j
0
o c
c1
If ± 0
10 'utoi;;aoo

0 0) N- ¼1) LC (N .-. 0
T U3JJ0O3 JI
I-
0
o a)
co
•4- c-i 0
o
.'-p P.i
('4 •- rg 0)
Id
- 0 • •r-1 • _0) +
ord
co 0 c
0 0 .0 co
Q) a)
• c-i •H
-
0
•'
$1 4)
('4-a) 0
co rd
0
oCd
C'4c
0• O•• •O• O•
1,D 04
0• O
GO
8
tr\
0)
V

Lc
.tz 0 q) •H
•' U)
0) o o 0 U)
q1 0
4.)
(1 P4 • a)
IdId
rdrd +
0i 0 0
o,c U C)
o
0 •..zl O\rJXJ -
0 4-) a)
Q)
a) cl_I
r=i 0'
.'
P4
I 4-:) Cd
o
—Ibo
a c a o 8 cr 'a
0 0
U)
0)
ph
NN\
32
NACA RM L52D23a
L) i N ('1 -• 0'
4U3JJ9OO !JVI
FL

(I
'C U
c° Nt1 •-'• 0 0• 0 0 0 0 8 8
U uoojjaoo
0
C-) a)
+ a) U
(I) U o 0 0
Id
F-4 rd
a).
0
o,1 o
0 0
o\aD
cn
a)
rd
C4-'
.0
a)
ca
co
o d
bto
U '-4
H C-)
0 C)
I
0 I ',D Ifl N\ C' -1 0
70 "u3ç3tJJ9o3 14JTII
3 .814
0.814
3!
NACA BM L52D23a
.008
.006
.0014
o c'j Q) C .002
U) - Cd 0 -
-
t:) l0
0
CH
.I '1) Q).: .010 0+' C)
CO 0
CO Q)
4-' Cd .008 iG)
Cl) +'
.006
.002-
Doç Depth, deg chords
0 0 3.814
chords
A
0.814
10 20 30 ;o
Speed, fps
(a) Tank no. 1.
0 . I I
0 10 20 30 140 Speed, fps
(b) Tank no. 2.
Figure 5.- Variation of strut drag coefficient with speed and depth of hydrofoil submergence.
i-
35
.10 - I
ri .08 -
0.814 c'J
.06
-
vc
0 Tank no. 1 (10.614 ft deep) H 0) I- Tank no. 2 (6.0 ft deep)
II I I
.014 - I I Cj I I rI I
0 Tank no. 1, 0.814c depth I 0 Tank no. 1, 3.814c depth
I Tank no. 2, 0.84c depth .02
I I A Tank no. 2, 3.814c depth I i NACA 653-1418 section
Corrected to A = 10
0 Ii I I I
0 0.5 1.0 1.5 2.0x 10⁶Reynolds number, R
-1-
-2
3
.440 0.5 1.0 1.5 2.0x 10⁶
Reynolds number, R
Figure 6.- Variation of lift-curve slope and angle of zero lift with Reynolds number.
to a)
0
CH +)
H
0
c-i 0
1) H fQ
36
NACA RM L52D23a
-----Tank no. 1
Tank no. 2
.OIi, NACA 63-I48 section
CL
0.6
N 0
I .1
I I
- —L. - - 0.4
I I
Tank no. 1 (10.64 ft deep) I al 0.6
I I
Tank no. 2 (6.0 ft deep) ' I
I I
UR
.. .03 .3
C) r1
.02 C)
14
.01
5 . 10 15 20 25 Speed, fps
(a) Depth of submergence, 0.84 chord.
.0h
cf .03
.3
a> C)
.02 '4
C)
I- - - -
0.6
0I 0
5 10 15 20 25 Speed, fps
(b) Depth of submergence, 3.84 chords.
Figure 7.— Variation of drag coefficient with speed for constant lift, coefficient.
rr --mv '"

r2II z
,r2
Ij
r2
(c/2) 2 + (2f) 2 + b
/ (c/2) 2 + (21)2Free
surface
X
r2'4 Y
/
J(c/2)2 + b2 Ae /
Figure 8.- Horseshoe-vortex arrangement that satisfies the free-surface boundary.
I - I
Figure 9.- Horseshoe-vortex arrangement that satisfactorily approximates the tank boundary conditions. C4
H Cd 0 -I
38
NACA RM L52D23a
0 U'
U'
0
+ U' 0
0• •'
1-k
rd
d C) Cd C4
-. 0
b 0
ca
PA ul
co
•r-I
0 H
0
a) PA 0 H
a)
4) c-i
H
0
rd
cl-I
0 4.)
pq
0 a)
cl-i cl-i
0 H
•0
c - U' - C'J r 0 cm
HI H
Cd I'd
Stfl.d9p 3çT.rçJtrç o Gtd9p a4TUTS 4e sedoi °-JTt ;o OT1
C;
Cd 'd •H
0-p
. 00 0
.- I
0 ' H
0 r4
0 .,-
c.-J.0 Co .Co
H P.
U' r1 rn
0
0
U' 0
lJ\
0 a
•0
0 O\ U' - c.J 0 H
cm H Cd co
tdap etTrtju-r IV :I:ew oq stdap atirtj IV sdois aIno.-rct iO oçe
'—I
g
me
NACA BM L52D23a
0
tr'
0
c' +) 0
.j 0 k CH 0
0C)
o Q
Go
c
-4 C) U.' 0
.4 0 CY od
0 C.)
I .n I
• zt0
H '
. q? 0
H Q) .c
4) CU q.
' 4) PLI V.'
HU)
0 o ,-1
U' 0
I I I I I •'I I I I I 10 O 0 U.' r.' CU H 0 H
CU! r4 cdIc
ctdep çuju et o. st4dop 9pIJ Bado1 9AJU3-JTT jo oç)j

MACA EM L52D23a
Quarter-chord depth. chords
- - -
00 0 0 0
Depth, a2, a1 al
chords Theoretical Experimental
0.53 o 0.59 U 0.3'4 -- 0 1.00 1.09 1.59 -----2.09 - 2.34 --- 0 3.09 ---- 0 3.8 ----- 0 4.09 V 5.00 ---- 0
1.0
.9
.8 a2 a1
.7
.6
10 2D 30 40 Speed. fps
(a) Aspect ratio, 10; tank no. 1.
1.0 c_00O3.8LQuarter-chord depth,
chords
.8 E 8 -
____
0.53 a2 a2
.5 LI 2) 30 140 10 20 30 40
Speed, (pa Speed, (pa
(b) Aspect ratio, 10; tank no. 2. (c) Aspect ratio, 10; tank no. 2 (ref. 2).
1.0[--__0-y-_.O0
0L .9L I I-----------------------109
&z11.00 I
a2 a2n ID
.8 .8-a-- --0.59
a1 a1 .7 .7
.6 .6
.51 10 3D 30 40 10 20
Speed. fps Speed, (pa
(d) Aspect ratio, 6; tank no. 1 (e) Aspect ratio, Ii-; tank no. 2 (ref. 10). (ref. 1).
Figure 11.- Comparison of experimental and theoretical ratio of lift-
curve slopes for aspect ratios 10, 6, and 4.
10.5 .040r 'S
0.5
42
NACA IM L52D23a
• 0L0 .040
Quarter-chord. Quarter-chord
.odepth chord .032 depth,
chords 0.5 0.5
• 024 .024-
75 <3
0.75 .016 0 .016
5 .003 2.0 .003
2.0 0
.0 .2 •Li .6 .3
-00 .2 .'-i- .6 .8
Lift coefficient, CL Lift coefficient, CL
(a) Aspect ratio, 10; tank no. 1. (b) Aspect ratio, 10; tank no. 2.
.032 .032
.024 0.75 .024-
Q 0 <3
1
1.0 .016 016.
008 .003 1.5
2.0
00 .2 •t.i .6 .8 0 .2 .ii .6 .8
Lift coefficient, CL Lift coefficient, CL
(c) Aspect ratio, 6; tank no. 1. (d) Aspect ratio, Ii-; tank no. 2.
Figure 12.- Variation of induced drag coefficient due to the hydrofoil vortex images with lift coefficient for hydrofoils of aspect-ratios 10, 6, and II..
C

.032
C.)
.024
a) -I
.016 o o
.003
032
C.)
- .024
a)
.016 0'
.008
wj
0.024
a)
.016 I.-, 0 0
II
0
°, a.)
a) "-I C.)
.01
a, 0 C.)
.0C
14
.024
a) -I
.016 a) 0 C.)
VRML
I 0 Experimental 0321- Theoretical o
C.)
.02i 7
.0l6I. 4.
c)
008__________c V- d
00 .2 •14 .6 :8 Lift coefficient, CL
Speed, 20 fps
0 1 1
0 .2 .L .6 8 Lift coefficient, CL
Speed. 17 fps
0 1 1
0 .2 .' .6 .8 Lift coefficient, CL
Speed, 25 fps
01 I I. I
0 .2 . . 6 .8 Lift coefficient, CL
Speed, 25 fps
0 I I
0 .2 . . 6 .8 0 .2 . . 6 .8 Lift coefficient, CL Lift coefficient, CL
Speed, 35 fps Speed, 35 fps
Tank no. 1. Tankno. 2.
(a) Depth, 0.84 chord.
Figure 13.- Comparison of experimental and theoretical drag coefficients for aspect'-ratio-10 hydrofoil.
*now 1
0 I I
0 .2 .4 Lift coefficient, CL
Speed, 25 fpsLift coefficient, CL
Speed, 25 fps
WM
4.)
a)
. .016 a) 0 C)
.008 F-.
0
• 032
-' .024 4.,
a)
.016
.008 F-.
.032
C.)
4-)
a) -.-1 C)
.016 a) 0 C)
cd
C.)
a)
C) -1
4
Q)
0 C)
14)4
WIA
C.)024
4)
a)
C)
".4 a) 0 C.)
.008
C i[L NACA RM L52D23a
0 Experimental .032 Theoretical
0.024 0/
/ 0/
C)
.016 o
0080 c
0 I 4- I
0 .2 .4 .6 .6 Lift coefficient, CL Lift coefficient, CL
Speed, 20 fps Speed, 17 fps
01 L I
0 .2 •L.i. .6 .8 0 .2 ..i. .6 .8 Lift coefficient, CL Lift coefficient, CL
Speed, 35 fps Speed, 35 fps
Tank no 1. Tank no. 2.
(b) Depth, 3.84 chords.
Figure 13.— Concluded.
11

0 Experimental
Theoretical WM
L)
- .024
C)
0
•.-, .016
.008C
0 0 .2 .4 .6 .3
Lift coefficient, CL
(b) Depth, 0.84 chord.
I-, C) 0 U
0
45
.032
.024
C,
.016
0
.008Cd
0 I-
0 .2 •14 .6 .8 Lift coefficient, CL
(a) Depth, 0.73 chord.
.032
Q
,.oi6
C,
.008Cd
o 1- _I 0 0 .2 .t .6 .3 0 .2 .4 .6 •3
Lift coefficient, CL Lift coefficient. CL
(c) Depth, 1.79 chords. (d) Depth, 2 .34 chords.
.032 .032
U
.024 0 0
C) 0 C)
:°.o16
.oi6 o
I _______ .0O8
Cd
C' C I
0 .2 . .6 .3 0 .2 . . 6 .8 Lift coefficient, CL Lift coefficient, CL
(e) Depth, 3.09 chords. (f) Depth, 3.84 chords.
Figure 14.- Comparison of experimental and theoretical drag coefficients for aspect-ratio-10 hydrofoil (see ref. 1). Speed, 25 fps.
.032
C) .024
C)
.016 C) 0 U
.008
.032
C)
.024 CD
.016
.008
.024 0)
0). 0 C)
C..
.032
()
. 024 w
".o16 a) 0 C)
.008
0 1 I I.
0 .2 .L. .6 .8 Lift coefficient, CL
Speed, 30 fps
.032
C)
.024 ci) C)
.oi6
,.008
Speed, 30 fps
NACA RM L52D23a
C—)
1)
C.)
0 C)
C.,
Lift coefficient, CL
Speed, 2) fps
o Experimental
.032
- Theoretical
C)
CU
C.,
c
01 I I I
3 0 .2 •4 .6 .8 Lift coefficient, CL
Speed, 20 fps
01 S -01 I - I I
0 .2 .i .6 .8 0 .2 14 .6 .8 Lift coefficient, CL Lift coefficient, CL
Speed, '40 fps Speed, '40 fps
(a) Depth, .1.0 chords. (b) Depth, 7.0 chords.
Figure 17.- Comparison of experimental and theoretical drag coefficients for aspect-ratio-6 hydrofoil (see ref. 10).

C)
C)
0 C)
WM
.008
(b) Depth, 1.09 chords.
Q
U
C)
U' 0 C)
C-.
.032
a C-)
+i 02'-0 U
C)
.016
.0O8
NACA EM L
032
.024
0
.016
.008
Lift coefficient, 0L
(a) Depth, 0.59 chord.
I 0 Experimental
.032 I.- Theoretical
F)
U
C)
4.
U. 0 C)
.008 QOcd
01 I I
0 .2 .L .6 .8j
Lift coefficient, CL
(c) Depth, 2.09 chords.
0 1 0 I I I- I
0 .2 .4 .6 .8 0 .2 .' .6 .8 Lift coefficient, CL Lift coefficient, CL
(d) Depth, 3.09 chords. (e) Depth, 4.09 chords.
Figure 16.- Comparison of experimental and theoretical drag coefficients for aspect-ratio-4bydrofoil (see ref. 2). Speed, 25 fps.
S.
C)• 040
CU
0//F 0
_
010
1'!; (I L •I
NACA BM L52D23a
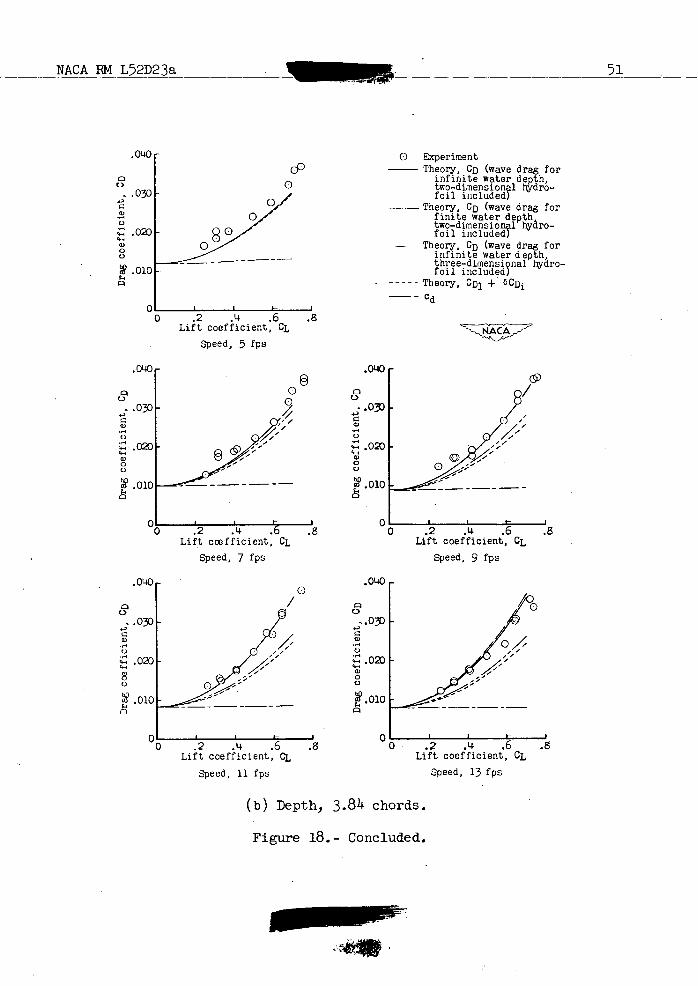
0 Experiment
Theory, CD (wave drag for infinite water depth, two-dimensional hydro-foil included)
-- Theory, CD (wave drag for finite water depth two-dimensional byro-foil included)
Theory, CD (wave drag for infinite water depth three-dimensional hyiro-foil included)
Theory, CD1 + oCD
cd
0 1 4-
0 .2 .4 .6 .8 Lift coefficient, CL
Speed, 5 fps
.050/
.050
.040 I' M. 0140 C) /
C)
.030 030
4.
0,' o/
0 / '4-4
.02) 8 /' .020 0
.010 .010
0 10
1 Lj .2 . .6 .80
Lift coefficient, CL
Speed, 7 fps
• 040 .040
C).030 //Q7 C)
.030
.0 20 '4-. ;
/"-4 C.)
.020 '4-.
0 C)
0 C)
010 W.010 C.
Lift coefficient, CL
Speed, 9 fps
01 I4- 0'
0 .2 .4 .6 .8 0 .2 . .6 .8 Lift coefficient, CL Lift coefficient, CL
Speed, 13 fps Speed. 17 fps
(a) Depth, 0.84 chord.
Figure 17.- Comparison of experimental and theoretical drag coefficients
for aspect-ratio-10 hydrofoil. Water depth, 10.64 feet (tank no. i).
.030
r.
4. .020
a) 0 U.
.010
0
Lift coefficient. CL
Speed, 7 fps
Lift coefficient, CL
Speed, 9 fps
°.030
a) C-,
.020
a) 0 C)
.010 C-,
C
NCARMT52D29
0 Experiment Theory, CD (wave drag for
infinite water depth, two-dimensional hydro-foil included)
----Theory CD (wave drag for finite water depth two-dimension1 hyro-foil included)
---Theory, CD (wave drag for infinite water depth three-dimensional hyaro-foil included)
Theory, C01 + oCDi
-- °d
tozol
- .030
CD
C-,
a) 0 C-,
.010 C-,
.2 .L .6 .8 Lift coefficient, CL
Speed, 5 fps
.0140 / .0140
030 °030
o
.0l0 W.010 C-, --- ---- C-,
Q C:)
0 1 11 0
0 .2 •14 .6 .8 0 .2 .4 .6 .8 Lift coefficient, CL Lift coefficient, CL
Speed, 13 fps Speed, 17 fps
(b) Depth, 384 chords.
Figure 17.- Concluded.
50 NACA EM L52D23a
060 0
.
050
r
10 // I 0//
.040
a)0
I / o I
j.02)
.010
.2 •L
Lift coefficient, CL
Speed, 5 fps
.050
O
t030 0/
1:::
.2 •L .6 .3 Lift coefficient, CL
Speed, 7 fps
jb,1.
I.i .010
0 Experiment
Theory, CD (wave drag for infinite water depth, two-dimensional hydro-foil included)
Theory, CD (wave drag for finite water depth two-dimensional hyaro-foil included)
Theory, CD (wave drag for infinite water depth three-dlmenslQnal hyro- foil included)
Theory, CD1 4- 6CD1
-- Cd
Lift coefficient, CL
Speed, 9 fps WN
.010
DL 0
I.
S
KKOI
.040 Q
C.)
0
.02) U
.010
Dl I I- _I I I
0 .2 •L .6 S 0 .2 •L .6 eg
Lift coefficient, CL Lift coefficient, CL
Speed, 11 fpsSpeed, 13 fps
(a) Depth, o.84 chord..
Figure 18.- Comparison of experimental and theoretical drag coefficients
for aspect-ratio-10 hydrofoil. Water depth, 6.0 feet (tank no. 2).
ENS
ci
.020
.010 IN
3
C-)
• .03
C)
. .02 4. a) 0 0
.01
NACA RM L52D2 3a 51
.0401cP
o 0 030
0
0 0
80 0_
.010
0 .2 •4 .6 .8 Lift coefficient, CL
Speed, 5 fps
0 Experiment Theory, CD (wave drag for
infinite water depth, two-dimensional sjdro-foil included)
Theory, CD (wave drag for finite water depth two-dimensional hyro-foil included)
Theory, CD (wave drag for infinite water depth three-dimensiQnal hydro- foil included)
Theory, CD1 + eCDI
Lift coefficient, CL
Lift coefficient, CL
Speed, 7 fps
Speed, 9 fps
.040 .040 0
•.030 ..030
.020
o 0
i .010 SF010
0I I_I-_I QI_I_I_4-_I 0 .2 .Le .6 .8 0 .2 .' .6 .8
Lift coefficient, CL Lift coefficient, CL
Speed, 11 fps Speed, 13 fps
(b) Depth, 3.84 chords.
Figure 18.- Concluded.
52
NACA RM L52D23a
I—ICl)
H 0 rl
rill
cx
• •' oc\J
a) Do
rd
CuII
H •H 0
Cia)
'Ok a)D • U)
CH 0
U-' • 0
4D
co
cn
Co
H
a)
ri
0
0
0 C 0 0 0 0

NACA RM L52D2 3a 53
-o c'J
co
\\
\ \
+ •-1 co 0
\\ \ 0 \
\
EQ
a)
' \0U) 0
00 \\ 0.12)0I-
\ rd
N cO
\(1)
N.\ 0 4 CU
•HI 0 \\\
H Cd c. •-
HO •:
. .-
.0 01 \
+)H H 0.
..{ d0 0.0 d) d) EQ
• ,-1 a)r1 a) co _.+) ,+) a)—'
Cd 4O
N
+s) Q) a) 01
.-sH H + H +)rl P. co
0)0 '0 0) -4-)
ol '0 ci C.4 ' 0• a) .0
. 00 a)
0 • 5-4
\
0 a) Cd-H
0)H-H
- - (J 0 C)
0CD
0)0 H H .CO cd 0)0
12) ' ..4 q -1 0000+)5-.
Q> 0
••H -H 0
-. C4
0 0.0 (00
100)
Cd E 0-1 I-I 0 -4
C'J,00)
o 00 I I I • .c'J
I
I
P. a)
-'-4
I I
0
.4 CJ 0 .4 C4J•
NACA_LangleY - 7-14-52 - 350
U