na sales & production - s3.amazonaws.coms3.amazonaws.com/zanran_storage/ filena sales &...
TRANSCRIPT
NA SALES & PRODUCTION Taking Our Lumps Though Better For It
FACS Automotive ConferenceNAIASJanuary 12, 2008
Michael RobinetVice President, Global Vehicle Forecasts

2007 © CSM Worldwide
PRESENTATION OUTLINE
• United States Sales Outlook
• NA Production
• Fitting Into A Global Equation
• Summary

2007 © CSM Worldwide
Hmm ….. Never A Dull Moment
2007 © CSM Worldwide2007 © CSM Worldwide
$10
$20
$30
$40
$50
$60
$70
$80
$9019
93
1994
1995
1996
1997
1998
1999
2000
2001
2002
2003
2004
2005
2006
2007
2008
$1.00
$1.50
$2.00
$2.50
$3.00
$3.50
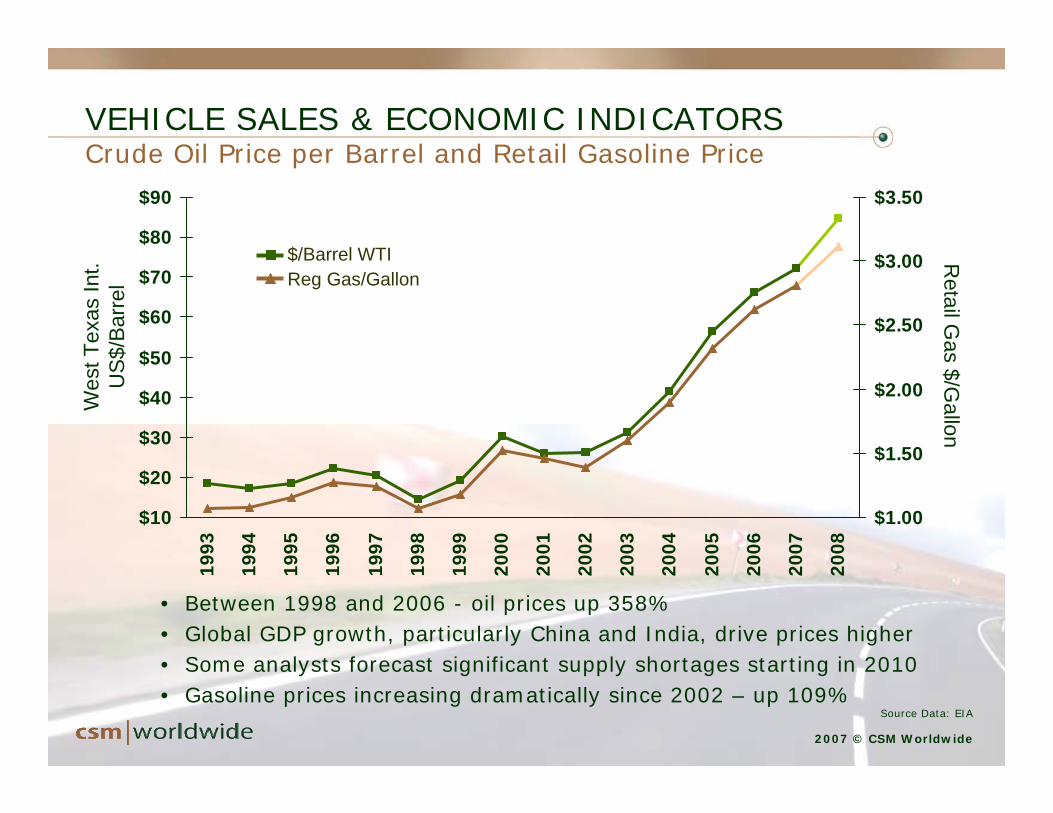
VEHICLE SALES & ECONOMIC INDICATORS Crude Oil Price per Barrel and Retail Gasoline Price
• Between 1998 and 2006 - oil prices up 358% • Global GDP growth, particularly China and India, drive prices higher• Some analysts forecast significant supply shortages starting in 2010• Gasoline prices increasing dramatically since 2002 – up 109%
Wes
t Tex
as In
t.U
S$/B
arre
lR
etail Gas $/G
allon
Source Data: EIA
$/Barrel WTIReg Gas/Gallon

2007 © CSM Worldwide
UNITED STATES SALES OUTLOOK Lethargic Though It Could Have Been Worse
16.116.316.3
16.1 16.015.515.5
16.216.416.3
16.616.7
16.8
16.116.216.7
16.1
17.2
16.216.216.716.616.7
17.6
14
15
16
17
18
19
Jan Feb Mar Apr May Jun Jul Aug Sep Oct Nov Dec
2007 2006
Uni
ts in
mill
ions
• Seasonally Adjusted Annualized Rate (SAAR) tracking at 16.1 million units
• Headwinds pose downside threat in 1Q & 2Q 2008
• Concerns include mounting consumer debt, stiffening credit practices and consumers uninspired by incentive programs

2007 © CSM Worldwide
• Sagging market demand to push sales to lowest level since 1998 • Sizable consumer debt, tightened lending guidelines and high gasoline
prices have diminished purchasing power• Depleted pent-up demand also hampering sales • Long-term, moderate growth stems from improved trends in housing, debt,
scrappage and off-lease prospects
UNITED STATES SALES OUTLOOK Remembering The Good Ole Days
17.3 17.1 16.8 16.6 16.9 16.9 16.6 16.1 15.8 16.1 16.5 16.9 17.3 17.6
0
4
8
12
16
20U
nits
in M
illio
ns
2000
2001
2002
2003
2004
2005
2006
2007
2008
2009
2010
2011
2012
2013

2007 © CSM Worldwide
UNITED STATES SALES OUTLOOK 2007 Sales Forecast By Company
3.82
2.63
2.07
1.070.78
1.55
2.56
0
1
2
3
4
5
GM
Toyo
ta
Ford
Chr
ysle
r
Hon
da
Nis
san
Hyu
ndai
-15%
-10%
-5%
0%
5%
10%2007 ActualYOY % Change
Unit Sales
Uni
ts in
Mill
ions
Market Share
GM, 23.5%
Toyota, 16.2%
Ford, 15.8%
Chrysler, 12.9%
Honda, 9.6%
Nissan, 6.6%
Hyundai, 4.8%

2007 © CSM Worldwide
UNITED STATES SALES OUTLOOK 2008 Sales Forecast By Company
3.63
2.70
1.99
1.180.73
2.59
1.64
0
1
2
3
4
5
GM
Toyo
ta
Ford
Chr
ysle
r
Hon
da
Nis
san
Hyu
ndai
-10%
-5%
0%
5%
10%
15%2008 ForecastYOY % Change
GM2 3 . 7 %
Toy ot a16 . 2 %
For d15 . 8 %
Hy unda i4 . 8 %Ni ssa n
6 . 6 %
Chr y sl e r12 . 9 %
Honda9 . 6 %
Unit Sales
Uni
ts in
Mill
ions
Market Share

2007 © CSM Worldwide
PRESENTATION OUTLINE
• United States Sales Outlook
• NA Production
• Fitting Into A Global Equation
• Summary

2007 © CSM Worldwide
SHORT-TERM OUTLOOK Under Pressure – Short-Term Scenarios
2007 © CSM Worldwide
0
2
4
6
8
10
12
14
16
18
1985 1989 1993 1997 2001 2005 2009
Prod
uctio
n (M
illio
ns)
Detroit 3 New Domestics Total North America
• Negative production environment
• Structural upheaval continues in 2008
• Economic fears and uncertainty hurting demand
• New capacity online late in 2008
• 2009 provides best upside opportunity
• Exports are a positive factor
CAGR = -1.40%
CAGR = 0.40%
CAGR = 9.30%

2007 © CSM Worldwide
200814.4M
Demand
Imports
Capacity
Economics
2007 © CSM Worldwide
US demand weakening amid
growing uncertainty
Japanese imports expected to remain strong to fill supply
gaps
Plant closings and reduced labor
decreasing artificial, subsidized demand
Housing market, credit crunch, volatile fuel
prices adding to weakness
SHORT-TERM OUTLOOK Under Pressure – 2008

2007 © CSM Worldwide
DETROIT 3 VS. NEW DOMESTICSIt Isn’t Bad Everywhere ….
2007 © CSM Worldwide
-500
-400
-300
-200
-100
0
100
200
300
Uni
t Vol
ume
Cha
nge
(Tho
usan
ds) • North American
production to decline 2.0 million units
• New Domestics to grow by 2.0 million units
• Detroit 3 to decline 4.0 million units
• Mirror effect - less effective tool
2000 – 2009

2007 © CSM Worldwide
-500
-400
-300
-200
-100
0
100
200
300
Uni
t Vol
ume
Cha
nge
(Tho
usan
ds)
2007 © CSM Worldwide
14.7M200914.4M200815.1M2007
• Detroit 3 structural changes continue
• Shift in production continues
• New Domestics growth is product driven
• New Domestics continue to add local build and new capacity
• Nissan weakness follows difficult comparisons
SHORT-TERM OUTLOOK Under the Hood – Shifting Fortunes
2007 © CSM Worldwide
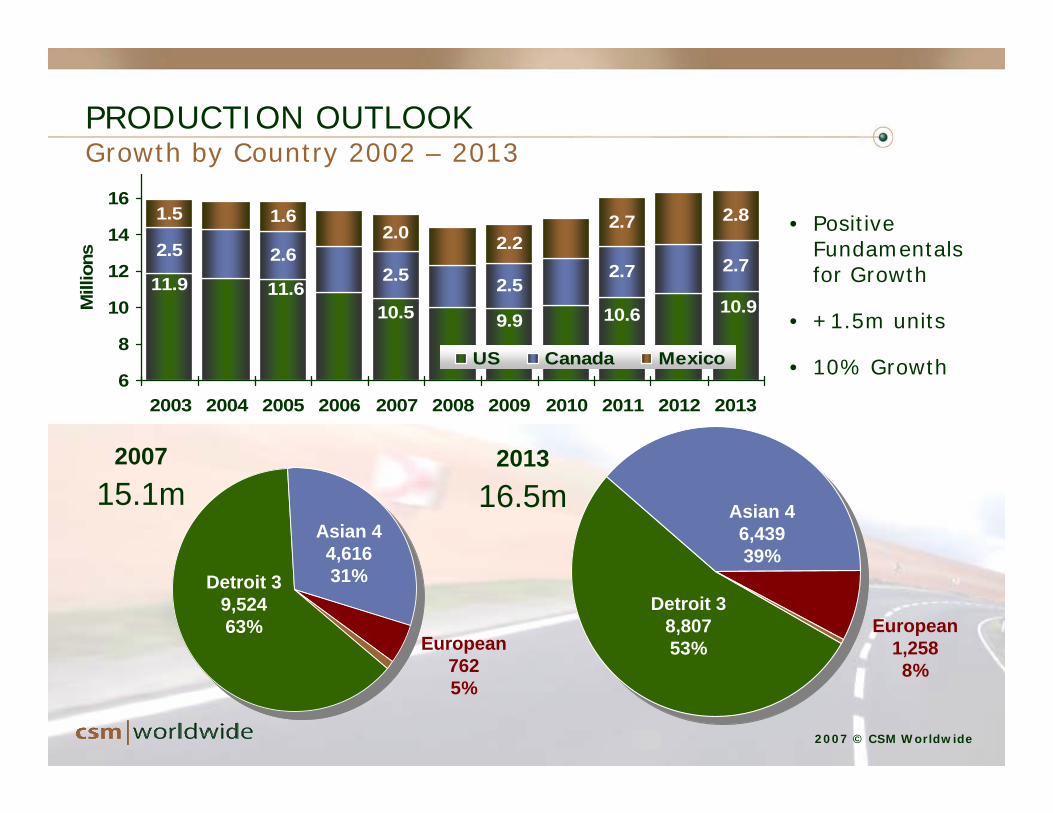
PRODUCTION OUTLOOKGrowth by Country 2002 – 2013
2.5 2.62.5 2.5
2.7 2.7
1.5 1.62.0 2.2
2.7 2.8
11.9 11.610.5 9.9 10.6 10.9
6
8
10
12
14
16
2003 2004 2005 2006 2007 2008 2009 2010 2011 2012 2013
Mill
ions
US Canada Mexico
200715.1m
Detroit 39,52463%
Asian 44,61631%
European7625%
Detroit 38,80753%
Asian 46,43939%
European1,2588%
2007 © CSM Worldwide
201316.5m
• Positive Fundamentals for Growth
• +1.5m units
• 10% Growth

2007 © CSM Worldwide
PRESENTATION OUTLINE
• United States Sales Outlook
• NA Production
• Fitting Into a Global Equation
• Summary

2007 © CSM Worldwide
GLOBAL LIGHT VEHICLE SALESEmphasis on New Markets
18.916.7
6.53.8 4.9
7.24.2
1.9
1.8
1.6
1.21.4
4.2
3.7
0.4
-5
0
5
10
15
20
25
N A
mer
ica
W E
urop
e
Japa
n/K
orea
S A
mer
ica
C/E
Eur
ope
Gtr
Chi
na
Sout
h A
sia
ME/
Afr
ica
Mill
ions
-2%
0%
2%
4%
6%
8%
10%
12%2007-13 Grth20072007-13 CAGR% (R-axis)
N Am, 12%
W EU, 11%
S Am, 8%
CE EU, 11%
China, 29%
S Asia, 26%
ME/Af, 3%
0%
100%
Contribution toGrowth 2007-
201377
% D
evel
opin
g M
arke
ts

2007 © CSM Worldwide
0
10
20
30
40
50
1997
1998
1999
2000
2001
2002
2003
2004
2005
2006
2007
2008
2009
2010
2011
2012
2013
Milli
ons
Japan/Korea W. Europe North America
GLOBAL PRODUCTION TRENDSGlobal Light Vehicle Production by Region
2007 © CSM Worldwide
0
10
20
30
40
Milli
ons M E/Africa S America C/E Europe
Gtr China SE Asia
43.2 45.4 45.547.9
45.58.9 10.4
22.1
36.8
2007-2013 Growth Rate 0.9%
2007-2013 Growth Rate 8.8%52
56
68
85

2007 © CSM Worldwide
0%
2%
4%
6%
8%
10%
12%
14%
16%
18%19
97
1998
1999
2000
2001
2002
2003
2004
2005
2006
2007
2008
2009
2010
2011
2012
2013
Glo
bal P
rodu
ctio
n Sh
are
By
Sale
s Pa
rent
%
GLOBAL PRODUCTION TRENDSGrowth of the Asian 4 by Sales Parent

2007 © CSM Worldwide2007 © CSM Worldwide
GLOBAL PRODUCTION TRENDSGlobal Production By Global Segment
10.610.5
9.3
18.5
16.5
10.5
9.9
5.6
10.5
12.5
9.5
4.1
5.7
10.6
13.9
4.9
10.1
5.9
6.3
12.6
19.2
13.2
6.9
23.2
0 5 10 15 20 25 30
A
B
C
D
E
FF
Millions
2013200720021997
0.0%
2.6%
4.6%
3.2%
5.8%
6.8%3.0
5.2
4.0
3.9
0.9
0.0
2007-13 Grow
th (Mil)
18%A
31%B
23%C
23%D
6%E
-1%FF
Share of Grow
th
Global Segm
ent
CAGR %2007-2013

2007 © CSM Worldwide
SEGMENT FOOTPRINT ANALYSISShare By Major Developed Region & Global Segment
• Europe and Japan/Korea focused on B- and C-segments, due to domestic market requirements and historical abilities
• Fewer space considerations and lower fuel costs drive North America toward C, D, E from Full-Frame
• Shifts reflective of domestic and export trends as production matures in developed markets
0%5%
10%15%20%25%30%35%40%
A
B
C
D
E
FF
EU-2007EU-2013JK-2007JK-2013NA-2007NA-2013

2007 © CSM Worldwide
SEGMENT FOOTPRINT ANALYSISNot Every Emerging Market Is The Same
• China matures –becoming more rationalized into the global framework
• China has similarities to Europe and Japan/Korea
• SE Asia driven by higher A & B segment volume in India, small car projects in Thailand – pickups suffer
• South America is the quintessential B-segment market –little change as the market expands
0%
10%
20%
30%
40%
50%
60%
70%A
B
C
D
E
FF
China-2007China-2013SE Asia-2007SE Asia-2013S Am-2007S Am-2013
2007 © CSM Worldwide2007 © CSM Worldwide
0 1 2 3 4 5 6 7 8 9 10 11 12 13
Toyota
GM
Ren/Niss
Ford
VW
Hyundai
Honda
PSA
Fiat
Suzuki
Units in Millions
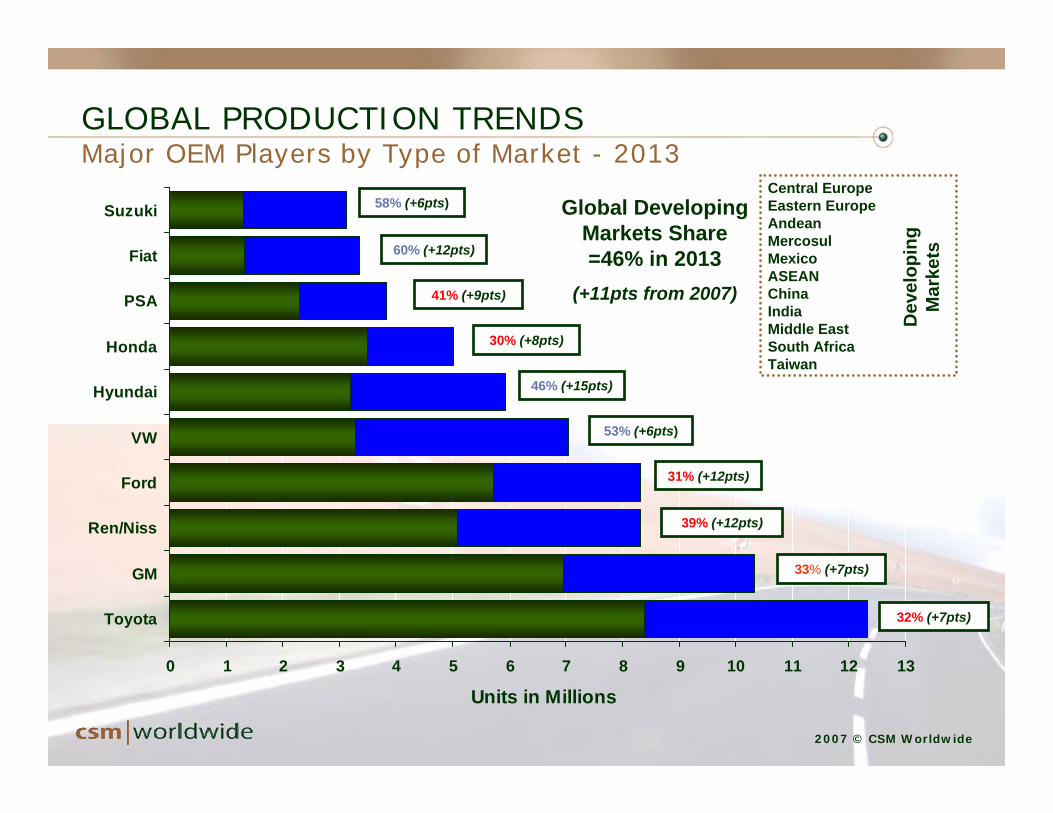
GLOBAL PRODUCTION TRENDSMajor OEM Players by Type of Market - 2013
Dev
elop
ing
Mar
kets
Global Developing Markets Share =46% in 2013
(+11pts from 2007)
Central EuropeEastern EuropeAndeanMercosulMexicoASEANChinaIndiaMiddle EastSouth AfricaTaiwan
39% (+12pts)
31% (+12pts)
53% (+6pts)
46% (+15pts)
30% (+8pts)
41% (+9pts)
60% (+12pts)
58% (+6pts)
32% (+7pts)
33% (+7pts)

2007 © CSM Worldwide2007 © CSM Worldwide
114
153
80
90
100
110
120
130
140
150
160
Th
ou
sa
nd
s
Vo
lum
e/P
lan
tLESS IS MORE AND MORE IS LESSIncreased Scale Affects Plants and Platforms
2007
192
168
155
160
165
170
175
180
185
190
195
Pla
tform
s O
ve
r 5
0K
2013
2005
2013
2005
Volume Per Plant Platforms over 50K/Year

2007 © CSM Worldwide
NOT MY GRANDFATHER’S INDUSTRY
• Style, Technology, Value & Scale• Tomorrow’s differentiators were yesterday’s
• Mastering The Fuel Economy Puzzle• No single solution – several options required• Don’t alienate suppliers – they may be needed
• An ever shrinking world still has its islands
• Little real trade liberalization from the BRICs
• Winners and Losers Will Be Determined by Those who Understand the Market and Those Flexible Enough to Adapt to It – Stick to the Basics

FACS Automotive Conference
2007 © CSM Worldwide
Michael RobinetVice President, Global Vehicle ForecastsCSM WorldwideNorthville, [email protected]