n ational t ransfer a ccounts population aging, intergenerational transfers, and the economy:...
TRANSCRIPT

NNational ational TTransfer ransfer AAccountsccounts
Population Aging, Population Aging, Intergenerational Transfers, Intergenerational Transfers, and the Economy: and the Economy: Introducing Introducing Age into National AccountsAge into National Accounts
Andrew MasonAndrew Mason
University of Hawaii – ManoaUniversity of Hawaii – Manoa
East-West CenterEast-West Center

National Transfer Accounts
MotivationMotivation
► Three features of the economy Three features of the economy Economic lifecycleEconomic lifecycle Population age structure Population age structure Systems for shifting resources across ageSystems for shifting resources across age
► SavingSaving► Public transfer programsPublic transfer programs► Familial Support systemsFamilial Support systems
► Interaction influences economic performance Interaction influences economic performance and generational equityand generational equity
► Implications for economic and population Implications for economic and population policypolicy

National Transfer Accounts
OrganizationOrganization
I.I. Fundamental IdeasFundamental Ideas
II.II. Brief Review of Recent ResearchBrief Review of Recent Research
III.III. Current Effort: National Transfer Current Effort: National Transfer AccountsAccounts
► Basic ConceptsBasic Concepts► Three Important IssuesThree Important Issues

National Transfer Accounts
FundamentalsFundamentalsThe Economic LifecycleThe Economic Lifecycle
0
0.2
0.4
0.6
0.8
1
1.2
0 6 12 18 24 30 36 42 48 54 60 66 72 78 84 90
Rel
ativ
e to
lab
or
inco
me(
30-4
9)
Consumption
Labor Income
Note: Based on estimates for Costa Rica, Indonesia, Taiwan, and Thailand.

National Transfer Accounts
A Simple ModelA Simple Model
► Consumption-Loan Economy (Samuelson Consumption-Loan Economy (Samuelson 1958) 1958) Labor income only Labor income only All output is immediately consumedAll output is immediately consumed Age reallocation system: Transfers only; no savingAge reallocation system: Transfers only; no saving
► Per capita age profiles of consumption and Per capita age profiles of consumption and production are fixed (preceding slide)production are fixed (preceding slide)
► Population age structure variesPopulation age structure varies Young: US 1850Young: US 1850 Middle-aged: India 2040Middle-aged: India 2040 Old: Japan 2050Old: Japan 2050

National Transfer Accounts
Aggregate C and YLAggregate C and YLVery Young Population (US Very Young Population (US 1850)1850)
0
200
400
600
800
1000
1200
1400
1600
0-4
10-
14
20-2
4
30-3
4
40-4
4
50-5
4
60-6
4
70-7
4
80-8
4
90-9
410
0+
C
Yl

National Transfer Accounts
Aggregate C and YLAggregate C and YLVery Young Population (US Very Young Population (US 1850)1850)
0
200
400
600
800
1000
1200
1400
1600
0-4
10-
14
20-2
4
30-3
4
40-4
4
50-5
4
60-6
4
70-7
4
80-8
4
90-9
410
0+
C
Yl
C'

National Transfer Accounts
Aggregate C and YLAggregate C and YLLarge Working-age Pop (India Large Working-age Pop (India 2040)2040)
0
20000
40000
60000
80000
100000
120000
0-4
10-
14
20-2
4
30-3
4
40-4
4
50-5
4
60-6
4
70-7
4
80-8
4
90-9
410
0+
C
Yl
C'

National Transfer Accounts
Aggregate C and YLAggregate C and YLOld Population (Japan 2080)Old Population (Japan 2080)
0
1000
2000
3000
4000
5000
6000
0-4
10-
14
20-2
4
30-3
4
40-4
4
50-5
4
60-6
4
70-7
4
80-8
4
90-9
410
0+
C
Yl
C'

National Transfer Accounts
First Demographic DividendFirst Demographic DividendEconomic Support RatioEconomic Support Ratio
0.7
0.75
0.8
0.85
0.9
0.95
1
1850 1900 1950 2000 2050 2100
US
Japan
India
Source: Mason 2007.
Ratio of effective workersto effective consumers

National Transfer Accounts
Summary of ImplicationsSummary of Implications
►Changes in the relative numbers of Changes in the relative numbers of workers and consumers over the workers and consumers over the demographic transition leads to a demographic transition leads to a demographic dividend.demographic dividend. Bloom and WilliamsonBloom and Williamson Bloom, Canning, and SevillaBloom, Canning, and Sevilla Lee and MasonLee and Mason
►The effect erodes as populations age. The effect erodes as populations age.

National Transfer Accounts
Introduce Capital to the Introduce Capital to the Economic Model Economic Model ►Economy with capitalEconomy with capital
Workers save during their working yearsWorkers save during their working years Rely on asset income and dis-saving during Rely on asset income and dis-saving during
retirement.retirement.
►For solving the old-age lifecycle For solving the old-age lifecycle problem, capital and transfers are close problem, capital and transfers are close substitutes.substitutes.
►However, capital also has favorable However, capital also has favorable effects on economic growth.effects on economic growth.

National Transfer Accounts
What determines the lifecycle What determines the lifecycle demand for capital?demand for capital?►Features of the economic lifecycleFeatures of the economic lifecycle
Consumption by the elderly (now & Consumption by the elderly (now & future)future)
Labor income of the elderly (now & future)Labor income of the elderly (now & future)
►Relative number of elderly: More Relative number of elderly: More elderly implies greater demand for elderly implies greater demand for lifecycle capital.lifecycle capital.

National Transfer Accounts
Demand for WealthDemand for WealthOld versus Young PopulationOld versus Young Population
0
200
400
600
800
1000
1200
1400
1600
0
1000
2000
3000
4000
5000
6000
0-4
10-
14
20-2
4
30-3
4
40-4
4
50-5
4
60-6
4
70-7
4
80-8
4
90-9
410
0+
Young Population Old Population
LC demand for wealth is negligible
LC demand for wealth is large
Yl
C
Yl
C
Note: Uses per capita consumption profiles shown above.

National Transfer Accounts
What determines the lifecycle What determines the lifecycle demand for capital (continued)?demand for capital (continued)?
►Support system for the elderlySupport system for the elderly Public transfers Public transfers Familial transfersFamilial transfers Lifecycle savingLifecycle saving
►Public and familial transfers may Public and familial transfers may crowd out lifecycle savingcrowd out lifecycle saving

National Transfer Accounts
II. Summary of Recent II. Summary of Recent ResearchResearch► Population, Saving, and WealthPopulation, Saving, and Wealth
Changes in age structure are Changes in age structure are partiallypartially responsible responsible for high saving rates in Asia (LMM various; KM for high saving rates in Asia (LMM various; KM 2007).2007).
Longer life expectancy led to behavioral change Longer life expectancy led to behavioral change that reinforced age structure effects (LMM various; that reinforced age structure effects (LMM various; KM 2007). KM 2007).
A decline in familial support for the elderly may A decline in familial support for the elderly may have played an important role (LMM 2003). have played an important role (LMM 2003).
Longer life expectancy and aging are leading to a Longer life expectancy and aging are leading to a permanent increase in wealth (LMM various; KM permanent increase in wealth (LMM various; KM 2007)2007)

National Transfer Accounts
II. Summary of Recent II. Summary of Recent ResearchResearch► Demographic DividendsDemographic Dividends
Changes in age structure produce two Changes in age structure produce two demographic dividendsdemographic dividends
First dividendFirst dividend► Concentration of population in working ages leads to Concentration of population in working ages leads to
more rapid economic growth;more rapid economic growth;► Effect unwinds as populations age.Effect unwinds as populations age.
Second dividend: changes in age structure and Second dividend: changes in age structure and increase in life expectancy lead toincrease in life expectancy lead to
► More investment and more rapid economic growthMore investment and more rapid economic growth► Permanently higher standards of living.Permanently higher standards of living.
Sources: Mason and Lee, various; Mason, various.Sources: Mason and Lee, various; Mason, various.

National Transfer Accounts
Important Issues to be Important Issues to be ExploredExplored► How does the economic lifecycle vary and How does the economic lifecycle vary and
why?why?► What systems do societies use to shift What systems do societies use to shift
resources from surplus to deficit ages?resources from surplus to deficit ages?► Why do the systems vary across countries Why do the systems vary across countries
and evolve over time? and evolve over time? ► What are the implications for economic What are the implications for economic
performance? For generational equity?performance? For generational equity?► What are the implications for economic What are the implications for economic
policy? For population policy? policy? For population policy?

National Transfer Accounts
III. National Transfer III. National Transfer AccountsAccounts► Objective: Objective:
Develop and apply a comprehensive system of accounts Develop and apply a comprehensive system of accounts that measures economic flows across age groups in a that measures economic flows across age groups in a manner consistent with the System of National Accounts. manner consistent with the System of National Accounts.
► Conceptual foundation: Conceptual foundation: Lee (1994) but also Samuelson (1958), Diamond (1965), Lee (1994) but also Samuelson (1958), Diamond (1965),
and Willis (1988).and Willis (1988).► Organization: Organization:
Collaboration between EWC/UH and UC-Berkeley. Core Collaboration between EWC/UH and UC-Berkeley. Core funding from NIA. Sub-projects supported by UNFPA, IDRC, funding from NIA. Sub-projects supported by UNFPA, IDRC, MacArthur Foundation and others.MacArthur Foundation and others.
► Website: www.ntaccounts.orgWebsite: www.ntaccounts.org

National Transfer Accounts
Participating CountriesParticipating Countries
Asia/OceaniaAsia/OceaniaChinaChina
IndiaIndia
IndonesiaIndonesia
JapanJapan
Korea, S.Korea, S.
PhilippinesPhilippines
TaiwanTaiwan
ThailandThailand
AustraliaAustralia
EuropeEuropeAustriaAustria
FinlandFinland
FranceFrance
HungaryHungary
SloveniaSlovenia
SwedenSweden
N AmericaN AmericaUnited StatesUnited States
Latin AmericaLatin AmericaBrazilBrazil
ChileChile
Costa RicaCosta Rica
MexicoMexico
UruguayUruguay
AfricaAfricaKenyaKenya
NigeriaNigeria

National Transfer Accounts
Japan Consumption and Labor Income, 2004
0
2,000
4,000
6,000
8,000
10,000
12,000
0 10 20 30 40 50 60 70 80 90
Yen (billions)
Source: Ogawa et al. 2007.
Labor Income
Consumption

National Transfer Accounts
Japan Lifecycle Deficit, 2004
-5000
-4000
-3000
-2000
-1000
0
1000
2000
3000
4000
5000
0 10 20 30 40 50 60 70 80 90
Yen (billions)

National Transfer Accounts
Inter-age Transfers
-5000
-4000
-3000
-2000
-1000
0
1000
2000
3000
4000
5000
0 10 20 30 40 50 60 70 80 90
Yen (billions)
GovernmentsFamilies
Charitable Organizations

National Transfer Accounts
Inter-age Asset-based Flows
-5000
-4000
-3000
-2000
-1000
0
1000
2000
3000
4000
5000
0 10 20 30 40 50 60 70 80 90
Yen (billions)
Accumulation anddis-accumulation
of assets
Accumulation anddis-accumulation
of debt

National Transfer Accounts
The Flow Account IdentityThe Flow Account Identity
► InflowsInflows Labor IncomeLabor Income Asset IncomeAsset Income Transfer InflowsTransfer Inflows
► OutflowsOutflows ConsumptionConsumption SavingSaving Transfer OutflowsTransfer Outflows
Inflows Outflows
( ) ( ) ( ) ( ) ( ) ( )l aY a Y a a C a S a a
Lifecycle Deficit Asset-based Reallocations Net Transfers
Age Reallocations
( ) ( ) ( ) ( ) ( ) ( )l aC a Y a Y a S a a a

National Transfer Accounts
Flow Account DetailsFlow Account Details
► Consumption: public and private for health, Consumption: public and private for health, education, housing, and other.education, housing, and other.
► Public transfers: in-kind (health, education, Public transfers: in-kind (health, education, other) and cash (pensions and other).other) and cash (pensions and other).
► Private transfers: intra-household for Private transfers: intra-household for health, education, housing, and all other; health, education, housing, and all other; inter-household for other. inter-household for other.
► Asset-based reallocations: Public and Asset-based reallocations: Public and private investment; public and private private investment; public and private credit/debt.credit/debt.
► Flows to ROW: remittances, foreign Flows to ROW: remittances, foreign investment, foreign aid.investment, foreign aid.

National Transfer Accounts
Approach to EstimationApproach to Estimation
►National Income Accounts and other National Income Accounts and other aggregate statistics are used as aggregate statistics are used as aggregate controlsaggregate controls
►Age profiles are estimated using Age profiles are estimated using nationally representative surveys, e.g., nationally representative surveys, e.g., income and expenditure surveys, labor income and expenditure surveys, labor force surveys, health expenditure force surveys, health expenditure surveys, etc. surveys, etc.
►Common methodology documented on Common methodology documented on www.ntaccounts.orgwww.ntaccounts.org

National Transfer Accounts
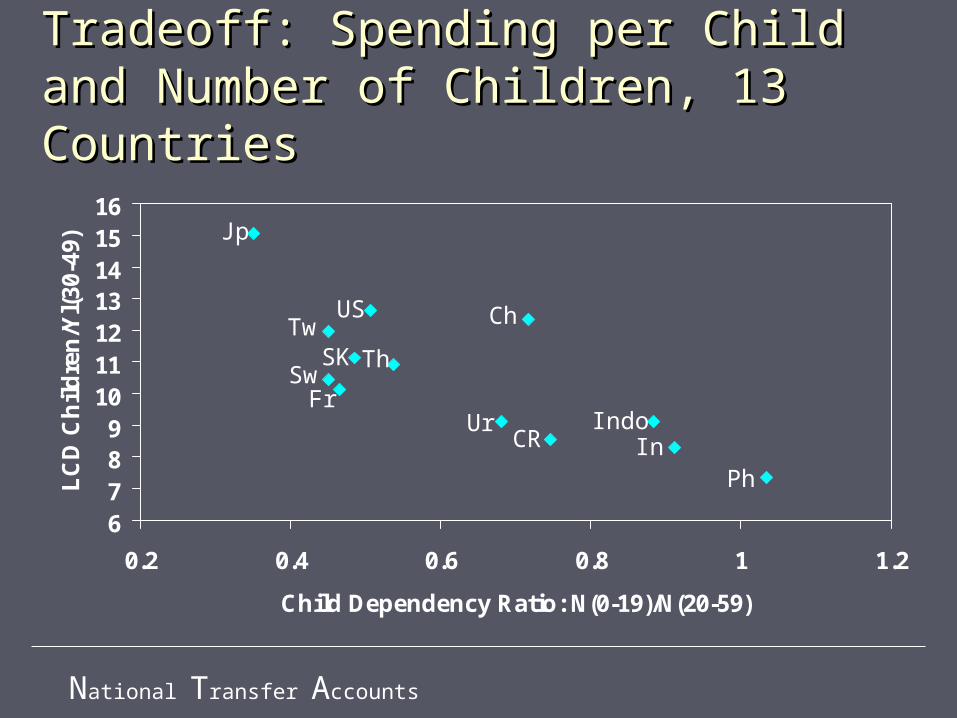
Issue 1: Lifecycle Deficit, Issue 1: Lifecycle Deficit, ChildrenChildren►Does the lifecycle deficit per child Does the lifecycle deficit per child
increase as the number of children increase as the number of children declines? declines? Becker quality-quantity tradeoffBecker quality-quantity tradeoff If so, the decline in fertility will have a If so, the decline in fertility will have a
smaller effect on capital accumulation. smaller effect on capital accumulation. However, if consumption is higher because However, if consumption is higher because
parents are spending more on education, parents are spending more on education, then human capital will increase as the then human capital will increase as the number of children declines. number of children declines.

National Transfer Accounts
Per Capita Lifecycle Deficit, Per Capita Lifecycle Deficit, Japan 2004, Survival WeightedJapan 2004, Survival Weighted
0
0.2
0.4
0.6
0.8
1
1.2
1.4
0 10 20 30 40 50 60 70 80 90
Age
Rel
ativ
e to
Yl(
30-4
9)
Note. US 1985-89 life table used for all countries.

National Transfer Accounts
Tradeoff: Spending per Child and Tradeoff: Spending per Child and Number of Children, 13 CountriesNumber of Children, 13 Countries
y = -7.7914x + 15.473
R2 = 0.6125
6789
10111213141516
0.2 0.4 0.6 0.8 1 1.2
Child Dependency Ratio: N(0-19)/N(20-59)
LC
D C
hil
dre
n/Y
l(30
-49)
National Transfer Accounts
Tradeoff: Spending per Child and Tradeoff: Spending per Child and Number of Children, 13 CountriesNumber of Children, 13 Countries
6789
10111213141516
0.2 0.4 0.6 0.8 1 1.2
Child Dependency Ratio: N(0-19)/N(20-59)
LC
D C
hil
dre
n/Y
l(30
-49)
Jp
US ChTwSK Th
SwFr
IndoUrCR In
Ph
National Transfer Accounts
Issue 2: Lifecycle Deficit, Issue 2: Lifecycle Deficit, ElderlyElderly►Does the lifecycle deficit per elderly Does the lifecycle deficit per elderly
decline as the number of elderly rises? decline as the number of elderly rises? Preston and others argue yes – political Preston and others argue yes – political
power. power. If so, the rise in the old-age population If so, the rise in the old-age population
may lead to a greater fiscal burden. may lead to a greater fiscal burden.

National Transfer Accounts
Tradeoff: Spending per Elderly and Tradeoff: Spending per Elderly and Number of Elderly, 13 CountriesNumber of Elderly, 13 Countries
y = 11.993x + 4.5285
R2 = 0.4266
23456789
101112
0.1 0.15 0.2 0.25 0.3 0.35 0.4 0.45 0.5
Old-age Dependency Ratio: N(60+)/N(20-59)
LC
D E
lder
ly/Y
l(30
-49)

National Transfer Accounts
Tradeoff: Spending per Elderly and Tradeoff: Spending per Elderly and Number of Elderly, 13 CountriesNumber of Elderly, 13 Countries
23456789
101112
0.1 0.15 0.2 0.25 0.3 0.35 0.4 0.45 0.5
Old-age Dependency Ratio: N(60+)/N(20-59)
LC
D E
lder
ly/Y
l(30
-49)
UrJpUS
Fr
Sw
CRTw
ThCh
SK
Ph InIndo

National Transfer Accounts
Issue 3. Support Systems for Issue 3. Support Systems for the Elderly. the Elderly. ►How do they differ across countries?How do they differ across countries?►Do Asian countries rely more on familial Do Asian countries rely more on familial
transfers and Western and Latin transfers and Western and Latin American countries more on public American countries more on public transfers? transfers?
►Does the expansion of public systems Does the expansion of public systems crowd saving as hypothesized by crowd saving as hypothesized by Feldstein?Feldstein?
►Or familial transfers? Or familial transfers?

National Transfer Accounts
Old-Age Reallocation SystemsOld-Age Reallocation Systems
Saving
Public Transfers
FamilialTransfers
Traditional society?
Capital-based transformation
Social welfare transformation

National Transfer Accounts
Old-Age Reallocation SystemsOld-Age Reallocation Systems
Saving
Public Transfers
FamilialTransfers
Public transfers and familial transfers are substitutes
(Barro).

National Transfer Accounts
Old-Age Reallocation SystemsOld-Age Reallocation Systems
Saving
Public Transfers
FamilialTransfers
Public transfers to the elderly crowd out saving
(Feldstein).

National Transfer Accounts
1/3
1/3
1/3
2/3
2/3
2/3
Assets
PublicTransfers
FamilyTransfers
Public=-1/3
Family=-1/3
Reallocations as a share of lifecycle deficit of the elderly.

National Transfer Accounts
1/3
1/3
1/3
2/3
2/3
2/3
Assets
PublicTransfers
FamilyTransfers
Public=-1/3
Family=-1/3
Net public transfers downward
Reallocations as a share of lifecycle deficit of the elderly.

National Transfer Accounts
1/3
1/3
1/3
2/3
2/3
2/3
Assets
PublicTransfers
FamilyTransfers
Public=-1/3
Family=-1/3
Net public transfers downward
Net family transfers downward
Reallocations as a share of lifecycle deficit of the elderly.

National Transfer Accounts
1/3
1/3
1/3
2/3
2/3
2/3
Assets
PublicTransfers
FamilyTransfers
Public=-1/3
Family=-1/3
Reallocations as a share of lifecycle deficit of the elderly.

National Transfer Accounts
1/3
1/3
1/3
2/3
2/3
2/3
Assets
PublicTransfers
FamilyTransfers
Public=-1/3
Family=-1/3
Reallocations as a share of lifecycle deficit of the elderly.
Combined net transferdownward

National Transfer Accounts
Old-age Reallocation System, Selected Countries.
0
50
75
100
75
75
50
50
25
25
0
0
25
100
100
Asset-based (%)
Public transfers (%)
Family Transfers (%)
US
Thailand
Costa Rica
Japan
Taiw an
Korea
Familial transfers equally important in Thailand, Korea, and Taiwan (36-
40%). Net familial transfers near zero in US, CR, and J. Large
public transfers in CR and J. More
reliance on assets in CR & US.
Net public transfers to elderly are zero in
Thailand; about 25% in Taiwan and Korea.

National Transfer Accounts
Old-age Reallocation System, Selected Countries.
0
50
75
100
75
75
50
50
25
25
0
0
25
100
100
Asset-based (%)
Public transfers (%)
Family Transfers (%)
US
Thailand
Costa Rica
Japan
Taiw an
Korea
Reliance on assets in old-age

National Transfer Accounts
Old-age Reallocation System, 65 to 85-year-olds, Taiwan, 2003.
0
50
75
100
75
75
50
50
25
25
0
0
25
100
100
Asset-based (%)
Public transfers (%)
Family Transfers (%)
65-year-olds67% assets, 2%
public, 32% private
85-year-olds23% assets, 39%
public, 38% private

National Transfer Accounts
Old-age Reallocation System, Costa Rica 2004
0
50
75
100
75
75
50
50
25
25
0
0
25
100
100
Asset-based (%)
Public transfers (%)
Family Transfers (%)
85

National Transfer Accounts
Old-age Reallocation System, Uruguay 1994
0
50
75
100
75
75
50
50
25
25
0
0
25
100
100
Asset-based (%)
Public transfers (%)
Family Transfers (%)
85

National Transfer Accounts
Old-age Reallocation System, 65-85-year-olds, Taiwan, 2003.
0
50
75
100
75
75
50
50
25
25
0
0
25
100
100
Asset-based (%)
Public transfers (%)
Family Transfers (%)
From ages 65 to 80, familial share varies little. Public rising and asset-based declining.
After 80 familial share is rising
and asset-based
declining.
Old-age Reallocation SystemFinland, 2003, 65-85 and Philippines, 1999, 65-80.
0
50
75
100
75
75
50
50
25
25
0
0
25
100
100
Asset-based (%)
Public transfers (%)
Family Transfers (%)
Finland 65
Finland 85
Philippines 80
Philippines 72

National Transfer Accounts
Old-age Reallocation System, 75-year-olds, Taiwan, 1977-2003.
0
50
75
100
75
75
50
50
25
25
0
0
25
100
100
Asset-based (%)
Public transfers (%)
Family Transfers (%)
1995-2003
1977-1994
Asset-based reallocations and public transfers have increased
over time; familial transfers have declined
precipitously.
NHI began in 1995; net public
transfers increased.

National Transfer Accounts
Summary of Support Summary of Support Systems Systems ► Estimates are preliminaryEstimates are preliminary► Old-age support systemsOld-age support systems
Show wide variationShow wide variation Vary with the age of the elderlyVary with the age of the elderly Are changing rapidlyAre changing rapidly
► Familial support system for the elderlyFamilial support system for the elderly Small in high-income countries (West and Japan)Small in high-income countries (West and Japan) Upward in rest of Asia, but declining over timeUpward in rest of Asia, but declining over time Downward in Latin AmericaDownward in Latin America

National Transfer Accounts
Warnings!Warnings!
►NIPA and NTA are incompleteNIPA and NTA are incomplete TimeTime EnvironmentEnvironment
►Aggregate data vary in quality and Aggregate data vary in quality and coveragecoverage
► Imputing values to individuals based Imputing values to individuals based on values for households is difficulton values for households is difficult

National Transfer Accounts
Final RemarksFinal Remarks
►Economic resources shifted across age Economic resources shifted across age are enormous.are enormous.
► Important in many respectsImportant in many respects Accumulation of human and physical Accumulation of human and physical
capitalcapital Generational equityGenerational equity Economic growthEconomic growth Externalities to childbearingExternalities to childbearing
►Measuring and studying these flows is Measuring and studying these flows is difficult but essential. difficult but essential.

NNational ational TTransfer ransfer AAccountsccounts
Support for this project has been provided Support for this project has been provided by:by:
• National Institute on Aging: R37-AG025488 and R01-National Institute on Aging: R37-AG025488 and R01-AG025247AG025247
• NUPRI Academic Frontier Project, Government of JapanNUPRI Academic Frontier Project, Government of Japan
• John D. and Catherine T. MacArthur Foundation John D. and Catherine T. MacArthur Foundation
• International Development Research Center (IDRC)International Development Research Center (IDRC)
• United Nations Population Fund (UNFPA)United Nations Population Fund (UNFPA)

National Transfer Accounts
The National Transfer Accounts project is a collaborative effort of East-West Center, Honolulu
and Center for the Economics and
Demography of Aging, University of California - Berkeley
Lee, Ronald, Co-DirectorLee, Ronald, Co-Director
Mason, Andrew , Co-Director Mason, Andrew , Co-Director
Auerbach, Alan Auerbach, Alan
Miller, Tim Miller, Tim
Lee, Sang-Hyop Lee, Sang-Hyop
Donehower, Gretchen Donehower, Gretchen
Ebenstein, Avi Ebenstein, Avi
Wongkaren, TurroWongkaren, Turro
Takayesu, Ann Takayesu, Ann
Boe, Carl Boe, Carl
Comelatto, Pablo Comelatto, Pablo
Sumida, Comfort Sumida, Comfort
Schiff, Eric Schiff, Eric
Stojanovic, Diana Stojanovic, Diana
Langer, EllenLanger, Ellen
Chawla, AmonthepChawla, Amonthep
Pajaron, Marjorie CincoPajaron, Marjorie Cinco

National Transfer Accounts
Japan Key Institutions: Nihon University Population Research
Institute and the Statistics Bureau of Japan, Tokyo, Japan. Ogawa, Naohiro, Country Leader
Matsukura, Rikiya Maliki
Obayashi, Senichi Kondo, Makoto Fukui, Takehiro
Ihara, HajimeSuzuki, Kosuke
Akasaka, Katsuya Moriki, Yoshie
Makabe, Naomi Ogawa, Maki

National Transfer Accounts
AustraliaKey Institution: Australia National University
Jeromey Temple, Country LeaderBrazil
Turra, Cassio, Country Leader Lanza Queiroz, BernardoRenteria, Elisenda Perez
Chile Key Institution: United Nations Economic Commission for
Latin America and the Carribean, Santiago, Chile Bravo, JorgeMauricio Holz

National Transfer Accounts
Taiwan Key Institution: The Institute of
Economics, Academia Sinica, Taipei, Taiwan.
Tung, An-Chi, Country LeaderLai, Mun Sim (Nicole)
Liu, Paul K.C.Andrew Mason
China Key Institution: China Center for
Economic Research, Beijing, China.
Ling, Li, Country Leader Chen, Quilin
Jiang, Yu
National Transfer Accounts
France Wolff, Francois-Charles, Country Leader
Bommier, Antoine Thailand
Key Institution: Economics Department, Thammasat University. Phananiramai, Mathana, Country Leader
Chawla, Amonthep (Beet) Inthornon, Suntichai
India Key Institution: Institute for Social and Economic Change, Bangalore
Narayana, M.R., Country Leader Ladusingh, L.
MexicoKey Institution: Consejo Nacional de Población
Partida, Virgilio, Country Leader Mejía-Guevara, Iván

National Transfer Accounts
Indonesia Key Institution: Lembaga Demografi, University of Indonesia, Jakarta, Indonesia.
Maliki, Country Leader Wiyono, Nur Hadi Nazara, Suahasil
Chotib Philippines
Key Institution: Philippine Institute for Development Studies. Racelis, Rachel H., Country Leader
Salas, John Michael Ian S.Pajaron, Marjorie Cinco
Sweden Key Institution: Institute for Future Studies, Stockholm, Sweden.
Lindh, Thomas, Country Leader Johansson, Mats Forsell, Charlotte

National Transfer Accounts
Uruguay Bucheli, Marisa, Country Leader
Furtado, Magdalena Rodrigo Ceni
Cecilia Rodriguez South Korea
An, Chong-Bum , Country LeaderChun, Young-JunLim, Byung-In
Kim, Cheol-Hee Jeon, Seung-Hoon
Gim, Eul-Sik Seok, Sang-Hun
Kim, Jae-Ho

National Transfer Accounts
Austria Key Institution: Vienna Institute of Demography Fuernkranz-Prskawetz, Alexia, Country Leader
Sambt, Joze Costa Rica
Key Institution: CCP, Universidad de Costa Rica Rosero-Bixby, Luis, Country Leader
Maria Paola Zuniga Slovenia
Sambt, Joze, Country Leader Hungary
Key Institution: TARKI Social Research InstituteGal, Robert
Medgyesi, Marton Finland
Key institutions: The Finnish Center for Pensions And the Finnish Pension Alliance
Vanne, ReijoGröhn, Jukka
Vaittinen, Risto

National Transfer Accounts
United States Key Institution: Center for the Economics and Demography of Aging
Lee, Ronald, Country LeaderMiller, Tim
Ebenstein, Avi Boe, Carl
Comelatto, Pablo Donehower, Gretchen
Schiff, EricLanger, Ellen

National Transfer Accounts
Kenya Mwabu, Germano
NigeriaSoyibo, Adedoyin

NNational ational TTransfer ransfer AAccountsccounts
Thank youThank you