n 2 -broadened 13 ch 4 at 80 to 296 k mary ann h. smith 1, keeyoon sung 2, linda r. brown 2, timothy...
Post on 21-Dec-2015
214 views
TRANSCRIPT

N2-broadened 13CH4 at 80 to 296 K
Mary Ann H. Smith1, Keeyoon Sung2, Linda R. Brown2, Timothy J. Crawford2, Arlan W. Mantz3, V. Malathy Devi4, and D. Chris Benner4
1Science Directorate, NASA Langley Research Center, Hampton, VA 23681, U.S.A.2Science Division, Jet Propulsion Laboratory, California Institute of Technology,
Pasadena, CA 91109, U.S.A. 3Dept. of Physics, Astronomy and Geophysics, Connecticut College,
New London, CT 06320, U.S.A. 4The College of William and Mary, Williamsburg, VA 23187, U.S.A.
11th International HITRAN Conference, 16-18 June 2010

Motivation
11th International HITRAN Conference, 16-18 June 2010
Titan atmospheric spectrumBrightness T (K) vs.Wavenumber (cm-1) recorded by CIRS onboard the Cassini spacecraft (Coustenis et al. , Icarus (2007)
Need a cold cell with good temperature control !!!
Titan atmospheric temperature range 70 - 200 K up to 5% CH4 in N2
12CH4, 13CH4, and CH3D bands overlap at 7.5 μm. Determine Titan 13C/12C and D/H ratios Titan temperature retrievals
HITRAN CH4 halfwidths and shifts based mostly on lab measurements at >200 K Extrapolation from HITRAN can lead to inaccuracies???

Cells cooled by closed-cycle helium refrigerators
11th International HITRAN Conference, 16-18 June 2010
Heritage from collisional-cooling cells designed and used for microwave studies by DeLucia group at OSU.
Cells constructed by A. Mantz have been used with infrared TDL spectrometers and with the Kitt Peak FTS.
New helium-cooled cells were specifically designed to fit in the sample compartment of a Bruker IFS 120 HR or IFS 125 HR FTS.
First cell was constructed at Connecticut College using Bruker drawings, shipped to JPL in April 2009, and successfully installed and tested in the Bruker IFS 125 HR.
Good news: Vibrations from the helium refrigerator did not affect FTS performance.

Bruker IFS 125 HR facility at JPL
11th International HITRAN Conference, 16-18 June 2010
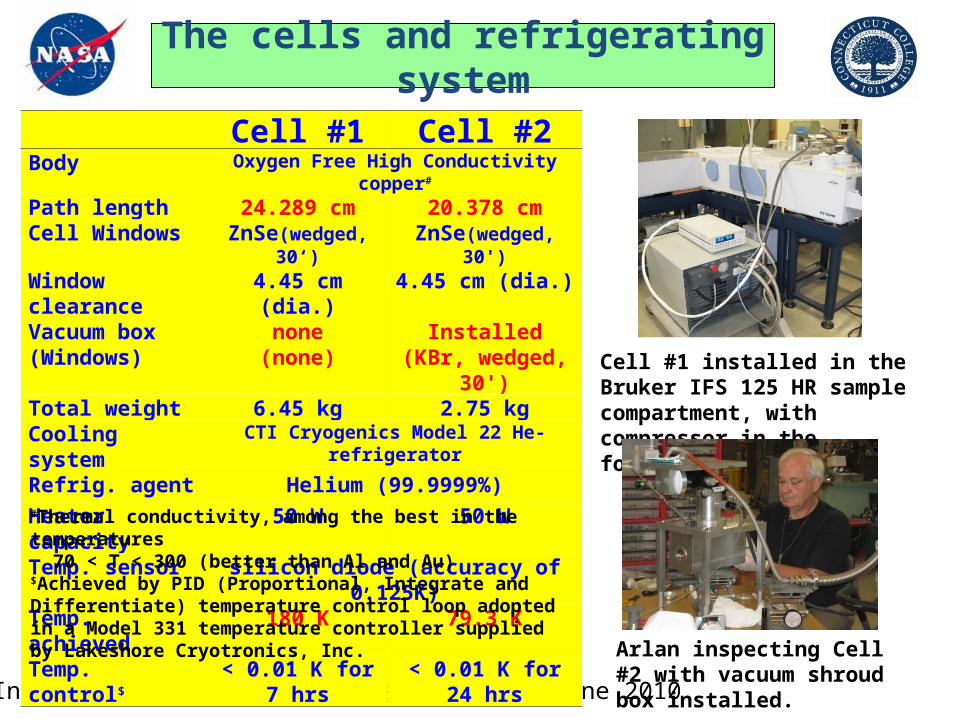
The cells and refrigerating system
11th International HITRAN Conference, 16-18 June 2010
Cell #1 Cell #2Body Oxygen Free High Conductivity copper#
Path length 24.289 cm 20.378 cmCell Windows ZnSe(wedged, 30‘) ZnSe(wedged, 30')Window clearance 4.45 cm (dia.) 4.45 cm (dia.)Vacuum box (Windows)
none(none)
Installed(KBr, wedged, 30')
Total weight 6.45 kg 2.75 kgCooling system CTI Cryogenics Model 22 He-refrigeratorRefrig. agent Helium (99.9999%)
Heater capacity 50 W 50 WTemp. sensor silicon diode (accuracy of 0.125K)Temp. achieved 180 K 79.3 KTemp. control$ < 0.01 K for 7 hrs < 0.01 K for 24 hrs
Cell #1 installed in the Bruker IFS 125 HR sample compartment, with compressor in the foreground.
#Thermal conductivity, among the best in the temperatures 70 < T < 300 (better than Al and Au)$Achieved by PID (Proportional, Integrate and Differentiate) temperature control loop adopted in a Model 331 temperature controller supplied by Lakeshore Cryotronics, Inc.
Arlan inspecting Cell #2 with vacuum shroud box installed.

Ice buildup on cell windows
11th International HITRAN Conference, 16-18 June 2010
Top panel (Cell #1): Ice features grew with time Resulting in changes in the continuum Limiting integration time for coadding
Changing backgroundDiminished temperature stability
Middle panel (Cell #1): Some features are persistent. Windows warm up more slowly than the cell body. Bottom panel (Cell #2) The ice features diminished substantially
Possible gas sources of ice (outside or inside the cell): H2O CO2 CH4 C2H6 their mixtures, and others?

Cooling performance of Cell #2
(with vacuum shroud)
11th International HITRAN Conference, 16-18 June 2010
0 200 400 600 800 1000 1200
120
140
160
180
200
220
240
260
280
300
320Set#14: Cooling the cell
Elapsed time (min)
Cel
l tem
p (K
)
16 17 18 19 20 21 22 23 24 1 2 3 4 5 6 7 8 9 10 11
02/15/2010 start:15:22
0 5 10 15 2078.5
79
79.5
80
80.5Cold Cell Temp Set.T = 80K
Elapsed time (hour)
Te
mp
(K
)
Set#18 Set#19 Set#20 Set#21 Set#22

Spectra of N2-broadened 13CH4 at 296 K and 80 K
11th International HITRAN Conference, 16-18 June 2010
Pure sample (99% 13C) spectrum at 296K P = 1.05 Torr T = 295.8 K Lots of features from high J transitions
N2-broadened spectrum at 296K Ptot = 795.6 Torr Ps = 1.03 Torr T = 295.8 K The high J features broadened out.
N2-broadened spectrum at 80K Ptot = 299.3 Torr Ps = 1.20 Torr T = 79.53 K The high J features almost disappeared.

Initial retrievals: 13CH4 R(2) manifold
11th International HITRAN Conference, 16-18 June 2010
Why choose the R(2) manifold? Two lines only, well isolated at low P Low J lines are persistent at low T. No line mixing is expected between F and E symmetry species. Voigt profile is good enough.
Selected 9 low-abundance spectra to avoid self-broadening.
Retrievals for three T rangesSubset#1: 181 – 296 KSubset#2: 80 – 181 KEntire Set: 80 – 296 K
Retrievals at individual temperatures to examine power-law T-dependence.

13CH4 R(2) Multispectrum Fitting Residuals
11th International HITRAN Conference, 16-18 June 2010
Fitting residuals from the Entire set(►)from Subset #1 (▼)

Temperature Dependences
11th International HITRAN Conference, 16-18 June 2010
γo(T) = γo(To) × (To/T)n
γo(T) = half width at T at 1 atmTo = reference T (296 K unless otherwise noted)n = temperature dependencePower law
δo(T) = δo(To) + δ'×(T-To)
δo(T) = half width at T at 1 atmTo = reference T (296 K unless otherwise noted)δ' = temperature dependenceNote that we do not use a power law here.
Lorentz line widths
Pressure-induced line shifts

R(2) Preliminary Fit Results
11th International HITRAN Conference, 16-18 June 2010
Transition γ0 n δ0 δ′ No. Spectra
R2 F2 1 (1313.722 cm-1)
Subset#1: 181 – 296 K 0.0627(1) 0.855(6) −0.0017(1) 3(2)E-06 5Subset#2: 80 – 181 K 0.0609(3) 0.898(5) −0.0012(6) 7(4)E-06 5Entire Set: 80 – 296 K 0.0619(1) 0.887(3) −0.0017(1) 7(1)E-06 9R2 E 1 (1313.788 cm-1)
Subset#1: 181 – 296 K 0.0538(1) 0.801(7) −0.0019(1) 1.3(2)E-05 5Subset#2: 80 – 181 K 0.0516(3) 0.890(7) +0.0019(7) 4.3(5)E-05 5Entire Set: 80 – 296 K 0.0531(1) 0.860(4) −0.0013(2) 2.3(2)E-05 9
Note: Units of γ and δ are cm-1 atm-1 at 296K, units of δ′ are cm-1 atm-1 K-1, and n is unitless.

Evidence for departure from power law
11th International HITRAN Conference, 16-18 June 2010
0 0.1 0.2 0.3 0.4 0.5 0.6
-1 .3
-1 .2
-1 .1
-1
-0 .9
-0 .8
-0 .713CH
4(
4)/N
2R(2) F2 1 (1313.722 cm
-1)
R(2) E 1 (1313.788 cm-1
)
log(To/T)
log
o
310 276 246 219 196 174 155 138 123 110 98 87 78T (K)
13CH4/N2 fit to the empirical power law, Sung et al., JMS in press (2010).
γo(T) = γo(To) × (To/T)n
Extra term proposed by Mondelain et al. for 12CH4/N2 (JMS, 2007) and 13CO/He , 13CO/Ar (APB, 2008)ln(γo
T) = ln(γoTo) +n1 ln(To/T) + n2 ln2(To/T)
n2 is the non-linear term (smaller that n1 by a factor of 12)

13CH4 R(2) Results Comparison
11th International HITRAN Conference, 16-18 June 2010
100 150 200 250 3000.04
0.06
0.08
0.1
0.12
0.14
0.16
0.18
0.2
Temperature (K)
ha
lf w
idth
co
effi
cie
nt, o
(cm
-1/a
tm)
13CH4 (
4) by N
2: line broadening
R(2) F2
R(2) E
o(T) = o
(To) x (To/T)n
oN
2
: This Work
oair
, HITRAN 2008
oair
: Smith et a l.(2010)
oair
: Devi et a l.(1988)
100 150 200 250 300-10
-8
-6
-4
-2
0
2
Temperature (K)F
req
. sh
ift c
oe
ffici
en
t, o
(1
0-3
cm
-1/a
tm)
13CH4(
4) by N
2: freq. shift
R(2) F2
R(2) E
o(T) = o
(To) + x(T-To)
o(T) = o
(To) + | x(T-To)|
oN
2
: This Worko
air, HITRAN 2008
HITRAN values are based on measurements from 210K to room temperature; we measured widths and shifts from 80K to 296K. Widths are about 3x greater 80K than at 296K. Extrapolation using HITRAN08 parameters results in a 6 to 10% underestimate of the 80K line width. The frequency shift for the E line is smaller than that for the F line at room temperature, but the different temperature dependences result in a 2x greater E line shift at 80 K. At Titan’s surface, atmospheric temperature is ~93K and pressure is ~1.5 bar.

R(0) – R(3) Fit Results, 80 – 296 KPreliminary, work in progress
11th International HITRAN Conference, 16-18 June 2010
Transition γ0 n δ0 δ′ No. Spectra
R0 A1 1 (1303.249 cm-1) 0.0523(1) 0.679(3) −0.0013(1) +5.2(1)E-05 9R1 F1 1 (1308.551 cm-1) 0.0602(1) 0.869(2) −0.0006(1) +2.3(1)E-05 9R2 F2 1 (1313.722 cm-1) 0.0619(1) 0.887(3) −0.0017(1) +7(1)E-06 9R2 E 1 (1313.788 cm-1) 0.0531(1) 0.860(4) −0.0013(2) +2.3(2)E-05 9R3 A2 1 (1318.635 cm-1) 0.0555(1) 0.773(4) −0.0011(1) +1.6(1)E-05 9
0.0556(1) 0.787(4) −0.0013(1) +1.0(2)E-05 9*R3 F2 1 (1318.810 cm-1) 0.0651(2) 0.805(6) +0.0025(2) −1(3)E-07 9
0.0644(2) 0.828(5) −0.0044(2) −2.1(3)E-05 9*R3 F1 1 (1318.957 cm-1) 0.0663(2) 0.782(5) −0.0040(2) +7.1(2)E-05 9
0.0657(2) 0.842(2) +0.0017(2) +5.3(2)E-05 9*
Note: Units of γ and δ are cm-1 atm-1 at 296K, units of δ′ are cm-1 atm-1 K-1, and n is unitless.*Retrieved with line mixing.

Summary and Conclusions
11th International HITRAN Conference, 16-18 June 2010
New experimental capability for low-T high-resolution spectroscopy• Closed-cycle He-cooled cell (single path) designed for the Bruker IFS 120/125 HR sample compartment.• Tested successfully with the Bruker IFS 125 HR at JPL.• Temperature range achieved with the FTS: 79.3 – 296 K.• Temperature stability 0.01 K for several days.
Measured and observed• Line width and pressure-induced shifts for 13CH4/N2 R(2) manifold.• Temperature dependences in 80 – 296 K range.• Non-linearity in the T-dependence of the widths.
Continuing analysis of other 13CH4 manifolds• R(0) through R(3) done; more to come.• Line mixing and speed-dependence to be considered.• Self-broadening must be quantified to obtain accurate low-T results for N2-broadening.
More gases at low temperatures (e.g., C2H6 at this conference).
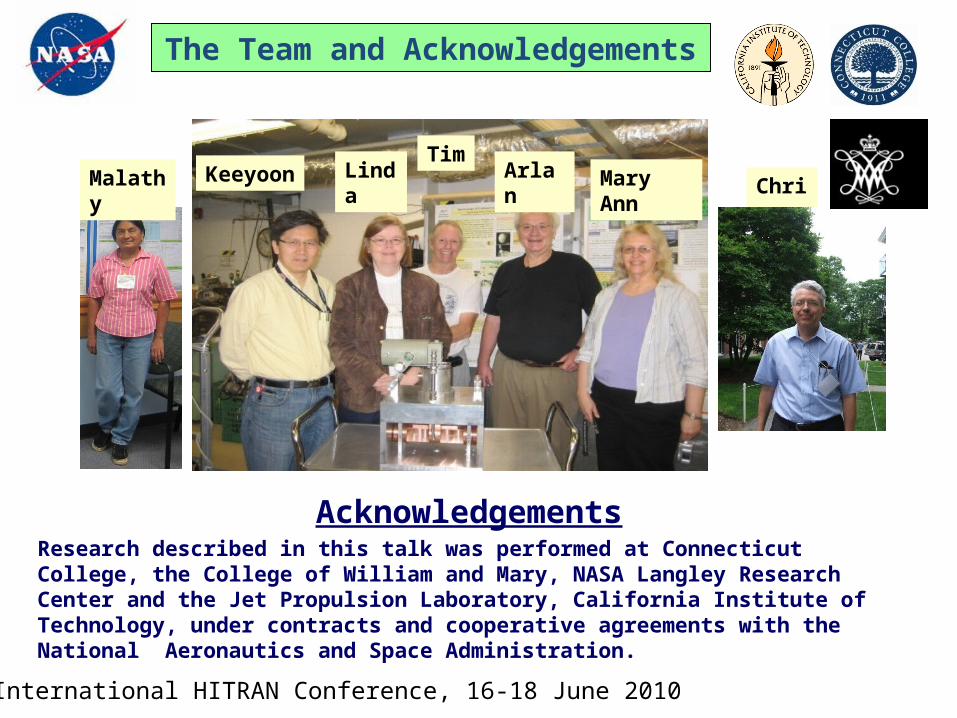
The Team and Acknowledgements
11th International HITRAN Conference, 16-18 June 2010
AcknowledgementsResearch described in this talk was performed at Connecticut College, the College of William and Mary, NASA Langley Research Center and the Jet Propulsion Laboratory, California Institute of Technology, under contracts and cooperative agreements with the National Aeronautics and Space Administration.
Malathy Keeyoon LindaTim
Arlan Mary Ann Chris