myth and reality in knowledge-led productivity growth itec working paper series
TRANSCRIPT

CBR (University of Cambridge) – ITEC (Doshisha University) Joint Papers
Innovation Policy as Cargo Cult: Myth and Realityin Knowledge-led Productivity Growth
Alan Hughes
ITEC Working Paper Series07-26
December 2007

Innovation Policy as Cargo Cult: Myth and Reality in Knowledge-led Productivity Growth
Institute for Technology, Enterprise and Competitiveness, Doshisha University
Working Paper 07-26
Alan Hughes1
University of Cambridge
Centre for Business Research
Judge Business School Building
Trumpington Street
Cambridge CB2 1AG
Email: [email protected]
and Visiting Fellow
Institute for Technology, Enterprise and Competitiveness,
Doshisha University
Kyoto, Japan

ITEC Working Paper 07-26
Abstract:
This paper questions the current emphases in innovation policy on a particular interpretation of US performance which emphasises R&D intensive high technology producing sectors, spin-offs from the science base and private sector venture capital. Whilst recognizing the important role they may play it is argued that it has been greatly exaggerated to the neglect of other key factors. One is the importance of the diffusion and use of ICT as a general purpose technology beyond the ICT and other R&D intensive high-tech producing sectors. A second is the dominant role which performance transformation in existing firms plays in driving industry level productivity compared with the direct role of new entrants. A third is the diversified role played by universities in knowledge exchange which extends beyond a narrow focus on spin offs and licensing to encompass the creation of human capital and a wide range of formal and informal business interactions. Finally there is the major role that public R&D procurement policy has played in the US in the effective provision of public rather than private sector venture capital. The paper provides a broad overview of evidence on each of these factors and considers some broad implications for innovation policy which might be drawn on the basis of that review. In particular it concludes by arguing that the crafting of innovation policy in the context of any specific national innovation system requires a careful consideration of the structural features of that context and the particular opportunities and challenges facing policy practitioners in it. An imperfect interpretation of the experience of one country’s system is unlikely to be an appropriate guide to innovation system failure or success elsewhere.
JEL codes: O31, O33, O38
Keywords: Innovation Policy, University-Industry Links, Productivity Growth
Acknowledgements:
This paper has benefited from a number of sources of support. The author would like to thank Hugh Whittaker and Yoshifumi Nakata of ITEC, Doshisha University, Kyoto, Japan, for providing an institutional base to work in this area in 2005 and 2007 as a Visiting Professor and then Overseas Visiting Fellow at ITEC. The author is also grateful to Richard Lester, Andy Cosh and Michael Scott Morton for many stimulating discussions in this area, to Anna Bullock for help in data preparation, to the Cambridge MIT Institute for financial support for the survey research into US and UK innovation on which this paper draws, and to the EPSRC for financial support under grant

ITEC Working Paper 07-26
EP/EO23614/1 IKC in Advanced Manufacturing Technologies for Photonics and Electronics – Exploiting Molecular and Macromolecular Materials, a ‘public space’ experiment in fostering commercialisation activities. I am also grateful for the congenial working environment provided by Mark Dodgson at the University of Queensland Business School and for the opportunity to present some of the ideas contained in this working paper at a series of innovation summit events he organised in Australia in the autumn of 2006 when the author was a visiting professor at the University of Queensland Business School. A version of this paper will appear in Bessant, J. and Venables, T. (eds) (2008) Creating Wealth from Knowledge. Meeting the innovation challenge. Edward Elgar: Cheltenham.

ITEC Working Paper 07-26 1
Innovation Policy as Cargo Cult: Myth and Reality in Knowledge-led Productivity Growth
Alan Hughes
In the immediate post-World War II years a series of millenarian movements known as cargo cults2 swept through Melanesia. They emerged in the aftermath of intensive American contact in the course of the Second World War. These contacts led to a substantial increase in the material goods available to Melanesian islanders, but the end of the War meant that such material goods became less available as military withdrawal occurred. In these circumstances cargo cults emerged in which prophets would promise the return of cargoes of material goods by their ancestors (often expected to take the form of the Americans) with cargo typically shipped in the airplanes which had been such a common feature of the war experience. The means by which the return of the cargo was to be encouraged varied between different cults in different islands, but frequently involved the ritual preparation and construction of a variety of structures such as airfields, storage facilities, landing strips and associated paraphernalia. Cult members were encouraged to abandon previous cultural practices and often mimicked the behavioural characteristics of Americans (Worsley (1957), Jarvie (1964)). The emergence of these cults did not lead to the return of material cargo.
There is in my view a danger today that the evolution of innovation policy structures based on copying perceived cultural characteristics and structures of the US innovation system will also fail to deliver the goods. In the case of innovation policy the cargo is improved economic welfare through improved productivity growth based on enhanced innovation performance. The key “ritual” structures are increased R&D expenditures; an emphasis upon the commercialisation of science through university based spinouts and licensing routes in high technology producing sectors; the promotion of entrepreneurship and new business entry and a supposed US entrepreneurial culture based on the subsidisation of risk taking in venture capital investment and of the development of the SME sector more generally.
These perceived key elements feature centrally in policy debates. For example in March 2000 the EU adopted the “Lisbon” strategy to make, within the next decade, the EU the most dynamic and competitive knowledge-based economy in the world. The strategy was explicitly positioned as a response to the observed superior performance of

ITEC Working Paper 07-26 2
the US economy which had in the previous decade substantially outperformed the European economies. It also explicitly accepted the view that this superior US economic performance was based on the emergence of high technology sectors such as ICT and biotechnology as key totems of the new knowledge-based economy of the US (European Commission (2004)). Despite the subsequent bursting of the dot.com bubble and an increased awareness of the emerging threat to Europe from India and China rather than the US these key elements of the innovation and technology strategy connected with Lisbon continue to be emphasized. Thus, in 2004, it was asserted that
“There is overwhelming evidence of the vital importance of boosting R&D as a prerequisite for Europe to become more competitive. To fail to act on that evidence would be a fundamental strategic error …”
European Commission (2004) p.21
Similarly, it was asserted that entrepreneurship is required to take advantage of technological developments
“Increasingly, new firms and SMEs are the major sources of growth and new jobs. Entrepreneurship is thus a vocation of fundamental importance, but Europe is not ‘entrepreneur-minded’ enough.”
European Commission (2004) p.28
Both of these arguments were followed by calls for greater tax subsidization of high technology investment, R&D expenditures and enhanced policies aimed at boosting entrepreneurship and new entry and reducing risk aversion and the “stigma of failure” (European Commission (2004)).
In relation to enhancing the role of universities the policy emphasis on spin-offs and licensing “US style” is often noted;
“In recent years, spurred by the experience of the US in particular, policy makers, enterprises, investors and academics throughout the industrialized world have paid increasing attention to the role of universities as drivers of innovation. Many universities have established formal offices and processes for identifying promising discoveries made within their walls and turning them into revenue streams through licensing or spin-outs. 3”
Apax (2005) p.4

ITEC Working Paper 07-26 3
The belief in the centrality of university-business links to economic progress and on the commercialisation of science through licensing and spin-offs is also explicit in the innovation strategies of many individual countries (OECD (2001) Yusuf and Nabeshima (2007)).
In this paper I wish to question these emphases on R&D intensive high technology spin-offs from the science base and entrepreneurial science. In doing so it is not my intention to argue that R&D or new entry or the growth of venture capital or university spin-offs do not matter4. My contention is rather that they have been greatly exaggerated to the neglect of other key factors when one considers the innovation system as a whole. One of these factors is the importance of the diffusion and use of ICT as a general purpose technology beyond the ICT and other R&D intensive high-tech producing sectors. This has enabled “unexpected” user sectors with negligible conventional R&D spend such as retailing to dominate movements in US aggregate productivity growth. A second factor is the dominant role which performance transformation in existing firms plays in driving industry level productivity compared with the direct role of new entrants. A third is the diversified role played by universities in knowledge exchange which extends beyond a narrow focus on spin offs and licensing to encompass the creation of human capital and a wide range of formal and informal business interactions. A further factor related to this is the predominant role of customer supplier interactions in open innovation systems (Chesbrough (2003)) rather than direct university business interactions. Finally there is the major role that public procurement policy has played in the US in the effective provision of public rather than private sector venture capital and the high value placed by US firms on public sector sources of knowledge for innovation. The paper attempts in the space available to provide a broad overview of evidence on each of these factors and to consider some broad implications for innovation policy which might be drawn on the basis of that review. In particular it concludes by arguing that the crafting of innovation policy in the context of any specific national innovation system requires a careful consideration of the structural features of that context and the particular opportunities and challenges facing policy practitioners in it. An imperfect interpretation of the experience of one country’s system is unlikely to be an appropriate guide to innovation system failure or success elsewhere.

ITEC Working Paper 07-26 4
Interpreting US Economic performance
Since so much policy is linked to references to US economic performance it is useful to begin with a brief overview of it in the recent past. Table 1 shows that the most dramatic feature of United States’ performance since World War II is that its recent improvement is heavily concentrated at the end of the last century and at the beginning of this century, when it returned to its long run trend performance after two decades of relatively low growth performance. The dramatic improvements in productivity growth after 1995 are now, however, due to the direct performance of R&D intensive high technology industries.
This can be seen if we decompose the aggregate performance into its components. An industry’s contribution to the aggregate depends on its own change in productivity growth, and on its size, because the economy is a weighted average of the different sectors.5
Table 1. US PRODUCTIVITY GROWTH 1947-2003
US Growth of real GDP per hour 1947 – 1972 2.9% 1972 – 1995 1.4% 1995 – 2000 2.5% 2000 – 2003 2.6%
Source McKinsey Global Institute, (2001), Farrell, Bailey and Remes (2005)
Decomposing productivity growth in the first period from 1995 to 2000 reveals that six of fifty-nine sectors accounted for the whole of the acceleration in productivity growth. The top three key sectors in the United States economy on this basis were wholesaling; retailing; and security and commodity broking. Their joint contribution was twice as great as the next three, which were electronic and electric equipment (semiconductors), industrial machinery and equipment (computers) and telecoms (McKinsey Global Institute (2001)).
None of the top three are technology intensive sectors in any conventional sense. In the second period, the most recent years for which decomposition data are available, seven sectors accounted for 85% of all the productivity growth. These were retailing; finance and insurance; computer and electronic products; wholesaling; administrative

ITEC Working Paper 07-26 5
and support services; real estate; and miscellaneous professional and scientific services. None of these, with the exception of computers and electronics, are in any sense conventionally R&D intensive (Farrell, Bailey and Remes (2005)). It’s a Wal-Mart not a Microsoft led turnaround. The traditionally identified R&D intensive sectors have not carried most weight.
Wal-Mart, on the back of a major IT based business structure, has transformed – some people would argue much for the worse – a whole variety of social and economic structures in the United States and delivered enormous productivity growth in the retailing sector (McGuckin, Spiegelman and Ark (2005), Foster, Haltiwanger and Krizan (2002)). Much of this has been linked, as in other service sectors such as transport and financial services to the implementation of new business models based on ICT and related technologies (Hughes and Scott Morton (2005) (2006)). Wal-Mart’s performance is thus an example of the impact of ICT as a general purpose technology (OECD (2003a), Helpmann (1998)) in a ‘user’ rather than a high tech ‘producer’ sector (Pilat and Lee (2001)). Microsoft on the other hand is a high tech producer which contributes to the capacity for many of these changes to occur in the ‘user’ sectors. So in that sense Sam Walton and Bill Gates are complementary, Sam Walton and Wal-Mart are more important to productivity turnaround than Bill Gates and Microsoft however, because of the scale of the activity which is transformed by the activities of a company such as Wal-Mart when it implements IT linked business transformations. Differences in services productivity growth, in fact, account for most of the difference in national productivity performance between the USA the UK and Europe in the past decade, rather than differences in high tech producing sectors (Oxford Institute of Retail Management (2004), Griffith and Harmgart (2005), Basu, Fernald, Oulton and Srinivasam (2003), van Ark, Inklaar and McGuckin (2002)).
High technology “producing” sectors are a small part of the economy, especially compared to the technology using sectors and the services sector more generally. This points to the need to think extremely carefully about the mechanisms by which high technology activity is diffused through the rest of the economy and not just the scale or productivity performances of high technology output per se. A focus on high technology production without a parallel consideration of diffusion or use throughout the innovation system, and the factors affecting that runs a clear risk of failing to deliver the goods.

ITEC Working Paper 07-26 6
Spin offs and new entry
Now I want to turn to the issue of new spin offs and their role in productivity performance; I have called this the golden oldies versus the new kids on the block debate. The new kids on the block are new high tech spin off firms that are often attributed such an important role in the science and innovation process. I want to present some facts about spin offs, especially in the United States and put them in the context of what is known about the way in which the golden oldies contribute to changes in industry structure and productivity growth.
The first thing is to get a sense of proportion. The United States economy has some 500,000 firms starting up each year. That, of course, includes firms of all kinds from small restaurants to boutique high tech businesses, not just businesses based on the exploitation of intellectual property or new products derived from advances in scientific research. In the US as a whole, in 2004 there were 462 IP based start-ups where the IP was from a US university. That may be impressive performance internationally, but its scale has to be borne in mind in interpreting claims of what might be gained in other economies from such spin offs.
Secondly, although IP produced by US universities produces results in considerable patenting and licensing activity, it’s insignificant numerically compared to the total amount of such research related activity in the United States. IBM in the year 2005 alone registered 2,941 patents with the US Patent office, Canon 1829, and HP 1790. The whole of the University of California (UC) state system, which is one of the most dynamic, productive and innovative university systems in the world, produced 388, MIT 136 and Stanford 90 (US Patent Office (2005)). This is an impressive university performance. It is important, however, to keep it in perspective relative to corporate activity and to think of universities as a part of a wider system in which they are perhaps a quantitatively small but qualitatively important part6.
Finally, although there is evidence that university spin-offs are less likely to go bankrupt than other high-tech start-ups or new firms generally (Shane (2004)), the returns from surviving university start-ups and licensing activity are enormously skewed (Mowery et al (2004)). There are a couple of statistics which illustrate just how skewed. Only 167 out of 27,322 patents held by 193 US university institutions in 2004 made over $1m (AUTM (2005)). In the case of Columbia University, Stanford and the UC system the top 5 patents accounted for 65% of gross licensing revenues. The chances of hitting a home run are small. That doesn’t mean to say you shouldn’t do it; in fact you

ITEC Working Paper 07-26 7
can’t win the race unless you place a bet, but you have to be realistic about what the odds are. First mover new start-ups based on radical innovations capable of transforming markets very rarely come to dominate those new markets. In the terminology of Markides and Geroski such pioneering ‘colonisers’ of radical new markets rarely survive early market expansion. Fast second movers with rather difference ‘consolidations’ skills come to scale up dominate, and capture maximum value (Markides and Geroski (2005)) 7.Universities also have to be clear about the costs. The vast majority of US university technology licensing offices barely break even or don’t make a profit. The gross average annual licensing revenues of the UC system in 2001-4 of $75 million cost almost $60 million per annum to maintain and manage. Thus in the period 2001-4 the net contribution of the University of California systems licensing income was $15 million annually, compared to around $235 million of commercial funding of university research (Mowery (2007)).
We can now look at this in a slightly broader way. Instead of just looking at the spin off activity by US based universities we can look at the impact of start-ups as a whole. A substantial amount of work has been done which attempt to decompose the change in productivity in particular industries across the OECD economies in terms of entry, exit and survivor growth (e.g. OECD (2003b), Bartelsmann, Haltiwanger and Scarpetta (2004)). This work breaks down productivity growth between the gains in productivity that are made by the surviving firms which are there throughout the period studied and the transfer of activity from lower to higher productivity surviving firms. This is the golden oldie effect. The firms are there at the beginning and they are there at the end. Then there’s the impact on productivity of firms that leave. If the worst firms drop out, there’s a batting average affect and average productivity rises. Finally there is the effect of new entries, the spin offs and new start ups. This is the new kids on the block effect. They enter the system and either die or survive and grow over the period analysed. What is clear from this work is that the vast majority of the productivity growth that is experienced in any economy and any industry in any time period is driven by the transformation in productivity of the golden oldies; that is, it’s the improvement in the performance of the firms that are there all the time. The contribution of survivors (often referred to as the ‘within firms’ effect) varies between 55% and 95%. The net effect of exits and entry accounts for 20-40%, but most of this is due to the batting average effect of exits. Entry effects are small because of low entry sizes at lower average productivity than incumbents and low survival rates. Only 30-50% of new entrants survive for over 5 years. Exit and entry rates rise and fall together across

ITEC Working Paper 07-26 8
countries and over time with high entry associated with high exit. In the case of the US the new entry component is typically large and negative, and survival rates are low but survivors on average grow faster. Finally, it is important to note that these studies do not suggest that the US is characterized by high net entry. Instead it appears that the US is characterized by relatively rapid growth of survivors, so it is post entry growth not entry per se that matters. To illustrate the effects we can look at some data from UK manufacturing for the period 1980-1992 (Disney, Haskel and Heden (2003)). The data relate to establishments which may operate a single plant and multi-plant establishments. Table 2 shows that net entry by singleton establishments accounted for only 15.9% of overall productivity growth, whilst net entry due to the closure and opening of establishments by multi-plant surviving firms accounted for over twice as much (33.2%). Productivity growth within surviving establishments owned by multi-plant businesses accounted for over 44%. Golden Oldies, surviving firms, clearly dominate this process8. They may also be the source of new spin-offs themselves:
“successful start-ups almost always begin with an idea that has ripened in the research organization of a large company (or university). Any region without larger companies at the technology frontier or research organizations of large companies will probably have fewer companies starting or spinning off.”
Gordon Moore (founder of Intel) cited in Branscomb and Auerswald (2002), p 44
A policy stance which concentrates on driving innovation and productivity by looking only at new independent firms will therefore miss a very important part of the story.
Table 2. Net Entry, Surviving Firm and Reallocation Components of UK Manufacturing Establishment Productivity Growth 1980-92 Contributors to Overall Productivity Growth
Singleton Establishments
Group owned Establishments
Surviving establishments’ productivity growth 0.6 44.6 Market reallocation between survivors with high and low productivity levels -0.4 3.9 Market reallocation between survivors with high and low productivity growth 0.4 -2.8
Net entry productivity effect 15.9 33.2
Source: Calculated from Disney, Haskel and Heden (2003)

ITEC Working Paper 07-26 9
There are some industries and there are some conditions which are relatively favourable to the success of innovative new entry (Baldwin and Gellatly (2003), Baldwin (1993), Gambardello and Malerba (1999), Audretsch (1995)). The first is where the nature of the technology is constantly changing the basis on which competitiveness can be built. If there is turbulence in the technological regime and entry is relatively low cost, experimentation in new entry may be accompanied by some home runs. Also, if the incumbents – the golden oldies – in an industry are heavily committed to an existing technology then there’s a better chance of a new entity succeeding because the conservatism that goes with very heavy investment in a standard technology makes the incumbents relatively slow to react (Christensen (1997)). Finally, the chances of success are higher if the resources to exploit new business ideas – complementary assets – are not owned by others. If these complementary assets, which are necessary to extract value, are owned by somebody else it is unlikely that they can be appropriated by new independent firms going it alone (Teece (1996)).
The role to be expected for new innovative entry and survival to enhance productivity performance is thus highly context specific. A blanket promotion of new start-ups in support of innovation without careful attention to industry dynamics and the ecology linking new entry and large firm success, and patterns of appropriating value should be avoided9.

ITEC Working Paper 07-26 10
Universities and the innovation system
In discussing the role of universities in innovation systems I will illustrate my argument with data from a recent survey based comparison of the UK and US economies. The Centre for Business Research/Industrial Performance Centre (CBR/IPC) US UK Innovation Benchmarking Survey (Cosh, Hughes, Lester (2006)) was carried out in the period March-November 2004. The primary telephone survey covered firms of all sizes from 10 employees upwards in the manufacturing and business services sectors. It achieved response rates of 18.7% in the US and 17.5% in the UK. There was in addition a postal follow-up survey in both countries for firms employing more than 1000 employees. In all, the survey instrument included 200 questions which generated over 300 variables per firm. In this paper I will draw only on those sections of the survey instrument which related to the interactions between universities and the firms in the survey as well as drawing on some material on the wider range of interactions which survey firms claimed were relevant to their innovation activities.
Table 3 shows the size distribution of the overall achieved samples in the UK and the US surveys. Approximately 2/3 of the firms in both surveys employ between 10 and 99 people, around 1/4 employ between 100 and 999 people, with the remainder employing over 1000. In order to provide UK US comparisons which are not contaminated by possible variations between countries in the distribution of responses by sector or by size of firm, I will focus on the results which are obtained when we form a matched sample. This matched sample consists of 1,149 US companies and 1,149 UK companies matched by employment size and by sector where the sectoral matching is at least at the three digit level. Table 4 shows the sectoral composition of this matched sample distinguishing between manufacturing and business services and high-tech and conventional sectors within those broad industrial groupings. The distinction between high-technology and conventional sectors is based on the R&D intensity of their activity and the technical composition of their labour force. The survey contains a representative proportion of high technology businesses in both countries.

ITEC Working Paper 07-26 11
Table 3. Size Distribution of UK and US Respondent Firms in the CBR/IPC Survey Employment Size US UK
10-99 62% 66% 100-999 24% 25% 1000+ 14% 9% N 1540 2129
Source: A. Cosh, A. Hughes and R. Lester UK PLC Just How Innovative Are We? Cambridge MIT Institute 2005
Table 4. The Sectoral Composition of a Matched Sample of UK and US Firms High-Tech Conventional
Manufacturing 28% 38% Business Services 15% 19%
Source: A. Cosh, A. Hughes and R. Lester UK PLC Just How Innovative Are We? Cambridge MIT Institute 2005
One way of looking at the role of university industry relationships is to locate
universities as a source of knowledge for innovation in the wider context of the overall sources of knowledge used by innovation active firms. The results of an analysis of this kind for firms in the UK US matched sample are shown in Figure 110. The picture which emerges is very clear. Customers, suppliers, competitors and the firms’ own internal knowledge are the dominant knowledge sources. In both the USA and the UK universities are relatively low in frequency of use as direct sources of knowledge for innovation. Interestingly in terms of the proportion of firms reporting universities as a source of knowledge the UK outstrips the US. In both countries use is made of a very wide range of other sources. There is clearly a distributed innovation knowledge system and in terms of frequency of use universities are only a small direct part of it11. This does not mean that they are not important, but it does mean that their contribution has to be seen in the context of a much wider and complex system of innovation information flows. This pattern is not unique to the US and the UK. The same is true for Australia for instance as is apparent from Figure 2 and for the EU more generally.

ITEC Working Paper 07-26 12
Figure 1. Use of sources of knowledge for innovation (% companies)
Figure 2. Key sources of ideas or information for innovation in Australian
innovating business 2001-2003 (% Companies)
Source: Calculated from ABS (2006)
It is of course possible that frequency of use may not be correlated with the importance placed upon the information obtained. The survey firms were also asked to indicate the value they placed upon the sources of knowledge as well as their use. The responses are

ITEC Working Paper 07-26 13
summarised in Table 5 where following Swann (2006) we group sources into 3 broad categories. These are the company sector, the public and private scientific knowledge base and a group of intermediating and regulatory organisations. Once again, in both countries the company sources dominate. Internal sources of knowledge plus knowledge obtained from suppliers and customers were ranked most highly as knowledge sources for innovation. In both countries they were followed by technical standards and health and safety regulations as important sources of knowledge from the intermediating and regulatory group. The need to contextualise innovation policy in the circumstances of particular countries, however, is highlighted by the fact that there are significant differences between the UK and the US in the value placed upon knowledge from the science base, and from the intermediating organisations other than standard settings and regulators. For instance US firms were almost twice as likely to place a high importance on knowledge gained from consultancies, government research laboratories and other public research laboratories, professional conferences and trade associations than were UK firms. Moreover, despite being more likely to cite universities as a source of knowledge UK firms more frequently placed a lower value on it than did US firms.

ITEC Working Paper 07-26 14
Table 5. High importance of sources of knowledge (% of users of that source) UK US ratio % % (UK/US)x100Company Sector Suppliers of equipment, materials, components, or software 41.5 49.2 84.4 Internal knowledge within the company 79.9 84.5 94.6 Clients or customers 60.9 53.5 113.7 Knowledge within the group 59.4 50.7 117.1 Competitors in your line of business 27.7 20.8 132.9 Intermediating and Regulatory Organisations Consultants 12.5 26.2 47.7 Professional conferences, meetings 14.6 23.9 61.2 Trade associations 15.1 23.5 64.4 Technical/trade press, computer databases 21.5 26.5 80.8 Fairs, exhibitions 17.4 18.0 96.8 Environmental standards and regulations 31.8 46.1 69.0 Technical standards or standard setting bodies 34.6 40.2 86.1 Health and safety standards and regulations 41.3 47.2 87.5 Other public sector e.g. Business links, Government Offices 10.5 38.7 27.1 Scientific Knowledge Base Government research organisations 6.6 24.7 26.6 Private research institutes 7.2 22.9 31.5 Commercial laboratories or R&D enterprises 12.2 28.4 43.0 Universities/ higher education institutes 13.8 27.0 51.3
Source: CBR/IPC UK US Innovation Benchmarking Survey
Another difference between the UK and the US emerges if we probe a little more deeply into the patterns of combined use of sources of knowledge.
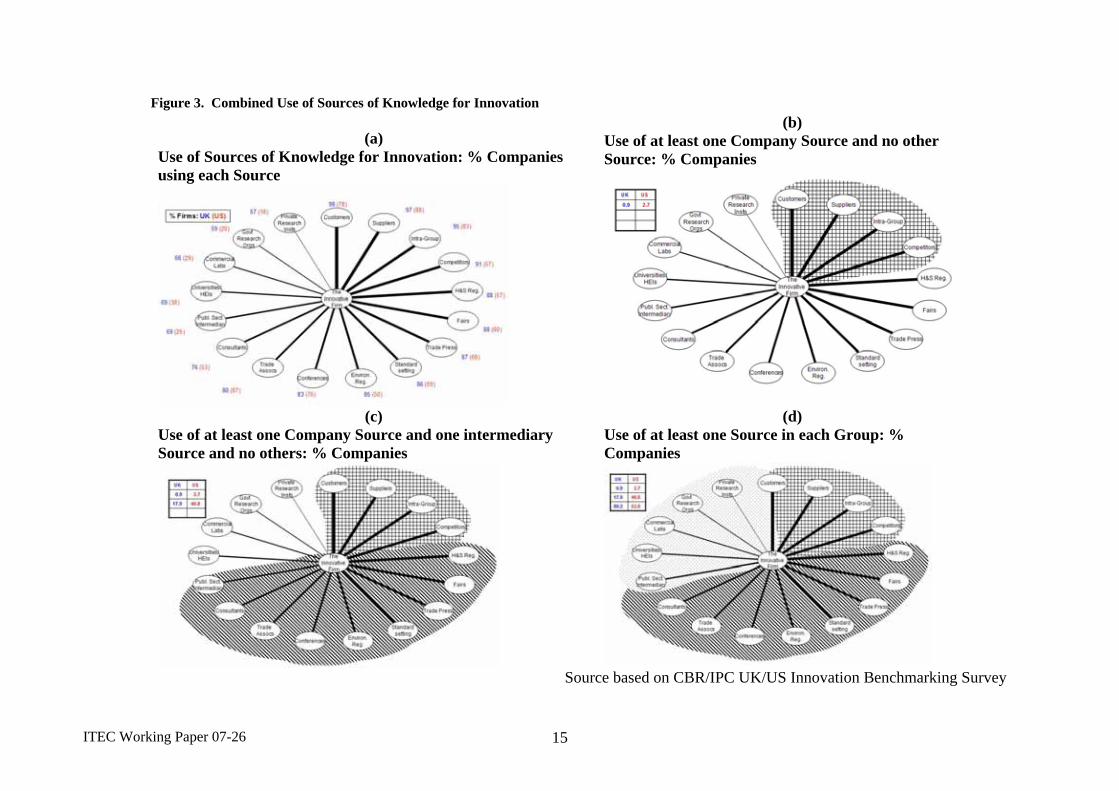
ITEC Working Paper 07-26 15
Figure 3. Combined Use of Sources of Knowledge for Innovation
(a) Use of Sources of Knowledge for Innovation: % Companies using each Source
(b)
Use of at least one Company Source and no other Source: % Companies
(c) Use of at least one Company Source and one intermediary Source and no others: % Companies
(d) Use of at least one Source in each Group: % Companies
Source based on CBR/IPC UK/US Innovation Benchmarking Survey

ITEC Working Paper 07-26 16
Figure 3 (following Swann (2006)) shows in successive quadrants the extent to which firms in the UK and the US are specialised in their use of sources of knowledge. The first upper left quadrant simply repeats in a different form the contents of Table 4 with the thickness of the bands reflecting the frequency of use of each source of knowledge. The top right-hand quadrant shows the proportion of companies in each country which used at least one source from the company sector, and no other sources. This reveals immediately that although customers, suppliers and competitors and the internal knowledge base of the firm are the most frequently used (and, as we have seen, the most highly valued source) they are almost never used in isolation. When we switch to the bottom left-hand quadrant we identify those firms which used at least one company source and at least one source from the intermediating and regulatory group and no others. Here a significant difference emerges between the United Kingdom and the United States. Over 40% of the US firms used a company source and an intermediary source and no others, whilst only 17% used this particular combination in the UK. When we turn finally to those companies which used at least one source in each group, then we find that the UK firms are far more likely to report using a research base source in combination with the other sources of knowledge in the company and intermediating sectors. It appears therefore that US firms are much more likely to combine company and intermediating sources, whilst UK firms have a much more diffuse use of knowledge sources. Equally US firms are less likely to use all three knowledge sources and have a more compact knowledge source pattern. Paradoxically, as we have already seen, when they do interact with institutions in the science base, they place a significantly higher value on the outcomes. This raises important questions about the extent to which the value placed upon the science base is enhanced by the use of intermediating institutions between the science base and companies themselves. It also raises the question of whether in the UK the use of so many sources raises difficulties of effective management and reduces their usefulness 12 . In terms of innovation policy this points up the importance of paying attention to the particular structure of the innovation system in which the policy is to be introduced and an analysis of whether the particular patterns observed, for instance in the United States, are linked to a superior pattern of innovation and productivity performance. It also raises issues of depth as opposed to breadth of interactions13.
Having looked at the structural position of universities in knowledge flows in the innovation system it is important to discuss the nature of the interactions between universities and firms. As a pre-cursor to looking at some of the university data arising

ITEC Working Paper 07-26 17
from the US UK survey which bear on this issue it is worthwhile setting out a typology of interactions.
First, universities educate and produce skilled graduates. Second through their research and dissemination activities, universities increase codified knowledge. University staff publish books and scientific papers, they patent, and in engineering faculties may develop proto-types. A very wide range of problem solving activities are also carried out – often on a regional or local basis, but sometimes on an international basis – directly addressing problems which are brought to the attention of the universities through contract research, co-operative research, and faculty consulting. University laboratories may have equipment which can be used for testing various kinds of commercial equipment. These three kinds of activities are captured in Figure 3 under the headings of educating people, increasing the stock of codified knowledge and problem solving.
What tends to be less discussed is what Richard Lester and Michael Piore have called the public space function of universities (Lester and Piore (2004)) which is captured in the fourth box in Figure 3. This function captures the distinctive role of universities in society and in the innovation system as public spaces in which other interested parties can “play”, if that public space is appropriately structured. This includes a range of “soft”, but none-the-less extremely important activities, to do with network forming, stimulating social interaction, influencing the direction of research processes by identifying commonly experienced problems, setting standards of a technical kind, setting up entrepreneurial centres and so on. These public space activities permit the discovery of potential complementary interests and the crafting of potential ways to develop them to mutual advantage. They also foster the role of universities as translators and providers of insights into “new” science. For instance in the context of the US Advanced Technology Program industrial research participants perceived that
“the university could provide research insight that is anticipatory of further research problems and that it could be an ombudsman anticipating and communicating to all parties the complex nature of the research being undertaken.”
Hall, Link and Scott (2003) p 491

ITEC Working Paper 07-26 18
Figure 3. The University role is multi-faceted
Source: A. Cosh, A. Hughes and R. Lester UK PLC Just How Innovative Are We? Cambridge MIT Institute 2006
It is interesting to explore how these diverse public spaces and other roles are perceived by businesses, and the relative significance of licensing and spinout formation compared to other interactions. The CBR/IPC Survey sheds some useful light here since respondent firms were asked how they interacted with the universities in their innovation activities and what kind of emphasis they placed on different interactions. Figure 4 reports the results. It shows that businesses interact across the full spectrum of those elements set out in Figure 3. The most frequent form of interaction is via informal contacts, and it’s not only the most frequent – a separate analysis (not shown here) reveals that it is also amongst the most highly valued (Cosh Hughes and Lester (2006)). All the conventional modes of university output (undergraduates and graduates, and publications and conferences) are frequently cited modes of interaction. In that sense there is no necessary conflict between how the business community says it interacts most with university activities and what academics themselves typically say they want to do.
From the point of view of differences between systems of innovation it is worth noting that US firms appear to use internships more than their UK counterparts14 and that they more frequently have an interaction involving innovation related expenditure with universities. This suggests a greater depth and intensity of interaction in the US than in the UK even if US interaction is less frequent. US firms are, however, less, not

ITEC Working Paper 07-26 19
more, likely to interact via licensing, whether exclusive or non-exclusive. However, when they interact via licensing they value it more highly (Cosh, Hughes and Lester (2005)).
Figure 4. Types of University-Industry Interaction contributing to Innovation (% Companies)
It is important to note that these are aggregate figures across manufacturing and business services. In some industries, in particular biomedical sciences, patenting and licensing are significant in terms of frequency of use and qualitative importance (Cohen, Nelson and Walsh (2002).
From the point of view of innovation policies outside the USA it is instructive to note the intensification of patenting and licensing regimes in US universities has provoked a reaction. This reaction emphasises the threats posed to the cost and timeliness of effective knowledge exchange and exploitation. In non-biomedical sciences in particular it has been argued that the time and costs involved in negotiating IP have begun to threaten industrially funded research (Mowery (2007)). Recent research suggests that major US universities are shifting knowledge exchange management beyond patent and licensing to avoid possible adverse reactions on the wider range of interactions. This includes managing wider industrial liaison activities alongside patenting. It also includes negotiating royalty free licences in some areas as part of industrial funding of research contracts in, for instance, electrical engineering and computer science (Mowery (2007)). If the ‘US Model” is to guide innovation policy

ITEC Working Paper 07-26 20
elsewhere it is as well that the current evolving model rather than the ‘old’ one is a reference point and the full range of interactions is recognised.
Public Policy and Venture Capital
I now want to turn to the issue of venture capital in the United States, and the view that what is required outside the US is subsidisation of private sector venture capital to promote a more risk tolerant investment climate. My first point here is that in practice in the United States, one of the most powerful, proactive venture capital supporting activities is public R&D procurement through the Small Business Innovation Research (SBIR) program (Connell (2006)). The SBIR was established in the 1980s in the middle of the period of very low United States productivity growth, when the United States experimented with a range of industrial policy mechanisms to counteract what it perceived, correctly, as its failure to deal with the threat commercially of Germany and Japan.
The SBIR was one of a number of initiatives taken in the course of the 1980s to address this challenge. Many were designed to encourage collaborative and cooperative strategies in relation to innovation policy and productivity performance (Dertouzos, Lester and Solow (1989), Branscomb, Kodama and Florida (1999), Wessner (2003)). Thus, for example, the 1984 National Cooperative Research Act relaxed anti-trust regulations to facilitate research joint venture collaborations. In relation to university industry links the 1988 Omnibus Trade and Competitiveness Act established, inter alia, the Advanced Technology Programme to promote university industry collaboration. In 1980 the passage of the Bayh Dole Act was designed to enhance university patenting and licensing based on federally funded research. In the course of the 1980s several hundred university industry research centres were also established. By 1990 such centres accounted for over $2.5 billion in academic R&D spending (see for example Branscomb et al (1999), Cohen et al (1998), Mowery (2007))15.
The SBIR as part of these policy initiatives was specifically established to support businesses with less than 500 employees, and provides 100% funded contracts to carry out technologically intensive R&D contractual obligations for US Federal Agencies. The US Federal Agencies advertise technical or research related problems and an open competition results in the award of a contract with potential follow-on contracts. The US government currently mandates 2½% of Federal Agency total R&D spend to SBIR,

ITEC Working Paper 07-26 21
and that is in absolute terms a significant sum. It amounts to $2 billion annually, covering 4,000 contracts (Connell (2006)). The venture capital sector in the US, for comparison was investing around $1 billion annually in around 200 deals per annum at the seed stage in the period 2005 to 2006 and around $4 billion annually in around 800 larger early stage deals. This was out of a total annual amount invested in all stages of around $24 billion in those years (Money Tree (2007)). The venture capital sector in the US is thus similar in its risk profile to private equity elsewhere with a focus on later stage investments and large scale company buyouts. Only a small proportion of funding goes into seed and early stage finance. If an upper bound estimate of overall US investment in early stage technological development, including investment by larger corporation, is considered, formal venture capital accounts for 2.3% of funding compared with 47.2% by business from internal funds, 23.9% by angels, 3.9% by universities and 22.7% by federal and state government (Branscomb and Auerswald (2002)).Within this overall picture the SBIR produces a situation in which a lot of the very risky early stage and seed investments are supported by a public sector mandated activity. Some extremely big and successful companies have been assisted in this way. Amgen, Qualcomm, and Genzyme, for instance, all have SBIR connections in their origins (Connell (2006)). The SBIR effectively derisks subsequent investment by providing certification and proof of performance capacity in the earlier stages of development for small firms that win these contracts. The balance of evaluation evidence also suggests that SBIR contract winners are more likely to commercialise on the basis of their research and to grow faster than similar firms not funded through SBIR contracts (Lerner (1999), Audretsch (2002) (2003), Audretsch, Link and Scott (2002), Wessner (2001), Wallstein (2000)). Overall Conclusions
So, what are the overall lessons to draw from this broad overview? The first is that US productivity and growth performance is not based solely on high tech production per se; it’s based on the diffusion of innovations throughout the system and frequently on the transformation of what people would regard as “low tech” sectors (in R&D terms) by general purpose high technologies based on ICT advances. Secondly, productivity gains are in general driven by firms that are in existence. Thinking about existing firms and their innovation performance is critically important in the innovation process. Innovation policy should not focus on start-ups alone. Moreover, the role that

ITEC Working Paper 07-26 22
start-ups may play is conditioned by the nature of particular technological regimes and patterns of appropriability. It is better to think in terms of typologies of commercialisation and knowledge exchange in which new firms entry and independent growth is one of several potential routes. New firms and spin-offs have an important seed bed role to play but need to be understood as part of a wider open innovation system in which the interplay between large and small firms and the transformations in large business process drive innovation and productivity. Thirdly, public sector procurement has potentially a very powerful part to play in supporting private venture capital and bridging the highest risk gap for early stage development of research intensive firms. Fourth, universities have to be seen as part of a complex system. Their direct contribution as a knowledge source is perceived in general by business as relatively small compared to other components in the innovation system. Their role must be understood within this wider context and is multifaceted. The mechanisms for university interaction with business are diverse and may be sector specific. Licensing and spin offs are only one part of the story. They are significant in only some sectors and if aggressively pursued may lead to loss of other forms of research funding from business, and high rates of spin-off failure respectively. A ‘one size fits all’ economic development or innovation strategy for any country or any university which focuses on licensing and spin-offs alone is not appropriate. An innovation policy which promotes ‘public space’ interactions is likely to lead through informal and other interactions to the discovery and development of appropriate interaction modes for particular sectors and purposes.
University research is of value and interest to the business sector because it is different. Creating institutional mechanisms which promote access to the space within which this different activity is pursued in turn creates the opportunity for the translation of scientific advance focused problem solving and the recognition and potential exploitation of commercialisation opportunities. If the innovation cargo is to be delivered the design and nature of such spaces, their adequacy and hence whether there are innovation systems failure in their provision should be high on the agenda in designing policy for “open” innovation systems.

ITEC Working Paper 07-26 23
Notes: 1 Alan Hughes is a member of the Council for Science and Technology (CST) the senior advisory body to UK government on science and technology policy. The views in this paper are his own and should not be interpreted as those of the CST.
2 The study of cargo cults has long engaged anthropologists and their physical manifestations are well established (Worsley (1957)). There is a long and continuing controversy as to their interpretation and meaning in the cultures in which they occur (Jarvie (1964), Lindstrom (1993), Jebens (2004)), and the term cargo cult is now, if anything, more used outside than inside the discipline of anthropology. This is principally a result of the adoption of the term by the scientist Richard Feynman to describe as “cargo cult science” scientific investigations which fail to deliver the scientific cargo because whilst apparently following all the correct forms and structures of scientific investigation they miss out on a key ingredient. That key ingredient is due consideration of all the evidence against as well as for a hypothesis (Feynman (1985)). The argument in this paper is in a similar spirit. 3 Whilst noting the influence of this interpretation of the US model the Apax report contains a good discussion of the wide range of interactions between universities and the business sector beyond licensing and spin-offs which are necessary to effect knowledge exchange. Hughes (2007) discusses these arguments in the more specific context of UK science and innovation policy. 4 For an overview of university spin-off contributions see, for example, Shane (2004). 5 More formally, the contribution of sector i to aggregate productivity growth iC can be
expressed as
⎟⎠⎞
⎜⎝⎛ −=
••
ii
ii
i LLL
YYY
LL
C1
0 where iY•
and iL•
are sectoral output and employment growth
rates over the period 0 to 1, YYi , and
LLi are the sectors’ shares in output and
employment in period 0 and oL and 1L are levels of national employment in time
periods 0 and 1 (McKinsey Global Institute (2001)). 6 Patent statistics are subject to a number of problems in assessing performance. Companies may patent for strategic reasons, and this strategic significance varies across sectors (see for example Hall (2004)). The broad university/industry picture is, however, clear enough. It is less clear whether the quality of university patents has risen or fallen

ITEC Working Paper 07-26 24
as their numbers have risen (Sampart, Mowery and Ziedonins (2003), Henderson, Jaffe and Trajtenberg (1998)). 7 From an innovation system point of view this points to the importance of understanding the interactions between types of firms and the complementary between spin-offs as a seed-bed of new ideas and the role of subsequent acquisition or replacement by fast second movers. 8 It should be noted that the interpretation in the text is rather different from that drawn by the authors who emphasise new entry effects. They choose to regard as ‘new entry’ new plants introduced by existing multi establishment businesses. This is clearly not new entry in the sense of new independent firms. Most new plants which open and survive are built by surviving multi-plant firms (the golden oldies). 9 It has been argued that focus on independent growth by new start-ups rather than their acquisition and integration by established firms is also questionable, given the relative strengths of large firms in exploiting or scaling up radical innovations pioneered by new firms (Markides and Gersoki (2005)). 10 The eighteen sources identified are consistent with a number of previous innovation surveys including the European Community Harmonised Innovation Survey and the periodic survey of the Small Business Sector in the UK carried out by the CBR since 1991. 11 These results are similar to results obtained for the United States in the well-known 1994 Carnegie Mellon survey, (see for example Cohen, Nelson and Walsh (2002)). 12 It is interesting to note that an analysis of European Community Harmonised Innovation data shows an inverted U-shaped relationship between innovation performances and the number knowledge sources used. (Laursen and Salter (2006). 13 The CBR/IPC Survey also reveals that US firms support these university interactions with a greater commitment of resources than is the case in the UK (Cosh, Lester and Hughes (2005)). 14 They also value them more highly (Cosh, Hughes and Lester (2006).

ITEC Working Paper 07-26 25
15 In addition to specific policy initiatives there is also abundant evidence which points to the important role played by federal expenditures, foreign policy related military expenditures generally and the (Defense) Advanced Research Project Agency (DARPA) in particular. This includes for example their role in emergence of the internet, computing and IT as a general purpose technology (Flamm (1987), Segaller (1998), Mowery and Rosenberg (1998)); the development of Silicon Valley (Lécuyer (2006)) and the impact of defence expenditure more generally on the structure and funding of basic applied science (Stokes (1997)).
References: ABS (2006), Innovation in Australian Business 2003 (Reissue), Australian Bureau of
Statistics, Canberra. Apax (2005), Understanding Technology Transfer, Apax Partners Ltd, London. Audretsch, D.B. (1995), Innovation and Industry Evolution, The MIT Press, Boston,
MA. Audretsch, D.B. (2002), ‘Public/Private Technology Partnerships: Evaluation SBIR-
Supported Research’, Research Policy, 31 (1), January, 145-58. Audretsch, D.B. (2003), ‘Standing on the Shoulders of Midgets: The U.S. Small
Business Innovation Research Program (SBIR)’, Small Business Economics, 20 (20), March, 129-35.
Audretsch, David B. & Link, Albert N. & Scott, John T., 2002. ‘Public/private technology partnerships: evaluating SBIR-supported research, Research Policy, Elsevier, vol. 31(1), pages 145-158, January. AUTM (2005), US Licensing Survey FY 2004, AUTM, Northbrook, Ill.
Baldwin, J.R. (1993), The Dynamics of Industrial Competition: A North American Perspective, Cambridge University Press, Cambridge.
Baldwin, J.R. and Gellatly, G. (2003), Innovation Strategies and Performance in Small Firms, Edward Elgar, Cheltenham.

ITEC Working Paper 07-26 26
Bartelsman, E., Haltiwanger, J. and Scarpetta, S. (2004), ‘Microeconomic Evidence of
Creative Destruction in Industrial and Developing Countries’, Policy Research Working Paper Series 3464, The World Bank.
Basu, S. Fernald, J.G., Oulton, N. and Srimivasan, S. (2003) ‘The Case of Missing Productivity Growth: Or Does Information Technology explain why productivity accelerated in the United States but not in the United Kingdom?’ Federal Reserve Bank of Chicago WP8, June.
Branscomb, L.M. and Auerswald, P.E. (2002), Between Invention and Innovation: An Analysis of Funding for Early Stage Technology Development, US Department of Commerce, Washington, DC.
Branscomb, L.M., Kodama, F. and Florida, R. (eds) (1999), Industrializing Knowledge: University Industry Linkage in Japan and the United States, MIT Press, Boston, MA.
Chesborough, H. (2003), Open Innovation: The New Imperative for Creating and Profiting from Technology, Harvard Business School Press, Boston, MA.
Christensen, C.M. (1997), The Innovator’s Dilemma. When New Technologies Cause Great Firms to Fail, Harvard Business School Press, Boston, MA.
Cohen, W.M., Nelson, R.R. and Walsh, J.P. (2002) ‘Links and Impacts: The Impact of Public Research on R&D’, Management Science, Vol. 48, No. 1, January, pp 1-23.
Connell, D. (2006), Secrets of the Worlds Largest Seed Capital Fund, Centre for Business Research, University of Cambridge, Cambridge, UK.
Cosh, A.D., Hughes, A. and Lester, R. (2006), UK PLC Just How Innovative Are We? Cambridge MIT Institute, University of Cambridge, Cambridge, UK. (http://www.cbr.cam.ac.uk/news/160206_Report_only.htm)
Dertouzos, M.L., Lester, R.K, and Solow, R.M. (1989), Made in America: Regaining the Productive Edge, MIT Press, Boston, MA.
Disney, R., Haskel, J. and Heden, Y. (2003), ‘Restructuring and Productivity Growth in UK Manufacturing’, The Economic Journal, Vol. 113, July, pp. 666-694.
European Commission (2004), Facing the Challenge: The Lisbon strategy for growth and employment. Report from the High Level Group chaired by Wim Kok. November, Luxembourg: Office of Official Publications of the European Communities.
Farrell, D., Baily, M.N. and Remes, J. (2005) ‘US Productivity after the Dot Com Bust’ McKinsey and Company.
Feynman, R.P. (1985), Surely you’re joking, Mr Feynman!: Adventures of a Curious Character, W.W. Norton Company Inc., New York, NY.

ITEC Working Paper 07-26 27
Flamm, K.S. (1987), Targeting the Computer: Government Support and International
Competition, The Brookings Institution, Washington, DC. Foster, L., Haltiwanger, J. and Krizan, C.J. (2002), ‘The link between aggregate and
microproductivity growth: Evidence from the retail trade’, National Bureau of Economic Research NBER Working Paper 9120, August.
Gambardello, A. and Malerba, F. (eds) (1999), The Organization of Economic Innovation in Europe, Cambridge University Press, Cambridge.
Griffith, R. and Harmgart, H. (2005), ‘Retail Productivity’, The Institute for Fiscal Studies Working Paper WP05/07, December, IFS, London.
Hall, B.H. (2004) ‘Exploring the Patent Explorion’, CBR Working Paper, WP 291, Centre for Business Research, University of Cambridge, Cambridge, UK, September.
Hall, B.H., Link, A.N. and Scott, J.T. (2003), ‘Universities As Research Partners’, The Review of Economics and Statistics, May, Vol. 85, No. 2, pp485-491.
Helpmann, E. (ed.) (1998) General Purpose Technologies and Economic Growth, MIT Press, Cambridge, MA.
Henderson, R., Jaffe, A.B. and Trajtenberg, M. (1998), ‘Universities as a Source of Commercial Technology: A Detailed Analysis of University Patenting 1965-1988’, Review of Economics and Statistics, Vol. 80, No. 10, February, pp119-127.
Hughes, A. (2007), ‘University Industry Links and UK Science and Innovation Policy’ in Yusuf, S. and Nabeshima, K. (eds), How Universities Promote Economic Growth, World Bank, Washington, DC.
Hughes, A. and Scott Morton, M.S. (2006), ‘The transforming power of complementary assets’, MIT Sloan Management Review, vol. 47, no. 4, Summer, MIT, Boston, MA.
Hughes, A. and Scott Morton, M.S. (2006), ‘ICT and Productivity Growth – The Paradox Resolved’, ESRC Centre for Business Research, Cambridge University, Working Paper No. 316.
Jarvie, I.C. (1964), The Revolution in Anthropology, Routledge and Kegan Paul, London, UK.
Jebens, H. (ed.) (2004), Cargo, Cult and Culture Critique, Honolulu, University of Hawaii Press.
Laursen, K. and Salter, A. (2006), ‘Open for Innovation: The role of openness in explaining innovations performance among UK manufacturing firms’, Strategic Management Journal, Vol. 27, Issue 2, pp131-150.
Lécuyer, C. (2006), Making Silicon Valley: Innovation and the Growth of High Tech, 1930-70, MIT Press, Cambridge, MA.

ITEC Working Paper 07-26 28
Lerner, J. (1999), ‘The Government as Venture Capitalist: The Long-Run Impact of the
SBIR Program’, Journal of Business, 72 (3), July, 285-318. Lester, R.K. and Piore, M.J. (2004), Innovation: The Missing Dimension, Harvard
University Press, Cambridge, MA. Lindstrom, L. (1993), Cargo Cult: Strange Stories of Desire from Melanesia and
Beyond, Honolulu, University of Hawaii Press. Markides, C.C. and Geroski, P.A. (2005) Fast Second: How Smart Companies Bypass
Radical Innovation to Enter or Dominate New Markets, Jossey Bass Wiley, San Francisco.
McGuckin, R.H., Spiegelman, M. and van Ark, B. (2005), ‘The US advantage in Retail and Wholesale Trade Performance: How Can Europe Catch Up?’, The Conference Board Working Paper 1358, March, New York.
McKinsey Global Institute in association with Solow, R.M., Bosworth, B., Hall, T. and Triplett, J. (2001), US Productivity Growth 1995-2000: Understanding the Contribution of Information Technology relative to other factors, McKinsey Global Institute.
Money Tree (2007), ‘Money tree Report’, Price Waterhouse Coopers (www.pwcmoneytree.com/moneytree/).
Mowery, D. (2007), ‘University-Industry Research Collaboration and technology Transfer in the United States since 1980’, in Yusuf, S. and Nabeshima, K. (eds) How Universities Promote Economic Growth, The World Bank, Washington, DC.
Mowery, D. and Rosenberg, N. (1998), Paths of Innovation: Technological Change in 20th Century America, Cambridge University Press, Cambridge.
OECD (2001) ‘Fostering Hi-Tech Spin Offs: A Public Strategy for Innovation’ OECD Science Technology Industry Review, Special Issue, No. 26, Paris.
OECD (2003a) ICT and Economic Growth: Evidence from OECD Countries Industries and Firms, OECD, Paris.
OECD (2003b, The Sources of Economic Growth in OECD Countries, OECD, Paris. Oxford Institute of Retail Management (2004), Assessing the Productivity of the UK
Retail Sector, Templeton College, Oxford, April. Pilat, D. and Lee, F.C. (2001), ‘Productivity Growth in ICT and ICT using Industries: A
course of Growth Differentials in the OECD?’, STI Working Papers 2001/4, OECD, June.

ITEC Working Paper 07-26 29
Sampart, B.N., Mowery, D.C. and Ziedonis, A.A. (2003), ‘Changes in University Patent
Quality after the Bayh-Dole Act: A Re-examination’, International Journal of Industrial Organization, Vol. 21, No. 9, November, pp1371-1390.
Segaller, S. (1998), Nerds 2.0.1: A Brief History of the Internet, TV Books, New York. Shane, S. (2004), Academic Entrepreneurship: University Spin-offs and Wealth
Creation, Edward Elgar, Cheltenham. Stokes, D.E. (1997), Pasteur’s Quadrant: Basic Science and Technological Innovation,
The Brookings Institution, Washington, DC. Swann, G.M.P. (2006), ‘Innovators and the Research Base: An Exploration Using
CIS4’, in Report for the Department of Trade and Industry/Office for Science and Innovation, London.
Teece, D.J. (1996), ‘Competition, Cooperation and Innovation: Organizational Arrangements for Regimes of Rapid Technological Progress, Journal of Economic Behaviour and Organization, Vol. 8, pp1-26.
US Patent Office (2005), ‘Patenting by Organisations’, US Patent Office, Washington, DC.
van Ark, B., Inklaar, R. And McGuckin, R.H. (2002), ‘Changing Gear’ Productivity, ICT and Service Industries: Europe and the United States’, Research Memorandum GD-60 Gröningen Growth and Development Centre, University of Gröningen.
Wallsten, S.J. (2000), ‘The Effects of Government-industry R&D Programs on Private R&D: The Case of the Small Business Innovation research Program’, RAND Journal of Economics, 31 (1), Spring, pp. 82-100.
Wessner, C.W. (ed) (2001), The Small Business Innovation Programme SBIR: Challenges and Opportunities, National Research Council, National Academy Press, Washington, DC.
Wessner, C.W. (2003), Government-Industry Partnerships for the Development of New Technologies; Summary Report, National Research Council, National Academy Press, Washington, DC.
Worsley, P. (1957), The Trumpet shall sound: A study of “cargo” cults in Melanesia, MacGibbon and Kee, London.
Yusuf, S. and Nabeshima, K. (eds) (2007), How Universities Promote Economic Growth, World Bank, Washington, DC.