myrtle beach advisory forecast forecastforecast model...myrtle beach advisory forecast model ... the...

13
Myrtle Beach advisory forecast model development: Integrating data from monitoring programs, remote sensing, and observing systems Myrtle Beach advisory forecast model Myrtle Beach advisory forecast model development: development: Integrating data from monitoring programs, remote Integrating data from monitoring programs, remote sensing, and observing systems sensing, and observing systems Shannon Berry Heath Kelsey Dwayne Porter Shannon Berry Heath Kelsey Dwayne Porter

Upload: others

Post on 05-Aug-2020

2 views

Category:

Documents


0 download

TRANSCRIPT

Myrtle Beach advisory forecast model  development:

Integrating data from monitoring programs, remote  sensing, and observing systems

Myrtle Beach advisory forecast model Myrtle Beach advisory forecast model  development:development:

Integrating data from monitoring programs, remote Integrating data from monitoring programs, remote  sensing, and observing systemssensing, and observing systems

Shannon BerryHeath KelseyDwayne Porter

Shannon BerryHeath KelseyDwayne Porter

Presenter
Presentation Notes
Thank you for inviting us to this meeting. Heath, Dwayne and I will talk with ; you about the need for use of the rain model developed for S.C. DHEC by Erica Johnson for our beach monitoring stations in Horry County.

1)Water quality issue: Bacterial contamination at beaches

2)User community: Beach program, public

3)Process: Objectives, data integration and model 

approach

4)Outcomes: Improved information, efficiency of effort

5)Performance metrics: Model validation, re‐evaluation, 

intervention analysis

6)Value added from improved technologies: NEXRAD 

extraction, data management, telemetry

7)Needs: Asset coverage, beachgoer data, bacterial source 

tracking, research 

StoryboardStoryboard

Presenter
Presentation Notes
I will talk with you about the water quality issues in Horry County, our past sampling and notification process, and the introduction of the rain model in 2005. Heath and Dwayne will discuss the specifics of the model and the enhancements they are developing. We’ve switched the order of numbers 3 and 4 in the storyboard so that we don’t have to jump back and forth between speakers.

• Bacteria  contamination

• Advisory posting

1.) Water quality issue1.) Water quality issue

Presenter
Presentation Notes
The need for predictive rain models comes from the desire to be most protective of public health. In the beginning we needed to get an idea about what the data looked like. In an effort to best protect beachgoers, we sampled only at low tide when we thought we would find the most bacteria. We set our sampling stations about 2 tenths of a mile apart and moved them when we found a swash or pipe so we could sample there. As the data came in we realized rainfall was major player in ocean water quality in Horry County because of the stormwater outfalls. Instead of sampling based on media weather data, we bought rain gauges.

Bacteria Concentration Day 1 (log)

Bac

teria

Con

cent

ratio

n D

ay 2

(log

)

• Most beaches use  yesterday’s bacteria 

concentration to issue  advisories

• Predictive modeling

Rainfall and rain gauges

1.) Water quality issue1.) Water quality issue

Presenter
Presentation Notes
Horry County’s stormwater outfalls all go to the ocean. Before the predictive model our staff relied on media weather reports and rainfall data to try to determine if a pre-emptive advisory was called for. They were having to guess if ¼ inch of rain caused an exceedence or was it ½ an inch or 1 inch or more. The advisory process meant contacting the media with the advisory locations, posting signs, sampling, waiting 24 hours for results, and continuing this process until the samples were below the standard. Many beaches in the US use results from sampling data to issue advisories, but this is not very effective and the results are not timely. The analysis takes 24 hours or so, so data that you have to make a decision on issuing an advisory are 24-hours old. That would be OK if the relationship between yesterdays bacteria concentration was similar to the current day. As you can see from this plot, this is not the case; these are results from Myrtle Beach sampling stations that show that the bacteria concentration on the first day does not match well with what it was yesterday.

Beachgoing public• Better, more timely 

information

2.) User community2.) User community

Rayna KingSean Torrens

Jennifer CanarightDavid Cudd

Beach program staff• Reduced effort

• Improved results

Presenter
Presentation Notes
When DHEC purchased rain gauges with remote dial in devices and when the rain model was introduced, staff time, travel, and sampling expense were decreased. We were better able to notify the public based on science and we could give more timely information to the media and the public.

4.) Outcomes4.) Outcomes

• Reduced sampling during rain  events

• Public has better and more  timely information

Presenter
Presentation Notes
Our staff in Horry County has 41 sampling stations along 27 miles of beach. These stations are sampled weekly. They are also responsible for almost 2,500 swimming pools. With 12 summer pool inspectors to supervise, they can use all the help they can get reducing time and labor. The rain model has helped them reduce work on weekends and nights, travel to post signs when not needed, and it has given us the confidence to advise the public based on science.

3.) Process3.) ProcessObjectives1.Develop decision support tools for 

bacteria contamination at beaches

2.Increase utility Observing System and 

Remote Sensing data

3.Pilot “science to management”

application through integration of data

3.) Process3.) Process•Factors affecting bacteria concentration

Monitoring programs Observing systems

3.) Process3.) Process•Integrating data incorporates these factors

Parameter SourceBacteria density  Monitoring Programs

Air temperature Monitoring Programs / Observing Systems/ Remote Sensing

Water temperature Monitoring Programs / Observing Systems/ Remote SensingSalinity Monitoring Programs / Observing SystemsTide stage NOAA

Weather conditions Weather Service/ Observing Systems/ Remote SensingWind direction Weather Service/ Observing Systems/ Remote SensingPrecipitation Weather Service/ Observing Systems/ Remote SensingSolar radiation Observing Systems/ Remote SensingRiver Flow  River Forecasting Centers / USGS

Soil Moisture Remote Sensing

Remote sensing

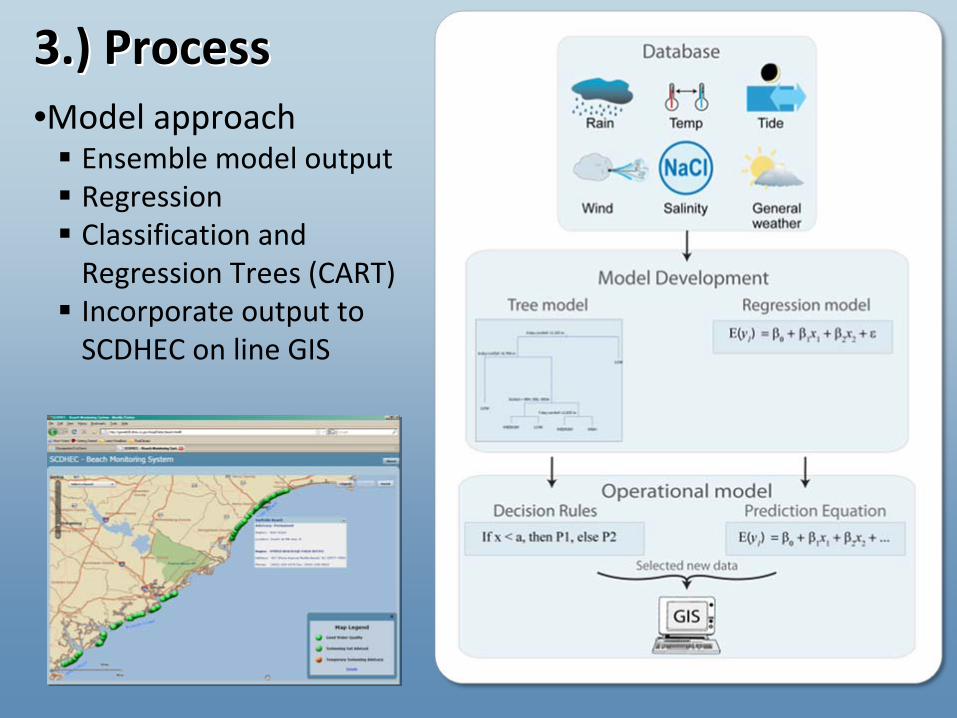
3.) Process3.) Process•Model approach

Ensemble model output

Regression 

Classification and 

Regression Trees (CART)

Incorporate output to 

SCDHEC on line GIS

5.) Performance metrics 5.) Performance metrics •Model validation, re‐evaluation, intervention 

analysis 

200420042006200620042004

Outfall Mod

ificatio

n

Stormwater modifications Reduced bacteria concentration

6.) Value added from improved 6.) Value added from improved  technologiestechnologies

•NEXRAD extraction, data management, telemetry

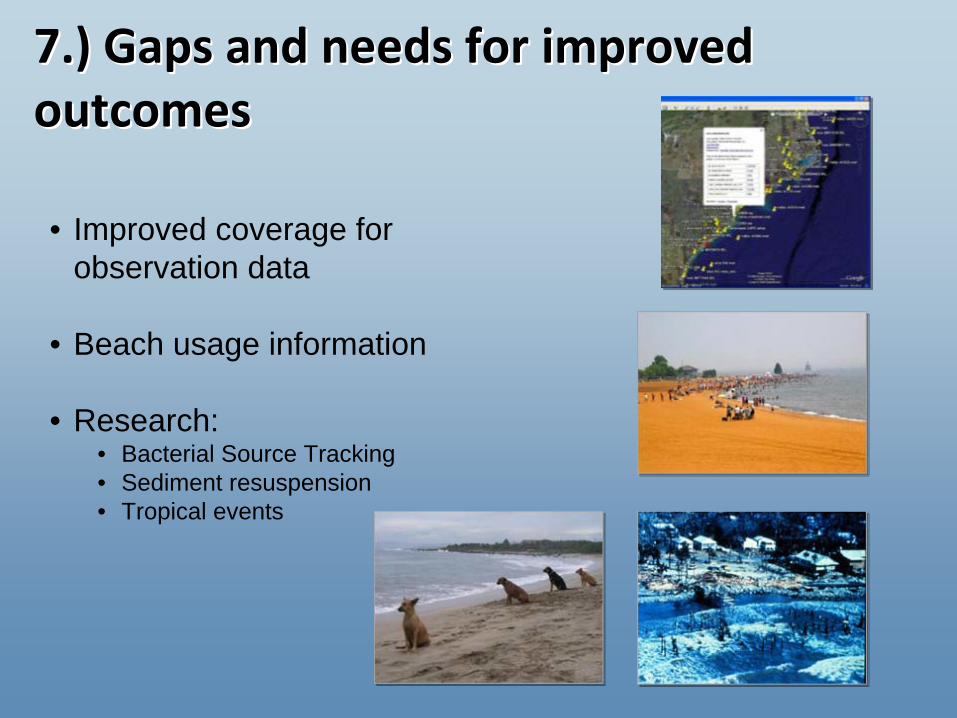
7.) Gaps and needs for improved 7.) Gaps and needs for improved  outcomesoutcomes

• Improved coverage for observation data

• Beach usage information

• Research: • Bacterial Source Tracking• Sediment resuspension• Tropical events