myer holdings limited 2015 annual report and notice of...
TRANSCRIPT

FOR IMMEDIATE RELEASE
12 October 2015
Myer Holdings Limited 2015 Annual Report and Notice of Annual General Meeting
Myer Holdings Limited today released the following documents:
• Annual Report for the year ended 25 July 2015;
• Notice of Meeting (including Proxy Form) for the 2015 Annual General Meeting, which will be held at Mural Hall, located on Level 6 of the Myer Melbourne store, Bourke Street Mall, Melbourne, on Friday 20 November 2015 at 11.00am;
• Appendix 4G and Corporate Governance Statement. The Annual Report and Notice of Meeting will be dispatched today to shareholders who have elected to receive hard copies. The 2015 Annual Report is available for download from www.myer.com.au/investor For further information please contact:
Investors
Davina Gunn, Investor Relations Manager, +61 (0) 400 896 809
Media
Mel Ward, Corporate Affairs Manager, +61 (0) 438 101 078
Page 1 of 1

B R I N G I N G T H E L O V E O F S H O P P I N G T O L I F E
A N N U A L R E P O R T
2 0 15
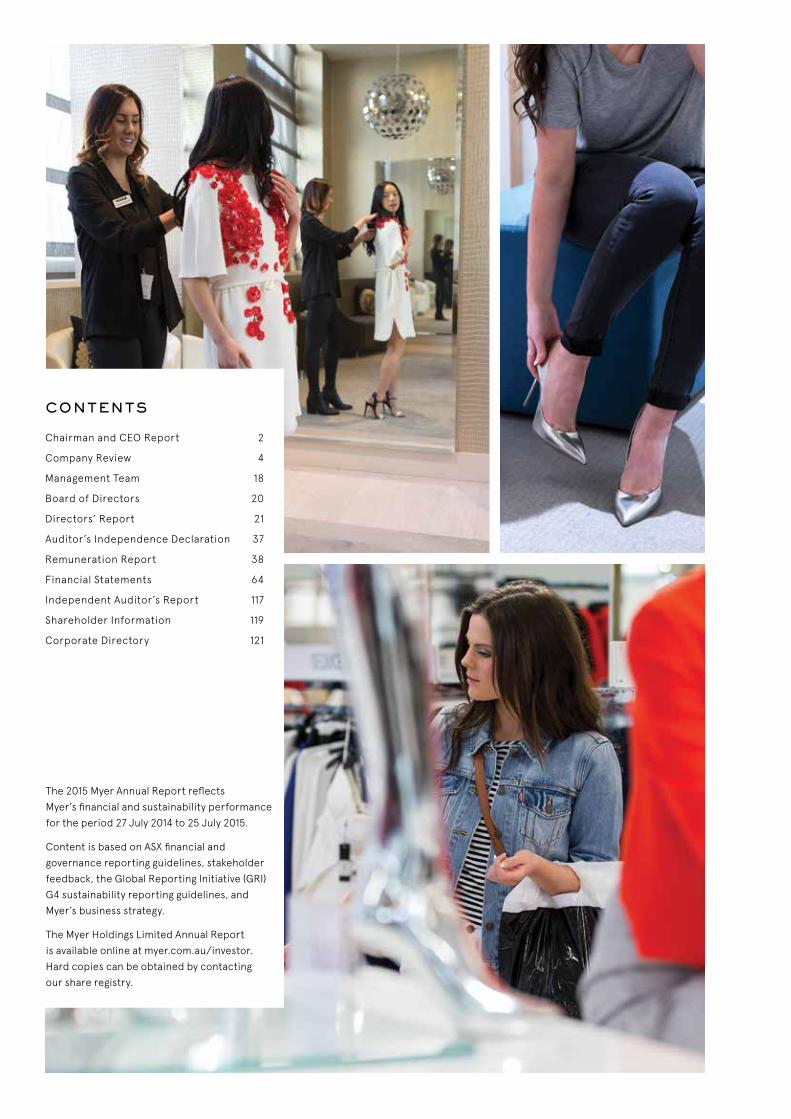
CONTENTS
The 2015 Myer Annual Report reflects
Myer’s financial and sustainability performance
for the period 27 July 2014 to 25 July 2015.
Content is based on ASX financial and
governance reporting guidelines, stakeholder
feedback, the Global Reporting Initiative (GRI)
G4 sustainability reporting guidelines, and
Myer’s business strategy.
The Myer Holdings Limited Annual Report
is available online at myer.com.au/investor.
Hard copies can be obtained by contacting
our share registry.
Chairman and CEO Report 2
Company Review 4
Management Team 18
Board of Directors 20
Directors’ Report 21
Auditor’s Independence Declaration 37
Remuneration Report 38
Financial Statements 64
Independent Auditor’s Report 117
Shareholder Information 119
Corporate Directory 121

MYER Annual Report 2015 1
Myer is a company with a proud heritage and a bright future.
As the retail world and our customers change, we are transforming Myer to deliver a
reinvigorated offer and wonderful experiences for our customers who love us today, and
for future generations.
ANNUAL GENERAL MEETING
The sixth Annual General Meeting of Myer Holdings Limited will be held
on Friday 20 November 2015 at 11.00am (Melbourne time).
Mural Hall
Level 6, Myer Melbourne Store
Bourke Street Mall, Melbourne VIC 3000
Myer Holdings Limited ABN 14 119 085 602

2 MYER Annual Report 2015
Q & A
CHAIRMAN AND CEO REPORT
2015 was a watershed year for Myer, which saw a strengthened management team chart a new strategy to aggressively tackle the evolving retail environment and return the business to sustainable, profitable growth.
The FY2015 result supports the case for our comprehensive change agenda. In the second half of the year the team focused on delivering a thorough review of Myer’s strategy under the leadership of new CEO Richard Umbers.
The New Myer strategy that was announced in September is an energetic revitalisation of Australia’s best-loved retailer. The strategy sets out a five year transformation program to bring the love of shopping to life with a renewed focus on Myer’s primary customers, investment in stores and online retailing (known as omni-channel) and a step change in the productivity of our store network. In the coming 12 months and the years ahead we will work diligently across the business to deliver the strategy.
What are the most significant achievements from the past year?
Richard commenced as CEO in March 2015, replacing Bernie Brookes who stepped down after almost nine years in the position. The Board and the entire Myer team thank Bernie for his significant contribution.
During the year, we also welcomed several new executives with a depth and breadth
of international retail expertise to further strengthen our Executive Management Group.
This year also marked one of the largest brand overhauls in Myer’s history as we rolled out a number of wanted brands including French Connection, seed, Nine West, Jack & Jones, Calvin Klein White Label and Tiger Mist. This trend will continue into the new financial year with the launch of our exclusive department store partnership with iconic British brand, TOPSHOP TOPMAN, and many more to come.
In June 2015, we successfully refinanced our $600 million debt facility on improved terms, tenor and pricing, giving us a solid financial foundation to begin the new financial year.
What were the main factors influencing the FY2015 result?
During FY2015, sales increased by 1.7 percent.
There was a continued strong performance in the Cosmetics, Childrenswear and Entertainment categories. This was offset by challenging conditions in Womenswear. There has been a positive customer response to the four major refurbishments and two new stores, and we have continued to deliver strong growth in online sales.
Continued cost growth ahead of sales growth resulted in net profit after tax
(NPAT) of $77.5 million which was down 21.3 percent on the prior year (excluding Individually Significant Items).
Why is Myer changing its strategy, and what is being done to address the Company’s financial performance?
The store footprint and margin expansion model from our early years as a listed company led to a cost base that was outgrowing revenue, and our operational model became too inflexible to match the pace of change in retail.
Our strategic review, which included a deep and detailed analysis of our customers and store catchments, convinced us that this model was no longer appropriate for the current environment and that broadly flat sales would continue without a significant change in strategic direction.
In the context of the strategic review the Board also decided that it would be prudent to raise additional capital to retire debt and provide the necessary balance sheet flexibility to deliver the New Myer strategy.
To achieve this, the Company made the decision to raise approximately $221 million of new capital through an accelerated, non-renounceable entitlement offer. In light of the entitlement offer, the Board elected to not declare a final dividend for FY2015.
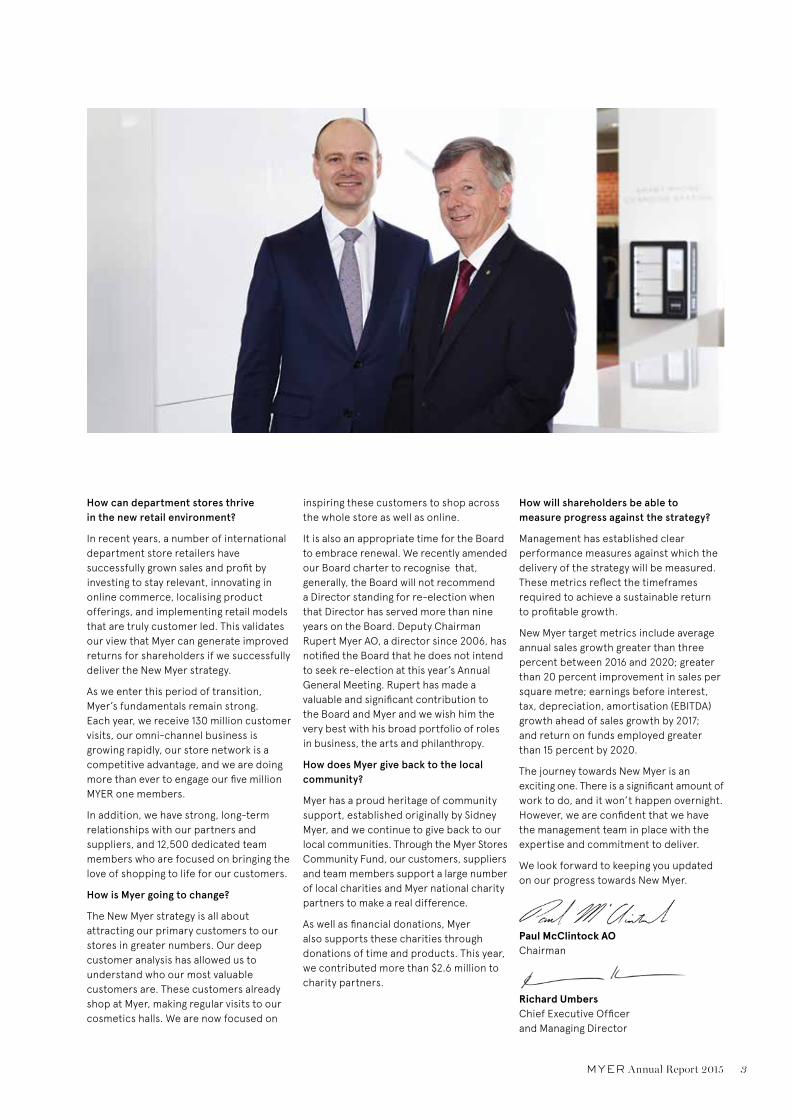
Myer Chairman Paul McClintock AO and CEO & Managing Director Richard Umbers provide
a review of the past year and discuss future priorities.
MYER Annual Report 2015 3
How can department stores thrive in the new retail environment?
In recent years, a number of international department store retailers have successfully grown sales and profit by investing to stay relevant, innovating in online commerce, localising product offerings, and implementing retail models that are truly customer led. This validates our view that Myer can generate improved returns for shareholders if we successfully deliver the New Myer strategy.
As we enter this period of transition, Myer’s fundamentals remain strong. Each year, we receive 130 million customer visits, our omni-channel business is growing rapidly, our store network is a competitive advantage, and we are doing more than ever to engage our five million MYER one members.
In addition, we have strong, long-term relationships with our partners and suppliers, and 12,500 dedicated team members who are focused on bringing the love of shopping to life for our customers.
How is Myer going to change?
The New Myer strategy is all about attracting our primary customers to our stores in greater numbers. Our deep customer analysis has allowed us to understand who our most valuable customers are. These customers already shop at Myer, making regular visits to our cosmetics halls. We are now focused on
inspiring these customers to shop across the whole store as well as online.
It is also an appropriate time for the Board to embrace renewal. We recently amended our Board charter to recognise that, generally, the Board will not recommend a Director standing for re-election when that Director has served more than nine years on the Board. Deputy Chairman Rupert Myer AO, a director since 2006, has notified the Board that he does not intend to seek re-election at this year’s Annual General Meeting. Rupert has made a valuable and significant contribution to the Board and Myer and we wish him the very best with his broad portfolio of roles in business, the arts and philanthropy.
How does Myer give back to the local community?
Myer has a proud heritage of community support, established originally by Sidney Myer, and we continue to give back to our local communities. Through the Myer Stores Community Fund, our customers, suppliers and team members support a large number of local charities and Myer national charity partners to make a real difference.
As well as financial donations, Myer also supports these charities through donations of time and products. This year, we contributed more than $2.6 million to charity partners.
How will shareholders be able to measure progress against the strategy?
Management has established clear performance measures against which the delivery of the strategy will be measured. These metrics reflect the timeframes required to achieve a sustainable return to profitable growth.
New Myer target metrics include average annual sales growth greater than three percent between 2016 and 2020; greater than 20 percent improvement in sales per square metre; earnings before interest, tax, depreciation, amortisation (EBITDA) growth ahead of sales growth by 2017; and return on funds employed greater than 15 percent by 2020.
The journey towards New Myer is an exciting one. There is a significant amount of work to do, and it won’t happen overnight. However, we are confident that we have the management team in place with the expertise and commitment to deliver.
We look forward to keeping you updated on our progress towards New Myer.
Paul McClintock AOChairman
Richard Umbers Chief Executive Officer and Managing Director

4 MYER Annual Report 2015
C O M P A N Y S N A P S H O T
Myer is a modern Australian retailer, with more than 100 years of heritage and
a dedicated focus to bring the love of shopping to life.
COMPANY REVIEW
Myer is Australia’s largest full-line
department store group, with more
than 60 stores located across Australia.
Our stores are visited by customers more
than 130 million times each year, and our
loyalty program, MYER one, has more than
five million members. In addition to our
physical Myer stores and our online store,
we own womenswear designer brand,
sass & bide. This range is available from
stand-alone boutiques, Myer stores,
overseas retailers, and online.
We are a significant employer in Australia,
with 12,500 Myer team members, and we
have a strong background in philanthropy.
One of our most widely recognised
initiatives is the Spirit of Christmas CD,
supporting The Salvation Army. This has
showcased the very best of Australian
musical talent and generated more than
$7.4 million since it launched. Since 2004,
our annual Precious Metal Ball has raised
more than $6 million, with funds going to
organisations such as Redkite, the Olivia
Newton-John Cancer and Wellness
Centre, and SMILE Foundation.
Myer is committed to responsible business
growth and integrating environmental,
social, and ethical considerations into
the way we operate. Our sustainability
strategy aims to maximise the positive
outcomes and influences we can have
on our stakeholders by integrating all
aspects of sustainability into our ‘every
day’ business operations. For more
information, please see page 14.
To enable the business to make sound
decisions and maximise opportunities,
Myer has a comprehensive risk
management plan to identify and manage
risks and uncertainties. Further details
are available in the Directors’ Report
on page 31.
Myer has a proud Australian history and
an exciting future supported by our New
Myer strategy, which delivers a fresh
interpretation of our brand, a re-energised
and relevant range, improved service and
in-store experiences complemented by
a strong omni-channel offer.
While the customer sits at the heart of
our strategy, it cannot succeed without
our devoted team of employees, and our
strong relationships with suppliers of high
quality, wanted brands and products.
Our strategy brings the best of Myer
to the customers who love us today,
and to future generations.

MYER Annual Report 2015 5

6 MYER Annual Report 2015
FINANCIAL SUMMARY ($M)
FY2015 FY2014 Change
Total Sales 3,195.6 3,143.0 +1.7%
Operating Gross Profit 1,290.4 1,285.9 +0.3%
Operating Gross Profit margin 40.4% 40.9% (53bps)
Cost of doing business (CODB) (1,067.2) (1,033.3) +3.3%
Earnings before interest, tax, depreciation, amortisation (EBITDA)* 223.2 252.6 (11.6%)
Earnings before interest and tax (EBIT)* 133.5 160.3 (16.7%)
Net Profit After Tax (NPAT)* 77.5 98.5 (21.3%)
* Excludes Individually Significant Items. See page 27 for further details.
AT A G L A N C E
COMPANY REVIEW
TEAM MEMBER ENGAGEMENT
84%TOTAL FEMALE EMPLOYEES
79%LOST TIME INJURY
FREQUENCY RATE (LTIFR)
7.7TOTAL CONTRIBUTION TO CHARITY PARTNERS
$2.6mREDUCTION IN GREENHOUSE
GAS EMISSIONS
3%
WASTE RECYCLING RATE
58%
SUSTAINABILITY
2015
2014
2013
2012
2011
40.4
40.9
41.5
41.2
39.5
OPERATING GROSS PROFIT MARGIN (%)
2015
2014
2013
2012
2011
NET PROFIT AFTER TAX ($M)
77.5*
98.5
127.2
139.3
162.7
2015
2014
2013
2012
2011
EARNINGS PER SHARE (CENTS)
13.2*
16.8
21.8
23.9
27.9
2015
2014
2013
2012
2011
TOTAL SALES ($B)
3.2
3.1
3.1
3.1
3.2
See page 14 for further details on sustainability.
MYER Annual Report 2015 7
P E R F O R M A N C E R E V I E W
COMPANY REVIEW
SALES
Total sales for the full year (ending
25 July 2015) increased by 1.7 percent
to $3,195.6 million, driven by new stores
and refurbishments as well as strong
growth in the online business. There
was continued strong growth in the
Cosmetics business as well as in
Childrenswear and Entertainment,
offset by a poor performance in
Womenswear. During Christmas 2014,
the rollout of Giftorium, representing
dedicated gifting space in all stores,
was well received by customers.
Customers also responded positively
to the four major store refurbishments
that were completed ahead of Christmas
2014. In addition, new stores at Mt Gravatt
(QLD) and Joondalup (WA) generated
additional growth.
During the year, two stores were closed
in NSW, at Hurstville in January 2015 and
Top Ryde in July 2015.
MARGINS AND CODB
The operating gross profit margin declined
by 53 basis points to 40.4 percent. This
was largely due to the depreciation in the
Australian dollar and increased inventory
provisions.
CODB increased by 3.3 percent to
$1,067.2 million, driven by costs associated
with refurbishments in four of our top
25 stores as well as two new stores, and
costs associated with the growth in the
omni-channel business.
NET FINANCE COSTS AND NET DEBT
Net debt increased by $40 million to
$388 million, reflecting lower profitability
and higher working capital. This was
largely offset by lower capital expenditure,
dividend and tax payments.
Net interest costs increased by 3.7 percent
to $22.7 million as a result of the higher net
debt position. Offsetting this were savings
achieved as a result of the re-financing in
the second half.
CASH FLOW AND BALANCE SHEET
The reduction in operating cash flow
by $96 million to $167 million reflected
both the reduction in earnings for the
year as well as a negative working capital
movement of $56 million. The negative
working capital movement was due
to an increase in trading inventory to
$22 million compared to FY2014 and
lower trade creditors of $19 million.
As part of our strategy to exit a large
number of brands, the Spring Clean
Clearance event launched in the first
quarter of FY2016 has successfully
reduced inventory by approximately
$10 million, with net debt also improving
by approximately $20 million since
balance date.
Capital expenditure during FY2015
decreased by $6 million to $62 million
compared to FY2014 pending the
outcomes of the strategic review.
INDIVIDUALLY SIGNIFICANT ITEMS
The FY2015 results include a number of
Individually Significant Items totalling
$61.7 million (pre tax) which have primarily
arisen as a result of the strategic review.
These significant items represent the
commencement of the ‘re-setting’
of the business as we implement the
New Myer strategy.
FY2016 OUTLOOK
FY2016 will represent a transitional year
for Myer in which significant investments
are being made in our future growth, with
the rewards from these investments to
be realised in late FY2016 and thereafter.
Following FY2016, Myer expects to return
to sustainable profit growth.
As a result (and including the impact of
the entitlement offer), Myer expects NPAT
for FY2016 to be in the range of $64 million
to $72 million, excluding the impact of
implementation costs associated with
New Myer.
Individually Significant Items in FY2016
are expected to be in the range of
$35 million to $45 million (pre tax)
and will predominantly comprise costs
associated with the New Myer strategy
and improving productivity.
Capital expenditure is expected to be in
the range of $100 million to $120 million
in FY2016.
Further discussion about Myer’s
performance is set out in the Directors’
Report from page 21.
8 MYER Annual Report 2015
We are investing in New Myer over the
next five years to deliver a sharper and
more focused offer to serve a more
valuable customer, driving productivity
and growth. Our stores will inspire and
delight and become more relevant to
our customers’ daily lives.
The New Myer strategy is founded on
advanced data analytics of Myer’s
customer base and store catchments.
We’re using this data to better understand
our customers and identify the greatest
opportunity to achieve higher sales
and profit.
Our strategy will come to life through
the four priorities outlined below, and
will be supported by our organisational
capability.
OUR FOUR STRATEGIC PRIORITIES
Customer led offer
> Provide the brands that inspire our
primary customers and create a halo
effect that attracts and retains other
customer groups.
Wonderful experiences
> Create stores that surprise and delight,
through retail experiences that
combine wanted brands and services
with the theatre of shopping that we
know customers love.
Omni-channel
> Embrace the new retail environment
through a seamless omni-channel
experience, a fusion between physical
and digital retailing that starts on your
device and ends in our store or on your
doorstep.
Productivity step change
> Deliver a more productive and
profitable store network over a smaller
and more efficient footprint as we work
to better align our network with our
primary customers.
T H E T R A N S F O R M AT I O N
O F M Y E R
Our New Myer strategy is a five-year journey, focused on the customers who represent the highest value to our business.
COMPANY REVIEW
MYER Annual Report 2015 9
COMPANY REVIEW
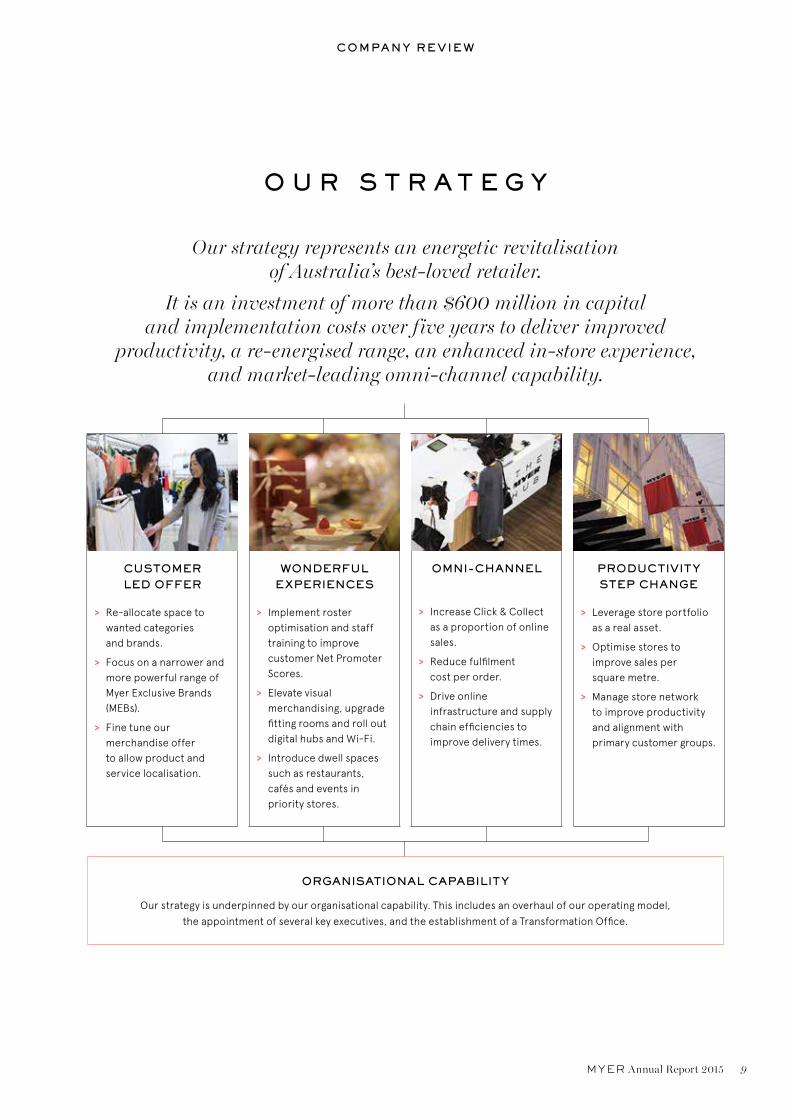
Our strategy represents an energetic revitalisation of Australia’s best-loved retailer.
It is an investment of more than $600 million in capital and implementation costs over five years to deliver improved
productivity, a re-energised range, an enhanced in-store experience, and market-leading omni-channel capability.
O U R S T R AT E G Y
CUSTOMER LED OFFER
> Re-allocate space to wanted categories and brands.
> Focus on a narrower and more powerful range of Myer Exclusive Brands (MEBs).
> Fine tune our merchandise offer to allow product and service localisation.
WONDERFUL EXPERIENCES
> Implement roster optimisation and staff training to improve customer Net Promoter Scores.
> Elevate visual merchandising, upgrade fitting rooms and roll out digital hubs and Wi-Fi.
> Introduce dwell spaces such as restaurants, cafés and events in priority stores.
OMNI-CHANNEL
> Increase Click & Collect as a proportion of online sales.
> Reduce fulfilment cost per order.
> Drive online infrastructure and supply chain efficiencies to improve delivery times.
PRODUCTIVITY STEP CHANGE
> Leverage store portfolio as a real asset.
> Optimise stores to improve sales per square metre.
> Manage store network to improve productivity and alignment with primary customer groups.
ORGANISATIONAL CAPABILITY
Our strategy is underpinned by our organisational capability. This includes an overhaul of our operating model,
the appointment of several key executives, and the establishment of a Transformation Office.
10 MYER Annual Report 2015
D E L I V E R I N G T H E N E W M Y E R
During FY2015, we embarked on our New Myer strategy by implementing a series of initiatives designed to provide our customers with the inspiring range and experiences they want, while ensuring they can shop with Myer
across all retail platforms with ease and convenience.
CUSTOMER LED OFFER
In developing our strategy, we conducted
a detailed analysis of 50,000 consumer
data sets to give us a clear understanding
of our primary customers’ lifestyles and
values, how they shop with Myer and our
competitors.
The forefront of this strategy is a customer
led offer which focuses on offering a
re-energised range delivered through
relevant categories, wanted brands, and
locally tailored offers.
During the year, we made a number of
positive changes to our merchandise
offer including introducing new brands
(see the opposite page), improving store
layouts and visual merchandising, and
streamlining our online range.
In particular, the introduction of
French Connection, seed and Nine West
represents one of the largest brand
rollouts ever undertaken at Myer, with
multiple brands deployed across a number
of different categories in large footprints
in more than 40 stores.
We continue to reinvigorate our brand
offer across concessions, national
brands, and MEBs, as well as localise
the range according to demographic
attributes and geographic factors.
WONDERFUL EXPERIENCES
Our focus is on delivering retail
experiences that combine wanted brands
and services with the theatre of shopping
that we know customers love.
We know from our flagship store in
Melbourne that when we get the in-store
offer right, combined with enticing dwell
spaces and cafés, we can generate great
customer experiences. Our Giftorium
concept, which launched in December
2014, is testament to the type of unique
shopping environments we can create.
Progress is already underway with changes
to the mix of our in-store team members
to create more flexible rosters and ensure
we have team members in-store when our
customers need them most. We have also
implemented a number of new training
initiatives to upskill our team members,
including our Intimate Apparel Fitting
School, where we are training team
members in the unique skills required to
fit and sell this complex product category.
This is just one of many training programs
we have planned under New Myer.
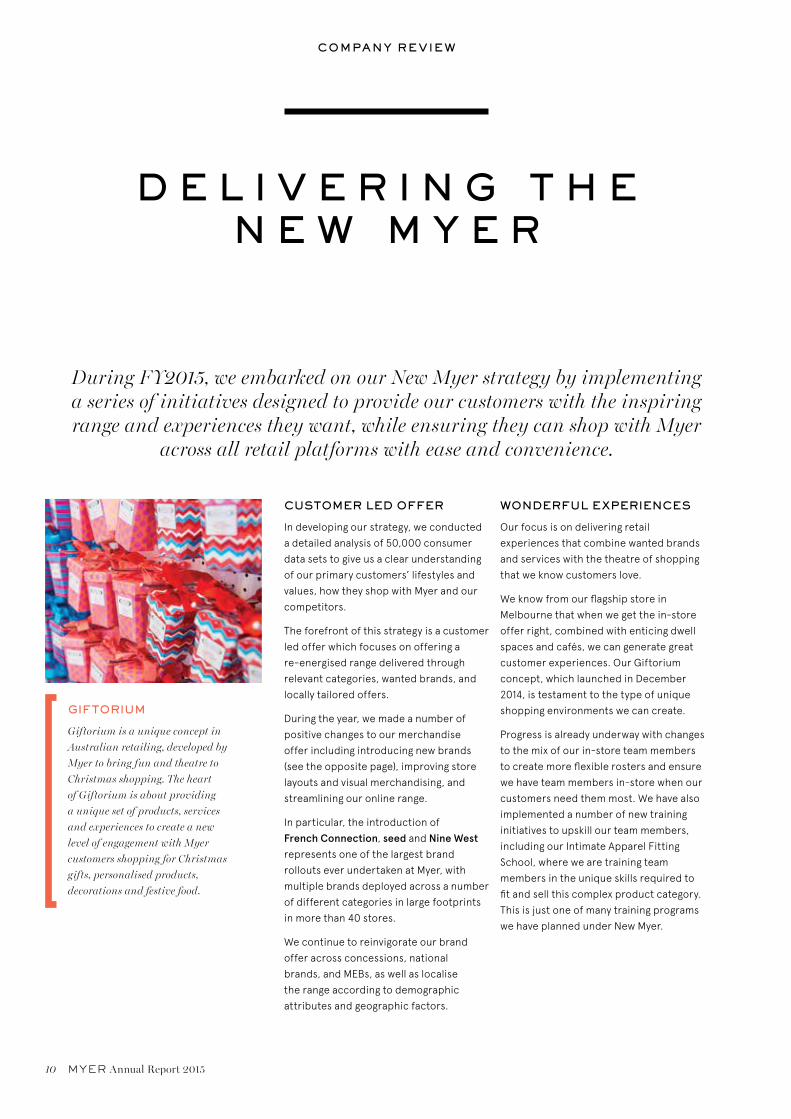
GIFTORIUM
Giftorium is a unique concept in
Australian retailing, developed by
Myer to bring fun and theatre to
Christmas shopping. The heart
of Giftorium is about providing
a unique set of products, services
and experiences to create a new
level of engagement with Myer
customers shopping for Christmas
gifts, personalised products,
decorations and festive food.
COMPANY REVIEW

MYER Annual Report 2015 11
ENHANCING THE IN-STORE EXPERIENCE
Our team members are critical
to providing our customers with
great experiences.
We continue to invest in our people
to ensure that we are delighting our
customers at every opportunity.
GIVING OUR CUSTOMERS WANTED BRANDS
Wonderful experiences start with brands that customers know
and love. Over the last year, we have launched a number of new
brands including White Suede, by Johnny, Maison Scotch,
Asilio, Jo Malone, M.J. Bale, Scotch & Soda, Jack & Jones
and Pierre Balmain.
In June 2015, we announced widely-recognised and renowned new
brands seed, Nine West and French Connection, strengthening our
fashion offer for Myer customers.
We are also thrilled that Myer is now the exclusive department
store home for TOPSHOP TOPMAN in Australia. Our Bondi store
will be the first to receive TOPSHOP TOPMAN in November 2015,
followed by a progressive rollout to more than 20 Myer stores.
… and increase space for wanted brands 1
WANTED BRANDS ALREADY SECURED ACTIONS
- Reallocate space away from over-spaced brands and towards our 40-50 most wanted brands
- C. 3.4x greater gross profit in identified brands/space
23
12 MYER Annual Report 2015
COMPANY REVIEW
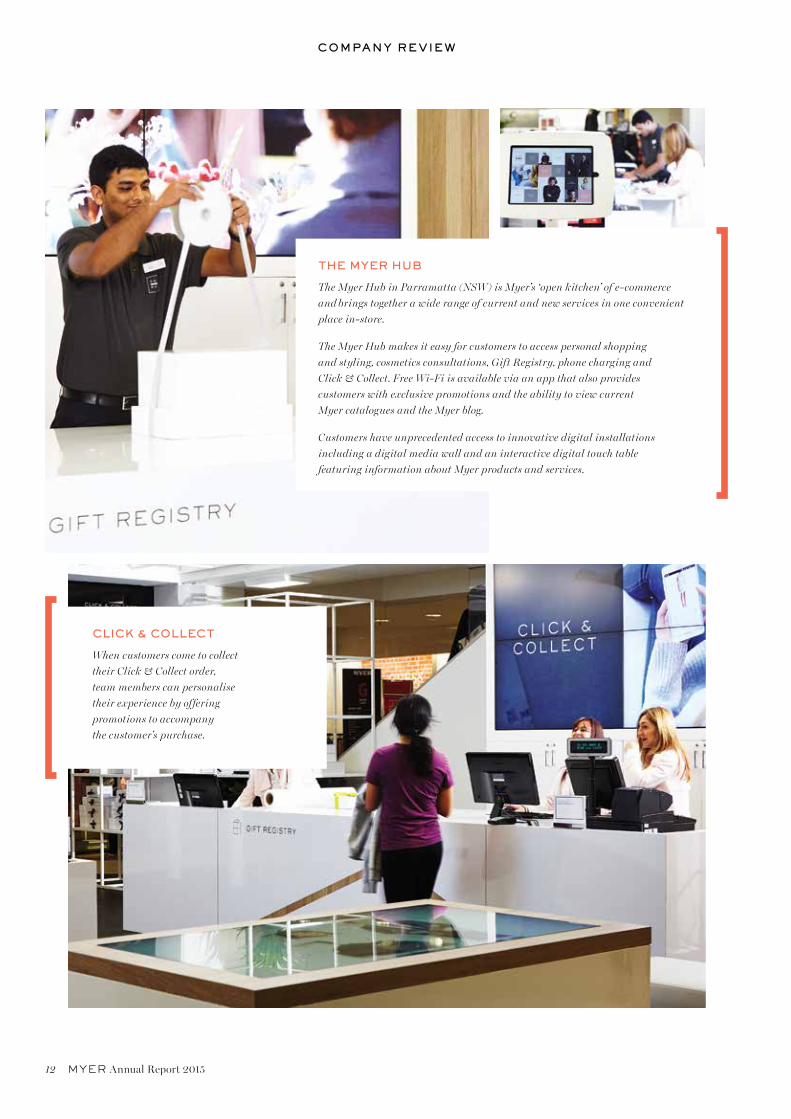
THE MYER HUB
The Myer Hub in Parramatta (NSW) is Myer’s ‘open kitchen’ of e-commerce
and brings together a wide range of current and new services in one convenient
place in-store.
The Myer Hub makes it easy for customers to access personal shopping
and styling, cosmetics consultations, Gift Registry, phone charging and
Click & Collect. Free Wi-Fi is available via an app that also provides
customers with exclusive promotions and the ability to view current
Myer catalogues and the Myer blog.
Customers have unprecedented access to innovative digital installations
including a digital media wall and an interactive digital touch table
featuring information about Myer products and services.
CLICK & COLLECT
When customers come to collect
their Click & Collect order,
team members can personalise
their experience by offering
promotions to accompany
the customer’s purchase.

MYER Annual Report 2015 13
OMNI-CHANNEL SHOPPING
Online shopping is revolutionising retail,
empowering customers, and providing
new channels to market.
We already have one of the leading online
offers in Australia, and our online sales
continue to grow. We are strengthening
our omni-channel proposition to create a
seamless shopping experience that starts
on any device and ends in any one of our
stores, or at a customer’s door or office.
This can be seen in the Myer Hub, which
was successfully trialled in our Parramatta
(NSW) store (see the opposite page).
Various elements of the Myer Hub concept
will be rolled out to select stores in FY2016.
In 2015, we closed our third party
operated distribution centre to enable
us to streamline our fulfilment model.
Our focus is on store-based fulfilment
which is more cost effective, enables
us to better manage delivery times, and
increases the use of our Click & Collect
service.
PRODUCTIVITY STEP CHANGE
Myer’s store network is one of our
strongest assets and a real source
of competitive advantage.
Our store network has been thoroughly
reviewed through detailed catchment
analysis, store by store, and we understand
the potential of each location.
With these detailed insights and analytics,
we will actively manage our store portfolio
to improve store productivity and better
align our footprint with our primary
customers.
During 2015 we have actively demonstrated
change, with the closure of two NSW stores
at Hurstville and Top Ryde, the decision
to not proceed with a store at Greenhills
(NSW), and the opening of two new stores
in Mt Gravatt (QLD) and Joondalup (WA).
ORGANISATIONAL CAPABILITY
Our success is underpinned by our
people and organisational capability.
We have already made progress in
mobilising our business for this
transformation, and in April 2015 we
established a Transformation Office to
promote and co-ordinate the progress
we are making.
To further strengthen our leadership
team, we welcomed a number of senior
executives in FY2015. These executives
possess the right mix of expertise in retail
and business transformation to help
successfully deliver the New Myer strategy.
We are strengthening our omni-channel proposition to create a seamless shopping experience.
Our new operating model puts the
customer at the centre of our decision
making and provides a framework as to how
all departments are working together to
achieve the New Myer strategy and improve
our business performance. In addition,
we have implemented a new governance
framework to streamline the decision-
making process, prioritise capital, and
monitor the returns from investments.
The ‘Myer Way of Working’ is a critical
component of our operating model, which
will build the culture, articulate the desired
behaviour and leadership styles, provide
a compelling communication strategy,
and implement the change capability.
These changes will enable us to have
a strong execution culture, with robust
systems, efficient processes, and the
organisational capability to drive Myer
forward.
COMPANY REVIEW
INTRODUCING THE FINDERS
Social media is a key channel for engagement with our primary customers. We have more than half a million Myer followers across a range of platforms including Facebook, Twitter, Instagram, YouTube, and Snapchat, which we use to talk about new brands, trends, events and product launches.
For the first time ever, we collaborated with leading Australian online style influencers, Amanda Shadforth (Oracle Fox), Carmen Hamilton (Chronicles of Her), Zanita Whittington (Zanita.com), and Jess Arifien and Trevor King (Oliver Grand) to bring our customers a new insight into trends for Spring 2015.
These online influencers were featured in our blog, ‘the find’ and across the Myer website and social media channels, as well as in marketing materials, digital display advertising and pop-up shops.
MYER ONE
Our MYER one loyalty
program of more than five
million members enables us
to engage directly with our
omni-channel customers.
We plan to reinvigorate
the offer available to our
premium members in
Platinum and Gold tiers.
14 MYER Annual Report 2015
COMPANY REVIEW
ATTRACTION AND ENGAGEMENT
Myer provides our team members with
a rewarding and supportive workplace.
This is reflected in the results of our
most recent employee survey, ‘My Say’,
which found that 84 percent of our
team members had a high level of
engagement with Myer. Myer team
members are offered a variety of
workplace benefits including shopping
discounts, flexible work arrangements,
and additional leave options. We also
provide capability development
opportunities through ‘on the job’,
online, and group instructor-led training.
DIVERSITY
In FY2015 we achieved our gender diversity
target, with a workforce comprised of
79 percent women. Our other measurable
objectives - proportions of men and
women on the Board and in the Executive
Management Group, and the Gender
Equality Indicators under the Workplace
Gender Equality Act (WGEA) - are set out
in our Corporate Governance Statement
which is available at myer.com.au/investor.
WORKPLACE SAFETY
The importance of safety is embedded
in our culture. We are committed to
reducing hazards, raising team member
awareness, and co-ordinating active
safety committees at each site. During
FY2015, we successfully maintained our
self-insurance licence arrangements.
The Myer Lost Time Injury Frequency
Rate (LTIFR) was 7.7 in FY2015.
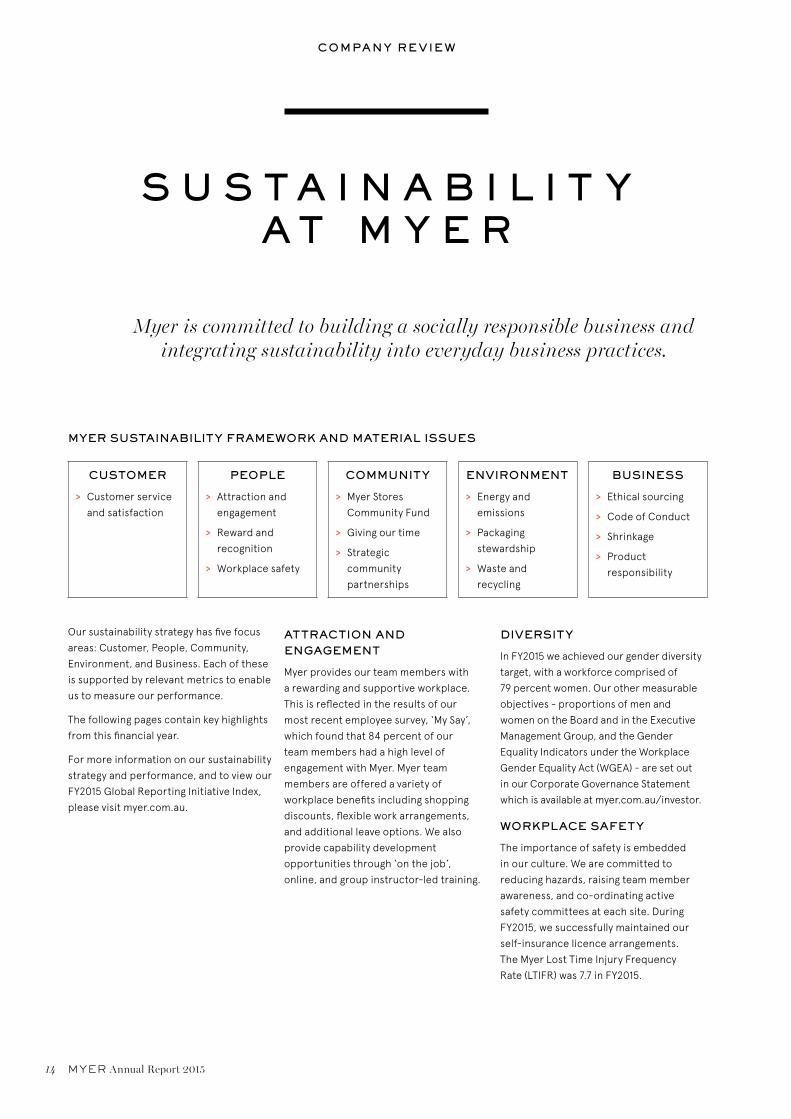
S U S TA I N A B I L I T Y AT M Y E R
Myer is committed to building a socially responsible business and integrating sustainability into everyday business practices.
Our sustainability strategy has five focus
areas: Customer, People, Community,
Environment, and Business. Each of these
is supported by relevant metrics to enable
us to measure our performance.
The following pages contain key highlights
from this financial year.
For more information on our sustainability
strategy and performance, and to view our
FY2015 Global Reporting Initiative Index,
please visit myer.com.au.
CUSTOMER
> Customer service
and satisfaction
PEOPLE
> Attraction and
engagement
> Reward and
recognition
> Workplace safety
COMMUNITY
> Myer Stores
Community Fund
> Giving our time
> Strategic
community
partnerships
ENVIRONMENT
> Energy and
emissions
> Packaging
stewardship
> Waste and
recycling
BUSINESS
> Ethical sourcing
> Code of Conduct
> Shrinkage
> Product
responsibility
MYER SUSTAINABILITY FRAMEWORK AND MATERIAL ISSUES
MYER Annual Report 2015 15
COMPANY REVIEW
ENERGY AND EMISSIONS
Energy, packaging and waste are our
key environmental impact areas, and in
FY2015 significant positive progress has
been made in reducing these impacts.
Through continued investment and focus
on energy efficiency, we have further
reduced our energy intensity by 2 percent
compared to FY2014. This has reduced by
a total of 8 percent since FY2013.
Our total energy use for the year
decreased by 2 percent to 707,151 GJ,
resulting in a 3 percent reduction in
direct and indirect greenhouse gas
emissions, to a total of 168,809 tonnes.
WASTE AND RECYCLING
Our commitment to reducing waste
and increasing recycling of packaging
enabled us to receive co-funding from
the Australian Packaging Covenant and
Sustainability Victoria for a recycling
optimisation project in FY2015. This year
we recycled 58 percent of our waste
stream, and we expect to see continued
reductions in the next year as the benefits
of the project are realised.
PRODUCT RESPONSIBILITY
We take pride in the quality of our
merchandise. We have extensive quality
and compliance processes in place to
ensure that our merchandise is safe, and
compliant with labelling and safety
requirements.
We also continue to develop our product
responsibility programs. Myer supports
the government-led ‘SmarterChoice’
program in NSW and VIC, which provides
customers with energy efficiency
information about electronic products.
To encourage the recycling of clothing,
we have partnered with Salvos Stores
to deliver the Myer and Salvos Fashion
Rescue program. This program rewards
customers who donate clothing
to Salvos Stores with a $10 Myer voucher.
In addition to preventing clothing from
going to landfill, the program benefits
Salvos Stores by increasing the quality
and quantity of donations, which assists
in raising funds for the work of The
Salvation Army in the community.
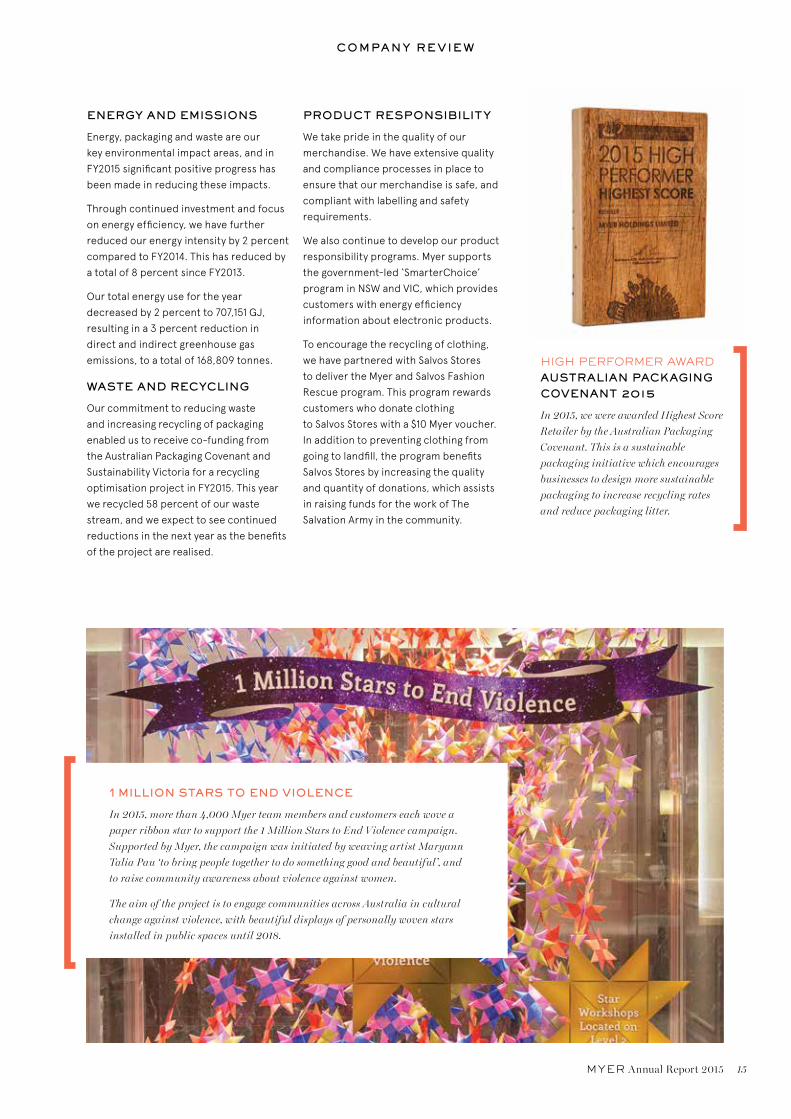
HIGH PERFORMER AWARD AUSTRALIAN PACKAGING COVENANT 2015
In 2015, we were awarded Highest Score
Retailer by the Australian Packaging
Covenant. This is a sustainable
packaging initiative which encourages
businesses to design more sustainable
packaging to increase recycling rates
and reduce packaging litter.
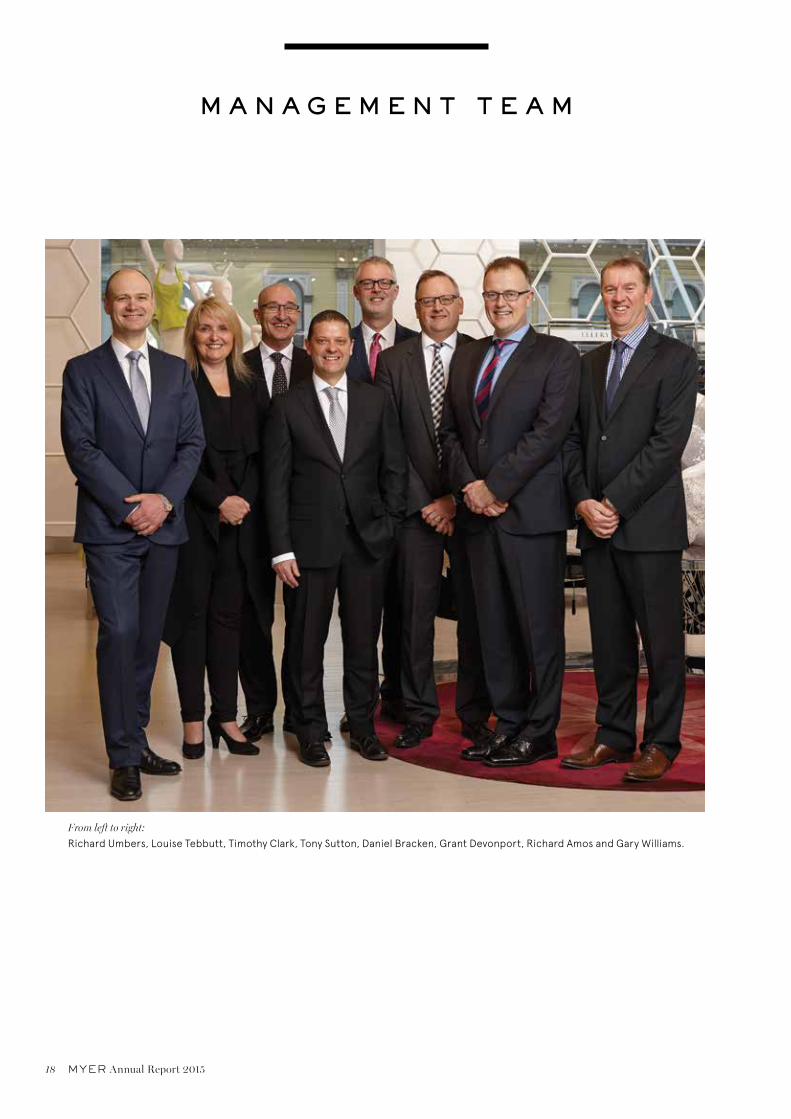
1 MILLION STARS TO END VIOLENCE
In 2015, more than 4,000 Myer team members and customers each wove a
paper ribbon star to support the 1 Million Stars to End Violence campaign.
Supported by Myer, the campaign was initiated by weaving artist Maryann
Talia Pau ‘to bring people together to do something good and beautiful’, and
to raise community awareness about violence against women.
The aim of the project is to engage communities across Australia in cultural
change against violence, with beautiful displays of personally woven stars
installed in public spaces until 2018.

16 MYER Annual Report 2015
COMPANY REVIEW
ETHICAL SOURCING
Myer is committed to sourcing merchandise
that is produced in safe and fair working
conditions, where the human rights of
workers are respected. This commitment
is supported by our Ethical Sourcing
Policy and a framework which measures
supplier adherence, identifies breaches,
and continuously improves the ethical
performance of our supply chain. All
new suppliers must adhere to our
Ethical Sourcing Policy.
The majority of our MEB merchandise
is sourced from China through our
dedicated global sourcing group, Myer
Sourcing Asia Limited, with offices located
in Hong Kong and Shanghai. Our external
logistics provider, Cargo Services, operates
four hubs in Asia to deliver merchandise
to Myer’s distribution centres in Australia.
In FY2015, we significantly increased
the number of ethical sourcing audits
undertaken, to a total of 313, including
303 audits of MEB supplier factories,
and a review of 10 national brand suppliers.
These audits identified one zero tolerance
issue and 14 high rated issues. These
non-conformances have subsequently
been addressed by the relevant suppliers.
Myer continues to work with our suppliers
to improve their ethical sourcing
procedures and ensure compliance
with our Ethical Sourcing Policy.
Our ethical sourcing framework includes:
> monitoring the factory locations
of all new MEB suppliers;
> rating suppliers against a supplier
risk profile;
> determining which suppliers are
to be audited under the Ethical
Sourcing Policy and audit cycle;
> assessing the risk level of any
issues identified during audits; and
> implementing remedial action plans
or withdrawal of supply for non-
compliant suppliers, depending
on the severity of the breach.
OUR MYER VALUES
In October 2014, we launched our new Company values which were updated to reflect our focus on bringing the love of shopping to life. Our values guide our behaviour, underpin our culture, and provide a framework for how we work at Myer.
Everyone at Myer has a role to play, from the people who source and buy our products to the people who sell them and everyone in between. The values we share help bind us together, as these are the things that matter the most to our business and our people.
Our values are:
1. Be passionate
2. Delight your customer
3. Challenge yourself
4. Be courageous
5. Do what’s right
6. Give something back
7. We are family

MYER Annual Report 2015 17
COMPANY REVIEW
GIVING BACK
Myer has a proud history of community
investment and, through our Myer Stores
Community Fund, we encourage our team
members, suppliers and customers to give
back to the local community.
Each year we also host the Myer Stores
Community Fund Precious Metal Ball, to
raise vital funds for our national and local
store charity partners. This year, we were
able to support Red Kite with $250,000
from funds raised at the Ball. This year,
we also launched our first ‘Round Up’
campaigns for Mother’s Day, allowing our
customers to round up to the nearest
dollar for the Myer Stores Community Fund.
For the coming three years, Myer will
align our community investment with
‘empowering and supporting women,
strengthening families’, to work with key
charities to help reduce family violence.
We have announced new partnerships
with White Ribbon Australia and Global
Sisters to support their valuable work in
improving outcomes for vulnerable women
and children. We will also continue to
support The Salvation Army, with a focus
on its provision of crisis care to women
and children affected by family violence.
SUSTAINABILITY PERFORMANCE AND TARGETS
Focus area Key measureFY2013
PerformanceFY2014
PerformanceFY2015
PerformanceFY2016 Target
Customer Net Promoter Score
N/A
Exceeded
target ●
Achieved target Improvement*
Team Employee engagement (%) N/A 83 ● 84 ≥83
Diversity (% female) 78.8 79.6 ● 79.0 >75
Workplace safety (LTIFR) 8.6 7.0 ● 7.7 ≤6.5
Community Direct charity contribution (% EBIT) 0.4 0.6 ● 0.8 ≥0.5
Environment Greenhouse gas emissions reduction (%) 4.8 5.0 ● 2.7 ≥3.0
Energy intensity (kJ/M2/opening hour) 191.2 179.8 ● 175.5 ≤171.5
Recycling rate (%) 55 57 ● 58 ≥60
Business New suppliers agreed to
Ethical Sourcing Policy (%) 100 100 ● 100 100
Code of Conduct training
(% of staff every two years) 75.5 82 ● 86.5 ≥75
Shrinkage reduction Reduction on
previous year
Reduction on
previous year● Minor
increaseMaintain
*On comparable stores basis ● Improved/met target ● Did not reach target
TOTAL CONTRIBUTION TO CHARITY PARTNERS
$2.6mMYER DIRECT TIME, CASH AND GOODS
$1.0mFACILITATED FUNDRAISING
FROM CUSTOMERS, SUPPLIERS AND TEAM MEMBERS
$1.6m
18 MYER Annual Report 2015
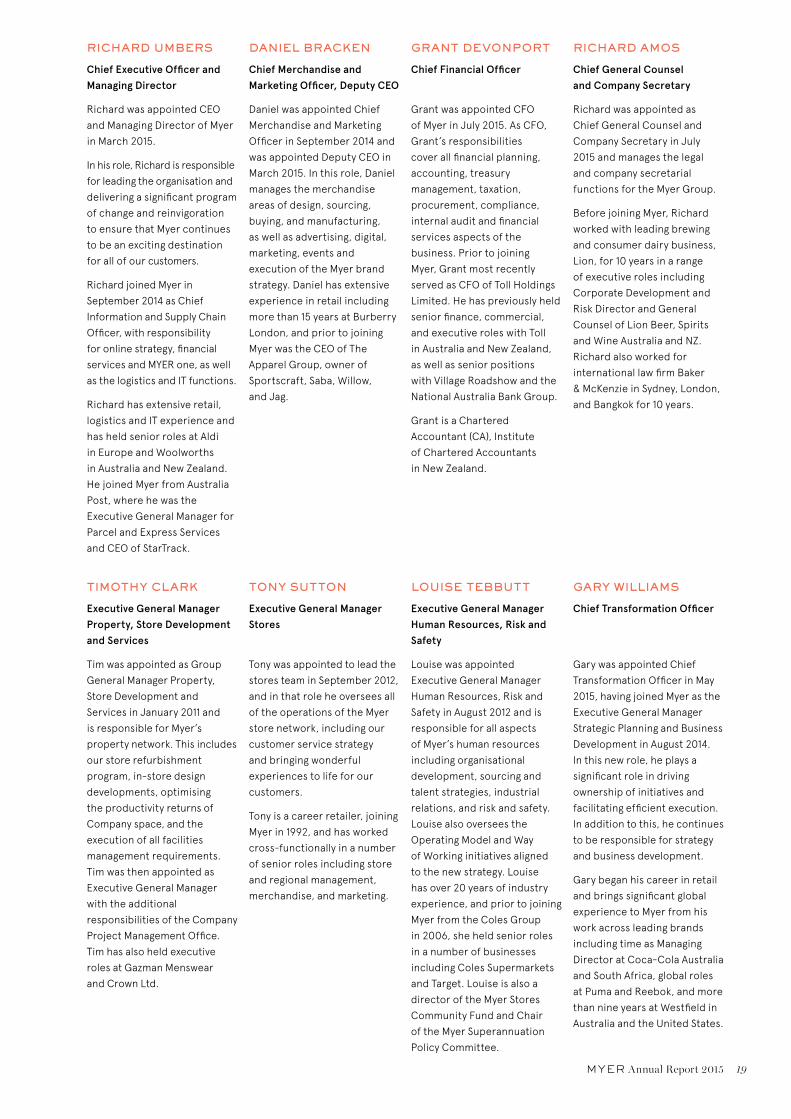
M A N A G E M E N T T E A M
From left to right:
Richard Umbers, Louise Tebbutt, Timothy Clark, Tony Sutton, Daniel Bracken, Grant Devonport, Richard Amos and Gary Williams.
MYER Annual Report 2015 19
RICHARD UMBERS
Chief Executive Officer and Managing Director
Richard was appointed CEO
and Managing Director of Myer
in March 2015.
In his role, Richard is responsible
for leading the organisation and
delivering a significant program
of change and reinvigoration
to ensure that Myer continues
to be an exciting destination
for all of our customers.
Richard joined Myer in
September 2014 as Chief
Information and Supply Chain
Officer, with responsibility
for online strategy, financial
services and MYER one, as well
as the logistics and IT functions.
Richard has extensive retail,
logistics and IT experience and
has held senior roles at Aldi
in Europe and Woolworths
in Australia and New Zealand.
He joined Myer from Australia
Post, where he was the
Executive General Manager for
Parcel and Express Services
and CEO of StarTrack.
DANIEL BRACKEN
Chief Merchandise and Marketing Officer, Deputy CEO
Daniel was appointed Chief
Merchandise and Marketing
Officer in September 2014 and
was appointed Deputy CEO in
March 2015. In this role, Daniel
manages the merchandise
areas of design, sourcing,
buying, and manufacturing,
as well as advertising, digital,
marketing, events and
execution of the Myer brand
strategy. Daniel has extensive
experience in retail including
more than 15 years at Burberry
London, and prior to joining
Myer was the CEO of The
Apparel Group, owner of
Sportscraft, Saba, Willow,
and Jag.
GRANT DEVONPORT
Chief Financial Officer
Grant was appointed CFO
of Myer in July 2015. As CFO,
Grant’s responsibilities
cover all financial planning,
accounting, treasury
management, taxation,
procurement, compliance,
internal audit and financial
services aspects of the
business. Prior to joining
Myer, Grant most recently
served as CFO of Toll Holdings
Limited. He has previously held
senior finance, commercial,
and executive roles with Toll
in Australia and New Zealand,
as well as senior positions
with Village Roadshow and the
National Australia Bank Group.
Grant is a Chartered
Accountant (CA), Institute
of Chartered Accountants
in New Zealand.
RICHARD AMOS
Chief General Counsel and Company Secretary
Richard was appointed as
Chief General Counsel and
Company Secretary in July
2015 and manages the legal
and company secretarial
functions for the Myer Group.
Before joining Myer, Richard
worked with leading brewing
and consumer dairy business,
Lion, for 10 years in a range
of executive roles including
Corporate Development and
Risk Director and General
Counsel of Lion Beer, Spirits
and Wine Australia and NZ.
Richard also worked for
international law firm Baker
& McKenzie in Sydney, London,
and Bangkok for 10 years.
TIMOTHY CLARK
Executive General Manager Property, Store Development and Services
Tim was appointed as Group
General Manager Property,
Store Development and
Services in January 2011 and
is responsible for Myer’s
property network. This includes
our store refurbishment
program, in-store design
developments, optimising
the productivity returns of
Company space, and the
execution of all facilities
management requirements.
Tim was then appointed as
Executive General Manager
with the additional
responsibilities of the Company
Project Management Office.
Tim has also held executive
roles at Gazman Menswear
and Crown Ltd.
TONY SUTTON
Executive General Manager Stores
Tony was appointed to lead the
stores team in September 2012,
and in that role he oversees all
of the operations of the Myer
store network, including our
customer service strategy
and bringing wonderful
experiences to life for our
customers.
Tony is a career retailer, joining
Myer in 1992, and has worked
cross-functionally in a number
of senior roles including store
and regional management,
merchandise, and marketing.
LOUISE TEBBUTT
Executive General Manager Human Resources, Risk and Safety
Louise was appointed
Executive General Manager
Human Resources, Risk and
Safety in August 2012 and is
responsible for all aspects
of Myer’s human resources
including organisational
development, sourcing and
talent strategies, industrial
relations, and risk and safety.
Louise also oversees the
Operating Model and Way
of Working initiatives aligned
to the new strategy. Louise
has over 20 years of industry
experience, and prior to joining
Myer from the Coles Group
in 2006, she held senior roles
in a number of businesses
including Coles Supermarkets
and Target. Louise is also a
director of the Myer Stores
Community Fund and Chair
of the Myer Superannuation
Policy Committee.
GARY WILLIAMS
Chief Transformation Officer
Gary was appointed Chief
Transformation Officer in May
2015, having joined Myer as the
Executive General Manager
Strategic Planning and Business
Development in August 2014.
In this new role, he plays a
significant role in driving
ownership of initiatives and
facilitating efficient execution.
In addition to this, he continues
to be responsible for strategy
and business development.
Gary began his career in retail
and brings significant global
experience to Myer from his
work across leading brands
including time as Managing
Director at Coca-Cola Australia
and South Africa, global roles
at Puma and Reebok, and more
than nine years at Westfield in
Australia and the United States.

20 MYER Annual Report 2015
B O A R D O F D I R E C T O R S
From left to right:
Chris Froggatt, Ian Cornell, Richard Umbers, Bob Thorn, Paul McClintock AO, Rupert Myer AO and Anne Brennan.
Bernie Brookes
On 2 March 2015, Bernie Brookes stepped down from the role of CEO and Managing
Director. From 2006 Bernie guided Myer through a turnaround under private ownership
to a public listing, and through a period of sustained weakness in consumer sentiment,
competitive disruption and structural change. The Board thanks Bernie for his
dedication and hard work over the past eight years.
MYER Annual Report 2015 21
D I R E C T O R S ’ R E P O R T
Your directors present their report on the consolidated entity consisting of Myer Holdings Limited ABN 14 119 085 602
(the Company or Myer) and the entities it controlled (collectively referred to as the Group) at the end of, or during the
financial period ended 25 July 2015.
1. DIRECTORS
The following persons were directors of the Company during the financial period and/or up to the date of this Directors’ Report:
Director Position Date appointed
Paul McClintock AO Chairman from 10 October 2012
Independent non-executive director
8 August 2012
Rupert Myer AO Deputy Chairman from 8 August 2012
Independent non-executive director
12 July 2006
Bernie Brookes Chief Executive Officer (CEO) and Managing Director 12 July 2006
Richard Umbers CEO and Managing Director 2 March 2015
Anne Brennan Independent non-executive director 16 September 2009
Ian Cornell Independent non-executive director 6 February 2014
Chris Froggatt Independent non-executive director 9 December 2010
Bob Thorn Independent non-executive director 6 February 2014
Bernie Brookes retired as CEO and Managing Director and
Richard Umbers was appointed as CEO and Managing Director
on 2 March 2015.
All other directors served as directors of the Company for the
whole financial period and until the date of this Directors’ Report.
Rupert Myer AO has notified the Board that he does not intend
to seek re-election for a fourth term as a director of the Board
at the Company’s 2015 Annual General Meeting.
Details of the qualifications, experience, and special
responsibilities of each current director are as follows:
PAUL McCLINTOCK AOChairman
> Independent non-executive director
> Member of the Board since 8 August 2012
> Appointed Chairman 10 October 2012
> Chairman – Nomination Committee
Paul has held significant chairman and advisory positions across
a broad range of industries, as well as government. He is highly
regarded for his wide and varied experience, including his role
as the Secretary to Cabinet and Head of the Cabinet Policy Unit.
Paul’s former positions include chairman of Thales Australia,
Medibank Private Limited, the COAG Reform Council, the Expert
Panel of the Low Emissions Technology Demonstration Fund,
Intoll Management Limited, Symbion Health, Affinity Health,
Ashton Mining, Plutonic Resources, and the Woolcock Institute
of Medical Research. He was also a director of the Australian
Strategic Policy Institute and Perpetual Limited, a Commissioner
of the Health Insurance Commission, and a member of the
Australia-Malaysia Institute Executive Committee. Paul graduated
in Arts and Law from the University of Sydney and is an honorary
fellow of the Faculty of Medicine of the University of Sydney and
a Life Governor of the Woolcock Institute of Medical Research.
Paul resides in New South Wales and is 66 years of age.
Other current directorships
Paul is chairman of NSW Ports, I-MED Australia and O’Connell
Street Associates. He is also a director of St Vincent’s Health
Australia and The George Institute for Global Health.
RUPERT MYER AODeputy Chairman
> Independent non-executive director
> Member of the Board since 12 July 2006
> Appointed Deputy Chairman 8 August 2012
> Member – Audit, Finance and Risk Committee
> Member – Human Resources and Remuneration Committee
> Member – Nomination Committee
Rupert serves as a non-executive chairman and director
of a number of public, private, and government entities.
His background includes roles in the retail and property sector,
healthcare, e-commerce, investment, family office, wealth
management, philanthropy services, and the community sector.
Rupert serves as a Board member of The Myer Foundation,
Creative Partnerships Australia, and Jawun – Indigenous
DIRECTORS’ REPORTContinued
22 MYER Annual Report 2015
Corporate Partnerships. Rupert is a member of the Business and
Economics Advisory Board of the University of Melbourne and
The Felton Bequests’ Committee and was formerly the chairman
of the Myer Family Group. Rupert holds a Bachelor of Commerce
(Honours) degree from the University of Melbourne, and a Master
of Arts from the University of Cambridge, and is a Fellow of the
Australian Institute of Company Directors. In June 2015, he was
appointed an Officer of the Order of Australia for distinguished
service to the visual and performing arts, through governance
roles with leading cultural institutions, as a supporter and
benefactor, to the promotion of philanthropy, and to the
community. Rupert resides in Victoria and is 57 years of age.
Other current directorships
Rupert is chair of the Australia Council for the Arts and Nuco
Pty Ltd. He is a director of AMCIL Limited, Healthscope Limited,
and eCargo Holdings Limited (Hong Kong).
RICHARD UMBERSChief Executive Officer and Managing Director
> Member of the Board since 2 March 2015
Richard Umbers was appointed CEO and Managing Director of
Myer in March 2015. In his role, Richard is responsible for leading
the organisation, and delivering a significant program of change
and reinvigoration to ensure that Myer continues to be an
exciting destination for all of our customers. Richard joined
Myer in September 2014 as Chief Information and Supply Chain
Officer, with responsibility for online strategy, financial services
and MYER one, as well as the logistics and IT functions. Prior to
joining Myer, Richard was Executive General Manager for Parcel
and Express Services at Australia Post, and also held the position
of CEO for StarTrack. Richard also had responsibility for the
enterprise-wide eCommerce program, a major change initiative
designed to position Australia Post to take advantage of the
boom in online shopping.
Richard has previously held a range of senior and general
management positions in fast moving consumer goods (FMCG)
retailing with roles at Woolworths in Australia and New Zealand
and Aldi in Europe.
Richard has a Master of Science degree in Finance from the
University of Leicester (UK), and a Bachelor of Science with
honours in Geology and Geography from The University of Exeter
(UK). He is also a graduate of the Australian Institute of Company
Directors. Richard lives in Victoria and is 48 years of age.
ANNE BRENNANIndependent non-executive director
> Member of the Board since 16 September 2009
> Chairman – Audit, Finance and Risk Committee
> Member – Human Resources and Remuneration Committee
> Member – Nomination Committee
Anne brings strong financial credentials and business acumen
to Myer, including her experience from senior management roles
in both large corporate organisations and professional services
firms. Anne has more than 20 years’ experience in audit,
corporate finance, and transaction services including executive
roles as the Chief Financial Officer (CFO) at CSR, and Finance
Director at the Coates Group. Prior to her executive roles, Anne
was a partner in three professional services firms: KPMG, Arthur
Andersen, and Ernst & Young. During her time at Ernst & Young,
Anne was a member of the national executive team and a board
member. Anne was formerly a director of Cuscal Limited.
Anne holds a Bachelor of Commerce (Honours) degree from
University College Galway. She is a Fellow of the Institute of
Chartered Accountants in Australia and a Fellow of the Australian
Institute of Company Directors. Anne resides in New South Wales
and is 54 years of age.
Other current directorships
Anne is a Director of Argo Investments Limited, Charter Hall
Group, Nufarm Limited, and Rabobank Limited (Australia and
New Zealand).
IAN CORNELLIndependent non-executive director
> Member of the Board since 6 February 2014
> Member – Human Resources and Remuneration Committee
Ian has extensive experience in the retail industry across a
number of senior retail roles including 11 years at Westfield.
During his time at Westfield, Ian was Head of Human Resources
for seven years and also responsible for retailing relationships
in Australia and New Zealand. He also spent three years as the
Head of Management and Marketing for Westfield’s shopping
centres in Australia and New Zealand and has extensive
experience in large scale retail operations and responding to
changing consumer trends. Prior to joining Westfield, Ian was
chairman and CEO of supermarket chain, Franklins, and earlier
spent 22 years at Woolworths, including his role as Chief General
Manager Supermarkets. Ian has previously been a director of
Goodman Fielder Limited. Ian is also a Fellow of the Institute
of Management, a Fellow of the Human Resources Institute, a
member of the Institute of Company Directors, and a graduate

DIRECTORS’ REPORTContinued
MYER Annual Report 2015 23
of the Advanced Management Programme at Harvard.
Ian resides in New South Wales and is 61 years of age.
Other current directorships
Ian is a director of Baby Bunting Pty Ltd and Inglis Bloodstock, as
well as of the PKD Foundation of Australia, a charitable foundation
raising funds for medical research into kidney disease.
CHRIS FROGGATTIndependent non-executive director
> Member of the Board since 9 December 2010
> Chairman – Human Resources and Remuneration Committee
> Member – Nomination Committee
Chris has a broad industry background, including experience in
consumer branded products, retailing, and hospitality across
numerous industries such as beverages, food, and confectionery.
She has more than 20 years’ executive experience as a human
resources specialist in leading international companies including
Brambles Industries, Whitbread Group, Mars, Diageo, and
Unilever NV. Chris has served on the boards of Britvic, Sports
Direct International, and Goodman Fielder Limited; as well as
being a director of the Australian Chamber Orchestra and the
Australian Chamber Orchestra Instrument Fund, and as an
independent trustee director of Berkeley Square Pension
Trustee Company Limited. Chris holds a Bachelor of Arts
(Honours) in English Literature from the University of Leeds
(United Kingdom). Chris is a Fellow of the Chartered Institute
of Personnel Development, and a member of the Australian
Institute of Company Directors. Chris resides in New South
Wales and is 56 years of age.
BOB THORNIndependent non-executive director
> Member of the Board since 6 February 2014
> Member – Audit, Finance and Risk Committee
Bob brings considerable senior retail management experience
to Myer from his nine years as Managing Director of Super Retail
Group. During his time at the company, Bob drove Australia and
New Zealand expansions and led the creation of the Boating
Camping Fishing (BCF) business, the market leader in camping
and leisure. Prior to Bob’s 13 years with Super Retail Group, he
was previously General Manager at Lincraft, and held senior roles
at other major retailers including nine years with David Jones.
Bob has also been the chairman of Cutting Edge, and a director
at WOW Sight and Sound, Babies Galore, and Unity Water. Bob is
a member of the Australian Institute of Company Directors and
is currently an adviser to the Board of BMag Pty Ltd. Bob resides
in Queensland and is 60 years of age.
Other current directorships
Bob is a director of Rotah Group Pty Ltd and is independent
chairman of PWR Holdings Pty Ltd.
2. DIRECTORSHIPS OF OTHER LISTED COMPANIES
The following table shows, for each person who served as a director during the financial period and/or up to the date of this
Directors’ Report, all directorships of companies that were listed on the ASX, other than the Company, since 31 July 2012, and
the period during which each directorship has been held.
Director Listed entity Period directorship held
Paul McClintock AO Perpetual Limited April 2004 – November 2012
Rupert Myer AO AMCIL Limited
Healthscope Limited
January 2000 – present
June 2014 – present
Bernie Brookes – –
Richard Umbers – –
Anne Brennan Charter Hall Group October 2010 – present
Nufarm Limited February 2011 – present
Argo Investments Limited September 2011 – present
Echo Entertainment Group Limited March 2012 – October 2014
Ian Cornell Goodman Fielder Limited February 2014 – March 2015
Chris Froggatt Goodman Fielder Limited August 2009 – March 2015
Bob Thorn – –

DIRECTORS’ REPORTContinued
24 MYER Annual Report 2015
3. MEETINGS OF DIRECTORS AND BOARD COMMITTEES
The number of meetings of the Board and of each Board Committee held during the period ended 25 July 2015 are set out below.
All directors are invited to attend Board Committee meetings. Most Board Committee meetings are attended by all directors;
however, only attendance by directors who are members of the relevant Board Committee is shown in the table below.
DirectorMeetings
of directorsAudit, Finance
and Risk Committee
Human Resources and Remuneration
CommitteeNomination Committee
A B A B A B A B
Paul McClintock AO 13 13 – – – – 3 3
Rupert Myer AO 13 13 4 4 5 5 3 3
Bernie Brookes* 6 6 – – – – – –
Richard Umbers* 6 6 – – – – – –
Anne Brennan 13 13 4 4 5 5 3 3
Ian Cornell 13 13 – – 5 5 – –
Chris Froggatt 13 13 – – 5 5 3 3
Bob Thorn 13 13 4 4 – - – –
Notes:
A = Number of meetings attended.
B = Number of meetings held during the time the director held office or was a member of the Committee during the year.
* = Bernie Brookes retired, and Richard Umbers was appointed, on 2 March 2015.
4. DIRECTORS’ RELEVANT INTERESTS IN SHARES
The following table sets out the relevant interests that each director has in the Company’s ordinary shares or other securities
as at the date of this Directors’ Report.
No director has a relevant interest in a related body corporate of the Company.
Director Ordinary shares Options Performance rights
Paul McClintock AO 181,000 Nil Nil
Rupert Myer AO 733,999 Nil Nil
Richard Umbers Nil Nil 568,749
Anne Brennan 53,658 Nil Nil
Ian Cornell 10,000 Nil Nil
Chris Froggatt 10,040 Nil Nil
Bob Thorn 161,000 Nil Nil
Bernie Brookes retired as a director of the Company on, and with effect from, 2 March 2015. At the date of his retirement, Mr Brookes
had a relevant interest of 10,042,399 ordinary shares in the Company. At the Company’s 2014 Annual General Meeting, the relevant
terms of Mr Brookes’ employment contract were approved by shareholders, including that he would retain 83,249 performance rights.
5. COMPANY SECRETARY AND OTHER OFFICERS
Marion Rodwell was the Company Secretary of the Company from 2008 until she departed on 6 July 2015. Ms Rodwell was
also Chief General Counsel.
Richard Amos was appointed as Company Secretary of the Company on 6 July 2015, as well as being appointed as Chief General
Counsel of the Group.
Before joining Myer, Richard Amos worked with leading brewing and consumer dairy business, Lion, for 10 years in a range of
executive roles including Corporate Development and Risk Director and General Counsel of Lion Beer, Spirits and Wine Australia
and NZ. Richard also worked for international law firm Baker and McKenzie in Sydney, London, and Bangkok for 10 years.
Details of other officers of the Company are referred to in section 8 below.

DIRECTORS’ REPORTContinued
MYER Annual Report 2015 25
6. PRINCIPAL ACTIVITIES
During the financial period, the principal activity of the Group
was the operation of the Myer department store business.
7. OPERATING AND FINANCIAL REVIEW
FY2015 FINANCIAL RESULTS
Summary
> Total sales up 1.7% to $3,195.6 million, up 1.1% on a comparable
store sales basis
> 2H total sales up 1.9%, up 1.3% on a comparable store sales
basis
> Operating gross profit (OGP) margin down 53 bps to 40.4%
> Cost of doing business (CODB) up 3.3% to $1,067.2 million
> Earnings before interest, tax, depreciation, and amortisation
(EBITDA) (excluding Individually Significant Items*) down 11.6%
to $223.2 million
> Earnings before interest and tax (EBIT) (excluding Individually
Significant Items*) down 16.7% to $133.5 million
> Net profit after tax (NPAT) (excluding Individually Significant
Items*) $77.5 million, down 21.3%
> Basic earnings per share (EPS) (excluding Individually
Significant Items*) 13.2 cents (FY2014: 16.8 cents). Statutory
basic EPS 5.1 cents (FY2014: 16.8 cents)
> Individually Significant Items* (post tax) totalling $47.7 million
> NPAT including Individually Significant Items $29.8 million,
down 69.7%
> There was no final dividend determined by the Board for
FY2015
* Certain items have been separately identified and presented as
Individually Significant based on the nature and/or impact these
items have on the Group’s financial performance for the period.
The above overview of the FY2015 financial results is discussed
in detail below.
Chief Executive Officer commentary
“Myer’s FY2015 result supports the case for our comprehensive
change agenda. The decisions we have taken to deliver New Myer
will lead to changes to both our store network and operations,
resulting in a more productive and efficient footprint,” said
Mr Umbers.
“During the past six months, management has been actively
addressing the underlying issues in the business, implementing
a series of initiatives that are consistent with the New Myer
strategic direction including the introduction of a large number
of wanted brands and initiatives to improve flexibility of our
in-store labour to better align our workforce with customer
demand.
The New Myer strategy sets out a defined pathway to return the
business to sustainable profit growth. We will achieve this by
delivering a sharper and more focused retail offer that attracts
more of the customers who represent the highest value to our
business. This will be supported by investment in our stores and
our omni-channel offer to make them more engaging and
productive,” said Mr Umbers.
The New Myer strategy is discussed in further detail in section 9
below.

DIRECTORS’ REPORTContinued
26 MYER Annual Report 2015
INCOME STATEMENT FOR THE 52 WEEKS TO 25 JULY 2015
FY2015 $m
FY2014 $m
Change vs. LY
Total sales value 3,195.6 3,143.0 +1.7%
Operating gross profit 1,290.4 1,285.9 +0.3%
Operating gross profit margin 40.4% 40.9% (53bps)
Cost of doing business (1,067.2) (1,033.3) +3.3%
Cost of doing business/sales 33.4% 32.9% +53bps
EBITDA* 223.2 252.6 (11.6%)
EBITDA margin* 7.0% 8.0% (106bps)
EBIT* 133.5 160.3 (16.7%)
EBIT margin* 4.2% 5.1% (92bps)
Net profit after tax (NPAT)* 77.5 98.5 (21.3%)
*Excluding Individually Significant Items which represent Non-IFRS financial measures. See page 27.
Sales
In FY2015, the Group’s total sales increased by 1.7% to $3,195.6 million, driven by new stores and refurbishments, as well as strong
growth in the online business. Myer has now delivered comparable store sales growth in 12 of the last 13 quarters.
There was continued strong growth in the Cosmetics business, as well as in Childrenswear and Entertainment, offset by a poor
performance in Womenswear. During Christmas 2014, the rollout of Giftorium, representing dedicated gifting space in all stores,
was well received by customers.
Customers also responded positively to the four major store refurbishments that were completed ahead of Christmas 2014.
In addition, new stores at Mt Gravatt (QLD) and Joondalup (WA) generated further growth.
During the period, two stores were closed in NSW, at Hurstville in January 2015 and Top Ryde in July 2015.
A large number of new brands were rolled out during the period, many of which performed particularly well, including Menswear
brands M.J. Bale, Aquila, Herringbone, Scotch & Soda, and Cosmetics brand Jo Malone.
Margins and CODB
The operating gross profit margin declined by 53 basis points to 40.4%. This was mainly due to the depreciation in the Australian
dollar and increased inventory provisions. Excluding the impact of these factors, operating gross profit margin increased by
32 basis points.
CODB increased by 3.3% to $1,067.2 million, driven by costs associated with refurbishments in four of our top 25 stores as well
as two new stores, and costs associated with growth in the omni-channel business.

DIRECTORS’ REPORTContinued
MYER Annual Report 2015 27
Net finance costs and net debt
In June 2015, the syndicated debt facility, now totalling
$600 million, was successfully refinanced, with more favourable
pricing, increased tenor, and improved terms. In addition to a
lower interest margin, the Fixed Charges Cover Ratio covenant
was lowered from 1.65 times to 1.50 times across the facility.
Net debt increased by $40 million to $388 million, reflecting
lower profitability and higher working capital. This was largely
offset by lower capital expenditure, dividend, and tax payments.
Net interest costs increased by 3.7% to $22.7 million as a result
of the higher net debt position. Offsetting this were the savings
achieved as a result of the refinancing in the second half.
Cash flow and balance sheet
The reduction in operating cash flow by $96 million to $167 million
reflected both the reduction in earnings for the year as well
as a negative working capital movement of $56 million. The
negative working capital movement was due to an increase in
trading inventory of $22 million compared to FY2014 and lower
trade creditors of $19 million.
As part of our strategy to exit a large number of brands, the
Spring Clean Clearance event launched in the first quarter of
FY2016 has successfully reduced inventory by approximately
$10 million, with net debt also improving by approximately
$20 million since balance date. Capital expenditure during
FY2015 decreased by $6 million to $62 million compared
to FY2014, pending the outcomes of the strategic review.
Individually Significant Items
The FY2015 result includes a number of Individually Significant
Items totalling $61.7 million (pre tax), which have been separately
identified and presented as Individually Significant based on
the nature and/or impact that these items have on the Group’s
financial performance for the period and have primarily arisen
as a result of the strategic review.
These significant items represent the commencement of the
‘re-setting’ of the business as we implement the New Myer
strategy, and comprise:
> $24.5 million in costs associated with two store closures
(Top Ryde and Hurstville), provisions for inventory clearance
(the exit of brands identified as part of the New Myer strategy),
and asset impairments related to brands no longer planned to
be ranged in store, as well as the impairment of lease rights;
> $14.8 million provision for surplus lease space in support
office and impairment of associated fitout assets;
> $11.8 million in restructuring costs and provisions associated
with headcount reduction in support office and supply chain,
and a voluntary redundancy program in stores;
> $10.6 million in strategic review and implementation costs.
DIRECTORS’ REPORTContinued
28 MYER Annual Report 2015
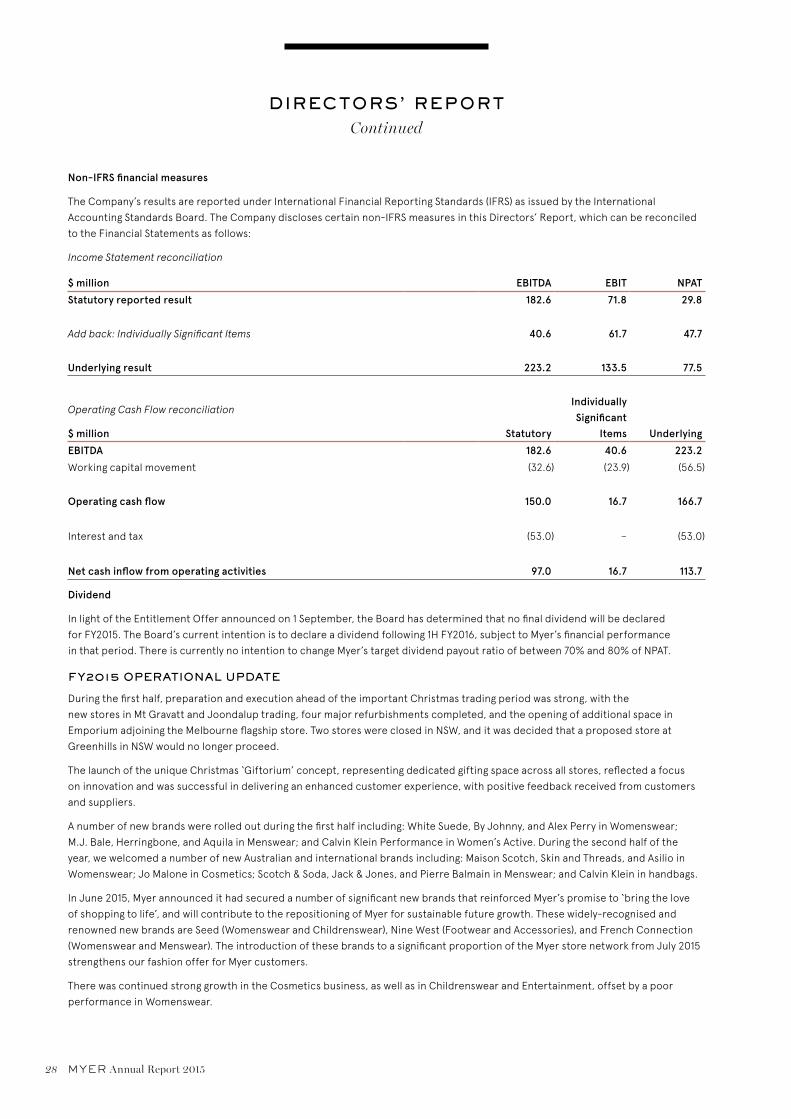
Non-IFRS financial measures
The Company’s results are reported under International Financial Reporting Standards (IFRS) as issued by the International
Accounting Standards Board. The Company discloses certain non-IFRS measures in this Directors’ Report, which can be reconciled
to the Financial Statements as follows:
Income Statement reconciliation
$ million EBITDA EBIT NPAT
Statutory reported result 182.6 71.8 29.8
Add back: Individually Significant Items 40.6 61.7 47.7
Underlying result 223.2 133.5 77.5
Operating Cash Flow reconciliation
$ million Statutory
Individually Significant
Items Underlying
EBITDA 182.6 40.6 223.2
Working capital movement (32.6) (23.9) (56.5)
Operating cash flow 150.0 16.7 166.7
Interest and tax (53.0) – (53.0)
Net cash inflow from operating activities 97.0 16.7 113.7
Dividend
In light of the Entitlement Offer announced on 1 September, the Board has determined that no final dividend will be declared
for FY2015. The Board’s current intention is to declare a dividend following 1H FY2016, subject to Myer’s financial performance
in that period. There is currently no intention to change Myer’s target dividend payout ratio of between 70% and 80% of NPAT.
FY2015 OPERATIONAL UPDATE
During the first half, preparation and execution ahead of the important Christmas trading period was strong, with the
new stores in Mt Gravatt and Joondalup trading, four major refurbishments completed, and the opening of additional space in
Emporium adjoining the Melbourne flagship store. Two stores were closed in NSW, and it was decided that a proposed store at
Greenhills in NSW would no longer proceed.
The launch of the unique Christmas ‘Giftorium’ concept, representing dedicated gifting space across all stores, reflected a focus
on innovation and was successful in delivering an enhanced customer experience, with positive feedback received from customers
and suppliers.
A number of new brands were rolled out during the first half including: White Suede, By Johnny, and Alex Perry in Womenswear;
M.J. Bale, Herringbone, and Aquila in Menswear; and Calvin Klein Performance in Women’s Active. During the second half of the
year, we welcomed a number of new Australian and international brands including: Maison Scotch, Skin and Threads, and Asilio in
Womenswear; Jo Malone in Cosmetics; Scotch & Soda, Jack & Jones, and Pierre Balmain in Menswear; and Calvin Klein in handbags.
In June 2015, Myer announced it had secured a number of significant new brands that reinforced Myer’s promise to ‘bring the love
of shopping to life’, and will contribute to the repositioning of Myer for sustainable future growth. These widely-recognised and
renowned new brands are Seed (Womenswear and Childrenswear), Nine West (Footwear and Accessories), and French Connection
(Womenswear and Menswear). The introduction of these brands to a significant proportion of the Myer store network from July 2015
strengthens our fashion offer for Myer customers.
There was continued strong growth in the Cosmetics business, as well as in Childrenswear and Entertainment, offset by a poor
performance in Womenswear.

DIRECTORS’ REPORTContinued
MYER Annual Report 2015 29
8. SIGNIFICANT CHANGES IN THE STATE OF AFFAIRS IN FY2015
In addition to those matters described in section 7 above, in
March 2015, the Company announced that Bernie Brookes was
stepping down from his position as CEO and Managing Director.
Richard Umbers, previously Chief Information and Supply Chain
Officer, was appointed CEO and Managing Director.
Richard was appointed to lead a significant program of change
and reinvigoration to ensure that the Group is well placed to
meet the expectations of its current and primary customers,
and importantly to be able to adapt to a rapidly-evolving retail
environment.
On the same day, it was announced that Daniel Bracken had
been appointed Deputy CEO in addition to his role as Chief
Merchandise and Marketing Officer.
Also in March 2015, it was announced that Mark Ashby,
Chief Financial Officer had resigned to take up an international
opportunity. In June 2015, Grant Devonport was appointed as
CFO. Grant joined the Company following a career of more than
30 years, including senior roles at listed entities in Australia, New
Zealand and the United Kingdom. He most recently served as
CFO of Toll Holdings Limited, a position he had held since 2011.
Other than the matters above and described in section 7,
there were no significant changes in the state of affairs of
the Group during the financial year, or up to the date of this
Directors’ Report.
9. BUSINESS STRATEGIES AND FUTURE DEVELOPMENTS
During 2015, the Company has undertaken a comprehensive
review of its strategy to address the evolving retail landscape
and evaluate the strategic direction best suited to the current
environment. The strategy sets the future direction of the
Company over a five-year delivery horizon.
During the period in which the review has been undertaken,
the Company has implemented a series of initiatives which
have been consistent with the new strategic direction.
These included:
> the streamlining of support office structures with a reduction
of support office roles;
> the recent closure of a third-party logistics dedicated online
pick and pack facility;
> the launch of a number of new brands including White Suede,
By Johnny and Alex Perry in Womenswear; M.J. Bale,
Herringbone and Aquila in Menswear; Calvin Klein
Performance in Women’s Active; Maison Scotch, Skin and
Threads, and Asilio in Womenswear; Jo Malone in Cosmetics;
Scotch & Soda, Jack & Jones, and Pierre Balmain in Menswear;
and Calvin Klein in handbags;
> initiatives to improve flexibility of our in-store labour to
better align our workforce with customer demand; and
> the launch of the digital Myer Hub at the Parramatta store.
The New Myer strategy sets out a five-year transformation
agenda that defines a clear pathway to restore profitable growth
by delivering an inspiring retail offer, with improved productivity.
This will put greater focus and investment into the Company’s
best stores which serve Myer’s most valuable customers, with
a revitalised merchandise offer and transformed shopping
experience to better meet customers’ needs in store and online.

DIRECTORS’ REPORTContinued
30 MYER Annual Report 2015
Our strategy is built on providing a sharper and more focused
offer to serve a more valuable customer, and improving
productivity. Myer stores will inspire and delight and become
more relevant to our customers’ daily lives. Our approach will be
informed by advanced data analytics of Myer’s customer base
and store catchments to build a profile of those customers
where there is the greatest opportunity to improve the customer
experience and deliver higher sales and profit.
The key elements of the strategic review include:
> Enhanced customer led offer including: wanted categories;
inspiring brands; and a relevant merchandise offer.
> Wonderful Experiences focused on: enhanced and
contemporary services; signature experiences; an improved
in-store presentation; and a strengthened MYER one program.
> Omni-channel shopping including: an integrated, seamless
experience; efficient Click & Collect; and, improved delivery
and fulfilment services.
> Productivity step change encompassing: the optimisation of
our store network; an emphasis on our Flagship and Premium
stores; the right sizing of our support office; and, a cost and
efficiency focus.
> Organisational capability underpinned by: the establishment
of a Transformation Office; prioritisation of activities and
allocation of resources; an execution focused culture; a robust
governance structure; and, strict investment return hurdles.
Further information on likely developments in the Group’s
operations and the expected results of those operations has
not been included in this Directors’ Report. The directors
believe that the disclosure of such information, including certain
business strategies, projects, and prospects would be likely to
result in unreasonable prejudice to the Group’s interests.
FY2016 OUTLOOK
FY2016 will represent a transitional year for Myer in which
significant investments are being made in our future growth with
the rewards from these investments to be realised in late FY2016
and thereafter. Following FY2016, Myer expects to return to
sustainable profit growth.
ENTITLEMENT OFFER
On Tuesday 1 September 2015, Myer announced the
launch of a fully underwritten 2 for 5 accelerated pro-rata
non-renounceable entitlement offer to raise approximately
$221 million, at an offer price of $0.94 (Entitlement Offer).
The proceeds of the Entitlement Offer will be used to reduce
core debt and provide balance sheet flexibility to implement the
New Myer strategy. Upon completion of the Entitlement Offer,
Myer will have a net debt/EBITDA of less than 1x based on a
pro forma 25 July 2015 balance sheet.
The Entitlement Offer comprises an institutional component and
a retail component. Institutional entitlements not taken up by
eligible institutional shareholders and entitlements of ineligible
institutional shareholders will be sold to institutional investors
in a bookbuild process managed by the underwriter. Retail
entitlements not taken up by eligible retail shareholders and
entitlements of ineligible retail shareholders will be placed by
the underwriter.
The institutional component of the Entitlement Offer is
scheduled to close on Wednesday 2 September 2015, and
the retail component of the offer will close on Thursday
17 September 2015.

DIRECTORS’ REPORTContinued
MYER Annual Report 2015 31
10. KEY RISKS AND UNCERTAINTIES
The Group’s strategies take into account the expected operating
and retail market conditions, together with general economic
conditions, which are inherently uncertain.
The Group has structured proactive risk management and
internal control systems in place to manage material risks.
The key risks and uncertainties that may have an effect on
the Group’s ability to execute its business strategies and the
Group’s future growth prospects and how the Group manages
these risks are set out below.
EXTERNAL ECONOMIC RISKS
Macro-economic factors such as the fluctuation of the Australian
dollar, poor consumer confidence, and weakness in the global
economy could adversely impact the Company’s ability to
achieve sales growth. Myer regularly analyses and uses economic
data to help mitigate the future impact on sales, and has also
implemented conservative hedging, capital management, and
marketing and merchandise initiatives to combat the cyclical
nature of the business.
COMPETITIVE LANDSCAPE RISKS
The Australian retail industry in which Myer operates is highly
competitive. The Company’s competitive position may be
negatively impacted by new entrants to the market, existing
competitors, and increased online competition, which could
impact sales. To mitigate these risks, Myer is implementing our
new strategy which is guided by our detailed customer insights
and a focus on providing a customer-led offer, wonderful
experiences, and omni-channel shopping.
TECHNOLOGY RISKS
With Myer’s increasing reliance on technology in a rapidly
changing digital environment, there is a risk that the malfunction
of IT systems, outdated IT infrastructure, or a cyber-security
violation could have a detrimental effect on our sales, business
efficiencies, and brand reputation. To offset these risks, Myer
continues to invest and develop our in-house technology
capabilities and engage with reputable third-party IT service
providers to ensure that we have reliable IT systems and issue
management processes in place.
BRAND REPUTATION RISKS
Myer’s strong brand reputation is crucial for building positive
relationships with customers, which in turn generates sales
and goodwill towards the Company. A significant event or issue
could attract strong criticism of the Myer brand which could
impact sales or our share price. Myer has a range of policies
and initiatives to mitigate brand risk, including a Code of
Conduct, a Whistleblower Policy, an Ethical Sourcing Policy,
marketing campaigns, and ongoing environmental and
sustainability initiatives.
PEOPLE MANAGEMENT RISKS
Safety is a high priority at Myer to ensure the wellbeing of all of
our team members, customers, and suppliers. Failure to manage
health and safety risks could have a negative effect on Myer’s
reputation and performance. We conduct regular detailed risk
assessments at each store, distribution centre, and at our support
office, as well as regular team member education sessions.
Myer needs to attract and retain talented senior managers
to ensure that our leadership team has the right skills and
experience to deliver our strategy. Failure to do so may adversely
affect Myer’s reputation, performance, and growth. During the
year, we made a number of new appointments to our Executive
Management Group, and we provide our team members with
access to training and development to further develop their skills.
STRATEGIC AND BUSINESS PLAN RISKS
A failure to deliver our strategic plan could impact sales, share
price, and our reputation. Our new strategic plan is guided by
our detailed external and internal customer insights and will be
implemented through three phases – mobilising the business
for transformation; resetting the business; and delivering the
New Myer.
ENTITLEMENT OFFER
The underwriting agreement relating to the Entitlement Offer
sets out various events, the occurrence of which will entitle
the underwriter to terminate the underwriting agreement.
Accordingly, there is a risk that the underwriter may terminate
its obligations under the underwriting agreement if any such
events occur. In those circumstances, if the Entitlement Offer
is undersubscribed, Myer may be unable to reduce its core debt
to the extent planned, which would reduce the balance sheet
flexibility sought to implement the New Myer strategy.
DIRECTORS’ REPORTContinued
32 MYER Annual Report 2015
REGULATORY RISKS
From time to time, Myer may be subject to regulatory investigations and disputes, including by the Australian Taxation Office (ATO),
Federal or State regulatory bodies including the Australian Competition and Consumer Commission (ACCC), the Australian Securities
and Investments Commission (ASIC), and the Australian Securities Exchange (ASX). The outcome of any such investigations or
disputes may have a material adverse effect on Myer’s operating and financial performance.
Specifically, Myer has received from ASIC enquiries relating to Myer’s continuous disclosure practices during the period of
1 November 2014 to 18 March 2015. ASIC’s enquiries are ongoing, and Myer is fully co-operating with ASIC. Myer is confident that
it has at all times complied, and continues to comply, with its continuous disclosure obligations.
LITIGATION
On 25 March 2015, legal proceedings were served against Myer by a shareholder seeking to bring a group action for itself and
on behalf of a defined (but unnamed) group of shareholders. The writ was filed by Portfolio Law Pty Ltd on behalf of Melbourne City
Investments Pty Ltd (MCI). MCI alleges loss and damage said to have resulted from a statement made in the context of Myer’s full year
FY2014 results. Myer strongly denies any and all allegations made against it and intends to vigorously defend itself against the claims.
The Company does not presently know the size of the claims, nor can it, based on the information currently available, quantify any
potential financial exposure arising from these litigation proceedings. No provision has been recognised at 25 July 2015 in respect
of this matter.
11. MATTERS SUBSEQUENT TO THE END OF THE FINANCIAL YEAR
No matter or circumstance has arisen since the end of the financial year which has not been dealt with in this Directors’ Report
or the Financial Report, and which has significantly affected, or may significantly affect:
(a) the Group’s operations in future financial years;
(b) the results of those operations in future financial years; or
(c) the Group’s state of affairs in future financial years.
12. DIVIDENDS
The following dividends have been paid to shareholders during the financial year:
2014 final dividend $’000
Final dividend for the period ended 26 July 2014 of 5.5 cents per fully paid ordinary share, fully franked,
paid on 13 November 2014
32,213
2015 interim dividend $’000
Interim dividend for the period ended 25 July 2015 of 7.0 cents per fully paid ordinary share, fully franked,
paid on 7 May 2015
40,998
There was no final dividend determined by the Board for the full year FY2015. The Board’s current intention is to declare a dividend
following 1H 2016, subject to Myer’s financial performance in that period.
Further information regarding dividends is set out in the Financial Statements (at note F3).
DIRECTORS’ REPORTContinued
MYER Annual Report 2015 33
13. OPTIONS AND PERFORMANCE RIGHTS GRANTED OVER UNISSUED SHARES
The Myer Equity Incentive Plan (MEIP) operates for selected senior executives and has been in operation since December 2006.
Under the MEIP, the Company has granted eligible executives options and performance rights over unissued ordinary shares of
the Company, subject to certain vesting conditions. Shares delivered to senior executives as a result of the vesting and exercise
of options and performance rights can be either issued as new shares or purchased on market.
Each option or performance right entitles the holder to acquire one ordinary fully paid share in the Company (subject to the
adjustments outlined below).
OPTIONS
No options were granted under the MEIP in the financial year ended 25 July 2015 and no options have been granted since the end
of the year.
The last remaining grant of options under the MEIP over unissued shares of the Company expired during the financial year ended
25 July 2015 as follows:
Date options granted Expiry date Exercise price of options(1) Number of options(2)
30 June 2009 24 October 2014 $2.34 2,186,650
Closing balance Nil
There are no further options which remain on issue as at the date of this Directors’ Report.
(1) To calculate the issue price of shares when options are exercised, the Company uses the seven-day volume weighted average price of shares on the date of issue.
(2) Each option entitled the holder to receive one fully paid ordinary share in the Company, subject to the satisfaction of the relevant performance conditions and the payment of the exercise price.
A holder of an option may only participate in new issues of securities of the Company if the option has been exercised, participation
is permitted by its terms, and the shares in respect of the options have been allocated and transferred to the option right holder
before the record date for determining entitlements to the new issue.
The number of shares that option holders are entitled to receive on the exercise of an option, or the exercise price of those options,
may be adjusted in a manner consistent with the ASX Listing Rules if there is:
> a pro-rata issue of shares to the Company’s shareholders (such as a bonus issue); or
> any reconstruction of the capital of the Company (such as a subdivision or return of capital).
If the manner of adjustment is not prescribed by the ASX Listing Rules, the Board can determine the adjustment to ensure that
option holders are not advantaged or disadvantaged as a result of any such capital action.
Further information about options granted under the MEIP (including the details of the options granted to the Key Management
Personnel (KMP) of the Company) is included in the Remuneration Report.
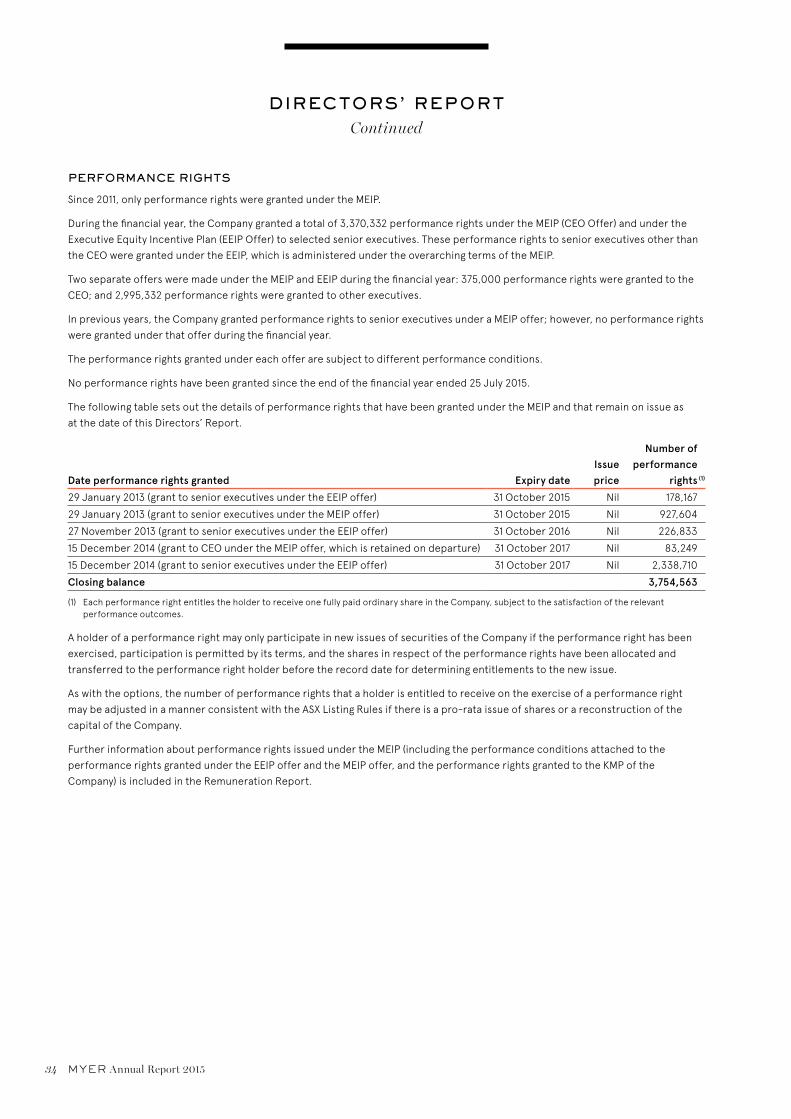
DIRECTORS’ REPORTContinued
34 MYER Annual Report 2015
PERFORMANCE RIGHTS
Since 2011, only performance rights were granted under the MEIP.
During the financial year, the Company granted a total of 3,370,332 performance rights under the MEIP (CEO Offer) and under the
Executive Equity Incentive Plan (EEIP Offer) to selected senior executives. These performance rights to senior executives other than
the CEO were granted under the EEIP, which is administered under the overarching terms of the MEIP.
Two separate offers were made under the MEIP and EEIP during the financial year: 375,000 performance rights were granted to the
CEO; and 2,995,332 performance rights were granted to other executives.
In previous years, the Company granted performance rights to senior executives under a MEIP offer; however, no performance rights
were granted under that offer during the financial year.
The performance rights granted under each offer are subject to different performance conditions.
No performance rights have been granted since the end of the financial year ended 25 July 2015.
The following table sets out the details of performance rights that have been granted under the MEIP and that remain on issue as
at the date of this Directors’ Report.
Date performance rights granted Expiry dateIssue price
Number of performance
rights (1)
29 January 2013 (grant to senior executives under the EEIP offer) 31 October 2015 Nil 178,167
29 January 2013 (grant to senior executives under the MEIP offer) 31 October 2015 Nil 927,604
27 November 2013 (grant to senior executives under the EEIP offer) 31 October 2016 Nil 226,833
15 December 2014 (grant to CEO under the MEIP offer, which is retained on departure) 31 October 2017 Nil 83,249
15 December 2014 (grant to senior executives under the EEIP offer) 31 October 2017 Nil 2,338,710
Closing balance 3,754,563
(1) Each performance right entitles the holder to receive one fully paid ordinary share in the Company, subject to the satisfaction of the relevant performance outcomes.
A holder of a performance right may only participate in new issues of securities of the Company if the performance right has been
exercised, participation is permitted by its terms, and the shares in respect of the performance rights have been allocated and
transferred to the performance right holder before the record date for determining entitlements to the new issue.
As with the options, the number of performance rights that a holder is entitled to receive on the exercise of a performance right
may be adjusted in a manner consistent with the ASX Listing Rules if there is a pro-rata issue of shares or a reconstruction of the
capital of the Company.
Further information about performance rights issued under the MEIP (including the performance conditions attached to the
performance rights granted under the EEIP offer and the MEIP offer, and the performance rights granted to the KMP of the
Company) is included in the Remuneration Report.
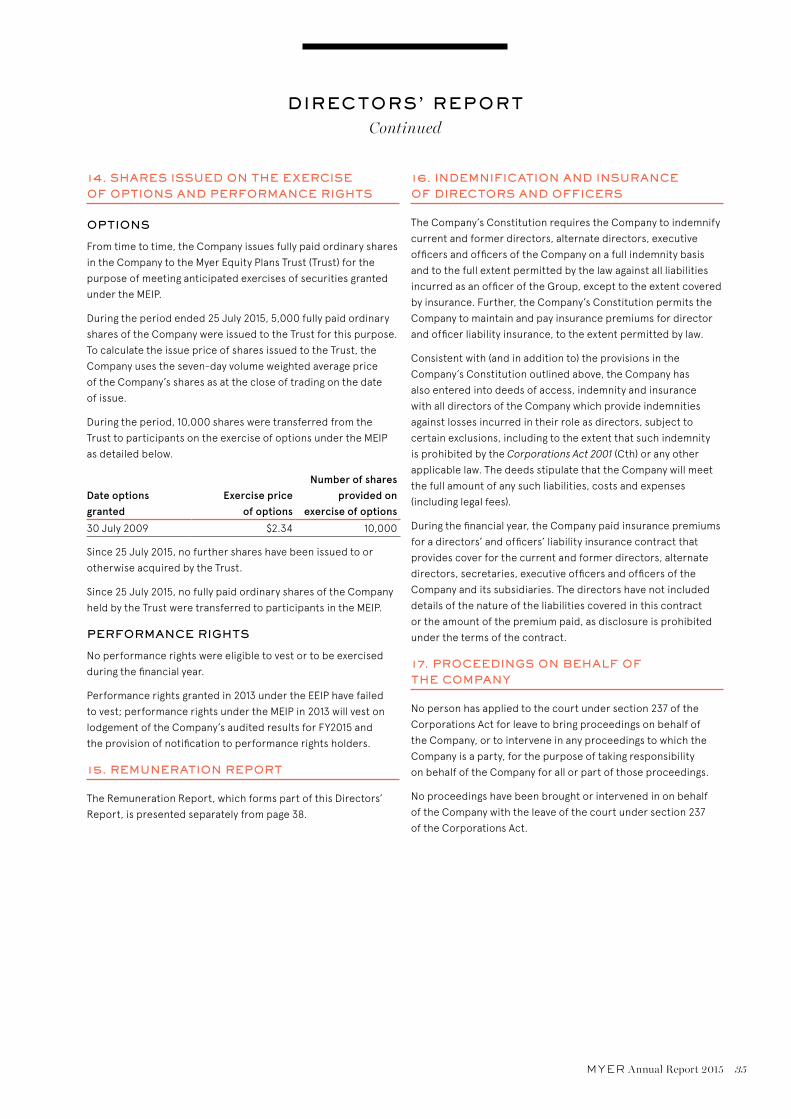
DIRECTORS’ REPORTContinued
MYER Annual Report 2015 35
14. SHARES ISSUED ON THE EXERCISE OF OPTIONS AND PERFORMANCE RIGHTS
OPTIONS
From time to time, the Company issues fully paid ordinary shares
in the Company to the Myer Equity Plans Trust (Trust) for the
purpose of meeting anticipated exercises of securities granted
under the MEIP.
During the period ended 25 July 2015, 5,000 fully paid ordinary
shares of the Company were issued to the Trust for this purpose.
To calculate the issue price of shares issued to the Trust, the
Company uses the seven-day volume weighted average price
of the Company’s shares as at the close of trading on the date
of issue.
During the period, 10,000 shares were transferred from the
Trust to participants on the exercise of options under the MEIP
as detailed below.
Date options granted
Exercise price of options
Number of shares provided on
exercise of options
30 July 2009 $2.34 10,000
Since 25 July 2015, no further shares have been issued to or
otherwise acquired by the Trust.
Since 25 July 2015, no fully paid ordinary shares of the Company
held by the Trust were transferred to participants in the MEIP.
PERFORMANCE RIGHTS
No performance rights were eligible to vest or to be exercised
during the financial year.
Performance rights granted in 2013 under the EEIP have failed
to vest; performance rights under the MEIP in 2013 will vest on
lodgement of the Company’s audited results for FY2015 and
the provision of notification to performance rights holders.
15. REMUNERATION REPORT
The Remuneration Report, which forms part of this Directors’
Report, is presented separately from page 38.
16. INDEMNIFICATION AND INSURANCE OF DIRECTORS AND OFFICERS
The Company’s Constitution requires the Company to indemnify
current and former directors, alternate directors, executive
officers and officers of the Company on a full indemnity basis
and to the full extent permitted by the law against all liabilities
incurred as an officer of the Group, except to the extent covered
by insurance. Further, the Company’s Constitution permits the
Company to maintain and pay insurance premiums for director
and officer liability insurance, to the extent permitted by law.
Consistent with (and in addition to) the provisions in the
Company’s Constitution outlined above, the Company has
also entered into deeds of access, indemnity and insurance
with all directors of the Company which provide indemnities
against losses incurred in their role as directors, subject to
certain exclusions, including to the extent that such indemnity
is prohibited by the Corporations Act 2001 (Cth) or any other
applicable law. The deeds stipulate that the Company will meet
the full amount of any such liabilities, costs and expenses
(including legal fees).
During the financial year, the Company paid insurance premiums
for a directors’ and officers’ liability insurance contract that
provides cover for the current and former directors, alternate
directors, secretaries, executive officers and officers of the
Company and its subsidiaries. The directors have not included
details of the nature of the liabilities covered in this contract
or the amount of the premium paid, as disclosure is prohibited
under the terms of the contract.
17. PROCEEDINGS ON BEHALF OF THE COMPANY
No person has applied to the court under section 237 of the
Corporations Act for leave to bring proceedings on behalf of
the Company, or to intervene in any proceedings to which the
Company is a party, for the purpose of taking responsibility
on behalf of the Company for all or part of those proceedings.
No proceedings have been brought or intervened in on behalf
of the Company with the leave of the court under section 237
of the Corporations Act.

DIRECTORS’ REPORTContinued
36 MYER Annual Report 2015
18. ENVIRONMENTAL REGULATION
The Group is subject to and has complied with the reporting
and compliance requirements of the National Greenhouse and
Energy Reporting Act 2007 (Cth) (NGER Act). No significant
environmental incidents have been reported internally, and no
breaches have been notified to the Group by any government
agency. The NGER Act requires the Group to report its annual
greenhouse gas emissions and energy use. The Group has
implemented systems and processes for the collection and
calculation of the data required. In compliance with the NGER
Act, the Group submitted its sixth report to the Greenhouse and
Energy Data Officer in October 2014 and is due to submit its
seventh report by 31 October 2015.
19. NON-AUDIT SERVICES
The Company may decide to employ its external auditor on
assignments additional to its statutory audit duties where the
auditor’s expertise and experience with the Company and/or
the Group are important.
Details of the amounts paid or payable to the auditor (PwC) for
audit and non-audit services provided during the year are set
out in the Financial Statements (at note H5).
The Board has considered the position and, in accordance with
advice received from the Audit, Finance and Risk Committee,
is satisfied that the provision of the non-audit services is
compatible with the general standard of independence for
auditors imposed by the Corporations Act. The directors
are satisfied that the provision of the non-audit services by
the auditor did not compromise the auditor independence
requirements of the Corporations Act for the following reasons:
> all non-audit services have been reviewed by the Audit,
Finance and Risk Committee to ensure that they do not impact
on the impartiality and objectivity of the auditor; and
> none of the services undermine the general principles relating
to auditor independence as set out in APES 110 Code of Ethics
for Professional Accountants.
20. AUDITOR’S INDEPENDENCE DECLARATION
A copy of the auditor’s independence declaration as required
under section 307C of the Corporations Act is attached to this
Directors’ Report.
21. ROUNDING OF AMOUNTS
The Group has taken advantage of ASIC Class Order 98/100
relating to the ‘rounding off’ of amounts in the Directors’ Report.
Amounts in the Directors’ Report have been rounded off to the
nearest thousand dollars, or in certain cases, to the nearest dollar.
The Directors’ Report is made in accordance with a resolution
of directors.
Paul McClintock, AO Chairman
Melbourne, 1 September 2015.
CORPORATE GOVERNANCE STATEMENT
To view our Corporate Governance Statement please visit
myer.com.au/investor.

MYER Annual Report 2015 37
A U D I T O R ’ S I N D E P E N D E N C E D E C L A R AT I O N
PricewaterhouseCoopers, ABN 52 780 433 757 Freshwater Place, 2 Southbank Boulevard, SOUTHBANK VIC 3006, GPO Box 1331, MELBOURNE VIC 3001 T: 61 3 8603 1000, F: 61 3 8603 1999, www.pwc.com.au
Liability limited by a scheme approved under Professional Standards Legislation. 19
Auditor’s Independence Declaration
As lead auditor for the audit of Myer Holdings Limited for the period ended 25 July 2015, I declare that to the best of my knowledge and belief, there have been:
a) no contraventions of the auditor independence requirements of the Corporations Act 2001 in relation to the audit; and
b) no contraventions of any applicable code of professional conduct in relation to the audit.
This declaration is in respect of Myer Holdings Limited and the entities it controlled during the period.
Andrew Mill MelbournePartnerPricewaterhouseCoopers
1 September 2015

38 MYER Annual Report 2015
R E M U N E R AT I O N R E P O R T
This report sets out the remuneration strategy, framework and
other conditions of employment for Myer Holdings Limited Key
Management Personnel (KMP). The report also details the role
and accountability of the Board and the relevant Committees
established to support the Board on these matters. The
information provided within this report has been audited
as required by section 308(3C) of the Corporations Act and
forms part of the Directors’ Report.
CONTENTS
This report provides details on the following matters:
> FY2015 remuneration overview
> Human Resources and Remuneration Committee and
remuneration governance
> Use of remuneration consultants
> Policies for remuneration of directors and other KMP
> Directors and executives disclosed in this report
> CEO and Managing Director arrangements
> Equity arrangements with directors and other KMP
> Remuneration and Company performance
> Remuneration outcomes for directors and other KMP
FY2015 REMUNERATION OVERVIEW
Myer continues to review and adapt its remuneration approach
to ensure it meets its needs as well as comply with legislation,
and aims to be at the forefront of corporate governance in
contemporary remuneration practices. Myer also takes into
account any feedback from its stakeholders, particularly
shareholders. This report outlines remuneration for FY2015.
The Board is currently in the process of finalising a broad review
of the Remuneration Framework to ensure that it will effectively
support the business through the planned transformation
program. Any changes to the Remuneration Framework will apply
for FY2016. Details will be disclosed in the FY2016 Remuneration
Report and, if required, as part of the AGM Notice of Meeting for
approval of grants of equity to the CEO.
Myer’s executive remuneration is structured as:
> Total Fixed Compensation (TFC): including base salary and
benefits such as superannuation; and
> variable remuneration: including at risk short term incentive
(STI) and long term incentive (LTI) components.
While TFC provides a fixed level of remuneration, the STI
and LTI components reward executives only when certain
pre-determined performance conditions and/or service
conditions are met or exceeded.
On 2 March 2015, Myer announced the appointment of new
CEO and Managing Director Richard Umbers. Mr Umbers joined
Myer on 1 September 2014 as Chief Information and Supply
Chain Officer and was promoted in March 2015, replacing
CEO and Managing Director Bernie Brookes. Mr Brookes
remained available for advice and handover arrangements
to Mr Umbers and the Board until 1 May 2015. The Board is
confident that Richard’s leadership credentials and focus
on excellence position him well to lead the transformation
and further development of Myer. Details of Mr Umbers’
remuneration and Mr Brookes’ termination benefits are
outlined on pages 50 and 51.
The Board was also pleased to announce the appointment of
a number of senior executives in June 2014 and subsequently
in June 2015 and August 2015. The Company secured several
outstanding executives to join the Company’s senior leadership
team, with an excellent combination of new thought leadership
and world-class retailing skills obtained both domestically and
internationally.
These appointments complement the knowledge and experience
of the existing leadership team. In securing these senior executives,
remuneration arrangements were structured to encourage the
executives to move from their previous roles where they forfeited
significant incentive arrangements upon leaving. Selected sign-on
grants have been made in the form of both cash and equity to
align the executives’ interests to shareholder interests. These
can be clawed back and forfeited if the executive ceases
employment.
The senior executives’ total remuneration is generally targeted
at the median of comparable positions in comparable companies
and is achieved when individual and Company performance
targets are met. Myer’s individual and Company performance
targets are considered by the Board to be consistently demanding.
Achieving these challenging targets requires high calibre
executives to be attracted to and retained within the Company.
The Board continues to take a considered approach to executive
remuneration but is mindful that shareholder interests will not
be served if the Company becomes unable to retain or attract
skilled executives. This team is key to accelerating the Company’s
strategy, supporting transformation, and strengthening
succession within its senior leadership group to build a
sustainable and successful business for the future.

REMUNERATION REPORTContinued
MYER Annual Report 2015 39
Key developments/changes for the year ended 25 July 2015 were:
Organisational changes Key development/remuneration outcomes
Governance and non-executive director remuneration
Non-executive directors’ fees were not increased in
FY2015. Last year, an increase in director base fees for
FY2015 was noted in the Annual Report. Subsequently
non-executive directors declined the increase.
An increase in the Human Resources and Remuneration
Chairman’s fee from $15,000 to $22,500 was approved
to more closely align fees to market median.
CEO and Managing Director remuneration
Mr Richard Umbers was appointed as CEO
and Managing Director on 2 March 2015.
Mr Umbers’ fixed remuneration on appointment as
CEO is $1.2 million per annum. This is subject to annual
performance-based review.
> Short term incentive (STI) As Mr Umbers was appointed CEO part way through
FY2015, having spent time in the role of Chief
Information and Supply Chain Officer, his target STI
opportunity for FY2015 has been pro-rated based
on the time he has acted in each role, resulting in
an STI opportunity of 52.9% of TFC. For the first full
year as CEO (i.e. FY2016), Mr Umbers’ target STI will
be equivalent to 80% of his TFC for achievement
against targeted performance. Subject to shareholder
approval, 40% of any annual STI awarded to Mr Umbers
will be delivered through a grant of restricted shares.
Mr Umbers cannot access, deal or otherwise trade in
the restricted shares for a restricted period from the
date of grant, which effectively defers this portion of
Mr Umbers’ STI reward.
> Long term incentive (LTI) Subject to shareholder approval, Mr Umbers’
LTI award will be delivered through a grant of
performance rights to the value of 90%
of his TFC. Mr Umbers will be eligible to participate
in future grants of performance rights under the
Executive Equity Incentive Plan (EEIP), with any
such grants being subject to shareholder approval.
In March 2015, Mr Bernie Brookes and the Board
mutually agreed that he would step down from
the role of CEO and Managing Director.
Details of termination benefits for Mr Brookes are
outlined on page 50.
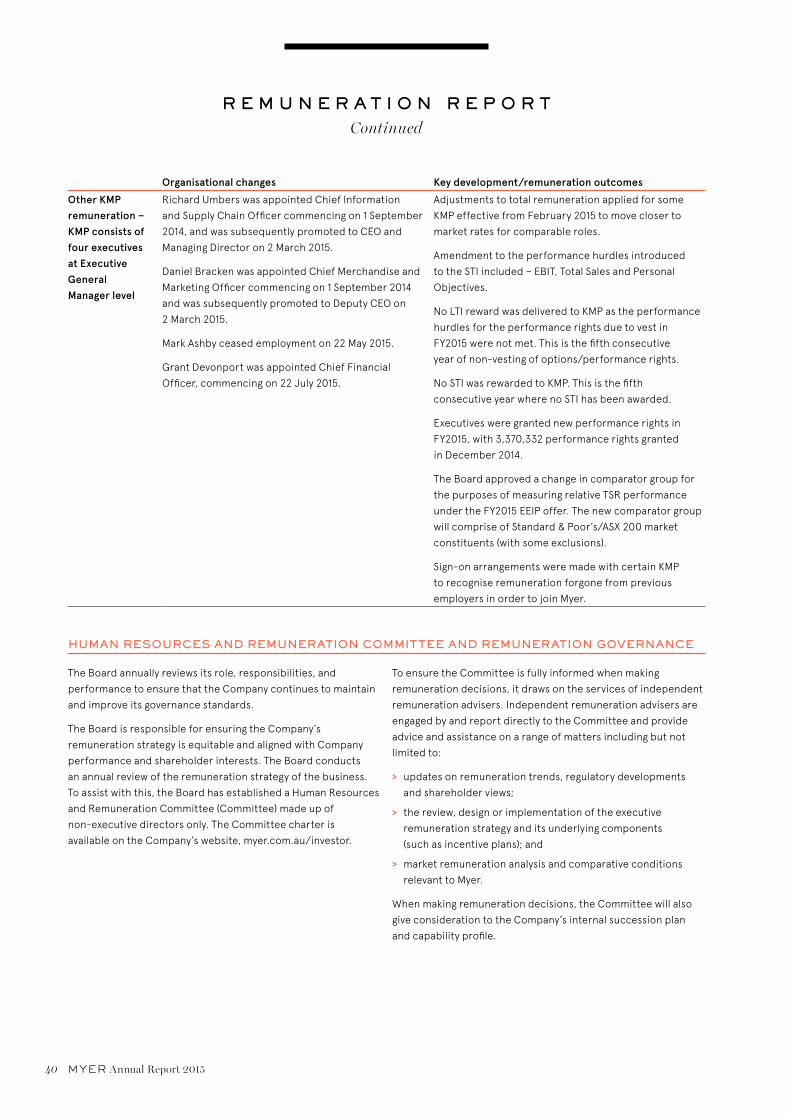
40 MYER Annual Report 2015
R E M U N E R AT I O N R E P O R TContinued
Organisational changes Key development/remuneration outcomes
Other KMP remuneration – KMP consists of four executives at Executive General Manager level
Richard Umbers was appointed Chief Information
and Supply Chain Officer commencing on 1 September
2014, and was subsequently promoted to CEO and
Managing Director on 2 March 2015.
Daniel Bracken was appointed Chief Merchandise and
Marketing Officer commencing on 1 September 2014
and was subsequently promoted to Deputy CEO on
2 March 2015.
Mark Ashby ceased employment on 22 May 2015.
Grant Devonport was appointed Chief Financial
Officer, commencing on 22 July 2015.
Adjustments to total remuneration applied for some
KMP effective from February 2015 to move closer to
market rates for comparable roles.
Amendment to the performance hurdles introduced
to the STI included – EBIT, Total Sales and Personal
Objectives.
No LTI reward was delivered to KMP as the performance
hurdles for the performance rights due to vest in
FY2015 were not met. This is the fifth consecutive
year of non-vesting of options/performance rights.
No STI was rewarded to KMP. This is the fifth
consecutive year where no STI has been awarded.
Executives were granted new performance rights in
FY2015, with 3,370,332 performance rights granted
in December 2014.
The Board approved a change in comparator group for
the purposes of measuring relative TSR performance
under the FY2015 EEIP offer. The new comparator group
will comprise of Standard & Poor’s/ASX 200 market
constituents (with some exclusions).
Sign-on arrangements were made with certain KMP
to recognise remuneration forgone from previous
employers in order to join Myer.
HUMAN RESOURCES AND REMUNERATION COMMITTEE AND REMUNERATION GOVERNANCE
The Board annually reviews its role, responsibilities, and
performance to ensure that the Company continues to maintain
and improve its governance standards.
The Board is responsible for ensuring the Company’s
remuneration strategy is equitable and aligned with Company
performance and shareholder interests. The Board conducts
an annual review of the remuneration strategy of the business.
To assist with this, the Board has established a Human Resources
and Remuneration Committee (Committee) made up of
non-executive directors only. The Committee charter is
available on the Company’s website, myer.com.au/investor.
To ensure the Committee is fully informed when making
remuneration decisions, it draws on the services of independent
remuneration advisers. Independent remuneration advisers are
engaged by and report directly to the Committee and provide
advice and assistance on a range of matters including but not
limited to:
> updates on remuneration trends, regulatory developments
and shareholder views;
> the review, design or implementation of the executive
remuneration strategy and its underlying components
(such as incentive plans); and
> market remuneration analysis and comparative conditions
relevant to Myer.
When making remuneration decisions, the Committee will also
give consideration to the Company’s internal succession plan
and capability profile.

REMUNERATION REPORTContinued
MYER Annual Report 2015 41
Ms Chris Froggatt chairs the Human Resources and
Remuneration Committee. Other members of the Committee
are Ms Anne Brennan, Mr Ian Cornell and Mr Rupert Myer AO.
In performing its role, the Committee has the responsibility
to make recommendations to the Board on:
> non-executive director fees;
> executive remuneration (for the Managing Director and CEO
and other executives) including specific recommendations on
remuneration packages and other terms of employment for
the Chairman, non-executive directors, the CEO and other
senior executives;
> the over-arching remuneration framework including the
policy, strategy and practices for fixed reward and both short
and long term incentive plans and performance hurdles; and
> the regular and continuing review of executive succession
planning and executive development activities to ensure
appropriate plans are in place for succession for business
critical roles.
The Committee has been established under rule 8.15 of the
Constitution of the Company. Further information on the role of
the Committee, its membership and meetings held throughout
the year are set out in the Corporate Governance Statement
(available on the Company’s website) and the Directors’ Report.
The Committee has regard to the following policy objectives:
> to ensure that the Company’s remuneration structures are
equitable and aligned with the long-term interests of the
Company and its shareholders;
> to attract and retain skilled executives;
> to structure short and long term incentives that are
challenging and linked to the creation of sustainable
shareholder returns; and
> to ensure that any termination benefits are justified and
appropriate.
The Chairman, the CEO, and the head of the Human Resources
function are regular attendees at the Committee meetings. The
CEO was not present during any Committee or Board meetings
when his remuneration was considered or discussed during the
financial period.
The Committee must at all times have regard to, and notify the
Board as appropriate, of all legal and regulatory requirements,
including any shareholder approvals required in connection with
remuneration matters.
The Committee Chairman or if she is not available, a Committee
member, will attend the Annual General Meeting and be available
to answer any questions from shareholders about the
Committee’s activities or, if appropriate, the Company’s
remuneration arrangements.
USE OF REMUNERATION CONSULTANTS
To ensure it is fully informed when making remuneration decisions,
the Committee draws on services from a range of external
sources, including remuneration consultants where appropriate.
The Company’s guidelines on the use of remuneration
consultants aim to ensure the independence of remuneration
consultants from Myer’s management, and include the process
for the selection of consultants and the terms of engagement.
Remuneration consultants are engaged by the Committee
Chairman, and report directly to the Committee. As part of this
engagement, an agreed set of protocols to be followed by the
consultants, the Committee, and management have been
devised that determine the way in which remuneration
recommendations are developed and provided to the Board.
This process is intended to ensure that any recommendation
made by the remuneration consultant is free from undue
influence by the KMP to whom any recommendations may relate.
During FY2015, the Committee continued to engage Ernst
& Young (EY) to provide independent advice to the Board in
its review of remuneration arrangements.
Throughout FY2015, the information received from EY in respect
of the CEO and executives related to:
> regulatory reforms;
> current market practices;
> review of variable remuneration framework;
> considerations with regard to the CEO appointment; and
> benchmarking to support the annual remuneration review
for the CEO and executives.
Any remuneration information provided by EY and relating to
the CEO was disclosed directly to the Committee Chairman
who considered the recommendation, in consultation with the
Committee and the Chairman of the Board. No recommendation
was provided in FY2015. Market data provided by EY is also used
to inform the CEO to propose adjustments to KMP remuneration
to the Committee for their approval.
During FY2015, the Board approved the engagement of EY to
provide remuneration advice, benchmarking data, market
commentary and professional guidance regarding Myer’s
executive remuneration and incentive plans. During this
engagement, no remuneration recommendations (as defined
by the Corporations Act) were provided to the Company by EY.
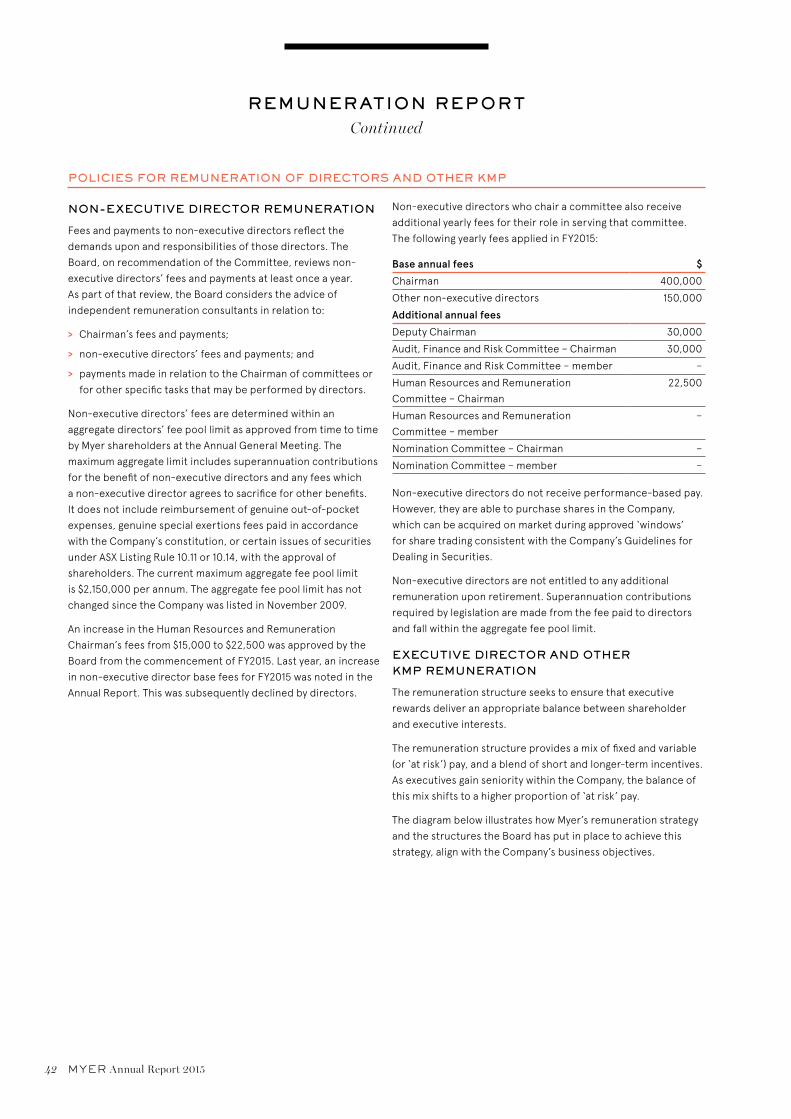
REMUNERATION REPORTContinued
42 MYER Annual Report 2015
POLICIES FOR REMUNERATION OF DIRECTORS AND OTHER KMP
NON-EXECUTIVE DIRECTOR REMUNERATION
Fees and payments to non-executive directors reflect the
demands upon and responsibilities of those directors. The
Board, on recommendation of the Committee, reviews non-
executive directors’ fees and payments at least once a year.
As part of that review, the Board considers the advice of
independent remuneration consultants in relation to:
> Chairman’s fees and payments;
> non-executive directors’ fees and payments; and
> payments made in relation to the Chairman of committees or
for other specific tasks that may be performed by directors.
Non-executive directors’ fees are determined within an
aggregate directors’ fee pool limit as approved from time to time
by Myer shareholders at the Annual General Meeting. The
maximum aggregate limit includes superannuation contributions
for the benefit of non-executive directors and any fees which
a non-executive director agrees to sacrifice for other benefits.
It does not include reimbursement of genuine out-of-pocket
expenses, genuine special exertions fees paid in accordance
with the Company’s constitution, or certain issues of securities
under ASX Listing Rule 10.11 or 10.14, with the approval of
shareholders. The current maximum aggregate fee pool limit
is $2,150,000 per annum. The aggregate fee pool limit has not
changed since the Company was listed in November 2009.
An increase in the Human Resources and Remuneration
Chairman’s fees from $15,000 to $22,500 was approved by the
Board from the commencement of FY2015. Last year, an increase
in non-executive director base fees for FY2015 was noted in the
Annual Report. This was subsequently declined by directors.
Non-executive directors who chair a committee also receive
additional yearly fees for their role in serving that committee.
The following yearly fees applied in FY2015:
Base annual fees $
Chairman 400,000
Other non-executive directors 150,000
Additional annual fees
Deputy Chairman 30,000
Audit, Finance and Risk Committee – Chairman 30,000
Audit, Finance and Risk Committee – member –
Human Resources and Remuneration
Committee – Chairman
22,500
Human Resources and Remuneration
Committee – member
–
Nomination Committee – Chairman –
Nomination Committee – member –
Non-executive directors do not receive performance-based pay.
However, they are able to purchase shares in the Company,
which can be acquired on market during approved ‘windows’
for share trading consistent with the Company’s Guidelines for
Dealing in Securities.
Non-executive directors are not entitled to any additional
remuneration upon retirement. Superannuation contributions
required by legislation are made from the fee paid to directors
and fall within the aggregate fee pool limit.
EXECUTIVE DIRECTOR AND OTHER KMP REMUNERATION
The remuneration structure seeks to ensure that executive
rewards deliver an appropriate balance between shareholder
and executive interests.
The remuneration structure provides a mix of fixed and variable
(or ‘at risk’) pay, and a blend of short and longer-term incentives.
As executives gain seniority within the Company, the balance of
this mix shifts to a higher proportion of ‘at risk’ pay.
The diagram below illustrates how Myer’s remuneration strategy
and the structures the Board has put in place to achieve this
strategy, align with the Company’s business objectives.
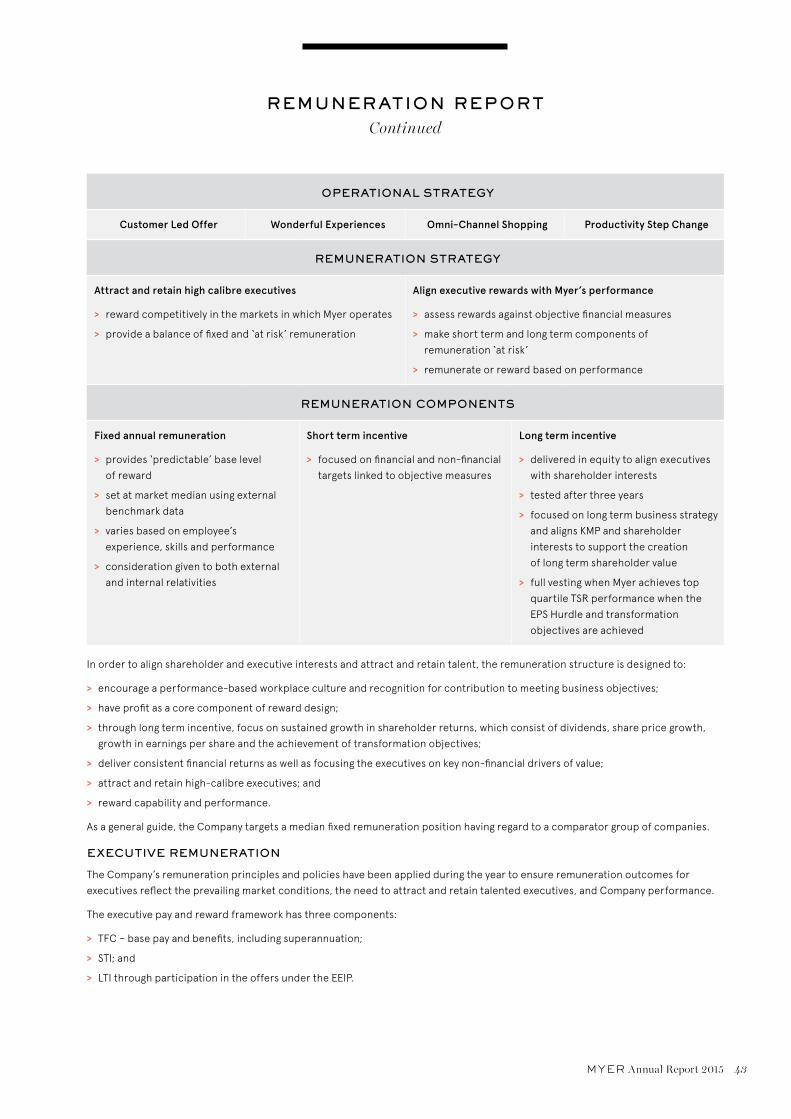
REMUNERATION REPORTContinued
MYER Annual Report 2015 43
OPERATIONAL STRATEGY
Customer Led Offer Wonderful Experiences Omni-Channel Shopping Productivity Step Change
REMUNERATION STRATEGY
Attract and retain high calibre executives
> reward competitively in the markets in which Myer operates
> provide a balance of fixed and ‘at risk’ remuneration
Align executive rewards with Myer’s performance
> assess rewards against objective financial measures
> make short term and long term components of
remuneration ‘at risk’
> remunerate or reward based on performance
REMUNERATION COMPONENTS
Fixed annual remuneration
> provides ‘predictable’ base level
of reward
> set at market median using external
benchmark data
> varies based on employee’s
experience, skills and performance
> consideration given to both external
and internal relativities
Short term incentive
> focused on financial and non-financial
targets linked to objective measures
Long term incentive
> delivered in equity to align executives
with shareholder interests
> tested after three years
> focused on long term business strategy
and aligns KMP and shareholder
interests to support the creation
of long term shareholder value
> full vesting when Myer achieves top
quartile TSR performance when the
EPS Hurdle and transformation
objectives are achieved
In order to align shareholder and executive interests and attract and retain talent, the remuneration structure is designed to:
> encourage a performance-based workplace culture and recognition for contribution to meeting business objectives;
> have profit as a core component of reward design;
> through long term incentive, focus on sustained growth in shareholder returns, which consist of dividends, share price growth,
growth in earnings per share and the achievement of transformation objectives;
> deliver consistent financial returns as well as focusing the executives on key non-financial drivers of value;
> attract and retain high-calibre executives; and
> reward capability and performance.
As a general guide, the Company targets a median fixed remuneration position having regard to a comparator group of companies.
EXECUTIVE REMUNERATION
The Company’s remuneration principles and policies have been applied during the year to ensure remuneration outcomes for
executives reflect the prevailing market conditions, the need to attract and retain talented executives, and Company performance.
The executive pay and reward framework has three components:
> TFC – base pay and benefits, including superannuation;
> STI; and
> LTI through participation in the offers under the EEIP.

REMUNERATION REPORTContinued
44 MYER Annual Report 2015
The combination of these three components comprises an executive’s total remuneration mix at target of performance reflected
by percentage in the following charts.
CEO
Fixed Remuneration 37.0%STI 17.8%STI (Deferred stock) 11.9%LTI 33.3%
Deputy CEO & Chief Merchandise and Marketing Officer
Fixed Remuneration 40.0%STI Cash 24.0%LTI 36.0%
CFO
Fixed Remuneration 40.0%STI Cash 24.0%LTI 36.0%
Other KMP
Fixed Remuneration 45.5%STI Cash 27.3%LTI 27.3%
TOTAL FIXED COMPENSATION
Fixed remuneration is determined by assessing an individual’s competency level and experience against the requirements of the
respective position relative to business unit/functional alignment and external market conditions, with flexibility to recognise
individual performance and value to the organisation.
Feature Description
What is included in TFC? TFC is structured as a total fixed employment compensation package, made up of base salary,
superannuation and other benefits. Some of the benefits include the opportunity to receive a
portion of their fixed remuneration in a variety of forms, including fringe benefits such as motor
vehicles, or to make additional contributions to superannuation or retirement plans (as permitted
by relevant legislation).
How is TFC reviewed? Base salary levels for each executive are set with reference to the market conditions and the
scope and nature of each individual’s role, the experience of the individual and performance
in that role.
The Committee reviews and makes recommendations to the Board regarding TFC for KMP and
senior executives annually in July, having regard to Company and individual performance and
relevant comparative remuneration in the market. Annual adjustments approved by the Board
are effective 1 February. The Board may also approve adjustments to executive remuneration as
recommended by the CEO, such as on promotion or as a result of additional duties performed
by the executive.
Where new senior executives join the Company or existing executives are appointed to new roles,
a review and benchmarking of fixed and total remuneration is conducted for each individual prior
to the issue of an offer and execution of a new employment contract.
Annual adjustments to the remuneration of executives and employees who are not KMP or senior
executives are determined based upon guidelines approved by the CEO and advised to the
Committee.
Which benchmarks are used? Remuneration for KMP is benchmarked against both a peer group of companies and companies
from the ASX 200, with a market capitalisation of between 50% and 200% of that of Myer
(excluding companies from the financial and mining sectors).
EY provided benchmarking data to the Committee in connection with the Committee’s review of TFC for members of the Group
executive in March 2015. Remuneration reviews are conducted annually and effective 1 February. The review conducted in FY2015
identified that fixed remuneration levels for executives were generally competitively positioned within the market, and where they
were not, appropriate adjustments were made (noting there was a freeze on base pay in FY2014). The EGM of Stores received a
performance and market-related adjustment off a low base for his initial appointment.

REMUNERATION REPORTContinued
MYER Annual Report 2015 45
SHORT TERM INCENTIVE
The quantum of short term variable rewards for the CEO and other KMP payable in a particular year are determined based on the
extent to which key performance indicators (KPIs) are satisfied in the relevant year. These KPIs are set by reference to the Company’s
overall performance and individual performance objectives established for the year. In the case of the CEO, these objectives are set
by the Chairman and endorsed by the Board. KPIs for the other KMP are set by the CEO and endorsed by the Committee for approval
by the Board.
Myer’s STI plan for KMP and other senior executives operates on an annual basis subject to Board review and approval. The FY2015
STI applied to all eligible executives including the KMP, subject to certain conditions and performance criteria being met which are
reviewed and approved annually by the Board.
Despite a number of strategic and operational objectives being met, the Board determined that Company metrics of EBIT and sales
growth were not met and no reward of STI to any of the Myer management team was provided against these metrics. In FY2015, a
select number of executives received an STI award for the delivery of personal objectives. The total amount payable was $246,100.
No KMP received an STI award.
Feature Description
What is the STI plan? The STI plan is the cash-based component of a senior executive’s at risk reward opportunity,
based on achieving pre-determined performance measurement criteria.
As stated above, subject to obtaining shareholder approval, up to 40% of any annual STI rewarded
to Mr Umbers from FY2016 onwards may be delivered through a grant of restricted shares.
What is the value of the STI
opportunity?
In respect of FY2015:
> As the CEO was appointed part way through FY2015, having spent time in the role of Chief
Information and Supply Chain Officer, the CEO’s STI opportunity for FY2015 will be pro-rated
based on the time he has acted in each role equivalent to 52.9% of his TFC.
> The remaining members of the senior executive team had the opportunity to earn a STI reward
equivalent to between 45% and 60% of their TFC for at target performance.
What was the FY2015
performance measure?
To incentivise performance and bring about positive change, three metrics were considered to
determine any incentive reward for FY2015: EBIT was the main metric, weighted at 50% of the total
potential reward; sales growth was the second metric, weighted at 30%; and the final metric was
the achievement of personal objectives established for each KMP and other executives, weighted
at 20%. Each measure was assessed in isolation without a ‘gate’ applying before any reward was
made against individual metrics.
Why was the performance
measure selected?
EBIT growth is one of the primary measures that the Board uses to assess the operating
performance of the Company, with an aim to maintain a focus on the Company’s operating
results and associated cash generation. It reflects the contribution from individual assets to
the Company’s operating performance and focuses on elements of the result that management
can influence to drive improvements in short term earnings.
Sales growth was chosen principally because of the impact it has on NPAT, which is a significant
contributor to the achievement of satisfactory returns to shareholders.
Personal objectives relate to specific individual quantitative targets set by the CEO (and approved
by the Human Resources and Remuneration Committee and the Board). These targets relate to
aspects of the business which align to our strategic goals, and over which the relevant executive
had significant influence.
The measures selected for each executive were determined by reference to the specific
objectives of the executive’s role for FY2015. Company financial measures were allocated to
all executives to ensure an alignment between executive reward outcomes and Company
performance. Given that STI rewards are contingent on performance across a range of measures,
maximum STI rewards can only be achieved for performance that is strong on all measures.
As in previous years, the Board has 100% discretion with the STI outcome.
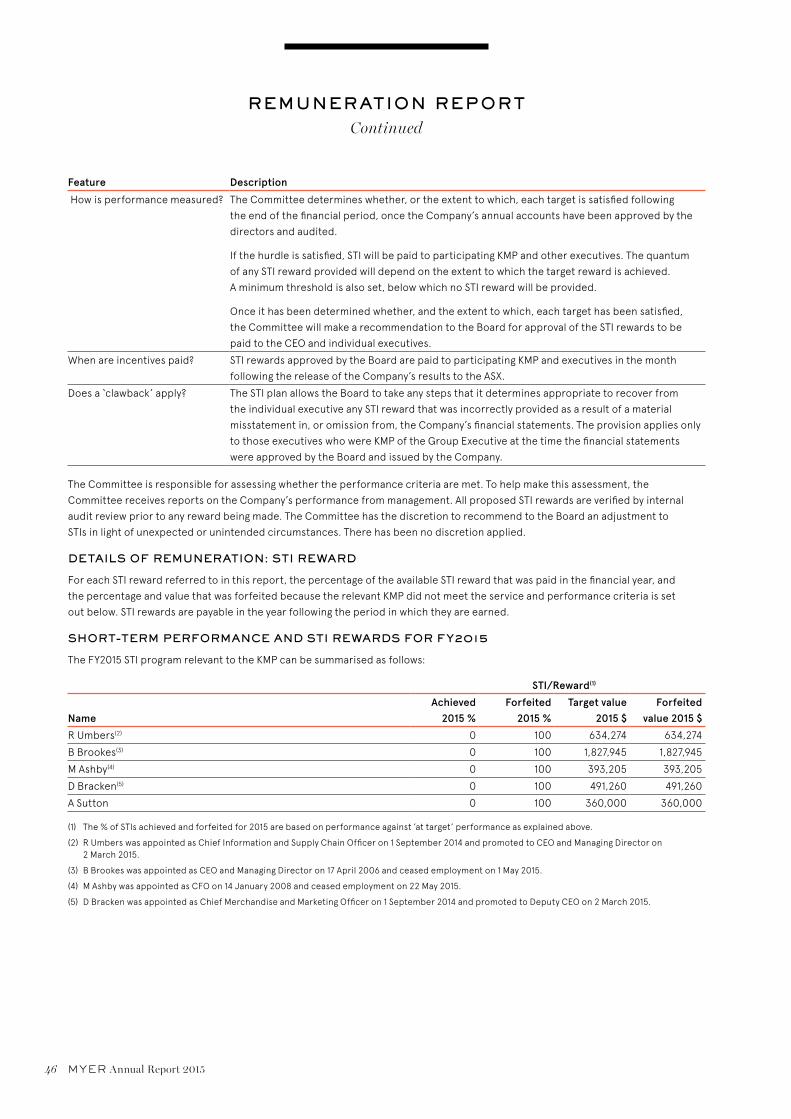
REMUNERATION REPORTContinued
46 MYER Annual Report 2015
Feature Description
How is performance measured? The Committee determines whether, or the extent to which, each target is satisfied following
the end of the financial period, once the Company’s annual accounts have been approved by the
directors and audited.
If the hurdle is satisfied, STI will be paid to participating KMP and other executives. The quantum
of any STI reward provided will depend on the extent to which the target reward is achieved.
A minimum threshold is also set, below which no STI reward will be provided.
Once it has been determined whether, and the extent to which, each target has been satisfied,
the Committee will make a recommendation to the Board for approval of the STI rewards to be
paid to the CEO and individual executives.
When are incentives paid? STI rewards approved by the Board are paid to participating KMP and executives in the month
following the release of the Company’s results to the ASX.
Does a ‘clawback’ apply? The STI plan allows the Board to take any steps that it determines appropriate to recover from
the individual executive any STI reward that was incorrectly provided as a result of a material
misstatement in, or omission from, the Company’s financial statements. The provision applies only
to those executives who were KMP of the Group Executive at the time the financial statements
were approved by the Board and issued by the Company.
The Committee is responsible for assessing whether the performance criteria are met. To help make this assessment, the
Committee receives reports on the Company’s performance from management. All proposed STI rewards are verified by internal
audit review prior to any reward being made. The Committee has the discretion to recommend to the Board an adjustment to
STIs in light of unexpected or unintended circumstances. There has been no discretion applied.
DETAILS OF REMUNERATION: STI REWARD
For each STI reward referred to in this report, the percentage of the available STI reward that was paid in the financial year, and
the percentage and value that was forfeited because the relevant KMP did not meet the service and performance criteria is set
out below. STI rewards are payable in the year following the period in which they are earned.
SHORT-TERM PERFORMANCE AND STI REWARDS FOR FY2015
The FY2015 STI program relevant to the KMP can be summarised as follows:
STI/Reward(1)
NameAchieved
2015 % Forfeited
2015 %Target value
2015 $Forfeited
value 2015 $
R Umbers(2) 0 100 634,274 634,274
B Brookes(3) 0 100 1,827,945 1,827,945
M Ashby(4) 0 100 393,205 393,205
D Bracken(5) 0 100 491,260 491,260
A Sutton 0 100 360,000 360,000
(1) The % of STIs achieved and forfeited for 2015 are based on performance against ’at target’ performance as explained above.
(2) R Umbers was appointed as Chief Information and Supply Chain Officer on 1 September 2014 and promoted to CEO and Managing Director on 2 March 2015.
(3) B Brookes was appointed as CEO and Managing Director on 17 April 2006 and ceased employment on 1 May 2015.
(4) M Ashby was appointed as CFO on 14 January 2008 and ceased employment on 22 May 2015.
(5) D Bracken was appointed as Chief Merchandise and Marketing Officer on 1 September 2014 and promoted to Deputy CEO on 2 March 2015.
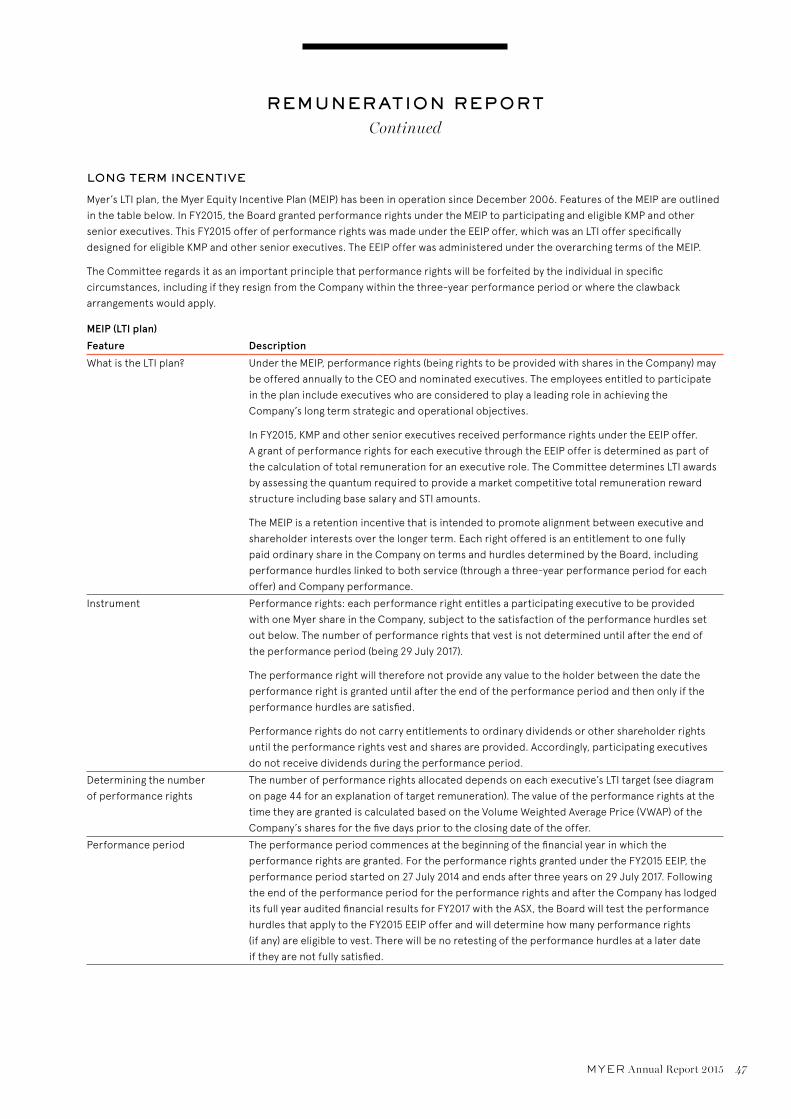
REMUNERATION REPORTContinued
MYER Annual Report 2015 47
LONG TERM INCENTIVE
Myer’s LTI plan, the Myer Equity Incentive Plan (MEIP) has been in operation since December 2006. Features of the MEIP are outlined
in the table below. In FY2015, the Board granted performance rights under the MEIP to participating and eligible KMP and other
senior executives. This FY2015 offer of performance rights was made under the EEIP offer, which was an LTI offer specifically
designed for eligible KMP and other senior executives. The EEIP offer was administered under the overarching terms of the MEIP.
The Committee regards it as an important principle that performance rights will be forfeited by the individual in specific
circumstances, including if they resign from the Company within the three-year performance period or where the clawback
arrangements would apply.
MEIP (LTI plan)
Feature Description
What is the LTI plan? Under the MEIP, performance rights (being rights to be provided with shares in the Company) may
be offered annually to the CEO and nominated executives. The employees entitled to participate
in the plan include executives who are considered to play a leading role in achieving the
Company’s long term strategic and operational objectives.
In FY2015, KMP and other senior executives received performance rights under the EEIP offer.
A grant of performance rights for each executive through the EEIP offer is determined as part of
the calculation of total remuneration for an executive role. The Committee determines LTI awards
by assessing the quantum required to provide a market competitive total remuneration reward
structure including base salary and STI amounts.
The MEIP is a retention incentive that is intended to promote alignment between executive and
shareholder interests over the longer term. Each right offered is an entitlement to one fully
paid ordinary share in the Company on terms and hurdles determined by the Board, including
performance hurdles linked to both service (through a three-year performance period for each
offer) and Company performance.
Instrument Performance rights: each performance right entitles a participating executive to be provided
with one Myer share in the Company, subject to the satisfaction of the performance hurdles set
out below. The number of performance rights that vest is not determined until after the end of
the performance period (being 29 July 2017).
The performance right will therefore not provide any value to the holder between the date the
performance right is granted until after the end of the performance period and then only if the
performance hurdles are satisfied.
Performance rights do not carry entitlements to ordinary dividends or other shareholder rights
until the performance rights vest and shares are provided. Accordingly, participating executives
do not receive dividends during the performance period.
Determining the number
of performance rights
The number of performance rights allocated depends on each executive’s LTI target (see diagram
on page 44 for an explanation of target remuneration). The value of the performance rights at the
time they are granted is calculated based on the Volume Weighted Average Price (VWAP) of the
Company’s shares for the five days prior to the closing date of the offer.
Performance period The performance period commences at the beginning of the financial year in which the
performance rights are granted. For the performance rights granted under the FY2015 EEIP, the
performance period started on 27 July 2014 and ends after three years on 29 July 2017. Following
the end of the performance period for the performance rights and after the Company has lodged
its full year audited financial results for FY2017 with the ASX, the Board will test the performance
hurdles that apply to the FY2015 EEIP offer and will determine how many performance rights
(if any) are eligible to vest. There will be no retesting of the performance hurdles at a later date
if they are not fully satisfied.

REMUNERATION REPORTContinued
48 MYER Annual Report 2015
MEIP (LTI plan)
Feature Description
Performance hurdles FY2015 EEIP offer (performance period 27 July 2014 – 29 July 2017):
Consistent with prior years, the financial performance measures approved by the Board for the
FY2015 EEIP offer were TSR performance, the Company’s EPS and the Business Transformation
Hurdle (introduced in FY2014).
> 50% of each award is subject to a performance hurdle, which measures the Company’s TSR
performance relative to a set peer group. The Board approved a change in comparator group
for the purposes of measuring relative TSR performance under the FY2015 EEIP offer. The new
comparator group will comprise of Standard & Poor’s/ASX 200 market constituents (with some
exclusions). This peer group is considered more appropriate to benchmark the Company’s
relative performance, being a broader and more appropriate comparator group, given Myer’s
size and position in the ASX 200.
> 25% of each award is subject to a performance hurdle that measures the Company’s EPS.
The EPS Hurdle is based on the compound annual growth rate in the Company’s fully diluted
EPS over the performance period.
> 25% of each award is subject to a Business Transformation Hurdle. The purpose of the Business
Transformation Hurdle is to assess the way in which Myer is transforming due to the structural
realignment of the retail industry.
Why were the performance
measures selected?
The Board decided to continue with a market-based performance measure for the FY2015 offer
and a relative TSR measure was selected to ensure an alignment between comparative shareholder
return and reward for executives. This also provides a direct comparison of the Company’s
performance over the three-year performance period against a comparator group of companies
that would, broadly, be expected to be similarly impacted by changes in market conditions.
EPS was selected as it is considered to be an effective measure for determining the underlying
profitability of the business.
The Business Transformation Hurdle was selected to assess the way in which the Company
is transforming in a time of continued structural realignment of the retail industry.
Vesting framework The number of performance rights that vest will depend on how well Myer has performed during
the performance period. For superior performance, 100% of the performance rights will vest.
Only a percentage of performance rights will vest for performance below that level. If Myer does
not achieve certain minimum thresholds then all the applicable performance rights will lapse and
no performance rights can vest.
For the FY2015 EEIP offer, the following vesting hurdles applied:
> TSR (50% of the award)
TSR percentile ranking % of TSR performance rights that will vest
Below 50th Nil
From 50th to 75th Pro rata with a linear progression between 50% and up to 100% of the
number of TSR performance rights
75th and above 100%
> EPS (25% of the award)
EPS Hurdle rate (CAGR over the performance period) % of EPS performance rights that will vest
Less than 2% Nil
Between 2% and 7%
pro rata vesting of rights
Pro rata with a linear progression between 50% and up to 100% of the
number of EPS performance rights
7% or greater 100% of the number of EPS performance rights

REMUNERATION REPORTContinued
MYER Annual Report 2015 49
MEIP (LTI plan)
Feature Description
> Business Transformation (25% of the award)
At the end of the performance period, the Board will compare Myer’s actual performance
against the target performance for the Business Transformation Hurdle metrics as set out in
Myer’s business plan.
The Board will then determine, in its absolute discretion, the percentage of the Business
Transformation performance rights that are eligible to vest on the basis of the results of the
comparison of Myer’s actual performance against the target performance for the Business
Transformation Hurdle metrics as set out in Myer’s business plan.
Each performance hurdle will be assessed separately, meaning that all hurdles do not need to be
satisfied for any of an executive’s performance rights to vest. This means that it is possible for
some or all of the performance rights with an EPS Hurdle to vest, while none of the performance
rights with a TSR or Business Transformation Hurdle vest (and vice versa).
Cessation of employment Generally, any performance rights granted will lapse on cessation of employment if they have not
been exercised (whether vested or unvested before that time). Subject to applicable law, the
Board has the power to allow an executive to keep some, or all of their performance rights on
cessation of employment (although the discretion is only likely to be exercised in exceptional
circumstances).
Does a ‘clawback’ apply? The LTI plan includes provisions for unvested rights to lapse and rights or interests in shares
allocated or to be allocated under the EEIP to be forfeited, at the Board’s discretion, if any
performance rights were incorrectly granted as a result of a material misstatement in, or omission
from, the Company’s financial statements. The provision applies only to those executives who
were KMP of the Company at the time the financial statements were approved by the Board and
issued by the Company.
Board discretion The rights and entitlements attaching to performance rights may be adjusted if the Company
undertakes a bonus or rights issue or a capital reconstruction in relation to the Company’s shares.
Expiry At the end of the applicable performance period, any performance rights that have not vested will
lapse and no shares will be provided for those performance rights.
OTHER REMUNERATION
In addition to standard remuneration arrangements, Mr Umbers, Mr Bracken and Mr Devonport were provided with additional cash
and equity as part of their original sign-on arrangements to recognise significant incentive arrangements forfeited upon leaving their
previous employers to join Myer.
Mr Umbers received $590,000 on his commencement in cash and $400,000 in performance rights vesting in 2017. These
performance rights are subject to a condition of continuous employment with the Company through to the end of the performance
period for the FY2015 EEIP. This equated to a total of 250,000 Myer shares at the time of grant when the Volume Weighted Average
Price (VWAP) share price was $1.60. The value attributed to a performance right was determined by the VWAP of Myer shares for the
five days prior to the closing date of the offer.
Mr Bracken received $390,000 on his commencement in cash and $200,000 in performance rights vesting in 2017. These performance
rights are subject to a condition of continuous employment with the Company through to the end of the performance period for
the FY2015 EEIP. This equated to a total of 125,000 Myer shares at the time of grant when the VWAP share price was $1.60. The value
attributed to a performance right was determined by the VWAP of Myer shares for the five days prior to the closing date of the offer.
Mr Devonport will receive $400,000 in cash upon the completion of his first year of employment. This payment would be waived
if Mr Devonport were to resign during the first 12 months of his employment with the Company. In addition, Mr Devonport will be
awarded additional performance rights to the value of $200,000 in the EEIP granted in each of FY2016 and FY2017. These performance
rights are subject to a condition of continuous employment with the Company through to the end of the performance period for the
FY2016 EEIP and the FY2017 EEIP.
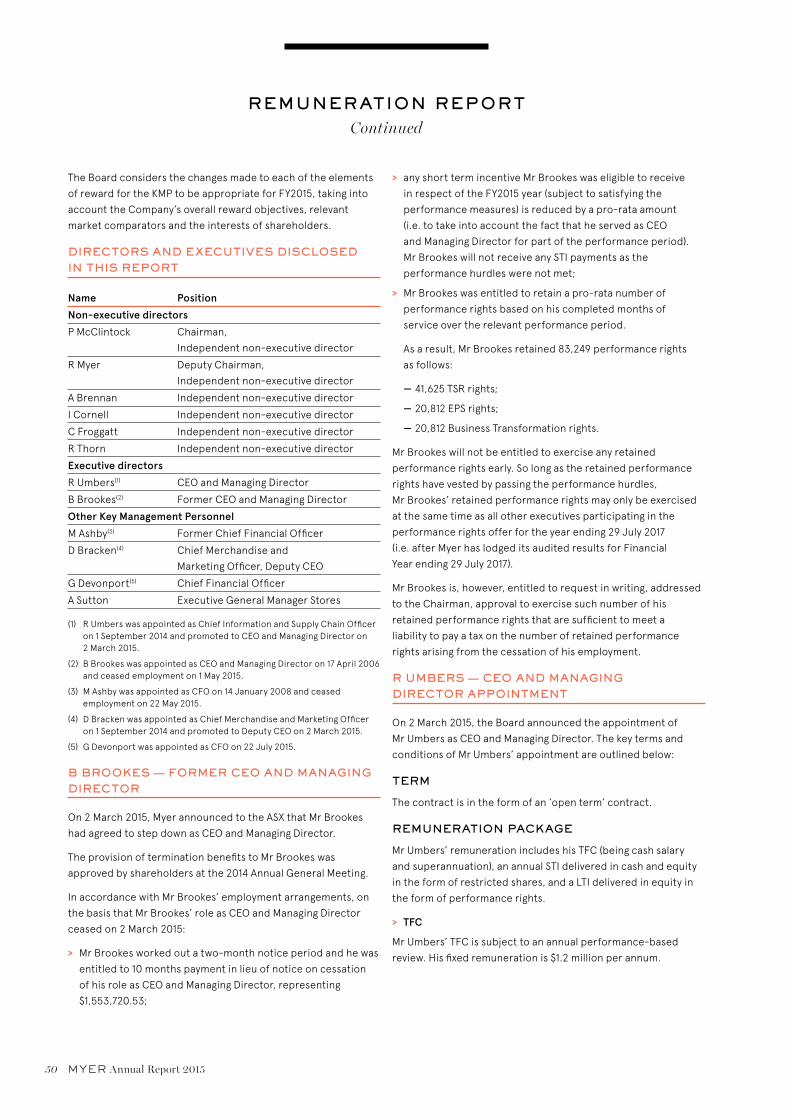
REMUNERATION REPORTContinued
50 MYER Annual Report 2015
The Board considers the changes made to each of the elements
of reward for the KMP to be appropriate for FY2015, taking into
account the Company’s overall reward objectives, relevant
market comparators and the interests of shareholders.
DIRECTORS AND EXECUTIVES DISCLOSED IN THIS REPORT
Name Position
Non-executive directors
P McClintock Chairman,
Independent non-executive director
R Myer Deputy Chairman,
Independent non-executive director
A Brennan Independent non-executive director
I Cornell Independent non-executive director
C Froggatt Independent non-executive director
R Thorn Independent non-executive director
Executive directors
R Umbers(1) CEO and Managing Director
B Brookes(2) Former CEO and Managing Director
Other Key Management Personnel
M Ashby(3) Former Chief Financial Officer
D Bracken(4) Chief Merchandise and
Marketing Officer, Deputy CEO
G Devonport(5) Chief Financial Officer
A Sutton Executive General Manager Stores
(1) R Umbers was appointed as Chief Information and Supply Chain Officer on 1 September 2014 and promoted to CEO and Managing Director on 2 March 2015.
(2) B Brookes was appointed as CEO and Managing Director on 17 April 2006 and ceased employment on 1 May 2015.
(3) M Ashby was appointed as CFO on 14 January 2008 and ceased employment on 22 May 2015.
(4) D Bracken was appointed as Chief Merchandise and Marketing Officer on 1 September 2014 and promoted to Deputy CEO on 2 March 2015.
(5) G Devonport was appointed as CFO on 22 July 2015.
B BROOKES — FORMER CEO AND MANAGING DIRECTOR
On 2 March 2015, Myer announced to the ASX that Mr Brookes
had agreed to step down as CEO and Managing Director.
The provision of termination benefits to Mr Brookes was
approved by shareholders at the 2014 Annual General Meeting.
In accordance with Mr Brookes’ employment arrangements, on
the basis that Mr Brookes’ role as CEO and Managing Director
ceased on 2 March 2015:
> Mr Brookes worked out a two-month notice period and he was
entitled to 10 months payment in lieu of notice on cessation
of his role as CEO and Managing Director, representing
$1,553,720.53;
> any short term incentive Mr Brookes was eligible to receive
in respect of the FY2015 year (subject to satisfying the
performance measures) is reduced by a pro-rata amount
(i.e. to take into account the fact that he served as CEO
and Managing Director for part of the performance period).
Mr Brookes will not receive any STI payments as the
performance hurdles were not met;
> Mr Brookes was entitled to retain a pro-rata number of
performance rights based on his completed months of
service over the relevant performance period.
As a result, Mr Brookes retained 83,249 performance rights
as follows:
— 41,625 TSR rights;
— 20,812 EPS rights;
— 20,812 Business Transformation rights.
Mr Brookes will not be entitled to exercise any retained
performance rights early. So long as the retained performance
rights have vested by passing the performance hurdles,
Mr Brookes’ retained performance rights may only be exercised
at the same time as all other executives participating in the
performance rights offer for the year ending 29 July 2017
(i.e. after Myer has lodged its audited results for Financial
Year ending 29 July 2017).
Mr Brookes is, however, entitled to request in writing, addressed
to the Chairman, approval to exercise such number of his
retained performance rights that are sufficient to meet a
liability to pay a tax on the number of retained performance
rights arising from the cessation of his employment.
R UMBERS — CEO AND MANAGING DIRECTOR APPOINTMENT
On 2 March 2015, the Board announced the appointment of
Mr Umbers as CEO and Managing Director. The key terms and
conditions of Mr Umbers’ appointment are outlined below:
TERM
The contract is in the form of an ‘open term’ contract.
REMUNERATION PACKAGE
Mr Umbers’ remuneration includes his TFC (being cash salary
and superannuation), an annual STI delivered in cash and equity
in the form of restricted shares, and a LTI delivered in equity in
the form of performance rights.
> TFC
Mr Umbers’ TFC is subject to an annual performance-based
review. His fixed remuneration is $1.2 million per annum.
REMUNERATION REPORTContinued
MYER Annual Report 2015 51
> STI
Mr Umbers is entitled to participate in Myer’s short term
incentive plan. As Mr Umbers was appointed CEO part way
through FY2015, having spent time in the role of Chief
Information and Supply Chain Officer, Mr Umbers’ STI
opportunity for FY2015 will be pro-rated based on the time he
has acted in each role equivalent to 52.9% of his TFC.
For the first full year as CEO (i.e. FY2016), Mr Umbers’ target
annual STI reward will be 80%. For all future years, Mr Umbers’
target STI reward will be as determined by the Board in its
absolute discretion.
60% of any annual STI reward will be provided in cash. Subject
to obtaining shareholder approval, the balance of 40% will be
delivered as restricted shares, although the Board will have the
discretion to reward cash in lieu of some or all of the restricted
shares.
Mr Umbers must not deal with any restricted shares for a
prescribed restriction period determined by the Board. During
the restriction period, the restricted shares will be held on trust.
However, Mr Umbers will be entitled to earn dividends on the
shares and, subject to any applicable voting restrictions, instruct
the trustee to vote the restricted shares.
> LTI
Subject to any required shareholder approval, Mr Umbers will be
entitled to an annual offer of performance rights under the EEIP,
to a value determined by the Board in its absolute discretion. For
the first offer (i.e. in respect of FY2016 grant), the offer value will
be 90% of Mr Umbers’ TFC, reflecting an amount of $1,080,000.
As Mr Umbers was granted performance rights prior to his
appointment as CEO and Managing Director, as a continuing
employee, Mr Umbers’ existing grants of performance rights
remain on issue, subject to satisfaction of the applicable service
and/or performance hurdles.
TOTAL REMUNERATION
Under Mr Umbers’ contract, his total remuneration (including
TFC, STI and LTI) at target is $3.24 million.
TERMINATION PROVISIONS
Myer may terminate Mr Umbers’ employment at any time by
providing 12 months’ written notice or payment in lieu of notice
(or a combination of these).
Mr Umbers may terminate his employment by providing the
Company with six months’ written notice.

REMUNERATION REPORTContinued
52 MYER Annual Report 2015
EQUITY ARRANGEMENTS WITH DIRECTORS AND OTHER KMP
FY2015 EEIP GRANT
In FY2015, KMP (other than the CEO) and other senior executives received LTI awards under the MEIP through the EEIP offer.
The awards granted may deliver value to executives at the end of the three-year performance period, subject to satisfaction
of performance hurdles as set out in the diagram below:
Total ShareholderReturn Hurdle = 50%
Earnings Per Share Hurdle = 25%
Business Transformation Hurdle = 25%
Performance rights granted Three-year performance period
The following table summarises the FY2015 performance right grants made to KMP in December 2014.
KMP
Value of performance
rights at grant date
Valuation of each
performance right at
grant date
Number of performance
rights granted(1)
Exercise price
Applicable hurdles
End of performance
period
R Umbers(2) $910,000 EPS $1.08 79,687 Nil EPS Hurdle 29 July 2017
TSR $0.30 159,375 Nil TSR Hurdle 29 July 2017
BT $1.08 79,687 Nil BT Hurdle 29 July 2017
Service $1.08 250,000 Nil Sign-on 3-year
Service Hurdle
29 July 2017
B Brookes(3) $600,000 EPS $1.08 93,750 Nil EPS Hurdle 29 July 2017
TSR $0.30 187,500 Nil TSR Hurdle 29 July 2017
BT $1.08 93,750 Nil BT Hurdle 29 July 2017
M Ashby(4) $480,000 EPS $1.08 75,000 Nil EPS Hurdle 29 July 2017
TSR $0.30 150,000 Nil TSR Hurdle 29 July 2017
BT $1.08 75,000 Nil BT Hurdle 29 July 2017
D Bracken(5) $710,000 EPS $1.08 79,687 Nil EPS Hurdle 29 July 2017
TSR $0.30 159,375 Nil TSR Hurdle 29 July 2017
BT $1.08 79,687 Nil BT Hurdle 29 July 2017
Service $1.08 125,000 Nil Sign-on 3-year
Service Hurdle
29 July 2017
A Sutton $360,000 EPS $1.08 56,250 Nil EPS Hurdle 29 July 2017
TSR $0.30 112,500 Nil TSR Hurdle 29 July 2017
BT $1.08 56,250 Nil BT Hurdle 29 July 2017
(1) The VWAP price used for the allocation of the FY2015 grant was $1.60.
(2) R Umbers was appointed as Chief Information and Supply Chain Officer on 1 September 2014 and promoted to CEO and Managing Director on 2 March 2015.
(3) B Brookes was appointed as CEO and Managing Director on 17 April 2006 and ceased employment on 1 May 2015.
(4) M Ashby was appointed as CFO on 14 January 2008 and ceased employment on 22 May 2015.
(5) D Bracken was appointed as Chief Merchandise and Marketing Officer on 1 September 2014 and promoted to Deputy CEO on 2 March 2015.

REMUNERATION REPORTContinued
MYER Annual Report 2015 53
THE TSR PEER GROUP
The Board approved a change in comparator group for the purposes of measuring relative TSR performance under the FY2015 EEIP
offer. The new comparator group will comprise Standard & Poor’s/ASX 200 market constituents (with some exclusions). This peer
group is considered appropriate to benchmark the Company’s relative performance, being a broader and more appropriate
comparator group, given Myer’s size and position within the ASX 200.
ADDITIONAL GRANT TO CEO AND CHIEF MERCHANDISE AND MARKETING OFFICER
Additional performance rights were offered to the new CEO and Chief Merchandise and Marketing Officer in FY2015 as part of their
original sign-on arrangements to recognise remuneration forgone from previous employers in order to join Myer. The potential
value of the performance rights granted under the EEIP offer was equivalent to $400,000 for the CEO and $200,000 for the Chief
Merchandise and Marketing Officer. These additional performance rights are subject to a condition of continuous employment
with the Company until the end of the vesting period (being 29 July 2017).
OPTIONS AND PERFORMANCE RIGHTS
Details of options granted under the MEIP that remain unvested as at 25 July 2015 are set out in the table below. No options have
been granted under the MEIP since 2009.
Grant type (options/performance rights) Grant date
Number of options/
performance rights(1)
Exercise price
Value per option/right at grant date
Vesting date (if holder remains
employed by a Myer Group
company) Expiry date
Options 30 Jun 2009 0 $2.34 $0.49 31 Jul 2014 24 Oct 2014
FY2011 No grants were made
Rights (CEO only EPS Hurdle) 9 Dec 2011 0 Nil $1.67 End of Perf. Period 31 Oct 2014
Rights (CEO only TSR Hurdle) 9 Dec 2011 0 Nil $1.08 End of Perf. Period 31 Oct 2014
Rights (EPS Hurdle) 21 Oct 2011 0 Nil $1.67 End of Perf. Period 31 Oct 2014
Rights (TSR Hurdle) 21 Oct 2011 0 Nil $1.08 End of Perf. Period 31 Oct 2014
Rights (EPS Hurdle) 29 Jan 2013 89,083 Nil $2.08 End of Perf. Period 31 Oct 2015
Rights (TSR Hurdle) 29 Jan 2013 89,084 Nil $1.56 End of Perf. Period 31 Oct 2015
Rights (Service Hurdle) 29 Jan 2013 927,604 Nil $2.08 End of Perf. Period 31 Oct 2015
Rights (EPS Hurdle) 27 Nov 2013 56,707 Nil $2.36 End of Perf. Period 31 Oct 2016
Rights (TSR Hurdle) 27 Nov 2013 113,418 Nil $1.57 End of Perf. Period 31 Oct 2016
Rights (Business Transformation
Hurdle)
27 Nov 2013 56,708 Nil $2.36 End of Perf. Period 31 Oct 2016
Rights (CFO only Service Hurdle) 27 Nov 2013 0 Nil $2.36 End of Perf. Period 31 Oct 2016
Rights (EPS Hurdle) 15 Dec 2014 480,488 Nil $1.08 End of Perf. Period 31 Oct 2017
Rights (TSR Hurdle) 15 Dec 2014 960,983 Nil $0.30 End of Perf. Period 31 Oct 2017
Rights (Business Transformation
Hurdle)
15 Dec 2014 480,488 Nil $1.08 End of Perf. Period 31 Oct 2017
Rights (Service Hurdle) 15 Dec 2014 500,000 Nil $1.08 End of Perf. Period 31 Oct 2017
Total 3,754,563
(1) Of the options noted above, zero options have vested and remain unexercised as at 25 July 2015. Refer to Financial Statements (note H4) for details.

REMUNERATION REPORTContinued
54 MYER Annual Report 2015
ASSESSMENT
At the end of each performance period, the Committee reviews the Company’s audited financial results and the results of the
other performance measures and assesses performance against each measure to determine the percentage of the options (if any)
that will vest.
Performance rights granted in 2013 subject to a TSR or EPS hurdle are not likely to vest as the EPS and TSR targets are unlikely
to be achieved. The performance rights granted in 2013 subject to a continuous service hurdle will vest following the lodgment
of the Company’s audited results for FY2015.
Details of options and performance rights over ordinary shares in the Company currently provided as remuneration and granted
during the current year to each director and each KMP are set out below. Further information on the MEIP is set out in note H4
of the Financial Statements.
Summary of options and performance rights granted, vested and lapsed for the reporting period
Name
Number of performance
rights granted during the
period(1)
Value of performance
rights at grant date(2)
$
Number of options
vested during the period
Number of options
lapsed during the period
Value at lapsed date
$
KMP of the Company
R Umbers(3) 568,749 910,000 – – –
B Brookes(4) 375,000 600,000 – 291,751 204,226
M Ashby(5) 300,000 480,000 – 673,611 491,736
D Bracken(6) 443,749 710,000 – – –
A Sutton 225,000 360,000 – – –
(1) No options or rights were granted to any director of the Company during the reporting period.
(2) The VWAP price used for the allocation of the FY2015 grant was $1.60.
(3) R Umbers was appointed as Chief Information and Supply Chain Officer on 1 September 2014 and promoted to CEO and Managing Director on 2 March 2015.
(4) B Brookes was appointed as CEO and Managing Director on 17 April 2006 and ceased employment on 1 May 2015.
(5) M Ashby was appointed as CFO on 14 January 2008 and ceased employment on 22 May 2015.
(6) D Bracken was appointed as Chief Merchandise and Marketing Officer on 1 September 2014 and promoted to Deputy CEO on 2 March 2015.
The assessed fair value at grant date of options granted to KMP is allocated equally over the period from grant date to vesting date
and the amount is included in the remuneration tables on pages 57 and 58. Fair values at grant date are independently determined
using an option pricing model that takes into account the exercise price, the term of the option, the impact of dilution, the share
price at grant date and expected price volatility of the underlying share, the expected dividend yield, and the risk-free interest rate
for the term of the option.
SHARES PROVIDED ON EXERCISE OF OPTIONS
There were no ordinary shares in the Company provided as a result of the exercise of options to any director of the Company
and KMP.
No amounts are unpaid on any shares provided on the exercise of options.
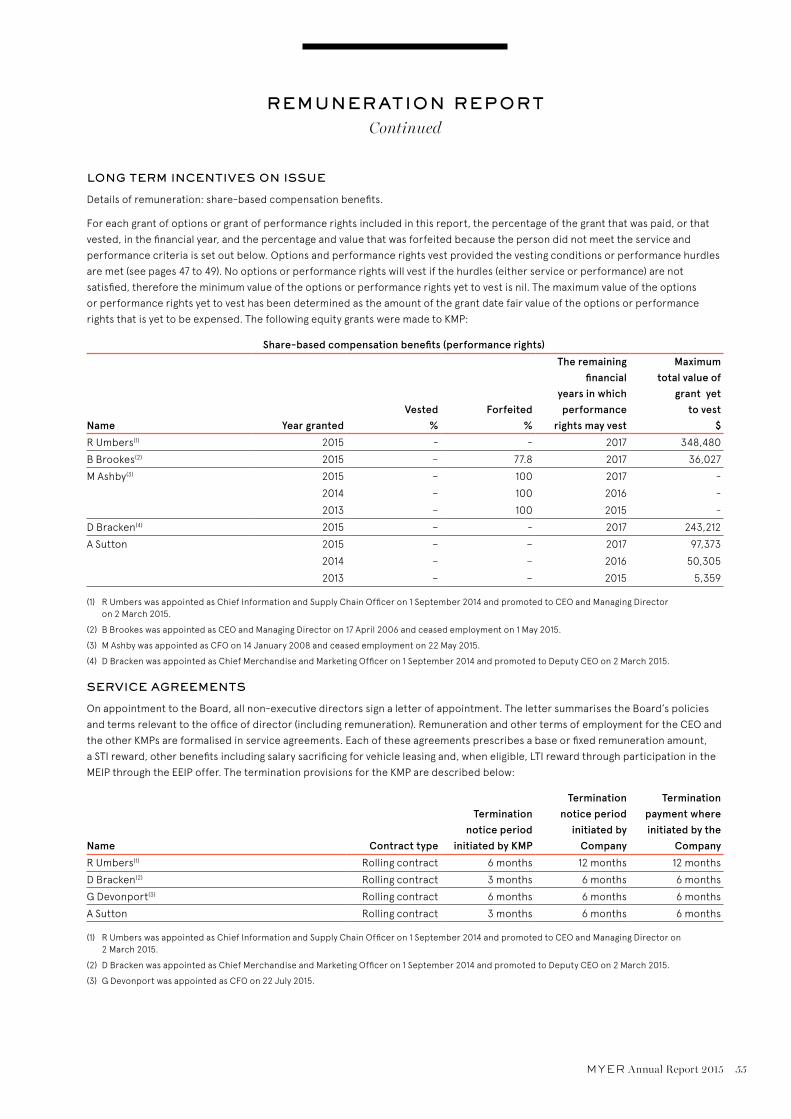
REMUNERATION REPORTContinued
MYER Annual Report 2015 55
LONG TERM INCENTIVES ON ISSUE
Details of remuneration: share-based compensation benefits.
For each grant of options or grant of performance rights included in this report, the percentage of the grant that was paid, or that
vested, in the financial year, and the percentage and value that was forfeited because the person did not meet the service and
performance criteria is set out below. Options and performance rights vest provided the vesting conditions or performance hurdles
are met (see pages 47 to 49). No options or performance rights will vest if the hurdles (either service or performance) are not
satisfied, therefore the minimum value of the options or performance rights yet to vest is nil. The maximum value of the options
or performance rights yet to vest has been determined as the amount of the grant date fair value of the options or performance
rights that is yet to be expensed. The following equity grants were made to KMP:
Share-based compensation benefits (performance rights)
Name Year grantedVested
%Forfeited
%
The remaining financial
years in which performance
rights may vest
Maximum total value of
grant yet to vest
$
R Umbers(1) 2015 - - 2017 348,480
B Brookes(2) 2015 – 77.8 2017 36,027
M Ashby(3) 2015 – 100 2017 -
2014 – 100 2016 -
2013 – 100 2015 -
D Bracken(4) 2015 – - 2017 243,212
A Sutton 2015 – – 2017 97,373
2014 – – 2016 50,305
2013 – – 2015 5,359
(1) R Umbers was appointed as Chief Information and Supply Chain Officer on 1 September 2014 and promoted to CEO and Managing Director on 2 March 2015.
(2) B Brookes was appointed as CEO and Managing Director on 17 April 2006 and ceased employment on 1 May 2015.
(3) M Ashby was appointed as CFO on 14 January 2008 and ceased employment on 22 May 2015.
(4) D Bracken was appointed as Chief Merchandise and Marketing Officer on 1 September 2014 and promoted to Deputy CEO on 2 March 2015.
SERVICE AGREEMENTS
On appointment to the Board, all non-executive directors sign a letter of appointment. The letter summarises the Board’s policies
and terms relevant to the office of director (including remuneration). Remuneration and other terms of employment for the CEO and
the other KMPs are formalised in service agreements. Each of these agreements prescribes a base or fixed remuneration amount,
a STI reward, other benefits including salary sacrificing for vehicle leasing and, when eligible, LTI reward through participation in the
MEIP through the EEIP offer. The termination provisions for the KMP are described below:
Name Contract type
Termination notice period
initiated by KMP
Termination notice period
initiated by Company
Termination payment where initiated by the
Company
R Umbers(1) Rolling contract 6 months 12 months 12 months
D Bracken(2) Rolling contract 3 months 6 months 6 months
G Devonport(3) Rolling contract 6 months 6 months 6 months
A Sutton Rolling contract 3 months 6 months 6 months
(1) R Umbers was appointed as Chief Information and Supply Chain Officer on 1 September 2014 and promoted to CEO and Managing Director on 2 March 2015.
(2) D Bracken was appointed as Chief Merchandise and Marketing Officer on 1 September 2014 and promoted to Deputy CEO on 2 March 2015.
(3) G Devonport was appointed as CFO on 22 July 2015.

REMUNERATION REPORTContinued
56 MYER Annual Report 2015
REMUNERATION AND COMPANY PERFORMANCE
The following graph shows the average individual total STI reward (as a percentage of each individual’s target STI, where 100% is the
target for the KMP group and its relationship to Group EBITDA and NPAT outcomes over five financial years).
0
50
100
150
200
250
300
350
FY2010 FY2011 FY2012 FY2013 FY2014 FY2015
EBITDANPATSTIP
$ m
illio
ns
% o
f ta
rget
STI
P p
aid
to s
enio
r ex
ecut
ives
0
10
20
30
40
50
FY2010 FY2011 FY2012 FY2013 FY2014 FY2015
EBITDANPATSTIP
The following table shows the Company’s annual performance against a range of metrics since 2010. The table shows the impact
of Company performance on shareholder returns, taking into account dividend payments, share price changes, and other capital
adjustments during the period.
FY2010 FY2011 FY2012 FY2013 FY2014 FY2015
Basic EPS (cents)(1) 29.0 27.9 23.9 21.8 16.8 13.2(5)
NPAT ($’000) 168,702(3) 162,657(4) 139,365 127,212 98,499 77,504(6)
Dividends (cents per share) 22.0 22.5 19.0 18.0 14.5 7.0
Share price at beginning of year(2) ($) 4.10 3.45 2.31 1.83 2.66 2.24
Share price at end of year ($) 3.45 2.31 1.83 2.66 2.24 1.18
(1) 2010 Basic EPS is calculated using pro forma NPAT and divided by the closing shares on issue. 2011 Basic EPS is calculated using normalised NPAT and divided by the weighted average shares.
(2) 2010 share price at the beginning of the year is the share price at listing.
(3) 2010 NPAT is pro forma NPAT excludes Individually Significant Items.
(4) 2011 NPAT excludes IPO and Individually Significant Items.
(5) 2015 Basic EPS excludes Individually Significant Items.
(6) 2015 NPAT excludes Individually Significant Items.
REMUNERATION OUTCOMES FOR DIRECTORS AND OTHER KMP
The following tables have been prepared in accordance with section 300A of the Corporations Act. They show details of the nature
and amount of each element of the remuneration paid or awarded for services provided in this period. In the case of share-based
payments and retention incentives, the amounts disclosed reflect the amount expensed during the year in accordance with relevant
accounting standards and accordingly this does not necessarily reflect the amount actually paid to the individual during the year,
which may be more or less than the amount shown in the tables on the following pages.

REMUNERATION REPORTContinued
MYER Annual Report 2015 57
The
bel
ow t
able
sh
ows
the
rem
uner
atio
n am
oun
ts r
ecor
ded
in t
he
finan
cial
sta
tem
ents
in t
he
per
iod
. Fo
otno
tes
are
on t
he
follo
win
g p
age.
Shor
t-te
rm e
mp
loye
e b
enefi
ts
Post
- em
plo
ymen
t b
enefi
tsLo
ng-t
erm
ben
efits
Tota
l re
mun
erat
ion
exp
ense
Shar
e-b
ased
p
aym
ents
Nam
e
Cas
h sa
lary
an
d fe
es(1
) $
Bon
us /
in
cent
ive
STI(2
) $O
ther
(3) $
Non
- m
onet
ary
ben
efits
$
Sup
er-
annu
atio
n(4) $
Sub
tota
l $
Long
se
rvic
e le
ave $
Ret
enti
on
bon
us $
Term
inat
ion
and
othe
r p
aym
ents
$
Excl
udin
g sh
are-
bas
ed
pay
men
ts(5
) $O
pti
ons(6
) $
Tota
l re
mun
erat
ion
exp
ense
$
Non
-exe
cuti
ve d
irec
tors
P M
cClin
tock 20
15 3
81,2
17
-
-
-
18,7
83
40
0,0
00
-
-
-
4
00
,00
0
-
40
0,0
00
2014
382
,225
–
–
–
17,7
75
40
0,0
00
–
–
–
4
00
,00
0
–
40
0,0
00
R M
yer
2015
162,
900
–
–
–
17
,10
0
180
,00
0
–
–
–
180
,00
0
–
180
,00
0
2014
163,
350
–
–
–
16
,650
1
80,0
00
–
–
–
1
80,0
00
–
1
80,0
00
A B
renn
an 20
15 16
2,90
0
–
–
–
17,1
00
1
80,0
00
–
–
–
1
80,0
00
–
1
80,0
00
2014
163,
350
–
–
–
16
,650
1
80,0
00
–
–
–
1
80,0
00
–
1
80,0
00
I Cor
nell(7
)
2015
135,
750
–
–
–
14
,250
1
50,0
00
–
–
–
1
50,0
00
–
1
50,0
00
2014
55,
017
–
–
–
5
,60
8 6
0,6
25
–
–
–
60
,625
–
6
0,6
25
C F
rogg
att 20
15 1
55,5
47
–
–
–
16,3
28
171,
875
–
–
–
171,
875
–
171,
875
2014
149,
738
–
–
–
15,
262
165,
00
0
–
–
–
165,
00
0
–
165,
00
0
P H
ay(8
)
2015
–
–
–
–
–
–
–
–
–
–
–
–
2014
131,
152
–
–
–
13,4
13
144,
565
–
–
–
144,
565
–
144,
565
R T
hor
n(9)
2015
121,
650
–
–
–
2
8,35
0
150
,00
0
–
–
–
150
,00
0
–
150
,00
0
2014
55,
017
–
–
–
5
,60
8 6
0,6
25
–
–
–
60
,625
–
6
0,6
25
Exec
utiv
e d
irec
tors
R U
mb
ers(1
0) 20
15 7
92,12
9 5
90,0
00
1
,372
–
2
5,0
45
1,4
08,
546
3,19
7 –
–
1
,411
,74
3 9
8,42
6 1,
510
,169
2014
–
–
–
–
–
–
–
–
–
–
–
–
B B
rook
es(1
1) 2015
2,3
38,0
56
–
245
,597
–
3
4,51
1 2
,618
,164
–
–
1,5
53,7
21
4,17
1,88
5 8
2,0
69
4,2
53,9
54
2014
1,8
43,
056
–
1
53,3
36
–
29,
44
4 2
,025
,836
6
0,8
97
–
–
2,0
86,7
33
484
,615
2
,571
,348
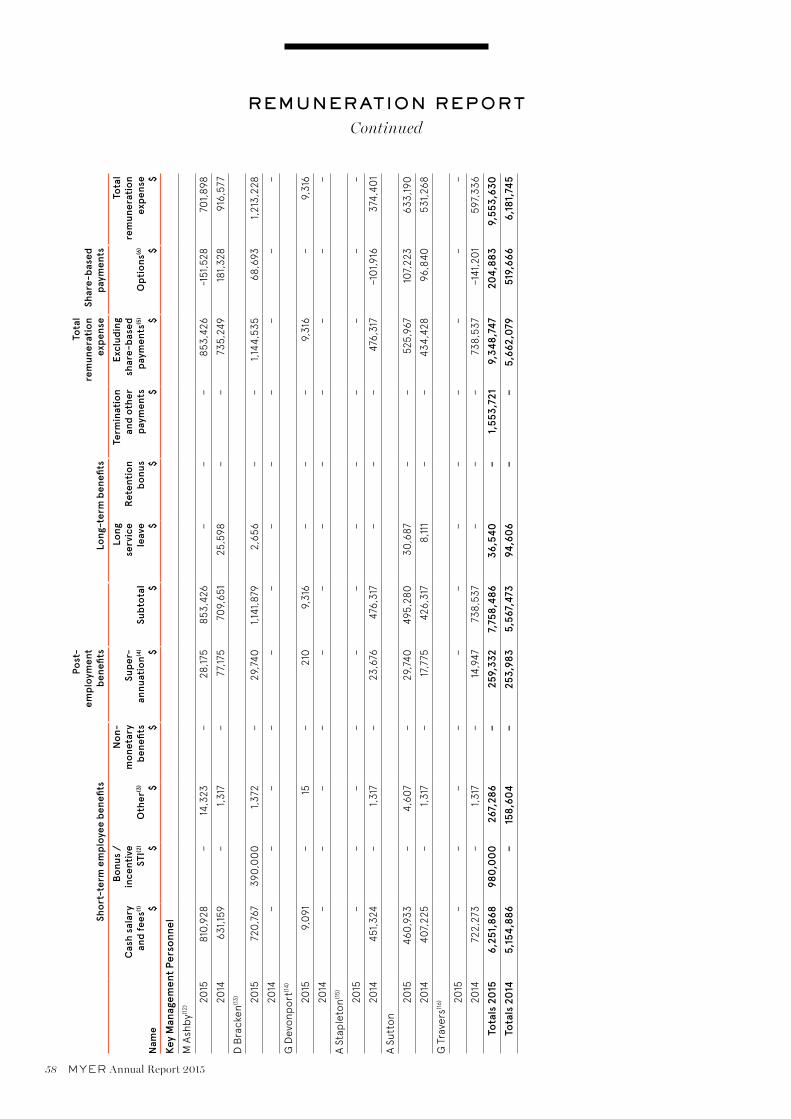
REMUNERATION REPORTContinued
58 MYER Annual Report 2015
Shor
t-te
rm e
mp
loye
e b
enefi
ts
Post
- em
plo
ymen
t b
enefi
tsLo
ng-t
erm
ben
efits
Tota
l re
mun
erat
ion
exp
ense
Shar
e-b
ased
p
aym
ents
Nam
e
Cas
h sa
lary
an
d fe
es(1
) $
Bon
us /
in
cent
ive
STI(2
) $O
ther
(3) $
Non
- m
onet
ary
ben
efits
$
Sup
er-
annu
atio
n(4) $
Sub
tota
l $
Long
se
rvic
e le
ave $
Ret
enti
on
bon
us $
Term
inat
ion
and
othe
r p
aym
ents
$
Excl
udin
g sh
are-
bas
ed
pay
men
ts(5
) $O
pti
ons(6
) $
Tota
l re
mun
erat
ion
exp
ense
$
Key
Man
agem
ent
Pers
onne
l
M A
shb
y(12)
2015
810
,928
–
14,3
23
– 2
8,17
5 8
53,4
26
–
––
853
,426
-1
51,5
28
70
1,89
8
2014
631
,159
–
1
,317
–
7
7,17
5 7
09,
651
25,
598
–
–
735
,249
1
81,3
28
916
,577
D B
rack
en(1
3) 2015
720
,767
3
90,0
00
1
,372
–
2
9,74
0
1,14
1,87
9 2
,656
–
–
1
,144,
535
68,
693
1,2
13,2
28
2014
–
–
–
–
–
–
–
–
–
–
–
–
G D
evon
po
rt(1
4)
2015
9,0
91
–
15
–
210
9
,316
–
–
–
9
,316
–
9
,316
2014
–
–
–
–
–
–
–
–
–
–
–
–
A St
aple
ton(1
5)
2015
–
–
–
–
–
–
–
–
–
–
–
–
2014
451
,324
–
1
,317
–
2
3,67
6 4
76,3
17
–
–
–
476
,317
–1
01,9
16
374
,40
1
A Su
tto
n
2015
460
,933
–
4
,607
–
2
9,74
0
495
,280
3
0,6
87
–
–
525
,967
1
07,2
23
633
,190
2014
407
,225
–
1
,317
–
17
,775
4
26,3
17
8,11
1 –
–
4
34,4
28
96,
840
5
31,2
68
G T
rave
rs(1
6) 2015
–
–
–
–
–
–
–
–
–
–
–
–
2014
722
,273
–
1
,317
–
14
,947
7
38,5
37
–
–
–
738
,537
–1
41,2
01
597
,336
Tota
ls 2
015
6,2
51,8
68
980
,00
0
267
,286
–
2
59,3
32
7,7
58,4
86 3
6,54
0
–
1,5
53,7
21
9,3
48,
747
20
4,88
3 9
,553
,630
Tota
ls 2
014
5,1
54,8
86
–
158
,60
4
–
253
,983
5
,567
,473
9
4,60
6 –
–
5
,662
,079
5
19,6
66
6,1
81,7
45

REMUNERATION REPORTContinued
MYER Annual Report 2015 59
(1) Cash salary includes short-term compensated absences, consideration for vehicle salary sacrifice and fees including allowances for Committee ‘chairman’ responsibilities for A Brennan and C Froggatt and Deputy Chairman fee for R Myer.
(2) STI payments relate to program performance and conditions for the year they were earned, not the year of actual payment. Due to performance, no STI payments were earned in the FY2015 year under the STI.
(3) Other payments for B Brookes include payments for rental subsidy and certain other services in relation to provision of accommodation. Other payments also include Company-paid FBT expenses.
(4) There were no post-employment benefits paid other than superannuation.
(5) Total remuneration expense excluding share-based payments reflects the accounting expense treatment of base salary, any bonuses or short term incentive payments, Fringe Benefit Tax expenses, superannuation, the balance of long service leave accruals, retention payments and any termination benefits in the reporting period.
(6) Remuneration in relation to share options and performance rights represents the amount expensed for the period based on valuations determined under AASB 2 Share-based Payment. This expense is based on the fair value at grant date, and reflects expectations of the number of options expected to vest. Where expectations change in relation to vesting, adjustment is made in the current period to reflect this change. As the equity grant may fully vest, partially vest or not vest at all, the benefit that the KMP ultimately realises is likely to be different to the amount disclosed in a particular year. The amount disclosed does not represent cash payments received in the period, and if vesting conditions are not met may result in reversal of the remuneration amount in a future period. There were no other equity-settled share-based payments and there were no cash-settled share-based payments.
(7) I Cornell was appointed as a non-executive director on 6 February 2014.
(8) P Hay retired as a non-executive director effective from 14 July 2014.
(9) R Thorn was appointed as a non-executive director on 6 February 2014.
(10) R Umbers was appointed as Chief Information and Supply Chain Officer on 1 September 2014 and promoted to CEO and Managing Director on 2 March 2015. Remuneration represents earnings from 1 September 2014.
(11) B Brookes was appointed as CEO and Managing Director on 17 April 2006 and ceased employment on 1 May 2015.
(12) M Ashby was appointed as CFO on 14 January 2008 and ceased employment on 22 May 2015.
(13) D Bracken was appointed as Chief Merchandise and Marketing Officer on 1 September 2014 and promoted to Deputy CEO on 2 March 2015.
(14) G Devonport was appointed as CFO on 22 July 2015.
(15) A Stapleton was promoted to Executive General Manager Merchandise on 4 February 2013 and ceased employment on 18 July 2014.
(16) G Travers was appointed as Executive General Manager Business Services on 1 November 2010 and ceased employment on 2 May 2014.

REMUNERATION REPORTContinued
60 MYER Annual Report 2015
STI AND LTI REMUNERATION
The table below sets out the relative proportion of remuneration for the executive directors and other KMP that is linked to
performance and the proportion which is fixed.
Total remuneration
expenseTotal fixed
remuneration At risk - STI(9)
At risk - LTI(1)
Share options Retention incentive
Name $ $ % $ % $ % $ %
Executive directors
R Umbers(2)
2015 1,510,169 821,743 54% 590,000 39% 98,426 7% - 0%
2014 - - 0% - 0% - 0% - 0%
B Brookes(3)
2015 4,253,954 4,171,885 98% - 0% 82,069 2% - 0%
2014 2,571,348 2,086,733 81% - 0% 484,615 19% - 0%
Key Management Personnel
M Ashby(4)
2015 701,898 853,426 122% - 0% -151,528 -22% - 0%
2014 916,577 735,249 80% - 0% 181,328 20% - 0%
D Bracken(5)
2015 1,213,228 754,535 62% 390,000 32% 68,693 6% - 0%
2014 - - 0% - 0% - 0% - 0%
G Devonport(6)
2015 9,316 9,316 100% - 0% - 0% - 0%
2014 - - 0% - 0% - 0% - 0%
A Stapleton(7)
2015 - - 0% - 0% - 0% - 0%
2014 374,401 476,317 127% - 0% -101,916 -27% - 0%
A Sutton
2015 633,190 525,967 83% - 0% 107,223 17% - 0%
2014 531,268 434,428 82% - 0% 96,840 18% - 0%
G Travers(8)
2015 - - 0% - 0% - 0% - 0%
2014 597,336 738,537 124% - 0% -141,201 -24% - 0%
Totals 2015 8,321,755 7,136,872 86% 980,000 12% 204,883 2% - 0%
Totals 2014 4,990,930 4,471,264 90% - 0% 519,666 10% - 0%
(1) LTI was provided through the issue of options and performance rights to individual executives under the MEIP. LTI allotments have been independently valued as at the date the option was granted to the executive. The proportions shown represent the amount expensed for the period under AASB 2 Share-based Payment as a proportion of total remuneration expense for the period. This amount also includes the current expense in relation to the retention bonuses. It does not reflect a cash payment to the executive under MEIP.
(2) R Umbers was appointed as Chief Information and Supply Chain Officer on 1 September 2014 and promoted to CEO and Managing Director on 2 March 2015.
(3) B Brookes was appointed as CEO and Managing Director on 17 April 2006 and ceased employment on 1 May 2015.
(4) M Ashby was appointed as CFO on 14 January 2008 and ceased employment on 22 May 2015.
(5) D Bracken was appointed as Chief Merchandise and Marketing Officer on 1 September 2014 and promoted to Deputy CEO on 2 March 2015.
(6) G Devonport was appointed as CFO on 22 July 2015.
(7) A Stapleton was promoted to Executive General Manager Merchandise on 4 February 2013 and ceased employment on 18 July 2014.
(8) G Travers was appointed as Executive General Manager Business Services on 1 November 2010 and ceased employment on 2 May 2014.
(9) Includes cash sign-on bonuses received.

REMUNERATION REPORTContinued
MYER Annual Report 2015 61
The number of options and rights over ordinary shares in the Company held during the financial period by each director of Myer
Holdings Limited and other KMP of the Group, including their personally-related parties, are set out below.
Opening balance
Granted as compen-
sation(1) Exercised Other
changes(2)
Closing balance
Vested and exercisable(3) Unvested
2015
Directors of Myer Holdings Limited
Paul McClintock AO - - - - - - -
Rupert Myer AO - - - - - - -
Bernard Brookes(4) 2,058,383 375,000 - (2,350,134) 83,249 - 83,249
Anne Brennan - - - - - - -
Chris Froggatt - - - - - - -
Ian Cornell - - - - - - -
Robert Thorn - - - - - - -
Richard Umbers(5) - 568,749 - - 568,749 568,749
Other Key Management Personnel of the Group
Mark Ashby(6) 634,339 300,000 - (934,339) - - -
Daniel Bracken(7) - 443,749 - 443,749 - 443,749
Grant Devonport(8) - - - - - - -
Anthony Sutton 457,279 225,000 - - 682,279 - 682,279
2014
Directors of Myer Holdings Limited
Paul McClintock AO - - - - - - -
Rupert Myer AO - - - - - - -
Bernard Brookes 9,438,777 - - (7,380,394) 2,058,383 - 2,058,383
Anne Brennan - - - - - - -
Chris Froggatt - - - - - - -
Ian Cornell(9) - - - - - - -
Peter Hay(10) - - - - - - -
Robert Thorn(9) - - - - - - -
Other Key Management Personnel of the Group
Mark Ashby 450,773 183,566 - - 634,339 - 634,339
Adam Stapleton(11) 326,073 99,650 (15,000) (410,723) - - -
Anthony Sutton 483,119 89,160 (115,000) - 457,279 - 457,279
Greg Travers(12) 450,773 146,853 - (597,626) - - -
(1) Options and performance rights granted during the year are outlined on page 53.
(2) Other changes comprise of (i) options and rights which have expired or forfeited during the period, (ii) balances held by new Key Management Personnel from the date of appointment and (iii) removes balances for those no longer regarded as Key Management Personnel.
(3) All vested options are exercisable at the end of the period.
(4) B Brookes was appointed as CEO and Managing Director on 17 April 2006 and ceased employment on 1 May 2015.
(5) R Umbers was appointed as Chief Information and Supply Chain Officer on 1 September 2014 and promoted to CEO and Managing Director on 2 March 2015.
(6) M Ashby was appointed as CFO on 14 January 2008 and ceased employment on 22 May 2015.
(7) D Bracken was appointed as Chief Merchandise and Marketing Officer on 1 September 2014 and promoted to Deputy CEO on 2 March 2015.
(8) G Devonport was appointed as CFO on 22 July 2015.
(9) I Cornell and R Thorn were appointed directors on 6 February 2014.
(10) P Hay retired as director effective 14 July 2014.
(11) A Stapleton was promoted to Executive General Manager Merchandise on 4 February 2013 and ceased employment on 18 July 2014.
(12) G Travers was appointed as Executive General Manager Business Services on 1 November 2010 and ceased employment on 2 May 2014.
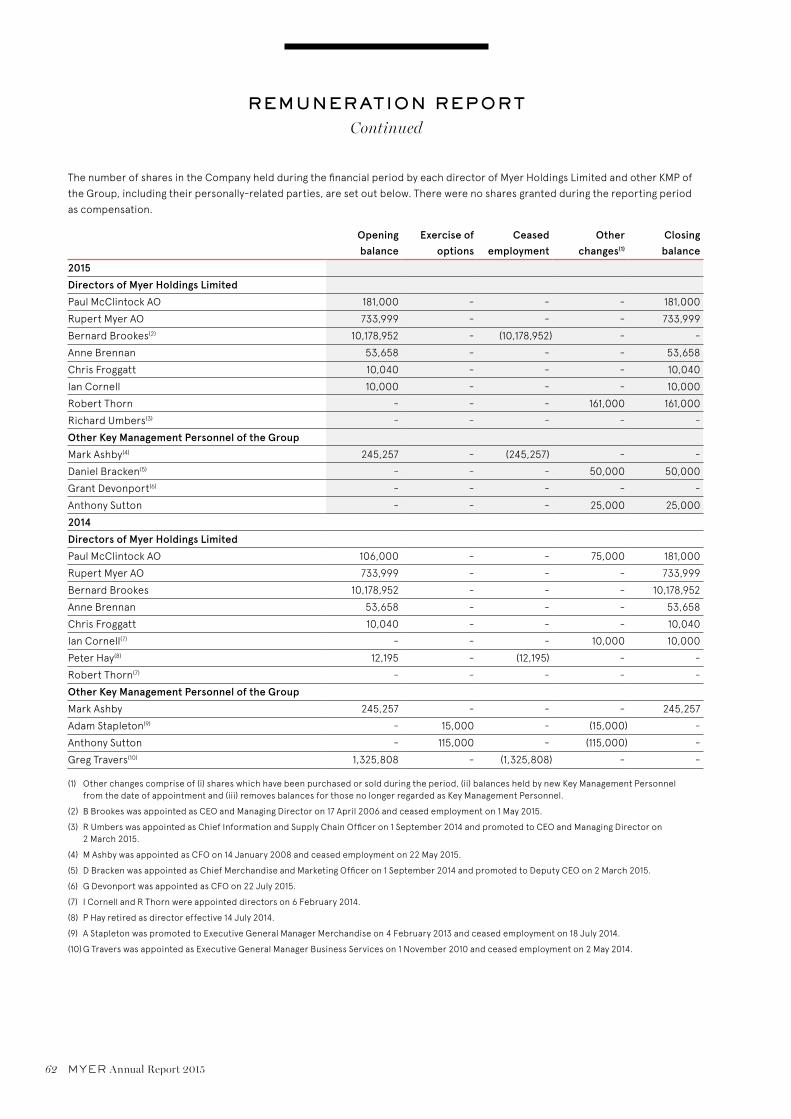
REMUNERATION REPORTContinued
62 MYER Annual Report 2015
The number of shares in the Company held during the financial period by each director of Myer Holdings Limited and other KMP of
the Group, including their personally-related parties, are set out below. There were no shares granted during the reporting period
as compensation.
Opening balance
Exercise of options
Ceased employment
Other changes(1)
Closing balance
2015
Directors of Myer Holdings Limited
Paul McClintock AO 181,000 - - - 181,000
Rupert Myer AO 733,999 - - - 733,999
Bernard Brookes(2) 10,178,952 - (10,178,952) - -
Anne Brennan 53,658 - - - 53,658
Chris Froggatt 10,040 - - - 10,040
Ian Cornell 10,000 - - - 10,000
Robert Thorn - - - 161,000 161,000
Richard Umbers(3) - - - - -
Other Key Management Personnel of the Group
Mark Ashby(4) 245,257 - (245,257) - -
Daniel Bracken(5) - - - 50,000 50,000
Grant Devonport(6) - - - - -
Anthony Sutton - - - 25,000 25,000
2014
Directors of Myer Holdings Limited
Paul McClintock AO 106,000 - - 75,000 181,000
Rupert Myer AO 733,999 - - - 733,999
Bernard Brookes 10,178,952 - - - 10,178,952
Anne Brennan 53,658 - - - 53,658
Chris Froggatt 10,040 - - - 10,040
Ian Cornell(7) - - - 10,000 10,000
Peter Hay(8) 12,195 - (12,195) - -
Robert Thorn(7) - - - - -
Other Key Management Personnel of the Group
Mark Ashby 245,257 - - - 245,257
Adam Stapleton(9) - 15,000 - (15,000) -
Anthony Sutton - 115,000 - (115,000) -
Greg Travers(10) 1,325,808 - (1,325,808) - -
(1) Other changes comprise of (i) shares which have been purchased or sold during the period, (ii) balances held by new Key Management Personnel from the date of appointment and (iii) removes balances for those no longer regarded as Key Management Personnel.
(2) B Brookes was appointed as CEO and Managing Director on 17 April 2006 and ceased employment on 1 May 2015.
(3) R Umbers was appointed as Chief Information and Supply Chain Officer on 1 September 2014 and promoted to CEO and Managing Director on 2 March 2015.
(4) M Ashby was appointed as CFO on 14 January 2008 and ceased employment on 22 May 2015.
(5) D Bracken was appointed as Chief Merchandise and Marketing Officer on 1 September 2014 and promoted to Deputy CEO on 2 March 2015.
(6) G Devonport was appointed as CFO on 22 July 2015.
(7) I Cornell and R Thorn were appointed directors on 6 February 2014.
(8) P Hay retired as director effective 14 July 2014.
(9) A Stapleton was promoted to Executive General Manager Merchandise on 4 February 2013 and ceased employment on 18 July 2014.
(10) G Travers was appointed as Executive General Manager Business Services on 1 November 2010 and ceased employment on 2 May 2014.

REMUNERATION REPORTContinued
MYER Annual Report 2015 63
LOANS
Details of loans made to directors of Myer Holdings Limited
and other KMP of the Group, including their personally-related
parties, are set out below.
Aggregates for KMP
(i) In 2015 and 2014 there were no loans to individuals
at any time.
Individuals with loans above $100,000 during the financial period
(ii) In 2015 and 2014 there were no loans to individuals that
exceeded $100,000 at any time.
OTHER TRANSACTIONS
There were no transactions with KMP or entities related to them,
other than compensation.
DEALING IN SECURITIES
Under the Company’s Guidelines for Dealing in Securities,
directors and senior executives are prohibited from entering into
hedging arrangements with respect to the Company’s securities.
A copy of the Guidelines for Dealing in Securities is available on
the Myer website, myer.com.au/investor.
64 MYER Annual Report 2015
Consolidated income statement 65
Consolidated statement of comprehensive income 66
Consolidated balance sheet 67
Consolidated statement of changes in equity 68
Consolidated statement of cash flows 69
Notes to the consolidated financial statements
A. Group performance
A1 Segment information 70
A2 Revenue 70
A3 Expenses 72
A4 Income tax 73
A5 Earnings per share 75
B. Working capital
B1 Trade and other receivables and prepayments 76
B2 Inventories 77
B3 Trade and other payables 77
C. Capital employed
C1 Property, plant and equipment 78
C2 Intangible assets 80
C3 Provisions 83
C4 Deferred income 86
D. Net debt
D1 Cash and cash equivalents 86
D2 Reconciliation of profit after income tax to
net cash inflow from operating activities 87
D3 Borrowings 87
E. Risk management
E1 Financial risk management 89
E2 Derivative financial instruments 93
F. Equity
F1 Contributed equity 96
F2 Retained earnings and reserves 98
F3 Dividends 99
G. Group structure
G1 Subsidiaries 100
G2 Deed of cross guarantee 101
G3 Parent entity financial information 104
H. Other information
H1 Contingencies 106
H2 Commitments 106
H3 Related party transactions 107
H4 Share-based payments 108
H5 Remuneration of auditors 110
H6 Events occurring after the reporting period 110
I. Other accounting policies 111
Directors’ declaration 116
F I N A N C I A L S TAT E M E N T S
for the period ended 25 July 2015

MYER Annual Report 2015 65
Notes
2015 52 weeks
$’000
2014
52 weeks
$’000
Total sales value (excluding GST) A2 3,195,626 3,143,027
Concession sales (501,153) (491,482)
Sale of goods (excluding GST) A2 2,694,473 2,651,545
Sales revenue deferred under customer loyalty program (40,122) (39 ,378)
Revenue from sale of goods (excluding GST) A2 2,654,351 2,612,167
Other operating revenue (excluding finance revenue) A2 131,423 128,769
Cost of goods sold (1,495,382) (1,455,066)
Operating gross profit 1,290,392 1,285,870
Other income 108 6,356
Selling expenses (828,906) (811,718)
Administration expenses (328,138) (320,204)
Strategic review, restructuring, store and brand exit costs and impairment of assets A3 (61,687) –
Earnings before interest and tax 71,769 160,304
Finance revenue A2 753 1,025
Finance costs A3 (23,488) (22,931)
Net finance costs (22,735) (21,906)
Profit before income tax 49,034 138,398
Income tax expense A4 (19,208) (39,856)
Profit for the period 29,826 98,542
Profit is attributable to:
Owners of Myer Holdings Limited 29,826 98,499
Non-controlling interests – 43
29,826 98,542
Cents Cents
Earnings per share attributable to the ordinary equity holders of the Company:
Basic earnings per share A5 5.1 16.8
Diluted earnings per share A5 5.1 16.6
The above consolidated income statement should be read in conjunction with the accompanying notes.
CONSOLIDATED INCOME STATEMENTfor the period ended 25 July 2015
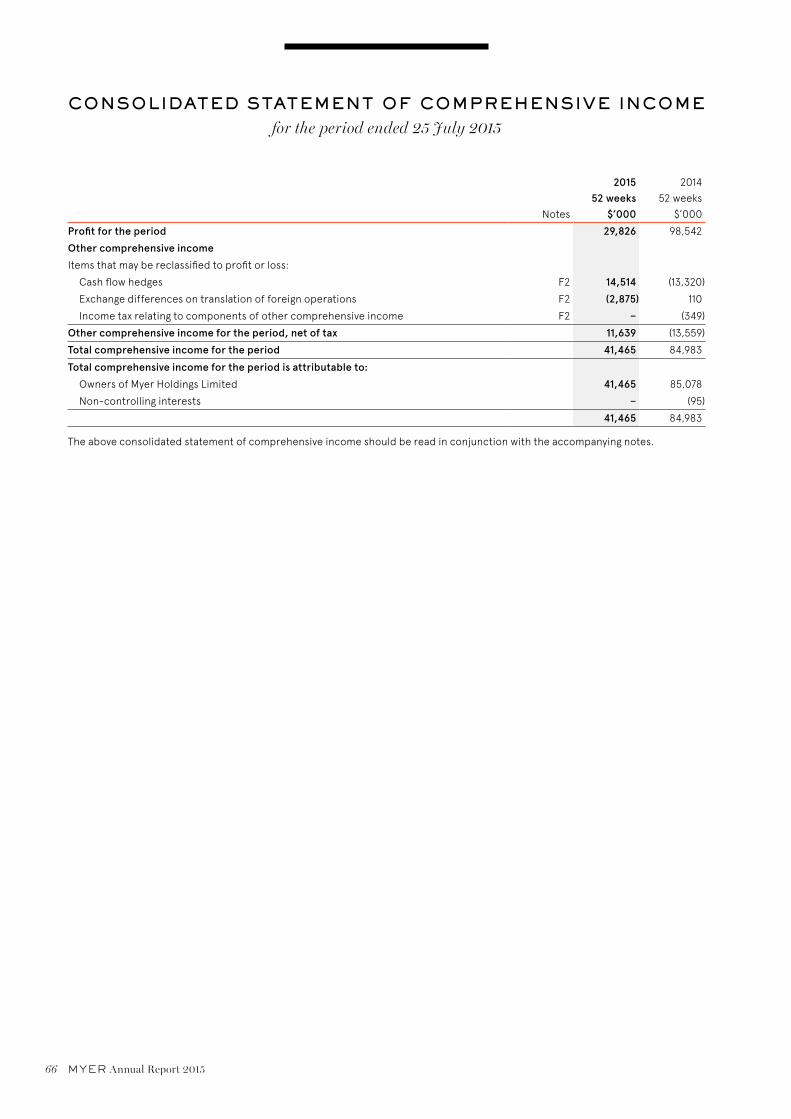
66 MYER Annual Report 2015
CONSOLIDATED STATEMENT OF COMPREHENSIVE INCOMEfor the period ended 25 July 2015
Notes
2015 52 weeks
$’000
2014
52 weeks
$’000
Profit for the period 29,826 98,542
Other comprehensive income
Items that may be reclassified to profit or loss:
Cash flow hedges F2 14,514 (13,320)
Exchange differences on translation of foreign operations F2 (2,875) 110
Income tax relating to components of other comprehensive income F2 – (349)
Other comprehensive income for the period, net of tax 11,639 (13,559)
Total comprehensive income for the period 41,465 84,983
Total comprehensive income for the period is attributable to:
Owners of Myer Holdings Limited 41,465 85,078
Non-controlling interests – (95)
41,465 84,983
The above consolidated statement of comprehensive income should be read in conjunction with the accompanying notes.

MYER Annual Report 2015 67
CONSOLIDATED BALANCE SHEETas at 25 July 2015
Notes
2015 $’000
2014
$’000
ASSETS
Current assets
Cash and cash equivalents D1 53,323 73,564
Trade and other receivables and prepayments B1 30,363 30,133
Inventories B2 381,907 376,763
Derivative financial instruments E2 15,211 –
Total current assets 480,804 480,460
Non-current assets
Property, plant and equipment C1 469,006 502,881
Deferred tax assets A4 18,016 13,698
Intangible assets C2 916,108 932,598
Other non-current assets 2,614 3,027
Total non-current assets 1,405,744 1,452,204
Total assets 1,886,548 1,932,664
LIABILITIES
Current liabilities
Trade and other payables B3 387,182 428,066
Derivative financial instruments E2 99 5,253
Current tax liabilities 512 7,321
Provisions C3 85,728 82,167
Deferred income C4 6,997 6,045
Other liabilities 871 2,029
Total current liabilities 481,389 530,881
Non-current liabilities
Borrowings D3 441,179 422,030
Derivative financial instruments E2 4,654 3,401
Provisions C3 21,198 14,039
Deferred income C4 75,112 68,900
Total non-current liabilities 542,143 508,370
Total liabilities 1,023,532 1,039,251
Net assets 863,016 893,413
EQUITY
Contributed equity F1 524,755 524,732
Retained earnings F2 335,366 378,751
Reserves F2 2,895 (10,070)
Capital and reserves attributable to owners of Myer Holdings Limited 863,016 893,413
Non-controlling interests – –
Total equity 863,016 893,413
The above consolidated balance sheet should be read in conjunction with the accompanying notes.

68 MYER Annual Report 2015
CONSOLIDATED STATEMENT OF CHANGES IN EQUITYfor the period ended 25 July 2015
Notes
Contributed equity $’000
Retained earnings
$’000Reserves
$’000
Non- controlling
interests $’000
Total $’000
Balance as at 27 July 2013 520,216 379,722 (4,024) 9,728 905,642
Net profit for the period – 98,499 – 43 98,542
Other comprehensive income for the period – – (13,421) (138) (13,559)
Total comprehensive income for the period – 98,499 (13,421) (95) 84,983
Transactions with owners in their capacity
as owners:
Contributions of equity, net of
transaction costs F1 4,516 – – – 4,516
Acquisition of non-controlling interests – – 6,029 (9,633) (3,604)
Dividends paid F3 – (99,470) – – (99,470)
Employee share schemes F2 – – 1,346 – 1,346
4,516 (99,470) 7,375 (9,633) (97,212)
Balance as at 26 July 2014 524,732 378,751 (10,070) – 893,413
Net profit for the period – 29,826 – – 29,826
Other comprehensive income for the period – – 11,639 – 11,639
Total comprehensive income for the period – 29,826 11,639 – 41,465
Transactions with owners in their capacity
as owners:
Contributions of equity, net of
transaction costs F1 23 – – – 23
Dividends paid F3 – (73,211) – – (73,211)
Employee share schemes F2 – – 1,326 – 1,326
23 (73,211) 1,326 – (71,862)
Balance as at 25 July 2015 524,755 335,366 2,895 – 863,016
The above consolidated statement of changes in equity should be read in conjunction with the accompanying notes.

MYER Annual Report 2015 69
CONSOLIDATED STATEMENT OF CASH FLOWSfor the period ended 25 July 2015
Notes
2015 52 weeks
$’000
2014
52 weeks
$’000
Cash flows from operating activities
Receipts from customers (inclusive of goods and services tax) 3,096,099 3,042,312
Payments to suppliers and employees (inclusive of goods and services tax) (2,946,252) (2,785,366)
149,847 256,946
Other income 108 6,356
Interest paid (22,601) (22,443)
Tax paid (30,439) (49,283)
Net cash inflow from operating activities D2 96,915 191,576
Cash flows from investing activities
Payments for property, plant and equipment (63,099) (50,112)
Acquisition of business – (2,999)
Payment for brands acquisition (1,000) (1,000)
Payments for intangible assets (17,276) (26,157)
Payment for acquisition of non-controlling interests – (33,363)
Lease incentives and contributions received 18,225 8,375
Interest received 800 1,006
Net cash outflow from investing activities (62,350) (104,250)
Cash flows from financing activities
Proceeds from borrowings, net of transaction costs 17,927 –
Proceeds from the issue of shares 23 4,516
Dividends paid to equity holders of the parent F3 (73,211) (99,470)
Other 455 (278)
Net cash outflow from financing activities (54,806) (95,232)
Net (decrease)/increase in cash and cash equivalents (20,241) (7,906)
Cash and cash equivalents at the beginning of the financial period 73,564 81,470
Cash and cash equivalents at end of period D1 53,323 73,564
The above consolidated statement of cash flows should be read in conjunction with the accompanying notes.

NOTES TO THE CONSOLIDATED FINANCIAL STATEMENTSfor the period ended 25 July 2015
70 MYER Annual Report 2015
A. GROUP PERFORMANCE
This section provides additional information regarding lines in the financial statements that are most relevant to explaining the
performance of the Group during the period, including the applicable accounting policies applied and significant estimates and
judgements made.
A1 SEGMENT INFORMATION
Management has determined the operating segments based on the reports reviewed by the Chief Executive Officer that are used
to make strategic decisions about the allocation of resources.
The Chief Executive Officer considers the business based on total store and product portfolio, and has identified that the Group
operates in Australia in the department store retail segment.
The Group also undertakes activities outside the department store retail business through its subsidiaries, sass & bide and FSS
Retail Pty Ltd. On the basis that this aspect of the business represents less than 10% of the total Group’s operations and has similar
economic characteristics to the department store retail business, it has not been disclosed as a separate reporting segment.
ACCOUNTING POLICY
Operating segments are reported in a manner consistent with the internal reporting provided to the chief operating decision
maker. The chief operating decision maker, who is responsible for allocating resources and assessing performance of the
operating segments, has been identified as the Chief Executive Officer.
A2 REVENUE
2015 52 weeks
$’000
2014
52 weeks
$’000
Sales revenue
Total sales value (excluding GST) 3,195,626 3,143,027
Concession sales (501,153) (491,482)
Sale of goods (excluding GST) 2,694,473 2,651,545
Sales revenue deferred under customer loyalty program (40,122) (39,378)
Revenue from sale of goods (excluding GST) 2,654,351 2,612,167
Other operating revenue
Concessions revenue 118,019 116,616
Other 13,404 12,153
131,423 128,769
Finance revenue
Interest revenue 753 1,025
Total revenue 2,786,527 2,741,961
Other includes revenue in relation to the gift card non-redemption income and forfeited lay-by deposits.

NOTES TO THE CONSOLIDATED FINANCIAL STATEMENTSfor the period ended 25 July 2015
MYER Annual Report 2015 71
A2 REVENUE (CONTINUED)
ACCOUNTING POLICY
Total sales value presented in the income statement represents proceeds from sale of goods (both from the Group and
concession operators) and prior to the deferral of revenue under the Myer customer loyalty program. Concession sales
presented in the income statement represents sales proceeds of concession operators within Myer stores. Total sales value
is disclosed to show the total sales generated by the Group and provide a basis of comparison with similar department stores.
Revenue from the sale of goods, excluding lay-by transactions, is recognised at the point of sale and is after deducting taxes
paid, and does not include concession sales. Allowance is made for expected sales returns based on past experience of returns
and expectations about the future. A provision for sales returns is recognised based on this assessment. Revenue from lay-by
transactions is recognised as part of revenue from the sale of goods at the date upon which the customer satisfies all payment
obligations and takes possession of the merchandise.
Revenue from sale of goods excludes concession sales in Myer stores on the basis that the inventory sold is owned by the
concession operator at the time of sale and not the Group. The Group’s share of concession sales is recognised as income
within other operating revenue at the time the sale is made.
Interest income is recognised on a time proportion basis using the effective interest method. Dividends are recognised
as revenue when the right to receive payment is established.
Critical accounting estimates and judgements – customer loyalty program
The Group operates a loyalty program where customers accumulate award points for purchases made which entitle them
to discounts on future purchases. The award points are recognised as a separately identifiable component of the initial sale
transaction, by allocating the fair value of the consideration received between the award points and the other components of
the sale such that the award points are recognised at their fair value. Revenue from the award points is recognised when the
points are redeemed. The amount of revenue is based on the number of points redeemed relative to the total number expected
to be redeemed. Award points expire 24 months after the initial sale.
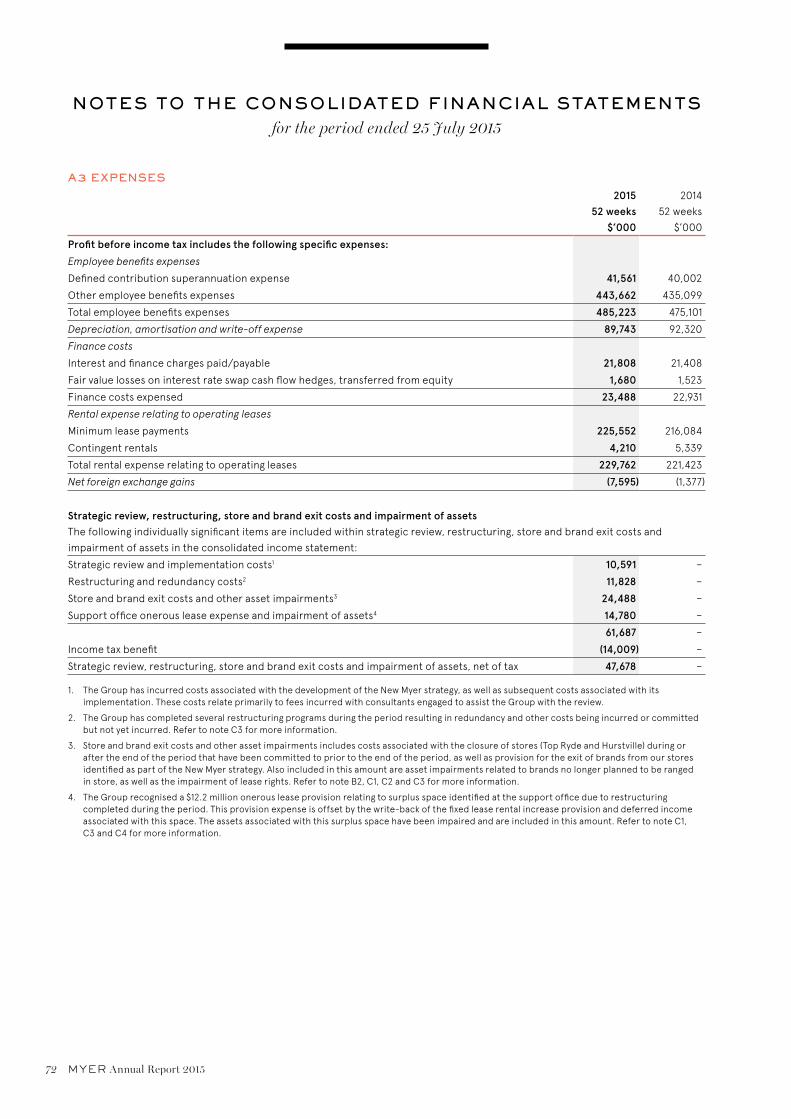
NOTES TO THE CONSOLIDATED FINANCIAL STATEMENTSfor the period ended 25 July 2015
72 MYER Annual Report 2015
A3 EXPENSES
2015 52 weeks
$’000
2014
52 weeks
$’000
Profit before income tax includes the following specific expenses:
Employee benefits expenses
Defined contribution superannuation expense 41,561 40,002
Other employee benefits expenses 443,662 435,099
Total employee benefits expenses 485,223 475,101
Depreciation, amortisation and write-off expense 89,743 92,320
Finance costs
Interest and finance charges paid/payable 21,808 21,408
Fair value losses on interest rate swap cash flow hedges, transferred from equity 1,680 1,523
Finance costs expensed 23,488 22,931
Rental expense relating to operating leases
Minimum lease payments 225,552 216,084
Contingent rentals 4,210 5,339
Total rental expense relating to operating leases 229,762 221,423
Net foreign exchange gains (7,595) (1,377)
Strategic review, restructuring, store and brand exit costs and impairment of assetsThe following individually significant items are included within strategic review, restructuring, store and brand exit costs and
impairment of assets in the consolidated income statement:
Strategic review and implementation costs1 10,591 –
Restructuring and redundancy costs2 11,828 –
Store and brand exit costs and other asset impairments3 24,488 –
Support office onerous lease expense and impairment of assets4 14,780 –
61,687 –
Income tax benefit (14,009) –
Strategic review, restructuring, store and brand exit costs and impairment of assets, net of tax 47,678 –
1. The Group has incurred costs associated with the development of the New Myer strategy, as well as subsequent costs associated with its implementation. These costs relate primarily to fees incurred with consultants engaged to assist the Group with the review.
2. The Group has completed several restructuring programs during the period resulting in redundancy and other costs being incurred or committed but not yet incurred. Refer to note C3 for more information.
3. Store and brand exit costs and other asset impairments includes costs associated with the closure of stores (Top Ryde and Hurstville) during or after the end of the period that have been committed to prior to the end of the period, as well as provision for the exit of brands from our stores identified as part of the New Myer strategy. Also included in this amount are asset impairments related to brands no longer planned to be ranged in store, as well as the impairment of lease rights. Refer to note B2, C1, C2 and C3 for more information.
4. The Group recognised a $12.2 million onerous lease provision relating to surplus space identified at the support office due to restructuring completed during the period. This provision expense is offset by the write-back of the fixed lease rental increase provision and deferred income associated with this space. The assets associated with this surplus space have been impaired and are included in this amount. Refer to note C1, C3 and C4 for more information.

NOTES TO THE CONSOLIDATED FINANCIAL STATEMENTSfor the period ended 25 July 2015
MYER Annual Report 2015 73
A3 EXPENSES (CONTINUED)
ACCOUNTING POLICY
The expenses disclosed above are also disclosed in the following sections of the financial statements:
> Employee benefits expenses – refer to note C3
> Depreciation and amortisation expense – refer to note C1 and C2
> Finance costs – refer to note D3 and E2
> Rental expense relating to operating leases – refer to note H2
> Net foreign exchange gains – refer to note I(c)
> Impairment of assets – inventory – refer to note B2
Individually Significant Items
Certain items have been separately disclosed and presented as Individually Significant based on the nature and/or impact these
items have on the Group’s financial performance for the period.
A4 INCOME TAX
2015 52 weeks
$’000
2014
52 weeks
$’000
(a) Income tax expense
(i) Income tax expense
Current tax 23,526 37,058
Deferred tax (4,318) 2,798
Income tax expense1 19,208 39,856
Deferred income tax expense included in income tax expense comprises:
(Increase)/decrease in deferred tax assets (4,344) 2,140
Increase/(decrease) in deferred tax liabilities 26 658
(4,318) 2,798
(ii) Numerical reconciliation of income tax expense to prima facie tax payable
Profit before income tax expense 49,034 138,398
Tax at the Australian tax rate of 30% (2014: 30%) 14,710 41,520
Tax effect of amounts which are not deductible (taxable) in calculating taxable income:
Non-deductible asset impairments 4,593 –
Sundry items (157) (1,777)
19,146 39,743
Adjustments for current tax of prior periods 62 113
Income tax expense1 19,208 39,856
1. Income tax expense includes an income tax benefit of $14 million (2014: nil) attributable to the strategic review, restructuring, store and brand exit costs and impairment of assets recorded during the period. Refer to note A3 for more information.
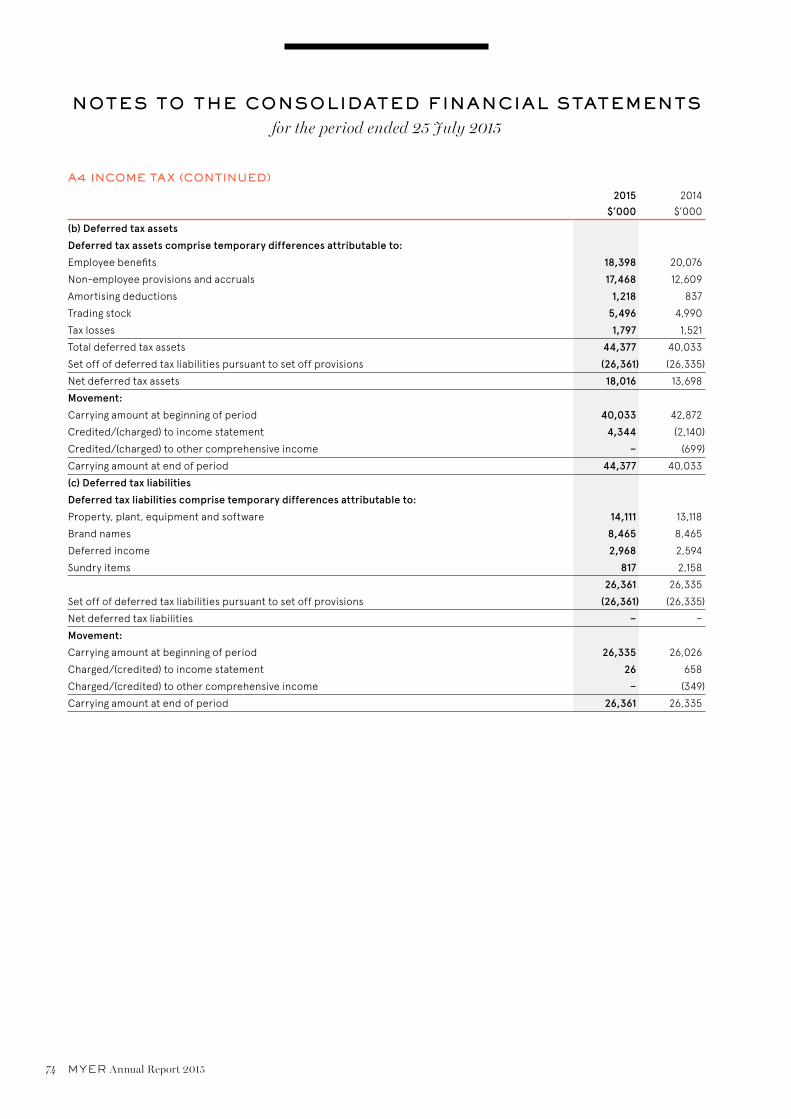
NOTES TO THE CONSOLIDATED FINANCIAL STATEMENTSfor the period ended 25 July 2015
74 MYER Annual Report 2015
A4 INCOME TAX (CONTINUED)
2015 $’000
2014
$’000
(b) Deferred tax assets
Deferred tax assets comprise temporary differences attributable to:
Employee benefits 18,398 20,076
Non-employee provisions and accruals 17,468 12,609
Amortising deductions 1,218 837
Trading stock 5,496 4,990
Tax losses 1,797 1,521
Total deferred tax assets 44,377 40,033
Set off of deferred tax liabilities pursuant to set off provisions (26,361) (26,335)
Net deferred tax assets 18,016 13,698
Movement:
Carrying amount at beginning of period 40,033 42,872
Credited/(charged) to income statement 4,344 (2,140)
Credited/(charged) to other comprehensive income – (699)
Carrying amount at end of period 44,377 40,033
(c) Deferred tax liabilities
Deferred tax liabilities comprise temporary differences attributable to:
Property, plant, equipment and software 14,111 13,118
Brand names 8,465 8,465
Deferred income 2,968 2,594
Sundry items 817 2,158
26,361 26,335
Set off of deferred tax liabilities pursuant to set off provisions (26,361) (26,335)
Net deferred tax liabilities – –
Movement:
Carrying amount at beginning of period 26,335 26,026
Charged/(credited) to income statement 26 658
Charged/(credited) to other comprehensive income – (349)
Carrying amount at end of period 26,361 26,335

NOTES TO THE CONSOLIDATED FINANCIAL STATEMENTSfor the period ended 25 July 2015
MYER Annual Report 2015 75
A4 INCOME TAX (CONTINUED)
ACCOUNTING POLICY
The income tax expense or revenue for the period is the tax payable on the current period’s taxable income based on the
national income tax rate adjusted by changes in deferred tax assets and liabilities attributable to temporary differences
between the tax bases of assets and liabilities and their carrying amounts in the financial statements, and to unused tax losses.
Deferred tax assets and liabilities are recognised for temporary differences at the tax rates expected to apply when the assets
are recovered or liabilities are settled, based on those tax rates which are enacted or substantively enacted. The relevant tax
rates are applied to the cumulative amounts of deductible and taxable temporary differences to measure the deferred tax asset
or liability. An exemption is made for certain temporary differences if they arose in a transaction, other than a business
combination, that at the time of the transaction did not affect accounting profit or taxable profit or loss.
Deferred tax assets are recognised for deductible temporary differences and unused tax losses only if it is probable that future
taxable amounts will be available to utilise those temporary differences and losses.
Deferred tax assets and liabilities are offset when there is a legally enforceable right to offset current tax assets and liabilities
and when the deferred tax balances relate to the same taxation authority. Current tax assets and tax liabilities are offset where
the entity has a legally enforceable right to offset and intends either to settle on a net basis, or to realise the asset and settle the
liability simultaneously.
Current and deferred tax balances attributable to amounts recognised in other comprehensive income or directly in equity are
also recognised directly in other comprehensive income or equity.
A5 EARNINGS PER SHARE
2015 cents
2014
cents
(a) Basic earnings per share
Total basic earnings per share attributable to the ordinary equity holders of the Company 5.1 16.8
(b) Diluted earnings per share
Total diluted earnings per share attributable to the ordinary equity holders of the Company 5.1 16.6
2015 $’000
2014
$’000
(c) Reconciliation of earnings used in calculating earnings per share
Earnings used in calculation of basic and diluted EPS attributable to ordinary shareholders 29,826 98,499
2015 Number
2014
Number
(d) Weighted average number of shares used as the denominator
Weighted average number of ordinary shares used as the denominator in calculating basic
earnings per share 585,683,950 585,253,946
Adjustments for calculation of diluted earnings per share:
Options and performance rights 4,640,752 6,748,120
Weighted average number of ordinary shares and potential ordinary shares used as the denominator
in calculating diluted earnings per share 590,324,702 592,002,066
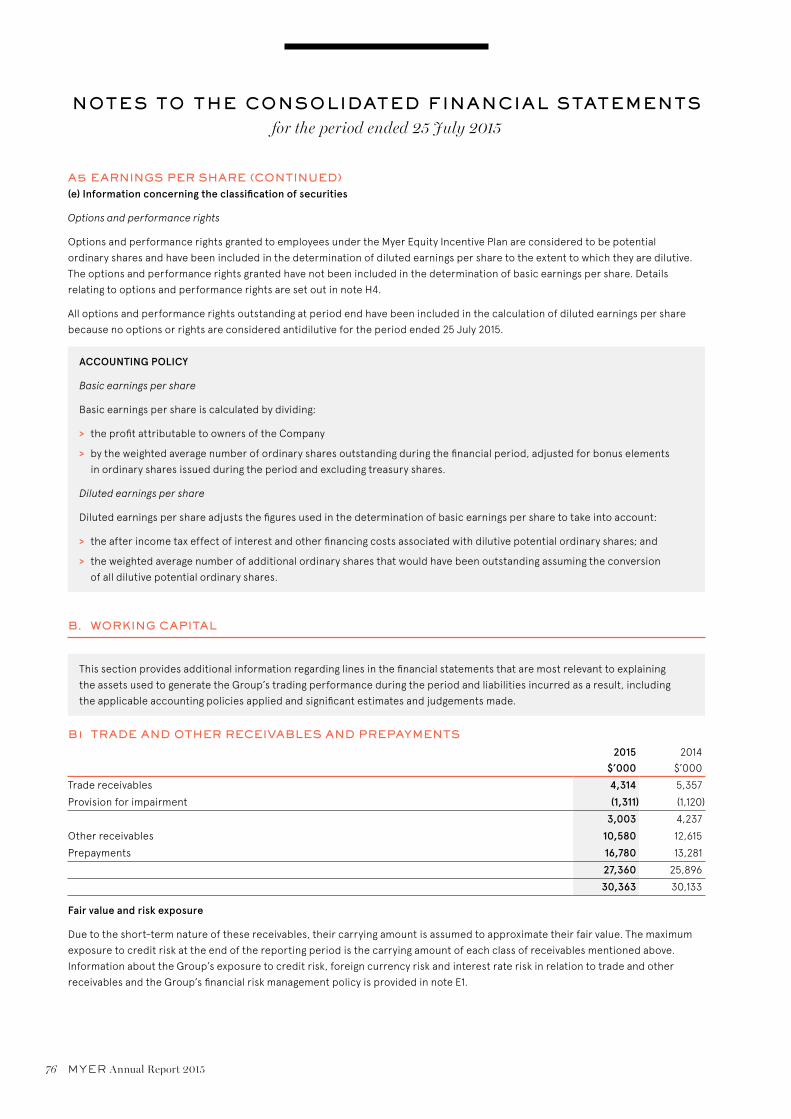
NOTES TO THE CONSOLIDATED FINANCIAL STATEMENTSfor the period ended 25 July 2015
76 MYER Annual Report 2015
A5 EARNINGS PER SHARE (CONTINUED)(e) Information concerning the classification of securities
Options and performance rights
Options and performance rights granted to employees under the Myer Equity Incentive Plan are considered to be potential
ordinary shares and have been included in the determination of diluted earnings per share to the extent to which they are dilutive.
The options and performance rights granted have not been included in the determination of basic earnings per share. Details
relating to options and performance rights are set out in note H4.
All options and performance rights outstanding at period end have been included in the calculation of diluted earnings per share
because no options or rights are considered antidilutive for the period ended 25 July 2015.
ACCOUNTING POLICY
Basic earnings per share
Basic earnings per share is calculated by dividing:
> the profit attributable to owners of the Company
> by the weighted average number of ordinary shares outstanding during the financial period, adjusted for bonus elements
in ordinary shares issued during the period and excluding treasury shares.
Diluted earnings per share
Diluted earnings per share adjusts the figures used in the determination of basic earnings per share to take into account:
> the after income tax effect of interest and other financing costs associated with dilutive potential ordinary shares; and
> the weighted average number of additional ordinary shares that would have been outstanding assuming the conversion
of all dilutive potential ordinary shares.
B. WORKING CAPITAL
This section provides additional information regarding lines in the financial statements that are most relevant to explaining
the assets used to generate the Group’s trading performance during the period and liabilities incurred as a result, including
the applicable accounting policies applied and significant estimates and judgements made.
B1 TRADE AND OTHER RECEIVABLES AND PREPAYMENTS
2015 $’000
2014
$’000
Trade receivables 4,314 5,357
Provision for impairment (1,311) (1,120)
3,003 4,237
Other receivables 10,580 12,615
Prepayments 16,780 13,281
27,360 25,896
30,363 30,133
Fair value and risk exposure
Due to the short-term nature of these receivables, their carrying amount is assumed to approximate their fair value. The maximum
exposure to credit risk at the end of the reporting period is the carrying amount of each class of receivables mentioned above.
Information about the Group’s exposure to credit risk, foreign currency risk and interest rate risk in relation to trade and other
receivables and the Group’s financial risk management policy is provided in note E1.
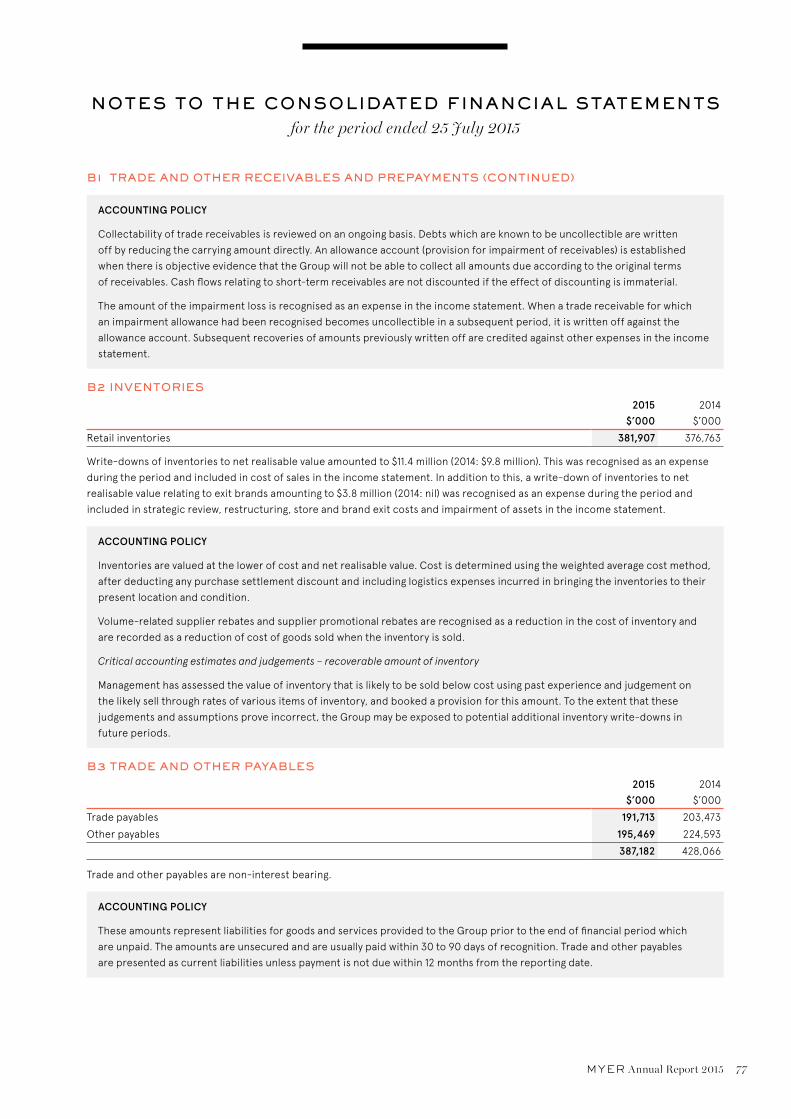
NOTES TO THE CONSOLIDATED FINANCIAL STATEMENTSfor the period ended 25 July 2015
MYER Annual Report 2015 77
B1 TRADE AND OTHER RECEIVABLES AND PREPAYMENTS (CONTINUED)
ACCOUNTING POLICY
Collectability of trade receivables is reviewed on an ongoing basis. Debts which are known to be uncollectible are written
off by reducing the carrying amount directly. An allowance account (provision for impairment of receivables) is established
when there is objective evidence that the Group will not be able to collect all amounts due according to the original terms
of receivables. Cash flows relating to short-term receivables are not discounted if the effect of discounting is immaterial.
The amount of the impairment loss is recognised as an expense in the income statement. When a trade receivable for which
an impairment allowance had been recognised becomes uncollectible in a subsequent period, it is written off against the
allowance account. Subsequent recoveries of amounts previously written off are credited against other expenses in the income
statement.
B2 INVENTORIES
2015 $’000
2014
$’000
Retail inventories 381,907 376,763
Write-downs of inventories to net realisable value amounted to $11.4 million (2014: $9.8 million). This was recognised as an expense
during the period and included in cost of sales in the income statement. In addition to this, a write-down of inventories to net
realisable value relating to exit brands amounting to $3.8 million (2014: nil) was recognised as an expense during the period and
included in strategic review, restructuring, store and brand exit costs and impairment of assets in the income statement.
ACCOUNTING POLICY
Inventories are valued at the lower of cost and net realisable value. Cost is determined using the weighted average cost method,
after deducting any purchase settlement discount and including logistics expenses incurred in bringing the inventories to their
present location and condition.
Volume-related supplier rebates and supplier promotional rebates are recognised as a reduction in the cost of inventory and
are recorded as a reduction of cost of goods sold when the inventory is sold.
Critical accounting estimates and judgements – recoverable amount of inventory
Management has assessed the value of inventory that is likely to be sold below cost using past experience and judgement on
the likely sell through rates of various items of inventory, and booked a provision for this amount. To the extent that these
judgements and assumptions prove incorrect, the Group may be exposed to potential additional inventory write-downs in
future periods.
B3 TRADE AND OTHER PAYABLES
2015 $’000
2014
$’000
Trade payables 191,713 203,473
Other payables 195,469 224,593
387,182 428,066
Trade and other payables are non-interest bearing.
ACCOUNTING POLICY
These amounts represent liabilities for goods and services provided to the Group prior to the end of financial period which
are unpaid. The amounts are unsecured and are usually paid within 30 to 90 days of recognition. Trade and other payables
are presented as current liabilities unless payment is not due within 12 months from the reporting date.

NOTES TO THE CONSOLIDATED FINANCIAL STATEMENTSfor the period ended 25 July 2015
78 MYER Annual Report 2015
C. CAPITAL EMPLOYED
This section provides additional information regarding lines in the financial statements that are most relevant to explaining the
capital investment made that allows the Group to generate its trading performance during the period and liabilities incurred as
a result, including the applicable accounting policies applied and significant estimates and judgements made.
C1 PROPERTY, PLANT AND EQUIPMENT
Freehold land
$’000
Freehold buildings
$’000
Fixtures and fittings
$’000
Plant and equipment
$’000
Capital works in progress
$’000Total
$’000
At 27 July 2013
Cost 10,100 19,500 410,474 357,863 25,330 823,267
Accumulated depreciation – (3,494) (182,151) (128,648) – (314,293)
Net book amount 10,100 16,006 228,323 229,215 25,330 508,974
Period ended 26 July 2014
Carrying amount at beginning of period 10,100 16,006 228,323 229,215 25,330 508,974
Additions – – 7,391 8,542 43,787 59,720
Additions – acquisition – – 162 – – 162
Transfer between classes – – 16,012 22,679 (38,136) 555
Assets written off – cost – – (11,831) (7,401) – (19,232)
Assets written off – accumulated depreciation – – 10,584 6,467 – 17,051
Assets disposal (500) – – – – (500)
Depreciation charge – (488) (34,605) (28,592) – (63,685)
Exchange differences – – 1 (4) (161) (164)
Carrying amount at end of period 9,600 15,518 216,037 230,906 30,820 502,881
At 26 July 2014
Cost 9,600 19,500 422,209 381,679 30,820 863,808
Accumulated depreciation – (3,982) (206,172) (150,773) – (360,927)
Net book amount 9,600 15,518 216,037 230,906 30,820 502,881
Period ended 25 July 2015
Carrying amount at beginning of period 9,600 15,518 216,037 230,906 30,820 502,881
Additions – – 15,796 9,107 16,375 41,278
Transfer between classes – – 14,689 23,812 (37,861) 640
Assets written off – cost – – (7,469) (6,309) – (13,778)
Assets written off – accumulated depreciation – – 5,524 4,193 – 9,717
Impairment1 – – (9,624) – – (9,624)
Depreciation charge – (488) (33,799) (27,732) – (62,019)
Exchange differences – – (271) 122 60 (89)
Carrying amount at end of period 9,600 15,030 200,883 234,099 9,394 469,006
At 25 July 2015
Cost 9,600 19,500 444,954 408,411 9,394 891,859
Accumulated depreciation and impairment – (4,470) (244,071) (174,312) – (422,853)
Net book amount 9,600 15,030 200,883 234,099 9,394 469,006
1. Impairment relates to assets associated with store closures, brand exits and support office onerous lease provision. Refer to note A3 for more information.

NOTES TO THE CONSOLIDATED FINANCIAL STATEMENTSfor the period ended 25 July 2015
MYER Annual Report 2015 79
C1 PROPERTY, PLANT AND EQUIPMENT (CONTINUED)
ACCOUNTING POLICY
Property, plant and equipment is stated at cost less depreciation. Cost includes expenditure that is directly attributable to
the acquisition of the items. Cost may also include transfers from equity of any gains/losses on qualifying cash flow hedges
of foreign currency purchases of property, plant and equipment.
Subsequent costs are included in the asset’s carrying amount or recognised as a separate asset, as appropriate, only when
it is probable that future economic benefits associated with the item will flow to the Group and the cost of the item can be
measured reliably. All other repairs and maintenance are charged to profit or loss during the financial period in which they
are incurred.
Land is not depreciated. Depreciation on other assets is calculated using the straight line method to allocate the cost net
of their residual values, over their estimated useful lives, as follows:
> Buildings 40 years (2014: 40 years)
> Fixtures and fittings 3 – 12.5 years (2014: 3 – 12.5 years)
> Plant and equipment, including leasehold improvements 10 – 20 years (2014: 10 – 20 years)
The assets’ residual values and useful lives are reviewed, and adjusted if appropriate, at the end of each reporting period.
An asset’s carrying amount is written down immediately to its recoverable amount if the asset’s carrying amount is greater than
its estimated recoverable amount (refer to note C2).
Gains and losses on disposals are determined by comparing proceeds with carrying amount. These are included in profit or loss.

NOTES TO THE CONSOLIDATED FINANCIAL STATEMENTSfor the period ended 25 July 2015
80 MYER Annual Report 2015
C2 INTANGIBLE ASSETS
Goodwill $’000
Brand names and
trademarks $’000
Software $’000
Lease rights
$’000 Total
$’000
At 27 July 2013
Cost 376,631 428,520 200,632 48,540 1,054,323
Accumulated amortisation – (2,218) (87,073) (34,015) (123,306)
Net book amount 376,631 426,302 113,559 14,525 931,017
Period ended 26 July 2014
Carrying amount at beginning of period 376,631 426,302 113,559 14,525 931,017
Additions – – 27,234 – 27,234
Additions – acquisition – 1,438 – – 1,438
Transfer between classes – – (555) – (555)
Assets written off – cost – – (2,822) – (2,822)
Assets written off – accumulated amortisation – – 918 – 918
Amortisation charge2 – (14) (20,853) (3,683) (24,550)
Exchange differences – – (82) – (82)
Carrying amount at end of period 376,631 427,726 117,399 10,842 932,598
At 26 July 2014
Cost 376,631 429,958 224,489 48,540 1,079,618
Accumulated amortisation – (2,232) (107,090) (37,698) (147,020)
Net book amount 376,631 427,726 117,399 10,842 932,598
Period ended 25 July 2015
Carrying amount at beginning of period 376,631 427,726 117,399 10,842 932,598
Additions – – 19,010 – 19,010
Transfer between classes – – (640) – (640)
Assets written off – cost – – (6,524) (22,754) (29,278)
Assets written off – accumulated amortisation – – 5,244 22,754 27,998
Impairment1 – (1,150) (514) (9,795) (11,459)
Amortisation charge2 – (301) (21,035) (1,047) (22,383)
Exchange differences – – 262 – 262
Carrying amount at end of period 376,631 426,275 113,202 – 916,108
At 25 July 2015
Cost 376,631 429,958 236,335 25,786 1,068,710
Accumulated amortisation and impairment – (3,683) (123,133) (25,786) (152,602)
Net book amount 376,631 426,275 113,202 – 916,108
1. Impairment relates to the impairment of the Charlie Brown brand and the impairment of lease right asset associated with one of our stores. Refer to note A3 for more information.
2. Amortisation of $22.4 million (2014: $24.5 million) is included in administration and selling expenses in the income statement.

NOTES TO THE CONSOLIDATED FINANCIAL STATEMENTSfor the period ended 25 July 2015
MYER Annual Report 2015 81
C2 INTANGIBLE ASSETS (CONTINUED)
Impairment tests for goodwill and intangibles with an indefinite useful life
The goodwill arising on the acquisition of the Myer business amounting to $349.5 million (2014: $349.5 million) cannot be allocated
to the Group’s individual cash generating units (the Group’s stores), and hence has been allocated to the Myer business as a whole.
Similarly, brand names which have an indefinite useful life and amounting to $402.8 million (2014: $402.8 million) have been allocated
to the Myer business as a whole.
AASB 136 Impairment of Assets requires goodwill and intangible assets with an indefinite useful life to be tested annually for
impairment. In testing these assets for impairment, the recoverable amount has been determined using a value in use calculation.
This calculation uses cash flow projections based on financial budgets approved by management covering a five-year period.
Cash flows beyond five-year periods are extrapolated using a terminal growth rate of 2.5%. Key assumptions used in the calculation
were as follows:
> discount rate (pre-tax) 14.4% (2014: 14.4%)
> terminal growth rate 2.5% (2014: 2.5%)
> operating gross profit margin 40% (2014: 41%)
The goodwill arising on the acquisition of the sass & bide business amounting to $27.1 million (2014: $27.1 million) cannot be allocated
to the individual cash generating units (the sass & bide stores), and hence has been allocated to the sass & bide business as a whole.
Similarly, the sass & bide brand name, which has an indefinite useful life and amounting to $23.5 million (2014: $23.5 million) has
been allocated to the sass & bide business as a whole. In testing these assets for impairment, the recoverable amount has been
determined using a value in use calculation. This calculation uses cash flow projections based on financial budgets approved by
management covering a five-year period. The discount rate and terminal growth rate assumptions used in the calculation are
consistent with those noted above.
Neither goodwill nor indefinite lived intangibles were impaired at the end of the reporting period. Sensitivity analysis on reasonably
possible changes in assumptions did not result in an outcome where an impairment would be required.
During the period, a review of the carrying value of the assets for each Myer store was undertaken and where indicators of
impairment were identified, the recoverable amount of these store assets was determined using a value in use calculation.
This calculation uses cash flow projections based on financial budgets approved by management covering a five-year period.
The key assumptions in the calculation are consistent with those noted above. Based on this, an impairment charge of $9.8 million
(2014: nil) was identified relating to lease right asset held.
Refer to note A3 for more information on other impairment charges recorded during the period.

NOTES TO THE CONSOLIDATED FINANCIAL STATEMENTSfor the period ended 25 July 2015
82 MYER Annual Report 2015
C2 INTANGIBLE ASSETS (CONTINUED)
ACCOUNTING POLICY
(i) Impairment of assets
Goodwill and intangible assets that have an indefinite useful life are not subject to amortisation and are tested annually
for impairment, or more frequently if events or changes in circumstances indicate that they might be impaired. Other
non-current assets are reviewed for impairment whenever events or changes in circumstances indicate that the carrying
amount may not be recoverable. An impairment loss is recognised for the amount by which the asset’s carrying amount exceeds
its recoverable amount. The recoverable amount is the higher of an asset’s fair value less costs to sell and value in use. For the
purposes of assessing impairment, assets are grouped at the lowest levels for which there are separately identifiable cash
inflows which are largely independent of the cash inflows from other assets or group of assets (cash generating units). For store
assets, the appropriate cash generating unit is an individual store. Non-financial assets other than goodwill that have previously
suffered an impairment are reviewed for possible reversal of the impairment at each reporting date.
(ii) Goodwill
Goodwill is measured as described in note I(d). Goodwill on acquisition of subsidiaries is included in intangible assets. Goodwill
is not amortised but it is tested for impairment annually, or more frequently if events or changes in circumstances indicate that
it might be impaired, and is carried at cost less accumulated impairment losses. Gains and losses on the disposal of an entity
include the carrying amount of goodwill relating to the entity sold.
(iii) Brand names and trade marks
The useful life of brands are assessed on acquisition. The brands which are not considered to have foreseeable brand maturity
dates have been assessed as having indefinite useful lives as there is a view that there is no foreseeable limit to
the period over which key brands are expected to generate net cash inflows for the entity. These brands are therefore
not amortised. Instead, these brand names are tested for impairment annually, or more frequently if events or changes
in circumstances indicate that they might be impaired, and are carried at cost less accumulated impairment losses.
Brands with a limited useful life are amortised over 5 years using the straight-line method and are carried at cost less
accumulated amortisation and impairment losses.
(iv) Computer software
All costs directly incurred in the purchase or development of major computer software or subsequent upgrades and material
enhancements, which can be reliably measured and are not integral to a related asset, are capitalised as intangible assets.
Direct costs may include internal payroll and on-costs for employees directly associated with the project. Costs incurred on
computer software maintenance or during the planning phase are expensed as incurred. Computer software
is amortised over the period of time during which the benefits are expected to arise, being 5 to 10 years.
(v) Lease rights
Lease rights represent the amount paid up front to take over store site leases from the existing lessee where such payments
are in addition to the ongoing payment of normal market lease rentals. Lease rights are amortised over the term of the lease
plus any renewal options reasonably certain to be utilised at the time of acquisition of the lease rights.
Critical accounting estimates and judgements – impairment
The Group tests annually whether goodwill and indefinite lived intangibles have suffered any impairment, in accordance
with the accounting policy noted above. The recoverable amount of cash generating units have been determined based
on value-in-use calculations at a store level. Goodwill and certain intangibles are tested for impairment at the level of the
Group as a whole, using calculations based on the use of assumptions.
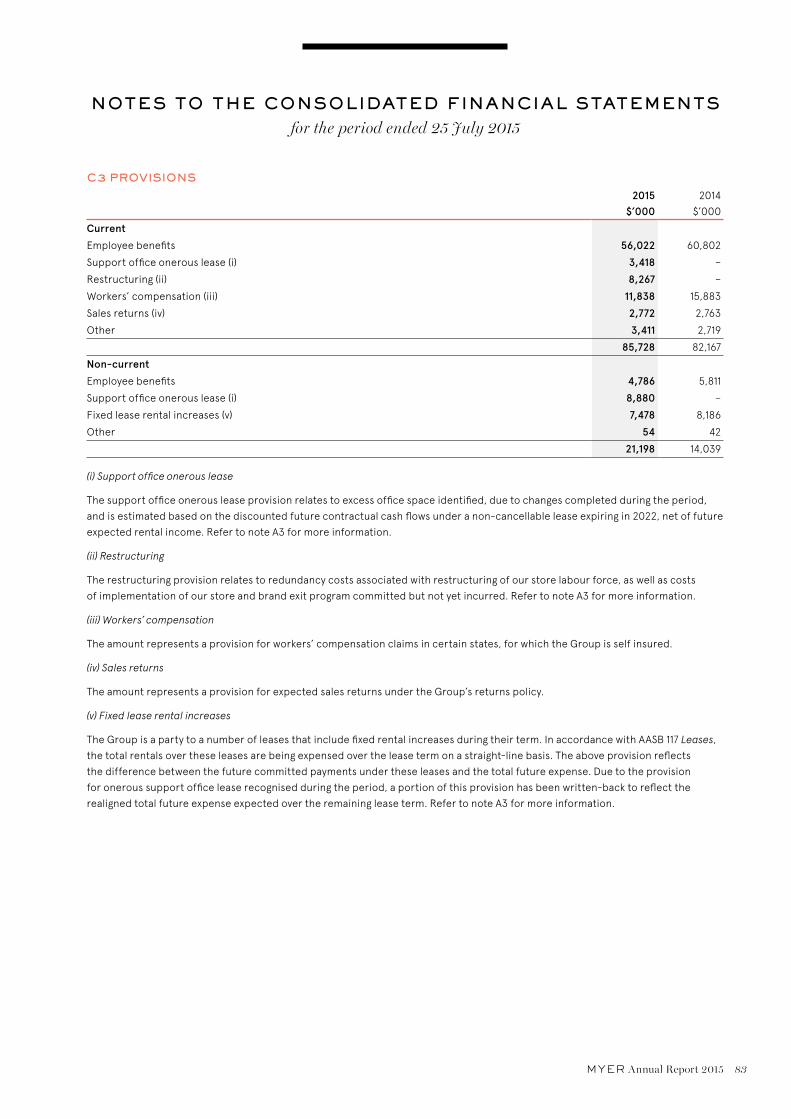
NOTES TO THE CONSOLIDATED FINANCIAL STATEMENTSfor the period ended 25 July 2015
MYER Annual Report 2015 83
C3 PROVISIONS
2015 $’000
2014
$’000
Current
Employee benefits 56,022 60,802
Support office onerous lease (i) 3,418 –
Restructuring (ii) 8,267 –
Workers’ compensation (iii) 11,838 15,883
Sales returns (iv) 2,772 2,763
Other 3,411 2,719
85,728 82,167
Non-current
Employee benefits 4,786 5,811
Support office onerous lease (i) 8,880 –
Fixed lease rental increases (v) 7,478 8,186
Other 54 42
21,198 14,039
(i) Support office onerous lease
The support office onerous lease provision relates to excess office space identified, due to changes completed during the period,
and is estimated based on the discounted future contractual cash flows under a non-cancellable lease expiring in 2022, net of future
expected rental income. Refer to note A3 for more information.
(ii) Restructuring
The restructuring provision relates to redundancy costs associated with restructuring of our store labour force, as well as costs
of implementation of our store and brand exit program committed but not yet incurred. Refer to note A3 for more information.
(iii) Workers’ compensation
The amount represents a provision for workers’ compensation claims in certain states, for which the Group is self insured.
(iv) Sales returns
The amount represents a provision for expected sales returns under the Group’s returns policy.
(v) Fixed lease rental increases
The Group is a party to a number of leases that include fixed rental increases during their term. In accordance with AASB 117 Leases,
the total rentals over these leases are being expensed over the lease term on a straight-line basis. The above provision reflects
the difference between the future committed payments under these leases and the total future expense. Due to the provision
for onerous support office lease recognised during the period, a portion of this provision has been written-back to reflect the
realigned total future expense expected over the remaining lease term. Refer to note A3 for more information.

NOTES TO THE CONSOLIDATED FINANCIAL STATEMENTSfor the period ended 25 July 2015
84 MYER Annual Report 2015
C3 PROVISIONS (CONTINUED)
Movement in provisions
Movement in each class of provision during the financial period, other than employee benefits, are set out below:
Support office
onerous lease
$’000Restructuring
$’000
Workers’ compensation
$’000
Sales returns
$’000
Fixed lease rental
increases $’000
Other $’000
Total $’000
2015
Carrying amount at beginning of
period – – 15,883 2,763 8,186 2,761 29,593
Additional provisions recognised 12,298 8,267 – 2,772 1,166 3,187 27,690
Provisions reversed – – (489) – (1,681) – (2,170)
Amounts utilised – – (3,556) (2,763) (193) (2,483) (8,995)
Carrying amount at end of period 12,298 8,267 11,838 2,772 7,478 3,465 46,118
Amounts not expected to be settled within the next 12 months
The current provision for employee benefits includes accrued annual leave and long service leave. For long service leave it covers all
unconditional entitlements where employees have completed the required period of service. The entire annual leave amount and
current portion of the long service leave provision is presented as current since the Group does not have an unconditional right to
defer settlement for any of these obligations. However, based on past experience, the Group does not expect all employees to take
the full amount of accrued long service leave or require payment within the next 12 months. The following amounts reflect leave that
is not expected to be taken or paid within the next 12 months.
2015 $’000
2014
$’000
Current long service leave obligations expected to be settled after 12 months 25,415 28,301
ACCOUNTING POLICY
Provisions
Provisions are recognised when the Group has a present legal or constructive obligation as a result of past events, it is probable
that an outflow of resources will be required to settle the obligation and the amount has been reliably estimated. Provisions are
not recognised for future operating losses.
Where there are a number of similar obligations, the likelihood that an outflow will be required in settlement is determined by
considering the class of obligations as a whole. A provision is recognised even if the likelihood of an outflow with respect to any
one item included in the same class of obligations may be small.
Provisions are measured at the present value of management’s best estimate of the expenditure required to settle the present
obligation at the end of the reporting period. The discount rate used to determine the present value reflects current market
assessments of the time value of money and the risks specific to the liability.
The Group is self-insured for costs relating to workers’ compensation and general liability claims in certain states. Provisions
are recognised based on claims reported, and an estimate of claims incurred but not yet reported, prior to balance date. These
provisions are determined utilising an actuarially determined method, which is based on various assumptions including but not
limited to future inflation, average claim size and claim administrative expenses. These assumptions are reviewed annually and
any reassessment of these assumptions will affect the workers’ compensation expense.

NOTES TO THE CONSOLIDATED FINANCIAL STATEMENTSfor the period ended 25 July 2015
MYER Annual Report 2015 85
C3 PROVISIONS (CONTINUED)
Employee benefits
(i) Short-term obligations
Liabilities for wages and salaries, including non-monetary benefits and annual leave expected to be settled within 12 months
after the end of the period in which the employees render the related service are recognised in respect of employees’ services
up to the end of the reporting period and are measured at the amounts expected to be paid when the liabilities are settled.
The liability for annual leave is recognised in the provision for employee benefits. All other short-term employee benefit
obligations are presented as payables.
(ii) Other long-term employee benefit obligations
The liability for long service leave which is not expected to be settled within 12 months after the end of the period in which the
employees render the related service is recognised in the provision for employee benefits and measured as the present value of
expected future payments to be made in respect of services provided by employees up to the end of the reporting period using
the projected unit credit method. Consideration is given to expected future wage and salary levels, experience of employee
departures and periods of service. Expected future payments are discounted using market yields at the end of the reporting
period on corporate bonds with terms to maturity and currency that match, as closely as possible, the estimated future cash
outflows.
The obligations are presented as current liabilities in the balance sheet if the entity does not have an unconditional right
to defer settlement for at least 12 months after the reporting date, regardless of when the actual settlement is expected
to occur.
(iii) Profit sharing and bonus plans
The Group recognises a liability and an expense for bonuses and profit sharing based on a formula that takes into consideration
the profit attributable to the Group’s shareholders after certain adjustments. The Group recognises a provision where
contractually obliged or where there is a past practice that has created a constructive obligation.
(iv) Termination benefits
Termination benefits are payable when employment is terminated before the normal retirement date, or when an employee
accepts voluntary redundancy in exchange for these benefits. The Group recognises termination benefits when it is
demonstrably committed to either terminating the employment of current employees according to a detailed formal plan
without possibility of withdrawal or providing termination benefits as a result of an offer made to encourage voluntary
redundancy. Benefits falling due more than 12 months after the end of the reporting period are discounted to present value.

NOTES TO THE CONSOLIDATED FINANCIAL STATEMENTSfor the period ended 25 July 2015
86 MYER Annual Report 2015
C4 DEFERRED INCOME
2015 $’000
2014
$’000
Current
Lease incentives and contributions 6,997 6,045
Non-current
Lease incentives and contributions 75,112 68,900
82,109 74,945
During the period, an onerous contract provision was recorded relating to excess office space identified under a non-cancellable
lease. This lease agreement included cash landlord contributions that the Group recorded as deferred income and has been
amortising on a straight-line basis over the term of the lease. The deferred income relating to the onerous space has been
written-back as part of the net support office onerous lease expense. Refer to note A3 for more information.
ACCOUNTING POLICY
A number of lease agreements for stores include cash contributions provided by the lessor for fit-outs as a lease incentive
or lease contribution. The asset additions from the fit-outs completed are recognised as fixtures and fittings at cost and
depreciated on a straight-line basis over the asset’s useful life. The lease incentive or lease contribution is presented as
deferred income and reversed on a straight-line basis over the lease term.
D. NET DEBT
This section provides additional information regarding lines in the financial statements that are most relevant to explaining the
net debt position and structure of the Group’s borrowings for the period, which are key to financing the Group’s activities both
now and for the future.
The net debt of the Group as at 25 July 2015 and 26 July 2014 is as follows:
2015 $’000
2014
$’000
Total borrowings 441,179 422,030
Less: cash and cash equivalents (53,323) (73,564)
Net debt 387,856 348,466
D1 CASH AND CASH EQUIVALENTS
2015 $’000
2014
$’000
Cash on hand 2,937 2,837
Cash at bank 50,386 70,727
53,323 73,564
ACCOUNTING POLICY
For the purpose of presentation in the statement of cash flows, cash and cash equivalents includes cash on hand, deposits
held at call with financial institutions, other short-term, highly liquid investments with original maturities of three months
or less that are readily convertible to known amounts of cash and which are subject to an insignificant risk of changes in value,
and bank overdrafts.

NOTES TO THE CONSOLIDATED FINANCIAL STATEMENTSfor the period ended 25 July 2015
MYER Annual Report 2015 87
D2 RECONCILIATION OF PROFIT AFTER INCOME TAX TO NET CASH INFLOW FROM OPERATING ACTIVITIES
2015 52 weeks
$’000
2014
52 weeks
$’000
Profit for the period 29,826 98,542
Depreciation and amortisation, including lease incentives and contributions 101,697 86,305
Interest income (753) (1,025)
Interest expense 1,221 1,233
Share-based payments expense 1,445 1,850
Net exchange differences (2,875) 110
Change in operating assets and liabilities
(Increase)/decrease in trade and other receivables (4,107) (6,418)
(Increase)/decrease in inventories (6,615) (11,049)
(Increase)/decrease in deferred tax asset (4,437) 2,294
(Increase)/decrease in derivative financial instruments (2,797) 1,924
(Decrease)/increase in trade and other payables (19,494) 31,151
(Decrease)/increase in current tax payable (6,809) (11,721)
Increase/(decrease) in provisions 10,720 (1,345)
(Decrease)/increase in other liabilities (107) (275)
Net cash inflow from operating activities 96,915 191,576
D3 BORROWINGS
2015 $’000
2014
$’000
Non-current borrowings
Bank loans 441,179 422,030
Total borrowings 441,179 422,030
(a) Structure of debt
The debt funding of the Group at 25 July 2015 comprised of a revolving cash advance syndicated facility of $600 million. This facility
was established on 29 October 2009, drawn down on 6 November 2009 and amended and restated on 3 June 2011 and 9 July 2013.
On 23 June 2015, the facility went through a third amendment and restatement which included extending the tenure and reducing
the limit. At balance date the following amounts were drawn:
2015 $’000
2014
$’000
Bank loans 445,000 425,000
Less: transaction costs (3,821) (2,970)
Borrowings 441,179 422,030
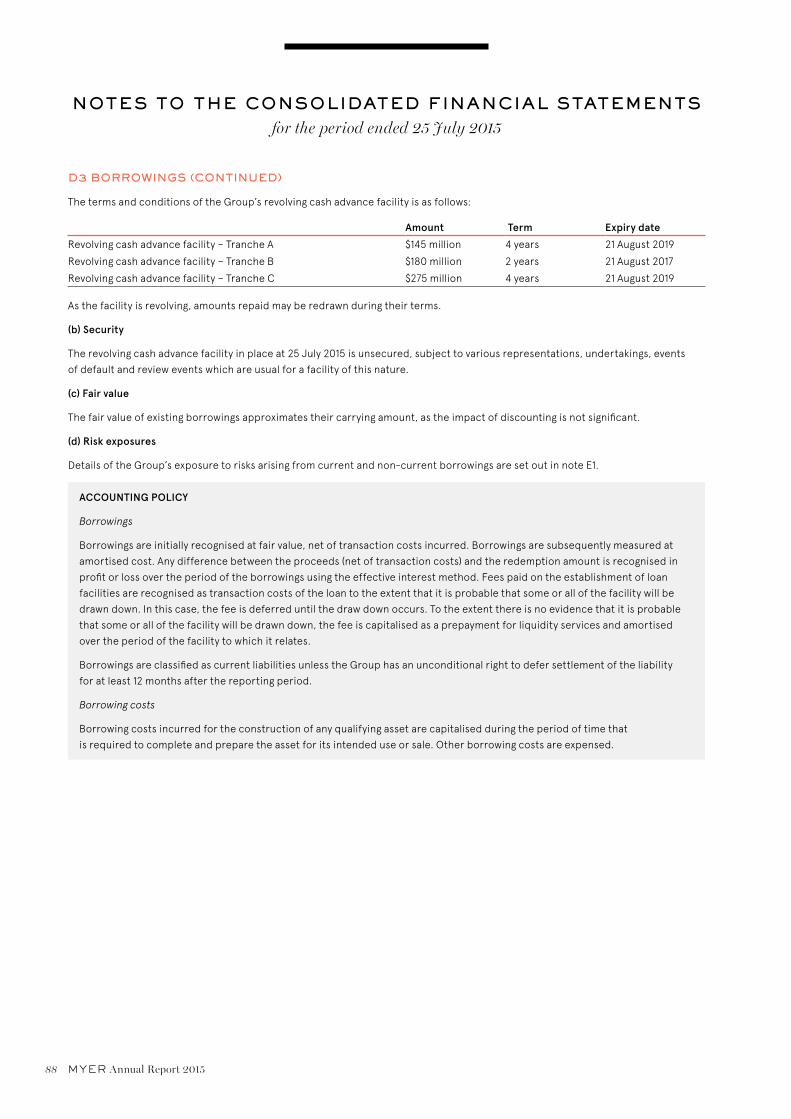
NOTES TO THE CONSOLIDATED FINANCIAL STATEMENTSfor the period ended 25 July 2015
88 MYER Annual Report 2015
D3 BORROWINGS (CONTINUED)
The terms and conditions of the Group’s revolving cash advance facility is as follows:
Amount Term Expiry date
Revolving cash advance facility – Tranche A $145 million 4 years 21 August 2019
Revolving cash advance facility – Tranche B $180 million 2 years 21 August 2017
Revolving cash advance facility – Tranche C $275 million 4 years 21 August 2019
As the facility is revolving, amounts repaid may be redrawn during their terms.
(b) Security
The revolving cash advance facility in place at 25 July 2015 is unsecured, subject to various representations, undertakings, events
of default and review events which are usual for a facility of this nature.
(c) Fair value
The fair value of existing borrowings approximates their carrying amount, as the impact of discounting is not significant.
(d) Risk exposures
Details of the Group’s exposure to risks arising from current and non-current borrowings are set out in note E1.
ACCOUNTING POLICY
Borrowings
Borrowings are initially recognised at fair value, net of transaction costs incurred. Borrowings are subsequently measured at
amortised cost. Any difference between the proceeds (net of transaction costs) and the redemption amount is recognised in
profit or loss over the period of the borrowings using the effective interest method. Fees paid on the establishment of loan
facilities are recognised as transaction costs of the loan to the extent that it is probable that some or all of the facility will be
drawn down. In this case, the fee is deferred until the draw down occurs. To the extent there is no evidence that it is probable
that some or all of the facility will be drawn down, the fee is capitalised as a prepayment for liquidity services and amortised
over the period of the facility to which it relates.
Borrowings are classified as current liabilities unless the Group has an unconditional right to defer settlement of the liability
for at least 12 months after the reporting period.
Borrowing costs
Borrowing costs incurred for the construction of any qualifying asset are capitalised during the period of time that
is required to complete and prepare the asset for its intended use or sale. Other borrowing costs are expensed.

NOTES TO THE CONSOLIDATED FINANCIAL STATEMENTSfor the period ended 25 July 2015
MYER Annual Report 2015 89
E. RISK MANAGEMENT
This section provides information relating to the Group’s exposure to various financial risks, how they could affect the Group’s
financial position and performance and how these risks are managed.
E1 FINANCIAL RISK MANAGEMENT
The Group’s activities expose it to a variety of financial risks: market risk (including currency risk, cash flow and fair value interest rate
risk), credit risk and liquidity risk. The Group’s overall risk management program focuses on the unpredictability of financial markets
and seeks to minimise potential adverse effects on the financial performance of the Group. The Group uses derivative financial
instruments such as foreign exchange contracts and interest rate swaps to hedge certain risk exposures. Derivatives are exclusively
used for hedging purposes, i.e. not as trading or other speculative instruments. The Group uses different methods to measure
different types of risk to which it is exposed. These methods include sensitivity analysis in the case of interest rate and foreign
exchange risk, and an aging analysis for credit risk.
Risk management is carried out by the Company under policies approved by the Board of Directors. The Company identifies,
evaluates and hedges financial risks. The Board provides written principles for overall risk management, as well as policies covering
specific areas, such as foreign exchange risk, interest rate risk, and use of financial instruments and non-derivative financial
instruments.
(a) Market risk
(i) Foreign exchange risk
Foreign exchange risk arises when future commercial transactions and recognised assets and liabilities are denominated in a
currency that is not the entity’s functional currency.
The Group sources inventory purchases overseas and is exposed to foreign exchange risk, particularly in relation to currency
exposures to the US dollar.
To minimise the effects of a volatile and unpredictable exchange rate, Group policy is to enter into forward exchange contracts in
relation to the Group’s overseas purchases for any 12-month period. The actual level of cover taken fluctuates depending on the
period until settlement of the foreign currency transaction, within the Board approved hedging policy. This policy allows cover to
be taken on a sliding scale between 25 – 100% depending on the period to maturity (up to 12 months).
The Group’s exposure to foreign currency risk at the end of the reporting period, expressed in Australian dollars, was as follows:
2015 2014
USD $’000
EURO $’000
GBP $’000
USD
$’000
EURO
$’000
GBP
$’000
Trade payables 18,016 433 89 26,425 585 44
Forward exchange contracts 172,803 6,637 – 183,151 – –
Group sensitivity
The Group applies a prudent cash flow hedging policy approach whereby all forward exchange contracts in relation to the Group’s
overseas purchases are designated as cash flow hedges at inception. Subsequent testing of effectiveness ensures that all effective
hedge movements flow through the cash flow hedge reserve within equity. Consistent with this approach, the sensitivity for
movements in foreign exchange rates for US dollar and Euro denominated financial instruments held at 25 July 2015, as detailed
in the above table, will flow through equity and will therefore have minimal impact on profit.
Other components of equity would have been $14.8 million lower/$17.9 million higher (2014: $14.4 million lower/$17.0 million higher)
had the Australian dollar strengthened/weakened by 10% against the US dollar and Euro, arising from foreign exchange contracts
designated as cash flow hedges. The Group’s exposure to other foreign exchange movements is not material.
These sensitivities were calculated based on the Group’s period end spot rate for the applicable reporting period.

NOTES TO THE CONSOLIDATED FINANCIAL STATEMENTSfor the period ended 25 July 2015
90 MYER Annual Report 2015
E1 FINANCIAL RISK MANAGEMENT (CONTINUED)
(ii) Cash flow and fair value interest rate risk
The Group is exposed to interest rate risk as it borrows funds at floating interest rates. Borrowings issued at floating rates expose
the Group to cash flow interest rate risk. The risk is managed by the use of floating to fixed interest rate swap contracts. During the
period, the Group policy was to fix the rates between 0 and 50% of its average gross debt. The Group complied with this policy
during the period.
Interest rate swaps have the economic effect of converting borrowings from floating rates to fixed rates. Generally, the Group raises
long-term borrowings at floating rates and swaps them into fixed rates. Under the interest rate swaps, the Group agrees with other
parties to exchange, at specified intervals (mainly quarterly), the difference between fixed rates and floating rate interest amounts
calculated by reference to the agreed notional principal amounts.
As at the end of the reporting period, the Group had the following variable rate borrowings and interest rate swap contracts
outstanding:
2015 2014
Weighted average
interest rate %
Balance $’000
Weighted
average
interest rate %
Balance
$’000
Borrowings – variable 3.6% 441,179 4.1% 422,030
Interest rate swaps (notional principal amount) 5.0% (200,000) 4.7% (200,000)
Net exposure to cash flow interest rate risk 241,179 222,030
The weighted average interest rates noted above for both borrowings and swaps are inclusive of margins applicable to the underlying
variable rate borrowings.
An analysis by maturities is provided in section (c) below.
Interest rate exposure is evaluated regularly to confirm alignment with Group policy and to ensure the Group is not exposed to
excess risk from interest rate volatility.
At 25 July 2015, if interest rates had changed by +/– 10% from the period end rates with all other variables held constant, post-tax
profit for the period would have been $0.4 million lower/$0.4 million higher (2014: $0.4 million lower/$0.4 million higher), mainly
as a result of higher/lower interest expense on borrowings.
Other components of equity would have been $0.6 million higher/$0.6 million lower (2014: $0.6 million higher/$0.6 million lower)
mainly as a result of an increase/decrease in the fair value of the cash flow hedges of borrowings.
The range of sensitivities has been assumed based on the Group’s experience of average interest rate fluctuations in the applicable
reporting period.
(b) Credit risk
Credit risk is managed on a Group basis. Credit risk arises from cash and cash equivalents, derivative financial instruments and
deposits with banks and financial institutions, as well as credit exposures to customers, including receivables and committed
transactions. For banks and financial institutions, only independently rated parties with a minimum rating of ‘A’ are accepted.
Sales to retail customers are primarily required to be settled in cash or using major credit cards, mitigating credit risk. Where
transactions are settled by way of lay-by arrangements, revenue is not recognised until full payment has been received from the
customer and goods collected.
The maximum exposure to credit risk at the end of the reporting period is the carrying amount of the financial assets as disclosed
in notes B1, D1 and E2.
The credit quality of financial assets that are neither past due nor impaired can be assessed by reference to external credit ratings
as detailed below, historical information about receivables default rates and current trading levels.

NOTES TO THE CONSOLIDATED FINANCIAL STATEMENTSfor the period ended 25 July 2015
MYER Annual Report 2015 91
E1 FINANCIAL RISK MANAGEMENT (CONTINUED)
Based on the credit history of these classes, it is expected that these amounts will be received and are not impaired.
2015 $’000
2014
$’000
Cash at bank and short-term bank deposits
AAA – –
AA 53,323 73,564
A – –
53,323 73,564
Derivative financial assets
AAA – –
AA 15,211 –
A – –
15,211 –
(c) Liquidity risk
Prudent liquidity risk management implies maintaining sufficient cash and marketable securities and the availability of funding
through an adequate amount of committed credit facilities to meet obligations when due and due to close out market positions.
Due to the seasonal nature of the retail business, the Group has in place flexible funding facilities to ensure liquidity risk
is minimised.
Financing arrangements
The Group had access to the following undrawn borrowing facilities at the end of the reporting period:
2015 $’000
2014
$’000
Floating rate
Expiring within one year (revolving cash advance facility) – –
Expiring beyond one year (revolving cash advance facility) 155,000 200,000
155,000 200,000
The long-term revolving cash advance facility comprises the following three tranches totalling $600 million with $445 million drawn
at period end:
> Tranche A $145 million, fully drawn expires on 21 August 2019
> Tranche B $180 million, fully drawn expires on 21 August 2017
> Tranche C $275 million, $120 million drawn expires on 21 August 2019
Maturities of financial liabilities
The tables below analyse the Group’s financial liabilities into relevant maturity groupings based on their contractual maturities for:
(a) all non-derivative financial liabilities; and
(b) net and gross settled derivative financial instruments for which the contractual maturities are essential for an understanding
of the timing of the cash flows.
The amounts disclosed in the table are the contractual undiscounted cash flows. Balances due within 12 months equal their carrying
amounts as the impact of discounting is not significant. For interest rate swaps, the cash flows have been estimated using forward
interest rates applicable at the end of the reporting period.
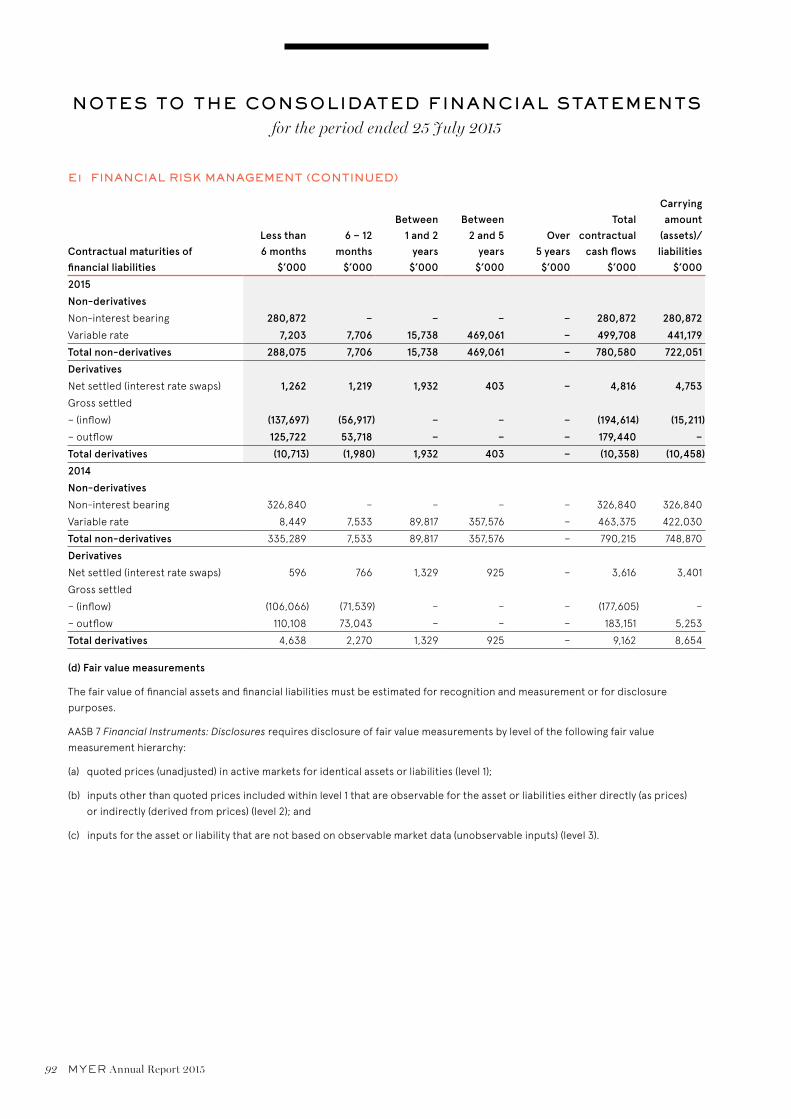
NOTES TO THE CONSOLIDATED FINANCIAL STATEMENTSfor the period ended 25 July 2015
92 MYER Annual Report 2015
E1 FINANCIAL RISK MANAGEMENT (CONTINUED)
Contractual maturities of financial liabilities
Less than 6 months
$’000
6 – 12 months
$’000
Between 1 and 2
years $’000
Between 2 and 5
years $’000
Over 5 years
$’000
Total contractual
cash flows $’000
Carrying amount
(assets)/ liabilities
$’000
2015
Non-derivatives
Non-interest bearing 280,872 – – – – 280,872 280,872
Variable rate 7,203 7,706 15,738 469,061 – 499,708 441,179
Total non-derivatives 288,075 7,706 15,738 469,061 – 780,580 722,051
Derivatives
Net settled (interest rate swaps) 1,262 1,219 1,932 403 – 4,816 4,753
Gross settled
– (inflow) (137,697) (56,917) – – – (194,614) (15,211)
– outflow 125,722 53,718 – – – 179,440 –
Total derivatives (10,713) (1,980) 1,932 403 – (10,358) (10,458)
2014
Non-derivatives
Non-interest bearing 326,840 – – – – 326,840 326,840
Variable rate 8,449 7,533 89,817 357,576 – 463,375 422,030
Total non-derivatives 335,289 7,533 89,817 357,576 – 790,215 748,870
Derivatives
Net settled (interest rate swaps) 596 766 1,329 925 – 3,616 3,401
Gross settled
– (inflow) (106,066) (71,539) – – – (177,605) –
– outflow 110,108 73,043 – – – 183,151 5,253
Total derivatives 4,638 2,270 1,329 925 – 9,162 8,654
(d) Fair value measurements
The fair value of financial assets and financial liabilities must be estimated for recognition and measurement or for disclosure
purposes.
AASB 7 Financial Instruments: Disclosures requires disclosure of fair value measurements by level of the following fair value
measurement hierarchy:
(a) quoted prices (unadjusted) in active markets for identical assets or liabilities (level 1);
(b) inputs other than quoted prices included within level 1 that are observable for the asset or liabilities either directly (as prices)
or indirectly (derived from prices) (level 2); and
(c) inputs for the asset or liability that are not based on observable market data (unobservable inputs) (level 3).

NOTES TO THE CONSOLIDATED FINANCIAL STATEMENTSfor the period ended 25 July 2015
MYER Annual Report 2015 93
E1 FINANCIAL RISK MANAGEMENT (CONTINUED)
The following tables present the Group’s assets and liabilities measured and recognised at fair value at 25 July 2015 and 26 July 2014:
Level 1 $’000
Level 2 $’000
Level 3 $’000
Total $’000
2015
Assets
Derivatives used for hedging – 15,211 – 15,211
Total assets – 15,211 – 15,211
Liabilities
Derivatives used for hedging – 4,753 – 4,753
Total liabilities – 4,753 – 4,753
2014
Assets
Derivatives used for hedging – – – –
Total assets – – – –
Liabilities
Derivatives used for hedging – 8,654 – 8,654
Total liabilities – 8,654 – 8,654
The fair value of financial instruments that are not traded in an active market (for example, over-the-counter derivatives) is
determined using valuation techniques which maximise the use of observable market data and rely as little as possible on
entity-specific estimates. The fair value of interest rate swaps is calculated as the present value of the estimated future cash flows.
The fair value of forward exchange contracts is determined using forward exchange market rates at the end of the reporting period.
These derivative financial instruments are included in level 2 as the significant inputs to fair value the instruments are observable.
The carrying amounts of trade receivables and payables are assumed to approximate their fair values due to their short-term nature.
The fair value of financial liabilities for disclosure purposes is estimated by discounting the future contractual cash flows at the
current market interest rate that is available to the Group for similar financial instruments.
E2 DERIVATIVE FINANCIAL INSTRUMENTS
2015 $’000
2014
$’000
Current assets
Forward foreign exchange contracts (i) 15,211 –
Total current derivative financial instrument assets 15,211 –
Current liabilities
Forward foreign exchange contracts (i) – 5,253
Interest rate swap contracts (ii) 99 –
Total current derivative financial instrument liabilities 99 5,253
Non-current liabilities
Interest rate swap contracts (ii) 4,654 3,401
Total non-current derivative financial instrument liabilities 4,654 3,401
(a) Instruments used by the Group
The Group is party to derivative financial instruments in the normal course of business in order to hedge exposure to fluctuations
in interest and foreign exchange rates in accordance with the Group’s financial risk management policies (refer to note E1).
(i) Forward exchange contracts – cash flow hedges
The Group makes purchases in numerous currencies, primarily US dollars. In order to protect against exchange rate movements,
the Group has entered into forward exchange contracts to purchase US dollars and Euro.

NOTES TO THE CONSOLIDATED FINANCIAL STATEMENTSfor the period ended 25 July 2015
94 MYER Annual Report 2015
E2 DERIVATIVE FINANCIAL INSTRUMENTS (CONTINUED)
These contracts are hedging highly probable forecasted purchases for the ensuing financial period. The contracts are timed to
mature when payments for shipments of inventory are scheduled to be made.
The portion of the gain or loss on the hedging instrument that is determined to be an effective hedge is recognised directly in equity.
When the cash flows occur, the Group adjusts the initial measurement of the inventory recognised in the balance sheet by the
related amount deferred in equity.
During the period ended 25 July 2015 nil (2014: nil) was reclassified from equity and included in the cost of inventory. There was no
hedge ineffectiveness in the current or prior period.
(ii) Interest rate swap contracts
Bank loans of the Group currently bear an average variable interest rate of 3.56% (2014: 4.12%). It is the Group’s policy to protect part
of the loans from exposure to increasing interest rates. Accordingly, the Group has entered into interest rate swap contracts under
which it is obliged to receive interest at variable rates and to pay interest at fixed rates.
Swaps currently in place cover approximately 44.9% (2014: 47.1%) of the Group’s drawn debt facility (refer to note D3 for details of the
Group’s borrowings). The notional principal amounts used in the swap agreements match the terms of the debt facilities. Under the
swap agreements, the fixed interest rates range between 2.97% and 3.9% (2014: 2.97% and 3.99%) and the variable rates are based on
the Bank Bill Swap Rate bid (BBSY Bid).
The contracts require settlement of net interest receivable or payable each three months. The contracts are settled on a net basis.
The gain or loss from remeasuring the hedging instruments at fair value is deferred in equity in the hedging reserve, to the extent
that the hedge is effective, and reclassified into the income statement when the hedged interest expense is recognised. In the
period ended 25 July 2015, $1.7 million was reclassified in profit and loss (2014: $1.5 million) and included in finance cost. There was
no hedge ineffectiveness in the current period.
(b) Risk exposures
Information about the Group’s exposure to credit risk, foreign exchange and interest rate risk is provided in note E1. The maximum
exposure to credit risk at the end of the reporting period is the carrying amount of each class of derivative financial assets
mentioned above.
ACCOUNTING POLICY
Derivatives are initially recognised at fair value on the date a derivative contract is entered into and are subsequently
remeasured to their fair value at the end of each reporting period. The accounting for subsequent changes in fair value depends
on whether the derivative is designated as a hedging instrument, and if so, the nature of the item being hedged. The Group
designates certain derivatives as either:
> hedges of the fair value of recognised assets or liabilities or a firm commitment (fair value hedges); or
> hedges of the cash flows or recognised assets or liabilities and highly probable forecast transactions (cash flow hedges).
The Group documents at the inception of the hedging transaction the relationship between hedging instruments and hedged
items, as well as its risk management objective and strategy for undertaking various hedge transactions. The Group also
documents its assessments, both at hedge inception and on an ongoing basis, of whether the derivatives that are used in
hedging transactions have been and will continue to be highly effective in offsetting changes in fair values or cash flows of
hedged items.

NOTES TO THE CONSOLIDATED FINANCIAL STATEMENTSfor the period ended 25 July 2015
MYER Annual Report 2015 95
E2 DERIVATIVE FINANCIAL INSTRUMENTS (CONTINUED)
ACCOUNTING POLICY (CONTINUED)
The full fair value of a hedging derivative is classified as a non-current asset or liability when the remaining maturity of the
hedged item is more than 12 months. It is classified as a current asset or liability when the remaining maturity of the hedged
item is less than 12 months.
(i) Fair value hedge
Changes in the fair value of derivatives that are designated and qualify as fair value hedges are recorded in the income
statement, together with any changes in the fair value of the hedged asset or liability that are attributable to the hedged risk.
The gain or loss relating to the effective portion of interest rate swaps hedging fixed rate borrowings is recognised in profit or
loss within finance costs, together with changes in the fair value of the hedged fixed rate borrowings attributable to interest rate
risk. The gain or loss relating to the ineffective portion is recognised in profit or loss.
If the hedge no longer meets the criteria for hedge accounting, the adjustment to the carrying amount of a hedge item for
which the effective interest method is used is amortised to profit or loss over the period to maturity using a recalculated
effective interest rate.
(ii) Cash flow hedge
The Group uses derivative financial instruments to hedge its exposure to foreign exchange and interest rate risks arising from
operational and financing activities.
The effective portion of changes in the fair value of derivatives that are designated and qualify as cash flow hedges is recognised
in equity in the hedging reserve. The gain or loss relating to the ineffective portion is recognised immediately
in profit or loss.
Amounts accumulated in equity are reclassified to profit or loss in the periods when the hedged item affects profit or loss.
When the forecast transaction that is hedged results in the recognition of a non-financial asset (for example, inventory or fixed
assets) the gains and losses previously deferred in equity are transferred from equity and included in the initial measurement
of the cost of the asset. The deferred amounts are ultimately recognised in profit or loss as cost of goods sold in the case of
inventory, or as depreciation in the case of fixed assets.
The gain or loss relating to the effective portion of the interest rate swaps hedging variable rate borrowings is recognised
in profit or loss within finance costs.
When a hedging instrument expires or is sold or terminated, or when a hedge no longer meets the criteria for hedge accounting,
any cumulative gain or loss existing in equity at that time remains in equity and is recognised when the forecast transaction is
ultimately recognised in profit or loss. When a forecast transaction is no longer expected to occur, the cumulative gain or loss
that was reported in equity is immediately reclassified to profit or loss.
(iii) Derivatives that do not qualify for hedge accounting
Certain derivative instruments do not qualify for hedge accounting. Changes in the fair value of any derivative instrument that
does not qualify for hedge accounting are recognised immediately in profit or loss.
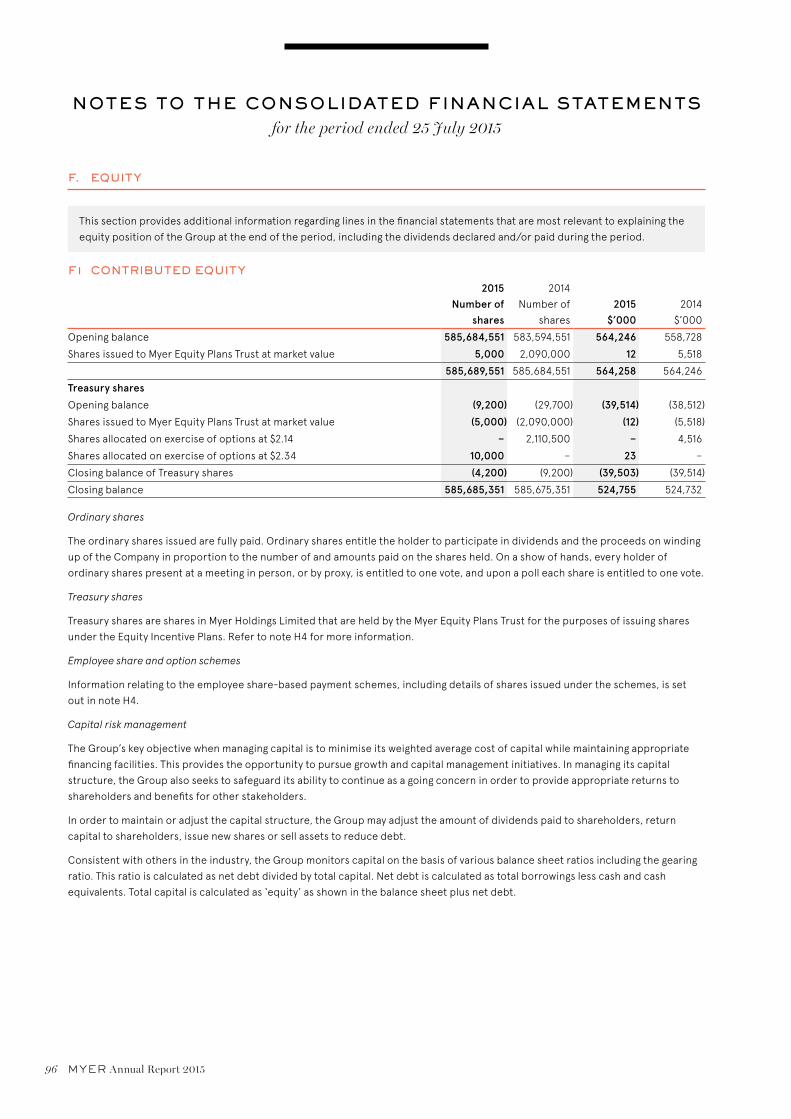
NOTES TO THE CONSOLIDATED FINANCIAL STATEMENTSfor the period ended 25 July 2015
96 MYER Annual Report 2015
F. EQUITY
This section provides additional information regarding lines in the financial statements that are most relevant to explaining the
equity position of the Group at the end of the period, including the dividends declared and/or paid during the period.
F1 CONTRIBUTED EQUITY
2015 Number of
shares
2014
Number of
shares
2015 $’000
2014
$’000
Opening balance 585,684,551 583,594,551 564,246 558,728
Shares issued to Myer Equity Plans Trust at market value 5,000 2,090,000 12 5,518
585,689,551 585,684,551 564,258 564,246
Treasury shares
Opening balance (9,200) (29,700) (39,514) (38,512)
Shares issued to Myer Equity Plans Trust at market value (5,000) (2,090,000) (12) (5,518)
Shares allocated on exercise of options at $2.14 – 2,110,500 – 4,516
Shares allocated on exercise of options at $2.34 10,000 – 23 –
Closing balance of Treasury shares (4,200) (9,200) (39,503) (39,514)
Closing balance 585,685,351 585,675,351 524,755 524,732
Ordinary shares
The ordinary shares issued are fully paid. Ordinary shares entitle the holder to participate in dividends and the proceeds on winding
up of the Company in proportion to the number of and amounts paid on the shares held. On a show of hands, every holder of
ordinary shares present at a meeting in person, or by proxy, is entitled to one vote, and upon a poll each share is entitled to one vote.
Treasury shares
Treasury shares are shares in Myer Holdings Limited that are held by the Myer Equity Plans Trust for the purposes of issuing shares
under the Equity Incentive Plans. Refer to note H4 for more information.
Employee share and option schemes
Information relating to the employee share-based payment schemes, including details of shares issued under the schemes, is set
out in note H4.
Capital risk management
The Group’s key objective when managing capital is to minimise its weighted average cost of capital while maintaining appropriate
financing facilities. This provides the opportunity to pursue growth and capital management initiatives. In managing its capital
structure, the Group also seeks to safeguard its ability to continue as a going concern in order to provide appropriate returns to
shareholders and benefits for other stakeholders.
In order to maintain or adjust the capital structure, the Group may adjust the amount of dividends paid to shareholders, return
capital to shareholders, issue new shares or sell assets to reduce debt.
Consistent with others in the industry, the Group monitors capital on the basis of various balance sheet ratios including the gearing
ratio. This ratio is calculated as net debt divided by total capital. Net debt is calculated as total borrowings less cash and cash
equivalents. Total capital is calculated as ‘equity’ as shown in the balance sheet plus net debt.

NOTES TO THE CONSOLIDATED FINANCIAL STATEMENTSfor the period ended 25 July 2015
MYER Annual Report 2015 97
F1 CONTRIBUTED EQUITY (CONTINUED)
The gearing ratios at 25 July 2015 and 26 July 2014 were as follows:
2015 $’000
2014
$’000
Total borrowings (note D3) 441,179 422,030
Less: cash and cash equivalents (note D1) (53,323) (73,564)
Net debt 387,856 348,466
Total equity 863,016 893,413
Total capital 1,250,872 1,241,879
Gearing ratio 31% 28%
The increase in the gearing ratio during 2015 was primarily driven by an increase in net debt and a decrease in equity associated
with dividends paid during the year being higher than profits following the decline in profit for the year.
ACCOUNTING POLICY
Ordinary shares are classified as equity.
Incremental costs directly attributable to the issue of new shares are shown in equity as a deduction, net of tax, from the
proceeds.
Where any Group company purchases the Company’s equity instruments; for example, as the result of a share buy-back or a
share-based payment plan, the consideration paid, including any directly attributable incremental costs (net of income taxes)
is deducted from equity attributable to the owners of Myer Holdings Limited as treasury shares until the shares are cancelled
or reissued. Where such ordinary shares are subsequently reissued, any consideration received, net of any directly attributable
incremental transaction costs and the related income tax effects, is included in equity attributable to the owners of
Myer Holdings Limited.

NOTES TO THE CONSOLIDATED FINANCIAL STATEMENTSfor the period ended 25 July 2015
98 MYER Annual Report 2015
F2 RETAINED EARNINGS AND RESERVES
2015 $’000
2014
$’000
(a) Retained earnings
Movements in retained earnings were as follows:
Balance at beginning of period 378,751 379,722
Profit for the period 29,826 98,499
Dividends (73,211) (99,470)
Balance at end of period 335,366 378,751
(b) Reserves
Share-based payments (i) 24,857 23,531
Cash flow hedges (ii) 7,045 (7,469)
Other reserve (iii) (25,621) (25,621)
Foreign currency translation (iv) (3,386) (511)
2,895 (10,070)
Movements in reserves were as follows:
Share-based payments
Balance at beginning of period 23,531 22,185
Share-based payments expense recognised (note H4) 1,445 1,850
Income tax (note A4) (119) (504)
Balance at end of period 24,857 23,531
Cash flow hedges
Balance at beginning of period (7,469) 6,039
Net gain/(loss) on revaluation 17,760 (17,190)
Transfer to net profit (3,246) 4,031
Deferred tax (note A4) – (349)
Balance at end of period 7,045 (7,469)
Other reserve
Balance at beginning of period (25,621) (31,650)
Acquisition of non-controlling interests – 6,029
Balance at end of period (25,621) (25,621)
Foreign currency translation
Balance at beginning of period (511) (598)
Currency translation differences arising during the period (2,875) 87
Balance at end of period (3,386) (511)
(i) Share-based payments
The share-based payments reserve is used to recognise the fair value of options and rights granted to employees under the
employee share plans. Further information on share-based payments is set out in note H4.
(ii) Cash flow hedges
The hedging reserve is used to record gains or losses on a hedging instrument in a cash flow hedge that are recognised directly in
equity, as described in note E2. Amounts are recognised in the income statement when the associated hedged transaction affects
profit or loss.
(iii) Other reserve
Under the shareholders’ agreement entered into with the non-controlling shareholders at the time of acquisition in 2011, the Group
held a call option over the non-controlling shareholders’ 35% interest in Boogie & Boogie Pty Ltd, the owner of sass & bide, and the
non-controlling shareholders had a corresponding put option. These options became exercisable in 2014, two years from acquisition

NOTES TO THE CONSOLIDATED FINANCIAL STATEMENTSfor the period ended 25 July 2015
MYER Annual Report 2015 99
F2 RETAINED EARNINGS AND RESERVES (CONTINUED)
date, at a market value of the shares at that time based on a formula contained within the shareholders’ agreement. The potential
liability of the Group under the put option was estimated at acquisition date based on expectations on the timing of exercise
and the exercise price at that future point in time, discounted to present value using the Group’s incremental borrowing rate.
The recognition of the put option liability at acquisition date resulted in the recognition of an amount to the other reserve within
shareholders’ equity and a financial liability within non-current liabilities other, reclassified to current liabilities in 2013 when it
became payable.
On acquisition of the remaining 35% of sass & bide, the cash payment of $33.4 million was recorded against the current financial
liability and non-controlling interests balances were recorded against other reserve.
(iv) Foreign currency translation
Exchange differences arising on translation of the foreign controlled entity are recognised in other comprehensive income as
described in note I(c) and accumulated in a separate reserve within equity. The cumulative amount is reclassified to the income
statement when the net investment is disposed of.
F3 DIVIDENDS
2015 $’000
2014
$’000
(a) Ordinary shares
Final fully franked dividend for the period ended 26 July 2014 of 5.5 cents (2013: 8.0 cents) per fully paid
share paid 13 November 2014 (2013: 14 November 2013) 32,213 46,759
Interim fully franked dividend for the period ended 25 July 2015 of 7.0 cents (2014: 9.0 cents) per fully
paid share paid 7 May 2015 (2014: 8 May 2014) 40,998 52,711
Total dividends paid 73,211 99,470
(b) Dividends not recognised at the end of the reporting period
The directors have not recommended the payment of a final dividend (2014: 5.5 cents per fully paid
ordinary share fully franked based on tax paid at 30%).
The aggregate amount of the proposed dividend expected to be paid after period end, but not
recognised as a liability at period end, is: – 32,212
(c) Franked dividends
The franked portions of the final dividends recommended after 25 July 2015 will be franked out of
existing franking credits or out of franking credits arising from the payment of income tax in the period
ending 30 July 2016.
Franking credits available for subsequent financial periods based on a tax rate of 30% (2014: 30%) 9,266 17,175
The above amounts represent the balance of the franking account as at the reporting date, adjusted for:
(a) franking credits that will arise from the payment of the amount of the provision for income tax;
(b) franking debits that will arise from the payment of dividends recognised as a liability at the reporting date; and
(c) franking credits that will arise from the receipt of dividends recognised as receivables at the reporting date.
The consolidated amounts include franking credits that would be available to the parent entity if distributable profits of subsidiaries
were paid as dividends.
The impact on the franking account of the dividend recommended by the directors since the end of the reporting period, but
not recognised as a liability at the reporting date, will be a reduction in the franking account of nil (2014: reduction of $14 million).
ACCOUNTING POLICY
Provision is made for the amount of any dividend declared, being appropriately authorised and no longer at the discretion of
the entity, on or before the end of the financial period but not distributed at balance date.
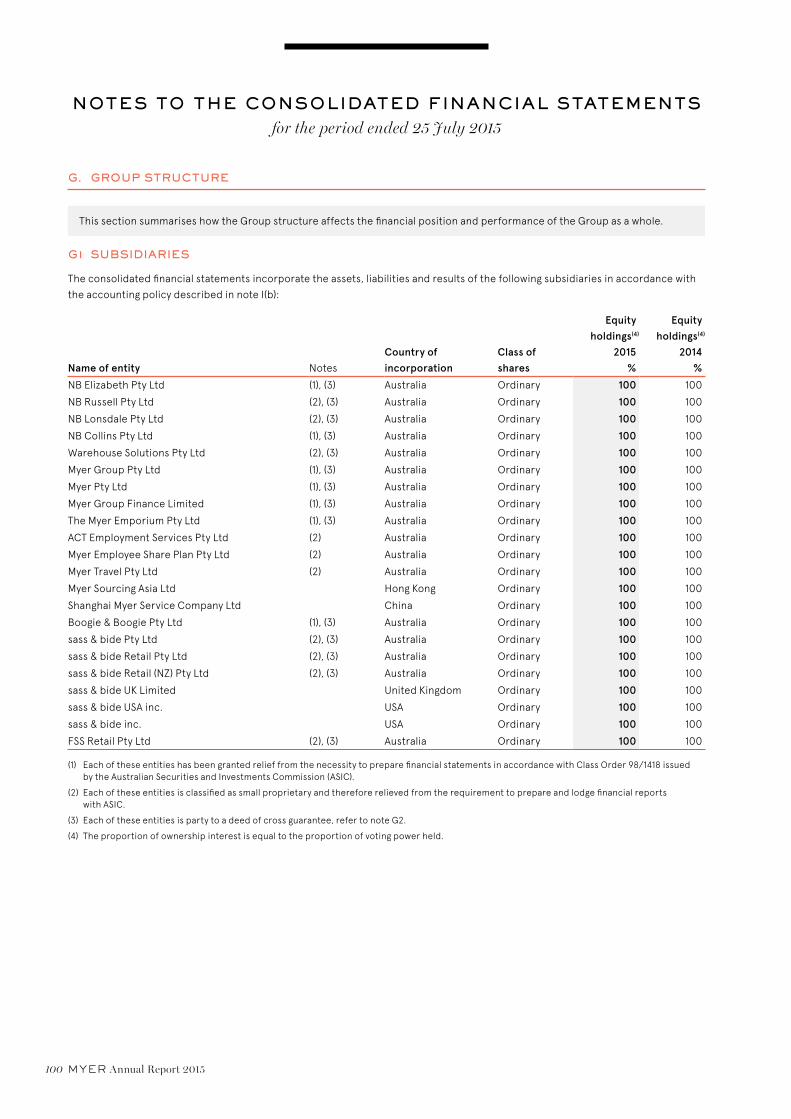
NOTES TO THE CONSOLIDATED FINANCIAL STATEMENTSfor the period ended 25 July 2015
100 MYER Annual Report 2015
G. GROUP STRUCTURE
This section summarises how the Group structure affects the financial position and performance of the Group as a whole.
G1 SUBSIDIARIES
The consolidated financial statements incorporate the assets, liabilities and results of the following subsidiaries in accordance with
the accounting policy described in note I(b):
Name of entity Notes
Country of incorporation
Class of shares
Equityholdings(4)
2015 %
Equityholdings(4)
2014 %
NB Elizabeth Pty Ltd (1), (3) Australia Ordinary 100 100
NB Russell Pty Ltd (2), (3) Australia Ordinary 100 100
NB Lonsdale Pty Ltd (2), (3) Australia Ordinary 100 100
NB Collins Pty Ltd (1), (3) Australia Ordinary 100 100
Warehouse Solutions Pty Ltd (2), (3) Australia Ordinary 100 100
Myer Group Pty Ltd (1), (3) Australia Ordinary 100 100
Myer Pty Ltd (1), (3) Australia Ordinary 100 100
Myer Group Finance Limited (1), (3) Australia Ordinary 100 100
The Myer Emporium Pty Ltd (1), (3) Australia Ordinary 100 100
ACT Employment Services Pty Ltd (2) Australia Ordinary 100 100
Myer Employee Share Plan Pty Ltd (2) Australia Ordinary 100 100
Myer Travel Pty Ltd (2) Australia Ordinary 100 100
Myer Sourcing Asia Ltd Hong Kong Ordinary 100 100
Shanghai Myer Service Company Ltd China Ordinary 100 100
Boogie & Boogie Pty Ltd (1), (3) Australia Ordinary 100 100
sass & bide Pty Ltd (2), (3) Australia Ordinary 100 100
sass & bide Retail Pty Ltd (2), (3) Australia Ordinary 100 100
sass & bide Retail (NZ) Pty Ltd (2), (3) Australia Ordinary 100 100
sass & bide UK Limited United Kingdom Ordinary 100 100
sass & bide USA inc. USA Ordinary 100 100
sass & bide inc. USA Ordinary 100 100
FSS Retail Pty Ltd (2), (3) Australia Ordinary 100 100
(1) Each of these entities has been granted relief from the necessity to prepare financial statements in accordance with Class Order 98/1418 issued by the Australian Securities and Investments Commission (ASIC).
(2) Each of these entities is classified as small proprietary and therefore relieved from the requirement to prepare and lodge financial reports with ASIC.
(3) Each of these entities is party to a deed of cross guarantee, refer to note G2.
(4) The proportion of ownership interest is equal to the proportion of voting power held.

NOTES TO THE CONSOLIDATED FINANCIAL STATEMENTSfor the period ended 25 July 2015
MYER Annual Report 2015 101
G2 DEED OF CROSS GUARANTEE
The following entities are parties to a deed of cross guarantee under which each company guarantees the debts of the others:
> Myer Holdings Limited > Myer Pty Ltd
> NB Elizabeth Pty Ltd > Myer Group Finance Limited
> NB Russell Pty Ltd > The Myer Emporium Pty Ltd
> Myer Group Pty Ltd > Boogie & Boogie Pty Ltd
> NB Lonsdale Pty Ltd > sass & bide Pty Ltd
> NB Collins Pty Ltd > sass & bide Retail Pty Ltd
> Warehouse Solutions Pty Ltd > sass & bide Retail (NZ) Pty Ltd
> Myer Group Pty Ltd > FSS Retail Pty Ltd
By entering into the deed, the wholly-owned entities have been relieved from the requirements to prepare a financial report
and directors’ report under Class Order 98/1418 (as amended) issued by the Australian Securities and Investments Commission.
The above companies represent a ‘closed group’ for the purposes of the Class Order, and as there are no other parties to the
deed of cross guarantee that are controlled by Myer Holdings Limited, they also represent the ‘extended closed group’.

NOTES TO THE CONSOLIDATED FINANCIAL STATEMENTSfor the period ended 25 July 2015
102 MYER Annual Report 2015
G2 DEED OF CROSS GUARANTEE (CONTINUED)
(a) Consolidated income statement, statement of comprehensive income and summary of movements in consolidated retained earnings
Set out below is a consolidated income statement, statement of comprehensive income and a summary of movements in
consolidated retained earnings for the closed group for the year ended 25 July 2015:
2015 52 weeks
$’000
2014
52 weeks
$’000
Income statement
Total sales value (excluding GST) 3,194,597 3,141,961
Concession sales (501,153) (491,482)
Sale of goods (excluding GST) 2,693,444 2,650,479
Sales revenue deferred under customer loyalty program (40,122) (39,378)
Revenue from sale of goods (excluding GST) 2,653,322 2,611,101
Other operating revenue (excluding finance revenue) 131,423 128,769
Cost of goods sold (1,494,144) (1,454,015)
Operating gross profit 1,290,601 1,285,855
Other income 76 6,356
Selling expenses (828,432) (810,112)
Administration expenses (327,743) (319,771)
Strategic review, restructuring, store and brand exit costs and impairment of assets (61,687) –
Earnings before interest and tax 72,815 162,328
Finance revenue 734 991
Finance costs (23,487) (22,930)
Net finance costs (22,753) (21,939)
Profit before income tax 50,062 140,389
Income tax expense (19,452) (40,106)
Profit for the period 30,610 100,283
Profit is attributable to:
Deed of Cross Guarantee group 30,610 100,240
Non-controlling interests – 43
30,610 100,283
Statement of comprehensive income
Profit for the period 30,610 100,283
Other comprehensive income
Items that may be reclassified to profit or loss:
Cash flow hedges 14,514 (13,320)
Exchange differences on translation of foreign operations (817) 248
Income tax relating to components of other comprehensive income – (349)
Other comprehensive income for the period, net of tax 13,697 (13,421)
Total comprehensive income for the period 44,307 86,862
Summary of movements in retained earnings
Opening balance 384,022 379,398
sass & bide opening retained earnings – 3,854
Profit for the period 30,610 100,240
Dividends paid (73,211) (99,470)
Closing balance 341,421 384,022

NOTES TO THE CONSOLIDATED FINANCIAL STATEMENTSfor the period ended 25 July 2015
MYER Annual Report 2015 103
G2 DEED OF CROSS GUARANTEE (CONTINUED)
(b) Consolidated balance sheet
Set out below is a consolidated balance sheet as at 25 July 2015 of the closed group:
2015 $’000
2014
$’000
ASSETS
Current assets
Cash and cash equivalents 52,647 71,185
Trade and other receivables and prepayments 43,608 42,497
Inventories 378,518 372,853
Derivative financial instruments 15,211 –
Total current assets 489,984 486,535
Non-current assets
Property, plant and equipment 468,573 502,327
Deferred tax assets 15,556 12,001
Intangible assets 915,525 932,138
Other non-current assets 2,628 2,932
Other financial assets 1,463 1,462
Total non-current assets 1,403,745 1,450,860
Total assets 1,893,729 1,937,395
LIABILITIES
Current liabilities
Trade and other payables 385,523 427,167
Derivative financial instruments 99 5,253
Current tax liabilities 889 7,516
Provisions 85,383 81,616
Deferred income 6,997 6,045
Other liabilities 871 2,029
Total current liabilities 479,762 529,626
Non-current liabilities
Borrowings 441,179 422,030
Derivative financial instruments 4,654 3,401
Provisions 21,144 13,997
Deferred income 75,112 68,900
Total non-current liabilities 542,089 508,328
Total liabilities 1,021,851 1,037,954
Net assets 871,878 899,441
EQUITY
Contributed equity 524,755 524,732
Retained earnings 341,421 384,022
Reserves 5,702 (9,313)
Total equity 871,878 899,441
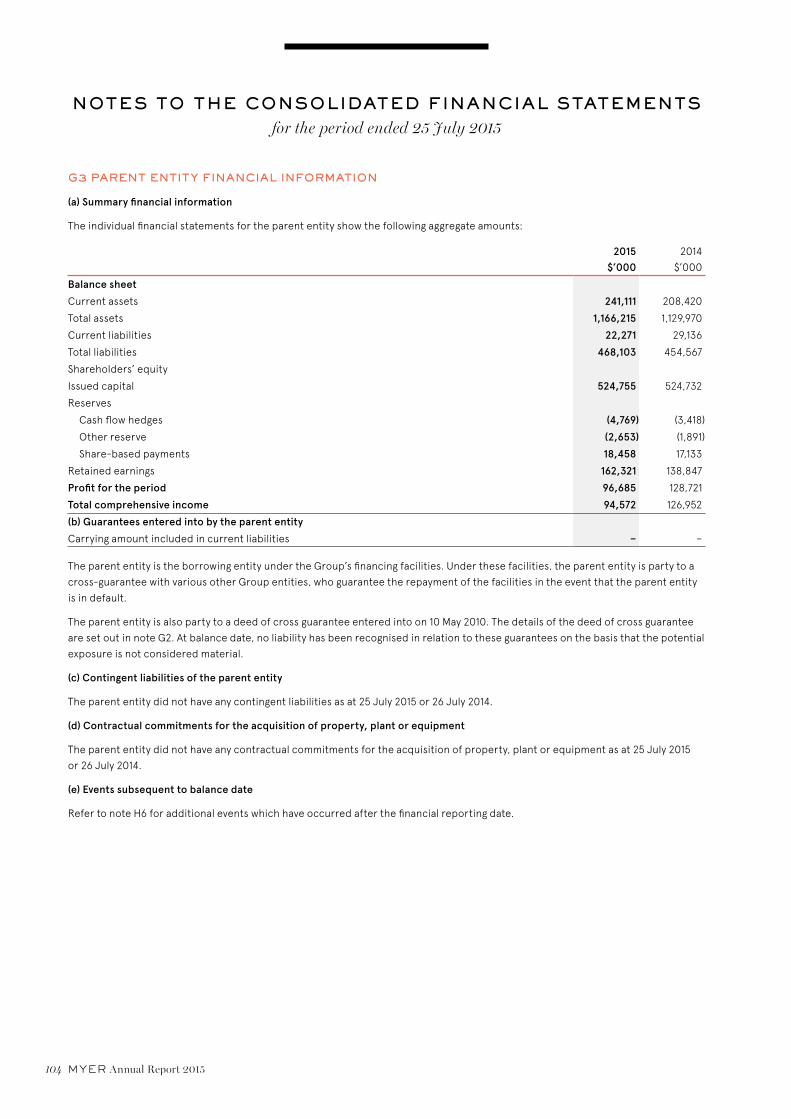
NOTES TO THE CONSOLIDATED FINANCIAL STATEMENTSfor the period ended 25 July 2015
104 MYER Annual Report 2015
G3 PARENT ENTITY FINANCIAL INFORMATION
(a) Summary financial information
The individual financial statements for the parent entity show the following aggregate amounts:
2015 $’000
2014
$’000
Balance sheet
Current assets 241,111 208,420
Total assets 1,166,215 1,129,970
Current liabilities 22,271 29,136
Total liabilities 468,103 454,567
Shareholders’ equity
Issued capital 524,755 524,732
Reserves
Cash flow hedges (4,769) (3,418)
Other reserve (2,653) (1,891)
Share-based payments 18,458 17,133
Retained earnings 162,321 138,847
Profit for the period 96,685 128,721
Total comprehensive income 94,572 126,952
(b) Guarantees entered into by the parent entity
Carrying amount included in current liabilities – –
The parent entity is the borrowing entity under the Group’s financing facilities. Under these facilities, the parent entity is party to a
cross-guarantee with various other Group entities, who guarantee the repayment of the facilities in the event that the parent entity
is in default.
The parent entity is also party to a deed of cross guarantee entered into on 10 May 2010. The details of the deed of cross guarantee
are set out in note G2. At balance date, no liability has been recognised in relation to these guarantees on the basis that the potential
exposure is not considered material.
(c) Contingent liabilities of the parent entity
The parent entity did not have any contingent liabilities as at 25 July 2015 or 26 July 2014.
(d) Contractual commitments for the acquisition of property, plant or equipment
The parent entity did not have any contractual commitments for the acquisition of property, plant or equipment as at 25 July 2015
or 26 July 2014.
(e) Events subsequent to balance date
Refer to note H6 for additional events which have occurred after the financial reporting date.

NOTES TO THE CONSOLIDATED FINANCIAL STATEMENTSfor the period ended 25 July 2015
MYER Annual Report 2015 105
G3 PARENT ENTITY FINANCIAL INFORMATION (CONTINUED)
ACCOUNTING POLICY
The financial information that is disclosed for the parent entity, Myer Holdings Limited, has been prepared on the same basis
as the consolidated financial statements, except as set out below.
(i) Investments in subsidiaries
Investments in subsidiaries are accounted for at cost in the financial statements of Myer Holdings Limited.
(ii) Tax consolidation legislation
Myer Holdings Limited and its wholly owned Australian controlled entities have implemented the tax consolidation legislation.
The head entity, Myer Holdings Limited, and the controlled entities in the tax consolidated group continue to account for their
own current and deferred tax amounts. These tax amounts are measured as if each entity in the tax consolidated group
continues to be a stand-alone taxpayer in its own right.
In addition to its own current and deferred tax amounts, Myer Holdings Limited also recognises the current tax liabilities
(or assets) and the deferred tax assets arising from unused tax losses and unused tax credits assumed from controlled entities
in the tax consolidated group.
The entities have also entered into a tax funding agreement under which the wholly-owned entities fully compensate Myer
Holdings Limited for any current tax payable assumed and are compensated by Myer Holdings Limited for any current tax
receivable and deferred tax assets relating to unused tax losses or unused tax credits that are transferred to Myer Holdings
Limited under the tax consolidation legislation. The funding amounts are determined by reference to the amounts recognised
in the wholly-owned entities’ financial statements.
The funding amounts are recognised as current intercompany receivables or payables.
Assets or liabilities arising under tax funding agreements with the tax consolidated entities are recognised as amounts
receivable from or payable to other entities in the Group.
Any difference between the amounts assumed and amounts receivable or payable under the tax funding agreement are
recognised as a contribution to (or distribution from) wholly-owned tax consolidated entities.

NOTES TO THE CONSOLIDATED FINANCIAL STATEMENTSfor the period ended 25 July 2015
106 MYER Annual Report 2015
H. OTHER INFORMATION
This section of the notes includes other information that must be disclosed to comply with the accounting standards and other
pronouncements, but that is not immediately related to individual line items in the financial statements. This section also
provides information about items that are not recognised in the financial statements as they do not (yet) satisfy the recognition
criteria.
H1 CONTINGENCIES
Contingent liabilities
The Group had contingent liabilities at 25 July 2015 in respect of:
Guarantees
The Group has issued bank guarantees amounting to $44.6 million (2014: $49.4 million), of which $26 million (2014: $30.5 million)
represents guarantees supporting workers’ compensation self insurance licences in various jurisdictions.
For information about other guarantees given by entities within the Group, including the parent entity, please refer to notes
G2 and G3.
While the amount and timing of any contingencies are uncertain, no material losses are anticipated in respect of the above
contingent liabilities.
H2 COMMITMENTS
(a) Capital commitments
Capital expenditure contracted for at the end of the reporting period but not recognised as liabilities is as follows:
2015 $’000
2014
$’000
Property, plant, equipment and software
Payable:
Within one year 2,132 10,553
Later than one year but not later than five years – –
Later than five years – –
2,132 10,553
(b) Operating lease commitments
The Group leases the majority of its stores and warehouses under non-cancellable operating leases expiring within one to 30 years.
The leases have varying terms, escalation clauses and renewal rights. On renewal, the terms of the leases are renegotiated.
Commitments for minimum lease payments in relation to non-cancellable operating leases are
payable as follows:
Within one year 225,595 225,526
Later than one year but not later than five years 878,427 880,983
Later than five years 2,069,321 2,145,696
3,173,343 3,252,205
Not included in the above commitments are contingent rental payments that may arise in the event that sales made by certain leased
stores exceed a pre-determined amount. The contingent rentals payable as a percentage of sales revenue and the relevant
thresholds vary from lease to lease.
A number of lease agreements for stores include cash contributions provided by the lessor for fit-outs and referred to as a lease
incentive or lease contribution. Refer to note C4 for more information.
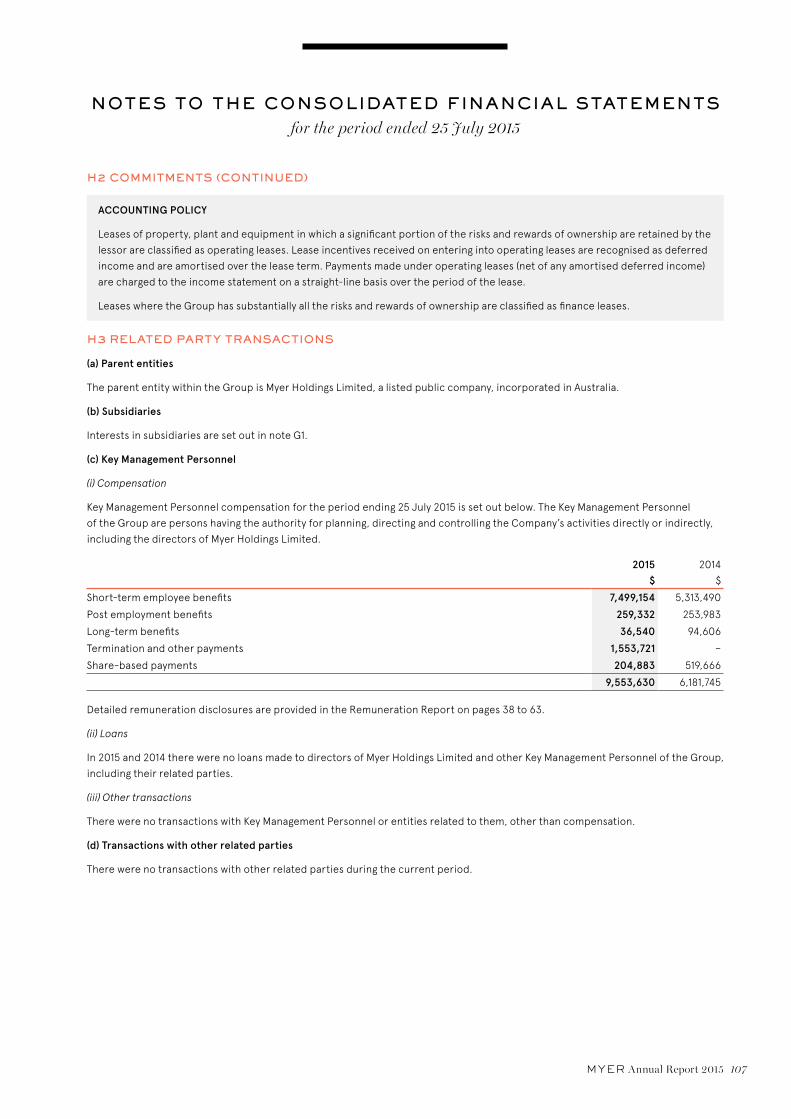
NOTES TO THE CONSOLIDATED FINANCIAL STATEMENTSfor the period ended 25 July 2015
MYER Annual Report 2015 107
H2 COMMITMENTS (CONTINUED)
ACCOUNTING POLICY
Leases of property, plant and equipment in which a significant portion of the risks and rewards of ownership are retained by the
lessor are classified as operating leases. Lease incentives received on entering into operating leases are recognised as deferred
income and are amortised over the lease term. Payments made under operating leases (net of any amortised deferred income)
are charged to the income statement on a straight-line basis over the period of the lease.
Leases where the Group has substantially all the risks and rewards of ownership are classified as finance leases.
H3 RELATED PARTY TRANSACTIONS
(a) Parent entities
The parent entity within the Group is Myer Holdings Limited, a listed public company, incorporated in Australia.
(b) Subsidiaries
Interests in subsidiaries are set out in note G1.
(c) Key Management Personnel
(i) Compensation
Key Management Personnel compensation for the period ending 25 July 2015 is set out below. The Key Management Personnel
of the Group are persons having the authority for planning, directing and controlling the Company’s activities directly or indirectly,
including the directors of Myer Holdings Limited.
2015 $
2014
$
Short-term employee benefits 7,499,154 5,313,490
Post employment benefits 259,332 253,983
Long-term benefits 36,540 94,606
Termination and other payments 1,553,721 –
Share-based payments 204,883 519,666
9,553,630 6,181,745
Detailed remuneration disclosures are provided in the Remuneration Report on pages 38 to 63.
(ii) Loans
In 2015 and 2014 there were no loans made to directors of Myer Holdings Limited and other Key Management Personnel of the Group,
including their related parties.
(iii) Other transactions
There were no transactions with Key Management Personnel or entities related to them, other than compensation.
(d) Transactions with other related parties
There were no transactions with other related parties during the current period.
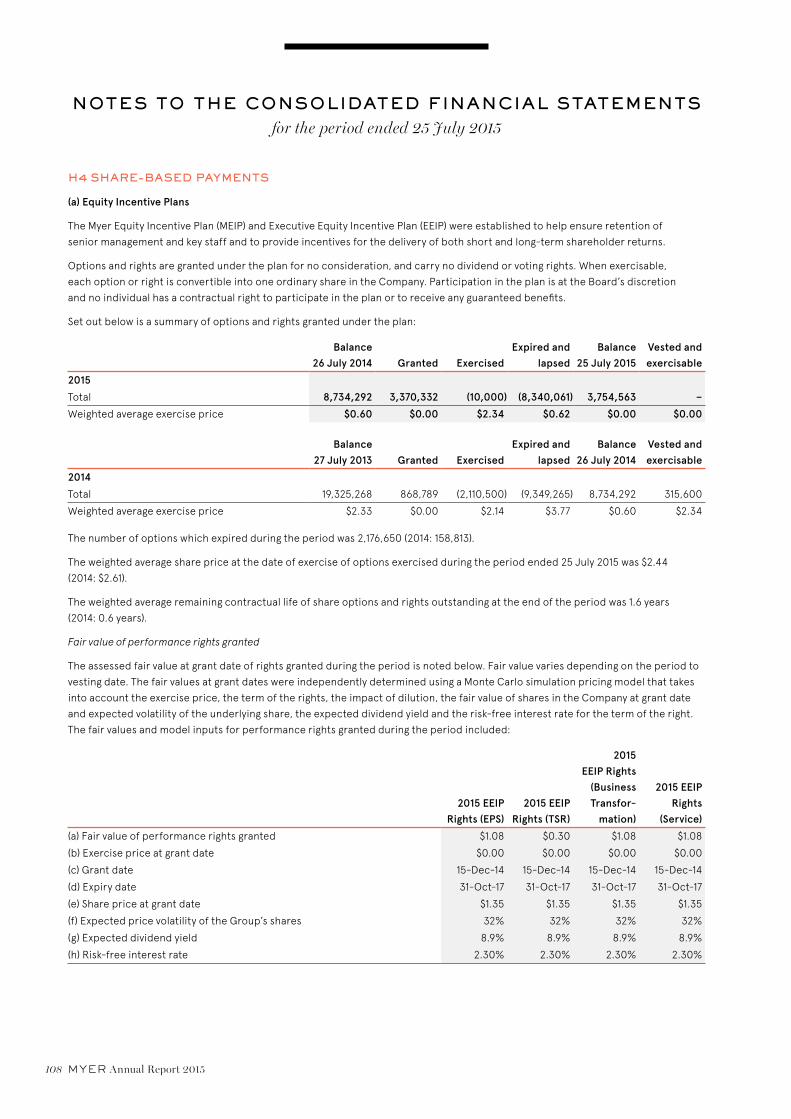
NOTES TO THE CONSOLIDATED FINANCIAL STATEMENTSfor the period ended 25 July 2015
108 MYER Annual Report 2015
H4 SHARE-BASED PAYMENTS
(a) Equity Incentive Plans
The Myer Equity Incentive Plan (MEIP) and Executive Equity Incentive Plan (EEIP) were established to help ensure retention of
senior management and key staff and to provide incentives for the delivery of both short and long-term shareholder returns.
Options and rights are granted under the plan for no consideration, and carry no dividend or voting rights. When exercisable,
each option or right is convertible into one ordinary share in the Company. Participation in the plan is at the Board’s discretion
and no individual has a contractual right to participate in the plan or to receive any guaranteed benefits.
Set out below is a summary of options and rights granted under the plan:
Balance 26 July 2014 Granted Exercised
Expired and lapsed
Balance 25 July 2015
Vested and exercisable
2015
Total 8,734,292 3,370,332 (10,000) (8,340,061) 3,754,563 –
Weighted average exercise price $0.60 $0.00 $2.34 $0.62 $0.00 $0.00
Balance 27 July 2013 Granted Exercised
Expired and lapsed
Balance 26 July 2014
Vested and exercisable
2014
Total 19,325,268 868,789 (2,110,500) (9,349,265) 8,734,292 315,600
Weighted average exercise price $2.33 $0.00 $2.14 $3.77 $0.60 $2.34
The number of options which expired during the period was 2,176,650 (2014: 158,813).
The weighted average share price at the date of exercise of options exercised during the period ended 25 July 2015 was $2.44
(2014: $2.61).
The weighted average remaining contractual life of share options and rights outstanding at the end of the period was 1.6 years
(2014: 0.6 years).
Fair value of performance rights granted
The assessed fair value at grant date of rights granted during the period is noted below. Fair value varies depending on the period to
vesting date. The fair values at grant dates were independently determined using a Monte Carlo simulation pricing model that takes
into account the exercise price, the term of the rights, the impact of dilution, the fair value of shares in the Company at grant date
and expected volatility of the underlying share, the expected dividend yield and the risk-free interest rate for the term of the right.
The fair values and model inputs for performance rights granted during the period included:
2015 EEIP Rights (EPS)
2015 EEIP Rights (TSR)
2015 EEIP Rights
(Business Transfor-
mation)
2015 EEIP Rights
(Service)
(a) Fair value of performance rights granted $1.08 $0.30 $1.08 $1.08
(b) Exercise price at grant date $0.00 $0.00 $0.00 $0.00
(c) Grant date 15-Dec-14 15-Dec-14 15-Dec-14 15-Dec-14
(d) Expiry date 31-Oct-17 31-Oct-17 31-Oct-17 31-Oct-17
(e) Share price at grant date $1.35 $1.35 $1.35 $1.35
(f) Expected price volatility of the Group’s shares 32% 32% 32% 32%
(g) Expected dividend yield 8.9% 8.9% 8.9% 8.9%
(h) Risk-free interest rate 2.30% 2.30% 2.30% 2.30%

NOTES TO THE CONSOLIDATED FINANCIAL STATEMENTSfor the period ended 25 July 2015
MYER Annual Report 2015 109
H4 SHARE-BASED PAYMENTS (CONTINUED)
The expected price volatility is based on the historic volatility (based on the remaining life of the performance rights), adjusted for
any expected changes to future volatility due to publicly available information.
Where rights are issued to employees of subsidiaries within the Group, the subsidiaries compensate the Company for the amount
recognised as expense in relation to these rights.
(b) Expenses arising from share-based payment transactions
Total expenses arising from share-based payment transactions recognised during the period as part of employee benefit expense
were as follows:
2015 $’000
2014
$’000
Options and rights issued under the MEIP and EEIP 1,445 1,850
Share-based payment transaction expenses represent the amount recognised in the period in relation to share-based remuneration
plans. Where expectations of the number of options or rights expected to vest changes, the life to date expense is adjusted,
which can result in a negative expense for the period due to the reversal of amounts recognised in prior periods.
ACCOUNTING POLICY
Share-based compensation benefits are provided to employees via the Myer Equity Incentive Plan.
The fair value of options granted under the plan is recognised as an employee benefit expense with a corresponding increase in
equity. The total amount to be expensed is determined by reference to the fair value of the options granted, which includes any
market performance conditions but excludes the impact of any services and non-market performance vesting conditions and
the impact of any non-vesting conditions.
Non-market vesting conditions are included in assumptions about the number of options that are expected to vest. The total
expense is recognised over the vesting period, which is the period over which all the specified vesting conditions are to be
satisfied. At the end of each period, the entity revises its estimates of the number of options that are expected to vest based
on the non-market vesting conditions. It recognises the impact of revisions to original estimates, if any, in profit or loss, with a
corresponding adjustment to equity.
The Myer Equity Incentive Plan is administered by the Myer Equity Plan Trust (see note I(b)(ii)). When options are exercised,
the trust transfers the appropriate number of shares to the employee. The proceeds received net of any directly attributable
transaction costs are credited directly to equity.

NOTES TO THE CONSOLIDATED FINANCIAL STATEMENTSfor the period ended 25 July 2015
110 MYER Annual Report 2015
H5 REMUNERATION OF AUDITORS
During the period, the following fees were paid or payable for services provided by the auditor of the Group, and its related
practices:
2015 $
2014
$
(a) PwC Australia
(i) Assurance services
Audit services
Audit and review of financial statements 396,380 392,530
Other assurance services
Audit of rent certificates 46,970 44,250
Total remuneration for audit and other assurance services 443,350 436,780
(ii) Taxation services
Tax compliance services 46,900 46,900
Total remuneration of PwC Australia 490,250 483,680
(b) Overseas practices of PwC
(i) Assurance services
Audit services
Audit and review of financial statements 72,717 68,109
(ii) Taxation services
Tax compliance services 8,958 25,331
Total remuneration for overseas practices of PwC 81,675 93,440
H6 EVENTS OCCURRING AFTER THE REPORTING PERIOD
Dividends on the Company’s ordinary shares
The directors have determined that no final dividend will be payable for the period ended 25 July 2015.
Entitlement offer
On 1 September 2015, the Company announced the launch of a fully underwritten 2 for 5 accelerated pro-rata non-renounceable
entitlement offer to raise approximately $221 million, at an offer price of $0.94 (Entitlement Offer).

NOTES TO THE CONSOLIDATED FINANCIAL STATEMENTSfor the period ended 25 July 2015
MYER Annual Report 2015 111
I. OTHER ACCOUNTING POLICIES
This section provides a list of other accounting policies adopted in the preparation of these consolidated financial statements.
Specific accounting policies are disclosed in their respective notes to the financial statements. This section also provides
information on the impacts of new accounting standards, amendments and interpretations, and whether they are effective in
2015 or later years.
The principal accounting policies adopted in the preparation of these consolidated financial statements (‘financial statements’ or
‘financial report’) are set out below. These policies have been consistently applied to all the periods presented, unless otherwise
stated. The financial statements are for the consolidated entity consisting of Myer Holdings Limited and its subsidiaries (‘Group’).
(a) Basis of preparation
These general purpose financial statements have been prepared in accordance with Australian Accounting Standards and
Interpretations issued by the Australian Accounting Standards Board (AASB) and the Corporations Act 2001. Myer Holdings Limited
is a for-profit entity for the purpose of preparing the financial statements.
Compliance with IFRS
The consolidated financial statements of Myer Holdings Limited group also comply with International Financial Reporting Standards
(IFRS) as issued by the International Accounting Standards Board (IASB).
Historical cost convention
These financial statements have been prepared under the historical cost convention, except for financial assets and liabilities
(including derivative instruments), which have been measured at fair value through profit or loss.
Critical accounting estimates
The preparation of financial statements in conformity with accounting standards requires the use of certain critical accounting
estimates. It also requires management to exercise its judgement in the process of applying the Group’s accounting policies.
The areas involving a higher degree of judgement or complexity, or areas where assumptions and estimates are significant to
the financial statements, are disclosed in notes A4, B2 and C2.
(b) Principles of consolidation
(i) Subsidiaries
The consolidated financial statements incorporate the assets and liabilities of all subsidiaries of Myer Holdings Limited
(‘Company’ or ‘parent entity’) as at 25 July 2015 and the results of all subsidiaries for the period then ended.
Subsidiaries are all entities (including structured entities) over which the Group has control. The Group controls an entity when
the Group is exposed to, or has rights to, variable returns from its involvement with the entity and has the ability to affect those
returns through its power to direct the activities of the entity. Subsidiaries are fully consolidated from the date on which control
is transferred to the Group. They are deconsolidated from the date that control ceases.
The acquisition method of accounting is used to account for business combinations by the Group (refer note I(d)).
Intercompany transactions, balances and unrealised gains on transactions between Group companies are eliminated. Unrealised
losses are also eliminated unless the transaction provides evidence of impairment of the asset transferred. Accounting policies
of subsidiaries have been changed where necessary to ensure consistency with the policies adopted by the Group.
Non-controlling interests in the results and equity of subsidiaries are shown separately in the consolidated income statement,
statement of comprehensive income, balance sheet and statement of changes in equity respectively.

NOTES TO THE CONSOLIDATED FINANCIAL STATEMENTSfor the period ended 25 July 2015
112 MYER Annual Report 2015
I. OTHER ACCOUNTING POLICIES (CONTINUED)
(ii) Employee Share Trust
The Group has formed the Myer Equity Plans Trust to administer the Group’s employee share scheme. This trust is consolidated,
as the substance of the relationship is that the trust is controlled by the Group.
Shares in Myer Holdings Limited held by the trust are disclosed as treasury shares and deducted from contributed equity.
(c) Foreign currency translation
(i) Functional and presentation currency
Items included in the financial statements of each of the Group’s entities are measured using the currency of the primary economic
environment in which the entity operates (‘the functional currency’). The consolidated financial statements are presented in
Australian dollars, which is Myer Holdings Limited’s functional and presentation currency.
(ii) Transactions and balances
Foreign currency transactions are translated into the functional currency using the exchange rates prevailing at the dates of the
transactions. Foreign exchange gains and losses resulting from the settlement of such transactions and from the translation at year
end exchange rates of monetary assets and liabilities denominated in foreign currencies are generally recognised in profit or loss.
They are deferred in equity if they relate to qualifying cash flow hedges.
Non-monetary items that are measured at fair value in a foreign currency are translated using the exchange rates at the date when
the fair value was determined. Translation differences on assets and liabilities carried at fair value are reported as part of the fair
value gain or loss. For example, translation differences on non-monetary assets and liabilities such as equities held at fair value
through profit or loss are recognised in profit or loss as part of the fair value gain or loss and translation differences on non-monetary
assets such as equities classified as available-for-sale financial assets are recognised in other comprehensive income.
(iii) Group companies
The results and financial position of foreign operations (none of which has the currency of a hyperinflationary economy) that
have a functional currency different from the presentation currency are translated into the presentation currency as follows:
> assets and liabilities for each balance sheet presented are translated at the closing rate at the date of that balance sheet;
> income and expenses for each income statement and statement of comprehensive income are translated at the rates prevailing
on the transaction dates; and
> all resulting exchange differences are recognised in other comprehensive income.
On consolidation, when a foreign operation is sold, the associated exchange difference is reclassified to profit or loss, as part of the
gain or loss on sale.
(d) Business combinations
The acquisition method of accounting is used to account for all business combinations, regardless of whether equity instruments
or other assets are acquired. The consideration transferred for the acquisition of a subsidiary comprises the fair values of the assets
transferred, the liabilities incurred and the equity interests issued by the Group. The consideration transferred also includes the
fair value of any asset or liability resulting from a contingent consideration arrangement and the fair value of any pre-existing equity
interest in the subsidiary. Acquisition-related costs are expensed as incurred. Identifiable assets acquired and liabilities and
contingent liabilities assumed in a business combination are, with limited exceptions, measured initially at their fair values at the
acquisition date. On an acquisition-by-acquisition basis, the Group recognises any non-controlling interest in the acquiree either
at fair value or at the non-controlling interest’s proportionate share of the acquiree’s identifiable net assets.
The excess of the consideration transferred and the amount of any non-controlling interest in the acquiree over the fair value of the
net identifiable assets acquired is recorded as goodwill. If those amounts are less than the fair value of the net identifiable assets of
the subsidiary acquired, the difference is recognised directly in profit or loss as a bargain purchase.
Where settlement of any part of cash consideration is deferred, the amounts payable in the future are discounted to their present
value as at the date of exchange. The discount rate used is the entity’s incremental borrowing rate, being the rate at which a similar
borrowing could be obtained from an independent financier under comparable terms and conditions.

NOTES TO THE CONSOLIDATED FINANCIAL STATEMENTSfor the period ended 25 July 2015
MYER Annual Report 2015 113
I. OTHER ACCOUNTING POLICIES (CONTINUED)
Contingent consideration is classified either as equity or a financial liability. Amounts classified as a financial liability are
subsequently remeasured to fair value with changes in fair value recognised in profit or loss.
(e) Investments and other financial assets
Classification
The Group classifies its investments in the following categories: financial assets at fair value through profit or loss, loans and
receivables, held to maturity investments, and available for sale financial assets. The classification depends on the purpose for which
the investments were acquired. Management determines the classification of its investments at initial recognition and, in the case of
assets classified as held to maturity, re-evaluates this designation at the end of each reporting period.
(i) Financial assets at fair value through profit or loss
Financial assets at fair value through profit or loss are financial assets held for trading which are acquired principally for the purpose
of selling in the short term with the intention of making a profit. Derivatives are also categorised as held for trading unless they are
designated as hedges.
(ii) Loans and receivables
Loans and receivables are non-derivative financial assets with fixed or determinable payments that are not quoted in an active
market. They arise when the Group provides money, goods or services directly to a debtor with no intention of selling the receivable.
They are included in current assets, except for those with maturities greater than 12 months after the reporting period, which are
classified as non-current assets. Loans and receivables are included in receivables in the balance sheet (refer to note B1).
(iii) Held to maturity investments
Held to maturity investments are non-derivative financial assets with fixed or determinable payments and fixed maturities that the
Group’s management has the positive intention and ability to hold to maturity.
(iv) Available for sale financial assets
Available for sale financial assets are non-derivatives that are either designated in this category or not classified in any of the other
categories. They are included in non-current assets unless management intends to dispose of the investment within 12 months of
the end of the reporting period.
Recognition and derecognition
Purchases and sales of investments are recognised on trade-date, the date on which the Group commits to purchase or sell the
asset. Investments are initially recognised at fair value plus transaction costs for all financial assets not carried at fair value through
profit or loss. Financial assets carried at fair value through profit or loss are initially recognised at fair value and transaction costs
are expensed in profit or loss. Financial assets are derecognised when the rights to receive cash flows from the financial assets have
expired or have been transferred and the Group has transferred substantially all the risks and rewards of ownership.
Measurement
Available-for-sale financial assets and financial assets at fair value through profit or loss are subsequently carried at fair value,
unless they are equity securities that do not have a market price quoted in an active market and whose fair value cannot be reliably
measured. In that case they are carried at cost.
Loans and receivables and held to maturity investments are carried at amortised cost using the effective interest method. Gains
or losses arising from changes in the fair value of the ‘financial assets at fair value through profit or loss’ category, including interest
and dividend income, are presented in profit or loss within other income or other expenses in the period in which they arise.
Changes in the fair value of monetary securities denominated in a foreign currency and classified as available-for-sale are analysed
between translation differences resulting from changes in amortised cost of the security and other changes in the carrying amount of
the security. The translation differences are recognised in profit or loss and other changes in carrying amount are recognised in equity.
Changes in the fair value of other monetary and non-monetary securities classified as available-for-sale are recognised in equity.
When securities classified as available-for-sale are sold or impaired, the accumulated fair value adjustments recognised in equity
are included in profit or loss as gains and losses from investment securities.
Details on how the fair value of financial instruments is determined are disclosed in note E1.

NOTES TO THE CONSOLIDATED FINANCIAL STATEMENTSfor the period ended 25 July 2015
114 MYER Annual Report 2015
I. OTHER ACCOUNTING POLICIES (CONTINUED)
Impairment
The Group assesses at the end of each reporting period whether there is objective evidence that a financial asset or group of
financial assets is impaired. In the case of equity securities classified as available for sale, a significant or prolonged decline in the
fair value of a security below its cost is considered in determining whether the security is impaired. If any such evidence exists for
available for sale financial assets, the cumulative loss – measured as the difference between the acquisition cost and the current
fair value, less any impairment loss on that financial asset previously recognised in profit or loss – is reclassified from equity and
recognised in profit or loss as a reclassification adjustment. Impairment losses recognised in profit or loss on equity instruments
classified as available for sale are not reversed through profit or loss.
(f) Goods and Services Tax (GST)
Revenues, expenses and assets are recognised net of the amount of associated GST, unless the GST incurred is not recoverable
from the taxation authority. In this case it is recognised as part of the cost of acquisition of the asset or as part of the expense.
Receivables and payables are stated inclusive of the amount of GST receivable or payable. The net amount of GST recoverable
from, or payable to, the taxation authority is included with other receivables or payables in the balance sheet.
Cash flows are presented on a gross basis. The GST components of cash flows arising from investing or financing activities, which
are recoverable from, or payable to, the taxation authority, are presented as operating cash flow.
(g) Rounding of amounts
The Group has taken advantage of Class Order 98/100, issued by the Australian Securities and Investments Commission, relating to
the ‘rounding off’ of amounts in the financial statements. Amounts in the financial statements have been rounded off to the nearest
thousand dollars, or in certain cases, to the nearest dollar.
(h) New accounting standards and interpretations
(i) New and amended standards adopted by the Group
The Group has applied the following standards and amendments for the first time in the annual reporting period commencing
27 July 2014:
> AASB 2013-4 Amendments to Australian Accounting Standards – Novation of Derivatives and Continuation of Hedge Accounting
> AASB 2014-1 Amendments to Australian Accounting Standards – Part A: Annual Improvements 2010-2012 and 2011-13 Cycles
> AASB 2014-1 Amendments to Australian Accounting Standards – Part C: Materiality
These revised standards did not affect any of the Group’s accounting policies or any of the amounts recognised and affected only
the disclosures in the notes to the financial statements.

NOTES TO THE CONSOLIDATED FINANCIAL STATEMENTSfor the period ended 25 July 2015
MYER Annual Report 2015 115
I. OTHER ACCOUNTING POLICIES (CONTINUED)
(ii) New standards and interpretations not yet adopted
Certain new accounting standards and interpretations have been published that are not mandatory for the 25 July 2015 reporting
period. The Group’s assessment of the impact of these new standards and interpretations, that were considered relevant for the
consolidated entity, is set out below:
Reference Title Summary
Application date of standard
Impact on Group’s financial statements
Application date for Group for financial year ending
AASB 9
Amendments
were made to
this and other
standards via
AASB 2010-7,
AASB 2010-10
and AASB 2013-9
Financial
Instruments
AASB 9 includes requirements for the
classification and measurement of
financial assets. It was further
amended by AASB 2010-7 to reflect
amendments to the accounting for
financial liabilities. The main changes
are described below:
> The standard will affect the
accounting of available for sale
financial assets, since AASB 9 only
permits the recognition of fair
value gains and losses in other
comprehensive income if they relate
to equity investments that are not
held for trading.
> Where the fair value option is used
for financial liabilities, the change in
fair value is accounted for in other
comprehensive income if it relates
to changes in credit risk. The
remaining change is presented in
the income statement.
In December 2013, a revised Standard
was issued and sets out the new rules
for hedge accounting. The main
changes are described below:
> New hedge accounting requirements
including changes to hedge
effectiveness testing, treatment of
hedging costs, risk components that
can be hedged and disclosures.
> Expanded disclosure requirements
and changes in presentation.
1 January 2017 There will be no material
impact on the Group’s
accounting for financial
liabilities, as the new
requirements only affect
the accounting for
financial liabilities that are
designated at fair value
through profit or loss and
the Group does not have
any such liabilities. The
Group also does not have
any available for sale
financial assets.
The Group has not yet
assessed how its hedging
arrangements would be
affected by the new rules;
however, it does not
expect the impact to
be material. Increased
disclosures may be
required in the financial
statements.
27 July 2019
IFRS 15 Revenue from
Contracts with
Customers
The core principle of the new revenue
recognition standard is that revenue
must be recognised when the control
of goods or services are transferred
to the customer, at the transaction
price.
1 January 2017 The Group does not
expect the new
accounting standard to
have a significant impact.
28 July 2018
There are no other standards that are not yet effective and that would be expected to have a material impact on the entity in the
current or future reporting periods and on foreseeable future transactions.

116 MYER Annual Report 2015
D I R E C T O R S ’ D E C L A R AT I O N
In the directors’ opinion:
(a) the financial statements and notes set out on pages 65 to 115 are in accordance with the Corporations Act 2001, including:
i. complying with Accounting Standards, the Corporations Regulations 2001 and other mandatory professional reporting
requirements; and
ii. giving a true and fair view of the consolidated entity’s financial position as at 25 July 2015 and of its performance for the
financial period ended on that date; and
(b) there are reasonable grounds to believe that the Company will be able to pay its debts as and when they become due and
payable; and
(c) at the date of this declaration, there are reasonable grounds to believe that the members of the extended closed group will be
able to meet any obligations or liabilities to which they are, or may become, subject by virtue of the deed of cross guarantee
described in note G2.
Note I.(a) confirms that the financial statements also comply with International Financial Reporting Standards as issued by the
International Accounting Standards Board.
The directors have been given the declarations by the Chief Executive Officer and the Chief Financial Officer required by section
295A of the Corporations Act 2001.
This declaration is made in accordance with a resolution of the directors.
Paul McClintock, AO Chairman
Melbourne, 1 September 2015.

MYER Annual Report 2015 117
I N D E P E N D E N T A U D I T O R ’ S R E P O R T
PricewaterhouseCoopers, ABN 52 780 433 757Freshwater Place, 2 Southbank Boulevard, SOUTHBANK VIC 3006, GPO Box 1331, MELBOURNE VIC 3001T: 61 3 8603 1000, F: 61 3 8603 1999, www.pwc.com.au
Liability limited by a scheme approved under Professional Standards Legislation.
Independent auditor’s report to the members of MyerHoldings Limited
Report on the financial reportWe have audited the accompanying financial report of Myer Holdings Limited (the company), whichcomprises the consolidated balance sheet as at 25 July 2015, the consolidated income statement andconsolidated statement of comprehensive income, consolidated statement of changes in equity andconsolidated statement of cash flows for the period 27 July 2014 to 25 July 2015, a summary ofsignificant accounting policies, other explanatory notes and the directors’ declaration for the MyerHoldings Group (the consolidated entity). The consolidated entity comprises the company and theentities it controlled at year’s end or from time to time during the period.
Directors’ responsibility for the financial reportThe directors of the company are responsible for the preparation of the financial report that gives atrue and fair view in accordance with Australian Accounting Standards and the Corporations Act 2001and for such internal control as the directors determine is necessary to enable the preparation of thefinancial report that is free from material misstatement, whether due to fraud or error. In Note I, thedirectors also state, in accordance with Accounting Standard AASB 101 Presentation of FinancialStatements, that the financial statements comply with International Financial Reporting Standards.
Auditor’s responsibilityOur responsibility is to express an opinion on the financial report based on our audit. We conductedour audit in accordance with Australian Auditing Standards. Those standards require that we complywith relevant ethical requirements relating to audit engagements and plan and perform the audit toobtain reasonable assurance whether the financial report is free from material misstatement.
An audit involves performing procedures to obtain audit evidence about the amounts and disclosuresin the financial report. The procedures selected depend on the auditor’s judgement, including theassessment of the risks of material misstatement of the financial report, whether due to fraud or error.In making those risk assessments, the auditor considers internal control relevant to the consolidatedentity’s preparation and fair presentation of the financial report in order to design audit proceduresthat are appropriate in the circumstances, but not for the purpose of expressing an opinion on theeffectiveness of the entity’s internal control. An audit also includes evaluating the appropriateness ofaccounting policies used and the reasonableness of accounting estimates made by the directors, as wellas evaluating the overall presentation of the financial report.
We believe that the audit evidence we have obtained is sufficient and appropriate to provide a basis forour audit opinion.
IndependenceIn conducting our audit, we have complied with the independence requirements of the CorporationsAct 2001.

118 MYER Annual Report 2015
INDEPENDENT AUDITOR’S REPORTContinued
Auditor’s opinionIn our opinion:
(a) the financial report of Myer Holdings Limited is in accordance with the Corporations Act 2001,including:
(i) giving a true and fair view of the consolidated entity's financial position as at 25 July 2015and of its performance for the period ended on that date; and
(ii) complying with Australian Accounting Standards (including the Australian AccountingInterpretations) and the Corporations Regulations 2001.
(b) the financial report and notes also comply with International Financial Reporting Standards asdisclosed in Note I.
Report on the Remuneration ReportWe have audited the remuneration report included in pages 38 to 63 of the directors’ report for theperiod ended 25 July 2015. The directors of the company are responsible for the preparation andpresentation of the remuneration report in accordance with section 300A of the Corporations Act2001. Our responsibility is to express an opinion on the remuneration report, based on our auditconducted in accordance with Australian Auditing Standards.
Auditor’s opinionIn our opinion, the remuneration report of Myer Holdings Limited for the period ended 25 July 2015complies with section 300A of the Corporations Act 2001.
PricewaterhouseCoopers
Andrew Mill MelbournePartner 1 September 2015
PricewaterhouseCoopers, ABN 52 780 433 757Freshwater Place, 2 Southbank Boulevard, SOUTHBANK VIC 3006, GPO Box 1331, MELBOURNE VIC 3001T: 61 3 8603 1000, F: 61 3 8603 1999, www.pwc.com.au
Liability limited by a scheme approved under Professional Standards Legislation.
Independent auditor’s report to the members of MyerHoldings Limited
Report on the financial reportWe have audited the accompanying financial report of Myer Holdings Limited (the company), whichcomprises the consolidated balance sheet as at 25 July 2015, the consolidated income statement andconsolidated statement of comprehensive income, consolidated statement of changes in equity andconsolidated statement of cash flows for the period 27 July 2014 to 25 July 2015, a summary ofsignificant accounting policies, other explanatory notes and the directors’ declaration for the MyerHoldings Group (the consolidated entity). The consolidated entity comprises the company and theentities it controlled at year’s end or from time to time during the period.
Directors’ responsibility for the financial reportThe directors of the company are responsible for the preparation of the financial report that gives atrue and fair view in accordance with Australian Accounting Standards and the Corporations Act 2001and for such internal control as the directors determine is necessary to enable the preparation of thefinancial report that is free from material misstatement, whether due to fraud or error. In Note I, thedirectors also state, in accordance with Accounting Standard AASB 101 Presentation of FinancialStatements, that the financial statements comply with International Financial Reporting Standards.
Auditor’s responsibilityOur responsibility is to express an opinion on the financial report based on our audit. We conductedour audit in accordance with Australian Auditing Standards. Those standards require that we complywith relevant ethical requirements relating to audit engagements and plan and perform the audit toobtain reasonable assurance whether the financial report is free from material misstatement.
An audit involves performing procedures to obtain audit evidence about the amounts and disclosuresin the financial report. The procedures selected depend on the auditor’s judgement, including theassessment of the risks of material misstatement of the financial report, whether due to fraud or error.In making those risk assessments, the auditor considers internal control relevant to the consolidatedentity’s preparation and fair presentation of the financial report in order to design audit proceduresthat are appropriate in the circumstances, but not for the purpose of expressing an opinion on theeffectiveness of the entity’s internal control. An audit also includes evaluating the appropriateness ofaccounting policies used and the reasonableness of accounting estimates made by the directors, as wellas evaluating the overall presentation of the financial report.
We believe that the audit evidence we have obtained is sufficient and appropriate to provide a basis forour audit opinion.
IndependenceIn conducting our audit, we have complied with the independence requirements of the CorporationsAct 2001.

MYER Annual Report 2015 119
S H A R E H O L D E R I N F O R M AT I O N
As at 22 September 2015.
Myer has one class of shares on issue (being ordinary shares). All the Company’s shares are listed on the Australian Securities Exchange.
Number
Issued capital* 690,360,533
Number of shareholders 54,068
Minimum parcel price $0.87
Holders with less than a marketable parcel 16,781 (5,796,084 shares)
* On 25 September 2015, approximately 130,918,282 additional shares will be issued under the retail component of the entitlement offer, referred to on page 30.
Distribution of shareholders and shareholdings
Range Total holders Units% of issued
capital
1 – 1,000 25,120 12,280,918 1.78
1,001 – 5,000 18,365 43,196,974 6.26
5,001 – 10,000 4,685 37,035,648 5.36
10,001 – 100,000 5,563 149,495,863 21.65
100,001 and over 335 448,351,130 64.94
Rounding 0.01
Total 54,068 690,360,533 100.00 Unmarketable parcels
Minimum Parcel Size Holders Units
Minimum $500.00 parcel at $0.87 per unit 575 16,781 5,796,084 Twenty largest shareholders
Rank Name Units % of Units
1. HSBC CUSTODY NOMINEES (AUSTRALIA) LIMITED 91,332,337 13.23
2. J P MORGAN NOMINEES AUSTRALIA LIMITED 76,354,634 11.06
3. CITICORP NOMINEES PTY LIMITED 57,463,637 8.32
4. NATIONAL NOMINEES LIMITED 39,352,649 5.70
5. BNP PARIBAS NOMS PTY LTD <DRP> 19,404,072 2.81
6. HSBC CUSTODY NOMINEES (AUSTRALIA) LIMITED <CW A/C> 12,838,065 1.86
7. RBC INVESTOR SERVICES AUSTRALIA NOMINEES PTY LIMITED <PI POOLED A/C> 9,217,689 1.34
8. HSBC CUSTODY NOMINEES (AUSTRALIA) LIMITED-GSCO ECA 8,867,222 1.28
9. UBS NOMINEES PTY LTD 8,253,182 1.20
10. SPACETIME PTY LTD <COPULOS EXEC S/F NO 1 A/C> 6,500,000 0.94
11. WARBONT NOMINEES PTY LTD <UNPAID ENTREPOT A/C> 6,458,233 0.94
12. BERNARD JOSEPH BROOKES 5,446,372 0.79
13. CS FOURTH NOMINEES PTY LTD 4,459,075 0.65
14. RBC INVESTOR SERVICES AUSTRALIA NOMINEES PTY LIMITED <PISELECT> 4,002,667 0.58
15. UBS NOMINEES PTY LTD 2,300,501 0.33
16. MR BERNARD JOSEPH BROOKES + MRS SUSIE HEIDI BROOKES <BROOKES FAMILY SUPER A/C> 2,096,060 0.30
17. BAINPRO NOMINEES PTY LIMITED 1,900,000 0.28
18. CITICORP NOMINEES PTY LIMITED <COLONIAL FIRST STATE INV A/C> 1,843,670 0.27
19. AMP LIFE LIMITED 1,677,421 0.24
20. BAINPRO NOMINEES PTY LIMITED 1,655,519 0.24
Totals: Top 20 holders of FULLY PAID ORDINARY SHARES (TOTAL) 361,423,005 52.35
Total Remaining Holders Balance 328,937,528 47.65

120 MYER Annual Report 2015
SHAREHOLDER INFORMATIONContinued
Substantial shareholders
As at 22 September 2015, there are five substantial shareholders that Myer is aware of:
Name Date of most recent notice Relevant interest
Deutsche Bank AG 21 September 2015 35,177,309
Goldman Sachs Group Inc. 18 September 2015 57,851,477
Perpetual Limited 17 September 2015 79,035,491
UBS Group AG 16 September 2015 48,575,914
Dimensional Fund Advisors 19 March 2015 35,285,313
VOTING RIGHTSShareholders may vote at a meeting of shareholders in person, directly or by proxy, attorney or representative, depending on
whether the shareholder is an individual or a company. Subject to any rights or restrictions attaching to shares, on a show of hands
each shareholder present in person or by proxy, attorney or representative has one vote and, on a poll, has one vote for each
fully paid share held. Presently, Myer has only one class of fully paid ordinary shares and these do not have any voting restrictions.
If shares are not fully paid, on a poll the number of votes attaching to the shares is pro-rated accordingly. Options and performance
rights do not carry any voting rights.
OPTIONS AND PERFORMANCE RIGHTS
Myer has unlisted performance rights on issue. As at 22 September 2015, there were 11 holders of performance rights; and there are
no longer any options on issue.
AMERICAN DEPOSITARY RECEIPT PROGRAM
Myer Holdings has a Sponsored Level I American Depositary Receipt (ADR) program. Myer ADRs are not listed on an exchange and
are only traded in the United States over-the-counter (OTC) market under the code: ‘MYRSY’ and the CUSIP number: 62847V 207.
One ADR represents four existing ordinary Myer shares.
Deutsche Bank Trust Company Americas (DBTCA) is the Depositary for the Company’s ADR program in the United States. Holders
of the Company’s ADRs should deal directly with DBTCA on all matters relating to their ADR holdings on the contact details below:
Deutsche Bank Shareholder Services
American Stock Transfer & Trust Company
Operations Centre
6201 15th Avenue
Brooklyn NY 11219
Email: [email protected]
Toll-free number: +1 800 937 5449
Direct Dial: +1 718 921 8124

B R I N G I N G T H E L O V E O F S H O P P I N G T O L I F E
MYER Annual Report 2015 121
C O R P O R AT E D I R E C T O R Y
REGISTERED OFFICE
Myer Holdings Limited
Level 7
800 Collins Street
Docklands VIC 3008
MYER POSTAL ADDRESS
Myer Holdings Limited
PO Box 869J
Melbourne VIC 3001
COMPANY SECRETARY
Richard Amos
Chief General Counsel and
Company Secretary
INVESTOR RELATIONS
Davina Gunn
Investor Relations Manager
Phone: +61 ( 0) 3 8667 7879
Mobile: +61 ( 0) 400 896 809
Email: [email protected]
MEDIA RELATIONS
Melanie Ward
Corporate Affairs Manager
Phone: +61 ( 0) 3 8667 7596
Mobile: +61 ( 0) 438 101 078
Email: [email protected]
SUSTAINABILITY
Fiona Baxter
National Sustainability Manager
Phone: +61 ( 0) 3 8667 7587
Email: [email protected]
MYER CUSTOMER SERVICE CENTRE
Phone: 1800 811 611 (within Australia)
Fax: +61 ( 0) 3 8667 6091
SHAREHOLDER ENQUIRIES
Share Registry
Computershare Investor Services Pty Ltd
GPO Box 2975
Melbourne VIC 8060
MYER SHAREHOLDER INFORMATION LINE
1300 820 260
+61 ( 0) 3 9415 4332 (outside Australia)
investorcentre.com
AUDITOR
PricewaterhouseCoopers
Level 19, Freshwater Place
2 Southbank Boulevard
Southbank VIC 3006
SECURITIES EXCHANGE LISTING
Myer Holdings Limited (MYR) shares
are listed on the Australian Securities
Exchange (ASX)
WEBSITES
myer.com.au
myer.com.au/investor
myerone.com.au
blog.myer.com.au
SHOP ONLINE
myer.com.au
FIND US HERE
facebook.com/myer
instagram.com/myer
twitter.com/myer
youtube.com/myer
pinterest.com/myermystore
POSITIONAL ONLY

A MYER Annual Report 2015
B R I N G I N G T H E L O V E O F S H O P P I N G T O L I F E
A N N U A L R E P O R T 2 0 1 5
MY
ER
HO
LD
IN
GS
LIM
IT
ED
AB
N 1
4 1
19
08
5 6
02
AN
NU
AL
RE
PO
RT
20
15