myelodysplastic syndromes: revised who classification … · causes of cytopenia aml ... –blood...
TRANSCRIPT
Robert P Hasserjian, MD
Associate Professor
Massachusetts General Hospital and Harvard Medical School
Myelodysplastic syndromes: revised WHO classification and distinction
from non-neoplastic conditions
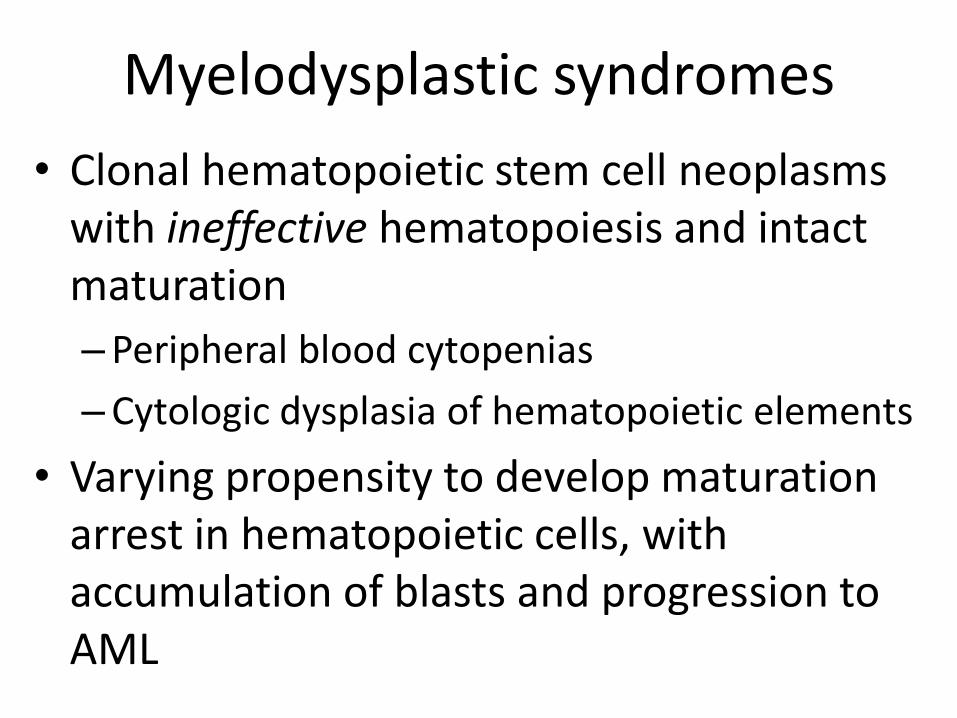
Myelodysplastic syndromes
• Clonal hematopoietic stem cell neoplasms with ineffective hematopoiesis and intact maturation
–Peripheral blood cytopenias
–Cytologic dysplasia of hematopoietic elements
• Varying propensity to develop maturation arrest in hematopoietic cells, with accumulation of blasts and progression to AML
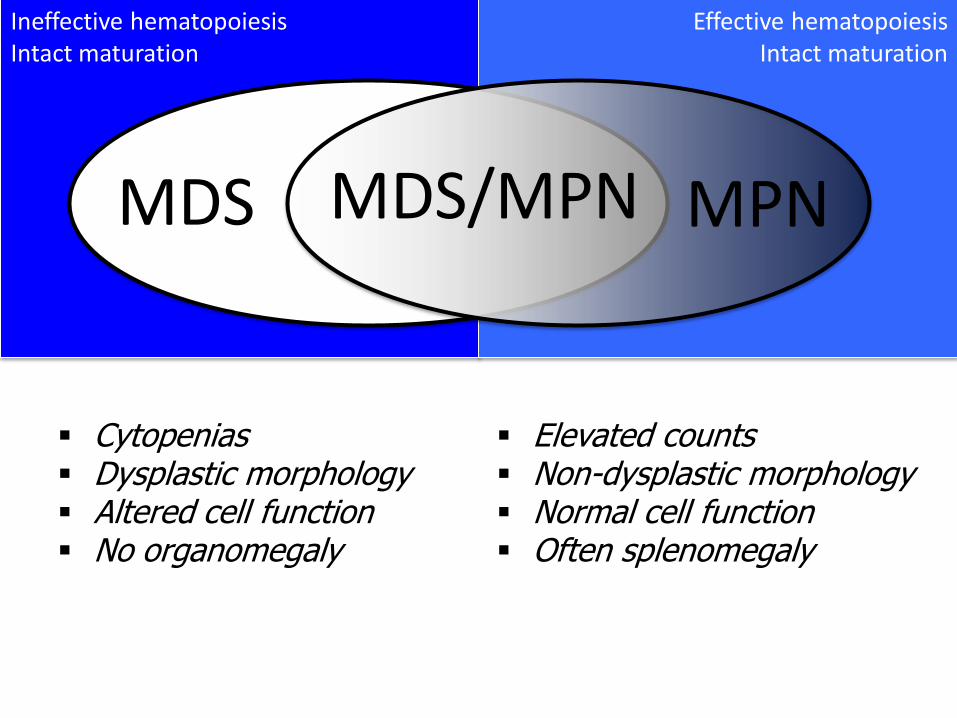
Ineffective hematopoiesis Intact maturation
Effective hematopoiesis Intact maturation
MDS/MPN MDS MPN
Cytopenias Dysplastic morphology Altered cell function No organomegaly
Elevated counts Non-dysplastic morphology Normal cell function Often splenomegaly
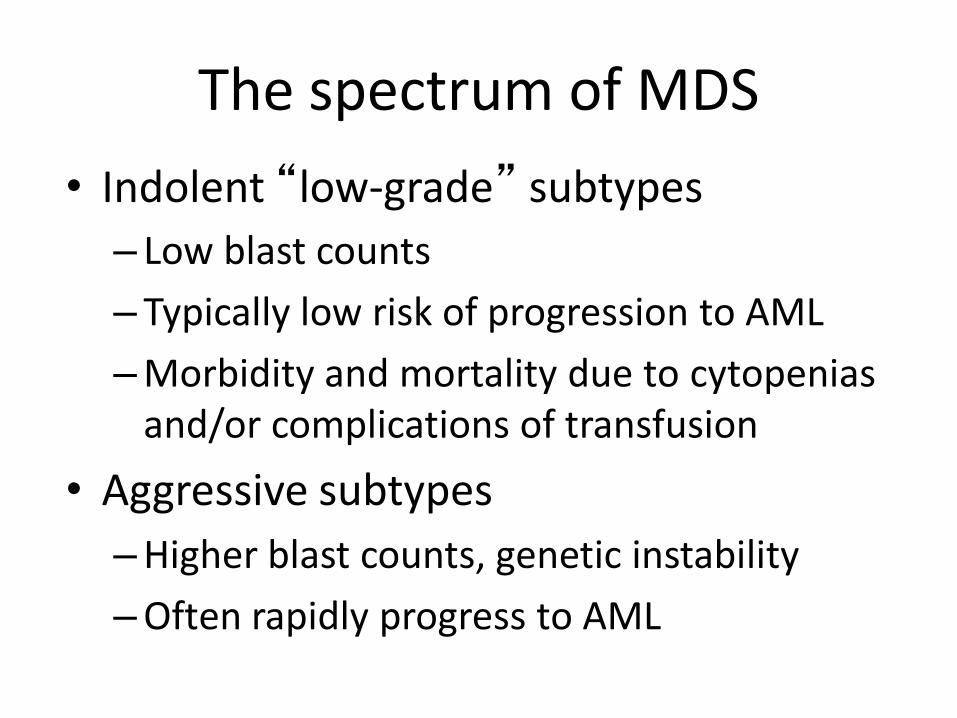
The spectrum of MDS
• Indolent “low-grade” subtypes
– Low blast counts
– Typically low risk of progression to AML
–Morbidity and mortality due to cytopenias and/or complications of transfusion
• Aggressive subtypes
–Higher blast counts, genetic instability
–Often rapidly progress to AML
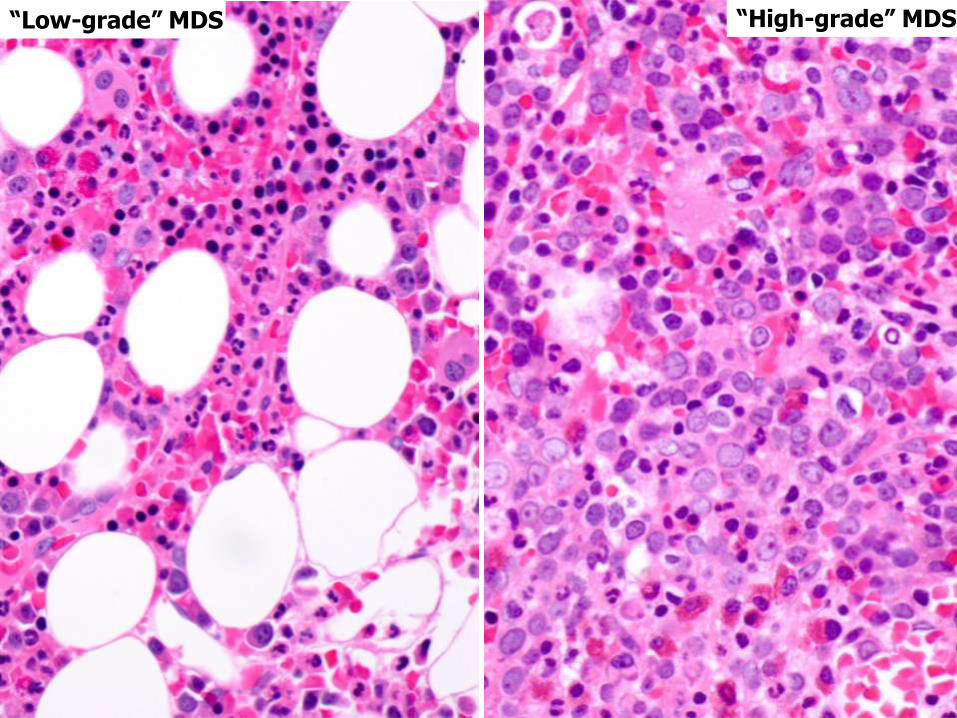
“Low-grade” MDS “High-grade” MDS

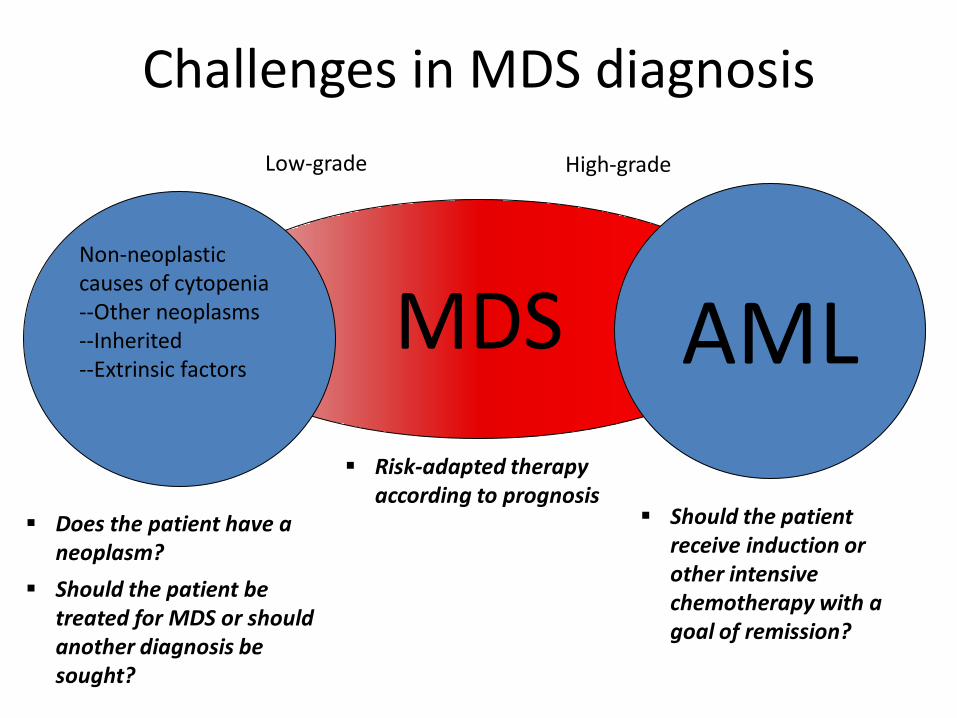
Challenges in MDS diagnosis
MDS Non-neoplastic causes of cytopenia --Other neoplasms --Inherited --Extrinsic factors
AML
Low-grade High-grade
Does the patient have a neoplasm?
Should the patient be treated for MDS or should another diagnosis be sought?
Should the patient receive induction or other intensive chemotherapy with a goal of remission?
Risk-adapted therapy according to prognosis
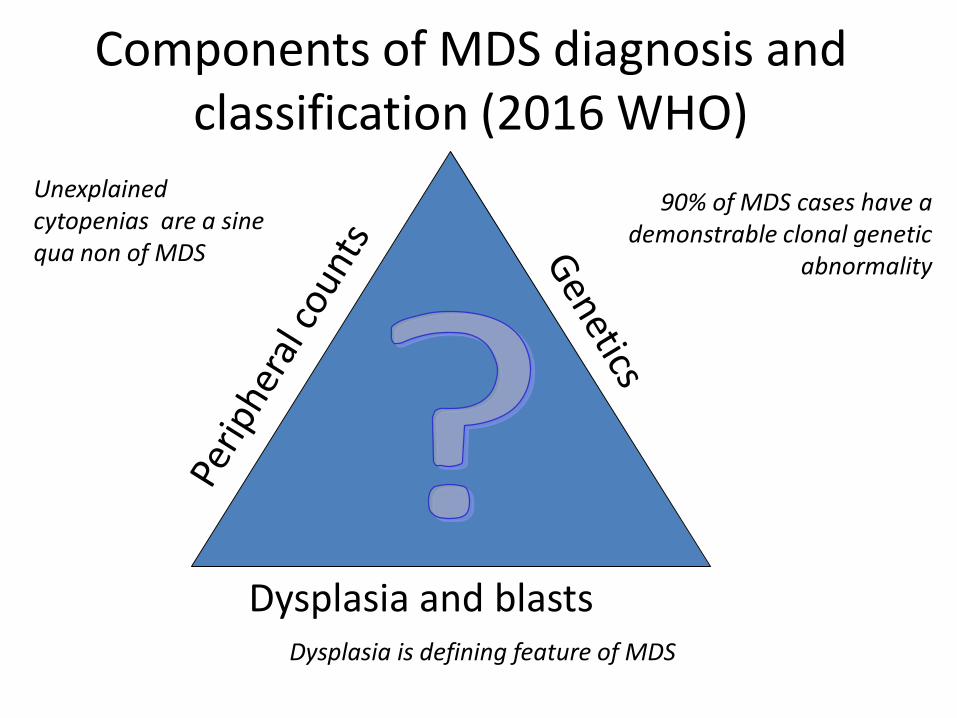
Components of MDS diagnosis and
classification (2016 WHO)
Dysplasia and blasts
Unexplained cytopenias are a sine qua non of MDS
90% of MDS cases have a demonstrable clonal genetic
abnormality
Dysplasia is defining feature of MDS
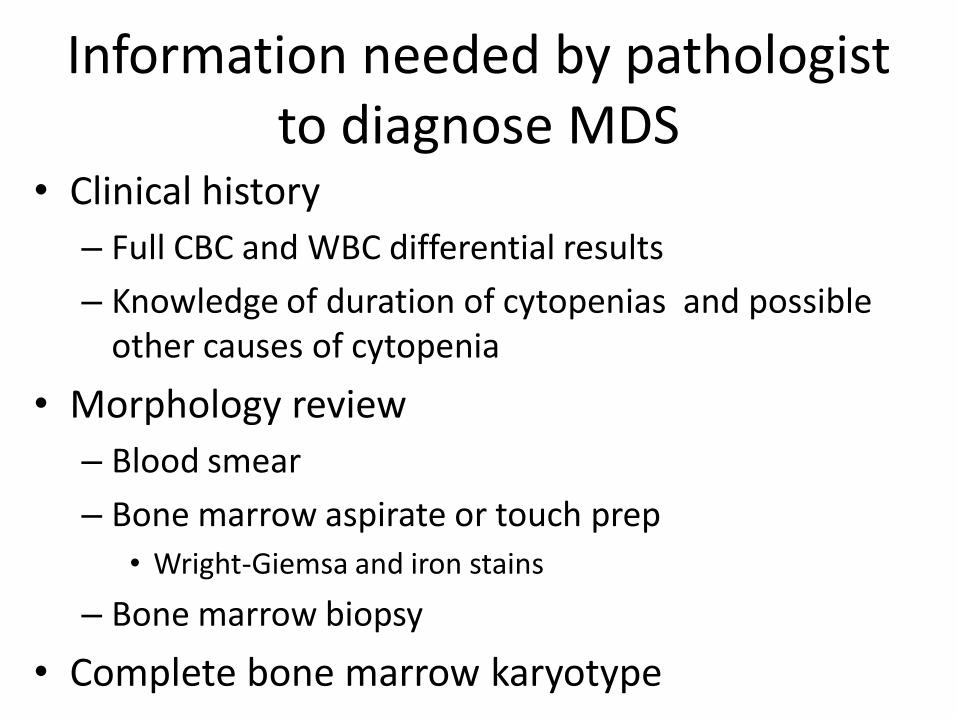
Information needed by pathologist to diagnose MDS
• Clinical history
– Full CBC and WBC differential results
– Knowledge of duration of cytopenias and possible other causes of cytopenia
• Morphology review
– Blood smear
– Bone marrow aspirate or touch prep
• Wright-Giemsa and iron stains
– Bone marrow biopsy
• Complete bone marrow karyotype
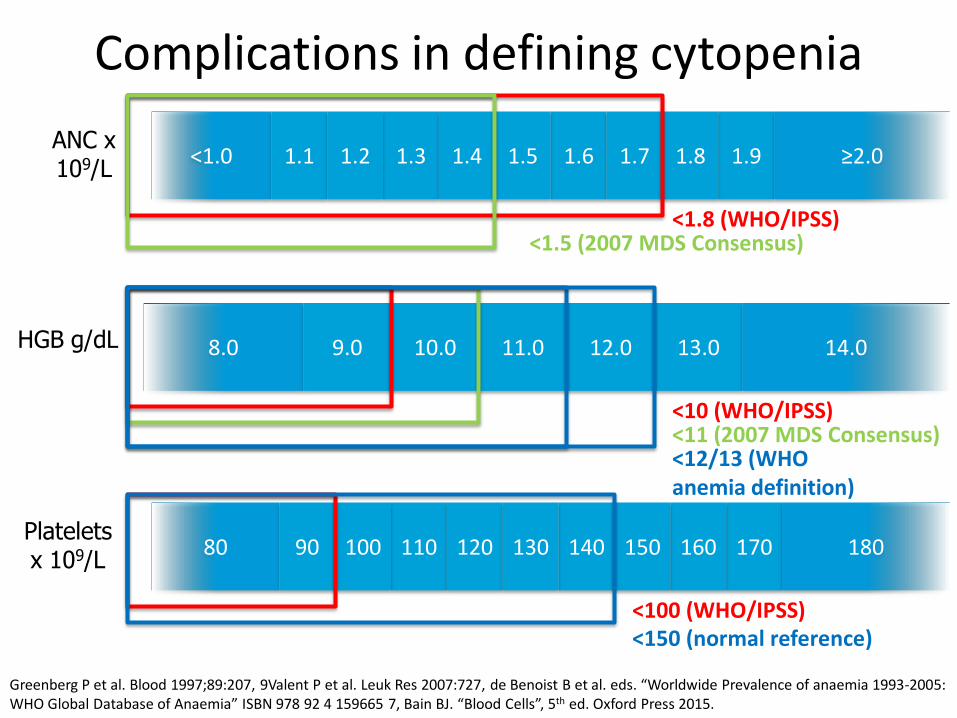
Complications in defining cytopenia
<1.0 1.1 1.3 1.6 1.9 1.8 1.2 1.7 1.4 1.5 ≥2.0
8.0 9.0 13.0 10.0 12.0 11.0 14.0
80 90 110 140 170 160 100 150 120 130 180 Platelets x 109/L
HGB g/dL
ANC x 109/L
<1.8 (WHO/IPSS) <1.5 (2007 MDS Consensus)
<10 (WHO/IPSS) <11 (2007 MDS Consensus) <12/13 (WHO anemia definition)
<100 (WHO/IPSS) <150 (normal reference)
Greenberg P et al. Blood 1997;89:207, 9Valent P et al. Leuk Res 2007:727, de Benoist B et al. eds. “Worldwide Prevalence of anaemia 1993-2005: WHO Global Database of Anaemia” ISBN 978 92 4 159665 7, Bain BJ. “Blood Cells”, 5th ed. Oxford Press 2015.
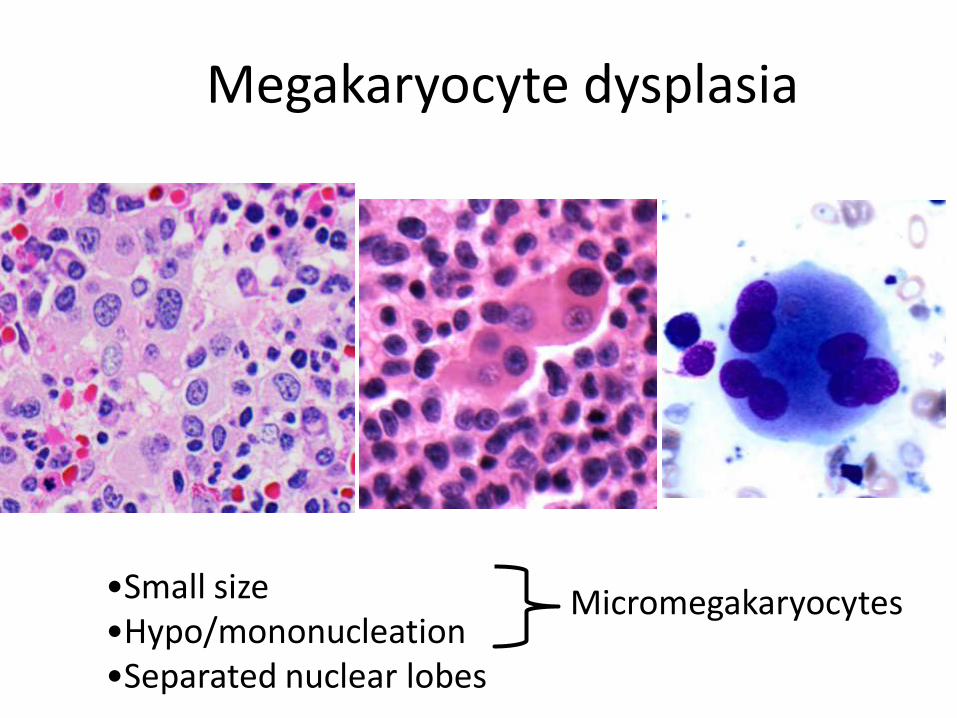
Megakaryocyte dysplasia
•Small size •Hypo/mononucleation •Separated nuclear lobes
Micromegakaryocytes
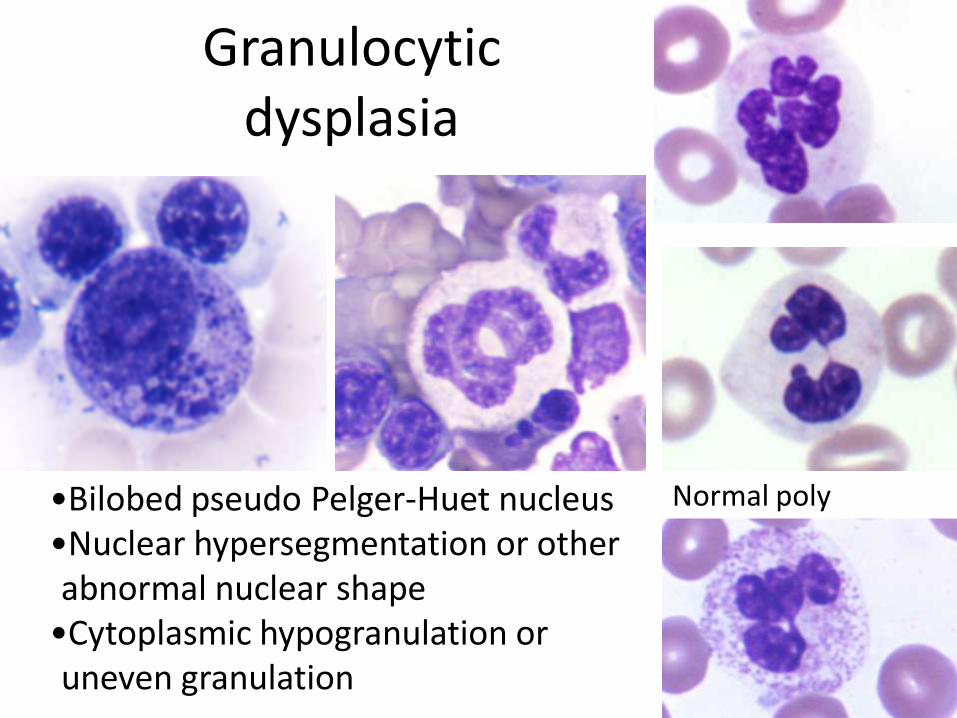
Granulocytic dysplasia
•Bilobed pseudo Pelger-Huet nucleus •Nuclear hypersegmentation or other abnormal nuclear shape
•Cytoplasmic hypogranulation or uneven granulation
Normal poly
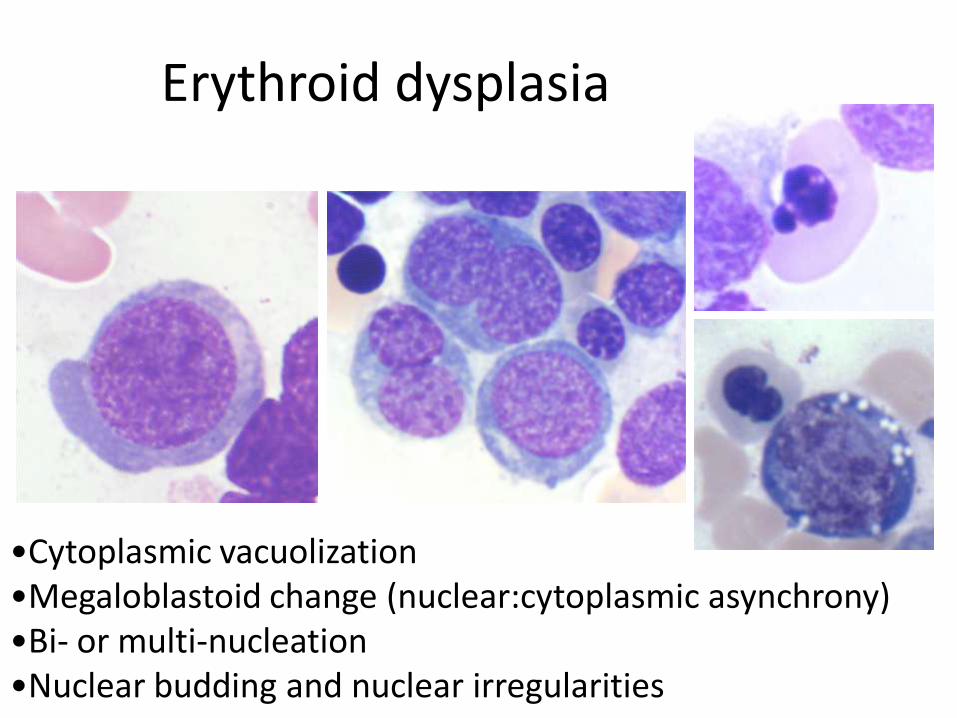
Erythroid dysplasia
•Cytoplasmic vacuolization •Megaloblastoid change (nuclear:cytoplasmic asynchrony) •Bi- or multi-nucleation •Nuclear budding and nuclear irregularities
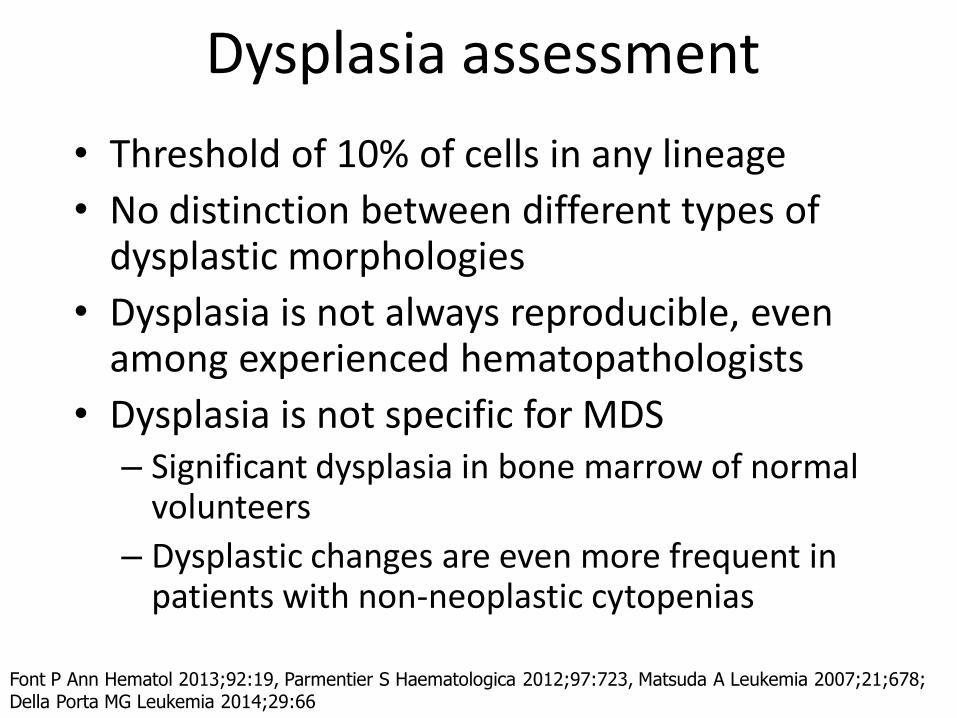
Dysplasia assessment
• Threshold of 10% of cells in any lineage
• No distinction between different types of dysplastic morphologies
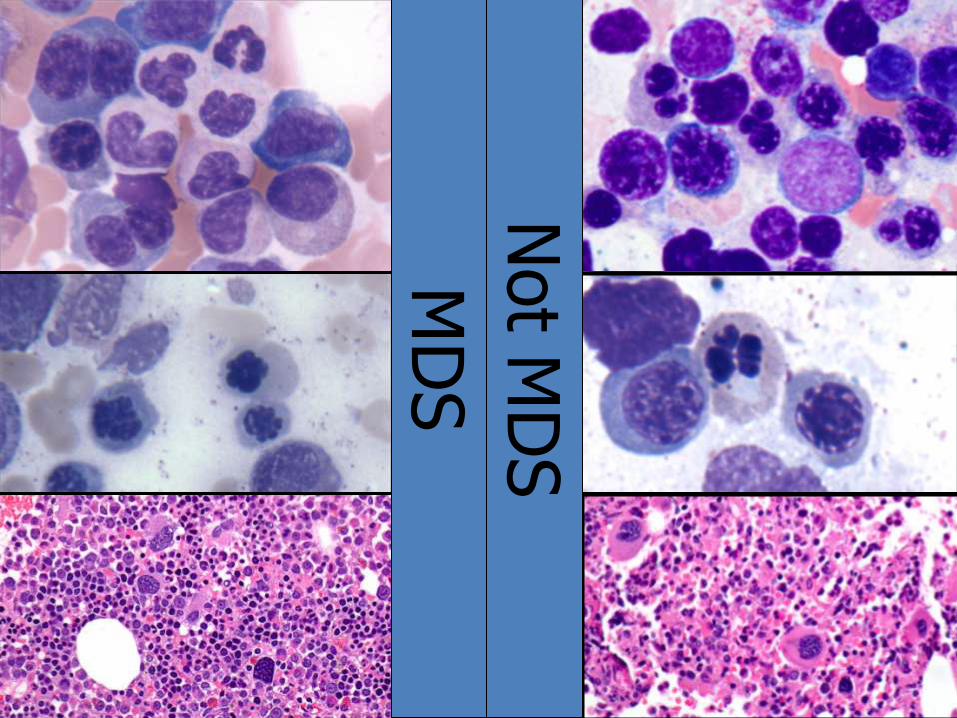
• Dysplasia is not always reproducible, even among experienced hematopathologists
• Dysplasia is not specific for MDS – Significant dysplasia in bone marrow of normal
volunteers
– Dysplastic changes are even more frequent in patients with non-neoplastic cytopenias
Font P Ann Hematol 2013;92:19, Parmentier S Haematologica 2012;97:723, Matsuda A Leukemia 2007;21;678; Della Porta MG Leukemia 2014;29:66
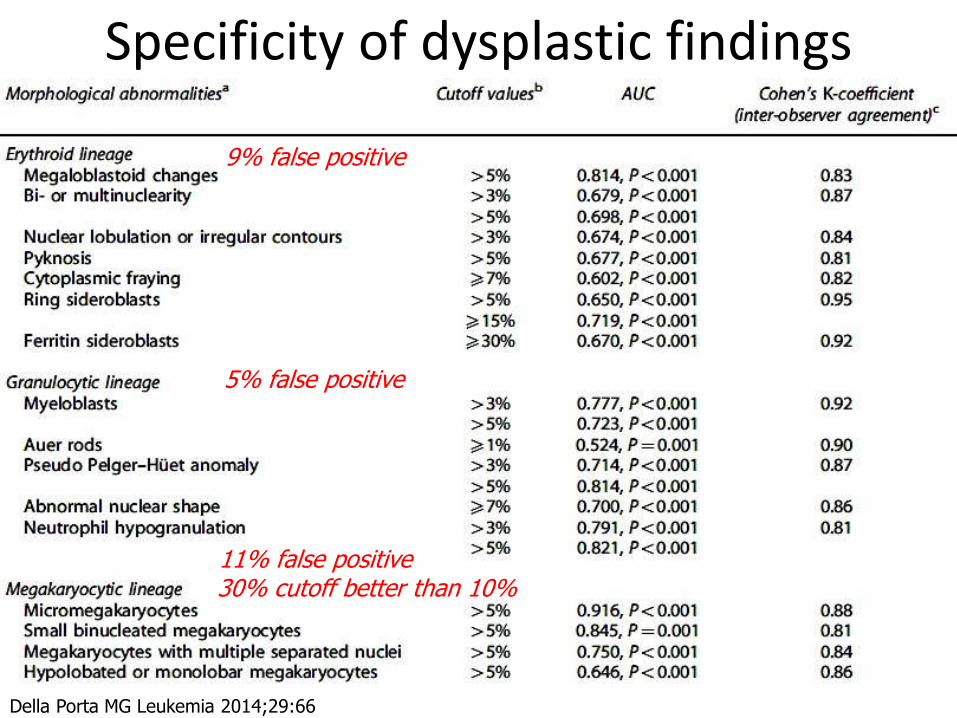
Specificity of dysplastic findings
Della Porta MG Leukemia 2014;29:66
9% false positive
5% false positive
11% false positive 30% cutoff better than 10%
MD
S
Not M
DS
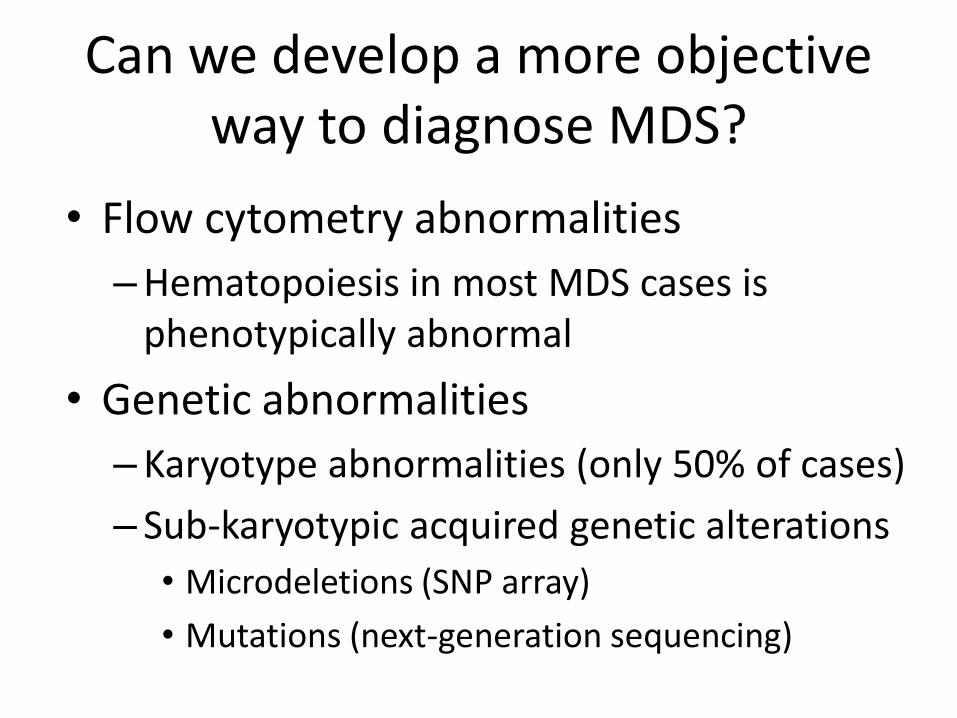
Can we develop a more objective way to diagnose MDS?
• Flow cytometry abnormalities
–Hematopoiesis in most MDS cases is phenotypically abnormal
• Genetic abnormalities
–Karyotype abnormalities (only 50% of cases)
– Sub-karyotypic acquired genetic alterations
• Microdeletions (SNP array)
• Mutations (next-generation sequencing)
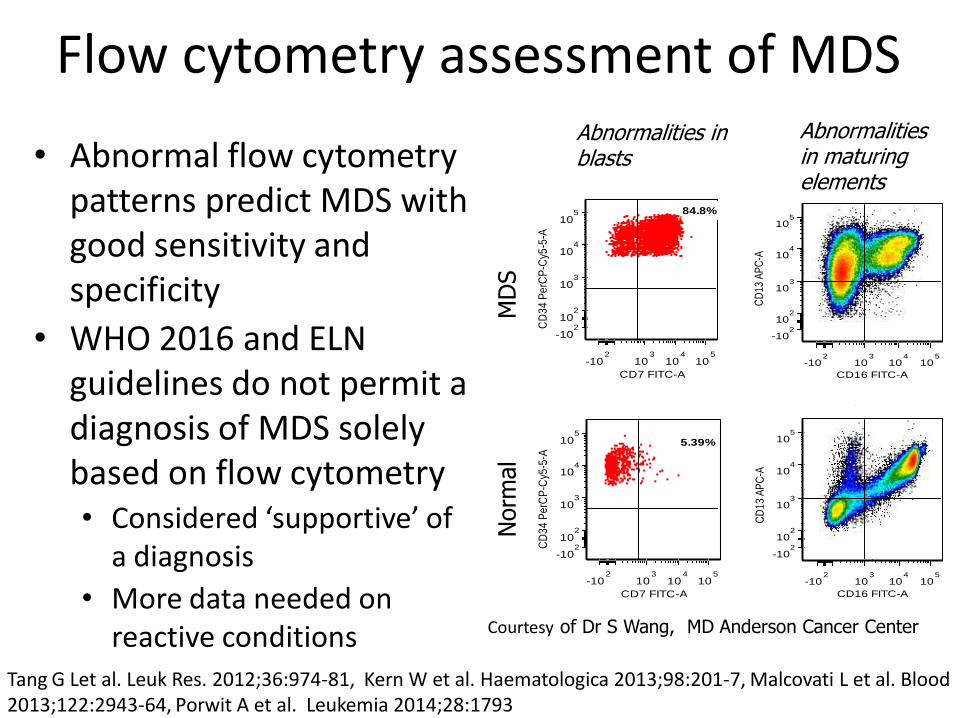
Flow cytometry assessment of MDS
• Abnormal flow cytometry patterns predict MDS with good sensitivity and specificity
• WHO 2016 and ELN guidelines do not permit a diagnosis of MDS solely based on flow cytometry • Considered ‘supportive’ of
a diagnosis
• More data needed on reactive conditions
Tang G Let al. Leuk Res. 2012;36:974-81, Kern W et al. Haematologica 2013;98:201-7, Malcovati L et al. Blood 2013;122:2943-64, Porwit A et al. Leukemia 2014;28:1793
MACKEY JR 1013078 BML_01 16-11b-34-33-13---19-45.f cs
Granulocy tes
CD16 FITC-A
CD
13 A
PC
-A
-102
103
104
105
-102
102
103
104
105
MOORE 762830 BML_01 16-11b-34-33-13---19-45.f cs
Granulocy tes
CD16 FITC-A
CD
13 A
PC
-A
-102
103
104
105
-102
102
103
104
105
MACKEY JR 1013078 BML_02 7-64-34-10-2---14-45.fcs
Clean blast 01
CD7 FITC-A
CD
34
Pe
rCP
-Cy5
-5-A
-102
103
104
105
-102
102
103
104
105 84.8%
MOORE 762830 BML_02 7-64-34-10-2---14-45.fcs
Clean blast 01
CD7 FITC-A
CD
34
Pe
rCP
-Cy5
-5-A
-102
103
104
105
-102
102
103
104
105
5.39%
MD
S
Norm
al
Courtesy of Dr S Wang, MD Anderson Cancer Center
Abnormalities in blasts
Abnormalities in maturing elements
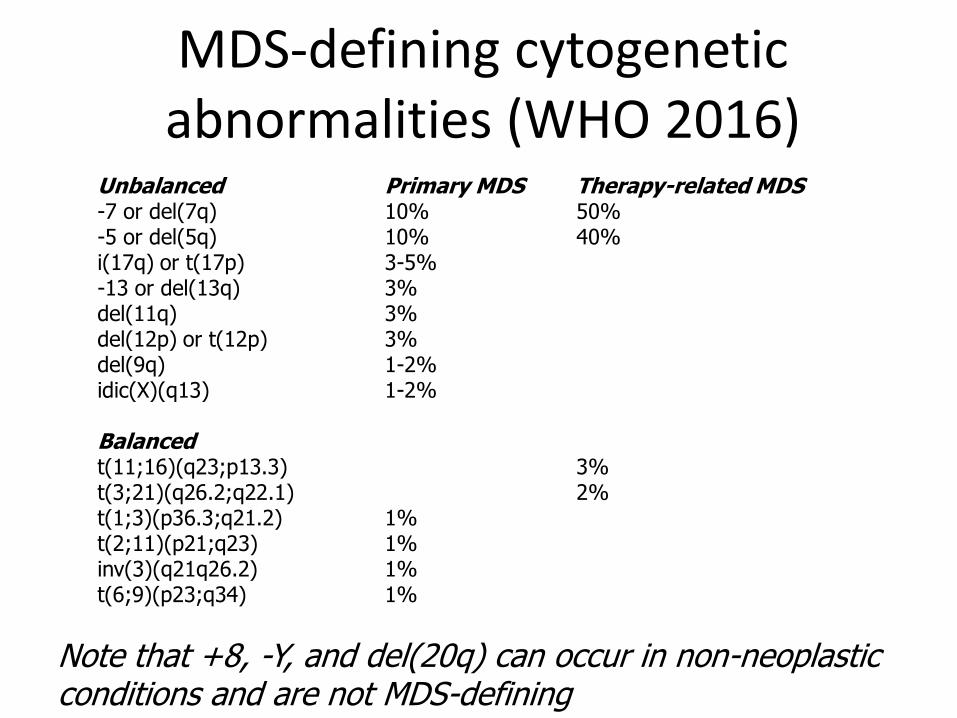
MDS-defining cytogenetic abnormalities (WHO 2016)
Unbalanced Primary MDS Therapy-related MDS -7 or del(7q) 10% 50% -5 or del(5q) 10% 40% i(17q) or t(17p) 3-5% -13 or del(13q) 3% del(11q) 3% del(12p) or t(12p) 3% del(9q) 1-2% idic(X)(q13) 1-2% Balanced t(11;16)(q23;p13.3) 3% t(3;21)(q26.2;q22.1) 2% t(1;3)(p36.3;q21.2) 1% t(2;11)(p21;q23) 1% inv(3)(q21q26.2) 1% t(6;9)(p23;q34) 1%
Note that +8, -Y, and del(20q) can occur in non-neoplastic conditions and are not MDS-defining
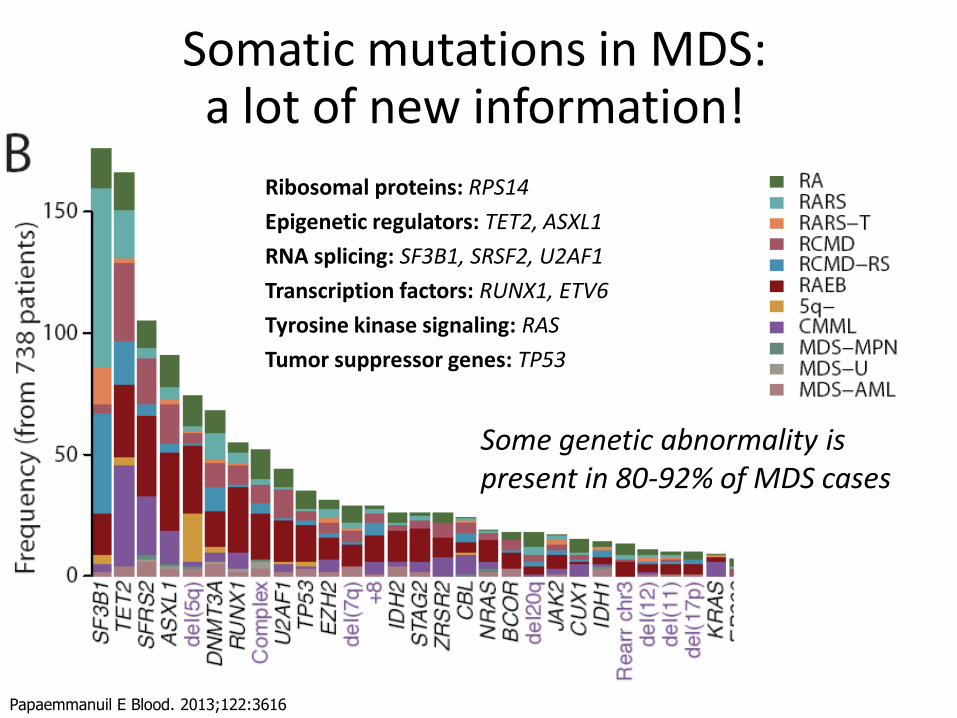
Somatic mutations in MDS: a lot of new information!
Papaemmanuil E Blood. 2013;122:3616
Ribosomal proteins: RPS14
Epigenetic regulators: TET2, ASXL1
RNA splicing: SF3B1, SRSF2, U2AF1
Transcription factors: RUNX1, ETV6
Tyrosine kinase signaling: RAS
Tumor suppressor genes: TP53
Some genetic abnormality is present in 80-92% of MDS cases
Impact of the explosive advance of molecular genetics on MDS
• Can mutations be used to diagnose MDS?
• Should MDS entities be defined by common molecular lesions or by common morphologic/clinical features?
• Major caveats
– Molecular genetic testing availability is not keeping up with its increasing relevance
– Data is actively accumulating (“moving target”)
“Clonal Hematopoiesis of Indeterminate Potential” (CHIP)
• A proportion of apparently healthy aging individuals harbor somatic MDS-type mutations in hematopoietic cells
– DNMT3A, TET2, ASXL1, TP53, JAK2, SF3B1
– Allele burden typically 10-20% in blood, can be higher
– Associated with increased risk of subsequent hematologic malignancy and death from other causes
– Many patients never develop cytopenias or MDS even after many years of followup
Jaiswal S et al. NEJM 2014;371:2488, Genovese G et al. NEJM 2014;371:2477, Xie M et al. Nature Med 2014;20:1472; Steensma D et al. Blood 2015;126:9
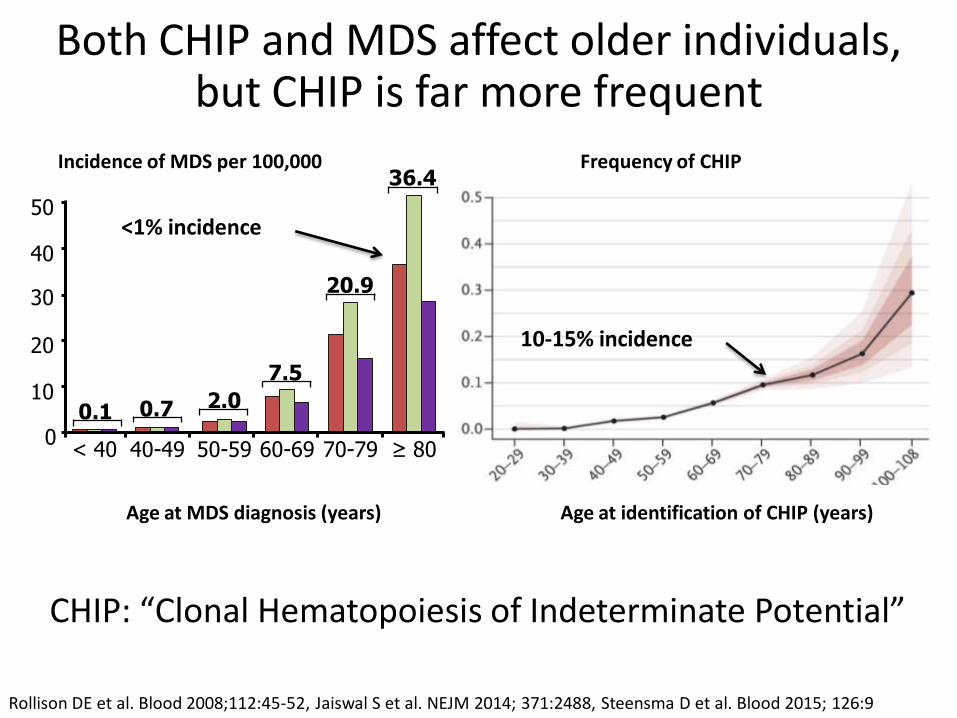
Age at MDS diagnosis (years)
0
10
20
30
40
50
< 40 40-49 50-59 60-69 70-79 ≥ 80
0.1 0.7 2.0
7.5
20.9
36.4
Age at identification of CHIP (years)
Rollison DE et al. Blood 2008;112:45-52, Jaiswal S et al. NEJM 2014; 371:2488, Steensma D et al. Blood 2015; 126:9
Incidence of MDS per 100,000 Frequency of CHIP
Both CHIP and MDS affect older individuals, but CHIP is far more frequent
CHIP: “Clonal Hematopoiesis of Indeterminate Potential”
<1% incidence
10-15% incidence
What is sufficient to diagnose MDS in a cytopenic patient in 2016?
Observation Sufficient to diagnose MDS in isolation?
Dysplastic morphology (≥10%)
Yes, provided possible secondary causes of cytopenia and dysplasia are excluded clinically
Excess marrow blasts (≥5%)
Yes, provided marrow recovery or growth factor effect are excluded
Cytogenetic abnormality
Yes, provided it is on the WHO list of ‘approved’ abnormalities*
Flow cytometry abnormality
No, but can support an MDS diagnosis suspected by other observations
MDS-type mutation No, these can be found in normal individuals and more study is needed (“Clonal hematopoiesis of indeterminate potential”)
*Specifically excluded are –Y, +8, and del(20q)
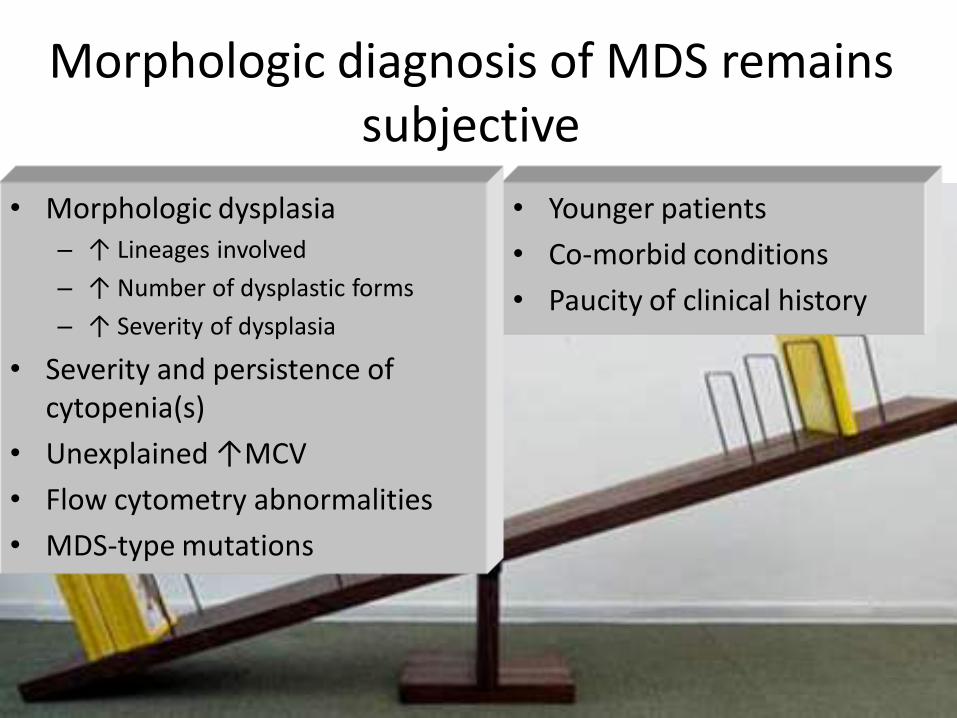
Morphologic diagnosis of MDS remains subjective
• Younger patients
• Co-morbid conditions
• Paucity of clinical history
• Morphologic dysplasia – ↑ Lineages involved
– ↑ Number of dysplastic forms
– ↑ Severity of dysplasia
• Severity and persistence of cytopenia(s)
• Unexplained ↑MCV
• Flow cytometry abnormalities
• MDS-type mutations
Challenges in MDS diagnosis
MDS Non-neoplastic causes of cytopenia --Other neoplasms --Inherited --Extrinsic factors
AML
Low-grade High-grade
Does the patient have a neoplasm?
Should the patient be treated for MDS or should another diagnosis be sought?
Should the patient receive induction or other intensive chemotherapy with a goal of remission?
Risk-adapted therapy according to prognosis
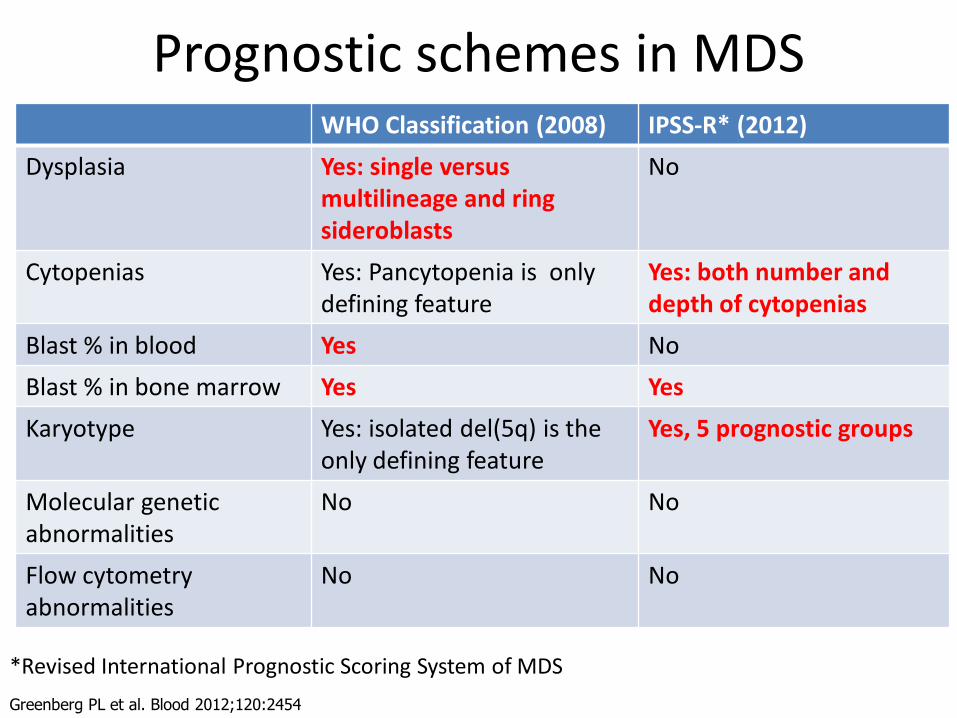
Prognostic schemes in MDS WHO Classification (2008) IPSS-R* (2012)
Dysplasia Yes: single versus multilineage and ring sideroblasts
No
Cytopenias Yes: Pancytopenia is only defining feature
Yes: both number and depth of cytopenias
Blast % in blood Yes No
Blast % in bone marrow Yes Yes
Karyotype Yes: isolated del(5q) is the only defining feature
Yes, 5 prognostic groups
Molecular genetic abnormalities
No No
Flow cytometry abnormalities
No No
Greenberg PL et al. Blood 2012;120:2454
*Revised International Prognostic Scoring System of MDS
Greenberg PL et al. Blood 2012;120:2454
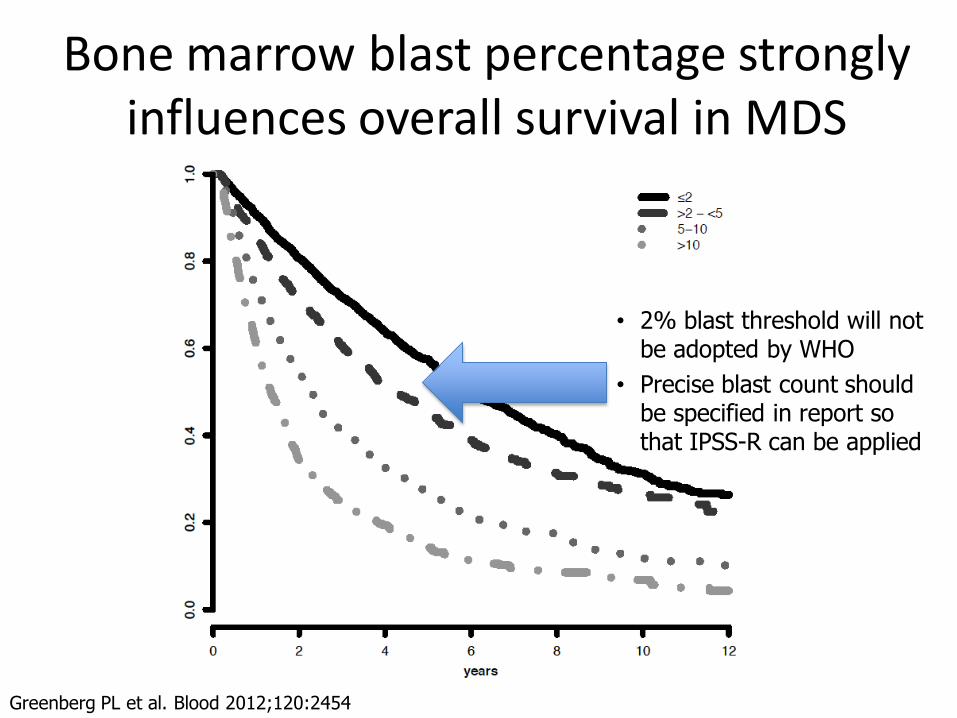
Bone marrow blast percentage strongly influences overall survival in MDS
• 2% blast threshold will not be adopted by WHO
• Precise blast count should be specified in report so that IPSS-R can be applied
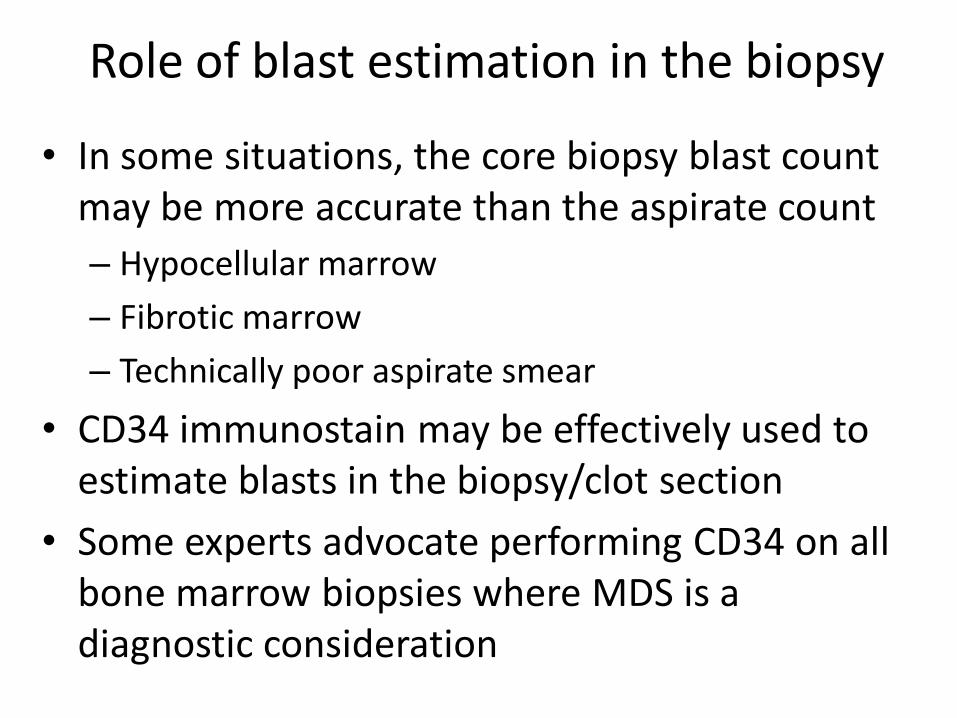
Role of blast estimation in the biopsy
• In some situations, the core biopsy blast count may be more accurate than the aspirate count
– Hypocellular marrow
– Fibrotic marrow
– Technically poor aspirate smear
• CD34 immunostain may be effectively used to estimate blasts in the biopsy/clot section
• Some experts advocate performing CD34 on all bone marrow biopsies where MDS is a diagnostic consideration
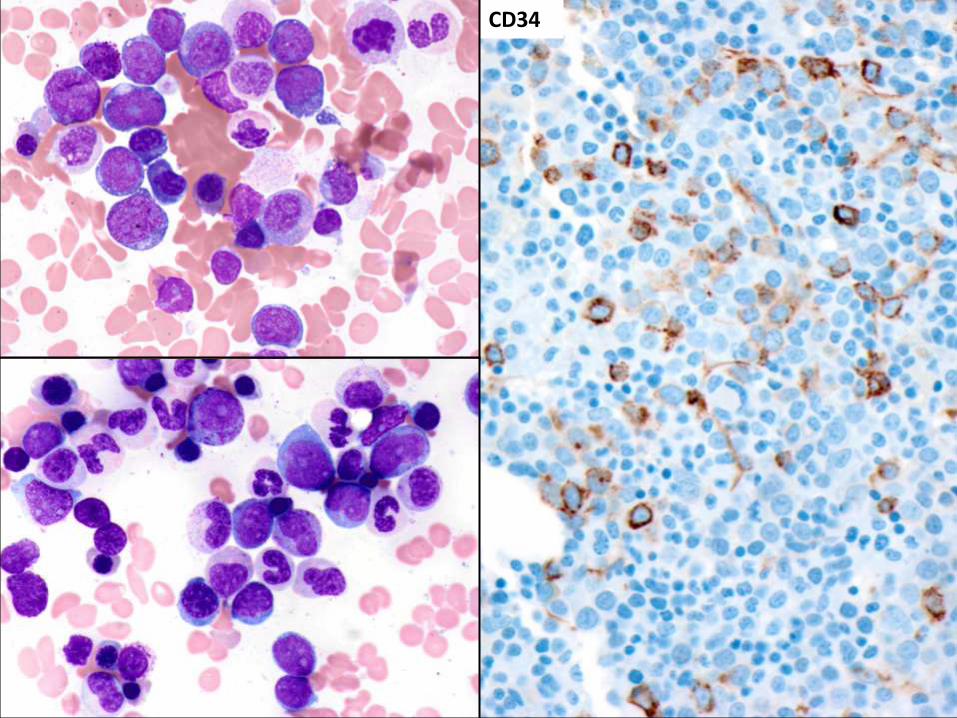
CD34
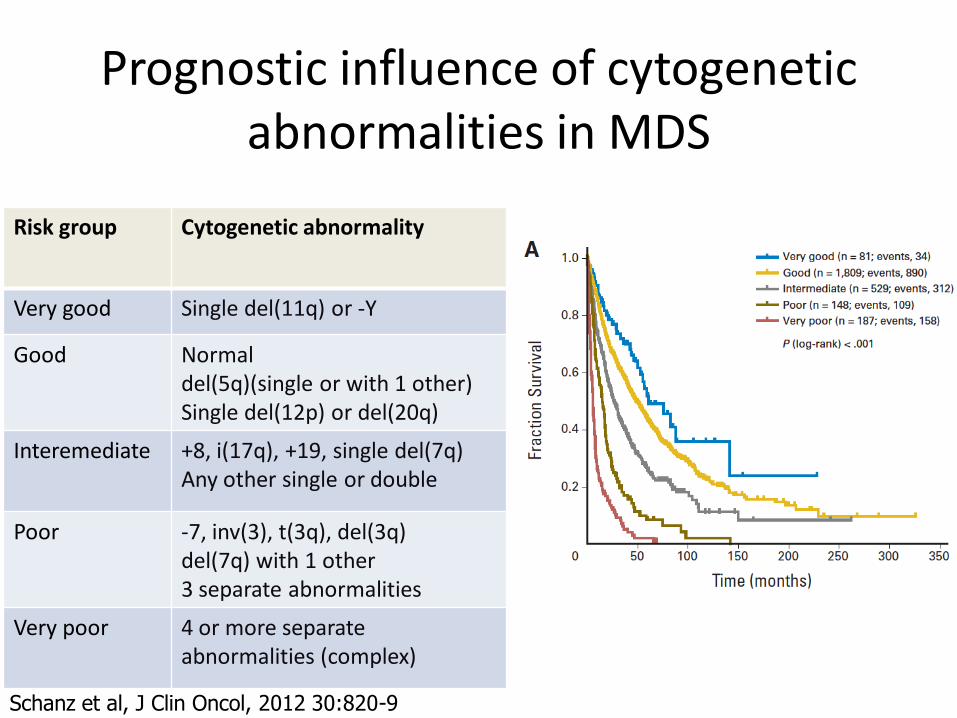
Prognostic influence of cytogenetic abnormalities in MDS
Risk group Cytogenetic abnormality
Very good Single del(11q) or -Y
Good Normal del(5q)(single or with 1 other) Single del(12p) or del(20q)
Interemediate +8, i(17q), +19, single del(7q) Any other single or double
Poor -7, inv(3), t(3q), del(3q) del(7q) with 1 other 3 separate abnormalities
Very poor 4 or more separate abnormalities (complex)
Schanz et al, J Clin Oncol, 2012 30:820-9
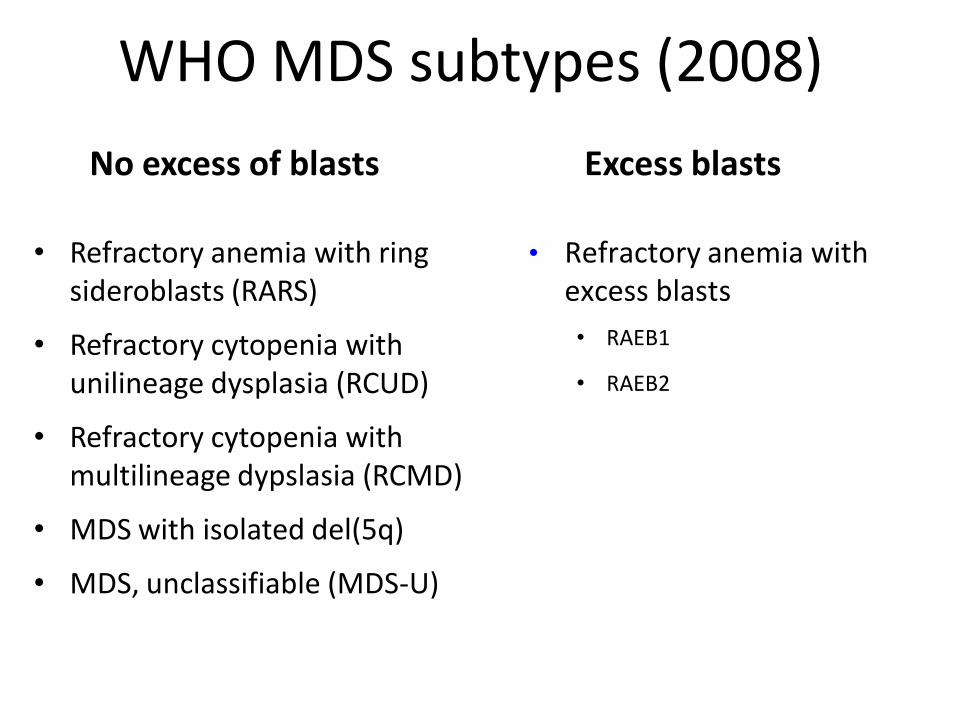
WHO MDS subtypes (2008)
• Refractory anemia with ring sideroblasts (RARS)
• Refractory cytopenia with unilineage dysplasia (RCUD)
• Refractory cytopenia with multilineage dypslasia (RCMD)
• MDS with isolated del(5q)
• MDS, unclassifiable (MDS-U)
• Refractory anemia with excess blasts
• RAEB1
• RAEB2
No excess of blasts Excess blasts
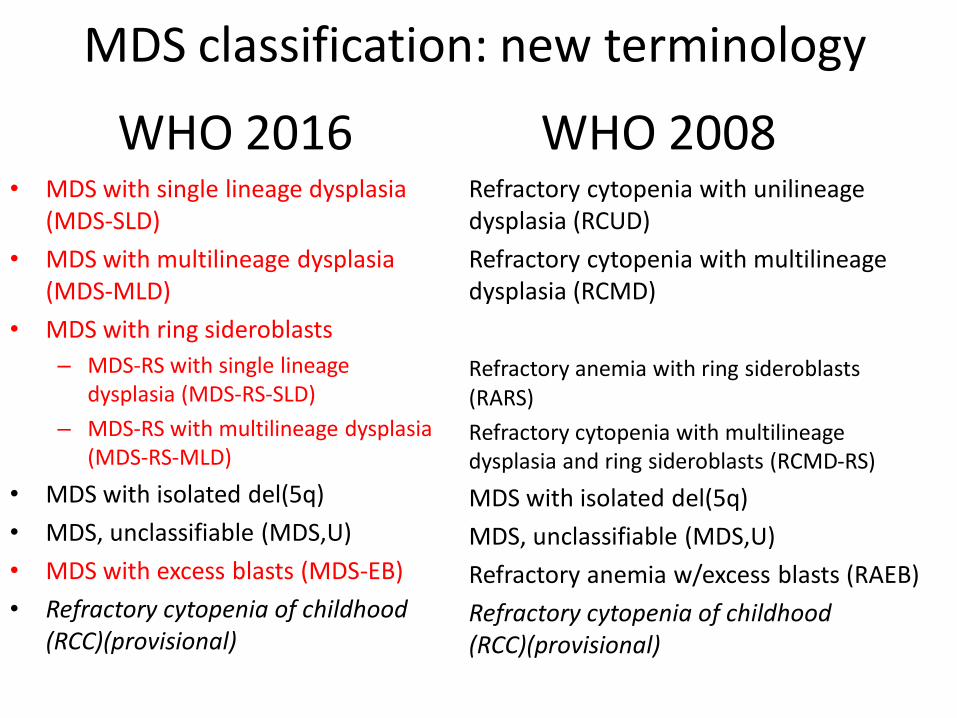
WHO 2016 • MDS with single lineage dysplasia
(MDS-SLD)
• MDS with multilineage dysplasia (MDS-MLD)
• MDS with ring sideroblasts
– MDS-RS with single lineage dysplasia (MDS-RS-SLD)
– MDS-RS with multilineage dysplasia (MDS-RS-MLD)
• MDS with isolated del(5q)
• MDS, unclassifiable (MDS,U)
• MDS with excess blasts (MDS-EB)
• Refractory cytopenia of childhood (RCC)(provisional)
Refractory cytopenia with unilineage dysplasia (RCUD)
Refractory cytopenia with multilineage dysplasia (RCMD)
Refractory anemia with ring sideroblasts (RARS)
Refractory cytopenia with multilineage dysplasia and ring sideroblasts (RCMD-RS)
MDS with isolated del(5q)
MDS, unclassifiable (MDS,U)
Refractory anemia w/excess blasts (RAEB)
Refractory cytopenia of childhood (RCC)(provisional)
WHO 2008
MDS classification: new terminology
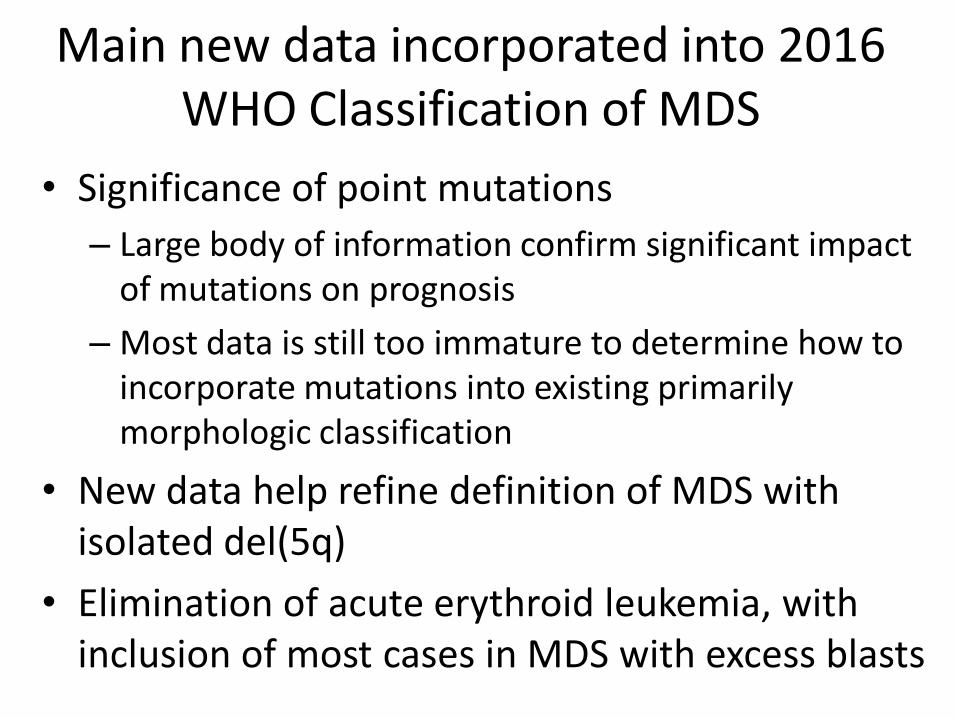
Main new data incorporated into 2016 WHO Classification of MDS
• Significance of point mutations
– Large body of information confirm significant impact of mutations on prognosis
– Most data is still too immature to determine how to incorporate mutations into existing primarily morphologic classification
• New data help refine definition of MDS with isolated del(5q)
• Elimination of acute erythroid leukemia, with inclusion of most cases in MDS with excess blasts

MDS with isolated del(5q)
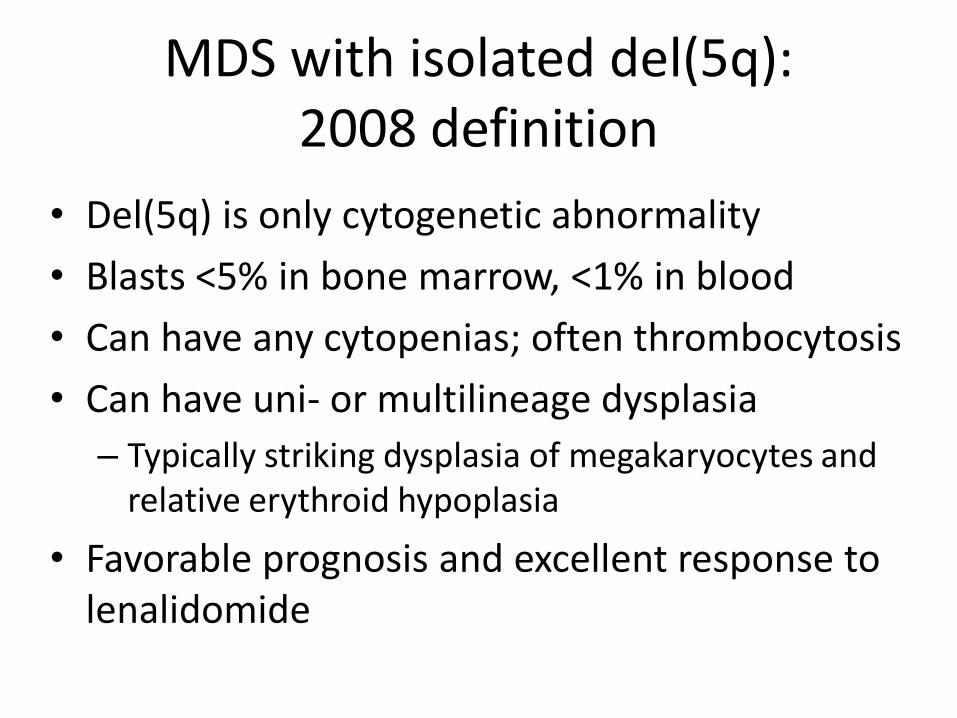
MDS with isolated del(5q): 2008 definition
• Del(5q) is only cytogenetic abnormality
• Blasts <5% in bone marrow, <1% in blood
• Can have any cytopenias; often thrombocytosis
• Can have uni- or multilineage dysplasia
– Typically striking dysplasia of megakaryocytes and relative erythroid hypoplasia
• Favorable prognosis and excellent response to lenalidomide
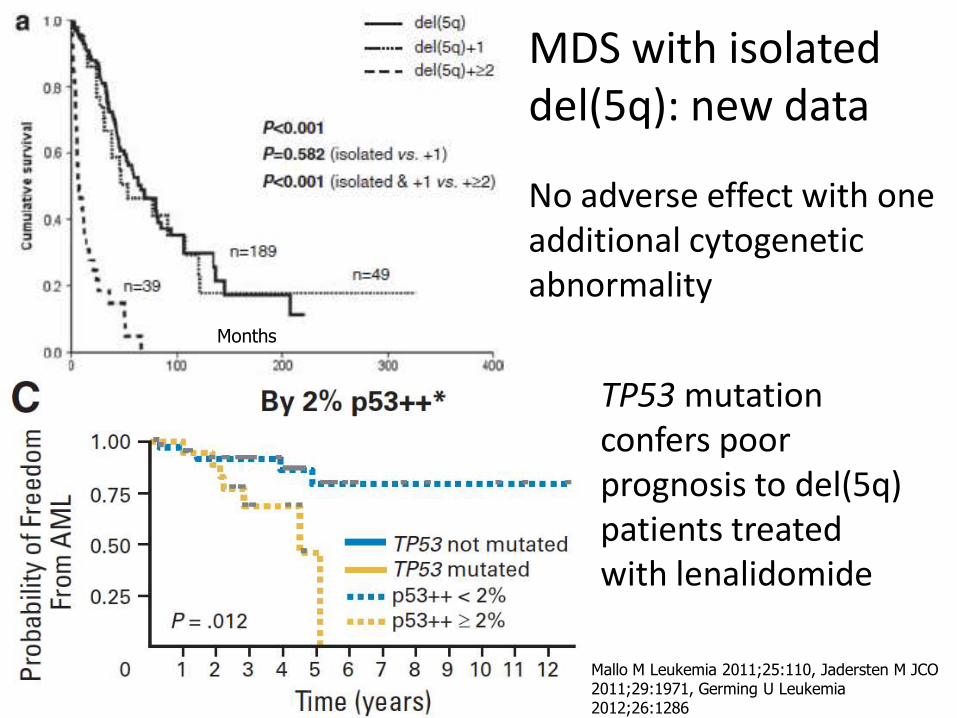
No adverse effect with one additional cytogenetic abnormality
TP53 mutation confers poor prognosis to del(5q) patients treated with lenalidomide
Mallo M Leukemia 2011;25:110, Jadersten M JCO 2011;29:1971, Germing U Leukemia 2012;26:1286
Months
MDS with isolated del(5q): new data
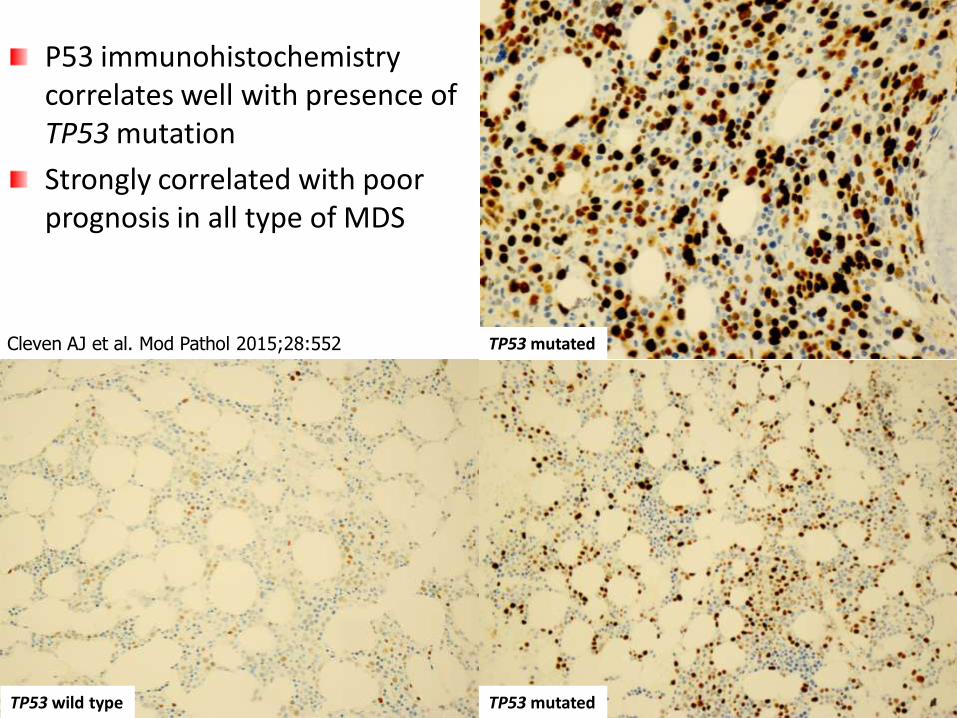
P53 immunohistochemistry correlates well with presence of TP53 mutation
Strongly correlated with poor prognosis in all type of MDS
Cleven AJ et al. Mod Pathol 2015;28:552
TP53 wild type TP53 mutated
TP53 mutated
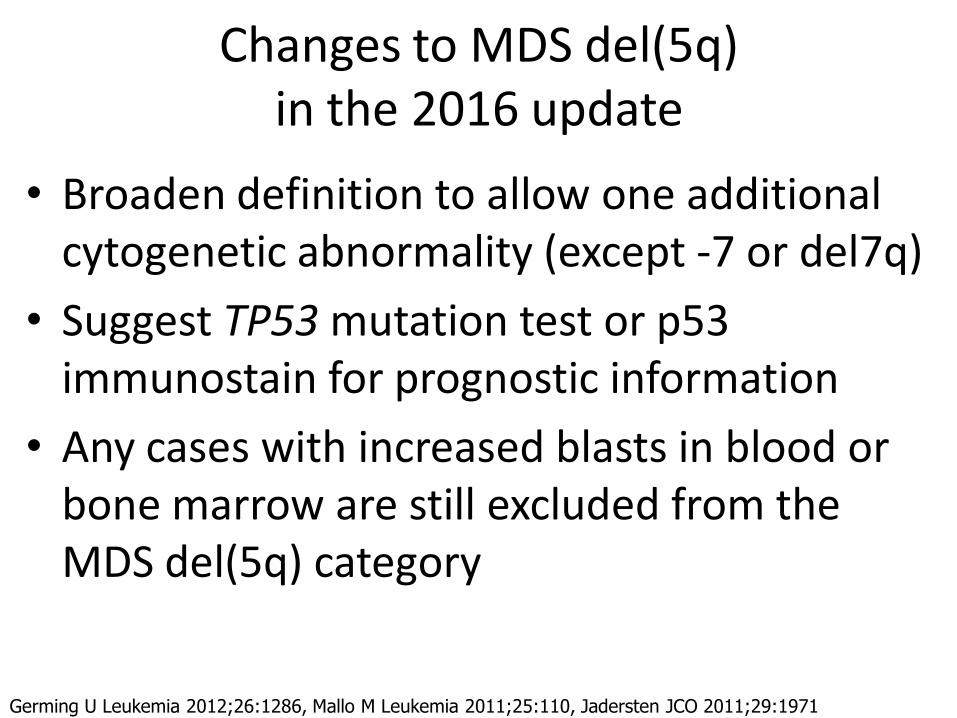
Changes to MDS del(5q) in the 2016 update
• Broaden definition to allow one additional cytogenetic abnormality (except -7 or del7q)
• Suggest TP53 mutation test or p53 immunostain for prognostic information
• Any cases with increased blasts in blood or bone marrow are still excluded from the MDS del(5q) category
Germing U Leukemia 2012;26:1286, Mallo M Leukemia 2011;25:110, Jadersten JCO 2011;29:1971
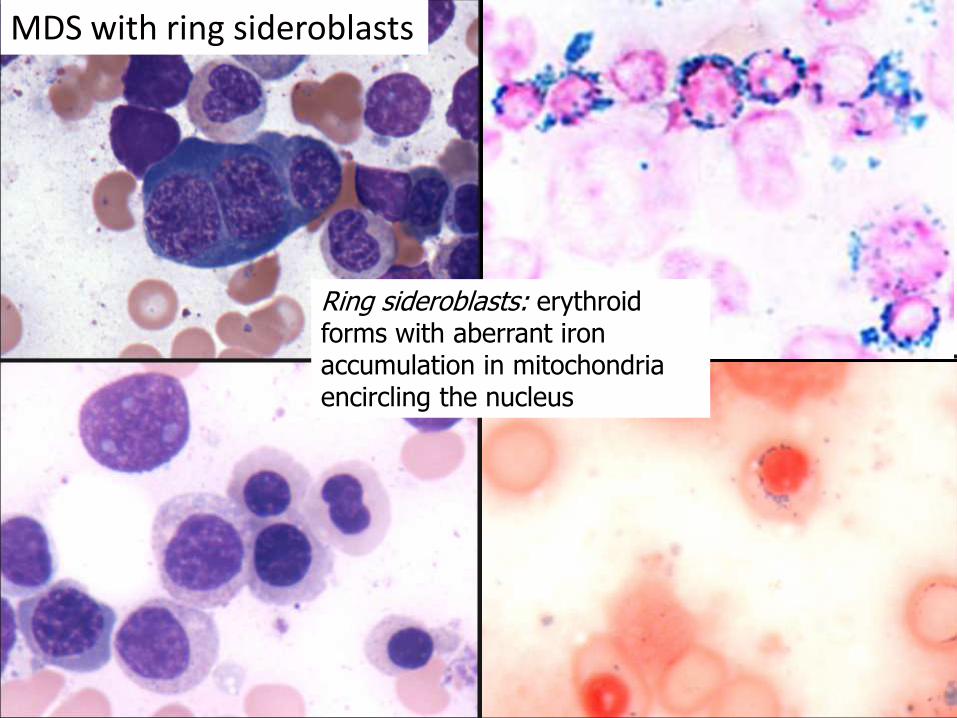
Ring sideroblasts: erythroid forms with aberrant iron accumulation in mitochondria encircling the nucleus
MDS with ring sideroblasts
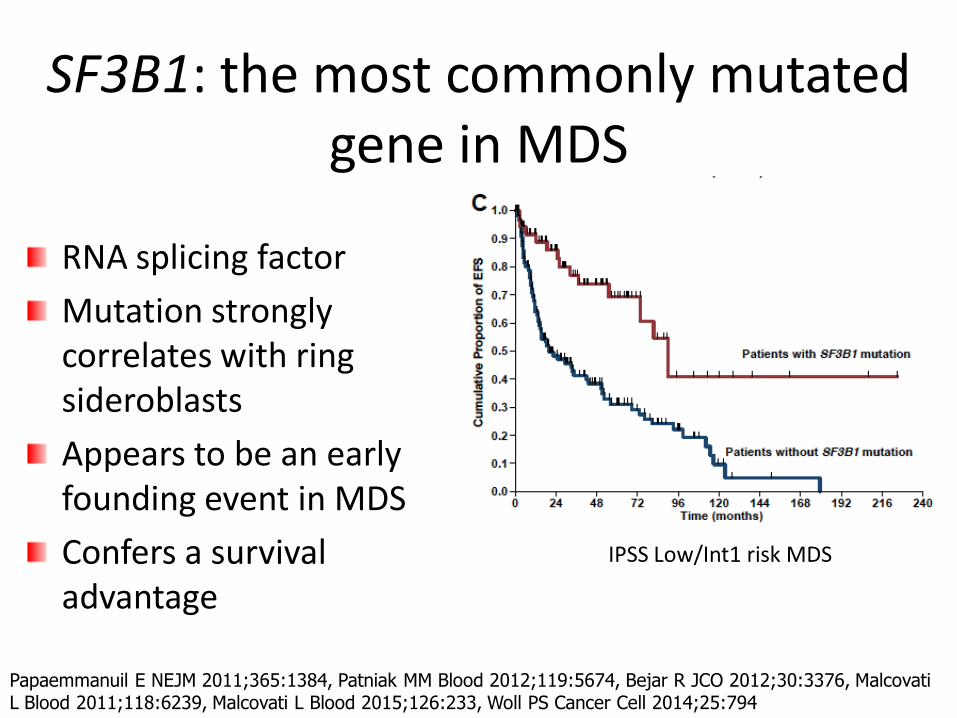
SF3B1: the most commonly mutated gene in MDS
RNA splicing factor
Mutation strongly correlates with ring sideroblasts
Appears to be an early founding event in MDS
Confers a survival advantage
IPSS Low/Int1 risk MDS
Papaemmanuil E NEJM 2011;365:1384, Patniak MM Blood 2012;119:5674, Bejar R JCO 2012;30:3376, Malcovati L Blood 2011;118:6239, Malcovati L Blood 2015;126:233, Woll PS Cancer Cell 2014;25:794
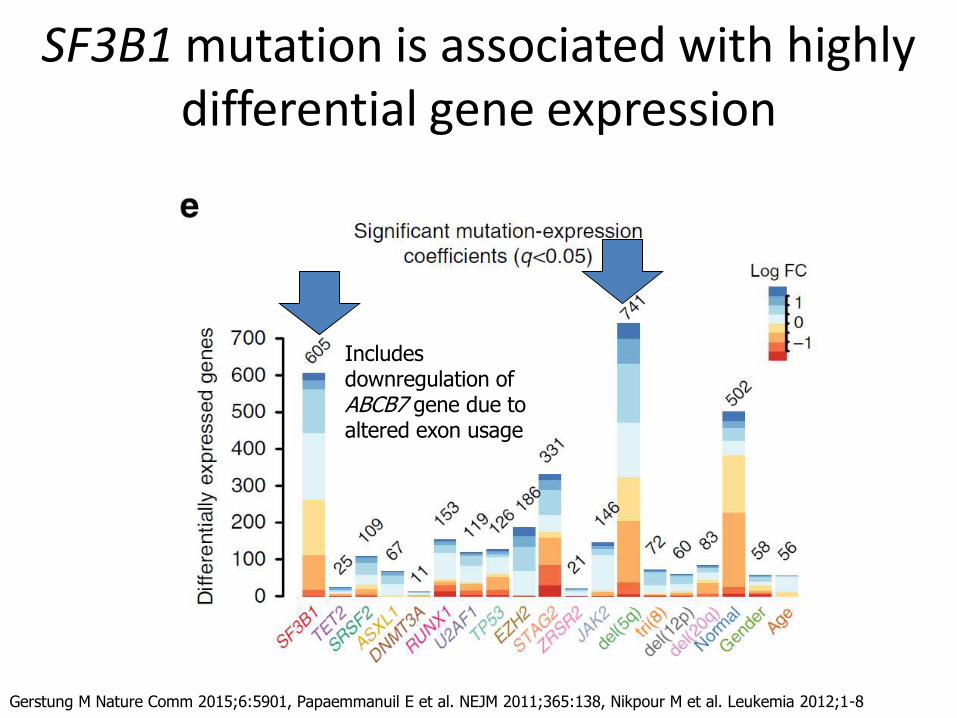
SF3B1 mutation is associated with highly differential gene expression
Gerstung M Nature Comm 2015;6:5901, Papaemmanuil E et al. NEJM 2011;365:138, Nikpour M et al. Leukemia 2012;1-8
Includes downregulation of ABCB7 gene due to altered exon usage
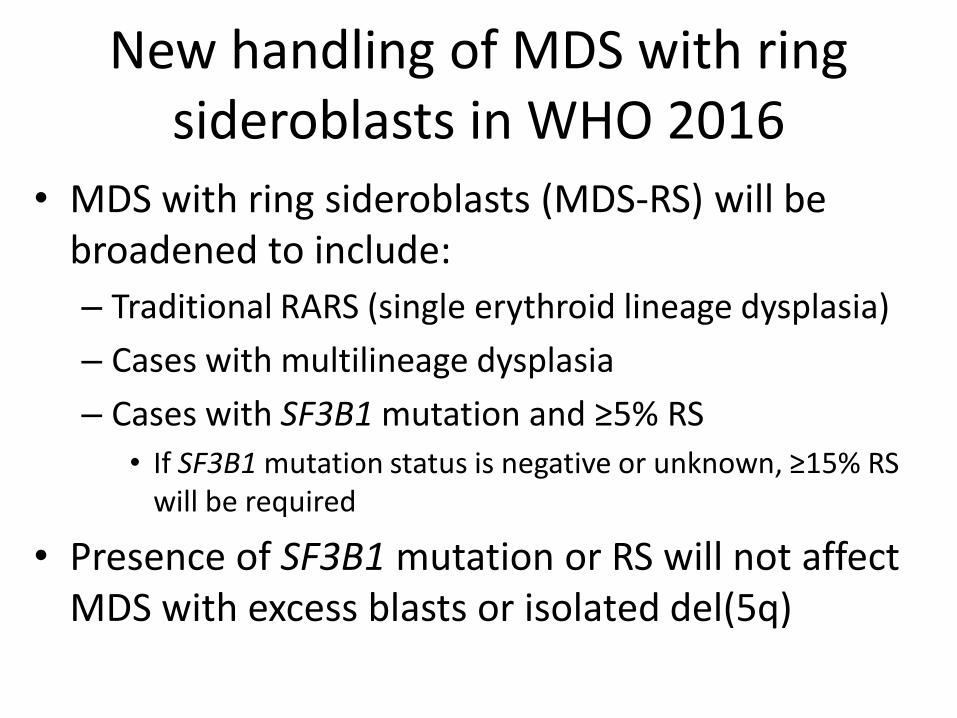
New handling of MDS with ring sideroblasts in WHO 2016
• MDS with ring sideroblasts (MDS-RS) will be broadened to include:
– Traditional RARS (single erythroid lineage dysplasia)
– Cases with multilineage dysplasia
– Cases with SF3B1 mutation and ≥5% RS
• If SF3B1 mutation status is negative or unknown, ≥15% RS will be required
• Presence of SF3B1 mutation or RS will not affect MDS with excess blasts or isolated del(5q)
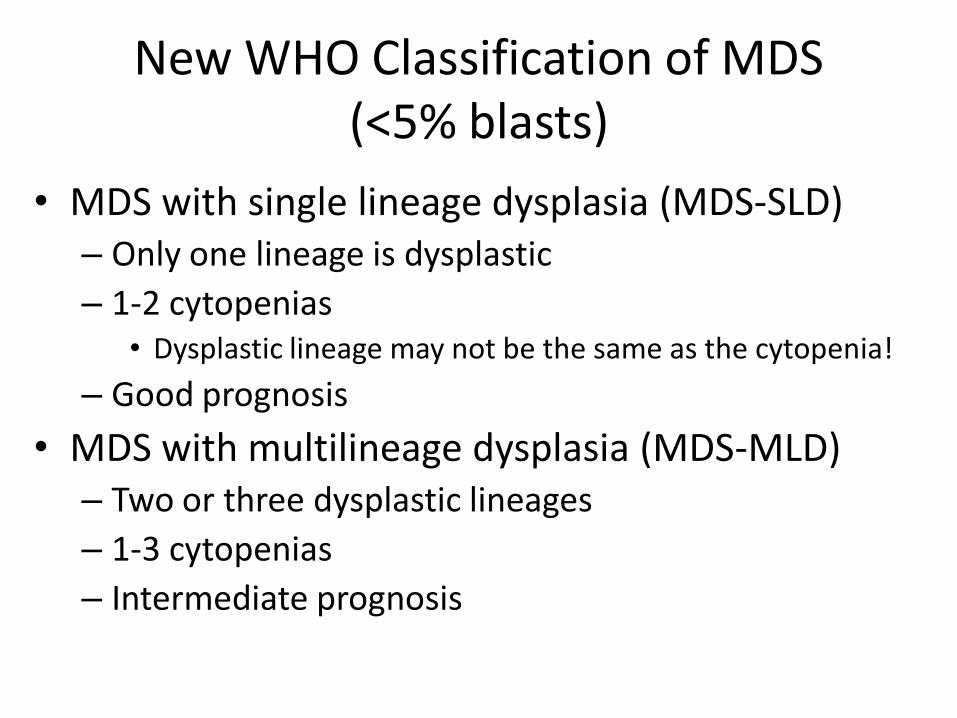
New WHO Classification of MDS (<5% blasts)
• MDS with single lineage dysplasia (MDS-SLD) – Only one lineage is dysplastic
– 1-2 cytopenias • Dysplastic lineage may not be the same as the cytopenia!
– Good prognosis
• MDS with multilineage dysplasia (MDS-MLD) – Two or three dysplastic lineages
– 1-3 cytopenias
– Intermediate prognosis
New WHO Classification of MDS (<5% blasts)
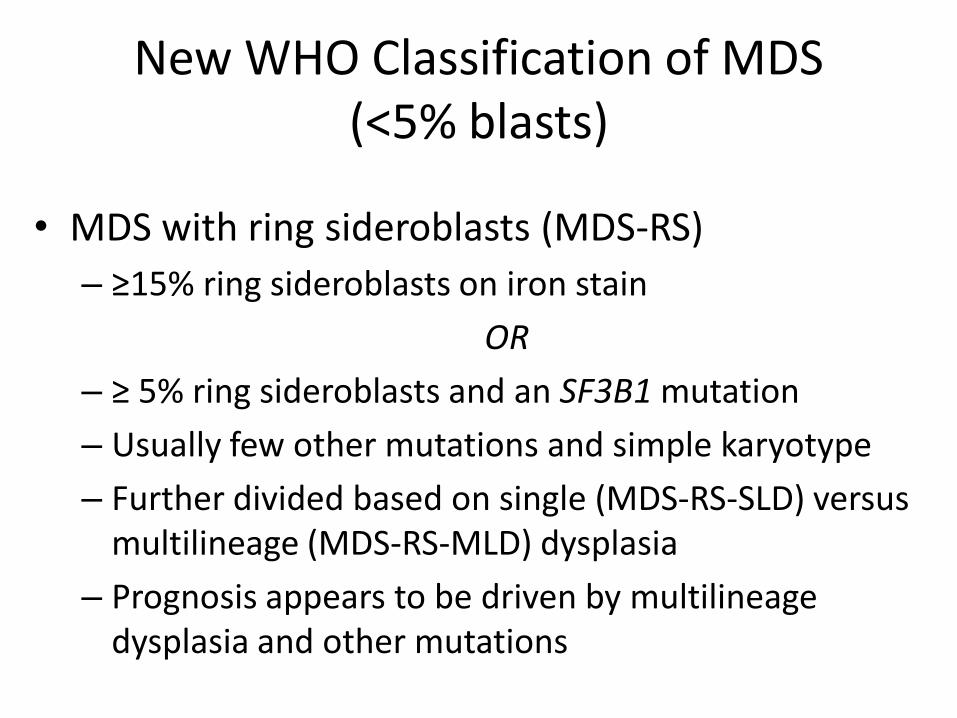
• MDS with ring sideroblasts (MDS-RS)
– ≥15% ring sideroblasts on iron stain
OR
– ≥ 5% ring sideroblasts and an SF3B1 mutation
– Usually few other mutations and simple karyotype
– Further divided based on single (MDS-RS-SLD) versus multilineage (MDS-RS-MLD) dysplasia
– Prognosis appears to be driven by multilineage dysplasia and other mutations
New WHO Classification of MDS (<5%
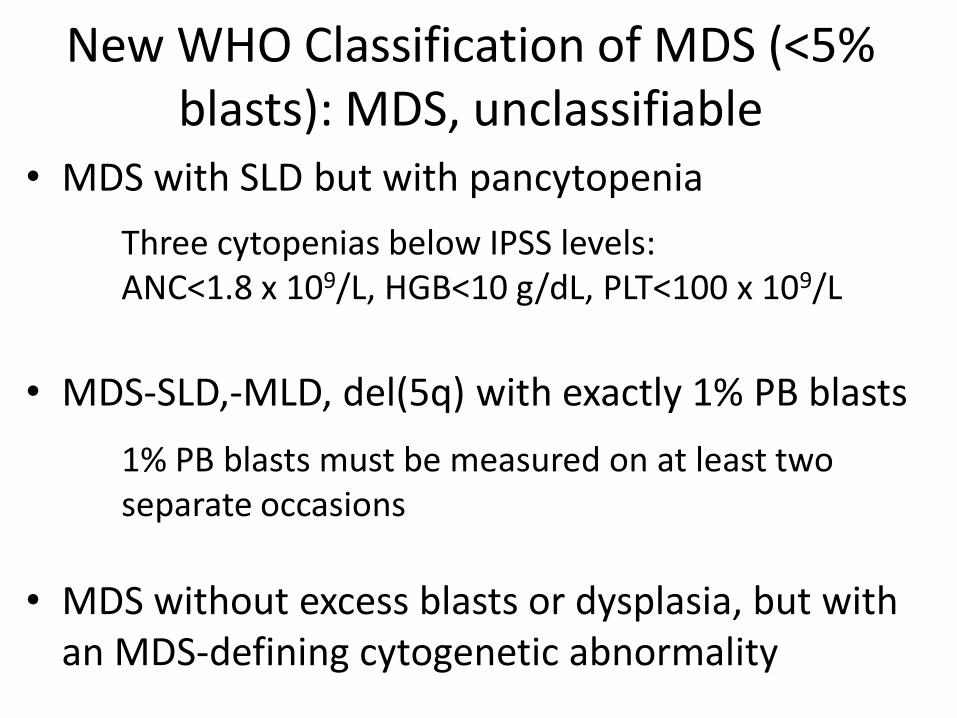
blasts): MDS, unclassifiable • MDS with SLD but with pancytopenia
• MDS-SLD,-MLD, del(5q) with exactly 1% PB blasts
• MDS without excess blasts or dysplasia, but with an MDS-defining cytogenetic abnormality
Three cytopenias below IPSS levels: ANC<1.8 x 10⁹/L, HGB<10 g/dL, PLT<100 x 109/L
1% PB blasts must be measured on at least two separate occasions
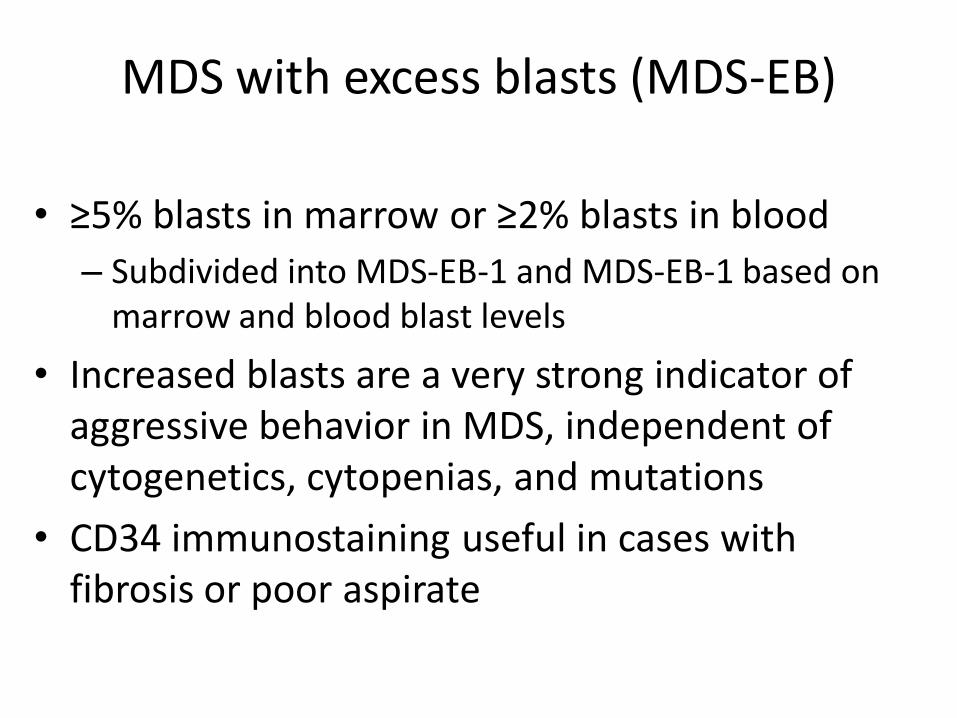
MDS with excess blasts (MDS-EB)
• ≥5% blasts in marrow or ≥2% blasts in blood
– Subdivided into MDS-EB-1 and MDS-EB-1 based on marrow and blood blast levels
• Increased blasts are a very strong indicator of aggressive behavior in MDS, independent of cytogenetics, cytopenias, and mutations
• CD34 immunostaining useful in cases with fibrosis or poor aspirate

Challenges in MDS diagnosis
MDS Non-neoplastic causes of cytopenia --Other neoplasms --Inherited --Extrinsic factors
AML
Low-grade High-grade
Does the patient have a neoplasm?
Should the patient be treated for MDS or should another diagnosis be sought?
Should the patient receive induction or other intensive chemotherapy with a goal of remission?
Risk-adapted therapy according to prognosis
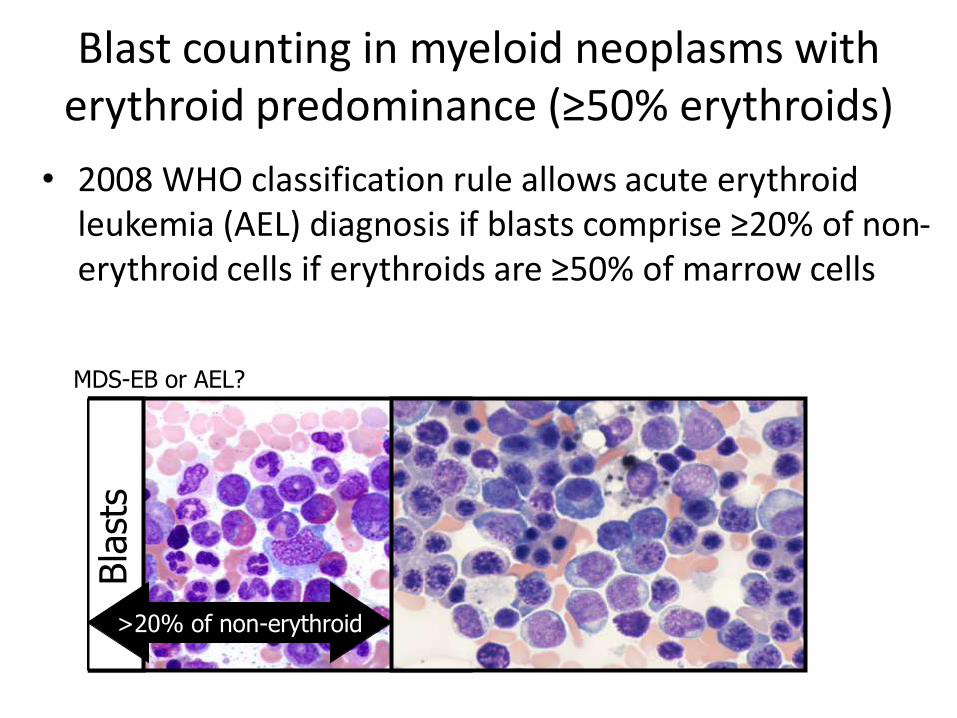
Blast counting in myeloid neoplasms with erythroid predominance (≥50% erythroids)
• 2008 WHO classification rule allows acute erythroid leukemia (AEL) diagnosis if blasts comprise ≥20% of non-erythroid cells if erythroids are ≥50% of marrow cells
Bla
sts
MDS-EB or AEL?
>20% of non-erythroid
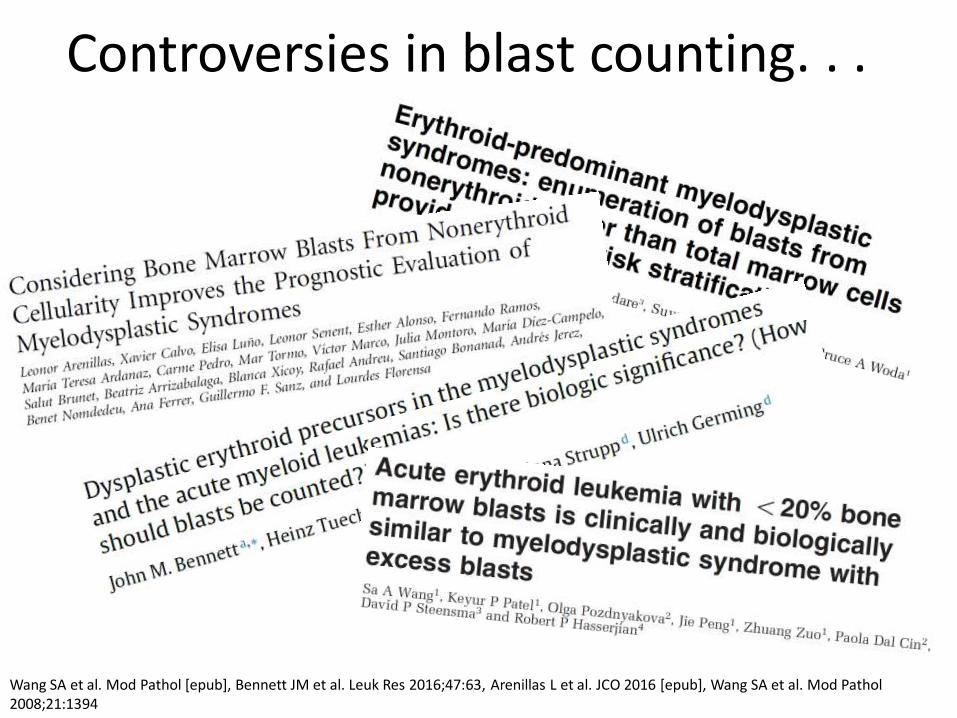
Controversies in blast counting. . .
Wang SA et al. Mod Pathol [epub], Bennett JM et al. Leuk Res 2016;47:63, Arenillas L et al. JCO 2016 [epub], Wang SA et al. Mod Pathol 2008;21:1394
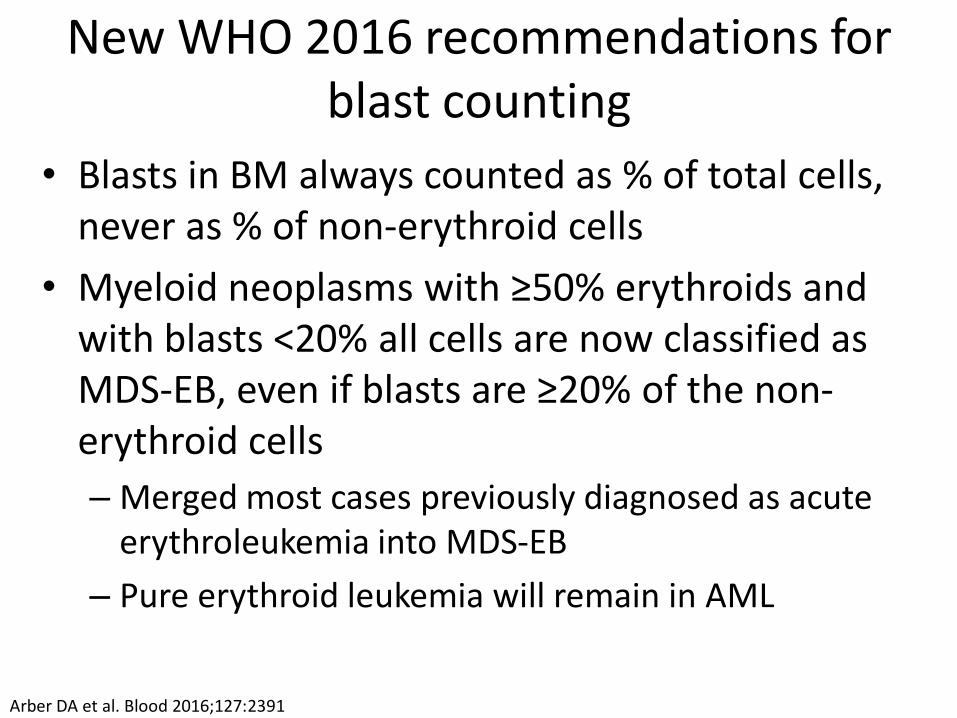
New WHO 2016 recommendations for blast counting
• Blasts in BM always counted as % of total cells, never as % of non-erythroid cells
• Myeloid neoplasms with ≥50% erythroids and with blasts <20% all cells are now classified as MDS-EB, even if blasts are ≥20% of the non-erythroid cells
– Merged most cases previously diagnosed as acute erythroleukemia into MDS-EB
– Pure erythroid leukemia will remain in AML
Arber DA et al. Blood 2016;127:2391
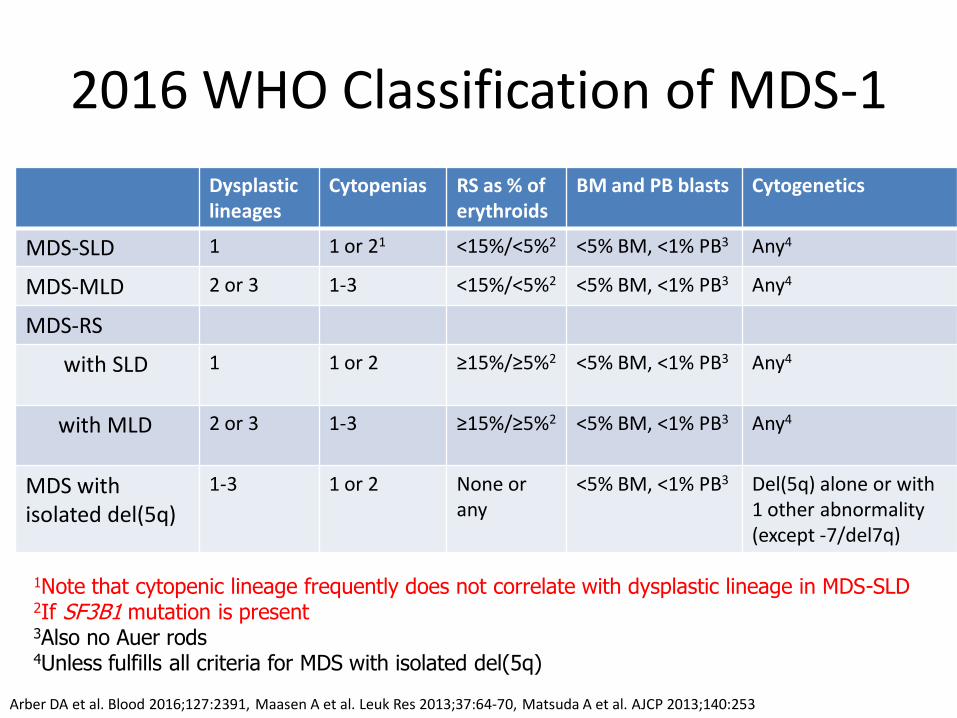
2016 WHO Classification of MDS-1
Dysplastic lineages
Cytopenias RS as % of erythroids
BM and PB blasts Cytogenetics
MDS-SLD 1 1 or 21 <15%/<5%2 <5% BM, <1% PB3 Any4
MDS-MLD 2 or 3 1-3 <15%/<5%2 <5% BM, <1% PB3 Any4
MDS-RS
with SLD 1 1 or 2 ≥15%/≥5%2 <5% BM, <1% PB3
Any4
with MLD 2 or 3 1-3 ≥15%/≥5%2
<5% BM, <1% PB3
Any4
MDS with isolated del(5q)
1-3 1 or 2 None or any
<5% BM, <1% PB3
Del(5q) alone or with 1 other abnormality (except -7/del7q)
1Note that cytopenic lineage frequently does not correlate with dysplastic lineage in MDS-SLD 2If SF3B1 mutation is present 3Also no Auer rods 4Unless fulfills all criteria for MDS with isolated del(5q)
Arber DA et al. Blood 2016;127:2391, Maasen A et al. Leuk Res 2013;37:64-70, Matsuda A et al. AJCP 2013;140:253
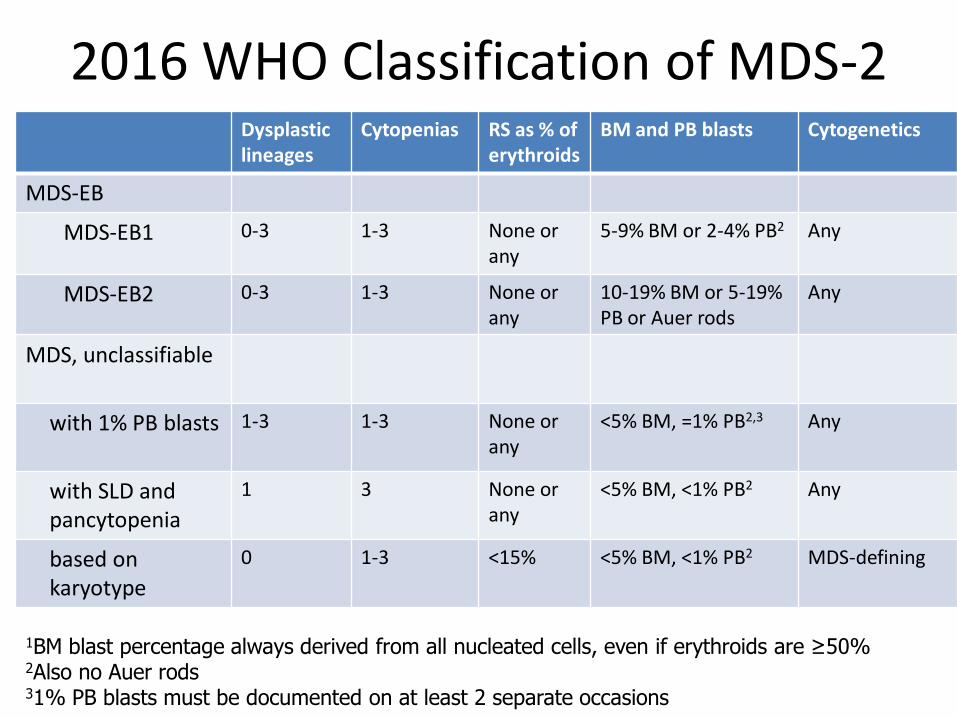
2016 WHO Classification of MDS-2 Dysplastic lineages
Cytopenias RS as % of erythroids
BM and PB blasts Cytogenetics
MDS-EB
MDS-EB1 0-3 1-3 None or any
5-9% BM or 2-4% PB2 Any
MDS-EB2 0-3 1-3 None or any
10-19% BM or 5-19% PB or Auer rods
Any
MDS, unclassifiable
with 1% PB blasts 1-3 1-3 None or any
<5% BM, =1% PB2,3 Any
with SLD and pancytopenia
1 3 None or any
<5% BM, <1% PB2
Any
based on karyotype
0 1-3 <15% <5% BM, <1% PB2
MDS-defining
1BM blast percentage always derived from all nucleated cells, even if erythroids are ≥50%
2Also no Auer rods 31% PB blasts must be documented on at least 2 separate occasions
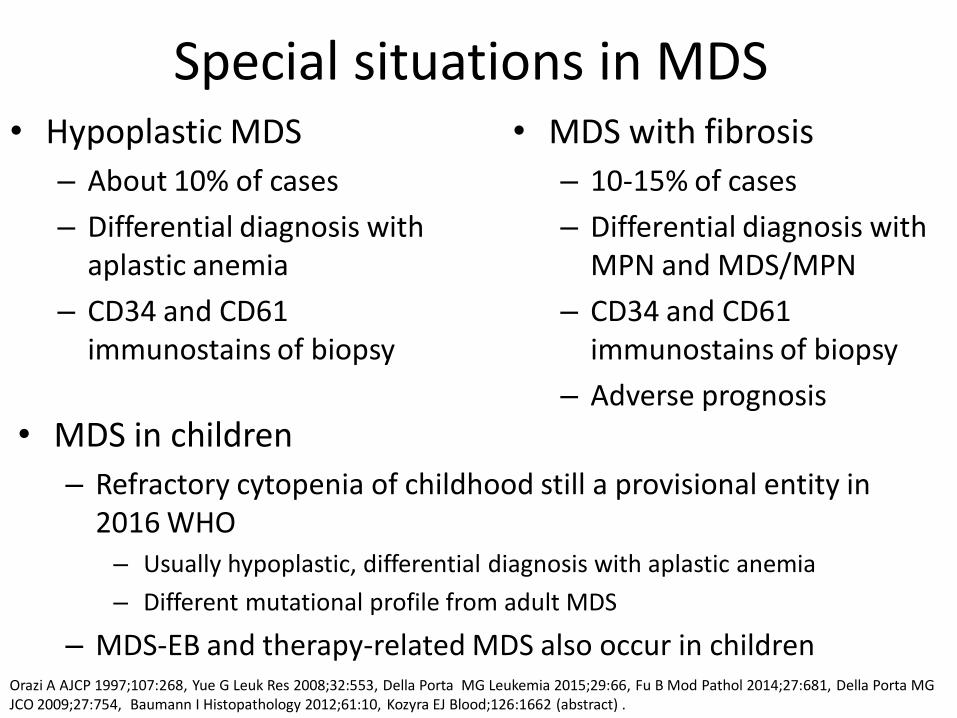
Special situations in MDS • Hypoplastic MDS
– About 10% of cases
– Differential diagnosis with aplastic anemia
– CD34 and CD61 immunostains of biopsy
• MDS with fibrosis
– 10-15% of cases
– Differential diagnosis with MPN and MDS/MPN
– CD34 and CD61 immunostains of biopsy
– Adverse prognosis
• MDS in children
– Refractory cytopenia of childhood still a provisional entity in 2016 WHO – Usually hypoplastic, differential diagnosis with aplastic anemia
– Different mutational profile from adult MDS
– MDS-EB and therapy-related MDS also occur in children Orazi A AJCP 1997;107:268, Yue G Leuk Res 2008;32:553, Della Porta MG Leukemia 2015;29:66, Fu B Mod Pathol 2014;27:681, Della Porta MG JCO 2009;27:754, Baumann I Histopathology 2012;61:10, Kozyra EJ Blood;126:1662 (abstract) .
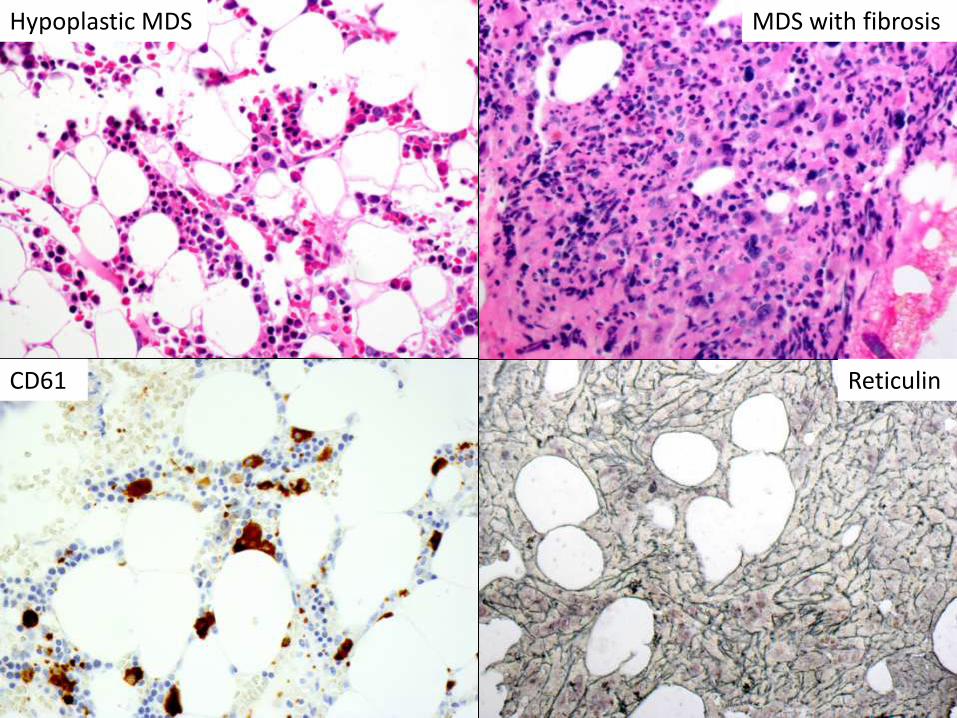
Hypoplastic MDS
CD61 Reticulin
MDS with fibrosis
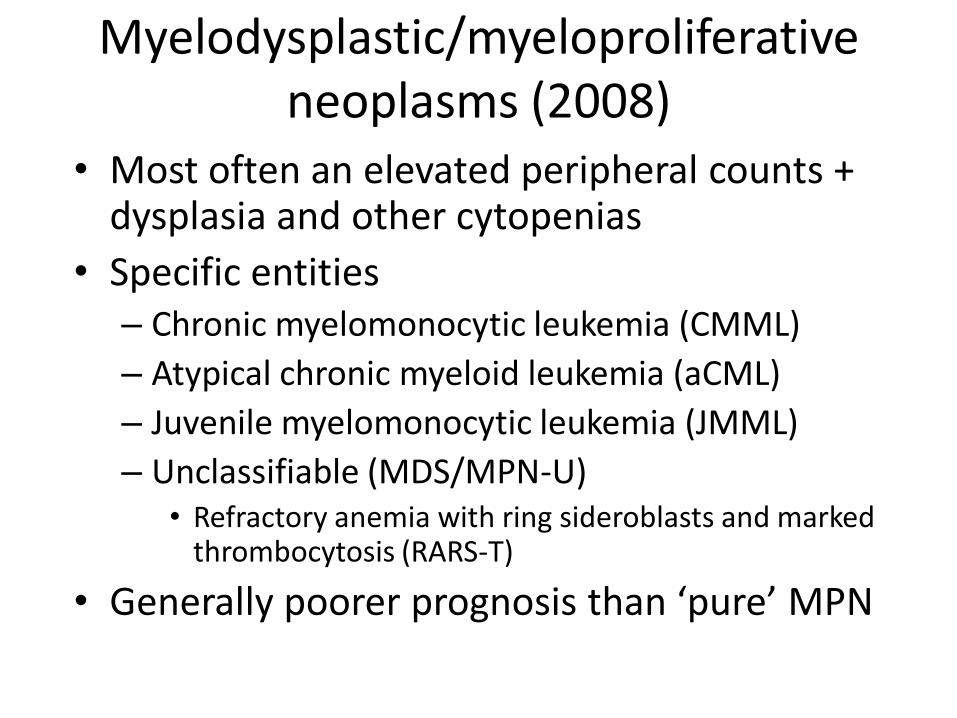
Myelodysplastic/myeloproliferative neoplasms (2008)
• Most often an elevated peripheral counts + dysplasia and other cytopenias
• Specific entities – Chronic myelomonocytic leukemia (CMML)
– Atypical chronic myeloid leukemia (aCML)
– Juvenile myelomonocytic leukemia (JMML)
– Unclassifiable (MDS/MPN-U) • Refractory anemia with ring sideroblasts and marked
thrombocytosis (RARS-T)
• Generally poorer prognosis than ‘pure’ MPN
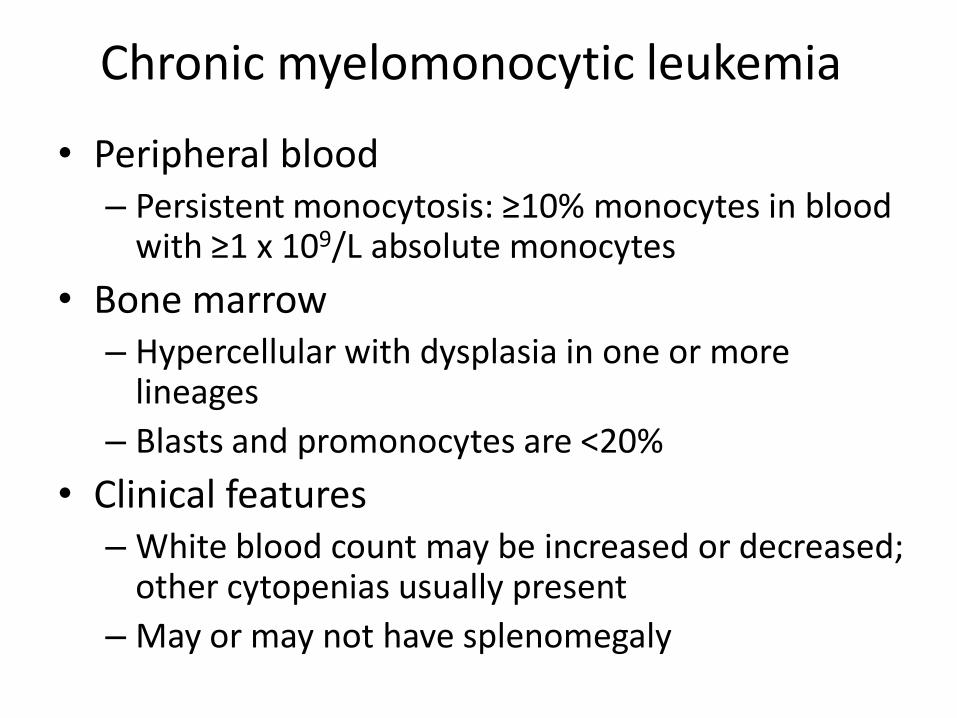
Chronic myelomonocytic leukemia
• Peripheral blood – Persistent monocytosis: ≥10% monocytes in blood
with ≥1 x 10⁹/L absolute monocytes
• Bone marrow – Hypercellular with dysplasia in one or more
lineages
– Blasts and promonocytes are <20%
• Clinical features – White blood count may be increased or decreased;
other cytopenias usually present
– May or may not have splenomegaly
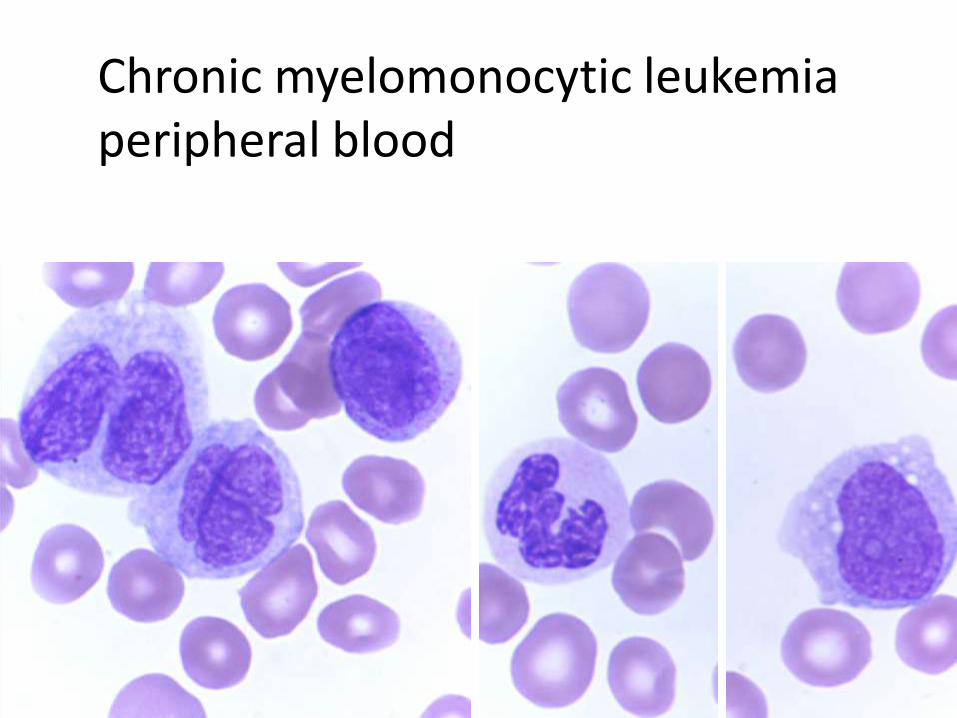
Chronic myelomonocytic leukemia peripheral blood
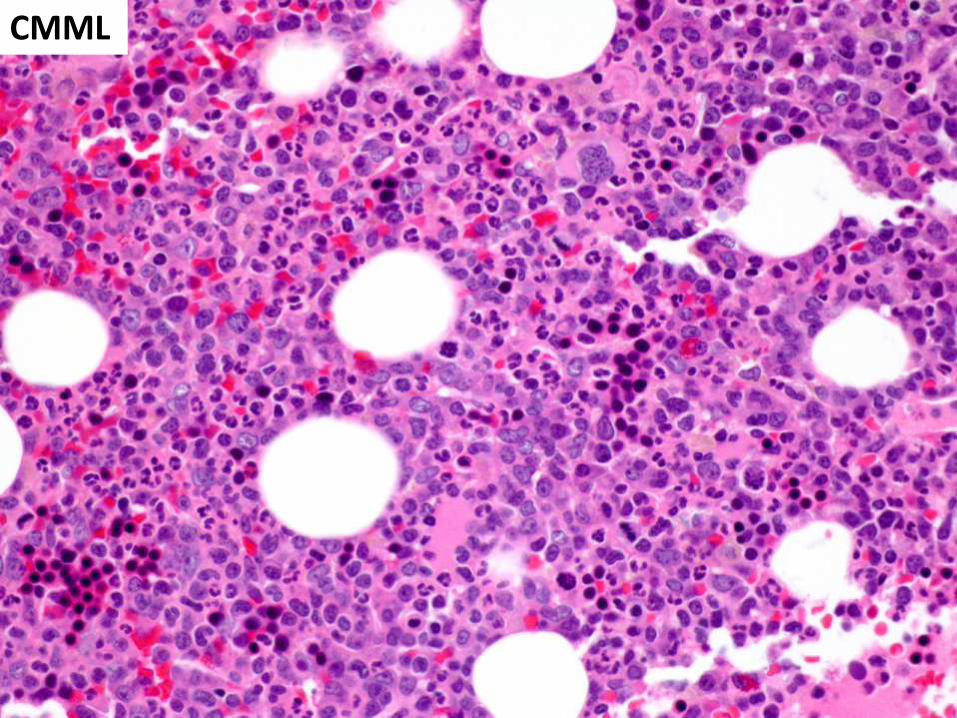
CMML
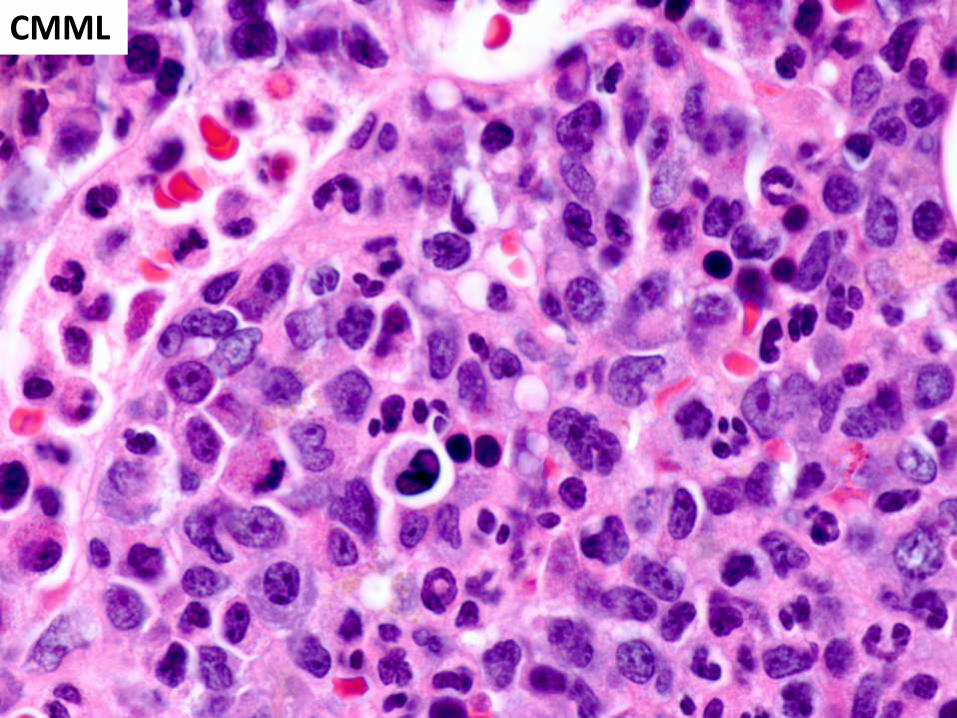
CMML
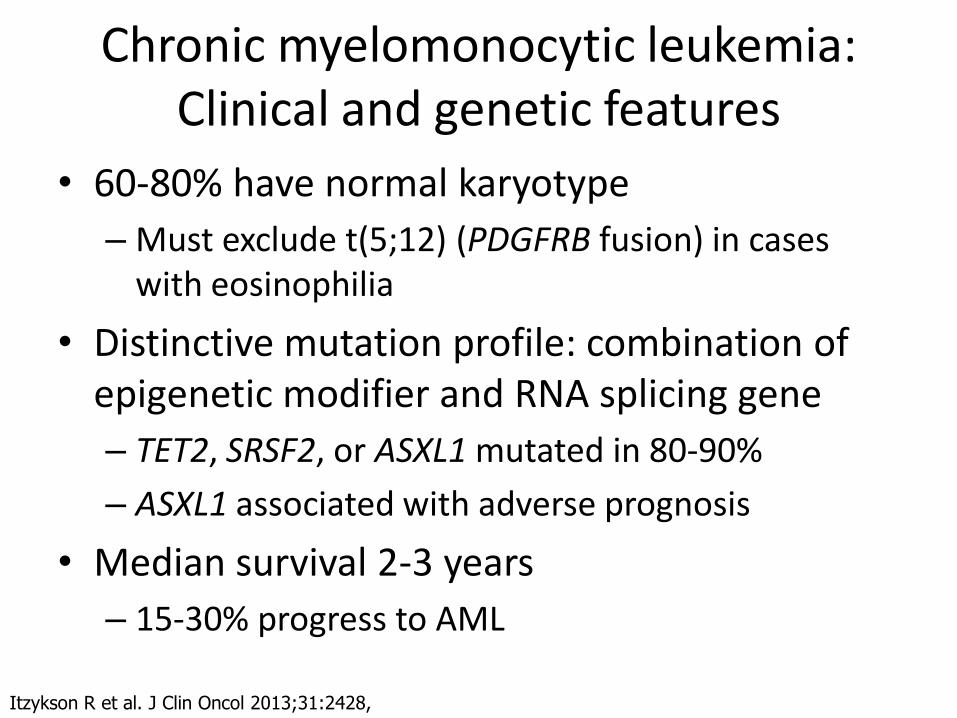
Chronic myelomonocytic leukemia: Clinical and genetic features
• 60-80% have normal karyotype
– Must exclude t(5;12) (PDGFRB fusion) in cases with eosinophilia
• Distinctive mutation profile: combination of epigenetic modifier and RNA splicing gene
– TET2, SRSF2, or ASXL1 mutated in 80-90%
– ASXL1 associated with adverse prognosis
• Median survival 2-3 years
– 15-30% progress to AML
Itzykson R et al. J Clin Oncol 2013;31:2428,
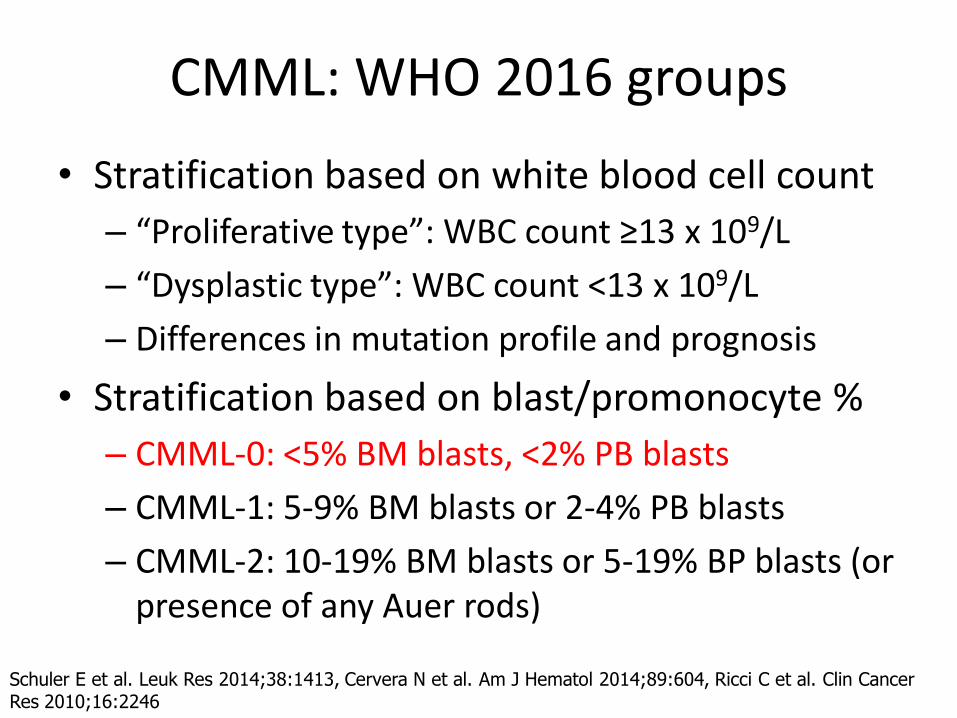
CMML: WHO 2016 groups
• Stratification based on white blood cell count
– “Proliferative type”: WBC count ≥13 x 109/L
– “Dysplastic type”: WBC count <13 x 109/L
– Differences in mutation profile and prognosis
• Stratification based on blast/promonocyte %
– CMML-0: <5% BM blasts, <2% PB blasts
– CMML-1: 5-9% BM blasts or 2-4% PB blasts
– CMML-2: 10-19% BM blasts or 5-19% BP blasts (or presence of any Auer rods)
Schuler E et al. Leuk Res 2014;38:1413, Cervera N et al. Am J Hematol 2014;89:604, Ricci C et al. Clin Cancer Res 2010;16:2246

Monocytic cells Monoblasts Promonocytes Monocytes
BLAST EQUIVALENTS
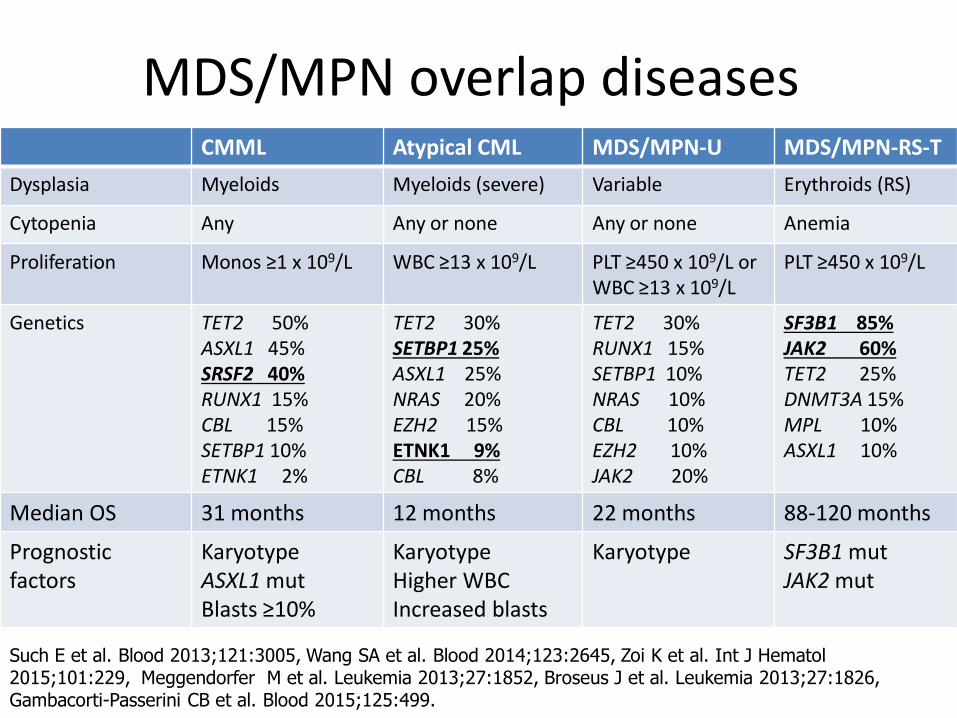
MDS/MPN overlap diseases CMML Atypical CML MDS/MPN-U MDS/MPN-RS-T
Dysplasia Myeloids Myeloids (severe) Variable Erythroids (RS)
Cytopenia Any Any or none Any or none Anemia
Proliferation Monos ≥1 x 10⁹/L WBC ≥13 x 109/L PLT ≥450 x 109/L or WBC ≥13 x 109/L
PLT ≥450 x 109/L
Genetics TET2 50% ASXL1 45% SRSF2 40% RUNX1 15% CBL 15% SETBP1 10% ETNK1 2%
TET2 30% SETBP1 25% ASXL1 25% NRAS 20% EZH2 15% ETNK1 9% CBL 8%
TET2 30% RUNX1 15% SETBP1 10% NRAS 10% CBL 10% EZH2 10% JAK2 20%
SF3B1 85% JAK2 60% TET2 25% DNMT3A 15% MPL 10% ASXL1 10%
Median OS 31 months 12 months 22 months 88-120 months
Prognostic factors
Karyotype ASXL1 mut Blasts ≥10%
Karyotype Higher WBC Increased blasts
Karyotype SF3B1 mut JAK2 mut
Such E et al. Blood 2013;121:3005, Wang SA et al. Blood 2014;123:2645, Zoi K et al. Int J Hematol 2015;101:229, Meggendorfer M et al. Leukemia 2013;27:1852, Broseus J et al. Leukemia 2013;27:1826, Gambacorti-Passerini CB et al. Blood 2015;125:499.
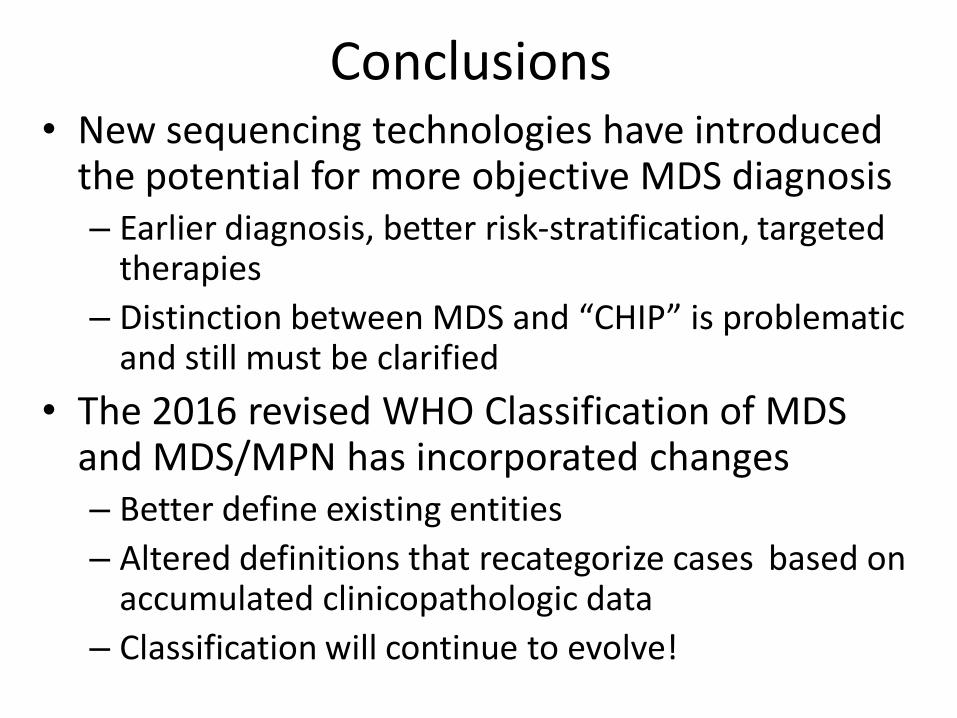
Conclusions • New sequencing technologies have introduced
the potential for more objective MDS diagnosis – Earlier diagnosis, better risk-stratification, targeted
therapies
– Distinction between MDS and “CHIP” is problematic and still must be clarified
• The 2016 revised WHO Classification of MDS and MDS/MPN has incorporated changes – Better define existing entities
– Altered definitions that recategorize cases based on accumulated clinicopathologic data
– Classification will continue to evolve!