my pets eat better than me - petfoodforumevents.com · my pets eat better than me a look into pet...
TRANSCRIPT

My pets eat better than meA look into Pet Specialty trends and key drivers for the future

Trusted source of relevant market and consumer information for more than 80 years
13,000+ passionate
experts
Deliveringglobally vital insights into local markets
in 100+ countries
More than25-time
innovation award winner
Comprehensive insights based on
Consumer Choices focusing on Syndicated Research

Categories | Brick-and-Mortar POS Panel
Pet Food Cat Litter Flea & Tick
30,000+ items
Sales Trends since 2011
$13 Billion annually in Pet Spec
~1,000 items
Sales Trends since 2011
$450 Million through Pet Spec
~600 products
Sales trends since 2013
$413 Million through Pet Spec

Pet Food
Pet Specialty = Pet Superstores and Neighborhood Pet
Brick-and-mortar only, no eCommerce
Scanned Point-of-Sale Data

Pet Food in the 1990s
Push towards Pet Specialty
Human trends shape innovation
Limited options
Low prices
Source: Harvard Business School. (1993). Cat Fight in the Pet Food Industry. Harvard Business Review, 1-2.

Premium found across channels
New type of consumer
Vast range of brands and SKUs
Source: GfK Pet Specialty – RG 5125756-ID 532421512
Fast Forward to 2017

Top 4 responses; Top 2 responses in 1999: Knowing latest music, dressing with personal style; GfK 2017 Generation Now Study Q5a (Base: Students); Roper Youth Report 1999 Q77
Millennials have a strong sense of self AND social sensitivity
79%
Have my own way of doing things
79%
Willing to share with others 77%
Good listener
79%
Feelrespected

Millennials are the largest pet owning population since 2014
8%
10%
10%
11%
13%
37%
50%
Where do they shop for pet food?*
Grocery
PetSmart/Petco
Discount Store
Online
Wholesale
Other Pet Specialty
Vet Clinic
101
103
92
107
104
96
96
Millennials are 7% more likely to shop online than any other generation
index
*Categories are not mutually exclusiveSource: 2017 Fall GfK MRI weighted to Population (000) and other studies - Base: Bases: Total Principal Shoppers and Pet Ownership - Number In Household: Any Pet Any

Growing consumer needs in Pet Specialty

Growing consumer needs drive Pet Specialty evolution
Online/ ecommerce
Channel expansion
Redefining brand image
Customer loyaltyKey events
in 2017

2012 2013 2014 2015 2016 2017
6,852 7,282 7,485 7,833 8,003 8,063 3,533 3,479 3,395 3,349 3,277 3,242
2012 2013 2014 2015 2016 2017
POUNDAGE Sales in Millions DOLLAR Sales in Millions
Growthimproving
Growthsoftening
Pet Specialty experiences slowing growth
+10.4+6.3 +2.8
+4.7 +2.2 +0.8
+2.0 -1.5 -2.4 -1.4 -2.2 -1.1

Dollar sales by species
$6.4Bn +0.7% YOY
$1.6Bn+1.1% YOY
$4.7Bn +0.6%YOY
$0.7Bn -0.2%YOY
$1.0Bn +1.7%YOY
$0.8Bn -0.5%YOY
$0.7Bn +2.1%YOY
$0.1Bn +7.4%YOY
$8B+0.8%YOY
Growth stemming
from treats

$1.71
2.55
Yet, premiumization continues…
+46% since 2011
Jan 2011 Nov 2017
Average Price per Pound (US$) – Food & Treats

*Segments are not mutually exclusive. Includes many rebranded items (Nutro, Instinct, Organix, etc.)
% of New Product Launches in Pet Specialty
Natural 78%
Grain Free 53%
Limited ingredient 7%
Frozen 3%
Meal Enhancers 5%
100% Freeze-Dried (Meal)3%
Kibble+ Freeze-Dried (Meal)5%
100% Dehydrated (Meal) 2%
Small/toy (dog) 12%
Large/XL (dog) 4%
Can/Tray & Pouch(Dog Wet Shelf) 71/22%
Can/Tray & Pouch (Cat Wet Shelf) 83/17%
4,554 new items launched during 2017 – +47% YoY

Established and Emerging Categories in 2017
Grain-Free$3.4Bn+10.0% YOY43% market share$3.07 per pound
Natural$5.7Bn+1.5% YOY
71% market share$2.85 per pound
Segments are not mutually exclusive | *Full meal only | Dehydrated includes Dehydrated+Freeze-Dried Combo | Kibble Plus includes both Part Freeze-dried as well as Part Dehydrated
Kibble Plus$332MM+69.5% YOY4.1% market share$3.33 per pound
Freeze-Dried*$93.0MM+31.8% YOY1.2% market share$32.50 per pound
Meal Enhancer$76.2MM
+24.5% YOY0.9% market share
$8.80 per pound
Dehydrated*$45.2MM
+53.3% YOY0.6% market share
$9.62 per pound
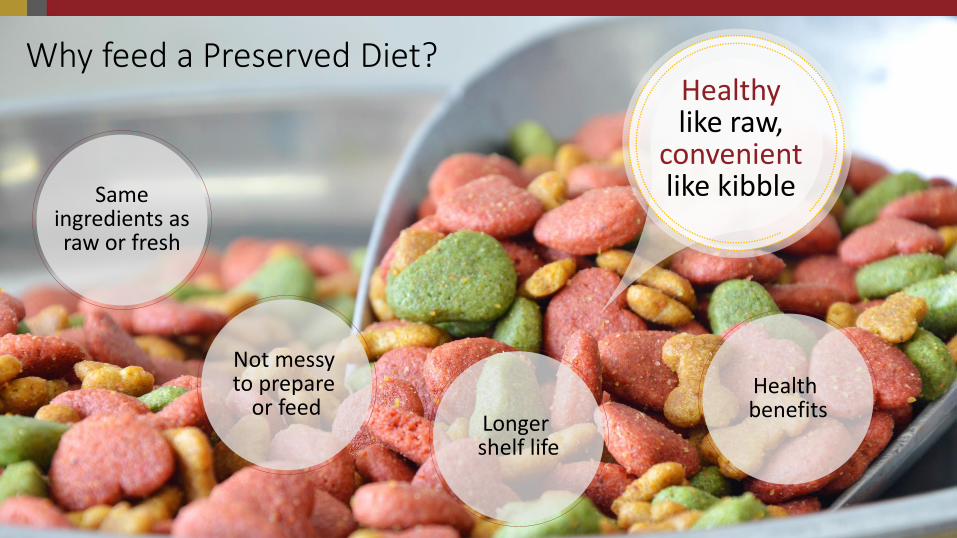
Why feed a Preserved Diet?
Sameingredients asraw or fresh
Not messy to prepare
or feedLonger shelf life
Health benefits
Healthylike raw,
convenientlike kibble

The Premiumization of Dry Food in Pet Specialty
Traditional Dry Part
Freeze-Dried
100%
Freeze-Dried
Part Dehydrated
100% Dehydrated
Dehydrated + Freeze-Dried
Dry Alternatives (Preserved)
$1.93 $3.31 $32.55$4.53 $9.37$9.61

GfK PRJ 114710 - RG 5125756 - RP 33382892 - ID 532771834
Jan 13-Dec 13 Jan 14-Dec 14 Jan 15-Dec 15 Jan 16-Dec 16 Jan 17-Dec 17
YOY $ Growth % (Jan -Dec 17)
While dry food makes up majority of sales, growth is driven by preserved
Annual Dollar Sales (MM)
5,187 5,2555,421 5,496 5,519
Preserved dry (all forms)
Traditional dry
-3
72
-20
48
34
55
Traditional Dry
Part Frz Drd
Part Dehydr
Dehydr + Frz Drd
100% Frz Drd
100% Drhydr
Total Dry+0.4
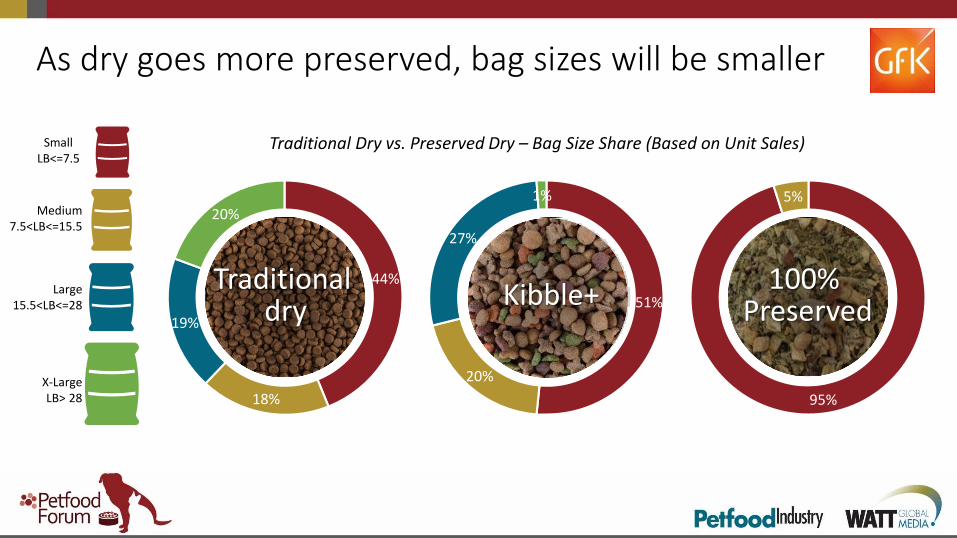
X-LargeLB> 28
Large15.5<LB<=28
Medium7.5<LB<=15.5
SmallLB<=7.5
Traditional Dry vs. Preserved Dry – Bag Size Share (Based on Unit Sales)
44%
18%
19%
20%
95%
5%
51%
20%
27%
1%
Traditional dry
As dry goes more preserved, bag sizes will be smaller
Kibble+100%
Preserved

$3.26 $4.90 $5.64$10.65 $11.69
$32.58
GfK PRJ 114710 - RG 5125756 - RP 33391860 - ID 532814768
Traditional dry Part freeze-dried Part dehydrated Dehydrated + freeze dried
100% dehydrated
100% freeze dried
$2.42 $3.40 $4.34$8.72 $7.64
$21.52
$1.91 $2.97 $3.35 $2.81
$1.34 $1.51 $1.80X-LargeLB> 28
Large15.5<LB<=28
Medium7.5<LB<=15.5
SmallLB<=7.5
Price per Pound by Bag Size

$3.26 $4.90 $5.64$10.65 $11.69
$32.58
GfK PRJ 114710 - RG 5125756 - RP 33391860 - ID 532814768
Traditional dry Part freeze-dried Part dehydrated Dehydrated + freeze dried
100% dehydrated
100% freeze dried
$2.42 $3.40 $4.34$8.72 $7.64
$21.52
$1.91 $2.97 $3.35 $2.81
$1.34 $1.51 $1.80X-LargeLB> 28
Large15.5<LB<=28
Medium7.5<LB<=15.5
SmallLB<=7.5
How to make the jump?

Meal Enhancers!
Makes traditional dry food more palatable
Gives boost of protein and nutrients
Adds variety to feeding time
More affordable entry point

© GfK 2018 - All rights reserved | 4/2018
PRJ 114710 - RG 5125756 - RP 33392105 - ID 532815473
Jan 13-Dec 13 Jan 14-Dec 14 Jan 15-Dec 15 Jan 16-Dec 16 Jan 17-Dec 17
100% FRZDRIED 100% DEHYDR. DEHYDR+FRZDRIED WET + LIQ SNACKS/TOPPERS
23.3
2.7
24.2
4.7
27.7
15.8
32.8
25.8
35.8
36.0
$27.4$29.7
$44.0
$61.2
$76.2M
Meal Enhancers 2017: $76.2M, +24.5% YOY

51%
3%44%
1%
2%
100% frzdrd Snacks/toppers Wet + Liquid Dehydr + FrzDrd 100% Dehydr
© GfK 2018 - All rights reserved | 4/2018
PRJ 114710 - RG 5125756 - RP 33392294 - ID 532815798
22%
1%
69%
9%Dog makes up 88%of Meal Enhancer $ Sales
Meal Enhancers by Species 2017: $76.2M, +24.5% YOY

Jan 15-Mar 15 Apr 15-Jun 15 Jul 15-Sep 15 Oct 15-Dec 15 Jan 16-Mar 16 Apr 16-Jun 16 Jul 16-Sep 16 Oct 16-Dec 16 Jan 17-Mar 17 Apr 17-Jun 17 Jul 17-Sep 17 Oct 17-Dec 17
YOY $ Growth %
251.7
297.7
169.0
106.8 87.3
61.1
29.044.1
33.3 35.4
45.8
10.15.7
17.713.7 20.6
29.7
20.1 20.5
24.7
13.5 6.6-1.0
100% Freeze-Dried Meal Enhancers are growing faster than Wet
100% Freeze Dried
Wet + Liquid

33 141
$4,981 $4,240
11 22Avg # items
Unit velocity
Dollar velocity$ $

70%of dollar sales in bags 1lb or less
$34.47 vs $5.06 wet/liquidaverage price per pound
$9.90 vs $2.50 wet/liquidaverage selling price
100% Freeze-Dried Meal Enhancers

What’s next for meal enhancers(and Pet Food)?

#5 Biohackingcreates a science for more individualized nutrition and products
Human Food Trends

Functional Meal Enhancers
New Innovation at Global Pet Conference
97%General Health

# Different selling items 2013 2017
GENERAL HEALTH 165 497
ALLERGY 3 5
DERM/SKIN 5 6
GASTRO-INTESTINE 7
HAIRBALL 1 4
JOINT/MOBILITY 2 2
ORAL/DENTAL 4
WEIGHT CONTROL 10
TOTAL MEAL ENHANCERS 176 535
3 New Functions have been added since 2013… Stay tuned for 2018!
Of Functional Meal Enhancers,
Weight Control has the most SKUs
followed by Gastro

Human ingredients and preferences being reflected in pet food
Emerging Trends
Turmeric Coconut Honey
Energy Bars Sustainably &Ethically Source

TurmericHolistic, Healthy and Hot for Humans and Pets
http://www.dogsnaturallymagazine.com/turmeric-dogs/
We like it in a Latte… …and its not just a pet supplement anymore!
Health Benefits
• Anti-Inflammatory
• Relieve Arthritis Pain
• Gastrointestinal Disorders
• Can Replace Steroids
• Allergy Relief

CoconutBeing and Looking Healthy
For us beauty, weight loss and healthy hydration…
Similar benefits for pet food and treats!
Health Benefits
• Healthy Skin and Coat
• Improves Digestion
• Superfood Benefits
• Thyroid Health
• Increases Energy
https://www.sitstay.com/blogs/good-dog-blog/coconut-oil-for-dogs

Honey
Naturally Healthy, Naturally Soothing, Naturally Sweet
http://www.akc.org/content/health/articles/can-dogs-eat-honey/
Sweet relief for humans… Taste boosting treats for pets. Health Benefits
• Reduce Allergies
• Anti-Microbial/Fungal
• Anti-Inflammatory
• Soothing to Sore Throats
• Appetite Stimulant
• Natural Sweetener

Protein BarsConvenient Nutrition for Humans and Pets
Plenty of premium options Smaller pet brands on board. Why?
• More and more pets are on the go – at the office, on vacation, around town
• Easier than packing bags of food
• Simplifies feeding while away from home
• CONVENIENCE!

Sustainably and Ethically Sourced
Food that’s both good for you, your pet, and the environment
Opportunity for Pet?
• Certified “Natural”
• Feel good what your feeding and where it comes from
• Environmental and ethical appeal
• Build consumer loyalty
“When your pet is part of the family, make sure their food is held to the same
standards as yours.”Tender & True

So what does all of this mean for Pet
Specialty?

Questions?

THANK YOU!
Natasha DavisClient Service Manager
GfK Point-of-Sale Tracking
@NattyDee711
#GfKPets