mutual funds as venture capitalists? evidence from … files/18-037_02aee6d2-1209-449e...the...
TRANSCRIPT

Mutual Funds as Venture Capitalists? Evidence from Unicorns
Sergey Chernenko Josh Lerner Yao Zeng
Working Paper 18-037

Working Paper 18-037
Copyright © 2017 by Sergey Chernenko, Josh Lerner, and Yao Zeng
Working papers are in draft form. This working paper is distributed for purposes of comment and discussion only. It may not be reproduced without permission of the copyright holder. Copies of working papers are available from the author.
Mutual Funds as Venture Capitalists? Evidence from Unicorns
Sergey Chernenko Purdue University
Josh Lerner Harvard Business School
Yao Zeng The University of Washington

! 1
Mutual Funds as Venture Capitalists? Evidence from Unicorns1
Sergey Chernenko Purdue University
Josh Lerner
Harvard University and NBER
Yao Zeng The University of Washington
October 2017
Abstract
Using novel contract-level data, we study the recent trend in open-end mutual funds investing in
unicorns—highly valued, privately held start-ups—and the consequences of these investments
for corporate governance provisions. Larger funds and those with more stable funding are more
likely to invest in unicorns. Compared to venture capital groups (VCs), mutual funds have
weaker cash flow rights and are less involved in terms of corporate governance, being
particularly underrepresented on boards of directors. Having to carefully manage their own
liquidity pushes mutual funds to require stronger redemption rights, suggesting contractual
choices consistent with mutual funds’ short-term capital sources.
1 We thank Slava Fos (discussant), Jesse Fried, Jarrad Harford, William Mann, Ramana Nanda, Morten Sorensen, Xiaoyun Yu (discussant), and conference participants at the Southern California Private Equity Conference, London Business School Private Equity Symposium, and the FRA Meeting for helpful comments. We thank Michael Ostendorff for access to the certificates of incorporation collected by VCExperts. We are grateful to Jennifer Fan for helping us better interpret and code the certificates of incorporation. We thank Quentin Dupont, Luna Qin, Bingyu Yan, and Wyatt Zimbelman for excellent research assistance. Lerner has advised institutional investors in private equity funds, private equity groups, and governments designing policies relevant to private equity. Lerner acknowledges support from the Division of Research of Harvard Business School. Zeng acknowledges support from the Foster School of Business Research Fund.
! 2
1 Introduction
The past few years have witnessed a dramatic change in the financing of entrepreneurial
firms. Whereas once these firms were financed primarily by a small set of venture capital groups
(VCs), who tightly monitored and controlled the companies in their portfolios, in recent years
financing sources have broadened dramatically. In the years after firm formation, individual
angels—whether operating alone or in groups—have played a far more important role (Lerner, et.
al., 2016). More mature firms have delayed going public by raising considerable sums from
investors who are traditionally associated with public market investing, such as mutual funds,
sovereign wealth funds, and family offices. A dramatic example of this process is Uber (see
Table 1), where successful entrepreneurs dominated the initial financing rounds. After a couple
of rounds dominated by venture groups, institutions such as Fidelity and BlackRock emerged as
the largest investors.
This change in financing sources provokes some important questions. Over the past two
decades, the academic literature has highlighted that venture capitalists are uniquely well suited
to the monitoring and governance of entrepreneurial firms. Through such mechanisms as the
replacement of management (Lerner, 1995), the staging of financing (Gompers, 1995), board
meetings (Bernstein, Giroud, and Townsend, 2016), and the use of convertible securities and the
associated contractual provisions (Kaplan and Stromberg, 2003), these investors address the
problems of uncertainty, asymmetric information, and asset intangibility that characterize start-
up firms. This line of work suggests that mutual funds—which tend to invest in common shares
of more mature firms, where governance issues are quite different, and to have limited
engagement with the firms in their portfolios—would be ill-suited to such investing.2 Moreover,
2 See “Capitalism’s Unlikely Heroes,” The Economist, February 7, 2015.
! 3
the open-end nature of mutual funds may be incompatible with investments in illiquid securities
(Chen, Goldstein, and Jiang, 2010, Goldstein, Jiang, and Ng, 2016, Chernenko and Sunderam,
2016): funds may be vulnerable to “runs” if investors become concerned about the nature or
valuation of their illiquid holdings (Zeng, 2016). These issues have triggered critical articles in
the business press about the potential risks of mutual funds “juicing” their returns through private
investments as well as scrutiny by the U.S. Securities and Exchange Commission (SEC).3
On the other hand, for public firms, institutional investors have been documented in
academic research to provide effective corporate governance through activism and other means
(see Brav, Jiang, and Kim, 2010 and Edmans and Holderness, 2016 for reviews). The effects are
present over time and across the world (McCahery, Sautner, and Starks, 2016). The
concentration of holdings and institutional investors’ portfolio shares, which are often associated
with large-block purchases in firms, are important factors determining the provision of
monitoring (Chen, Harford, and Li, 2007, Fich, Harford and Tran, 2015). Recent studies show
that even index mutual funds, which might be seen as the most passive of investors, provide
significant corporate governance to public firms (Appel, Gormley, and Keim, 2016).
Given the academic debate, it is surprising that there has been virtually no scrutiny in the
academic literature of whether and how passive institutional investors provide corporate
governance to private firms. Given the increasing popularity of mutual funds directly investing in
private firms (particularly the ones with valuations of a billion dollars or more, popularly
referred to as “unicorns”), this question has an urgency that it would not have had a few years
ago.
3See “Regulators Look into Mutual Funds’ Procedures for Valuing Startups,” Wall Street Journal, November 17, 2015.
! 4
Our paper provides an attempt at answering this question. We seek to identify not only
the volume of mutual fund investments, but also the extent of their involvement in the oversight
of these firms. To address these questions, we use novel contract-level data—certificates of
incorporation (COIs) of these unicorns—to examine the contractual terms between unicorns and
their investors (including mutual funds). Thus, our paper contributes to the entrepreneurial
finance literature pioneered by Kaplan and Stromberg (2003), who documented that the structure
of contracts between VCs and their portfolio firms was consistent with the theoretical predictions
of contract theory. Bengtsson and Sensoy (2011) used coded contractual data from VCExperts to
explore the relationship between the experience of VCs and the contractual terms that they use.
Other related papers include Gompers, et al., (2016) on VCs and Gompers, Kaplan, and
Mukharlyamov (2017) on private equity firms, which use survey data to examine the allocation
of rights between entrepreneurs and investors.
Using COIs, we focus on the contractual provisions associated with mutual funds’ direct
investments in unicorns, with a particular focus on corporate governance implications. We first
provide a descriptive analysis regarding mutual fund investment in unicorns. Consistent with
anecdotal evidence, our findings reveal a significant upward trend of mutual fund investments in
unicorns. Mutual funds appear to be more interested than VCs in investing in late rounds and hot
sectors. These findings are also consistent with those in contemporaneous research by Kwon,
Lowry, and Qian (2017), who examine mutual fund investments in private firms using a larger
sample of private firms and a smaller sample of mutual funds but do not examine the corporate
governance implications of mutual fund investments.
We then explore the potential determinants of mutual fund investment in unicorns. We
find that larger funds and funds with more stable funding are more likely to invest in unicorns.

! 5
These results make sense because these funds are more likely to benefit from the highly non-
transparent and illiquid unicorn investments.
Our main findings regarding corporate governance provisions suggest that mutual funds
are less involved than VCs and provide less governance in general. Specifically, we find that
mutual fund-involved investment rounds are associated with both fewer cash flow rights and
fewer control/voting rights across a number of dimensions. For instance, mutual fund-involved
rounds are more likely to use straight convertible preferred stock, which is associated with
weaker indirect incentive provisions than participating preferred stock that is popular among
VCs (Kaplan and Stromberg, 2003). Mutual funds are also significantly less represented on the
board of directors; they are thus less likely to directly monitor the portfolio unicorns through
board intervention or voting on important corporate actions. These results suggest that mutual
funds are not likely to provide governance services similar to VCs.
At the same time, we find that mutual fund-involved investment rounds are associated
with significantly stronger redemption rights: that is, the convertible preferred stock that mutual
funds hold is more likely to be redeemable. This result is robust across all of our specifications.
A unique aspect of our study is that we examine not only whether an investment round is
associated with redemption rights (i.e., the extensive margin), but also the details of redemption
rights (i.e., the intensive margin, which we articulate later). Conditional on an investment round
having redemption rights, mutual fund-involved rounds are not only associated with significantly
shorter delay between the date that shareholders request redemptions and the actual payment
date(s), but also require no or a less strict voting procedures to trigger redemption.
Overall, our results reflect mutual funds’ unique capabilities and weaknesses compared to
VCs. On the one hand, mutual fund managers are unlikely to have the skill set to serve as
! 6
directors of or mentors to managers, particularly ones with the special challenges facing high-
growth private entities. Their limited skill set likely leads to fewer governance rights. Their
inability to provide governance (as well as other strategic benefits to portfolio firms) may also
mean that they are largely undifferentiated from other sources of capital. Their relatively weak
bargaining power may translate into fewer cash flow rights as well.
Different from VCs, mutual funds’ shares on the liability side are redeemable on a daily
basis. This implies that mutual funds have to manage their asset side much more actively. Given
that the secondary market for private firms’ preferred stocks is highly illiquid, mutual funds
demand more and stronger redemption rights (possibly at the cost of sacrificing other cash-flow
rights and governance provisions) on both the extensive and intensive margins. These provisions
allow mutual funds to more easily redeem the preferred stocks in their portfolio when they face
redemption pressures from their own shareholders.4 In other words, the need of illiquidity risk
management shapes mutual funds’ contractual choices, making mutual funds better able to “vote
with their feet” than VCs. Overall, our findings provide a novel and more balanced view
regarding mutual funds’ governance capacity. Although they appear neither as experienced nor
as involved as VCs in this realm, their unique capital structure pushes them towards certain
contractual features.
It is worth nothing that our data do not allow us to identify the causal effect of mutual
fund participation on specific contractual provisions. In other words, the following two
interpretations of our results are not distinguishable: 1) contractual provisions associated with
mutual fund-involved rounds are a direct result of negotiation between the investing mutual
funds and unicorns, or alternatively, 2) mutual funds choose to invest in unicorn-rounds with 4 Mutual funds may not need to exercise their redemption right in practice: by strengthening their outside option, stronger redemption rights may also make the preferred stock easier to trade in the secondary market.

! 7
certain contractual provisions that these investors find appealing. Both interpretations are
consistent with mutual funds preferring or requesting certain ex-ante contractual provisions,
leading to ex-post implications for corporate governance. Importantly, we show that our results
are robust to controlling for round fixed effects, valuations, ex-post exit outcomes, and unicorn
fixed effects.
To keep our paper focused, we leave a number of questions for future research. These
include the impact of these non-traditional investors on the performance of the private firms
receiving the capital, as well as the returns to these investors from the investments. More
generally, there are interesting open questions as to whether mutual funds are a substitute for or a
complement to venture investors, and the rationales for these ventures remaining private for
extended periods. We suggest some particularly promising questions in the conclusion.
The organization of the paper is as follows. Section 2 describes the data and our sample
construction; it also discusses the associated institutional background. Section 3 reports the
results of our analyses of the determinants of mutual fund investments in unicorns and the
corporate governance implications. Section 4 concludes and discusses future research directions.
2 Data and institutional background
One of the major challenges in studying investments in entrepreneurial private firms has
been the absence of large, comprehensive datasets that include all investors (particularly those
other than VCs), governance provisions, and financial performance (see Kaplan and Lerner,
2017, for a discussion). We combine novel data on the corporate governance provisions in the
funding rounds of private firms with information on the mutual fund holdings of these firms. Our
data on investment rounds and the associated corporate governance provisions come from the
! 8
certificates of incorporation (COIs), which are amended and filed every time a firm raises a new
round of financing. Our data on mutual fund holdings of private firms come from SEC forms N-
CSR and N-Q, complemented by the CRSP Mutual Fund Holdings database. We discuss the
construction of our sample, along with the relevant intuitional background, below.
2.1 Identifying the Sample
We focus mainly on U.S.-based private venture-backed firms that at some point between
January 2012 and December 2016 had at least one investment round with nominal valuation of at
least one billion U.S. dollars, that is, the so-called “unicorns.” We make this decision because
data on these high-profile firms is much more comprehensive: in particular, our main data source,
VCExperts, has made a concerted effort to gather these firms’ regulatory filings, including the
COIs that we use to identify corporate governance provisions. Moreover, given their need to
deploy significant amounts of capital, mutual fund investments are likely to be concentrated in
such firms.
We first identify unicorns based on the “WSJ Billion Dollar Startup Club” database
provided by Dow Jones.5 Since its inception in January 2012, the database includes private firms
that have raised VC financing and achieved a nominal valuation of over one billion U.S. dollars.
It also includes firms that have exited unicorn status during the time period, whether by
acquisition, going public, or by being refinanced at a lower nominal valuation. The database
excludes firms that only achieved a billion dollar valuation once publicly traded or in an
acquisition by a strategic or financial buyer. Dow Jones identifies these firms using the team of
analysts that compiles its VentureSource (formerly VentureOne) database, which has been
extensively used in academic research (Kaplan and Lerner, 2017).
5 It is available at http://graphics.wsj.com/billion-dollar-club/.
! 9
As of December 2016, the database included 104 U.S. unicorns. Our sample consists of
the subset of 98 firms for which VCExperts has financing round data as well as the associated
COIs.
An important caveat is that, as documented by Metrick and Yasuda (2011) and Gornall
and Strebulaev (2017), inferring actual valuations of private venture-backed firm can be complex.
In particular, Dow Jones (and most other practitioners and analysts) would classify a firm as a
unicorn in the case where an investor purchased a block of preferred shares for $100 million
convertible into common stock that would represent 10% of the firms basis on a fully converted
basis (that is, if all preferred shareholders converted their holdings as well), because the nominal
implied valuation is one billion dollars. But these preferred shares may have rights (e.g.,
mandated dividends and liquidation preferences) that allow them to receive, for example, 40% of
the firm’s expected cash flows. In this instance, the “true” implied valuation may be $250
million. For these reasons, we use their valuations as a control only and interpret the results
related to valuations with caution.
Also in light of such complexities and potential disagreements about unicorn valuations,
we extend the unicorn sample to include another 55 U.S.-based private venture-backed firms that
at some point between January 2012 and December 2016 had at least one investment round with
nominal valuation of at least 500 million U.S. dollars. Although our main results are robust to
whether we include these “almost-unicorn” firms, including them helps increase the sample size
and thus the statistical power of our analysis.
Overall, our sample consists of 153 private firms. For simplicity, we call all of them firms
or unicorns interchangeably in what follows. We obtain firm-level characteristics, such as
geographic and industry information, from VC Experts and use Capital IQ to confirm these

! 10
characteristics when possible. We also obtain firm exit outcomes, that is, whether and when a
firm went public (IPO), was acquired (M&A), or went bankrupt, from firm websites directly.
Within our sample, 31 unicorns went public, while 13 unicorns were acquired. More specifically,
106 out of 742 observations (at the firm-investment round level) have a positive exit event (IPO
or M&A) within 3 years of the round closing date, in which case we set the dummy variable Exit
equal to 1.
For these 153 firms, we then gathered information from the COIs through VCExperts.
These are public documents filed by a firm with the Secretary of State of the state in which the
firm is incorporated.6 In states such as California, Delaware, and many others, all firms are
required to restate and file the COI when there are any changes in the authorized number of
shares of equity outstanding, including preferred shares issued to institutional investors such as
VCs and mutual funds. In particular, there are separate COIs filed for each investment round of
private firms, as long as the given round requires an increase in the total authorized number of
equity shares. As a result, our analysis is unlikely to be subject to reporting biases.
Although the COIs are publicly accessible in principle, they are very difficult and costly
to get.7 We are able to obtain the original COIs for all firms in our sample from VCExperts,
which has made a major effort in collecting the COIs for higher-profile VC-backed private firms.
VCExperts has gathered and coded such COIs for selected firms. For lower-profile firms,
however, VCExperts has gathered and coded COIs only when its clients made specific requests.
6 The state in which a firm is incorporated may not necessarily be the state in which the firm is headquartered. In our sample, most firms are incorporated in the State of Delaware. 7 For example, in Delaware, the Department of State’s Division of Records, maintains COI filings. However, the COIs are neither downloadable nor searchable. According to their staff, all requests for copies (which begin at $10 per page) must be made in person, using the computers in their office to look up companies.
! 11
For the purposes of our analysis, we did not rely on VCExperts’s coding scheme, but rather
coded the original COIs ourselves for our sample unicorns.
Each COI sets forth the rights, preferences, and restrictions of each class and series of
common and preferred shares. COIs thus allow us to document and analyze the contractual terms
between the unicorns and their investors in the different investment rounds. We discuss the
definition of each of these contractual terms and the coding procedure in Section 2.4.
For each investment round, the COIs also document the number of authorized shares of
common and convertible preferred shares, as well as their conversion price. Although the
conversion price allows us to infer the direction of changes in valuations, we are generally not
able to estimate valuations from the COIs directly: the number of shares actually outstanding is
often ambiguous (often not all authorized shares are issued) and some of the variables we would
need to do a “true” valuation along the lines of Metrick and Yasuda (2011) are missing. For this
reason, we use the valuations estimated by VCExperts when available and for controlling
purpose only, and interpret the results with caution.8
2.2 Mutual funds and their investments in unicorns
Open-end mutual funds have increasingly invested in the convertible preferred stocks
issued by unicorns in recent years, both indirectly from secondary markets and directly by
participating in investment rounds. In a mutual fund-involved investment round, the mutual
funds may join a syndicate under a lead VC and/or negotiate with a prospective portfolio firm
directly. Mutual funds may even lead an investment round, as in the D round of Uber highlighted
in Table 1, led by Fidelity Investments.
8 VCExperts uses its own proprietary model to estimate the valuations of some investment rounds.

! 12
Our sample of mutual funds includes all actively managed U.S. domestic equity funds.
We obtain basic information on our sample of mutual funds as of December 2016 from the
standard CRSP survivor-bias-free mutual fund database. We then calculate fund characteristics
including fund size, family size, institutional share of capital, turnover, cash ratio, management
fee, and fund flow volatility. Although most characteristics are self-explanatory, we provide
formal definitions in Table A1 in the Appendix. Summary statistics are reported in Table 2.
[Table 2 about here]
We use mutual funds’ quarterly portfolio holdings for fund-level analysis on the
determinants of mutual fund investments in unicorns, and use their direct investments in unicorns
for round-level analysis of contractual provisions. Since there are no CUSIPs associated with
private firms’ preferred stocks, we first obtain quarterly portfolio holdings of unicorns from the
CRSP Mutual Fund Holdings database by searching for the names of the unicorns in the holdings
data.9 It is even more challenging to distinguish between direct investments and secondary-
market transactions. To identify mutual fund direct investments in unicorns round by round, we
further use SEC forms N-CSR and N-Q and apply the following two-step process.10
First, we identify cases where the security name in CRSP Mutual Fund Holdings database
indicates the series of preferred stock and where a fund initiates a position in the specific series
within a 60-day window of the corresponding round’s closing date. In principle, it is impossible
9 One challenge is that a unicorn may use different trading names in different investment rounds, and the trading names may be different from its registered name in the COI. We hand-collect all the available trading and alternative names for our sample unicorns (from their company websites and press releases) to obtain the highest-quality match possible between a unicorn name and the associated security names in the holdings data. 10 Private firms generally disclose the number of their investors in the SEC Form D as well. Although the Form D also asks private firms to disclose the names of their investors and their respective investment amounts, such information is not required and thus the unicorns almost never disclose. The names of investors documented by other commercial databases rely on voluntary disclosure by the investors themselves; such information is only partial and thus is not useful for our purpose. As a result, we have to rely on the realized portfolio holdings of mutual funds, the disclosure of which is subject to the 1940 Act, to infer their investments in unicorns.
! 13
to fully distinguish between direct investments and secondary-market transactions, and the
process described above may inevitably include some secondary-market transactions of the
corresponding series of preferred stocks. But given the proximity to the closing date, we consider
such secondary-market transactions comparable to direct investments. We have also confirmed
using other available data sources, such as Crunchbase, that the time difference between a direct
investment and the corresponding round closing date may be indeed larger than 30 days but is
generally smaller than 60 days. Thus, we pick a 60-day window in our analysis.
In many cases, however, the title of security in CRSP Mutual Fund Holdings database
does not state the series of preferred stock. Therefore in the second step, we identify cases where
at least one mutual fund increased its holdings of a unicorn within a 60-day window of a round’s
closing date. We then use N-CSR and N-Q filings to confirm whether the fund did invest in the
series of preferred stock in question.
Once we confirm from the above two steps that at least one fund bought preferred stock
within a 60-day window of the round’s closing date, we set the MFs dummy, which is at the
unicorn-round level, to 1, indicating that this round is a mutual fund-involved round.11
2.3 Contractual provisions
Following Kaplan and Stromberg (2003), we focus on the major contractual provisions
set forth in the COIs: dividend rights, liquidation rights, anti-dilution protections, redemption
rights, voting rights (in particular the rights to elect and vote for directors), and protective
provisions. These provisions specify the ex-ante allocation of cash flow and control rights
between firms and their investors. In the following, we describe these provisions, their
11 We do not include investments that are done through private equity funds, even if they are owned by mutual funds, such as Wellington Management’s Hadley Harbor fund, which closed on around $1 billion in 2014.

! 14
governance and incentive implications, and our coding procedure. The corresponding
distributions of these contractual provisions are presented in Table 3.
[Table 3 about here]
Different types of provisions have varying implications. Among the contractual
provisions that we consider, dividend rights, liquidation rights, and anti-dilution protections
reflect the allocation of standard cash flow rights; voting rights (to elect directors) and protective
provisions allocate control rights; while redemption rights and the underlying detailed provisions
reflect the allocation of liquidity rights.
2.3.1 Standard cash-flow rights
Dividend rights. Dividends provide time-based guaranteed upside to investors. There are
two components. We consider whether the dividends are cumulative. Cumulative dividends
(cumulative = 1) are guaranteed; they accumulate over time and effectively increase the investors’
return in the event of liquidation. In contrast, if dividends are not cumulative (cumulative = 0),
the dividends, if any, are paid only if declared by the discretion of the firm’s board of directors,
and thus are not guaranteed ex-ante. Overall, cumulative dividends are suggestive of stronger
cash flow rights of the investors.
Liquidation rights. Liquidation rights impact how the proceeds are shared among
different classes and series of investors in a deemed liquidation event, which is usually defined
as a sale of a firm or the majority of the firm’s assets. We consider three dimensions of
liquidation rights as follows.
First, liquidation preference specifies whether in the event of a liquidation event, a given
class or family of classes of convertible preferred stocks is senior (liquidation preference = 3),
! 15
pari passu (liquidation preference = 2), or junior (liquidation preference = 1) to the previous
class or classes.
Second, liquidation multiple specifies how many times the original purchase price (plus
any declared but unpaid dividends) the investor will be entitled to receive in preference to other
shareholders, and is coded as a number. In the case of large exits, the amount received by
converting the shares in common stock is likely to be greater, an option the investors will
consequently exercise. Conversely, if the firm goes bankrupt or is sold for a very low amount,
this contractually stipulated amount may not be received.
The third dimension of liquidation rights is participation rights. There are three possible
types of participation rights associated with preferred shares. Participating provisions allow the
holders of a convertible preferred stock to “double dip”: in the case where the liquidation
preferences is triggered, they receive the stipulated amount (the liquidation multiple times the
original purchase price) back first and then can convert the convertible preferred stock to a
common stock and share the upside. We divide agreements into those with no participation
(participation = 1), capped participation (participation = 2; the holders of a convertible preferred
stock receive the liquidation multiple times the original purchase price back first and then share
ratably with the holders of common stock up to a total liquidation amount per share equal to
some multiple of the original purchase price), and full participation (participation = 3).
Intuitively, participation rights allow investors to receive both upside and downside protections.
Overall, more senior liquidation preferences, higher liquidation multiples, and stronger
participation rights are suggestive of stronger investor cash flow rights.
Anti-dilution protections. Anti-dilution protections aim to protect the preferred investors
in the event a firm issues new equity at a lower valuation than in previous financing rounds.
! 16
Anti-dilution protections can be full ratchet (anti-dilution = 2; the conversion price of the
existing convertible preferred shares is adjusted downwards to the price at which the new shares
are issued, regardless of the number of new shares issued) or weighted average (anti-dilution = 1;
the conversion price of the existing convertible preferred shares is adjusted downwards
according to a weighted average of the original and new financing sizes), or absent entirely (anti-
dilution = 0). The use of anti-dilution protections, and in particular full ratchet anti-dilution
protections, is suggestive of strong investor cash flow rights.
2.3.2 Liquidity rights
Given our focus on mutual funds, we classify redemption rights and the underlying
detailed provisions as a new category of contractual provisions: liquidity rights.
Redemption rights. Redemption rights specify whether a class or series of convertible
preferred stocks is redeemable (redemption = 1) at its holders’ discretion. We call this the
extensive margin of redemption rights. In the event of redemption, the par value of the
corresponding convertible preferred stock is paid back to the redeeming investor, provided the
firm has enough funds available. Different from mutual fund redemptions, which are required by
the 1940 Act to be met at the same-day closing net asset value (NAV) within seven business
days, redemption of preferred stock is met at the original purchase price, that is, the par value of
the preferred stock12 and subject to a more complex procedure (which we detail below). They are
also impacted by the applicable corporate laws in the states of incorporation.
To our knowledge, there does not exist any data documenting how much the redeeming
preferred shareholders actually get in the event of redemption. However, thanks to the rich
12 In our sample, some COIs specify that the redemption shall be met at either the original purchase price or an estimated “market” value of the preferred stocks at the time of redemption request. We choose not to code this variation because it is impossible to know the market value ex-ante.
! 17
structure of COIs, we are able to document and code several more granular dimensions regarding
the details of redemption rights for any given investment round with redemption rights. We call
these details the intensive margin of redemption rights.
In what follows, we highlight the institutional details regarding redemption rights as well
as their economic implications. We stress that although these different dimensions may suggest
relatively stronger or weaker redemption rights, the fact of an investment round having
redemption rights always indicates stronger redemption rights than without any redemption
rights at all.
Months until first redemption. Whenever preferred stock is redeemable, investors can ask
for redemption only after a certain date. We measure the number of months from round closing
until expiration of the “lock-in” period. A shorter lock-in period indicates stronger redemption
rights.
Delay after redemption notice. Delay after redemption notice is the maximum number of
days from the time when investors submit a redemption notice (legally called the notice or
receipt date) to the time of first redemption payment (legally called the redemption date). In
some circumstances, the COIs indicate that a delay is possible but do not specify the maximum
number of days allowed. In such cases, we use two specifications: one treats these cases as
missing values while the other sets these missing values to 365, which is the longest delay
observed in the data.
Voting requirements. In some circumstances, a redemption notice from any shareholder is
sufficient for redemption to take place (No vote necessary = 1), while in other circumstances a
voting process by other shareholders is required (No vote necessary = 0). If voting is required, it
may take place at either the specific class level (Class vote = 1) or the entire preferred stock level
! 18
(Class vote = 0). In either case, the firm will send a vote notice to other shareholders in the
required pool.13 From the perspective of investors who want to redeem, no voting indicates
strongest redemption rights, while class voting is preferable to voting by all preferred shares.
Number of annual installments. Firms may delay redeeming shares by spreading out
redemption payments over time. We count the maximum number of annual installments allowed
by the COI. If immediate payment is required, the number of annual installments is set to 0.
Stronger redemption rights, along both the extensive and intensive margins, imply that
investors enjoy a higher level of asset liquidity. Stronger investor liquidity rights also imply
stronger indirect corporate governance provisions for the entrepreneurs to perform better.
2.3.3 Control rights
Voting rights to elect directors (board rights). Investors in preferred shares may have the
right to elect a certain number of directors, who represent either the preferred investors
collectively or that particular class or series. We focus on three components of such rights. First,
we consider the number of director(s) that the investors of a class or series of convertible
preferred stocks are able to elect as a separate voting class. We call such directors separate
directors and code the stipulated number. Second, we consider the number of director(s) that the
investors of a class or series are able to elect with all of other classes of convertible preferred
stocks as a whole. We again tabulate the number of such preferred directors. Third, we consider
the number of director(s) that the investors of a class or series are able to elect with some but not
all of the other classes of investors as a pool. We again total the number of such pool directors.
13 Technically, all the shares in the required voting pool will be redeemed by default, but shareholders who do not initiate the redemption request may choose to be excluded from redemptions. No matter whether they choose to be included or excluded from redemptions, they may choose to vote.

! 19
More and stronger voting rights to elect directors are suggestive of stronger corporate
governance provisions.
Protective provisions. Protective provisions are analogous to veto rights: they give the
investors of a class or series of convertible preferred stocks the voting rights to veto certain
actions by the firm or other class or series of equity holders. There are many more possible types
of protective provisions than one can reasonably code, and it is generally difficult to weigh their
relative importance.14 As a result, we simply count the number of items of protective provisions
for any given class or series of convertible preferred stocks. Similar to the analysis of voting
rights to elect directors, we also consider protective provisions at two levels. The count of
separate protective provisions includes the protective provisions exclusively associated with a
specific class or series of convertible preferred shares, while the count of preferred protective
provisions includes those that are associated with all classes of convertible stock as a single
voting class. A larger number of protective provisions is generally suggestive of stronger
corporate governance provisions.
Generally, the allocation of cash flow rights directly reflects investors’ bargaining power
and risk preferences in various aspects (downside protection versus upside exposure, etc.),
though they may be correlated with control rights (Kaplan and Stromberg, 2003). The allocation
of control rights is more indicative of the extent of direct monitoring by the corresponding
investors. The allocation of liquidity rights also impacts the incentives of the entrepreneurs, but
14 Typical corporate actions that are subject to protective provisions include but are not limited to 1) to liquidate, dissolve or wind-up the corporation to effect any merger or consolidation, 2) to amend, alter or repeal any provision of the COI or bylaws of the corporation in a manner that adversely affects the powers, preferences or rights of the given series, 3) to create any additional class or series of capital stock, 4) to reclassify or alter any existing security of the corporation that is pari passu with the given series, and 5) to increase or decrease the authorized number of directors.
! 20
more directly reflects mutual funds’ need of illiquidity risk management in our context. As a
result, we consider the different types of contractual provisions separately.
Note that we code all the provisions for each unicorn-round at the time of the financing.
In other words, we focus on the ex-ante contractual and incentive provisions at the time investors
and firm negotiate the investment round. Provisions associated with a specific class or series of
convertible preferred stocks may be revised in subsequent investment rounds (Broughman and
Fried, 2010). But such revisions would be a much less clear indicator of the strength of ex-ante
corporate governance provisions by the specific class of investors.
3 Results
3.1 Time trends in mutual fund investment in unicorns
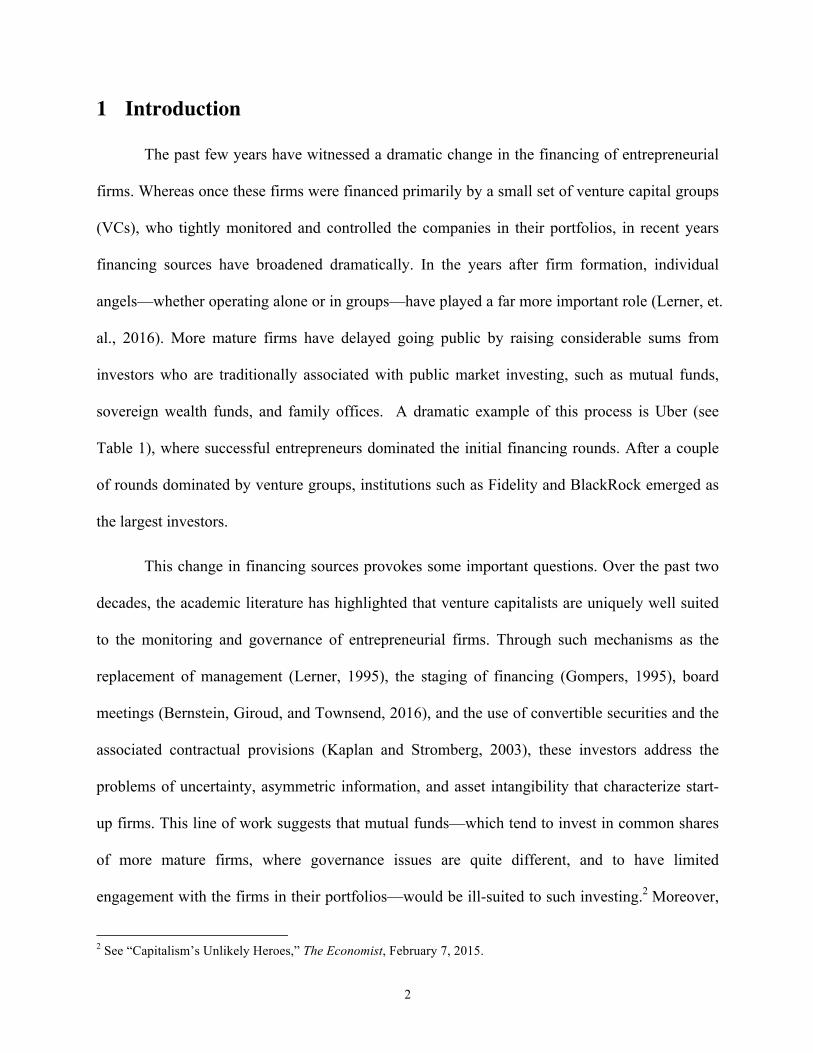
We start by documenting in Figure 1 the increased propensity for mutual funds to invest
in unicorns. Panel (a) of Figure 1 shows that over the 2010-2016 period, the number of distinct
funds directly investing in unicorns has increased from less than 10 to more than 140. Panel (b)
of Figure 1 illustrates the increase over time in mutual funds’ aggregate holdings of unicorns.
The dollar value of aggregate holdings has also increased by an order of magnitude, from less
than $1 billion to more than $8 billion. These results paint a consistent picture of unicorn
investments becoming a more important part of the portfolios of open-end mutual funds.
[Figure 1 about here]
From another perspective, Panel (c) of Figure 1 shows that the fraction of unicorn
financing rounds with one or more mutual funds participating directly has also increased
significantly over our sample period. In 2010 and 2011, less than 5% of financing rounds
involved mutual funds as investors; by 2015 and 2016, this fraction had climbed to 40%. We

! 21
note that the quarterly volatility of mutual fund direct investment in unicorns was high across the
four quarters of 2016, possibly consistent with the general difficulty of private firms getting new
funding in that year.15 Overall, the results in Figure 1 suggest that mutual funds are increasingly
becoming an important source of capital for entrepreneurial firms.
3.2 Determinants of mutual fund investment in unicorns
We next explore the cross section of mutual fund investments in unicorns, asking two
main questions. First, which firms and rounds are mutual funds more likely to invest in directly?
And second, which funds are more likely to invest in unicorns?
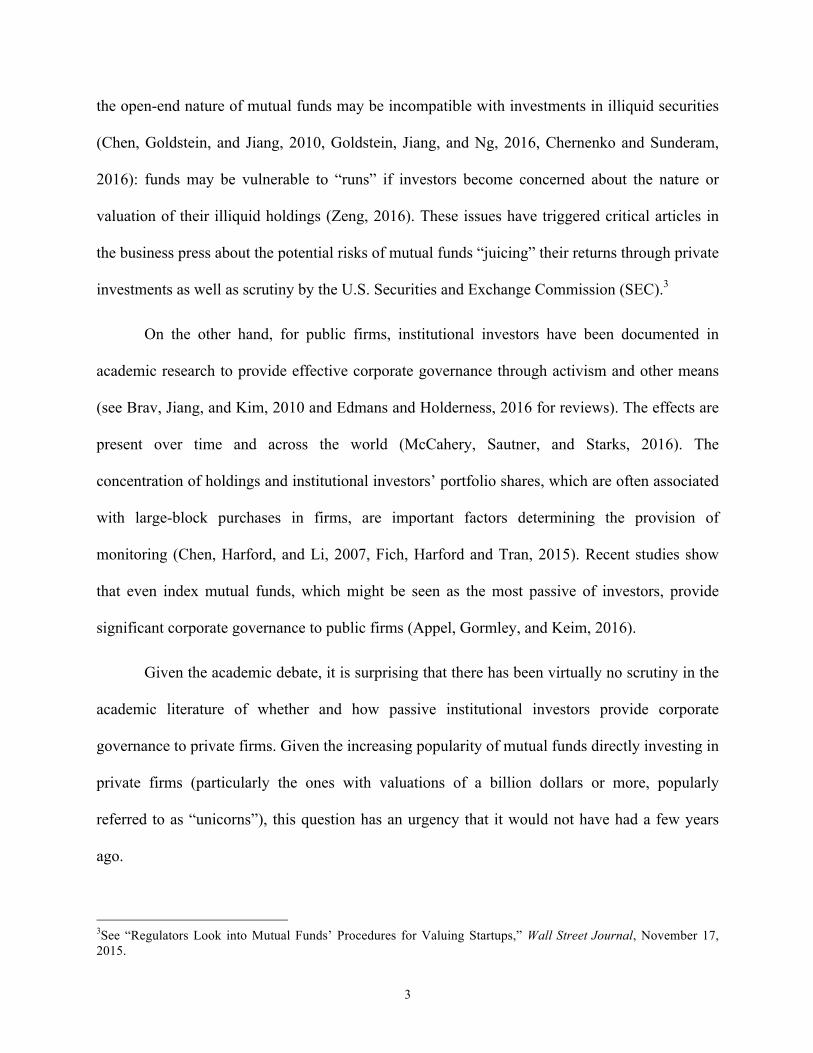
Figure 2 reports the probability of mutual funds investing in different types of unicorns.
Panel (a) shows that mutual funds are much more likely to participate in late than in early
financing rounds. In our data, mutual funds did not participate in any seed round. On the other
hand, more than 38% of Series F and more than 47% of later rounds involve mutual funds. This
pattern is consistent with the anecdotal evidence that mutual funds hope to boost their portfolio
performance by investing in companies that are close to going public or being acquired.16
[Figure 2 about here]
Panel (b) of Figure 2 shows that Healthcare and Information Technology (IT) are the two
industries that are most likely to see mutual fund investments. This result is also consistent with
the anecdotal evidence suggesting that mutual funds chase unicorns in “hot” industries.
Panel (c) of Figure 2 shows that unicorns in Massachusetts are most likely to attract
mutual fund direct investments, followed by unicorns in the states of California, Washington,
15 For example, see “Blood in the Water: 90% of the Billion-Dollar Unicorn Startups Are In Trouble,” Business Insider, January 21, 2016. 16 For example, see “T Rowe Price $17bn Fund Reveals Details of Private Investments,” Financial Times, February 28, 2017.

! 22
New York, and other states. Since Fidelity, with its headquarters in Boston, is the largest fund
family that has been consistently investing in unicorns, this pattern suggests potential home bias
in mutual fund investments in unicorns. This bias might also be driven by savings in pre-closing
due diligence costs.
[Figure 3 about here]
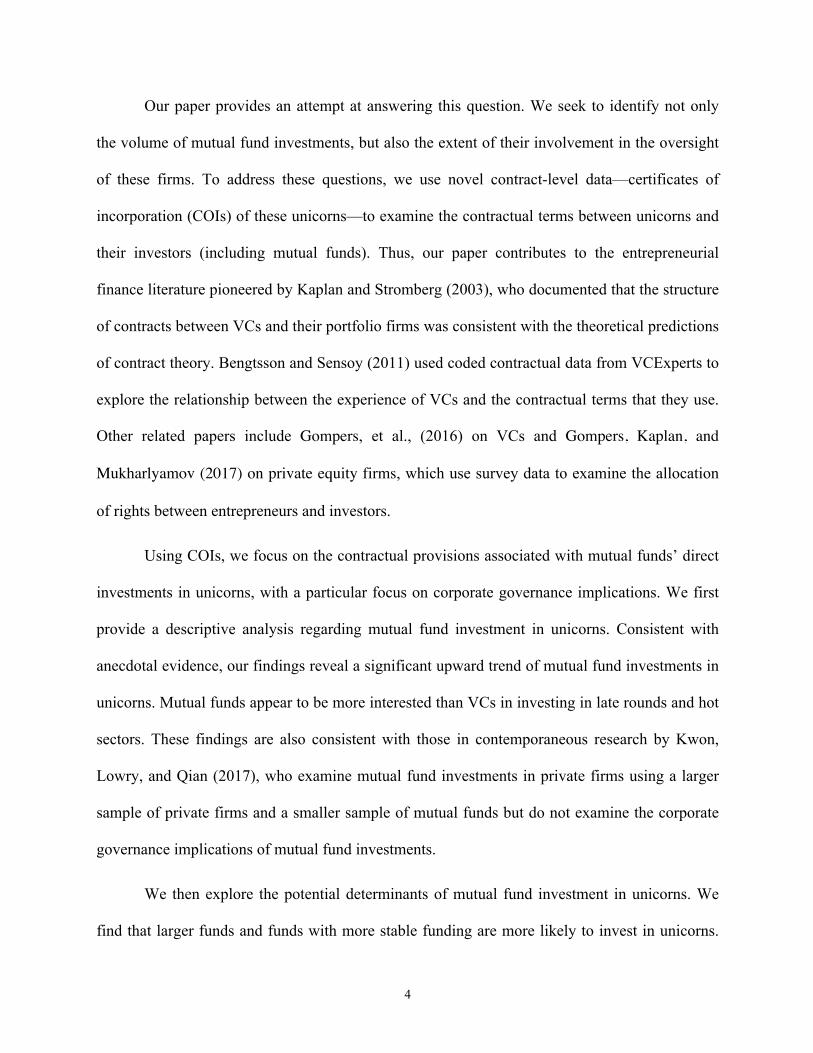
From a slightly different angle, Figure 3 examines the conditional distribution of unicorn
financing rounds with and without mutual fund participation. We report the distribution of
mutual fund-involved rounds across rounds (Panel a), sectors (Panel b), and states of
headquarters (Panel c), and compare it to the corresponding distribution of investment rounds
without any mutual fund involvement. Panel (a) shows that the distribution of rounds with
mutual fund involvement is more heavily tilted towards later investment rounds. Panel (b) shows
that mutual fund-involved rounds are more likely to be in the Healthcare and IT sectors. Panel (c)
suggests that rounds with mutual funds are more likely to be in California and Massachusetts.
We next ask which funds are more likely to invest in unicorns. We estimate regressions
of the form:
!"#$%&"!!"#$%"&'"!!ℎ!"#!,!
= ! + !!!"#$!!"#$!,! + !!!"#$%&!!"#$!,! + !!!"#$%$&$%'"()!!ℎ!"#!,!
+ !!!"#$%&'#!,! + !!!"#ℎ!!"#$%!,! + !!!"#"$%&%#'!!""!,!
+ !!!"#$!!"#$%&#%&'!,! + !!,! ,!
where the unit of observation is fund-quarter date.

! 23
We consider two alternative specifications. In the first one, the dependent variable is the
share of total net assets (TNA) invested in unicorns at the end of a given quarter. We use a Tobit
regression specification. In the second one, the dependent variable is an indicator variable equal
to one if the unicorn portfolio share is greater than zero. We use in this case a logit regression
specification. In each case, we include the Lipper objective-quarter date fixed effects. These
fixed effects control for the aggregate time trends documented in Figure 1, as well as unobserved
characteristics at the objective level. Table 4 reports the results.17
[Table 4 about here]
We find that larger funds allocate a larger fraction of their portfolio to unicorns (columns
1-3) and are more likely to invest in unicorns (columns 4-6). These results are consistent with
economies of scale whereby larger funds are in a better position to bear the fixed research and
legal costs necessary to invest in unicorns. We also find evidence of economies of scale at the
fund family level: funds offered by larger fund families allocate a larger share of their portfolio
to unicorns.
Funds with more volatile fund flows are less likely to invest in unicorns (row 3).
Investing in a very illiquid asset is likely to be especially costly for funds with more volatile and
less predictable fund flows, as these funds might be forced to sell their illiquid assets in order to
meet redemption requests. The correlation 1) between fund flow volatility and the unicorn
portfolio share and that 2) between fund flow volatility and the likelihood of direct investment in
unicorns are both significantly negative, suggesting the existence of the liquidity concern
mentioned above. 17 The number of observations varies across Tobit and logit specifications in Table 4. The reason is that logit specifications drop observations where objective-year fixed effects perfectly predict positive investment in unicorns. Tobit regressions, on the other hand, include these observations.
! 24
We also find evidence that management fees and institutional shares are positively
associated with unicorn investments. Higher management fees may reflect greater ability to
research and invest in unicorns. The positive effect of the institutional share may reflect lower
flow volatility and weaker strategic complementarities among investors that may prompt them to
withdraw from funds with illiquid assets (Chen, Goldstein, and Jiang 2010, Goldstein, Jiang, and
Ng 2016). Thus, funds with a higher institutional share may be more comfortable investing in
unicorns.
3.3 Contractual provisions in unicorn investments
How do the cash flow and control rights received by mutual funds compare to the rights
received by VCs? To answer this question, we examine ex-ante contractual provisions,
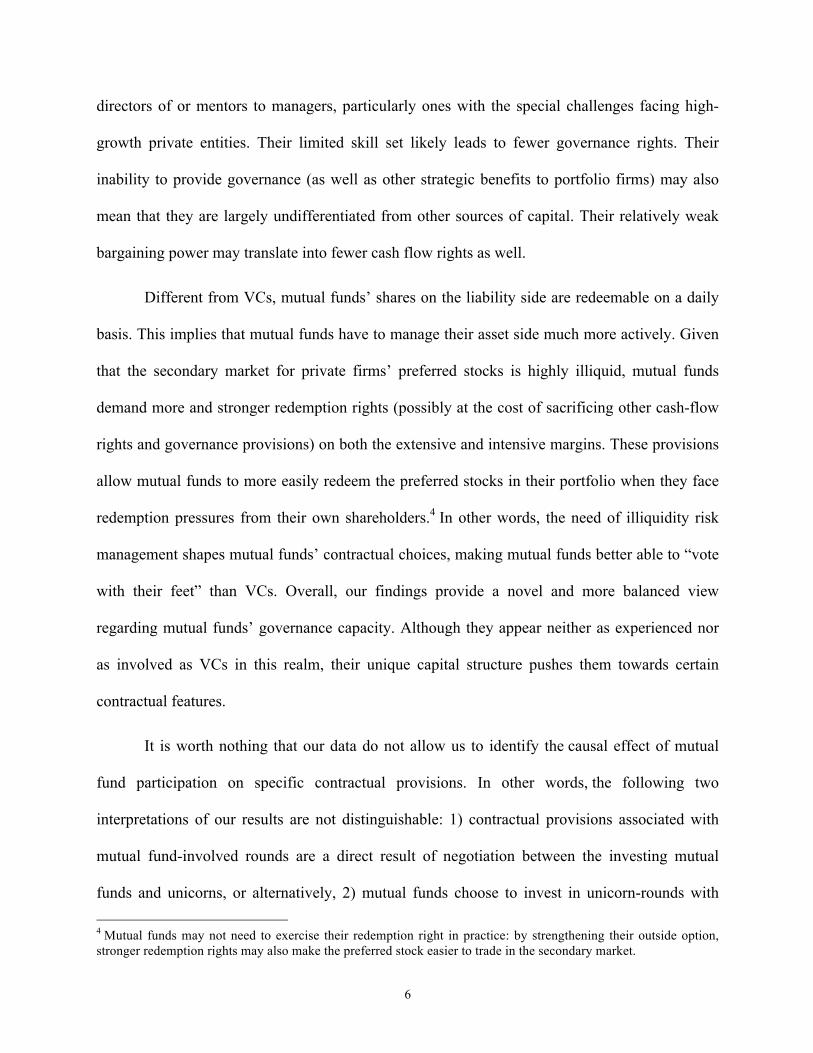
comparing financing rounds with and without mutual fund participation. Figure 4 provides a first
look at the differences in certain key ex-ante contractual provisions.
[Figure 4 about here]
Figure 4 shows that financing rounds with mutual fund participation are less likely to
have participation rights (Panel a), more likely to have redemption rights (Panel b), and less
likely to be represented on the board of directors (Panel c). Although suggestive, the results in
Figure 4 do not control for round number or time, and thus could be driven by the fact that
mutual funds invest in later rounds and have been increasing their investments over time. To
address these concerns, we next turn to more formal regression analysis.
3.3.1 Standard cash flow rights
Table 5 reports the results of regressions exploring liquidity and other standard cash flow
rights. Mutual fund participation in the current financing round, that is, MFs, is the main

! 25
independent variable of interest. In various specifications, we include 1) year fixed effects to
control for systematic differences across vintages, 2) round fixed effects, valuations, and ex-post
exit outcomes to control for differences between early versus late financing rounds or more
broadly less versus more successful rounds, and 3) unicorn fixed effects to control for
differences in fixed unobserved characteristics across unicorns. The cash flow rights we look at
are 1) full ratchet anti-dilution protection, 2) cumulative dividends, 3) liquidation multiples, 4)
participation rights, and 5) liquidation preferences. All provisions are coded according to the
descriptions in Section 2.4. For the cash flow rights (columns 5-24), larger values are suggestive
of greater cash-flow rights for the investors in the financing round, while larger values in
columns (1) through (4) are suggestive of greater liquidity rights at the extensive margin.
[Table 5 about here]
As shown in columns (5)-(8), we find some evidence that mutual fund investments are
less likely to be in the form of participating preferred stock. For example, with year and round
fixed effects, mutual fund-involved rounds are 16.2% less likely to have participating rights.
This evidence suggests that mutual funds enjoy weaker cash flow rights in this specific
dimension. We find little association between mutual fund investment and other standard cash
flow rights.
3.3.2 Liquidity rights
The results in columns (1) through (4) of Table 5, however, show that mutual fund-
involved rounds are associated with significantly stronger liquidity rights. In particular, mutual
fund participation is significantly correlated with stronger redemption rights at the extensive
margin. The difference in redemption rights between rounds with and without mutual fund

! 26
participation is particularly large economically. In column (1), we find evidence that convertible
preferred stock issued in rounds with mutual fund participation is 18.6% more likely to have
redemption rights with year and round fixed effects, and the result is still strong and robust
(13.2%) with unicorn fixed effects (column 4).
Importantly, after further controlling for post-money round valuations estimated by
VCExperts (column 2) or ex-post exit outcomes (column 3), the results are still statistically
significant and the economic magnitude is even stronger: mutual fund-involved rounds are 21.2%
or 18.5% more likely to have redemption rights with year and round fixed effects. The
association between mutual fund participation and stronger liquidity rights are thus unlikely to be
driven by mutual funds selecting more successful investment rounds, but instead reflect their
preferences among contractual provisions. The same argument also applies to our later analysis
concerning control and voting rights.
To better understand along which dimensions mutual fund-involved rounds are likely to
be associated with stronger redemption rights, we look at the underlying detailed provisions
described above that capture the intensive margin of redemption rights. The results are reported
in Table 6, in which year and round fixed effects are included.
[Table 6 about here]
Conditional on a round having redemption rights, mutual fund-involved rounds are
associated with stronger redemption rights along all the detailed dimensions that we consider,
with the majority of them being statistically significant. First, mutual fund participation is
associated with significantly shorter delays between the notice/receipt date and actual
redemption date. As suggested in column (2), mutual fund participation is associated with a
reduced delay of 13.6 days. Some COIs indicate that a delay is possible but do not specify the

! 27
maximum days allowed. For such cases, if we set the maximum delay to 365 days (the longest
delay observed in the data) instead of treating them as missing values, column (3) suggests that
mutual fund participation is associated with a reduced delay of 89.3 days. Moreover, conditional
on a vote requirement, mutual fund-involved rounds are 30.3% more likely to require a vote by
the holders of the same class of preferred stock rather than a vote by all holders of all classes of
preferred stock (column 5). Column (6) indicates that in mutual fund-involved rounds, actual
cash distributions are spread out across fewer annual installments, that is, less likely to be
delayed; in terms of the magnitude, mutual fund participation is associated with a reduced delay
of three quarters of a year. Finally, although they are not statistically significant, the results in
columns (1) and (4) suggest that mutual fund-involved rounds may be associated with a shorter
delay until investors can ask for redemption and are less likely to require a vote to effectuate
redemptions.
These results are intuitive from the perspective of liquidity risk management. Compared
to VCs, mutual funds have much more liquid liabilities and are subject to daily redemptions.
This means that mutual funds may be forced to liquidate their holdings of unicorns in order to
meet redemption requests. To better manage the liquidity risk associated with large redemptions
from their shareholders, mutual funds request stronger redemption rights from the unicorns they
invest in. Even if mutual funds do not intend to redeem their holdings of unicorns, they might
still want to have the redemption rights ex-ante to inform the SEC and their investors that they
can exit their unicorn investment if needed, given the new SEC rule that requires mutual funds to
self-categorize their holdings into different liquidity buckets.18
18 The new rule is available at https://www.sec.gov/rules/final/2016/33-10234.pdf.
! 28
In all, the results in Tables 5 and 6 are suggestive of mutual funds being willing to give
up some standard cash flow rights in exchange for stronger liquidity rights. These findings
regarding the priority of mutual funds’ contracting choices are further echoed by the following
analysis on control and voting rights.
3.3.3 Control and voting rights
We next turn our attention to control rights and look at 1) the right to elect directors and 2)
protective provisions. We start with the regressions of the right to elect the board of directors,
since the board of directors plays an important role in corporate governance and monitoring
(Adams, Hermalin, and Weisbach, 2010) and since outside directors can be particularly effective
(Lerner, 1995, Duchin, Matsusaka, and Ozbas, 2010). Because the vast majority of director
elections are uncontested (Cai, Garner, and Walkling, 2009), the number of directors that a class
or series of investors can elect and vote for is a good measure of the strength of monitoring.
Table 7 reports the results. In columns (1) through (4), the dependent variable is the
number of directors that a class or series of investors can elect exclusively. In columns (5)
through (8), the dependent variable is the total number of directors that a class or series of
investors can elect, including preferred directors and pool directors as defined earlier. Since
preferred directors and pool directors do not represent a single class of investors, we weight them
to better reflect the governance provisions by the investors in the investment round. Specifically,
we divide the number of preferred directors by the round’s number under the assumption that
these preferred directors represent equally all classes of preferred stock investors. Similarly, for
pool directors, we divide the number of directors by the number of classes in the voting pool
under the same assumption. We then sum up these numbers to get the weight-adjusted total
directors for each investment round.
! 29
The results in Table 7 show a robust pattern: mutual fund-involved rounds are associated
with weaker rights to elect and vote for directors, and the effects are both economically and
statistically significant. Specifically, mutual funds participation is associated with 0.22-0.41
fewer class directors and 0.25-0.45 fewer weight-adjusted total directors across different fixed-
effect specifications.
Notably, the results are strong and robust even if we include round fixed effects and post-
money round valuations or exit outcomes as controls in columns (1) through (3) and (5) through
(7). This suggests that the association between mutual fund participation and weaker board
representation is unlikely to be driven by mutual funds selecting more successful unicorn-rounds
that potentially need less corporate governance, but more likely to reflect mutual funds’
contracting priorities.
[Table 7 about here]
The results in Table 7 thus reveal an important difference between mutual funds and VC
in their investments in private firms. While VCs provide monitoring and value-added to their
portfolio firms by bringing in outside directors and structuring the board of directors (Lerner,
1995, Hellmann and Puri, 2002), mutual funds are significantly less likely to get involved in
corporate governance through representation on the board of directors. Our results are thus
broadly consistent with the existing evidence that mutual funds are not very active in voting on
director elections in public firms (Choi, Fisch, and Kahan, 2013, Iliev and Lowry, 2015).
We next turn to the protective provisions. In Table 8 we look at 1) the number of
protective provisions that a class or series of investors enjoy exclusively and 2) the number of
total protective provisions. Similarly, in calculating the number of total protective provisions, we
! 30
weight the number of preferred protective provision to reflect the corporate governance
associated with a given investment round.
[Table 8 about here]
The results in Table 8 show that mutual fund participation is generally associated with
more protective provisions, suggesting that mutual fund-involved rounds’ lack of representation
in boards is likely to be partially compensated by enjoying more veto rights. The results in Table
8 are stronger when looking at within unicorn variation in columns (4) and (8) than across
unicorns variation in the other columns. This makes sense since simple counts of protective
provisions may not fully capture differences in the strength of protective provisions across
unicorns. Within a given unicorn, however, increases in the number of protective provisions are
a good indicator of stronger rights. But again, given that the number of protective protections is a
less precise measure for governance provision than the number of board directors, we interpret
the results of protective protections with caution.
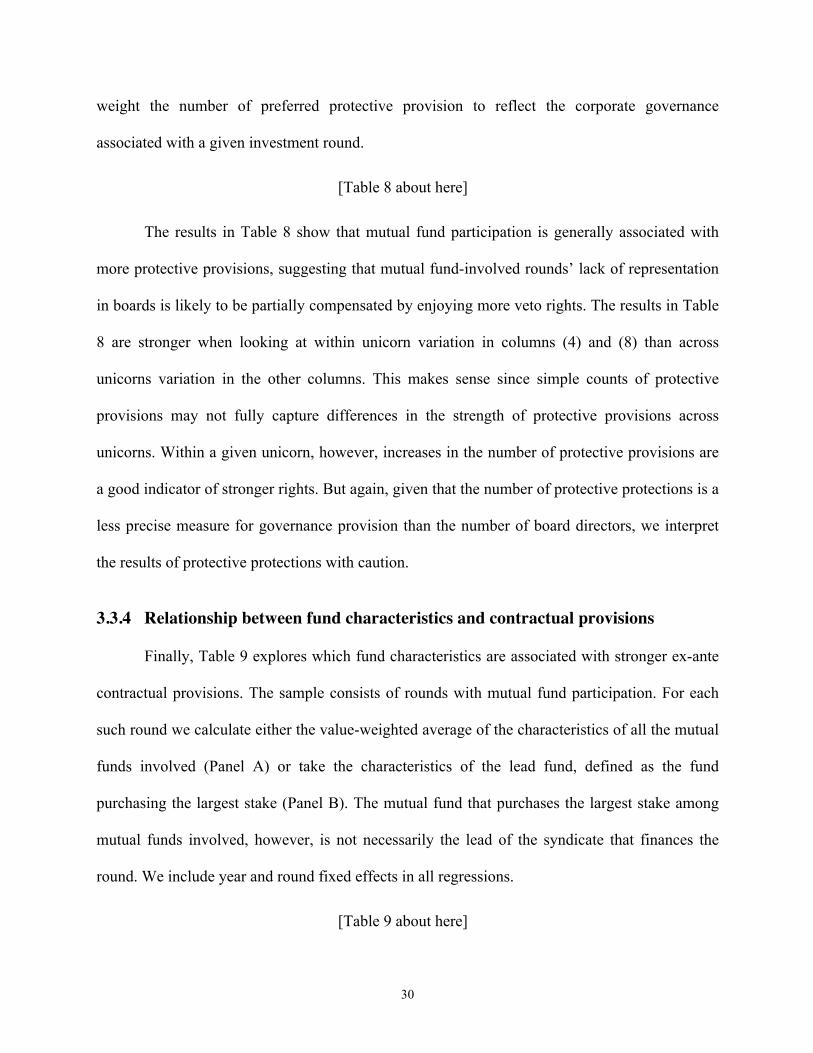
3.3.4 Relationship between fund characteristics and contractual provisions
Finally, Table 9 explores which fund characteristics are associated with stronger ex-ante
contractual provisions. The sample consists of rounds with mutual fund participation. For each
such round we calculate either the value-weighted average of the characteristics of all the mutual
funds involved (Panel A) or take the characteristics of the lead fund, defined as the fund
purchasing the largest stake (Panel B). The mutual fund that purchases the largest stake among
mutual funds involved, however, is not necessarily the lead of the syndicate that finances the
round. We include year and round fixed effects in all regressions.
[Table 9 about here]

! 31
Given the relatively small number of mutual fund-involved rounds (N = 101), regressions
in Table 9 have limited statistical power. However, a couple of results do stand out and are
consistent with our key messages.
First, even within the sample of rounds with mutual fund participation, flow volatility of
the participating funds is associated with higher probability of the round having redemption
rights, as shown in Panel A, column (5). The economic magnitude is also quite large – a one
standard deviation increase in flow volatility (of the participating funds) is associated with 13.5%
higher probability of having redemption rights, which is statistically significant.
Second, in Panel B, we focus on the “lead” mutual fund of a given round and get even
stronger results. As shown in Panel B, column (5), a one standard deviation increase in flow
volatility (of the participating funds) is associated with 16.5% higher probability of having
redemption rights, which is even more statistically significant.
We note that, given the relatively small sample size and the strong correlation (0.57)
between fund size and family size in our sample, we control for only one measure of size at a
time. Our benchmark specifications in Table 9 use family size because the contractual terms with
portfolio unicorns are often negotiated by the fund family rather than by individual funds. We
obtain similar, though slightly weaker, results when using fund instead of family size.
Finally, we find that the funds that are part of larger fund families are more likely to
negotiate stronger liquidation preference rights (column 4).
Overall, our results suggest that compared to VCs, mutual funds are less likely to be
involved in direct monitoring. Although it is consistent with the traditional view that mutual
funds have a different skill set, we highlight that this may reflect not necessarily the lack of
! 32
aptitude for such tasks, but rather the central importance of liquidity risk management. In this
sense, our findings provide a novel and more balanced view regarding mutual funds’ contracting
priorities when investing in private firms.
4 Conclusion
Using novel contract-level data, we study the recent trend in open-end mutual funds
investing in unicorns—large, privately held start-ups—and the contractual consequences of
mutual fund investments. Larger mutual funds and those having more stable funding are more
likely to invest in unicorns. Having to carefully manage their own liquidity, mutual funds require
stronger redemption rights along both the intensive and extensive margins, suggesting
contractual choices consistent with the funds’ reliance on redeemable funding. But compared to
venture capital groups, mutual funds have weaker standard cash flow rights and are less involved
in firms’ corporate governance, being particularly underrepresented on boards of directors. Due
to data limitation, we are not able to establish a causal identification of the ex-post impact of
mutual fund investments on firms’ performance, but our current results are robust to controlling
for round fixed effects, valuations, ex-post exit outcomes, and unicorn fixed effects.
There are many open questions here, as the introduction suggested. One relates to
certification. Although they are not as involved in the corporate governance of portfolio firms as
VCs, mutual funds may still provide certification to the portfolio firms, similar to banks
(Megginson and Weiss, 1991) and VCs (Puri, 1996). This potential certification role may give
mutual funds “soft power”: the ability to intervene with unicorns even if their contractual rights

! 33
do not legally entitle them to do so.19 Studying such certification, as well as ex-post outcomes
more generally, are questions that we hope to address in future work.
19 For an example, see Mike Isaac, 2017, “Uber Founder Travis Kalanick Resigns as C.E.O.,” New York Times, June 21, 2017.

! 34
References
Adams, Renée, Benjamin Hermalin, and Michael Weisbach, 2010. “The Role of Boards of Directors in Corporate Governance: A Conceptual Framework and Survey.” Journal of Economic Literature, 48: 58-107. Appel, Ian, Todd Gormley, and Donald Keim, 2016. “Passive Investors, Not Passive Owners.” Journal of Financial Economics, 121: 111-141. Bengtsson, Ola, and Berk Sensoy, 2011. “Investor Abilities and Financial Contracting: Evidence from Venture Capital.” Journal of Financial Intermediation, 20: 477-502. Bernstein, Shai, Xavier Giroud, and Richard R. Townsend, 2016, “The Impact of Venture Capital Monitoring,” Journal of Finance. 71, 1591-1622. Brav, Alon, Wei Jiang, and Hyunseob Kim, 2010. “Hedge Fund Activism: A Review.” Foundations and Trends in Finance, 4, 1–66. Broughman, Brian, and Jesse Fried, 2010, “Renegotiation of Cash Flow Rights in the Sale of VC-Backed Firms,” Journal of Financial Economics, 95:384–399. Cai, Jie, Jacqueline Garner, and Ralph Walkling, 2009. “Electing Directors.” Journal of Finance, 64: 2389-2421. Chen, Qi, Itay Goldstein and Wei Jiang, 2010. “Payoff Complementarities and Financial Fragility: Evidence from Mutual Fund Outflows.” Journal of Financial Economics, 97: 239-262. Chen, Xia, Jarrad Harford, and Kai Li, 2007. “Monitoring: Which Institutions Matter?” Journal of Financial Economics, 86: 279-305. Chernenko, Sergey and Adi Sunderam, 2016. “Liquidity Transformation in Asset Management: Evidence from the Cash Holdings of Mutual Funds.” Unpublished working paper. Choi, Stephen, Jill Fisch, and Marcel Kahan, 2013. “Who Calls the Shots? How Mutual Funds Vote on Director Elections.” Harvard Business Law Review, 3: 35-81. Duchin, Ran, John Matsusaka, and Oguzhan Ozbas, 2010. “When Are Outside Directors Effective?” Journal of Financial Economics, 96: 195-214. Edmans, Alex, and Clifford Holderness, 2016. “Blockholders: A Survey of Theory and Evidence.” Forthcoming in Handbook of Corporate Governance, edited by Benjamin Hermalin and Mike Weisbach, New York, Elsevier. Fich, Eliezer, Jarrad Harford, and Anh Tran, 2015. “Motivated Monitors: The Importance of Institutional Investors’ Portfolio Weights.” Journal of Financial Economics, 118: 21-48.

! 35
Goldstein, Itay, Hao Jiang, and David Ng, 2016. “Investor Flows and Fragility in Corporate Bond Funds.” Journal of Financial Economics, forthcoming. Gompers, Paul, 1995. “Optimal Investment, Monitoring, and the Staging of Venture Capital.” Journal of Finance, 50: 1461-1490.
Gompers, Paul, Steven Kaplan, and Vladimir Mukharlyamov, 2017. “What Do Private Equity Firms Say They Do?” Journal of Financial Economics, 121: 449-476. Gompers, Paul, Will Gornall, Steven Kaplan and Ilya Strebulaev, 2016. “How Do Venture Capitalists Make Decisions?” Stanford University Graduate School of Business Research Paper, No. 16-33.
Gornall, Will and Strebulaev, Ilya A., 2017, “Squaring Venture Capital Valuations with Reality. ” Stanford University Graduate School of Business Research Paper, No. 17-29.
Hellmann, Thomas and, Manju Puri, 2002, “Venture Capital and the Professionalization of Start-Up Firms: Empirical Evidence,” Journal of Finance, 57: 169-197.
Iliev, Peter, and Michelle Lowry, 2015. “Are Mutual Funds Active Voters?” Review of Financial Studies, 28: 446-485.
Kaplan, Steven, and Josh Lerner, 2017. “Venture Capital Data: Opportunities and Challenges.” in John Haltiwanger, Erik Hurst, Javier Miranda, and Antoinette Schoar, editors, Measuring Entrepreneurial Businesses: Current Knowledge and Challenges, National Bureau of Economic Research Studies in Income and Wealth, Volume 75, Chicago, University of Chicago Press, 2017, pp. 413-431.
Kaplan, Steven, and Per Stromberg, 2003. “Financial Contracting Theory Meets the Real World: An Empirical Analysis of Venture Capital Contracts.” Review of Economic Studies, 70: 281-315. Kwon, Songjoung, Michelle Lowry, and Yiming Qian, 2017. “Mutual Fund Investments in Private Firms.” Unpublished working paper. Lerner, Josh, 1995. “Venture Capitalists and the Oversight of Private Firms.” Journal of Finance, 50: 301-318. Lerner, Josh, Antoinette Schoar, Stanislav Sokolinski, and Karen Wilson, 2016. “The Globalization of Angel Investments: Evidence Across Countries.” Journal of Financial Economics, forthcoming. Megginson, William and Kathleen Weiss, 1991. “Venture Capitalist Certification in Initial Public Offerings.” Journal of Finance, 46: 879-903.
Metrick, Andrew and Ayako Yasuda, 2011. Venture Capital and the Finance of Innovation, John Wiley & Sons, Inc., Second edition.
! 36
McCahery, Joseph, Zacharias Sautner, and Laura Starks, 2016. “Behind the Scenes: The Corporate Governance Preferences of Institutional Investors.” Journal of Finance, 71: 2905-2932. Puri, Manju, 1996. “Commercial Banks in Investment Banking Conflict of Interest or Certification Role?" Journal of Financial Economics, 40: 373-401. Zeng, Yao, 2016. “A Dynamic Theory of Mutual Fund Runs and Liquidity Management.” Unpublished working paper.

Figure 1Time Trend in Mutual Fund Investment in Unicorns
This figure shows (a) the number of open-end mutual funds investing in unicorns, (b) ag-gregate mutual fund holdings of unicorns, and (c) fraction of unicorn financing rounds with mutualfund participation.
(a) Number of funds investing in unicorns
0
50
100
150
Num
ber o
f fun
ds
2010q12010q3
2011q12011q3
2012q12012q3
2013q12013q3
2014q12014q3
2015q12015q3
2016q12016q3
(b) Aggregate mutual fund holdings of unicorns
0
2,000
4,000
6,000
8,000
Aggr
egat
e ho
ldin
gs o
f uni
corn
s ($
milli
on)
2010q12010q3
2011q12011q3
2012q12012q3
2013q12013q3
2014q12014q3
2015q12015q3
2016q12016q3
(c) Probability of mutual fund participation
0
.1
.2
.3
.4
Fina
ncin
g ro
unds
with
mut
ual f
und
parti
cipa
tion
2010q12010q3
2011q12011q3
2012q12012q3
2013q12013q3
2014q12014q3
2015q12015q3
2016q12016q3
37

Figure 2Probability of Mutual Fund Participation
This figure shows the fraction of financing rounds with mutual fund participation by series,sector, and state of headquarters.
(a) by Series
0 .1 .2 .3 .4 .5Probability of mutual fund participation
H or greater
G
F
E
D
C
B
A
Seed
(b) by Sector
0 .05 .1 .15 .2 .25 .3Probability of mutual fund participation
Other
Healthcare
Information Technology
Consumer Discretionary
Industrials
Financials
(c) by State of Headquarters
0 .05 .1 .15 .2 .25Probability of mutual fund participation
MA
CA
WA
NY
Other
38
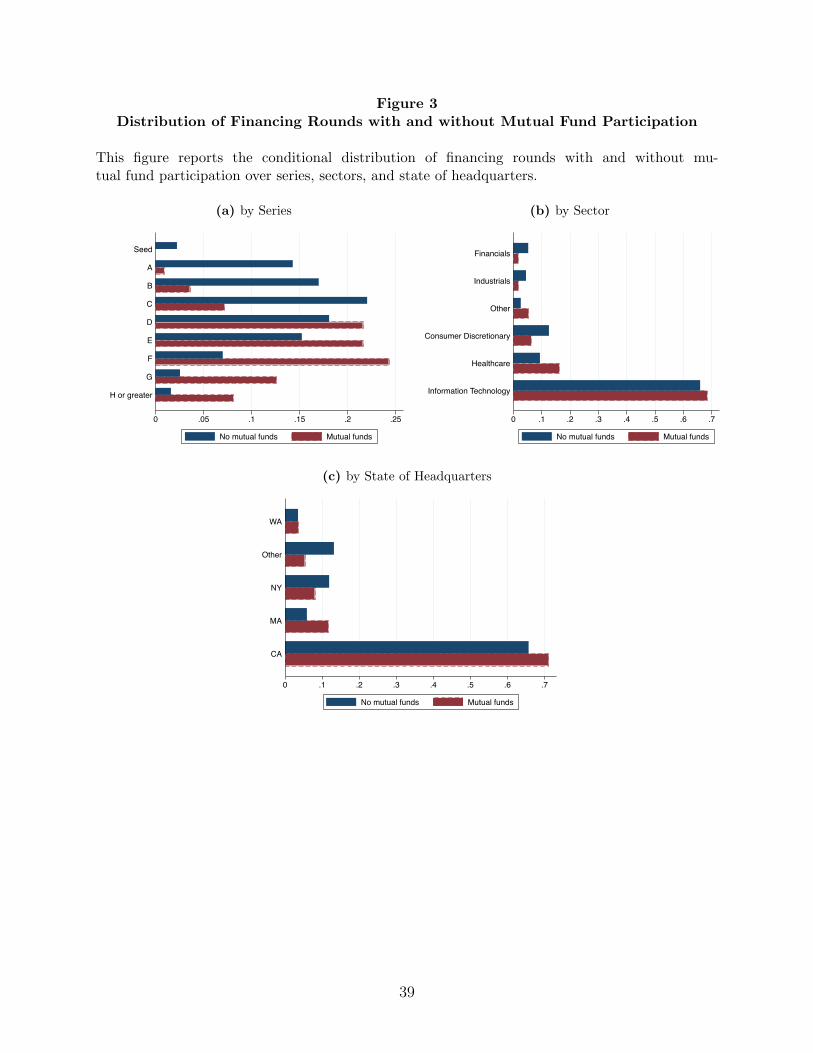
Figure 3Distribution of Financing Rounds with and without Mutual Fund Participation
This figure reports the conditional distribution of financing rounds with and without mu-tual fund participation over series, sectors, and state of headquarters.
(a) by Series
0 .05 .1 .15 .2 .25
H or greater
G
F
E
D
C
B
A
Seed
No mutual funds Mutual funds
(b) by Sector
0 .1 .2 .3 .4 .5 .6 .7
Information Technology
Healthcare
Consumer Discretionary
Other
Industrials
Financials
No mutual funds Mutual funds
(c) by State of Headquarters
0 .1 .2 .3 .4 .5 .6 .7
CA
MA
NY
Other
WA
No mutual funds Mutual funds
39

Figure 4Contractual Provisions in Rounds with and without Mutual Funds
This figure reports the conditional distribution of financing round with and without mutualfund participation over participation rights, redemption rights, and the number of separate classdirectors.
(a) by Participation Rights
0 .2 .4 .6 .8 1
Participating Preferred
Conventional Convertible
No mutual funds Mutual funds
(b) by Redemption Rights
0 .2 .4 .6 .8
Yes
No
No mutual funds Mutual funds
(c) by Number of Class Directors
0 .2 .4 .6 .8 1
0
1
2
3
4
5
No mutual funds Mutual funds
40

Table 1The Investors of Uber
This table, compiled from Crunchbase, reports the list of investors of Uber by rounds andinvestment types as of June 2016.
Round/Type Disclosed InvestorsSeed Garrett Camp, Travis Kalanick
Angel First Round (lead), Adam Leber, AFSquare, A-Grade Investments, Alfred Lin,Babak Nivi, Bechtel Ventures, Bobby Yazdani, Cyan Banister, Data Collective,David Sacks, Dror Berman, Founder Collective, Gary Vaynerchuk, Jason Cala-canis, Jason Port, Jeremy Stoppelman, Josh Spear, Kapor Capital, Kevin Hartz,Khaled Helioui, Lowercase Capital, Mike Walsh, Naval Ravikant, Oren Michels,Scott Banister, Scott Belsky, Shawn Fanning, Techstars Ventures
Series A Benchmark (lead), Alfred Lin, First Round, Innovation Endeavors, LowercaseCapital, Scott Banister
Series B Menlo Ventures (lead), Benchmark, CrunchFund, Data Collective, GoldmanSachs, Je! Bezos, Je! Kearl, Nihal Mehta, Signatures Capital, Summit Action,Troy Carter, Tusk Ventures
Series C GV (lead), Benchmark, TPG Growth
Series D Fidelity (lead), BlackRock, General Atlantic, GV, Kleiner Perkins Caufield & By-ers, Menlo Ventures, Sherpa Capital, Summit Partners, Wellington Management
Series E Glade Brook Capital Partners (lead), Brand Capital, Dinesh Moorjani, Founda-tion Capital, HDS Capital, Jack Abraham, Light Street Capital Management,Lone Pine Capital, New Enterprise Associates, Qatar Investment Authority,Razmig Hovaghimian, Sherpa Capital, Square Peg Capital, Sway Ventures (for-merly AITV), Times Internet, Valiant Capital Partners,
Series F AppWorks Ventures, Bennett Coleman and Co Ltd, Microsoft, Microsoft Corpo-ration - Strategic Investments, MSA
Late Debt Goldman Sachs (co-lead), Morgan Stanley (co-lead), Barclays PLC, Citigroup
Late PE Saudi Arabia’s Public Investment Fund, Tata Capital, Letterone Holdings SA
41

Table 2Summary statistics: Funds
This table reports summary statistics for mutual funds in the sample. The sample consistsof actively managed domestic equity funds with TNA of at least $10 million. The sample periodis 2010Q1–2016Q4, with each fund-quarter as an observation.
PercentileN Mean SD 25 50 75
Fund size 80458 5.60 1.70 4.32 5.56 6.80Family size 80458 9.99 2.64 8.49 10.55 11.78Institutional share 80458 0.32 0.39 0.00 0.08 0.70Turnover 59293 0.82 0.91 0.31 0.57 0.98Cash/Assets 80031 3.64 15.46 0.27 1.53 3.67Management fee (%) 57925 0.76 0.28 0.60 0.75 0.90Flow volatility (%) 73847 0.05 0.41 0.01 0.02 0.04Portfolio concentration 73482 0.03 0.07 0.01 0.02 0.03Unicorns portfolio share (%) 80458 0.02 0.22 0.00 0.00 0.00
42
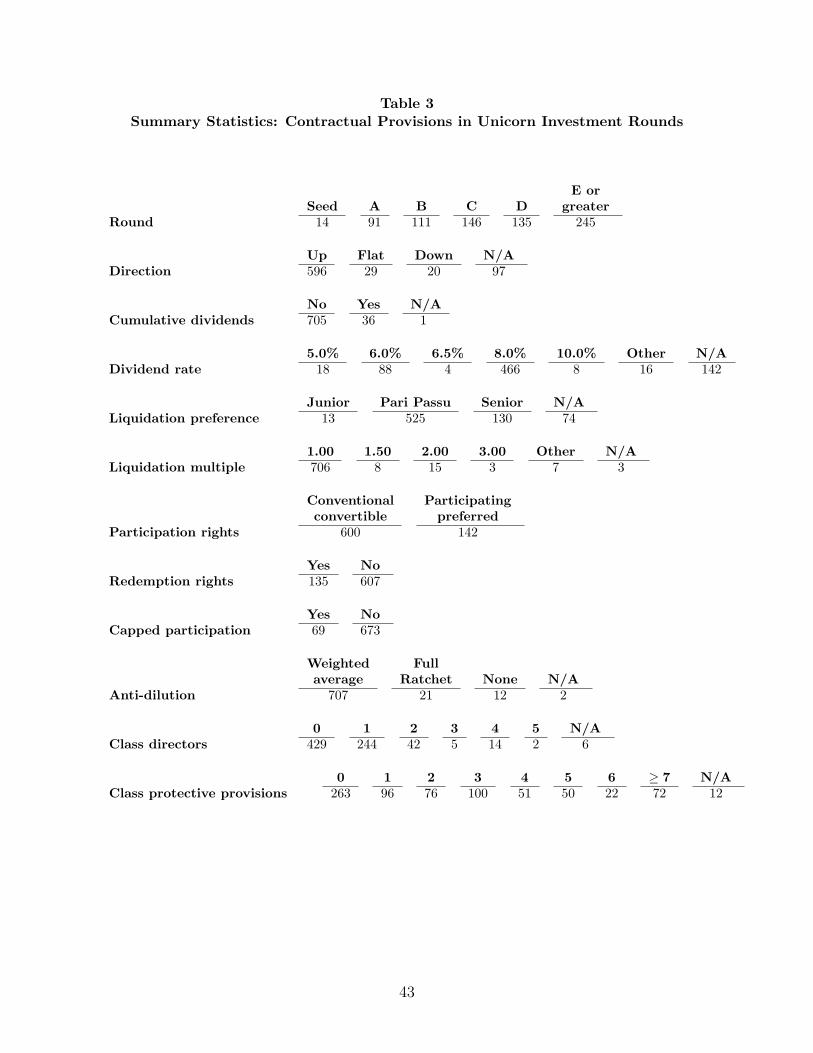
Table 3Summary Statistics: Contractual Provisions in Unicorn Investment Rounds
E orSeed A B C D greater
Round 14 91 111 146 135 245
Up Flat Down N/ADirection 596 29 20 97
No Yes N/ACumulative dividends 705 36 1
5.0% 6.0% 6.5% 8.0% 10.0% Other N/ADividend rate 18 88 4 466 8 16 142
Junior Pari Passu Senior N/ALiquidation preference 13 525 130 74
1.00 1.50 2.00 3.00 Other N/ALiquidation multiple 706 8 15 3 7 3
Conventional Participatingconvertible preferred
Participation rights 600 142
Yes NoRedemption rights 135 607
Yes NoCapped participation 69 673
Weighted Fullaverage Ratchet None N/A
Anti-dilution 707 21 12 2
0 1 2 3 4 5 N/AClass directors 429 244 42 5 14 2 6
0 1 2 3 4 5 6 ! 7 N/AClass protective provisions 263 96 76 100 51 50 22 72 12
43
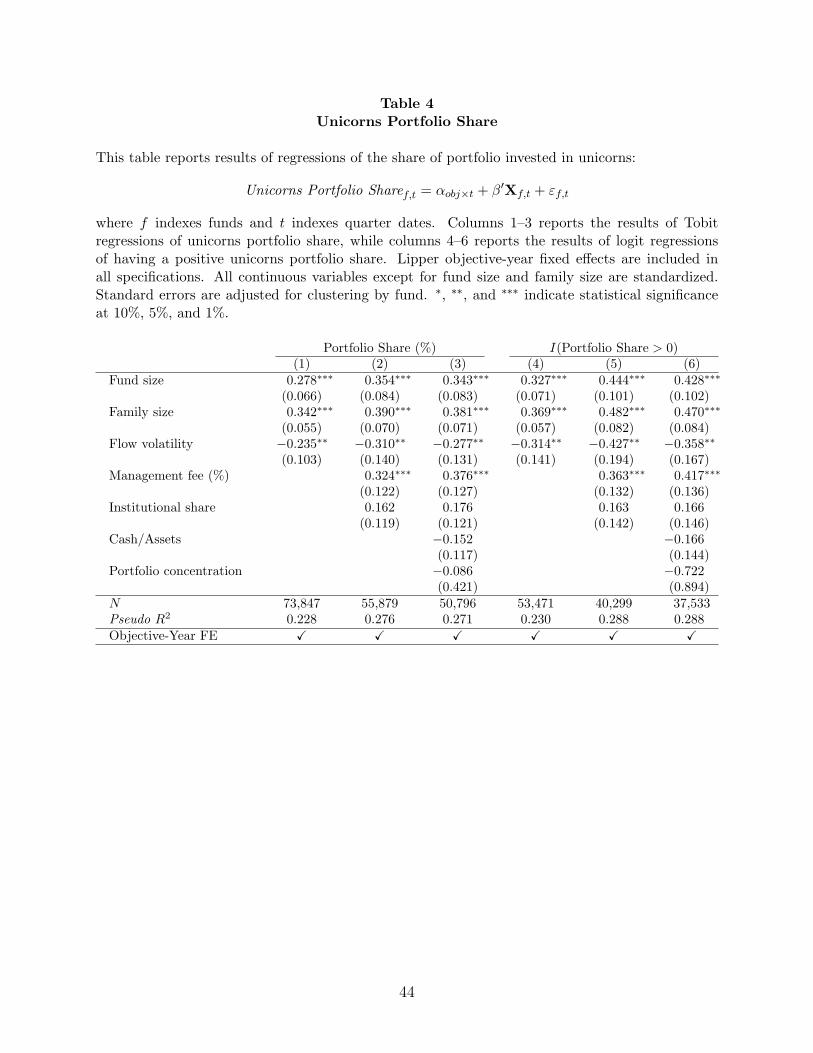
Table 4Unicorns Portfolio Share
This table reports results of regressions of the share of portfolio invested in unicorns:
Unicorns Portfolio Sharef,t = !obj!t + ""Xf,t + #f,t
where f indexes funds and t indexes quarter dates. Columns 1–3 reports the results of Tobitregressions of unicorns portfolio share, while columns 4–6 reports the results of logit regressionsof having a positive unicorns portfolio share. Lipper objective-year fixed e!ects are included inall specifications. All continuous variables except for fund size and family size are standardized.Standard errors are adjusted for clustering by fund. #, ##, and ### indicate statistical significanceat 10%, 5%, and 1%.
Portfolio Share (%) I(Portfolio Share > 0)(1) (2) (3) (4) (5) (6)
Fund size 0.278!!! 0.354!!! 0.343!!! 0.327!!! 0.444!!! 0.428!!!
(0.066) (0.084) (0.083) (0.071) (0.101) (0.102)Family size 0.342!!! 0.390!!! 0.381!!! 0.369!!! 0.482!!! 0.470!!!
(0.055) (0.070) (0.071) (0.057) (0.082) (0.084)Flow volatility !0.235!! !0.310!! !0.277!! !0.314!! !0.427!! !0.358!!
(0.103) (0.140) (0.131) (0.141) (0.194) (0.167)Management fee (%) 0.324!!! 0.376!!! 0.363!!! 0.417!!!
(0.122) (0.127) (0.132) (0.136)Institutional share 0.162 0.176 0.163 0.166
(0.119) (0.121) (0.142) (0.146)Cash/Assets !0.152 !0.166
(0.117) (0.144)Portfolio concentration !0.086 !0.722
(0.421) (0.894)N 73,847 55,879 50,796 53,471 40,299 37,533Pseudo R2 0.228 0.276 0.271 0.230 0.288 0.288Objective-Year FE ! ! ! ! ! !
44
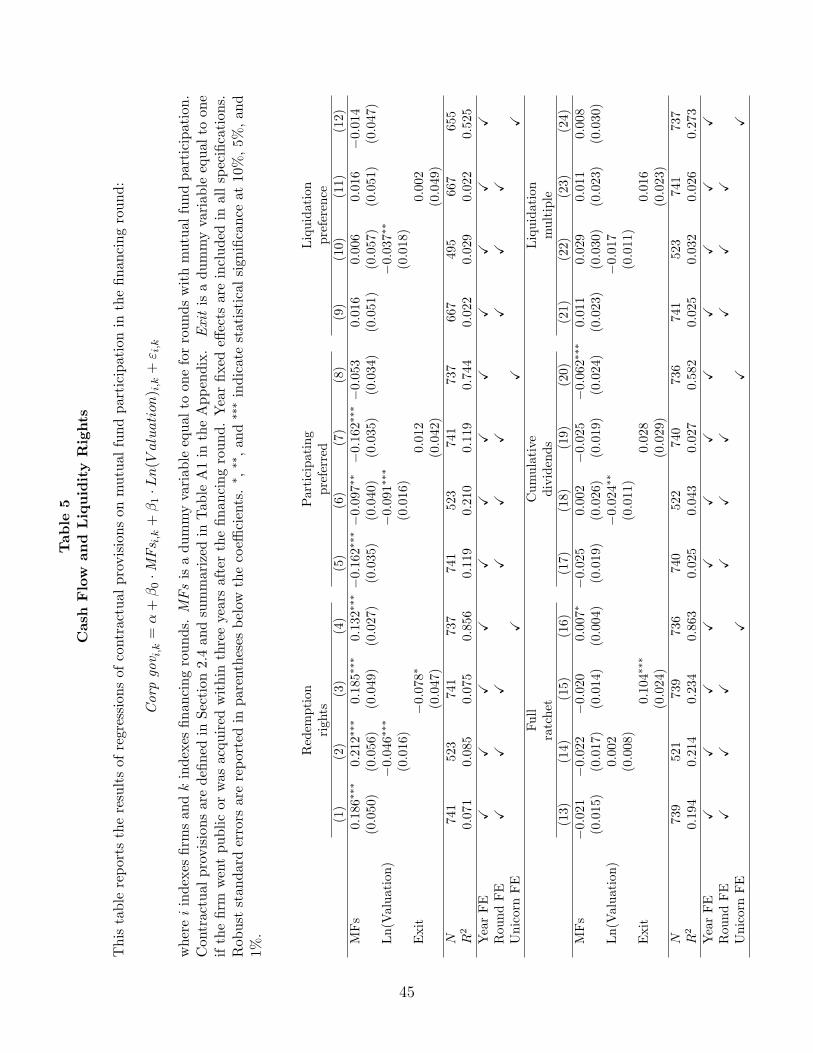
Table
5Cash
Flow
and
LiquidityRights
This
table
reports
theresultsof
regression
sof
contractual
provision
son
mutual
fundparticipationin
thefinan
cinground:
Corpgov i,k=
!+
"0·M
Fs i,k+
"1·L
n(V
aluation) i,k+
# i,k
whereiindexes
firm
san
dkindexes
finan
cingrounds.
MFsisadummyvariab
leequal
toon
eforroundswithmutual
fundparticipation.
Con
tractual
provision
saredefined
inSection
2.4an
dsummarized
inTab
leA1in
theAppendix.
Exitisadummyvariab
leequal
toon
eifthefirm
wentpublicor
was
acqu
ired
within
threeyearsafterthefinan
cinground.Yearfixede!
ects
areincluded
inallspecification
s.Rob
ust
stan
darderrors
arereportedin
parentheses
below
thecoe"
cients.! ,
!!,an
d!!
!indicatestatisticalsign
ificance
at10
%,5%
,an
d1%
.
Red
emption
Participating
Liquidation
righ
tspreferred
preference
(1)
(2)
(3)
(4)
(5)
(6)
(7)
(8)
(9)
(10)
(11)
(12)
MFs
0.18
6!!!
0.21
2!!!
0.18
5!!!
0.13
2!!!
!0.16
2!!!
!0.09
7!!
!0.16
2!!!
!0.05
30.01
60.00
60.01
6!0.01
4(0.050
)(0.056
)(0.049
)(0.027
)(0.035
)(0.040
)(0.035
)(0.034
)(0.051
)(0.057
)(0.051
)(0.047
)Ln(V
aluation)
!0.04
6!!!
!0.09
1!!!
!0.03
7!!
(0.016
)(0.016
)(0.018
)Exit
!0.07
8!0.01
20.00
2(0.047
)(0.042
)(0.049
)N
741
523
741
737
741
523
741
737
667
495
667
655
R2
0.07
10.08
50.07
50.85
60.11
90.21
00.11
90.74
40.02
20.02
90.02
20.52
5YearFE
!!
!!
!!
!!
!!
!!
Rou
ndFE
!!
!!
!!
!!
!UnicornFE
!!
!Full
Cumulative
Liquidation
ratchet
dividen
ds
multiple
(13)
(14)
(15)
(16)
(17)
(18)
(19)
(20)
(21)
(22)
(23)
(24)
MFs
!0.02
1!0.02
2!0.02
00.00
7!!0.02
50.00
2!0.02
5!0.06
2!!!
0.01
10.02
90.01
10.00
8(0.015
)(0.017
)(0.014
)(0.004
)(0.019
)(0.026
)(0.019
)(0.024
)(0.023
)(0.030
)(0.023
)(0.030
)Ln(V
aluation)
0.00
2!0.02
4!!
!0.01
7(0.008
)(0.011
)(0.011
)Exit
0.10
4!!!
0.02
80.01
6(0.024
)(0.029
)(0.023
)N
739
521
739
736
740
522
740
736
741
523
741
737
R2
0.19
40.21
40.23
40.86
30.02
50.04
30.02
70.58
20.02
50.03
20.02
60.27
3YearFE
!!
!!
!!
!!
!!
!!
Rou
ndFE
!!
!!
!!
!!
!UnicornFE
!!
!
45

Table 6Redemption Rights
This table reports the results of regressions of various aspects of investor redemption rightson mutual fund participation in the financing round:
Redemptioni,k = !+ "0 ·MFsi,k + #i,k
where i indexes firms and k indexes financing rounds. MFs is a dummy variable equal to one forrounds with mutual fund participation. Months until redemption is the number of months untilthe first date investors can ask for their shares to be redeemed. Delay after notice is the maximumnumber of days from the time investors submit redemption notice to the first redemption payment.In cases of no stated maximum, Delay after notice 1 sets such observations to missing, whileDelay after notice 2 sets them to the 365 days, maximum value observed in the data. No votenecessary is a dummy variable equal to one if redemption notice is su!cient and if no vote byother investors is necessary for redemption to take place. Class vote is a dummy variable equal toone is redemption vote takes place at the class level. The omitted case is voting by all preferedshareholders. Annual installments is the number of annual installments. Financing round and yearfixed e"ects are included in all specifications. Robust standard errors are reported in parenthesesbelow the coe!cients. !, !!, and !!! indicate statistical significance at 10%, 5%, and 1%.
Months until Delay after Delay after No vote Class Annualredemption notice 1 notice 2 necessary vote installments
(1) (2) (3) (4) (5) (6)MFs !4.804 !13.565!! !89.322!!! 0.097 0.303!!! !0.750!!
(5.314) (6.139) (20.869) (0.059) (0.082) (0.344)Constant 56.655!!! 68.362!!! 169.198!!! 0.002 0.085 1.972!!!
(4.953) (6.859) (38.049) (0.020) (0.073) (0.406)N 134 113 131 131 131 131R2 0.076 0.193 0.184 0.217 0.214 0.065Year FE ! ! ! ! ! !Round FE ! ! ! ! ! !
46

Table 7Directors
This table reports the results of the regressions of the number of directors on mutual fundparticipation in the financing round:
Directorsi,k = !+ "0 ·MFsi,k + "1 · Ln(V aluation)i,k + #i,k
where i indexes firms and k indexes financing rounds. MFs is a dummy variable equal to onefor rounds with mutual fund participation. Exit is a dummy variable equal to one if the firmwent public or was acquired within three years after the financing round. In columns 1–4 thedependent variable is the number of directors representing a given class of shares. In columns 5–8the dependent variable is the weight-adjusted number of directors calculated as
Weight adjusted total directors = Class directors+Preferred directors
Round number+
Pool directors
Pool size.
with the definitions of class directors, preferred directors, and pool directors provided in Section 2.4.Robust standard errors are reported in parentheses below the coe!cients. !, !!, and !!! indicatestatistical significance at 10%, 5%, and 1%.
Weight-AdjustedClass Directors Total Directors
(1) (2) (3) (4) (5) (6) (7) (8)MFs !0.413!!! !0.357!!! !0.408!!! !0.224!!! !0.458!!! !0.388!!! !0.452!!! !0.280!!!
(0.065) (0.081) (0.066) (0.072) (0.065) (0.080) (0.065) (0.071)Ln(Valuation) !0.032 !0.049
(0.032) (0.030)Exit 0.398!!! 0.442!!!
(0.112) (0.107)N 735 517 735 730 736 518 736 732R2 0.163 0.203 0.187 0.651 0.178 0.232 0.209 0.638Year FEs ! ! ! ! ! ! ! !Round FEs ! ! ! ! ! !Unicorn FEs ! !
47

Table 8Protective Provisions
This table reports the results of the regressions of the number of protective provisions onmutual fund participation in the financing round
Protective provisionsi,k = !+ "0 ·MFsi,k + "1 · Ln(V aluation)i,k + #i,k
where i indexes firms and k indexes financing rounds. MFs is a dummy variable equal to one forrounds with mutual fund participation. Exit is a dummy variable equal to one if the firm wentpublic or was acquired within three years after the financing round. In columns 1–4 the dependentvariable is the number of class protective provisions. In columns 5–8 the dependent variable is theweight-adjusted total number of protective provisions calculated as
Weight-adjusted total protective provisions = Class protective provisions+Preferred protective provisions
Round number.
Class and weight-adjusted total protective provisions are defined in Section 2.4. !, !!, and !!!
indicate statistical significance at 10%, 5%, and 1%.
Weight-AdjustedClass Protective Provisions Total Protective Provisions
(1) (2) (3) (4) (5) (6) (7) (8)MFs 0.658! 0.654 0.658! 0.850!!! 0.572 0.745! 0.573 0.743!!!
(0.395) (0.411) (0.395) (0.235) (0.377) (0.397) (0.377) (0.263)Ln(Valuation) !0.039 !0.156
(0.135) (0.134)Exit !0.003 0.110
(0.302) (0.293)N 729 512 729 725 729 512 729 725R2 0.063 0.086 0.063 0.647 0.133 0.163 0.134 0.654Year FEs ! ! ! ! ! ! ! !Round FEs ! ! ! ! ! !Unicorn FEs ! !
48
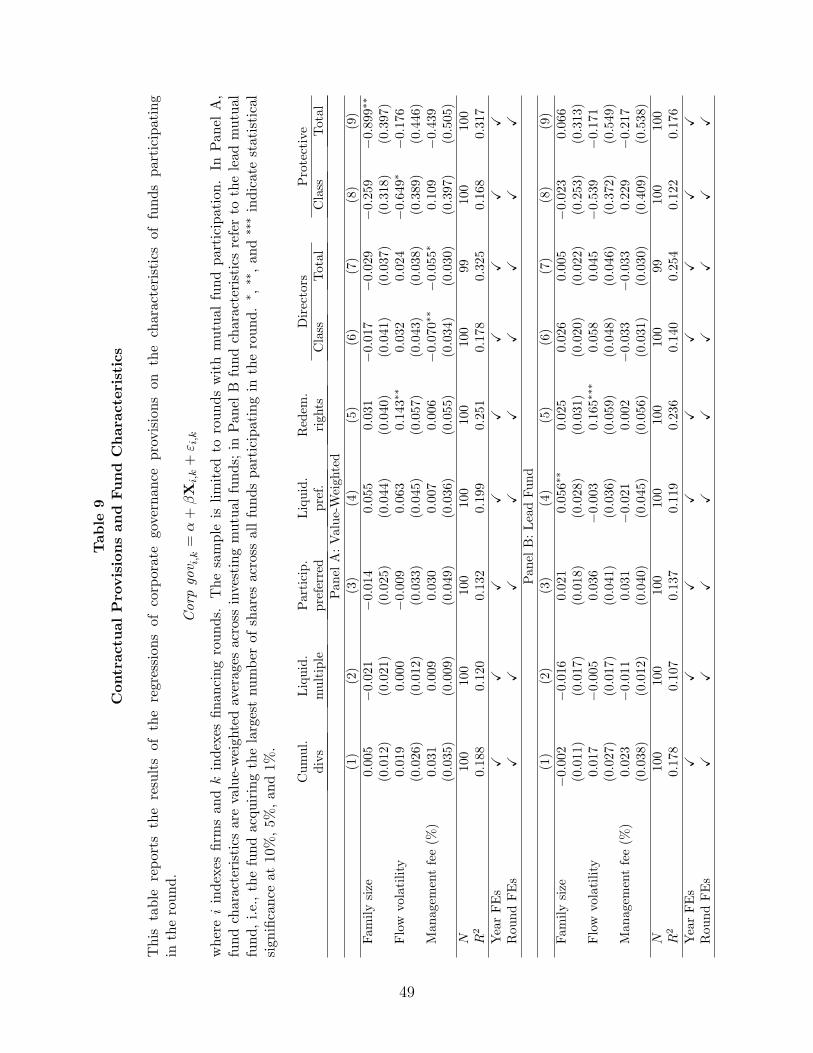
Table
9ContractualPro
visionsand
Fund
Chara
cter
istics
This
table
reports
the
resultsof
the
regression
sof
corporate
governan
ceprovision
son
the
characteristicsof
fundsparticipating
intheround.
Corpgov i,k=
!+
"X
i,k+
# i,k
whereiindexes
firm
san
dkindexes
finan
cingrounds.
Thesample
islimited
toroundswithmutual
fundparticipation.In
Pan
elA,
fundcharacteristicsarevalue-weigh
tedaverages
across
investingmutual
funds;
inPan
elB
fundcharacteristicsreferto
thelead
mutual
fund,i.e.,thefundacqu
iringthelargestnu
mber
ofshares
across
allfundsparticipatingin
theround.
! ,!!,an
d!!
!indicatestatistical
sign
ificance
at10%,5%
,an
d1%
.
Cumul.
Liquid.
Particip.
Liquid.
Red
em.
Directors
Protective
divs
multiple
preferred
pref.
righ
tsClass
Total
Class
Total
Pan
elA:Value-Weigh
ted
(1)
(2)
(3)
(4)
(5)
(6)
(7)
(8)
(9)
Fam
ilysize
0.00
5!0.02
1!0.01
40.05
50.03
1!0.01
7!0.02
9!0.25
9!0.89
9!!
(0.012
)(0.021
)(0.025
)(0.044
)(0.040
)(0.041
)(0.037
)(0.318
)(0.397
)Flow
volatility
0.01
90.00
0!0.00
90.06
30.14
3!!
0.03
20.02
4!0.64
9!!0.17
6(0.026
)(0.012
)(0.033
)(0.045
)(0.057
)(0.043
)(0.038
)(0.389
)(0.446
)Man
agem
entfee(%
)0.03
10.00
90.03
00.00
70.00
6!0.07
0!!
!0.05
5!0.10
9!0.43
9(0.035
)(0.009
)(0.049
)(0.036
)(0.055
)(0.034
)(0.030
)(0.397
)(0.505
)N
100
100
100
100
100
100
9910
010
0R
20.18
80.12
00.13
20.19
90.25
10.17
80.32
50.16
80.31
7YearFEs
!!
!!
!!
!!
!Rou
ndFEs
!!
!!
!!
!!
!Pan
elB:LeadFund
(1)
(2)
(3)
(4)
(5)
(6)
(7)
(8)
(9)
Fam
ilysize
!0.00
2!0.01
60.02
10.05
6!!
0.02
50.02
60.00
5!0.02
30.06
6(0.011
)(0.017
)(0.018
)(0.028
)(0.031
)(0.020
)(0.022
)(0.253
)(0.313
)Flow
volatility
0.01
7!0.00
50.03
6!0.00
30.16
5!!!
0.05
80.04
5!0.53
9!0.17
1(0.027
)(0.017
)(0.041
)(0.036
)(0.059
)(0.048
)(0.046
)(0.372
)(0.549
)Man
agem
entfee(%
)0.02
3!0.01
10.03
1!0.02
10.00
2!0.03
3!0.03
30.22
9!0.21
7(0.038
)(0.012
)(0.040
)(0.045
)(0.056
)(0.031
)(0.030
)(0.409
)(0.538
)N
100
100
100
100
100
100
9910
010
0R
20.17
80.10
70.13
70.11
90.23
60.14
00.25
40.12
20.17
6YearFEs
!!
!!
!!
!!
!Rou
ndFEs
!!
!!
!!
!!
!
49

A Appendix
Table A1Definition of Key Variables
This table provides the definitions of the variables in the paper. For round-level variables,since they are precisely defined in the main text, this table provides a summary for brevity.
Variable DefinitionFund-Level Variables
Fund size Log of aggregate total net assets (TNA) for a given fund.
Family size Log of aggregate TNA across all CRSP mutual funds within the same family.
Institutional share Following Chen, Goldstein and Jiang (2010), a share class is institutional if a)CRSP’s institutional dummy is equal to Y and retail dummy is equal to N, or b)fund name includes the word institutional or its abbreviation, or c) class nameincludes one of the following su!xes: I, X, Y, or Z. Share classes with the wordretirement in their name or su!xes J, K, and R are retail.
Turnover Portfolio turnover is from CRSP.
Cash ratio The ratio of cash to total net assets is from CRSP.
Management fee Fund management fee as a percentage for a given fund.
Flow volatility Standard deviation of monthly fund flows over the preceding twelve months.
Unicorns portfolio share Fund holdings of unicorns in the sample divided by fund TNA.Round/Series-Level Variables
Full ratchet Whether a series has full-ratchet anti-dilution provisions.
Cumulative dividends Whether the dividends of a series are cumulative.
Liquidation multiple The liquidation multiple of a given series as a number.
Participating preferred Whether a series has participation rights.
Liquidation preference Whether a series is senior, pari-passu, or junior to its closest previous series.
Redemption rights Whether a series has redemption rights.
Months until redemption Number of months until the first date investors can ask for their shares to beredeemed.
Delay after notice Maximum number of days from the time investors submit redemption notice tothe first redemption payment.
No vote necessary Whether no vote by other investors is necessary for redemptions.
Class vote Whether redemption vote is at the class level.
Annual installments Number of delayed annual installments allowed for redemption payments.
Class directors The number of directors that a series can vote as a separate class.
Total directors The weight-adjusted total number of directors that a series can vote.
Class protective provisions The number of protective provisions that a series can vote as a separate class.
Total protective provisions The weight-adjusted number of total protective provisions that a series can vote
MFs Binary variable equal to one for rounds with at least one mutual fund investing.
Exit Binary variable equal to one if the firm went public or was acquired within threeyears following the financing round.
50