music engineering technology, frost school of music
TRANSCRIPT

University of Plymouth
PEARL https://pearl.plymouth.ac.uk
Faculty of Health: Medicine, Dentistry and Human Sciences School of Psychology
2019-08
Recommendation of New Medical
Alarms based on Audibility,
Identifiability, and Detectability in a
Randomized, Simulation-Based Study
Edworthy, J
http://hdl.handle.net/10026.1/13762
10.1097/CCM.0000000000003802
Critical Care Medicine
Lippincott, Williams & Wilkins
All content in PEARL is protected by copyright law. Author manuscripts are made available in accordance with
publisher policies. Please cite only the published version using the details provided on the item record or
document. In the absence of an open licence (e.g. Creative Commons), permissions for further reuse of content
should be sought from the publisher or author.

1
Title:
Recommendation of New Medical Alarms based on Audibility, Identifiability, and Detectability in
a Randomized, Simulation-Based Study
Authors:
Christopher Bennett, Ph.D.
Music Engineering Technology, Frost School of Music, University of Miami
Judy Edworthy, Ph.D.
Cognition Institute, Plymouth University
Roman Dudaryk, M.D.
Department of Anesthesiology, Perioperative Medicine and Pain Management, Miller
School of Medicine, University of Miami
Nichole Crenshaw, Ph.D.
School of Nursing & Health Studies, University of Miami
Richard McNeer, M.D., Ph.D.
Department of Anesthesiology, Perioperative Medicine and Pain Management, Miller
School of Medicine, University of Miami
Work performed at University of Miami
Address for reprints:
Jackson Memorial Hospital – Ryder Trauma Center
1800 NW 10th Ave

2
Room T242
Miami, FL 33136-1005
No reprints will be ordered
Financial Support:
Association for the Advancement of Medical Instrumentation
Corresponding Author:
Richard McNeer, M.D., Ph.D.
Division of Trauma and Critical Care, Department of Anesthesiology,
University of Miami-Miller School of Medicine,
P.O. Box 016370 (M820), Miami, FL 33101

3
Phone: 305 585 1191
Email: [email protected]
Keywords:
medical alarms; audible alarms; auditory alarms; patient monitoring; simulation; alarm
fatigue
Published in Critical Care Medicine

4
Abstract
Objective: Accurate and timely identification of existing audible medical alarms is not adequate
in clinical settings. New alarms that are easily heard, quickly identifiable, and discernable from
one another are indicated. The “auditory icons” (brief sounds that serve as metaphors for the
events they represent) have been proposed as a replacement to current international standard.
The objective was to identify the best performing icons based on audibility and performance in a
simulated clinical environment.
Design: Three sets of icon alarms were designed using empirical methods. Subjects
participated in a series of clinical simulation experiments that examined the audibility,
identification accuracy, and response time of each of these icon alarms. A statistical model that
combined the outcomes was used to rank the alarms in overall efficacy. We constructed the
“best” and “worst” performing sets based on this ranking and prospectively validated these sets
in a subsequent experiment with a new sample.
Setting: Experiments were conducted in simulated ICU settings at the University of Miami.
Subjects: Medical trainees were recruited from a convenience sample of nursing students and
anesthesia residents at the institution.
Interventions: In Experiment 1 (formative testing), subjects were exposed to one of three sets
of alarms; identical setting and instruments were used throughout. In Experiment 2 (summative
testing), subjects were exposed to one of two sets of alarms, assembled from the best and
worst performing alarms from Experiment 1.
Measurements and Main Results: For each alarm we determined the minimum sound level to
reach audibility threshold in the presence of background clinical noise, identification accuracy
(percentage), and response time (seconds). We enrolled 123 medical trainees and
professionals for participation (78 with less than 6 years of training). We identified the best

5
performing icon alarms for each category, which matched or exceeded the other candidate
alarms in identification accuracy and response time.
Conclusions: We propose a set of 8 auditory icon alarms that were selected through formative
testing and validated through summative testing for adoption by relevant regulatory bodies and
medical device manufacturers.

6
Introduction
Audible medical alarms are essential for monitoring patient vital signs by alerting care-
givers to potentially adverse events. However, poorly designed or ineffective alarms largely
contribute to the development of alarm fatigue, a phenomenon that has received renewed
scrutiny in patient safety research since a 2011 summit hosted by the Association for the
Advancement of Medical Instrumentation (AAMI) and attended by representatives from the Joint
Commission, the National Institutes of Standards and Technology, and the Food and Drug
Administration. The current standard, specified by the International Electrotechnical
Commission and International Standards Organization in IEC/ISO 60601-1-8 (1) – or simply
“IEC alarms”, comprise melodic sequences of 3 to 5 musical notes. This standard was
implemented in 2003 without any validation testing (2). Since then, a large body of literature has
accumulated, demonstrating that IEC alarms are not efficacious in terms of learnability,
discernibility, and discriminability,(3-14) and that development of new standard is indicated.
The ISO Joint Working Group on Alarm Systems has been charged with the
commissioning, monitoring, and reporting of work to overhaul current alarm standards with the
goal of creating and testing a novel class of alarms known as “auditory icons” (15-17). Auditory
icons are sonic metaphors for the event they represent; for example, the auditory icon for
deletion of a computer file is often the sound of crumpling paper. Icons are nearly immediately
discernable, quickly learnable, and easily discriminable. Compared to IEC alarms, icon alarms
were shown to be superior in terms of recognizability and localizability in a laboratory setting
(15), and in terms of response time, identification accuracy, and perceptual effort and fatigue in
a clinical simulator (17).
The AAMI Medical Device Alarms Committee serves as a mirror committee for the
IEC/ISO joint working group on alarm systems. This committee has accepted the rationale and

7
evidence supporting icons as the preeminent replacement. However, previous studies on
auditory icon alarms were not conclusive on several issues. First, they did not include auditory
background noise, which is an important factor since it is known to partially mask IEC alarms
(18) and contributes to distraction, especially during periods of high-risk (19). Additionally,
those studies used a subject pool not represented by nurses, who are at the ‘front-line’ of alarm
exposure while monitoring patients in critical care settings. Finally, those studies evaluated only
one example icon alarm for each of the eight alarm categories. We therefore sought to
investigate the remaining formative aspects surrounding icon alarm testing in a series of
controlled experiments performed using high-fidelity clinical simulation. In a final summative
evaluation, a ‘top-performing’ set of Icon alarms is identified to recommend as a new
international standard.
Materials and Methods
Overview
This study was approved by the institutional review boards at the University of Miami and
Jackson Memorial Hospital. Thirty-eight icon alarms were evaluated in two experiments (Figure
1) that in total involved 123 participants with nursing or medical background (see Table 1 in the
Supplemental Digital Content). An incentive of $30 was offered to each subject for participation.
In Experiment 1, 3 sets of 10 icon alarms were studied using nursing students, certified nurse
anesthetists, medical students in the 3rd or 4th year of training, and clinical Anesthesiology
residents as subjects (n = 58) who were block randomized into one of the 3 icon groups.
Audibility of icon alarms was measured and alarm performance was assessed in a simulated
critical care environment. Two new sets of icon alarms representing the best and worst
performers were assembled based on the performance results. In Experiment 2, the best and
worst performing sets were compared using a different set of subjects consisting of nursing
students (n = 35) who were block randomized into best or worst groups. The best icon set was

8
stylized—a process analogous to cartoonization, changing a photo into a cartoon. We consider
the stylizing of auditory icons to be an important design refinement intended to overcome
potential confusion with real sounds in the clinical environment (for example, between the sound
of a real heartbeat and the ‘cardiovascular’ icon). Constructing the icons in this way also allows
the spectrum of the sound to be tailored to the clinical noise environment—a process which is
very difficult to accomplish with real-world sounds. However, icon stylizing could affect an icon’s
audibility, identifiability and general performance, so it was necessary to record any potential
degradation in performance of these stylized icons before recommendation to the IEC.
Therefore, to establish the performance characteristics of this final set, the audibility and
performance in the simulation lab was assessed using a new group of subjects (n = 30)
consisting of nursing students.
Icon Design
Descriptions of the icons and audible media files are found within the Supplemental
Digital Content. The icon alarms were concrete metaphors for the condition or system they
represented. Icons were designed based on the eight alarm categories specified by IEC
standards (General alarm, Oxygenation, Ventilation, Cardiovascular, Temperature, Drug
administration, Perfusion, and Power failure). Additionally, we included two more categories not
to be included in the final recommendation: Brain Activity and Monitor Error categories (20). All
icons were augmented with a pointer, a rapid train of pulsed tones that alerts the operator to the
insipient presentation of an icon. The pointer representing “high priority” (as defined by the IEC,
comprising three rapid pulses followed by two slower ones) was used throughout this study. The
first set of icon alarms tested was previously developed and has been shown to dramatically
out-perform IEC alarms in many ways, including identification accuracy, time to respond,
localizability, recognizability and subjective preference (15, 17). The remaining sets of icons
were designed using similar evidence-based methods but had not been tested previously (21).

9
Once a final high-performing subset of icons was identified, it was then stylized in order to not
resemble real-world sounds
Calculation of Icon Alarm Audibility
The audibility of the icon alarms in the presence of noise (known as the “masking
threshold”) was determined as follows. Subjects were seated at a desk wearing headphones
and presented with a series of icon alarms embedded within a masking noise at a sound level of
70 dB. This noise level was chosen based on typical sound levels measured in our operating
rooms (18). Subjects were asked to respond (two-alternative, forced choice) as to whether they
could hear the alarm over the masking noise; if they could then the alarm level was lowered,
otherwise it was raised until the masking threshold could be determined (22). Each of these
masking thresholds were then averaged together for all subjects. For additional information on
headphone calibration, masking noise generation, and threshold determination, see the
Methods in the Supplemental Digital Content.
Simulation Setup
A two-bed intensive care unit was simulated. Bed 1 simulated a ‘bedside’ procedure
being performed on a patient. Bed 1 was cordoned off with surgical drapes and not visible to
subjects. A speaker was placed behind the drapes and calibrated to play a recording complete
with alarms and procedure sounds at an average sound level of 70 dB. This served as a
realistic auditory mask and distractor (Supplemental Digital Content—Table 3). An intubated
manikin placed in Bed 2 simulated the patient attended to by subjects. At the foot of bed 2 was
a small table with the patient’s chart which included history, physical, and hospital course
complete with vital signs and lab results. A monitor display was present which showed updated
vital sign and ventilator parameters and annunciated alarm sounds associated with the patient
in bed 2. This display also had touchscreen functionality and could be used by subjects to log
10
detection of alarm sounds—both selected alarm category and timestamp could be saved to a
data file for each simulation experiment (see the Methods in the Supplemental Digital Content).
Experiment 1: Formative Testing
Experiments were conducted at the University of Miami Gordon Center for Research in Medical
Education.
Experimental Protocol
Before participating in experiments, subjects were assigned to one of three experimental
groups representing the 3 sets of icon alarms. First, masking threshold was calculated using
one of the two remaining sets of icon alarms so that subjects were never exposed to the same
set during audibility and simulation experiments. Then subjects viewed a self-paced slideshow
presentation describing the simulated patient’s history, physical and hospital course.
Additionally, orientation to icon alarm sounds and instructions on the use of the interactive
patient monitor display were presented. Subjects were instructed to review the patient’s chart
during simulations and to formulate a differential diagnosis to be listed on a form before the end
of the simulation—this represented a distractor task. Subjects were instructed to ignore the
procedure-associated sounds (and alarms) and only attend to alarms associated with the
patient under their care in Bed 2. Upon initiation of the simulation script, typical procedure
associated sounds and alarms (icon alarms of the same group-specific set) emanated from
behind the surgical drape of bed 2. Upon hearing an alarm associated with their patient,
subjects used the patient’s monitor touchscreen to indicate detection of an alarm by selecting
the alarm’s category. For an example excerpt of a subject’s responses to the presentation of
alarms, see Figure 4 in the Supplemental Digital Content. Previously, we used the Swedish
Occupational Fatigue Inventory (SOFI) and the National Aeronautics and Space Administration
Task Load assessment (NASA-TLX) questionnaires to assess for perceived fatigue and task
load in a simulation-based study.(3) We also used these instruments to demonstrate that

11
relative to the current IEC alarms, subjects perceived less fatigue and task load when using icon
alarms.(17) In the current study, at the conclusion of simulations, subjects completed the SOFI
and NASA-TLX questionnaires and an exit survey to assess participant opinion.
Outcomes and Power Analysis
The primary outcomes from this Experiment, identification accuracy and response time,
were used for statistical modeling (see Statistical Methods subjection below). For descriptive
purposes, identification accuracy was calculated by averaging binary responses
(correct/incorrect) for each alarm category to obtain overall percent correct, while response
times were averaged and 95% confidence intervals calculated. The secondary outcomes were
the results of the NASA-TLX and SOFI instruments and the exit survey. We estimated a
moderate effect size to capture differences between alarm categories in the primary outcomes.
Accounting for 3 groups (Icon set) of 10 items (Alarm category), and specifying α=0.05, β=0.2, a
power analysis indicated that 19 subjects per group, for a total of 57 subjects would be required.
In anticipation of subject exclusions, we enrolled 60 subjects (Supplemental Digital Content
Table 1).
Statistical Methods
We specified a generalized linear mixed model (GLMM) approach (23) —similar to a
previous study (17)—to capture a multi-dimensional rank of each Icon’s performance partly
informed by identification accuracy (binary responses) and masking threshold. For the latter,
average masking thresholds for each icon were assigned into ordinal tiers whereby an Icon that
could be heard <-20 dB below the mask was in the top tier (easiest to hear above noise), an
Icon between -20 dB and -15 dB was in the middle tier, and an Icon with an average threshold
>-15 dB was in the lowest tier (hardest to hear above noise). The fixed factors in the GLMM
were therefore all ordinal parameters and consisted of icon set group, alarm category, masking
tier, and the 3-way interactions. Subjects were set as a random effect. The dependent variable

12
was each subject’s binary response (correct/incorrect). These results informed the ranking of
icon performance and are presented as the log-odds for obtaining a correct response. A
separate GLMM was performed to measure the impact of fixed factors on response times. This
model was specified identically as above, however, the dependent variable was response time,
and the results did not inform the ranking of icon performance.
Experiment 2: Summative Testing
Simulation experimental protocol
Experiments were conducted at the University of Miami School of Nursing & Health
Studies. Consent, tutorial, and simulation procedures were identical to those for Experiment 1.
In this case two icon sets instead of three, representing the best and worst performers from
Experiment 1 were compared. Additionally, a final composite set, representing the stylized
versions of the best performing icons, was tested by itself in order to verify that icon stylization
would not affect performance. Masking thresholds were also measured to determine audibility of
the stylized set.
Outcomes and power analysis
We collected the same objective outcomes as in Experiment 1, but no subjective
outcomes. Since two sets representing the best and worst performing icons were to be
compared, we expected a larger effect. For α=0.05 and β=0.2, we anticipated 16 subjects per
group, for a total of 32 subjects to enroll. In anticipation of any exclusions, we enrolled 35
subjects (Supplemental Digital Content Table 1). To assess masking thresholds and
performance of the stylized icon set, 30 new subjects were arbitrarily enrolled.
Statistical Methods
Similar to Experiment 1, we performed GLMM analyses to compare relative performance
of the best and worst icon sets. In this case, the fixed factors were icon set group, alarm

13
category and the 2-way interaction. Two separate GLMM analyses were conducted to
determine the impact of these factors on identification accuracy and on response time.
Results
No significant differences in subject perception of fatigue and task load as measured by
SOFI and NASA-TLX instruments were observed in any of the experiments. Nor were any
differences observed in the responses to the exit survey. The detailed results for these are
reported in the Results in the Supplemental Digital Content.
Masking thresholds for Icon alarms (excluding consideration of the pointer) ranged from
41.3 to 64.1 dB, and correspond to the ‘ventilation’ icon (set 2) and ‘perfusion’ icon (set 3),
respectively (Table 1). This indicates that the latter would have to be played at 4.6 times higher
volume (loudness) in order to be just audible over background noise, compared to the former.
The pointer which was the same in all sets had a calculated masking threshold between 40.6 to
43.2 dB.
Among the 30 alarms tested in Experiment 1, 11 icon alarms were identified correctly
more than 80% of the time, and another 12 were identified more than 50% of the time. The
average response time over the 30 alarms tested was 8 seconds, and subjects responded to 16
alarms with lower than average response times (Table 1).
Factors found to have a significant effect on correct identification of alarms were an
icon’s set, alarm category, and masking threshold. These same factors, except for masking
threshold had a significant effect on response time. (Tables 4 and 5 in the Supplemental Digital
Content). The relative likelihood in terms of log-odds of an individual icon being correctly
identified in Experiment 1 indicates that 5 of the icons alarms in set 1 performed better than
average across all alarms, while 7 of the icon alarms in set 3 performed below average (Figure
2).

14
Comparison between the best and worst icon sets (that were selected from Experiment
1) demonstrates that the former significantly out-performed the latter both in terms of
identification accuracy (F=9.458; p<0.001) and response time (F=7.369; p<0.001) –see Tables
6 and 7 in the Supplemental Digital Content. The combined results of these two outcomes
(Figure 3) suggest that identification accuracy and response were inversely correlated
(Spearman’s = -0.904). Performance of the stylized version of the best performing set was not
significantly different from that of the (un-stylized) best set in terms of response time and
identification accuracy (based on multivariate analysis of variance), indicating that icon alarm
performance remained intact after stylization (Figure 4).
Discussion
Of the 38 icon alarms tested in the current study, we identify an auditory icon for each
the 8 alarming categories specified in the current IEC standard that performed best based on
ability to be heard in background noise and in terms of ease of identification in an ICU simulator.
There are many factors to consider when evaluating medical alarm efficacy, and an approach
for integrating these many outcomes has not been previously elucidated. We identified the
outcomes that we feel reasonably reflect efficacy in real world practice, and combined the
measures of audibility, identification accuracy, and response time to fit into a single statistical
model that was used to assess alarm performance. In order to be forward-looking, we
considered two additional categories that were recently suggested for inclusion; namely, brain
monitoring (for example during administration of sedation and anesthesia) and monitor error (a
category that would indicate an inability to properly capture physiological information) (20). For
the purposes of recommending alarms to supplant the IEC standard in its current form, our final
recommendation is constrained to the original 8 alarming categories. However, we have
demonstrated that icon sets with 10 alarms can perform well in simulation, and future

15
investigations may be warranted to establish an upper limit for the number of alarm categories
that can be effectively implemented in clinical settings.
Most icon alarms continued to be audible at sound volumes one quarter the level of the
background noise. These findings, along with the inclusion of a highly audible embedded
“pointer”, should help mitigate factors relating to icon audibility in clinical practice. In contrast to
our previous study that compared performances of current IEC alarms and a set of icon alarms
(17) we expected to observe smaller differences in performance when comparing sets of icon
alarms in the current study. Nonetheless, we were able to detect significant differences in
identification accuracy among the candidate icon alarms tested. Additionally, icon alarms that
were easier to identify tended also to be more quickly identified. While it is not known if the
differences in response times observed here would be clinically relevant, we feel that faster
detection of patient state changes is a desirable clinical adjunct of improved alarm design, and
therefore, an outcome worthy of study. Importantly, a majority of our enrolled subjects drew from
the nursing trainees and practitioners. We felt this to be important, considering nurses are
typically at the interface between monitoring devices and patients and are exposed to the
adverse effects of audible alarms.
Limitations and future direction
A general limitation of this study is that it is simulation-based, and the icon alarm
performance reported here may not be completely extrapolatable to real-world clinical settings.
After adoption of the current IEC standard in 2007, investigations revealed that the IEC alarms
are difficult to learn and identify, are often ignored or disabled by practitioners, and have not
been adopted by all device manufacturers who instead have opted to use proprietary alarms.
We feel that the methodology and systematic approach to selecting a candidate set of icon
alarms for recommendation increases the chances that the new standard will perform better and
be more accepted in clinical practice than the current one. Future studies will be vital to

16
determine if this desired outcome comes to fruition and may validate our simulation-based
approach to alarm design.
We included a distractor task during simulations—subjects were instructed to review the
patient chart and formulate a differential diagnosis. However, we cannot rule out the possibility
that some subjects focused on completing the narrow task of identifying alarms. At times,
subjects failed to enter a selection after an alarm sounded. Our methodology did not allow us to
determine whether these non-responses were due to hesitance in selecting an alarm before the
next alarm sounded, or if an alarm simply was not heard. Based on our measurements of icon
audibility, the latter is unlikely, and if the former were true, then our observation that the best
icon set was detected significantly faster than other sets may actually be conservative since
non-responses did not contribute to calculation of response times. Ability to discriminate icons
alarms when multiple alarms sound simultaneously was not investigated for this
recommendation and is a relevant limitation of the current study. However, we expect
discriminability to be more so of an issue with acoustically simple sounds like the current IEC
standard and proprietary alarms, and less so with the acoustically complex icon alarms.
Similarly, we are unable to explain why some icons perform better than others. Inquiry of this
kind merits further study, and is complicated by the fact that in contrast to simple sign waves
and tonal pulses, icons are highly complex sounds and therefore not easily generalizable in a
psychoacoustic sense. It is possible that accurate identification simply correlates with how well-
matched the icon sound is metaphorically to alarm meaning. This was our rationale for
empirically testing several icon versions for each IEC alarm category.
Conclusion
In a controlled study that included 123 medical trainees and practitioners, a single set of
alarms, with representatives for each of the eight standardized alarming categories, was
identified as the top performers in terms of audibility in noise, identifiability, and detectability in a

17
simulation ICU environment. This set of icon alarms will be put forth for recommendation to the
International Electrotechnical Commission to replace the alarms suggested in 60601-1-8.
Acknowledgements
We thank Amanda Abate and Jamie Robinson for their diligent assistance in conducting
simulation experiments.

18
References
1. IEC/ISO: Audible alarms in medical equipment. Geneva, Switzerland, International Electro-
technical Commission, 2006
2. Block FE: For if the trumpet give an uncertain sound, who shall prepare himself to the battle?
Anesth Analg 2008;106:357-359
3. McNeer RR, Bennett CL, Dudaryk R: Intraoperative noise increases perceived task load and
fatigue in anesthesiology residents: A simulation-based study. Anesth Analg 2016;122:512-525
4. Mondor TA, Finley GA: The perceived urgency of auditory warning alarms used in the
hospital operating room is inappropriate. Can J Anaesth 2003;50:221-228
5. Edworthy J, Hellier E: Fewer but better auditory alarms will improve patient safety. Qual Saf
Health Care 2005;14:212-215
6. Schmid F, Goepfert MS, Kuhnt D, et al: The wolf is crying in the operating room: Patient
monitor and anesthesia workstation alarming patterns during cardiac surgery. Anesth Analg
2011;112:78-83
7. Sanderson P, Wee A, Lacherez P: Learnability and discriminability of melodic medical
equipment alarms. Anaesthesia 2006;61:142-147
8. Wee AN, Sanderson PM: Are melodic medical equipment alarms easily learned? Anesth
Analg 2008;106:501-508
9. Lacherez P, Limin Seah E, Sanderson P: Overlapping melodic alarms are almost
indiscriminable. Hum Factors 2007;49:637-645
19
10. Williams S, Beatty PCW: Measuring the performance of audible alarms for anaesthesia.
Physiol Meas 2005;26:571-581
11. Edworthy J, Hellier E, Titchener K, et al: Heterogeneity in auditory alarm sets makes them
easier to learn. Int J Ind Ergonomics 2011;41:136-146
12. Logan M: A siren call to action: Priority issues from the medical device alarms summit.
Herndon, VA, AAMI, 2011
13. Keller JP, Diefes R, Graham K, et al: Why clinical alarms are a ‘Top ten’ hazard. Biomed
Instrum Technol 2011;17-23
14. Kowalczyk L: Patient alarms often unheard, unheeded. Boston, MA, The Boston Globe,
2011
15. Edworthy J, Reid S, McDougall S, et al: The recognizability and localizability of auditory
alarms: Setting global medical device standards. Hum Factors 2017;59:1108-1127
16. Edworthy J, Reid S, Peel K, et al: The impact of workload on the ability to localize audible
alarms. Appl Ergon 2018;72:88-93
17. McNeer RR, Horn DB, Bennett CL, et al: Auditory icon alarms are more accurately and
quickly identified than current standard melodic alarms in a simulated clinical setting.
Anesthesiology 2018;129:58-66
18. Bennett CL, Dudaryk R, Ayers AL, et al: Simulating environmental and psychological
acoustic factors of the operating room. J Acoust Soc Am 2015;138:3855-3863

20
19. Stevenson RA, Schlesinger JJ, Wallace MT: Effects of divided attention and operating room
noise on perception of pulse oximeter pitch changes: A laboratory study. Anesthesiology
2013;118:376-381
20. Edworthy JR, Schlesinger JJ, McNeer RR, et al: Classifying alarms: Seeking durability,
credibility, consistency, and simplicity. Biomed Instrum Technol 2017;51:50-57
21. Edworthy J: Designing auditory alarms. Black A, Luna P, Lund O, Walker S, editors. London
and New York, Taylor & Francis, 2017
22. Carhart R, Jerger J: Preferred method for clinical determination of pure-tone thresholds. J
Speech Hear Disord 1959;24:330-345
23. Casals M, Girabent-Farres M, Carrasco JL: Methodological quality and reporting of
generalized linear mixed models in clinical medicine (2000–2012): A systematic review. PloS
one 2014;9:e112653

21
Figure Legends
Figure 1. Experimental approach to selecting best performing set of Icon alarms. Three sets of
Icon alarms were tested in Experiment 1 (labeled Sets 1 thru 3). Each set consisted of the 8
categories specified in IEC 60601-1-8 “General alarm” (GA), “Oxygenation” (Ox), “Ventilation”
(Ve), “Cardiovascular” (CV), “Artificial perfusion” (AP), “Temperature” (Te), “Drug administration”
(DG), and “Equipment or power failure” (PF), plus 2 additional alarm categories, “Brain activity”
(BA) and “Monitor Error” (ME). Based on previous studies and an expected small effect size, 57
subjects were used to test each Icon alarm for audibility in background noise (masking
threshold) and for alarm recognition accuracy and response times in a simulated ICU. Based on
these results the best and worst performing individual Icon alarms in each category (excluding
the BA and ME categories) were assembled into “best” and “worst” Icon sets. For experiment 2,
these sets were then compared same simulated ICU as before using a new population sample
of nursing subjects (N=32) in order to verify the reproducibility of Icon performance results (I.e.,
that the best set would outperform the worst set) and to identify unanticipated effects resulting
from the new grouping of Icons (intra-group interactions). Finally, the Icons in the best set were
stylized to limit confusion with real-world clinical sounds, and retested in the ICU simulation with
another sample set of nursing subjects (N=30).
Figure 2. Results of Experiment 1, showing the relative performance of Icon alarms as
measured by identification accuracy, alarm category and masking threshold. Shown are the
results of a generalized linear mixed model analysis. Fixed factors were Group (Icon set), Alarm
category, Masking threshold, and a corresponding 3-way interaction term (Icon set X Alarm
category X Masking threshold). The dependent variable was whether alarm identification was
correct or not (binary response). The scale is in terms of log odds with larger values indicating

22
increased prediction of a correct response. To facilitate interpretation of results, the aggregate
average was set to a log odds of zero. Therefore, an Icon alarm with a log odds greater than
zero performed above average relative to the rest. Corresponding 95% confidence intervals are
shown. These results were used to guide selection of the “best” and “worst” sets of icon alarms
which were tested in Experiment 2.
Figure 3. Relative performance of Icon sets in Experiment 2. Shown are results for the “best”
(black) and “worst (gray) sets in terms of indexed identification accuracy (A) and response time
in seconds (B). These data correspond to two separate generalized linear mixed model
analyses in which the fixed factors were Icon set, Alarm category and a 2-way interaction term.
Higher values of indexed identification accuracy correspond to increased likelihood of a correct
response (range is from 0 to 1). Identification accuracy and response times were inversely
correlated (spearman’s rho = -0.904).
Figure 4. Performance of Icon sets relative to the final stylized set. Shown are the differences in
response time in seconds (Top) and identification accuracy in percentage (Bottom) of each icon
set tested relative to stylized icon set (baseline) with 95% confidence intervals. Average
response time for the stylized set was 8 seconds which was significantly less than sets 2 and 3,
and the worst set (A). Average identification accuracy of the stylized set was 68%, and was
statistically better than set 3 and the worst set (B). The performance of the stylized set was not
statistically different from the (un-stylized) best set.

23
Tables
Table 1. (Left group) Masking thresholds in the presence of 70 dB-SPL pink masking noise; (Middle group) alarm identification accuracy; (Right group) response times for each alarming category and Icon set.
Masking Threshold (dB) a
Overall % Correct b Response Time in s (95% CI) c
Alarm Category Set 1
Set 2
Set 3
Styled Set 1
Set 2
Set 3
Set 1
Set 2
Set 3
Oxygenation 51.0 44.9 48.5 46.4 67 75 69 6 (5-6) 8 (6-9) 7 (6-9)
Ventilation 54.2 41.8 60.6 52.5 94 90 54 6 (6-7) 7 (6-8) 9 (8-11)
Cardiovascular 53.6 60.3 48.8 46.8 81 84 76 7 (6-7) 7 (6-8) 9 (7-10)
Monitor Error 51.9 46.4 49.5 - 69 43 41 8 (7-9) 10 (7-12) 11 (8-13)
Temperature 42.9 59.3 57.4 42.4 94 31 80 6 (5-7) 8 (6-10) 6 (6-7)
Drug Admin. 53.2 54.5 49.2 57.2 96 70 41 6 (5-6) 7 (6-8) 9 (7-11)
Perfusion 55.2 50.4 64.1 44.7 89 75 33 7 (6-8) 7 (6-9) 12 (10-14)
Power Failure 59.8 50.8 52.4 51.1 74 67 37 6 (5-7) 10 (8-12) 10 (8-11)
Brain Monitor 43.1 46.8 52.0 - 93 84 57 7 (6-7) 7 (6-8) 6 (5-7)
General Alarm 46.2 45.2 47.9 - e 65 80 48 9 (8-10) 9 (7-10) 10 (8-12)
Pointer d 43.2 41.1 40.6 40.9 - - - - - -
a Green: <= 50 dB; Red: >=55 dB. Lower number suggests better masking threshold. b Green: > 80%; Red < 50% c Green: <=7 s; Red: >= 11 s d Pointer was the same alarm across all sets e The General Alarm for the stylized set was the Pointer alone with no additional icon
Table 2. Auditory maskers and distractors used for each phase of the Experiment.
Experimental Phase Masker/Distractor
Tutorial None
Audibility Pink Noise
Experiment 1 Simulated Surgery Sounds and Alarms
Experiment 2 Simulated Surgery Sounds and Alarms

24
Table of Contents
SDC METHODS .......................................................................................................................................... 24
SDC Table 1. ....................................................................................................................................... 24
SDC Table 2. ....................................................................................................................................... 25
HEADPHONE CALIBRATION ......................................................................................................................... 25
MASK GENERATION ................................................................................................................................... 26
THRESHOLD DETERMINATION ..................................................................................................................... 26
EXPERIMENT 1 SIMULATION PROTOCOL ...................................................................................................... 26
SDC Figure 1....................................................................................................................................... 27
SDC Figure 2....................................................................................................................................... 28
SDC Figure 3....................................................................................................................................... 28
SDC RESULTS ........................................................................................................................................... 29
EXAMPLE RESPONSE ................................................................................................................................. 29
SUBJECTIVE RESULTS ............................................................................................................................... 29
SDC Figure 4....................................................................................................................................... 29
SDC Figure 5....................................................................................................................................... 30
SDC Figure 6....................................................................................................................................... 30
SDC Figure 7....................................................................................................................................... 31
ANOVA TABLES ....................................................................................................................................... 31
SDC Table 3. ....................................................................................................................................... 31
SDC Table 4. ....................................................................................................................................... 31
SDC Table 5. ....................................................................................................................................... 31
SDC Table 6. ....................................................................................................................................... 32
SDC Table 7. ....................................................................................................................................... 32
PSYCHOMETRIC INSTRUMENTS ................................................................................................................... 32
SOFI .................................................................................................................................................... 33
NASA-TLX ........................................................................................................................................... 34
Alarm Survey ....................................................................................................................................... 35
SDC REFERENCES ................................................................................................................................... 36
SDC Methods SDC Table 1. Population description for each of the Experiments

25
Position Participants Years of Clinical Exposure
no. (%) <1 1 to 5 6 to 10 >=10 Unknown
Experiments 1 (N=60)
Anesthesia attending physician 4 (3%) 0 0 2 2 0
Anesthesia resident 30 (24%) 0 30 0 0 0
Clinical nurse anesthetist 10 (8%) 0 0 3 7 0
Student nurse anesthetist 10 (10%) 0 3 3 0 4
Medical student 4 (3%) 4 0 0 0 0
Experiment 2 (N=35)
Nursing student 35 (28%) 0 11 9 1 14
Experiment 2 ‘stylized’ (N=30)
Nursing student 30 (24%) 30 0 0 0 0
SDC Table 2. Metaphors relating to each of the categories of alarming events for each Icon Set
Alarm Category
Icon Set 1 Metaphor
Icon Set 2 Metaphor
Icon Set 3 Metaphor
Stylized Set Metaphor
General Chime to motif of Beethoven’s 5th
Symphony
Train whistle Gong strike Pointer
Cardiovascular Fast, rhythmic drum pattern (Indian
wedding drumming)
Several pulses of a ‘lup-dup’ heart beat
‘Tick-tock’ of a clock
‘Lup-dub’ heartbeat sound
Artificial perfusion
Hand sloshing inside a tub of liquid
Straw sucking in an empty vessel or cup
Air bubbling through liquid
Liquid disturbance, water churning,
bubbles Ventilation Sound of a science
fiction ventilator mask
Inhalation followed by exhalation
HVAC system A single inhale followed by an
exhale Oxygenation High pressure build-
up of air escaping a tank
Three wine cork pops
Depressurization of a mask or tank
Irregular, stylized dripping/saturation
Temperature Whistling kettle Boiling water Sizzle of a cooking frying pan
Whistling kettle
Drug delivery Shaking pill bottle Pharmacist scraping pills off of a tablet
Water dripping in a reverberant cavern
Shaking pill bottle
Equipment failure
Improper start of a cold motor (pull
cord)
Motor losing power and revving down
Powering down of a science fiction
motor; synthesized
Starting up a motor that shuts down suddenly
Brain Activity Synthesized wind chime.
Synthesized low to high frequency
sweep
Electricity on a Jacob’s Ladder
None
Monitor Error Ruler rapping on a desk.
Hammer striking a metal stake
Striking a metal drum
None
SDC Table 3. Auditory maskers and distractors used for each phase of the Experiment.

26
Experimental Phase Masker/Distractor
Tutorial None
Audibility Pink Noise
Experiment 1 Simulated Surgery Sounds and Alarms
Experiment 2 Simulated Surgery Sounds and Alarms
Headphone Calibration
This study was conducted with closed-back, over the ear headphones, with a flat frequency response from 20 to 20,000 Hz (±3 dB) (AKG, K553PRO). Headphone SPL levels were calibrated for the specific computer and soundcard configuration (Dell Latitude) using a reference microphone (GRAS 40AG/IEC61094-4), ear canal simulator (GRAS RA0045/IEC-60711), and low-leak pinna (GRAS RA0056/ITU-P57 Type 3.2) simulator. Following calibration, gain structure was fixed throughout the experiment.
Mask Generation
To determine the audibility threshold of each Icon alarm, a subject heard a simultaneous playback of noise and target and was asked to respond as to whether or not they could hear the alarm over the mask. In order to generate the mask, a random selection from a monophonic recording of a 1-hour Operating Room (OR) case was first chosen. In order to ensure that an eventful selection was made, a check was instituted to determine the root-mean-square (RMS) level of the selection. If the RMS was below 60 dB-SPL, then the selection was discarded, and a new random selection was made. Once a selection was identified, it was converted to the frequency domain, the phase was preserved, and the magnitude was discarded. A new magnitude response was artificially generated using a pink magnitude distribution. Using the preserved phase and the pink magnitude, the signal was then converted back to the time-domain, resulting in a mask that preserved the timing and phase of the original, but with a pink-distribution of energy across frequencies. Dynamic range compression was then applied to the mask. Finally, the mask was amplitude normalized, windowed and scaled to output at a root-mean-square level of 70 dB-SPL.
Threshold Determination
Both the target and mask for each Icon under test were initialized to 70 dB-SPL then each alarm from the set was tested against one level of mask. The order of alarm presentation was randomized. If the subject heard the alarm over the mask, the alarm level dropped by -5dB and was presented again with a newly generated mask. However, if the listener could not hear the alarm over the mask, the alarm level increased by 10 dB and is presented again. A “pivot” was defined as each time the user’s current response was different from their previous response. As described in the Hughson-Westlake Method (1), a 2-up-1-down test identifies the audibility threshold as the lowest level at which the listener hears the target at least 50% of the time once 4 Pivots are counted.
Experiment 1 Simulation Protocol
Subject were asked to enter a simulated ICU at the Michael Gordon Center for Research in Medical Education housed at the University of Miami Miller School of Medicine. Subjects were given time to click through a slideshow tutorial on a computer screen at a self-selected pace that covered topics relating to experimental protocol. This included instructions for interacting with the touch-screen patient monitor, introduction to each of the alarm sounds, and a case review of the simulated patient. Next, the subjects were guided into the simulated ICU that contained two beds, one that was surgical and draped

27
off by curtains, and one containing the patient they were monitoring. A clinical soundscape was played through a speaker (Genelec 8020A, Iisalmi, Finland) at 70 dB-SPL with sounds typical of a surgery in addition to audible alarms to provide a realistic auditory mask. The subjects were asked to not respond to the alarms in the adjacent surgery, which were also from the same Icon set. At the moment of hand-off from study personnel to subject, the simulation script was initiated.
The interactive patient monitor was derived from a software program called PT-SAFE (2), but modified to look like the patient monitors used at Jackson Memorial Hospital, shown in SDC Figure 1 and described in (3). The simulation script and Icon set were loaded in (SDC Figure 2), and the software directed the annunciation of alarms, according to script parameters (SDC Figure 3). PT-SAFE also captured tap gestures along with a timestamp for identifying the precise time of alarm identification by the subject. A read-out of the alarm identification was displayed (like a chat window) so that the subject could quickly review the recorded response and re-select a different alarm if the wrong one was accidentally clicked. We provided up to 15 s following alarm annunciation for the user to correct a mis-selection.
SDC Figure 1. PT-SAFE interactive Patient Monitor and Ventilator Monitor. The drop-down box is
visible with the list of alarms for the subject to select from.

28
SDC Figure 2. Simulation script used for the manikin, showing all simulated patient monitor values
(lines) as well as timing and type of audible alarms (symbols)
SDC Figure 3. A subject interacting with the PT-SAFE software, responding to an alarm. Behind the
blue curtain were loudspeakers that were reproducing a surgical clinical soundscape with interfering audible alarms.

29
SDC Results
Example Response
The primary outcomes, response accuracy and time, are visualized in SDC Figure 4, which shows the annunciation of an alarm, followed by the user response. In the first user response from this excerpt, a drop in DIA, MEA, and SYS (SpO2 dropped from 91 to 90% but remained above the alarm threshold) triggered a cardiovascular alarm to annunciate at 55 s, followed by a user selecting the “Brain Activity” (an incorrect response) 20 s later.
Subjective Results
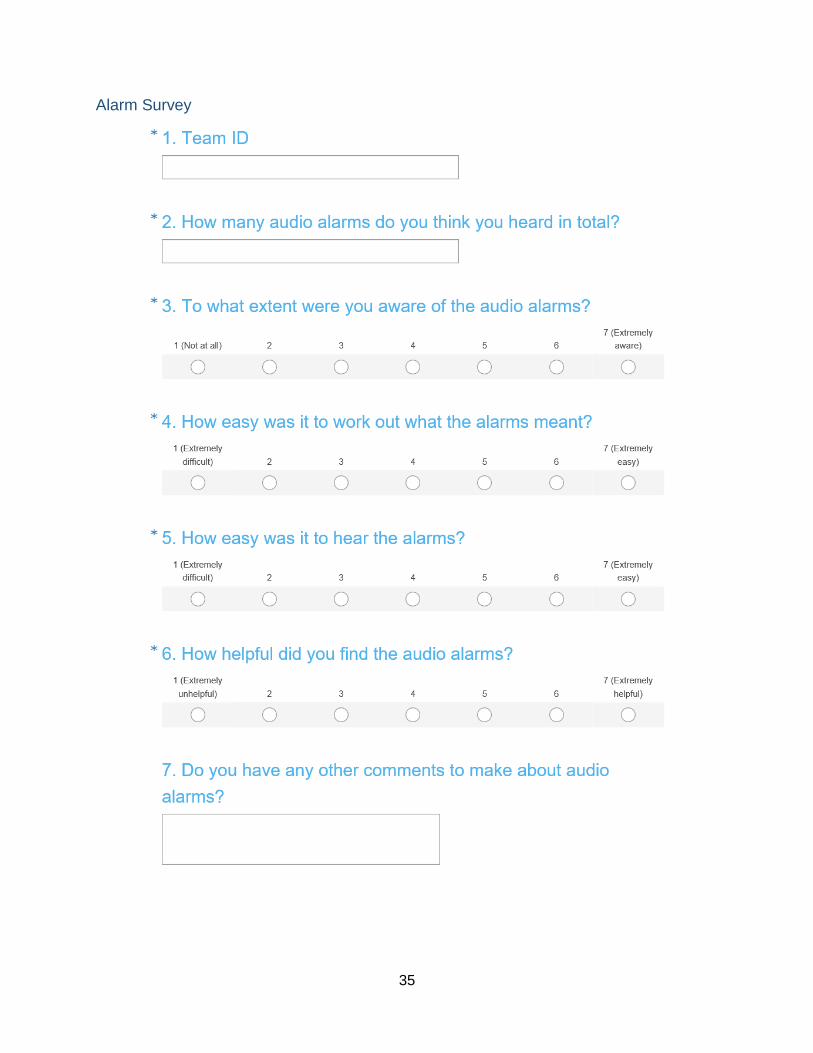
We administered subjective instruments to assess the perceptual affect of the subjects following the simulation experiments and to survey the subjects on questions specific to their experience with these novel alarm sets. For the psychometric instruments. There were no significant differences found between the original 3 Icons sets from Experiment 1 with the stylized set from Experiment 2, so pairwise comparisons between groups was not performed (see SDC Figures 5, 6, 7).
SDC Figure 4. Excerpt of the simulation script showing user responses in vertical dashed lines. Error
response marked in red (actual alarm was Cardiovascular). Time to respond is indicated by the distance between the alarm and the user response.

30
SDC Figure 5. No significant differences were found between Icon Sets in the Exit Survey
questions.
SDC Figure 6. No significant differences were found between Icon Sets in the NASA-TLX.

31
SDC Figure 7. No significant differences were found between Icon Sets in the SOFI.
ANOVA Tables
SDC Table 3. ANOVA on Alarm Audibility (Experiment 1)
Source F df1 P-Value
Alarm Category 8.52 9 < 0.001
Icon Set 8.63 2 < 0.001
Icon Set*Alarm Category 7.64 18 < 0.001
SDC Table 4. Fixed Effects on Alarm Identification Accuracy (Experiment 1)
Source F df1 df2 P-Value
Icon Set 9.944 2 1560 < 0.001
Alarm Category 7.694 9 1560 < 0.001
Masking Tier 5.089 2 1560 0.006
Icon Set*Alarm Category* Masking Tier 7.371 16 1560 < 0.001
SDC Table 5. Fixed Effects on Response Time (Experiment 1)
Source F df1 df2 P-Value
Icon Set 5.221 2 1514 0.005

32
Alarm Category 10.533 9 1514 < 0.001
Masking Tier 0.656 2 1514 0.519
Icon Set*Alarm Category* Masking Tier 2.646 16 1514 < 0.001
SDC Table 6. Fixed Effects on Alarm Identification Accuracy (Experiment
2)
Source F df1 df2 P-Value
Icon Set (Best or Worst) 9.980 1 1030 0.002
Alarm Category 12.042 9 1030 <0.001
Icon Set*Alarm Category 11.498 9 1030 < 0.001
SDC Table 7. Fixed Effects on Response Time (Experiment 2)
Source F df1 df2 P-Value
Icon Set (Best or Worst) 8.540 1 994 0.004
Alarm Category 10.405 9 994 <0.001
Icon Set*Alarm Category 4.097 9 994 < 0.001
Psychometric Instruments

33
SOFI

34
NASA-TLX
35
Alarm Survey

36
SDC References
1. Carhart R, Jerger J: Preferred method for clinical determination of pure-tone thresholds. J Speech Hear Disord 1959;24:330-345
2. Bennett CL, McNeer RR: PT-SAFE: A software tool for development and annunciation of medical audible alarms. Anesth Analg 2012;114:576-583
3. McNeer RR, Horn DB, Bennett CL, et al: Auditory icon alarms are more accurately and quickly

37

38

39

40

41

42

43