museumdevelopmentnorthwest.files.wordpress.com€¦ · web view12. third sector annual pay award...
TRANSCRIPT

May 2019
Heritage Volunteering Group Survey 2019
Full Report

1
Heritage Volunteering Group Survey 2019 © Agenda Consulting

EXECUTIVE SUMMARY We were delighted to support Heritage Volunteering Group in carrying out this survey to gain a better understanding of volunteering in the heritage sector.
Gathering and distilling evidence to support good decision-making is at the heart of all that we do. Through our well-established Volunteers Count study we have enabled benchmarking of key metrics on volunteers and volunteer management practices.
This HVG survey draws on some of the key measures from Volunteers Count, complemented by measures designed by the Steering Group comprising the Museums
Association (MA), NCVO, the Science Museum Group and Agenda Consulting.
An impressive 63 organisations took part and we hope that you will find the results useful in considering your strategic approach to volunteering in the coming year.
Tim WaltersPrincipal Consultant Agenda Consulting
Key FindingsManaging volunteers:
The median organisation has 6 staff who directly supervise volunteers At median 14% of all paid employees supervise volunteers. The median ratio of volunteers to supervisors is 14:1
Budget and spend: The median annual budget for managing volunteers is £5,000 or £25 per volunteer The median annual spend for managing volunteers (excluding staff costs) is £2,649 or £21
per volunteer
Volunteer numbers: The median organisation has 92 volunteers The median ratio of volunteers to paid employees is 2:1. Rising to a ratio of 12:1 at upper
quartile The median organisation recruited 28 volunteers in 2018-19 or 32% of the volunteer base
Volunteer contribution: For the median organisation, volunteers contributed a total of 7,540 hours of their time in
2018-19. For a quarter of organisations this figure was 30k hours or more. This equates to 92 hours per volunteer per year at median and 139 hours at upper quartile The median cost (excluding staff costs) per volunteer hour is 61p at median and as low as
22p for a quarter of oganisations (lower quartile) If organisations had paid at national minimum wage for their volunteer contribution then the
median cost of volunteer hours would have been £61,903. For a quarter of organisations this figure is £246k or more.
Nature of volunteering: 71% volunteer more than once a month 32% have volunteered for less than 1 year whilst 16% have volunteered for 10 years or more 88% volunteer on-site, 7% volunteer off-site and 5% volunteer at home
2
Heritage Volunteering Group Survey 2019 © Agenda Consulting
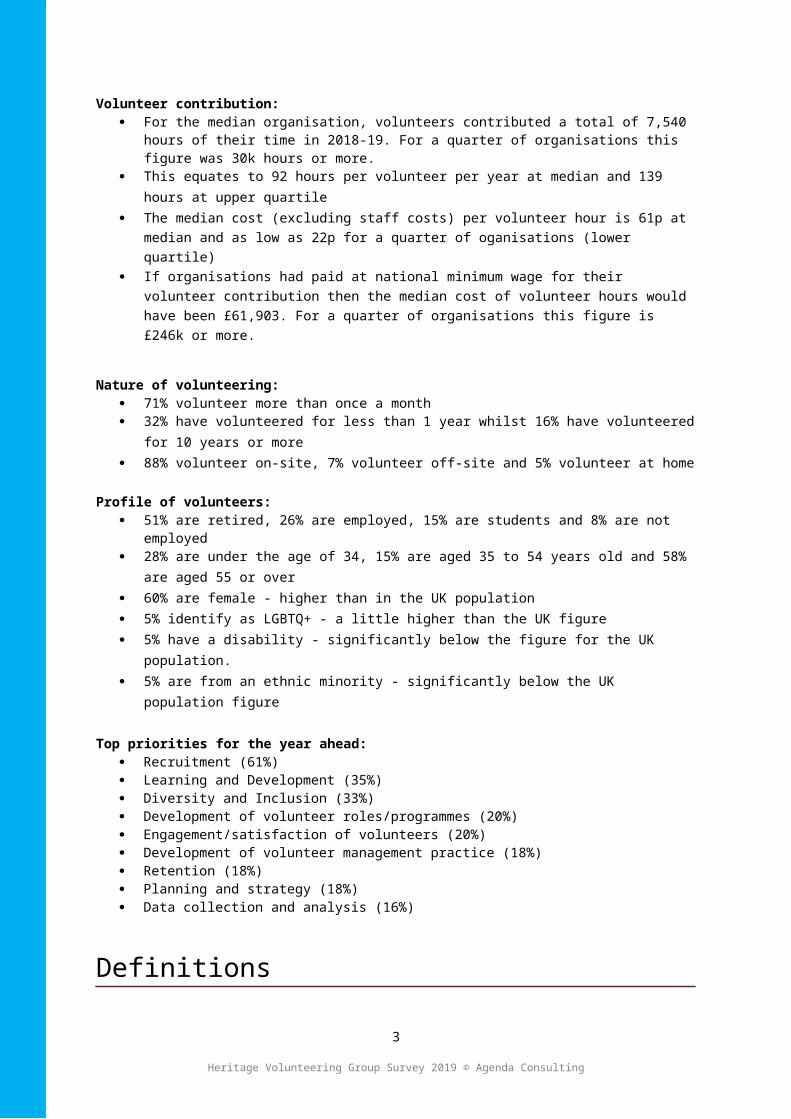
Profile of volunteers: 51% are retired, 26% are employed, 15% are students and 8% are not employed 28% are under the age of 34, 15% are aged 35 to 54 years old and 58% are aged 55 or over 60% are female - higher than in the UK population 5% identify as LGBTQ+ - a little higher than the UK figure 5% have a disability - significantly below the figure for the UK population. 5% are from an ethnic minority - significantly below the UK population figure
Top priorities for the year ahead: Recruitment (61%) Learning and Development (35%) Diversity and Inclusion (33%) Development of volunteer roles/programmes (20%) Engagement/satisfaction of volunteers (20%) Development of volunteer management practice (18%) Retention (18%) Planning and strategy (18%) Data collection and analysis (16%)
Definitions
Lower Quartile: the value in the distribution of organisation responses below which 25% of the distribution lies
Median: the value in the distribution of organisation responses below which and above which 50% of the distribution lies
Upper quartile: the value in the distribution of organisation responses below which 75% of the distribution lies
3
Heritage Volunteering Group Survey 2019 © Agenda Consulting

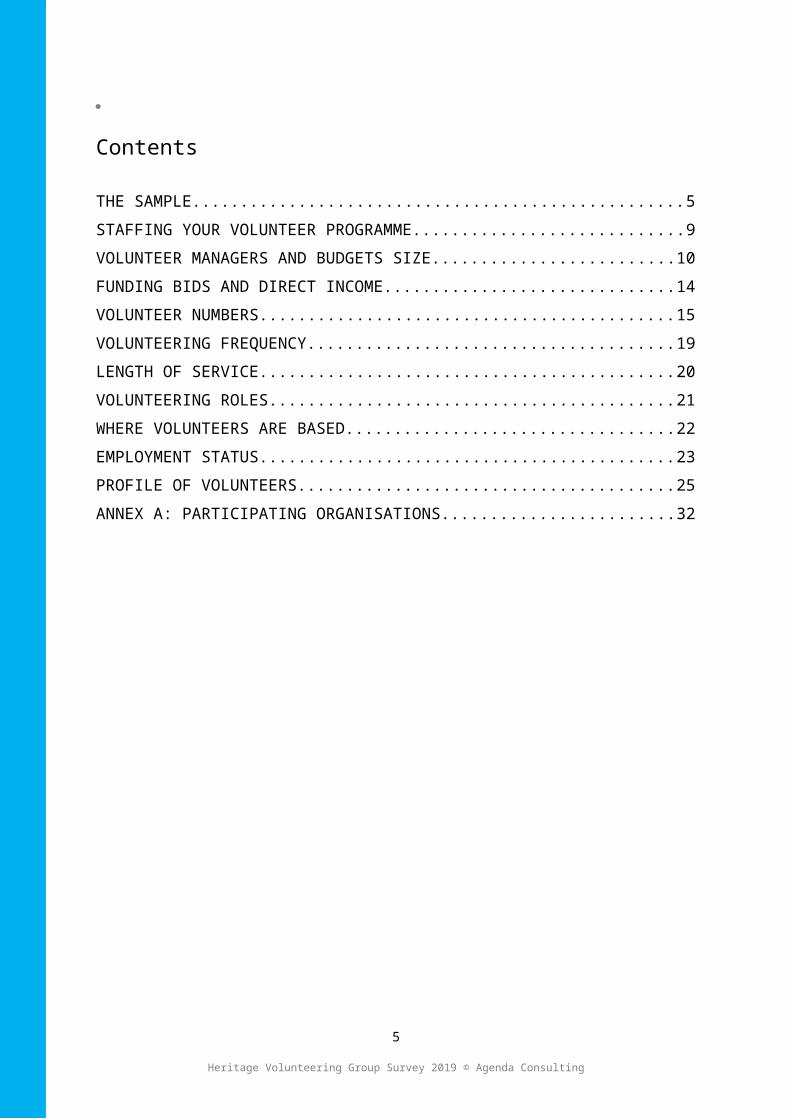
Contents
THE SAMPLE...................................................................................................................................... 5
STAFFING YOUR VOLUNTEER PROGRAMME....................................................................9
VOLUNTEER MANAGERS AND BUDGETS SIZE...............................................................10
FUNDING BIDS AND DIRECT INCOME..................................................................................14
VOLUNTEER NUMBERS..............................................................................................................15
VOLUNTEERING FREQUENCY................................................................................................ 19
LENGTH OF SERVICE.................................................................................................................. 20
VOLUNTEERING ROLES.............................................................................................................21
WHERE VOLUNTEERS ARE BASED......................................................................................22
EMPLOYMENT STATUS.............................................................................................................. 23
PROFILE OF VOLUNTEERS.......................................................................................................25
ANNEX A: PARTICIPATING ORGANISATIONS...................................................................32
4
Heritage Volunteering Group Survey 2019 © Agenda Consulting
THE SAMPLEQ2 Which of the following options best describes your organisation's primary purpose Guidance text:What your organisation does first and foremost. If you choose Other there will be a space to add more information.For example, sector body or funder.
Amongst the 16 organisations who selected ‘Other’, responses included “Cathedral”, “Charities”, “Library”, “Church” and “Sector body”.
5
Heritage Volunteering Group Survey 2019 © Agenda Consulting
Q3 Other Primary Purpose:Summary of responses

Q4 Which of the following options best describes your organisation Guidance text: This is the type of your organisation, often associated with its governance or funding. If you choose Other there will be a space to add more information.
For example, non-departmental public body, membership or arms-length organisation.
6
Heritage Volunteering Group Survey 2019 © Agenda Consulting
Q5 Other Organisation Descriptions:Summary of responses
Amongst the 7 organisations who selected ‘Other’, responses included “Charities”.
63 Responses

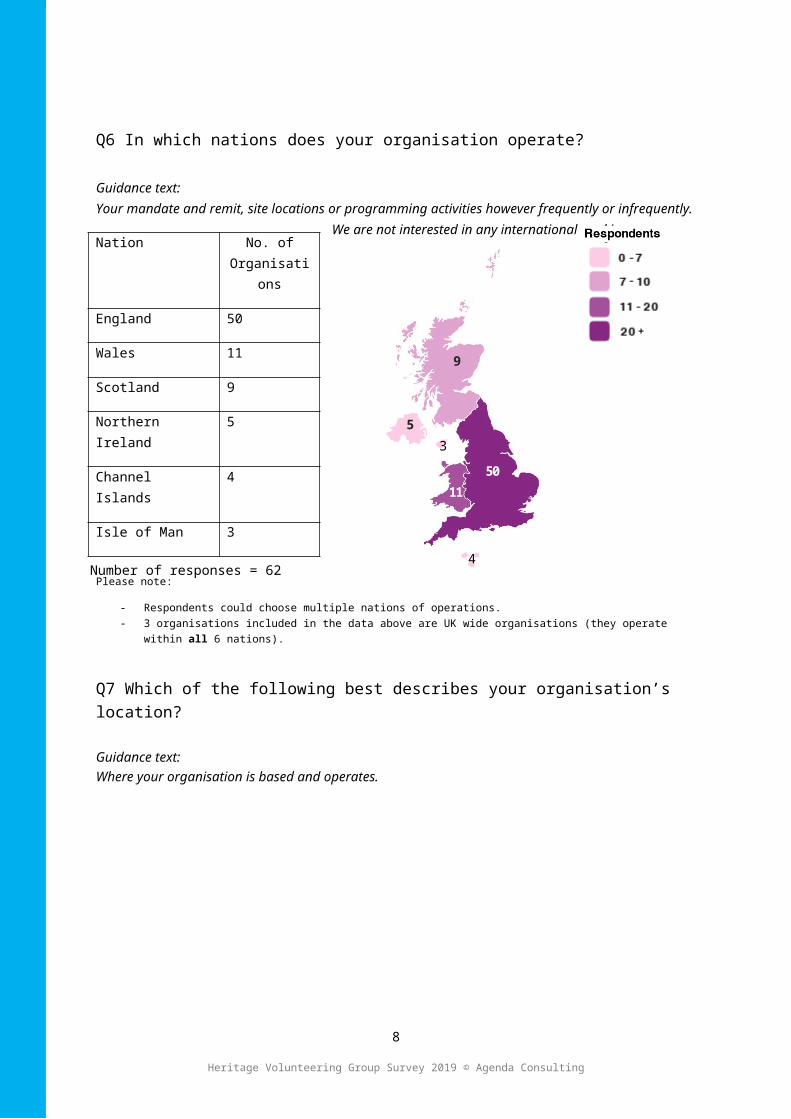
Q6 In which nations does your organisation operate?
Guidance text:Your mandate and remit, site locations or programming activities however frequently or infrequently. We are not interested in any international working.
Please note:
- Respondents could choose multiple nations of operations. - 3 organisations included in the data above are UK wide organisations (they operate within all 6 nations).
Q7 Which of the following best describes your organisation’s location?
Guidance text: Where your organisation is based and operates.
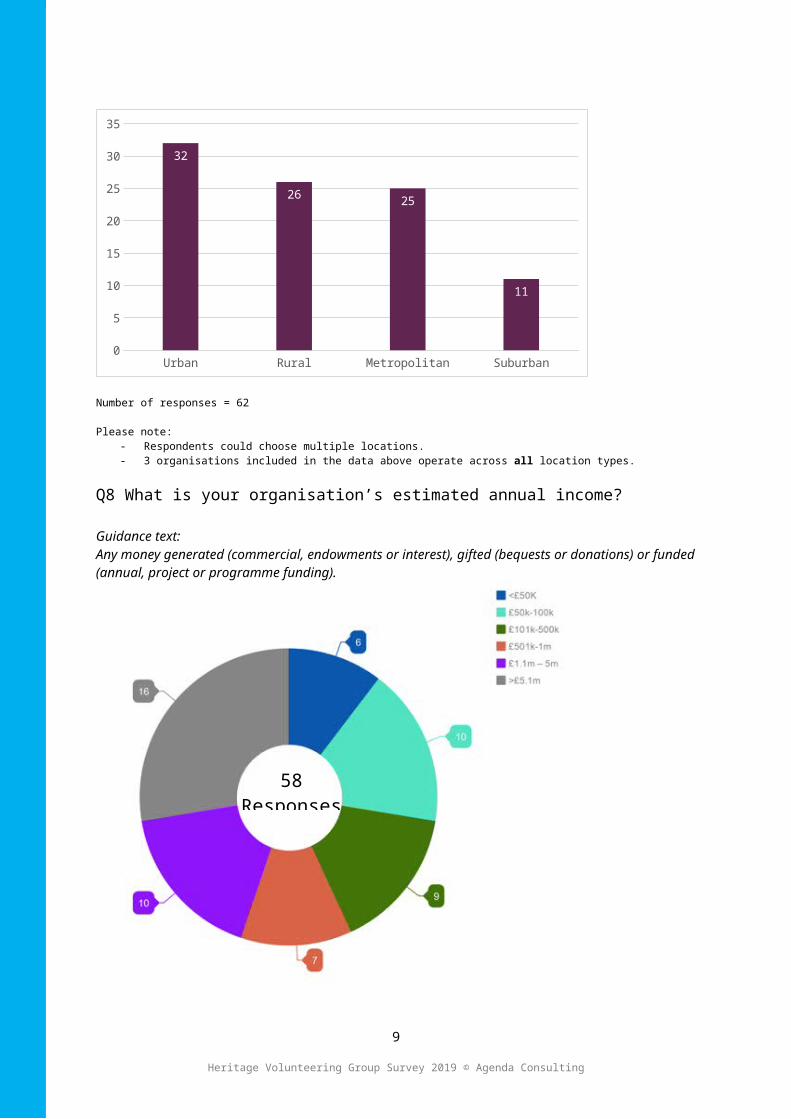
Number of responses = 62
Please note: - Respondents could choose multiple locations.
7
Heritage Volunteering Group Survey 2019 © Agenda Consulting
11
50
11
9
5
11
Urban Rural Metropolitan Suburban0
5
10
15
20
25
30
35
32
26 25
11
11
9
5
11
9
5
4
11
9 5
3
Nation No. of Organisations
England 50
Wales 11
Scotland 9
Northern Ireland 5
Channel Islands 4
Isle of Man 3
Number of responses = 62
- 3 organisations included in the data above operate across all location types.
Q8 What is your organisation’s estimated annual income?
Guidance text: Any money generated (commercial, endowments or interest), gifted (bequests or donations) or funded (annual, project or programme funding).
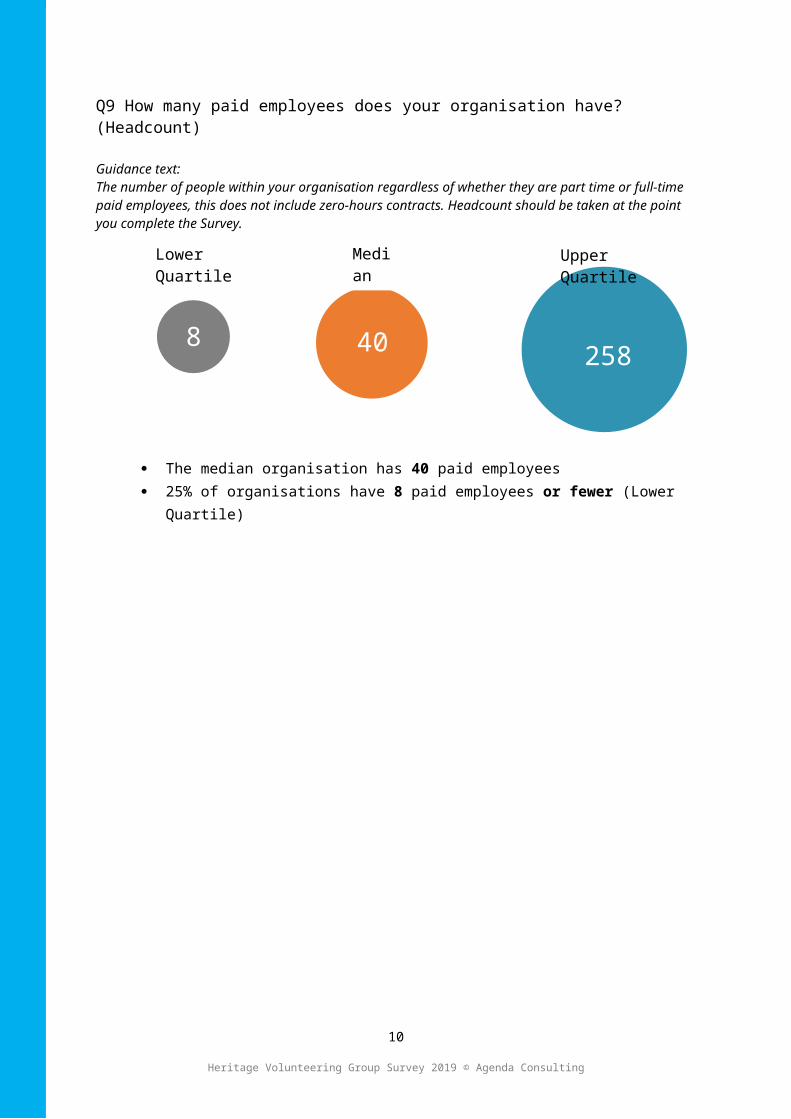
Q9 How many paid employees does your organisation have? (Headcount)
Guidance text:The number of people within your organisation regardless of whether they are part time or full-time paid employees, this does not include zero-hours contracts. Headcount should be taken at the point you complete the Survey.
8
Heritage Volunteering Group Survey 2019 © Agenda Consulting
58 Responses
8
Lower Quartile Median
40
Upper Quartile
258
The median organisation has 40 paid employees 25% of organisations have 8 paid employees or fewer (Lower Quartile) 25% of organisations have 258 employees or more (Upper Quartile)
STAFFING YOUR VOLUNTEER PROGRAMMEQ10- 14 How many of the following does your organisation have to manage your volunteer programme (Headcount):
Head/Director of Volunteering (paid) Volunteer Manager (paid) Volunteer Co-ordinator (paid) Volunteer Administrator (paid) Unpaid Volunteer Manager or Co-ordinator
Guidance text:Job titles may vary across organisations please choose the titles/ hierarchy that best fit. Where someone is responsible for volunteering although that is not their primary focus then please record this information within the final option below
Key findings
Of the 54 organisations who responded to questions 10-14: 20% have no individuals in the above roles. Asked who has accountability for managing their
volunteer programmes (question 15 free text) key roles cited include:o Heads of Department or Directorso Operations Managers and Supervisorso Curators and Archivistso Administrators and Assistants
41% have just 1 individual in the above roles, these break down as follows:o 1 Head/Director of Volunteering (paid)o 9 Volunteer Managers (paid)o 8 Volunteer Co-ordinators (paid)o 1 Volunteer Administrator (paid)o 3 Unpaid Volunteer Managers or Co-ordinators
The remaining 39% have 2 or more people in the above roles. The average percentage break-down of these roles is as follows:
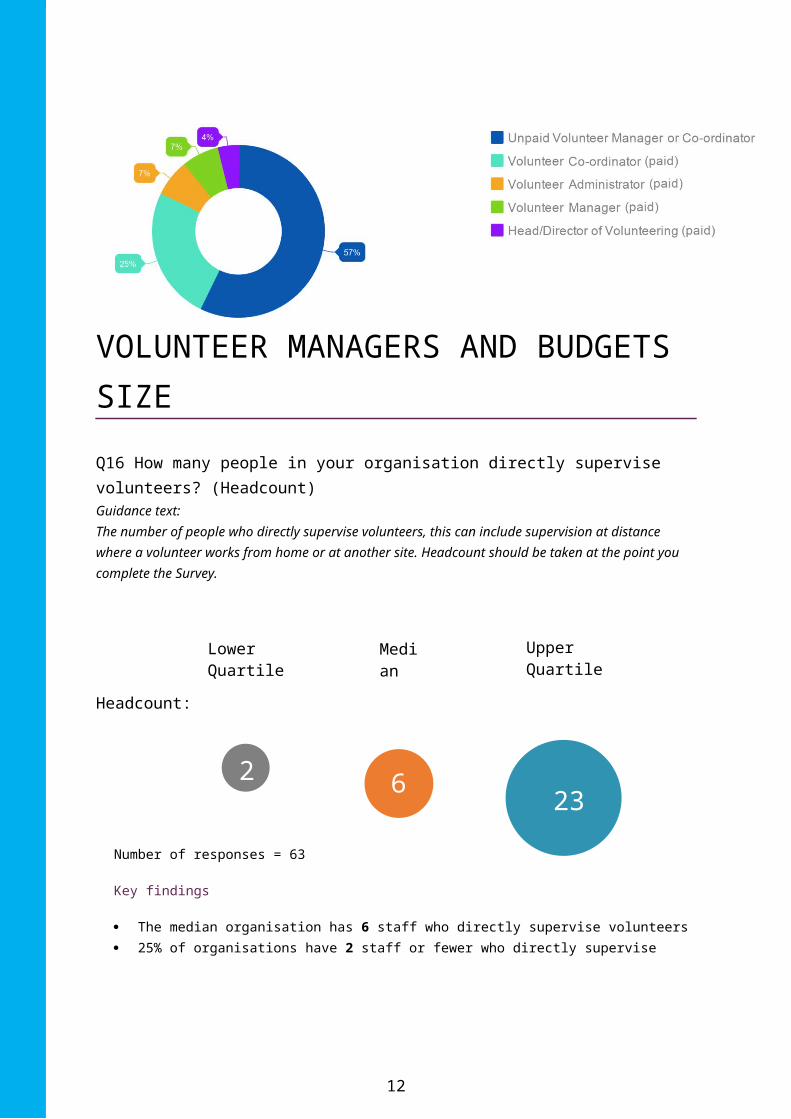
o 57% are unpaid Volunteer Managers or Co-ordinatorso 25% are paid Volunteer Co-ordinatorso 7% are paid Volunteer Administratorso 7% are paid Volunteer Managerso 5% are paid Head/Directors of Volunteering
9
VOLUNTEER MANAGERS AND BUDGETS SIZEQ16 How many people in your organisation directly supervise volunteers? (Headcount)Guidance text:The number of people who directly supervise volunteers, this can include supervision at distance where a volunteer works from home or at another site. Headcount should be taken at the point you complete the Survey.
Headcount:
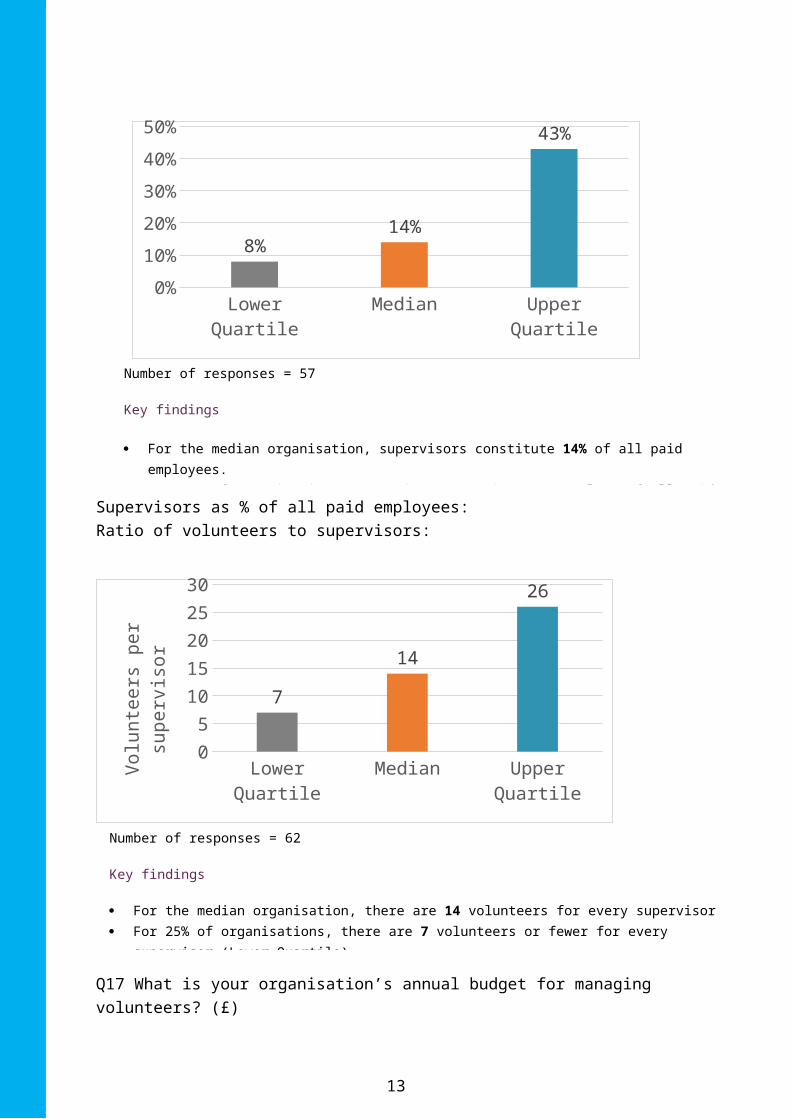
Supervisors as % of all paid employees:
10
2
Lower Quartile Median
6
Upper Quartile
23
Number of responses = 63
Key findings
The median organisation has 6 staff who directly supervise volunteers 25% of organisations have 2 staff or fewer who directly supervise volunteers (Lower Quartile) 25% of organisations have 23 staff or more who directly supervise volunteers (Upper Quartile)

Ratio of volunteers to supervisors:
Q17 What is your organisation’s annual budget for managing volunteers? (£)
Guidance text:Include any money allocated to the recruitment, selection, training, reward or expenses. This does not include staff costs. This can be for 2018-19 or 2019-20 if you have it.
Lower Quartile (25%)
Median (50%) Upper Quartile (75%)
TOTAL FIGURE 0 5000 17800
PER VOLUNTEER 0 25 106
Number of responses = 49
Key findings
11
Lower Quartile Median Upper Quartile0%5%
10%15%20%25%30%35%40%45%50%
8%14%
43%
Lower Quartile Median Upper Quartile0
5
10
15
20
25
30
7
14
26
Volu
ntee
rs p
er su
-pe
rviso
r
Number of responses = 62
Key findings
For the median organisation, there are 14 volunteers for every supervisor For 25% of organisations, there are 7 volunteers or fewer for every supervisor (Lower Quartile) For 25% of organisations, there are 26 volunteers or more for every supervisor (Upper Quartile)
Total annual budget:
o The median organisation has an annual budget of £5,000 for managing volunteerso 25% of organisations have no annual budget for managing volunteerso 25% of organisations have an annual budget of £17,800 or more for managing volunteers
Annual budget Per Volunteer
o The median organisation has an annual budget of £25 for managing volunteers, per volunteer
o 25% of organisations have no annual budget for managing volunteers per volunteer (Lower Quartile)
o 25% of organisations have an annual budget of £106 for managing volunteers, per volunteer (Upper Quartile)
Q18 What did your organisation spend on managing volunteers, excluding staff costs in 2018-2019? (£)
Guidance text:Include all spend associated with volunteers - recruitment, selection, training, reward or expenses. This should not include staff costs.
Total Figure:
Spend on managing volunteers, per volunteer:
12
£338
Lower Quartile Median
£2649
Upper Quartile
£16,500
Number of responses = 48
Key findings
The median organisation spent £2649 on managing volunteers, excluding staff costs, in 2018-19 25% of organisations spent £338 or less on managing volunteers, excluding staff costs, in 2018-
19 (Lower Quartile) 25% of organisations spent £16,500 or more on managing volunteers, excluding staff costs, in
2018-19 (Upper Quartile)
13
Lower Quartile Median Upper Quartile0
10
20
30
40
50
60
70
£7
£21
£64Sp
end
per v
olun
teer
(£)
Number of responses = 48
Key findings
The median organisation spent £21 on managing volunteers per volunteer, excluding staff costs, in 2018-19
25% of organisations spent £7 or less on managing volunteers per volunteer, excluding staff costs, in 2018-19 (Lower Quartile)
25% of organisations spent £64 or more on managing volunteers per volunteer, excluding staff costs, in 2018-19 (Upper Quartile)

Total spend on managing volunteer as % of annual budget for managing volunteers:
14
Number of responses = 34
Key findings
The median organisation spent 100% of its annual budget for managing volunteers on managing volunteers in 2018-19
25% of organisations spent 71% or less of their annual budget for managing volunteers on managing volunteers in 2018-19 (Lower Quartile)
25% of organisations spent 100% or more of their annual budget for managing volunteers on managing volunteers in 2018-19 (Upper Quartile)
Lower Quartile Median Upper Quartile0%
10%20%30%40%50%60%70%80%90%
100%
71%
100% 100%

FUNDING BIDS AND DIRECT INCOME
Q60: Please indicate the number of successful funding bids awarded in 2018-2019 that include volunteering
Guidance text:The number of funding bids awarded not the value of the funding bids.
Key findings 45 organisations responded to this question 53% of respondents have not recorded a successful funding bid awarded in 2018-19 The highest number of successful funding bids which include volunteering recorded in his
survey was 18
Q61: Please indicate the direct income generated from volunteer-led activities in 2018-2019? (£)
Guidance text:Any activities that are undertaken by a volunteer that are directly chargeable for example a children’s workshop or a guided tour.
Number of Responses
Lower Quartile (25%)
Median (50%) Upper Quartile (75%)
Max
Whole Sample 37 0 0 13,000 250,000
Income
£51k-100k 6 5,000 32,500 48,750 75,000
£101k-500k 5 0 3,000 20,000 30,000
£1.1m – 5m 7 0 0 4,774 13,000
>£5.1m 8 0 0 5,000 250,000
*Incomes bands which do not appear did not meet the minimum number of responses (5)
Key findings
51% of participants do not generate any direct income through volunteer-led activities The maximum direct income generated from volunteer-led activities in 2018-19 was £250,000
15

VOLUNTEER NUMBERS
Q19 How many volunteers does your organisation currently have? (Headcount)
Guidance text:The number of volunteers in whatever capacity, hours or frequency they work. Headcount should be taken at the point you complete the Survey.
Total Figure:
Volunteers Per Paid Employee
16
34
Lower Quartile Median
92
Upper Quartile
250
Number of responses = 62
Key findings
The median organisation has 92 volunteers 25% of organisations have 34 volunteers or less (Lower Quartile) 25% of organisations have 250 volunteers or more (Upper Quartile)
Number of responses = 58
Key findings
The median organisation has 2 volunteers per paid employee 25% of organisations have 1 volunteer per paid employee (Lower Quartile) 25% of organisations have 12 volunteers per paid employee (Upper Quartile)
Lower Quartile Median
Upper Quartile

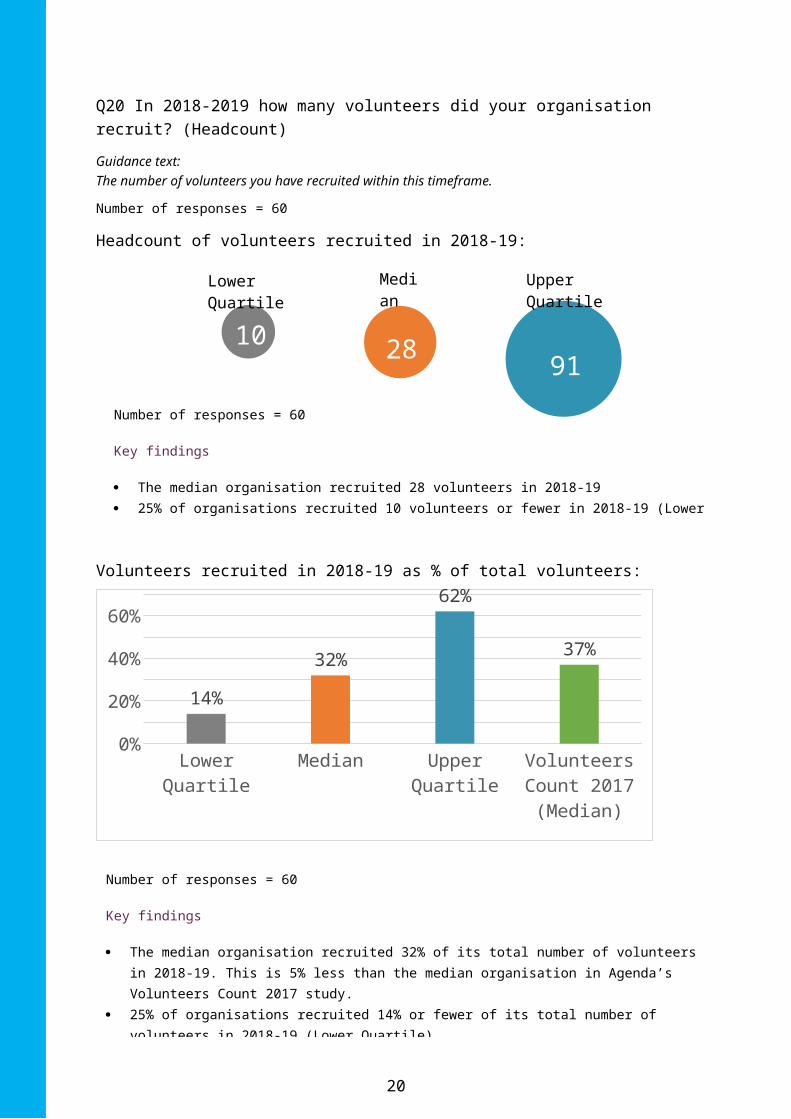
Q20 In 2018-2019 how many volunteers did your organisation recruit? (Headcount)
Guidance text:The number of volunteers you have recruited within this timeframe.
Number of responses = 60
Headcount of volunteers recruited in 2018-19:
Volunteers recruited in 2018-19 as % of total volunteers:
Lower Quartile Median Upper Quartile Volunteers Count 2017
(Median)
0%10%20%30%40%50%60%70%
14%
32%
62%
37%
17
10
Lower Quartile Median
28
Upper Quartile
91
Number of responses = 60
Key findings
The median organisation recruited 28 volunteers in 2018-19 25% of organisations recruited 10 volunteers or fewer in 2018-19 (Lower Quartile) 25% of organisations recruited 91 volunteers or more in 2018-19 (Upper Quartile)
Number of responses = 60
Key findings
The median organisation recruited 32% of its total number of volunteers in 2018-19. This is 5% less than the median organisation in Agenda’s Volunteers Count 2017 study.
25% of organisations recruited 14% or fewer of its total number of volunteers in 2018-19 (Lower Quartile)
25% of organisations recruited 62% or more of its total number of volunteers in 2018-19 (Upper Quartile)

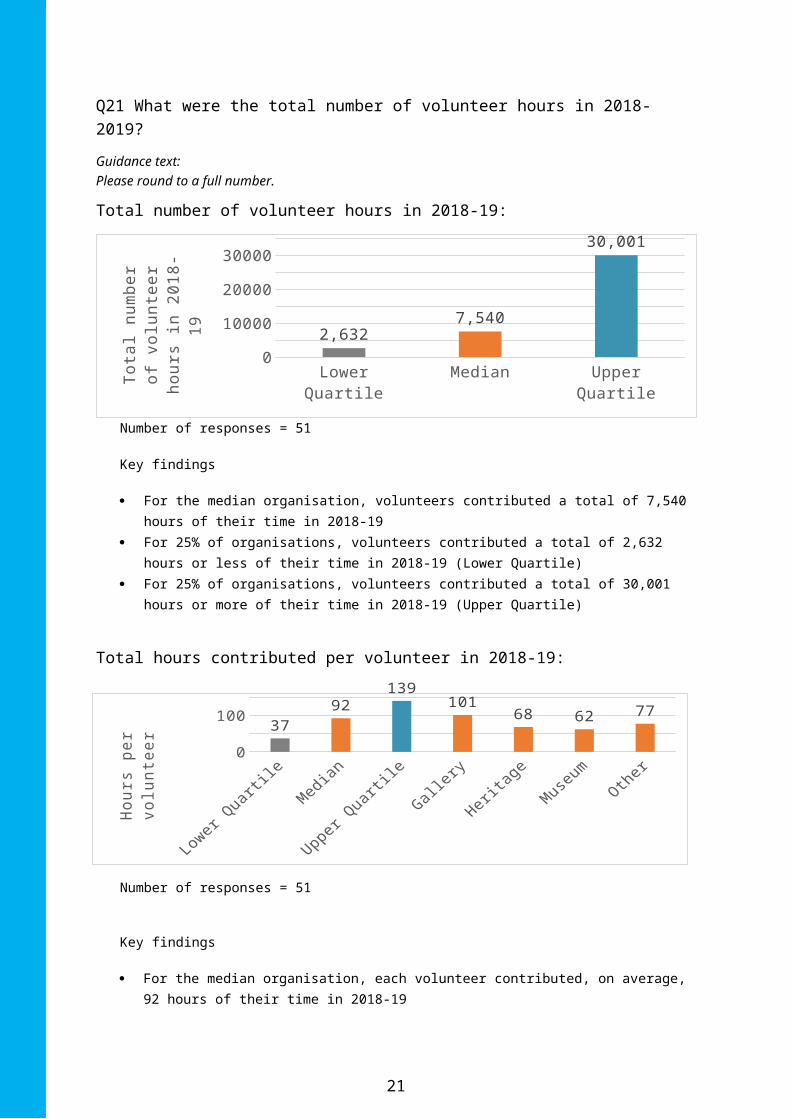
Q21 What were the total number of volunteer hours in 2018-2019?
Guidance text:Please round to a full number.
Total number of volunteer hours in 2018-19:
Lower Quartile Median Upper Quartile0
5000100001500020000250003000035000
2,6327,540
30,001
Tota
l num
ber o
f vo-
lunt
eer h
ours
in 2
018-
19
Number of responses = 51
Key findings
For the median organisation, volunteers contributed a total of 7,540 hours of their time in 2018-19
For 25% of organisations, volunteers contributed a total of 2,632 hours or less of their time in 2018-19 (Lower Quartile)
For 25% of organisations, volunteers contributed a total of 30,001 hours or more of their time in 2018-19 (Upper Quartile)
Total hours contributed per volunteer in 2018-19:
Number of responses = 51
Key findings
For the median organisation, each volunteer contributed, on average, 92 hours of their time in 2018-19
For 25% of organisations, each volunteer contributed, on average, 37 hours or less in 2018-19 (Lower Quartile)
For 25% of organisations, each volunteer contributed, on average, 139 hours or more in 2018-19 (Upper Quartile)
There is a noticeable difference based on organisation type with the median Gallery recording 101 hours per volunteer, while the median Museum recorded just 62 hours per volunteer
18
Lower Quartile
Median Upper Quartile
Gallery Heritage Museum Other0
20406080
100120140160
37
92
139
101
68 6277
Hour
s per
vol
unte
er

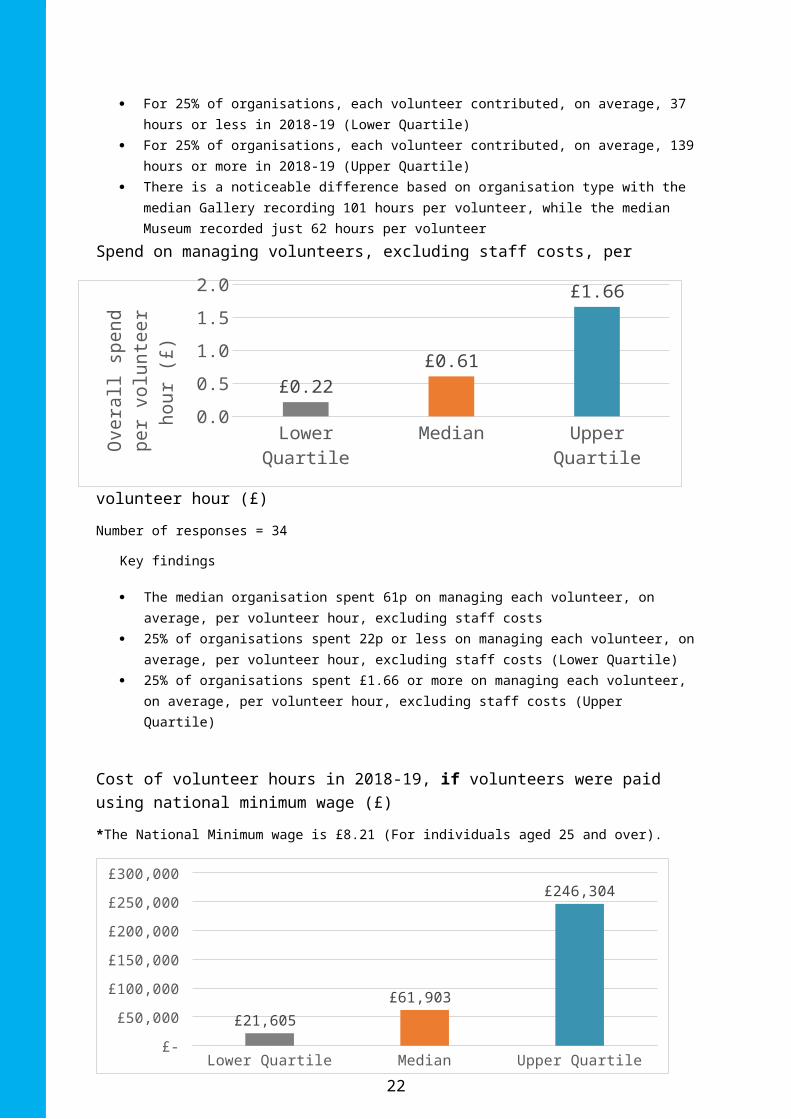
Spend on managing volunteers, excluding staff costs, per volunteer hour (£)
Number of responses = 34
Key findings
The median organisation spent 61p on managing each volunteer, on average, per volunteer hour, excluding staff costs
25% of organisations spent 22p or less on managing each volunteer, on average, per volunteer hour, excluding staff costs (Lower Quartile)
25% of organisations spent £1.66 or more on managing each volunteer, on average, per volunteer hour, excluding staff costs (Upper Quartile)
Cost of volunteer hours in 2018-19, if volunteers were paid using national minimum wage (£)
*The National Minimum wage is £8.21 (For individuals aged 25 and over).
Number of responses = 51
Key findings
In 2018-19 if volunteers were paid using the national minimum wage: For the median organisation, volunteer hours would have cost £61,903 if volunteers were
paid using national minimum wage For 25% of organisations, volunteer hours would have costs £21,605 or less, if volunteers
were paid using national minimum wage (Lower Quartile)
19
Lower Quartile Median Upper Quartile0.00.20.40.60.81.01.21.41.61.8
£0.22
£0.61
£1.66
Ove
rall s
pend
per
vo-
lunt
eer h
our (
£)
Lower Quartile Median Upper Quartile£-
£50,000
£100,000
£150,000
£200,000
£250,000
£300,000
£21,605
£61,903
£246,304
For 25% of organisations, volunteer hours would have cost £246,304 or more, if volunteers were paid using national minimum wage (Upper Quartile
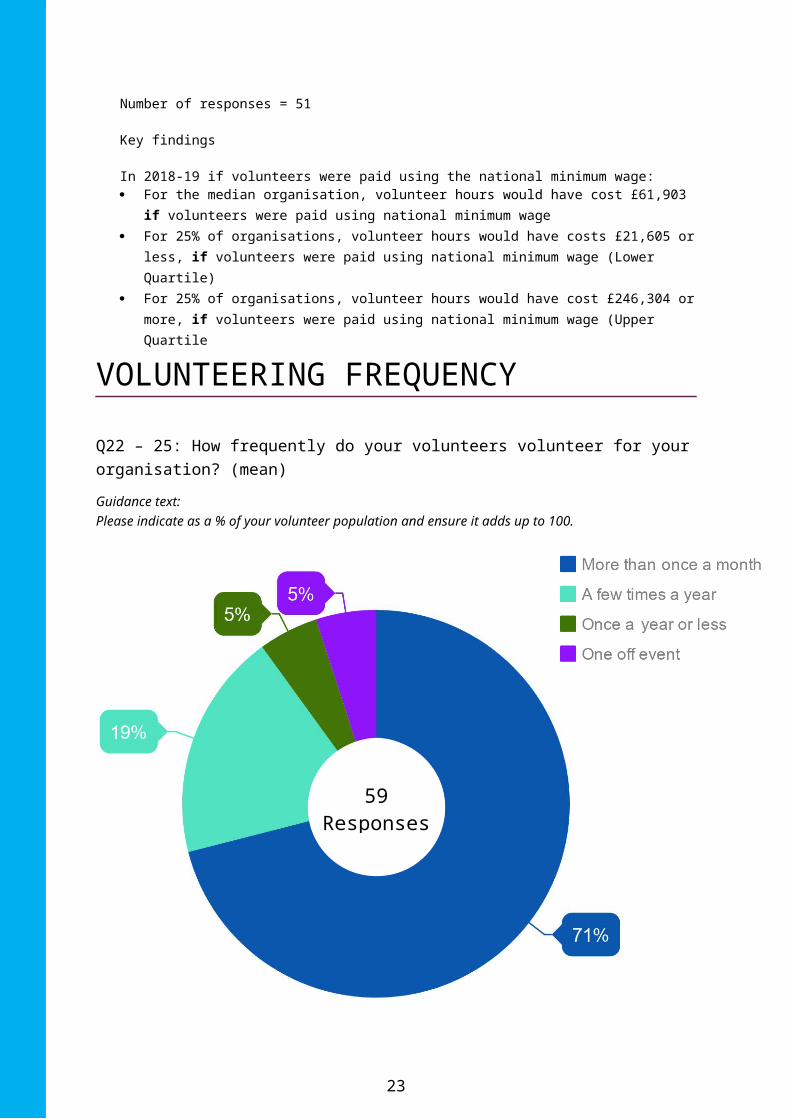
VOLUNTEERING FREQUENCY
Q22 – 25: How frequently do your volunteers volunteer for your organisation? (mean)
Guidance text:Please indicate as a % of your volunteer population and ensure it adds up to 100.
Number of responses = 59
Key findings
The average volunteering frequencies are as follows:
71% of volunteers volunteer more than once a month 19% of volunteers volunteer a few times a year 5% of volunteers volunteer once a year or less 5% of volunteers volunteer as a once off event
20
59 Responses
LENGTH OF SERVICE
Q26 - 31: How long have your volunteers been with your organisation? (mean)
Guidance text:Please indicate as a % of your volunteer population and ensure it adds up to 100.
Number of responses = 59
Key findings
The average length of service of volunteers is as follows:
32% have volunteered for less than 1 year 32% have volunteered for 1 to 4 years 20% have volunteered for 5 to 9 years 16% have volunteered for 10 years or more
21
59 Responses
VOLUNTEERING ROLES
Q32 - 49: Please indicate as a % of your organisation’s volunteer population the areas in which they primarily volunteer?
Guidance text:Please ensure it adds up to 100.
Number of responses = 61
Q50 Other volunteering roles:Summary of responses
Amongst the 20 organisations who selected ‘Other’, the other groupings of roles from most to least mentioned include:
1. Gardening2. Audience engagement3. Engineering and Maintenance4. Collections based5. Management6. Administration7. Creative
22
Broadcast/ Publishing/ Licensing
HR
Finance
Audience Research/ Evaluation
Digital/ IT
Corporate Strategy/ Management
Development/ Sponsorship/ Fundraising
Consulting/ Training
Marketing/ Communications
Estates/ Facilities Management
Exhibitions, including touring
Retail/ Events/ Catering
Curatorial
Conservation /Preservation/Collections Care
Other
Archives
Education/ Engagement/Learning
Operations/ Front of House
0% 5% 10% 15% 20% 25% 30% 35%
0%
0%
1%
1%
1%
1%
1%
1%
1%
2%
3%
3%
5%
9%
10%
13%
15%
32%
Mean % of volunteers in each role.
WHERE VOLUNTEERS ARE BASED
Q51 - 53: Where are your volunteers based to do their volunteering? (mean)
Guidance text:Please indicate as a % of your volunteer population and ensure it adds up to 100.
Number of responses = 62
Key findings
On average, volunteers are based as follows:
88% of volunteers are based on-site 7% of volunteers are based off-site 5% of volunteers are based at home
23
62 Responses

EMPLOYMENT STATUS
54 - 59 How many of your volunteers are primarily: (mean)
Guidance text:Please indicate as a % of your volunteer population and ensure it adds up to 100.
24
49 Responses

Retired Employed Student Not employed0%
10%
20%
30%
40%
50%
60%
51%
26%
15%
8%
36%40%
12% 12%
HVG Volunteers Count 2017
Employment Status
Perc
enta
ge o
f vol
unte
ers
Number of responses = 49
Key findings
On average, the employment status of volunteers within HVG is as follows:
51% are retired. This is higher (+15) than the percentage of retired volunteers within Agenda’s Volunteers Count 2017 study (36%)
26% are employed. This is lower (-14) than the percentage of employed volunteers within Agenda’s Volunteers Count 2017 study (40%)
15% are students 8% are not employed
25

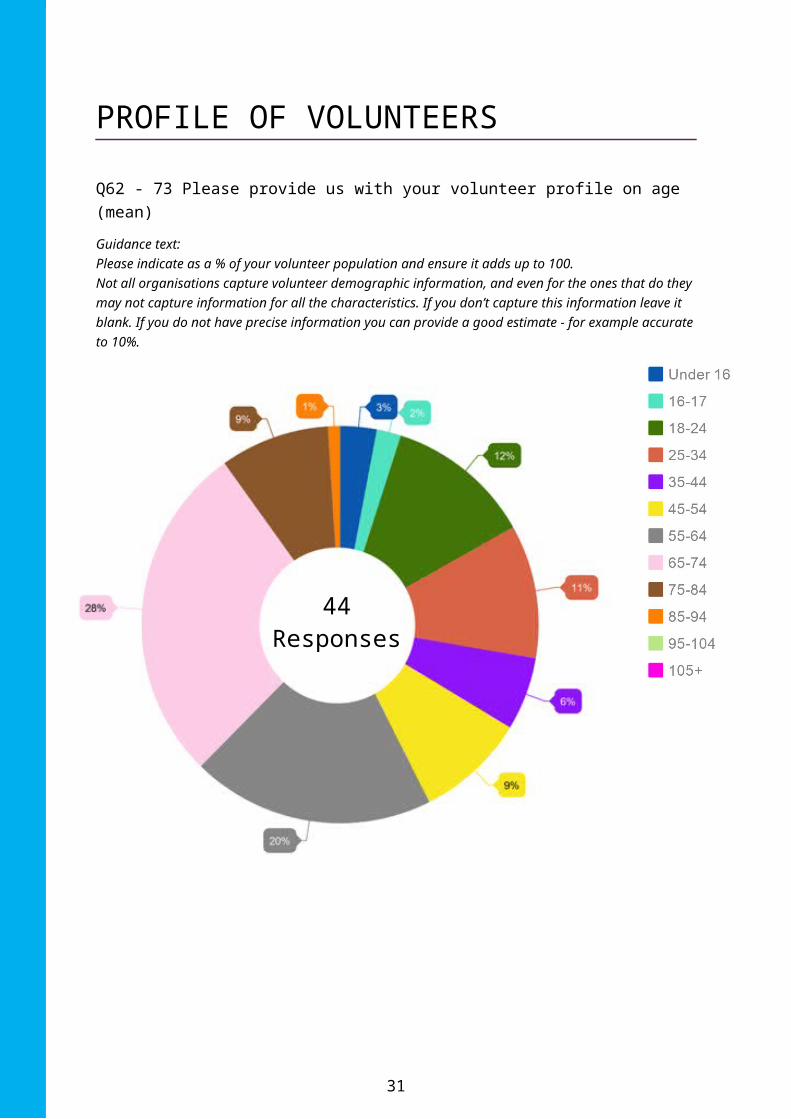
PROFILE OF VOLUNTEERS
Q62 - 73 Please provide us with your volunteer profile on age (mean)
Guidance text:Please indicate as a % of your volunteer population and ensure it adds up to 100.Not all organisations capture volunteer demographic information, and even for the ones that do they may not capture information for all the characteristics. If you don’t capture this information leave it blank. If you do not have precise information you can provide a good estimate - for example accurate to 10%.
26
44 Responses
44 Responses

Under 34 35-54 55+0%
10%
20%
30%
40%
50%
60%
70%
28%
15%
58%
19%25%
56%
HVG Volunteers Count 2017
Age Group
Perc
enta
ge o
f vol
unte
ers
Number of responses = 44
Key findings
On average, the age breakdown of volunteers within HVG is as follows:
28% are under the age of 34. This is higher (+9) than the percentage of volunteers aged under 34 within Agenda’s Volunteers Count 2017 study (19%)
15% are aged 35 to 54 years old. This is significantly lower (-10) than the percentage of volunteers aged 35 to 54 within Agenda’s Volunteers Count 2017 study (25%)
58% are aged 55 or over.
27

Q 74 – 77: Please indicate the % of your volunteer population which are:
Guidance text:Not all organisations capture volunteer demographic information, and even for the ones that do they may not capture information for all the characteristics. If you don’t capture this information leave it blank.If you do not have precise information you can provide a good estimate - for example accurate to 10%.Disability- The Equality Act 2010 defines a person as disabled if they have a physical or mental impairment, which has a substantial and long –term (i.e. has lasted or is expected to last at least 12 months) and adverse effect on the person’s ability to carry out normal day –to-day activities.
28
60%5%
5% 5%

% Female % LGBTQ+ % Disability % Ethnic minorities0%
10%
20%
30%
40%
50%
60%
70%
80%
60%
5% 5% 5%
68%
4% 6% 5%
50%
3%
17%13%
HVG Volunteers Count 2017 UK population (ONS)
Perc
enta
ge o
f vol
unte
ers
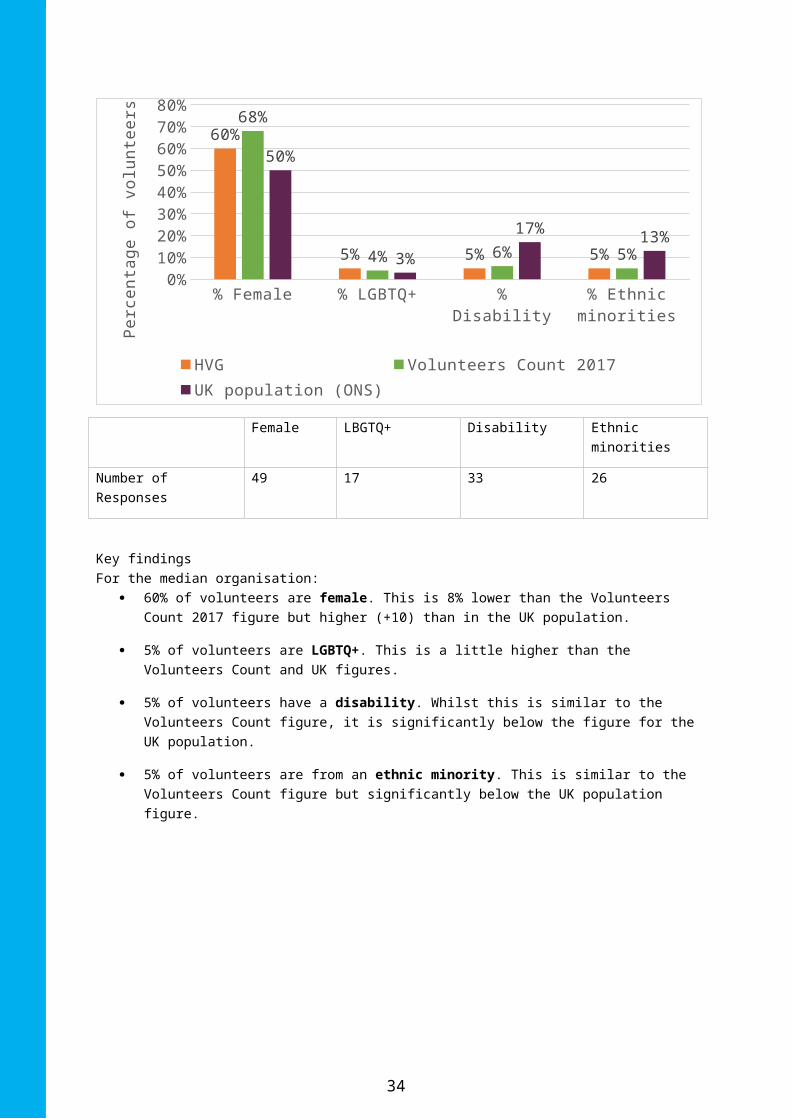
Female LBGTQ+ Disability Ethnic minorities
Number of Responses 49 17 33 26
Key findingsFor the median organisation:
60% of volunteers are female. This is 8% lower than the Volunteers Count 2017 figure but higher (+10) than in the UK population.
5% of volunteers are LGBTQ+. This is a little higher than the Volunteers Count and UK figures.
5% of volunteers have a disability. Whilst this is similar to the Volunteers Count figure, it is significantly below the figure for the UK population.
5% of volunteers are from an ethnic minority. This is similar to the Volunteers Count figure but significantly below the UK population figure.
29

Q 78 – 85: From the data you collect please provide us with your volunteer profile on religion and belief: (mean)
Please indicate as a % of your volunteer population and ensure it adds up to 100.Not all organisations capture volunteer demographic information, and even for the ones that do they may not capture information for all the characteristics. If you don’t capture this information leave it blank.If you do not have precise information you can provide a good estimate - for example accurate to 10%.
Number of Responses = 10
Key findings
Just 10 organisations have data on volunteers’ religious profile Amongst those 10 organisations:
o 45% of volunteers are Christiano 42% of volunteers have no religiono 6% of volunteers are religious, but are none of the religions offered in the surveyo 3% of volunteers are Muslimo 2% of volunteers are Buddhisto 1% of volunteers are Jewisho 1% of volunteers are Sikho 1% of volunteers are Hindu
30
10 Responses
OPEN QUESTIONS
Q86: What else could HVG do to support volunteering across the sector? (Open Question)
Summary of free text responses
This question was asked as an open question, where respondents could respond using free text. Responses were analysed into themes. The main groupings of responses from most to least mentioned include:
1. Training
2. Online Resources
3. Case Studies
4. Networking Opportunities
5. Signposting/ Hub
6. Advice
7. Advocacy
8. Conferences
9. Research
10. Templates
11. Communication
12. Funding
13. Partnerships
31

Q88: What are the top 3 priorities for volunteering in your organisation in the year ahead? (Open Question)
We have undertaken a qualitative analysis of responses to this question. We show the most frequent themes, with the % of sample respondents mentioning the theme and a short explanation of each.
Data collection and analysis
Planning and strategy
Retention
Development of volunteer management practice
Engagement/Satisfaction of volunteers
Development of volunteer roles/programme
Diversity and Inclusion
Learning and Development
Recruitment
0% 10% 20% 30% 40% 50% 60% 70%
16%
18%
18%
18%
20%
20%
33%
35%
61%
The top themes are: Recruitment (61%): Almost two thirds of respondents highlighted recruitment as one of their top 3
priorities. Organisations aim to recruit more volunteers with the impetus on recruiting young people.
Learning and Development (35%): Over a third of organisations plan to enhance their learning and development offer. They are prioritising the improvement of the induction and training programmes for their volunteers.
Diversity and Inclusion (33%): Respondents highlight improving diversity as a top priority for their organisation. They seek to become more attractive to minority groups and aim to recruit a more diverse range of volunteers.
Development of volunteer roles/programmes (20%): Improving volunteer programmes to a higher standard and developing volunteer roles is a top priority for respondents.
Engagement/satisfaction of volunteers (20%): Respondents aim to improve the engagement of volunteers to give them a more enjoyable and satisfying experience.
Development of volunteer management practice (18%): Respondents are prioritising the creation or development of their volunteer management. They plan to improve the training of staff in volunteer management, focussing on areas such as best practise, data management, risk assessments etc.
Retention (18%): Retention of volunteers and maintaining volunteer numbers has been highlighted as a top priority for many organisations.
Planning and strategy (18%): Respondents are looking to the future. They aim to implement and complete existing plans, while also prioritising the development of new plans and strategies.
Data collection and analysis (16%): Respondents highlight research as important and aim to improve their data collection and analysis to facilitate this.
32
ANNEX A: PARTICIPATING ORGANISATIONS
The table below sets out the 63 participating organisations alphabetically.
Amgueddfa Cymru - National Museum Wales
Museum of London
Anglesey Archives Museum of OxfordArkwright Society Museums AssociationBahamas Loco Soc’y National Football MuseumBletchley Park Trust National Galleries of ScotlandBritish Schools Museum National Museums LiverpoolCanal & River Trust National Museums ScotlandChawton House National Portrait GalleryCogges Heritage Trust New Lanark TrustColchester + Ipswich Museum Oxford ArchaeologyCompton Verney House Trust Oxford Preservation TrustCouncil for British Archaeology Oxford University MuseumsCynon Valley Museum Trust Ripon Museum TrustDurham Cathedral Royal Museums GreenwichEnglish Heritage Trust Science Museum GroupFfestiniog and Welsh Highland Railways SS Great Britain TrustFreelance St Dunstan's CollegeGuildhall Art Gallery St Paul's Cathedral Schools & Family
Learning DepartmentHarewood House Stirling District TourismHistoric Royal Palaces The Churches Conservation TrustImperial War Museums The Coffin WorksInformation Services at The University of Edinburgh
the Geffrye Museum of the Home
Jersey Heritage The National Library of WalesKegworth Heritage Centre The Regimental Museum of The Royal
WelshLeicestershire County Council The Shropshire Regimental MuseumLlanthony Secunda Priory Trust The Story MuseumLondon Canal Museum UnileverMaidenhead Heritage Centre West Somerset Steam Railway Trust
(WSSRT)Maidstone Museum Worcester Heritage & Amenity TrustMuseum of Anthropology (at UBC) York MinsterMuseum of English Rural Life
*2 organisations did not leave their name
33
VOLUNTEERS COUNT 2019We hope you found the Heritage Volunteering Group survey results useful. If you are interested in tracking more volunteer management metrics, why not join Volunteers Count 2019?
Volunteers Count is a biennial study, enabling you to:
Track your organisation’s progress over time Benchmark against 5-20 similar not-for-profit organisations of your choice Drill down into measures for deeper insight Learn from Good Practice provided by participants
We’re welcoming bookings now, and the questionnaire is open until Friday 19 July. If you take part, you will receive:
Your own results report, plus benchmark data for your chosen group and the whole sample A series of reports containing sector-wide analysis An Invitation to our Results and Training webinars A 1-1 webinar consultation with one of our team, to discuss your results
Find out more
Join one of our upcoming webinars to hear more about the scope of the study, watch the online questionnaire demo, and ask questions in the Q&A.
Register for a webinar >>>
Sign up to Volunteers Count 2019 >>>
34
HVG members are entitled to a discounted rate!
PLUS
We’re offering new participants an additional 25% off, when you
enter VCINTRO25 at the checkout.

Agenda Consulting
We are a research consultancy helping not-for-profit organisations develop and sustain the highest levels of employee and volunteer engagement.
We offer:
Employee and Volunteer Surveys: Engagement Surveys Respectful Workplace Surveys Pulse Surveys Action Planning and Developing
Engagement Strategies Engagement Research
Benchmarking Studies: Volunteers Count – Volunteer
Management People Count – HR and Workforce Social Care Reward: Pay, Terms and
Conditions Third Sector Annual Pay Award
Events: Volunteers Count Results Webinar
(Oct) People Count Results Webinar (Sept) Strategic People Conference (Mar)
Find out more:
Join a webinaragendaconsulting.co.uk/events
View our range of surveys and surveys clientsagendaconsulting.co.uk/surveys
Learn about our benchmarking studiesagendaconsulting.co.uk/benchmarking
Find tips, good practice, research findings, reports, infographicsagendaconsulting.co.uk/insights
Contact us:
Web:agendaconsulting.co.uk
Tel:+44 (0)1865 263720
Email:[email protected]
Address:2nd Floor, 11-12 Market Street, Oxford, OX1 3EX
Social:twitter.com/agendaconsult
linkedin.com/company/agenda-consulting
35