murphy oil corporation€¦ · 1 murphy oil at a glance murphy oil corporation (“murphy” or...
TRANSCRIPT
Murphy Oil Corporation2013 Annual Report
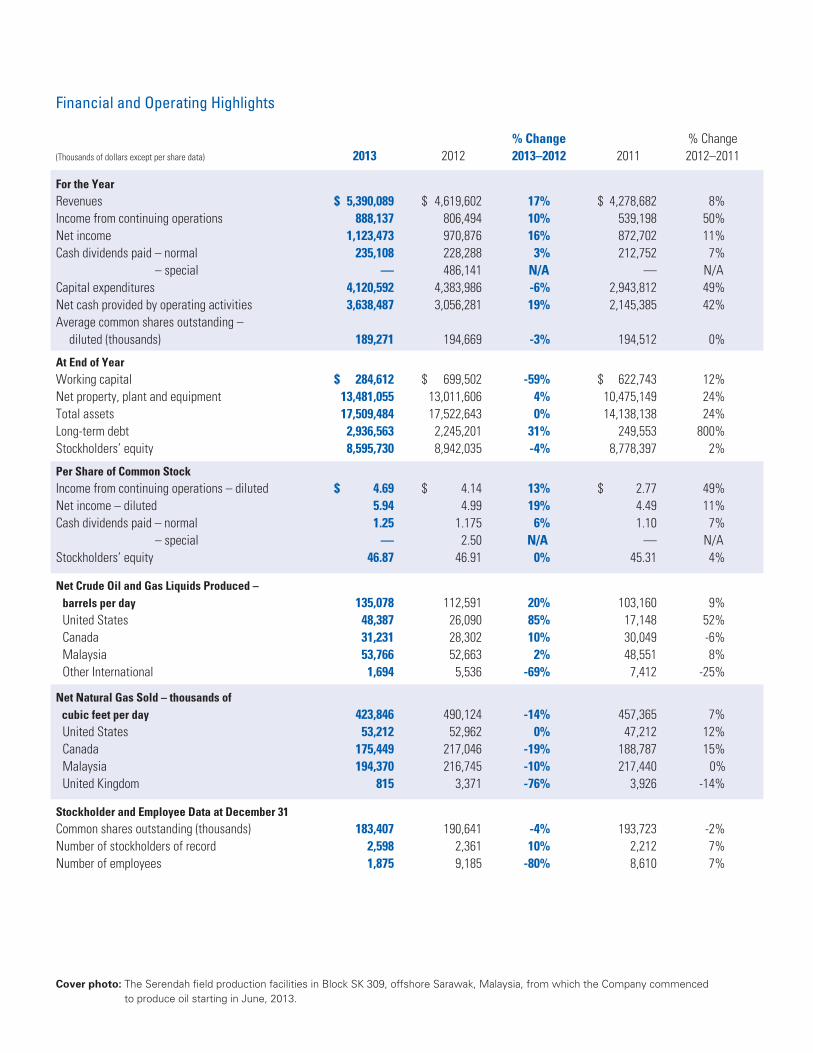
Financial and Operating Highlights
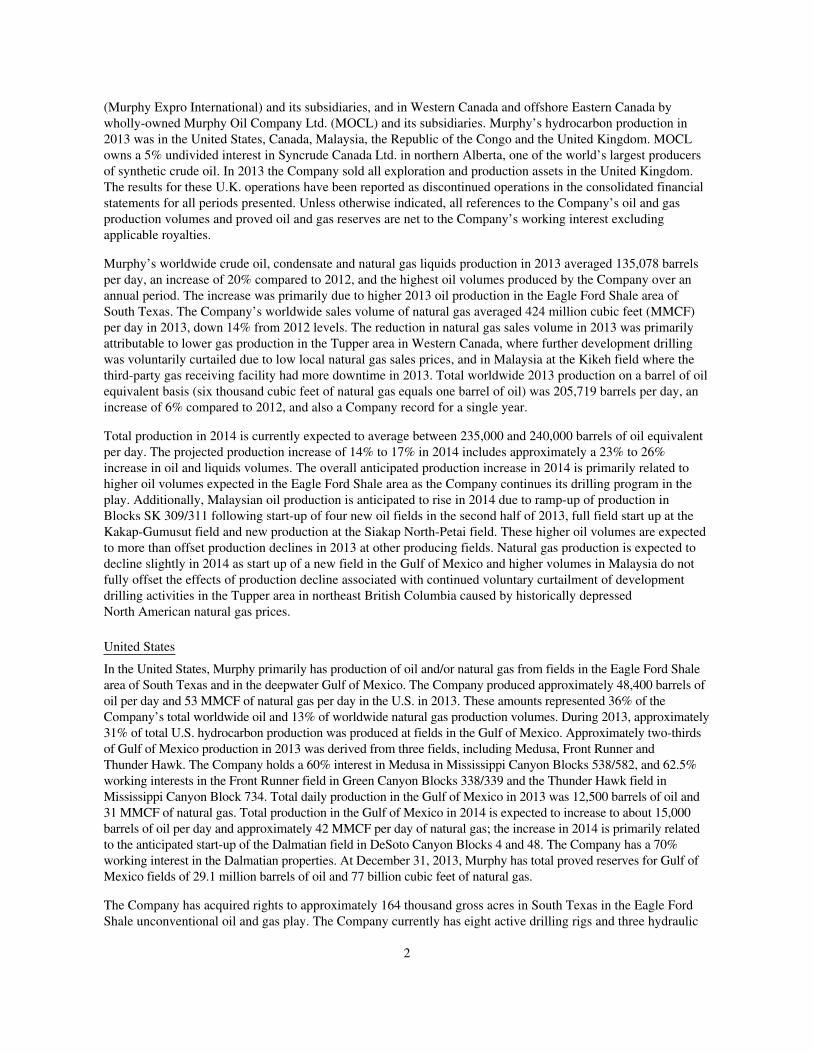
Cover photo: The Serendah field production facilities in Block SK 309, offshore Sarawak, Malaysia, from which the Company commenced to produce oil starting in June, 2013.
% Change % Change(Thousands of dollars except per share data) 2013 2012 2013–2012 2011 2012–2011
For the YearRevenues $ 5,390,089 $ 4,619,602 17% $ 4,278,682 8%Income from continuing operations 888,137 806,494 10% 539,198 50%Net income 1,123,473 970,876 16% 872,702 11%Cash dividends paid – normal 235,108 228,288 3% 212,752 7% – special — 486,141 N/A — N/ACapital expenditures 4,120,592 4,383,986 -6% 2,943,812 49%Net cash provided by operating activities 3,638,487 3,056,281 19% 2,145,385 42%Average common shares outstanding – diluted (thousands) 189,271 194,669 -3% 194,512 0%
At End of YearWorking capital $ 284,612 $ 699,502 -59% $ 622,743 12%Net property, plant and equipment 13,481,055 13,011,606 4% 10,475,149 24%Total assets 17,509,484 17,522,643 0% 14,138,138 24%Long-term debt 2,936,563 2,245,201 31% 249,553 800%Stockholders’ equity 8,595,730 8,942,035 -4% 8,778,397 2%
Per Share of Common StockIncome from continuing operations – diluted $ 4.69 $ 4.14 13% $ 2.77 49%Net income – diluted 5.94 4.99 19% 4.49 11%Cash dividends paid – normal 1.25 1.175 6% 1.10 7% – special — 2.50 N/A — N/AStockholders’ equity 46.87 46.91 0% 45.31 4%
Net Crude Oil and Gas Liquids Produced – barrels per day 135,078 112,591 20% 103,160 9% United States 48,387 26,090 85% 17,148 52% Canada 31,231 28,302 10% 30,049 -6% Malaysia 53,766 52,663 2% 48,551 8% Other International 1,694 5,536 -69% 7,412 -25%
Net Natural Gas Sold – thousands of cubic feet per day 423,846 490,124 -14% 457,365 7% United States 53,212 52,962 0% 47,212 12% Canada 175,449 217,046 -19% 188,787 15% Malaysia 194,370 216,745 -10% 217,440 0% United Kingdom 815 3,371 -76% 3,926 -14%
Stockholder and Employee Data at December 31Common shares outstanding (thousands) 183,407 190,641 -4% 193,723 -2%Number of stockholders of record 2,598 2,361 10% 2,212 7%Number of employees 1,875 9,185 -80% 8,610 7%
1
Murphy Oil at a Glance
Murphy Oil Corporation (“Murphy” or “the Company”) is an international oil and gas company that conducts business through various operating subsidiaries. The Company produces oil and/or natural gas in the United States, Canada and Malaysia and conducts exploration activities worldwide. Murphy also has an interest in a Canadian synthetic oil operation. The Company currently owns a petroleum refinery and markets petroleum products in the United Kingdom. The Company has announced its intention to sell its U.K. downstream operations. Murphy is headquartered
in El Dorado, Arkansas, and has 1,875 employees worldwide. The Company’s common stock is traded on the New York Stock Exchange (NYSE) under the ticker symbol “MUR”.
On August 30, 2013, the Company completed the separation of its U.S. downstream business. The separate, publicly owned company is known as Murphy USA Inc. and is traded on the NYSE under the ticker symbol “MUSA.”
OfficesEl Dorado, Arkansas
Houston, Texas
Calgary, Alberta, Canada
Kuala Lumpur, Malaysia
Ho Chi Minh City, Vietnam
Douala, Cameroon
Malabo, Equatorial Guinea
Paramaribo, Suriname
St. Albans, Hertfordshire, England
Pointe-Noire, Republic of the Congo
Perth, Western Australia, Australia
Jakarta, Indonesia
Major Subsidiaries of Murphy Oil Corporation
Murphy Exploration & Production Company, through various operating subsidiaries and affiliates, is engaged in crude oil and natural gas production activities in the United States and Malaysia, and explores for oil and natural gas worldwide. The subsidiary has its headquarters in Houston, Texas, and conducts business from offices in numerous locations around the world.
Murphy Oil Company Ltd. is engaged in crude oil and natural gas exploration and production in Western Canada and offshore Eastern Canada as well as the production
of synthetic crude oil from oil sands. The subsidiary’s office is located in Calgary, Alberta, and is operated as a component of the Company’s worldwide exploration and production operation directed from Houston.
Murco Petroleum Limited is engaged in refining and marketing of petroleum products in the United Kingdom. Headquartered at St. Albans, England, Murco owns a refinery in Milford Haven, Wales, and operates a network of fueling stations in the United Kingdom. The Company has announced its intention to sell these U.K. operations.
Dear Fellow Shareholders
2
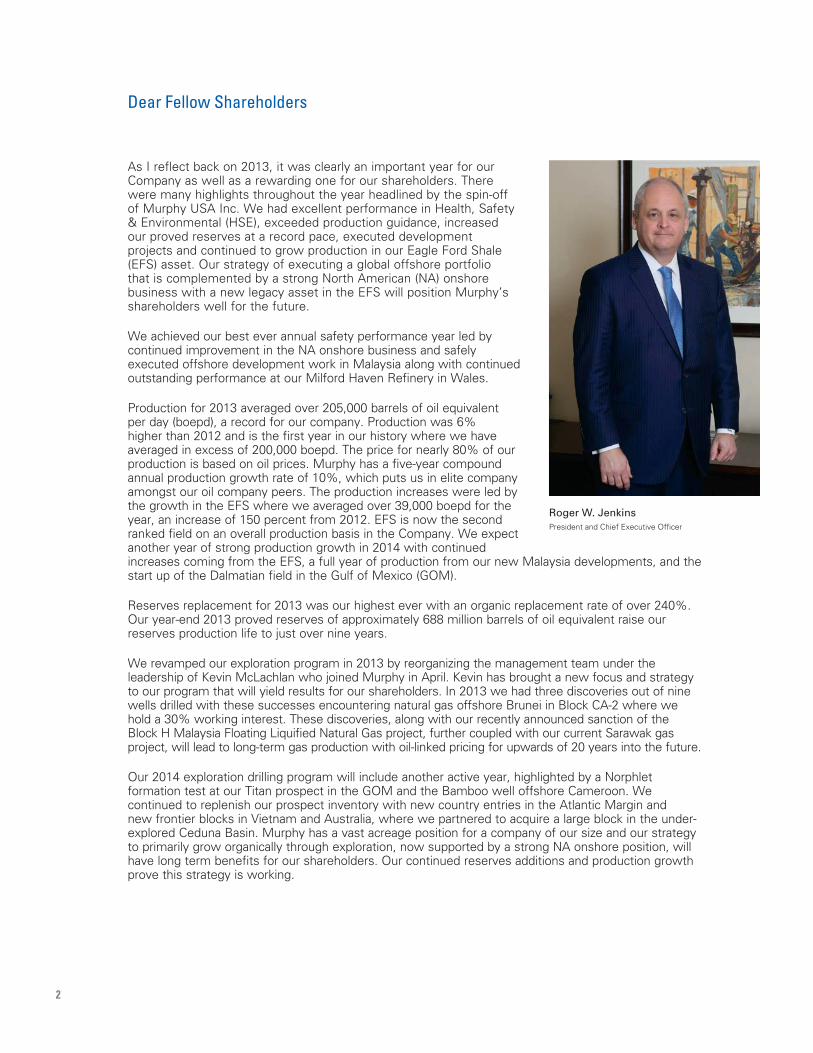
As I reflect back on 2013, it was clearly an important year for our Company as well as a rewarding one for our shareholders. There were many highlights throughout the year headlined by the spin-off of Murphy USA Inc. We had excellent performance in Health, Safety & Environmental (HSE), exceeded production guidance, increased our proved reserves at a record pace, executed development projects and continued to grow production in our Eagle Ford Shale (EFS) asset. Our strategy of executing a global offshore portfolio that is complemented by a strong North American (NA) onshore business with a new legacy asset in the EFS will position Murphy’s shareholders well for the future.
We achieved our best ever annual safety performance year led by continued improvement in the NA onshore business and safely executed offshore development work in Malaysia along with continued outstanding performance at our Milford Haven Refinery in Wales.
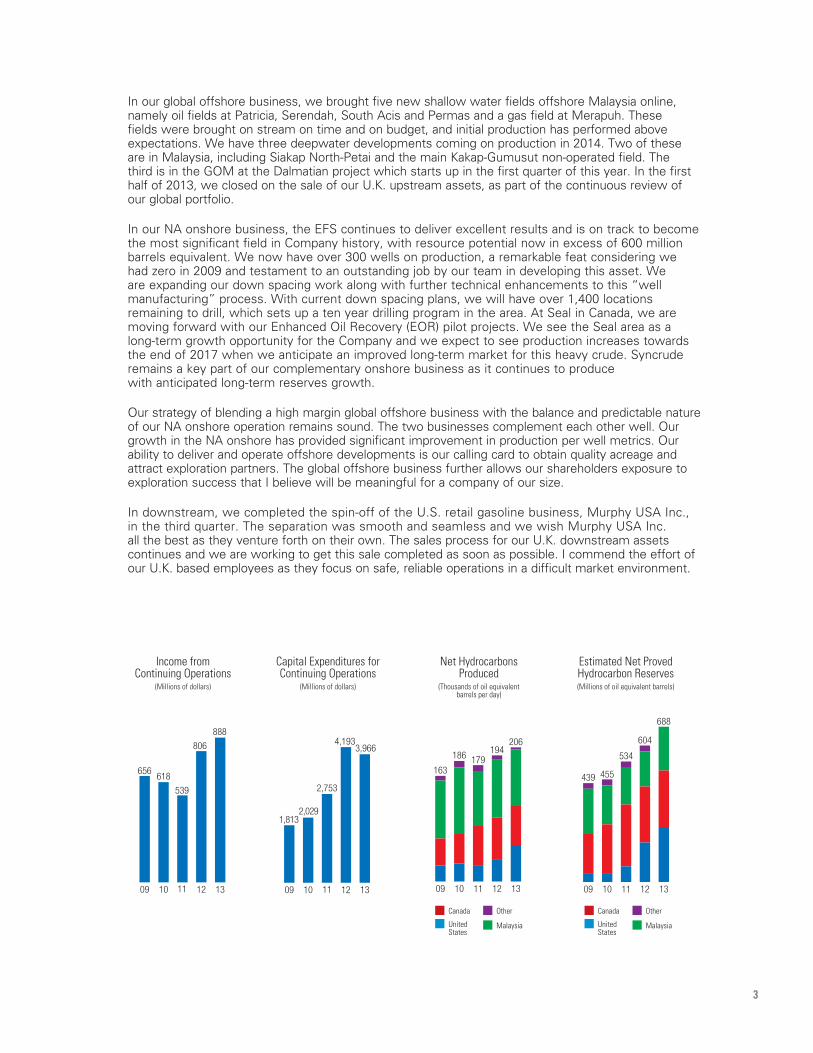
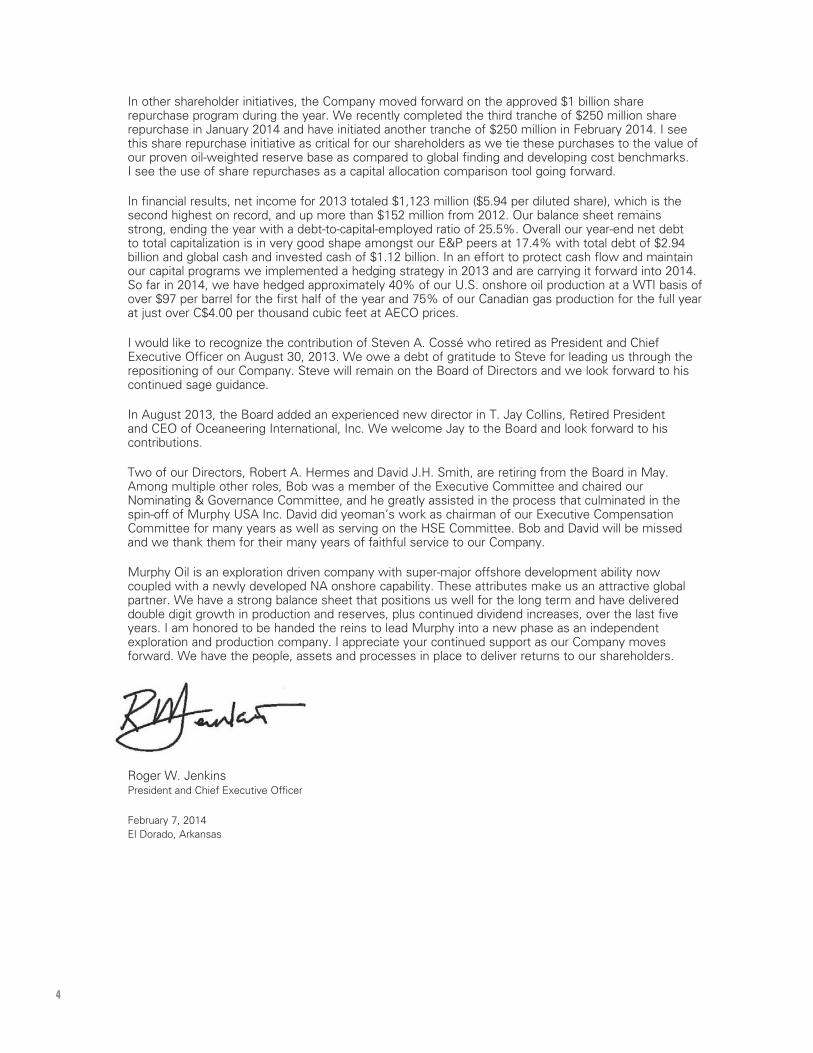
Production for 2013 averaged over 205,000 barrels of oil equivalent per day (boepd), a record for our company. Production was 6% higher than 2012 and is the first year in our history where we have averaged in excess of 200,000 boepd. The price for nearly 80% of our production is based on oil prices. Murphy has a five-year compound annual production growth rate of 10%, which puts us in elite company amongst our oil company peers. The production increases were led by the growth in the EFS where we averaged over 39,000 boepd for the year, an increase of 150 percent from 2012. EFS is now the second ranked field on an overall production basis in the Company. We expect another year of strong production growth in 2014 with continued increases coming from the EFS, a full year of production from our new Malaysia developments, and the start up of the Dalmatian field in the Gulf of Mexico (GOM).
Reserves replacement for 2013 was our highest ever with an organic replacement rate of over 240%. Our year-end 2013 proved reserves of approximately 688 million barrels of oil equivalent raise our reserves production life to just over nine years.
We revamped our exploration program in 2013 by reorganizing the management team under the leadership of Kevin McLachlan who joined Murphy in April. Kevin has brought a new focus and strategy to our program that will yield results for our shareholders. In 2013 we had three discoveries out of nine wells drilled with these successes encountering natural gas offshore Brunei in Block CA-2 where we hold a 30% working interest. These discoveries, along with our recently announced sanction of the Block H Malaysia Floating Liquified Natural Gas project, further coupled with our current Sarawak gas project, will lead to long-term gas production with oil-linked pricing for upwards of 20 years into the future.
Our 2014 exploration drilling program will include another active year, highlighted by a Norphlet formation test at our Titan prospect in the GOM and the Bamboo well offshore Cameroon. We continued to replenish our prospect inventory with new country entries in the Atlantic Margin and new frontier blocks in Vietnam and Australia, where we partnered to acquire a large block in the under-explored Ceduna Basin. Murphy has a vast acreage position for a company of our size and our strategy to primarily grow organically through exploration, now supported by a strong NA onshore position, will have long term benefits for our shareholders. Our continued reserves additions and production growth prove this strategy is working.
Roger W. JenkinsPresident and Chief Executive Officer
In our global offshore business, we brought five new shallow water fields offshore Malaysia online, namely oil fields at Patricia, Serendah, South Acis and Permas and a gas field at Merapuh. These fields were brought on stream on time and on budget, and initial production has performed above expectations. We have three deepwater developments coming on production in 2014. Two of these are in Malaysia, including Siakap North-Petai and the main Kakap-Gumusut non-operated field. The third is in the GOM at the Dalmatian project which starts up in the first quarter of this year. In the first half of 2013, we closed on the sale of our U.K. upstream assets, as part of the continuous review of our global portfolio.
In our NA onshore business, the EFS continues to deliver excellent results and is on track to become the most significant field in Company history, with resource potential now in excess of 600 million barrels equivalent. We now have over 300 wells on production, a remarkable feat considering we had zero in 2009 and testament to an outstanding job by our team in developing this asset. We are expanding our down spacing work along with further technical enhancements to this “well manufacturing” process. With current down spacing plans, we will have over 1,400 locations remaining to drill, which sets up a ten year drilling program in the area. At Seal in Canada, we are moving forward with our Enhanced Oil Recovery (EOR) pilot projects. We see the Seal area as a long-term growth opportunity for the Company and we expect to see production increases towards the end of 2017 when we anticipate an improved long-term market for this heavy crude. Syncrude remains a key part of our complementary onshore business as it continues to produce with anticipated long-term reserves growth.
Our strategy of blending a high margin global offshore business with the balance and predictable nature of our NA onshore operation remains sound. The two businesses complement each other well. Our growth in the NA onshore has provided significant improvement in production per well metrics. Our ability to deliver and operate offshore developments is our calling card to obtain quality acreage and attract exploration partners. The global offshore business further allows our shareholders exposure to exploration success that I believe will be meaningful for a company of our size.
In downstream, we completed the spin-off of the U.S. retail gasoline business, Murphy USA Inc., in the third quarter. The separation was smooth and seamless and we wish Murphy USA Inc. all the best as they venture forth on their own. The sales process for our U.K. downstream assets continues and we are working to get this sale completed as soon as possible. I commend the effort of our U.K. based employees as they focus on safe, reliable operations in a difficult market environment.
3
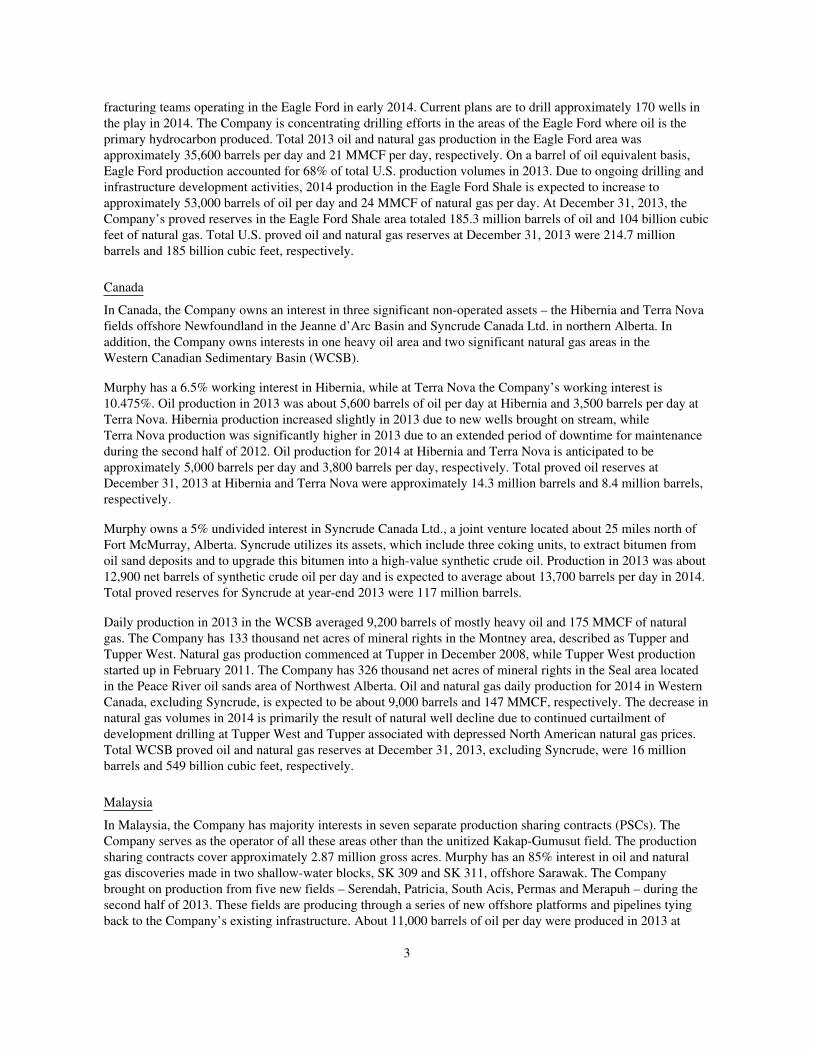
Income from Continuing Operations
(Millions of dollars)
656618
539
888
806
09 10 11 12 13
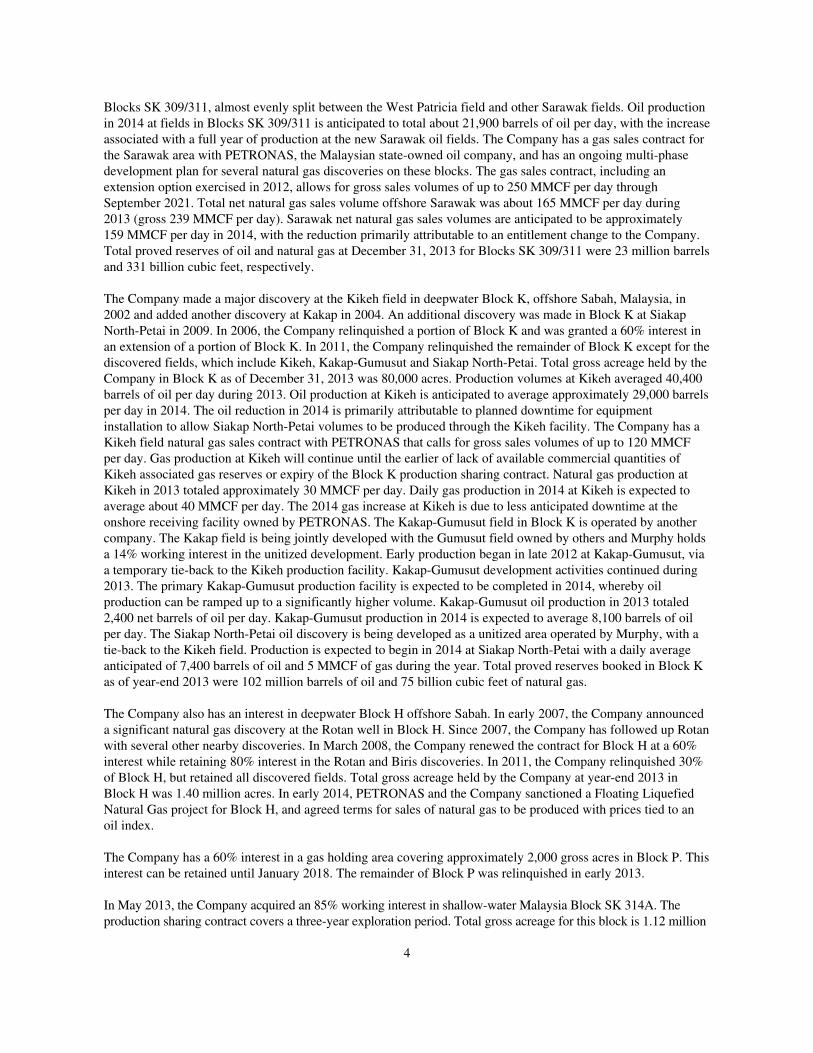
Capital Expenditures for Continuing Operations
(Millions of dollars)
1,8132,029
2,753
3,966 4,193
09 10 11 12 13
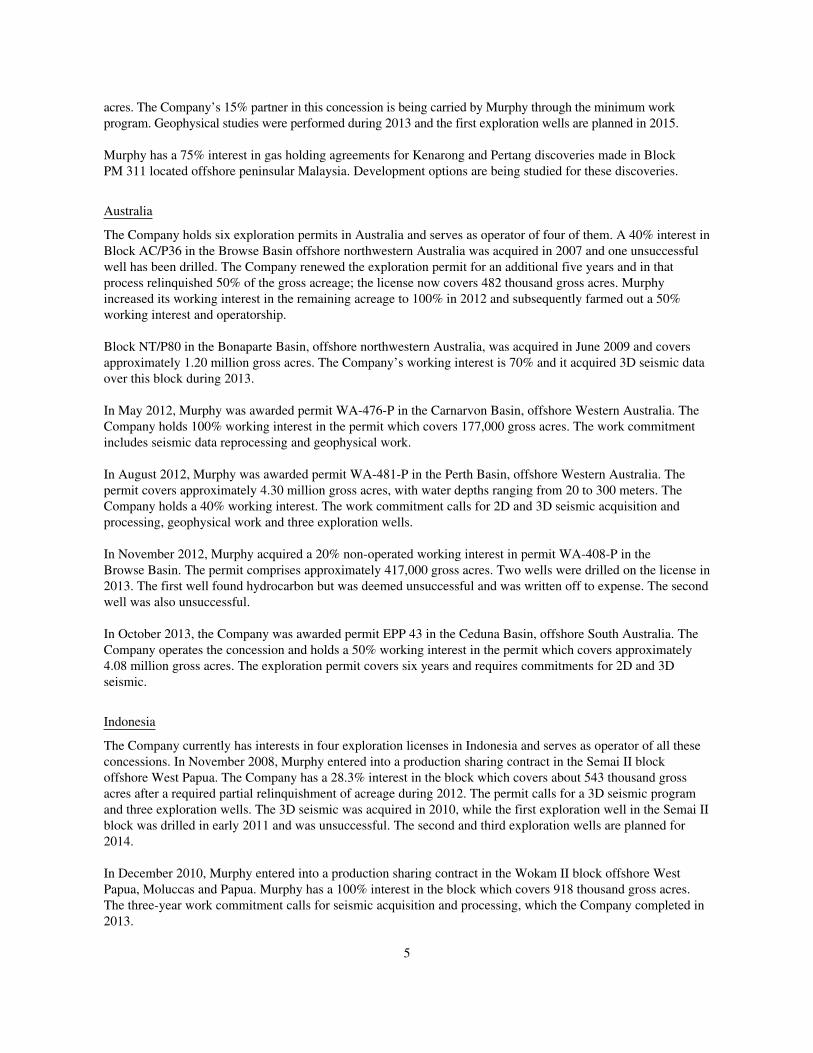
163
186 179
206194
09 10 11 12 13
Net Hydrocarbons Produced
(Thousands of oil equivalent barrels per day)
Canada
United States
Other
Malaysia
Estimated Net Proved Hydrocarbon Reserves(Millions of oil equivalent barrels)
439 455
534
688
604
09 10 11 12 13
Canada
United States
Other
Malaysia
4
In other shareholder initiatives, the Company moved forward on the approved $1 billion share repurchase program during the year. We recently completed the third tranche of $250 million share repurchase in January 2014 and have initiated another tranche of $250 million in February 2014. I see this share repurchase initiative as critical for our shareholders as we tie these purchases to the value of our proven oil-weighted reserve base as compared to global finding and developing cost benchmarks. I see the use of share repurchases as a capital allocation comparison tool going forward.
In financial results, net income for 2013 totaled $1,123 million ($5.94 per diluted share), which is the second highest on record, and up more than $152 million from 2012. Our balance sheet remains strong, ending the year with a debt-to-capital-employed ratio of 25.5%. Overall our year-end net debt to total capitalization is in very good shape amongst our E&P peers at 17.4% with total debt of $2.94 billion and global cash and invested cash of $1.12 billion. In an effort to protect cash flow and maintain our capital programs we implemented a hedging strategy in 2013 and are carrying it forward into 2014. So far in 2014, we have hedged approximately 40% of our U.S. onshore oil production at a WTI basis of over $97 per barrel for the first half of the year and 75% of our Canadian gas production for the full year at just over C$4.00 per thousand cubic feet at AECO prices.
I would like to recognize the contribution of Steven A. Cossé who retired as President and Chief Executive Officer on August 30, 2013. We owe a debt of gratitude to Steve for leading us through the repositioning of our Company. Steve will remain on the Board of Directors and we look forward to his continued sage guidance.
In August 2013, the Board added an experienced new director in T. Jay Collins, Retired President and CEO of Oceaneering International, Inc. We welcome Jay to the Board and look forward to his contributions.
Two of our Directors, Robert A. Hermes and David J.H. Smith, are retiring from the Board in May. Among multiple other roles, Bob was a member of the Executive Committee and chaired our Nominating & Governance Committee, and he greatly assisted in the process that culminated in the spin-off of Murphy USA Inc. David did yeoman’s work as chairman of our Executive Compensation Committee for many years as well as serving on the HSE Committee. Bob and David will be missed and we thank them for their many years of faithful service to our Company.
Murphy Oil is an exploration driven company with super-major offshore development ability now coupled with a newly developed NA onshore capability. These attributes make us an attractive global partner. We have a strong balance sheet that positions us well for the long term and have delivered double digit growth in production and reserves, plus continued dividend increases, over the last five years. I am honored to be handed the reins to lead Murphy into a new phase as an independent exploration and production company. I appreciate your continued support as our Company moves forward. We have the people, assets and processes in place to deliver returns to our shareholders.
Roger W. JenkinsPresident and Chief Executive Officer
February 7, 2014 El Dorado, Arkansas
5
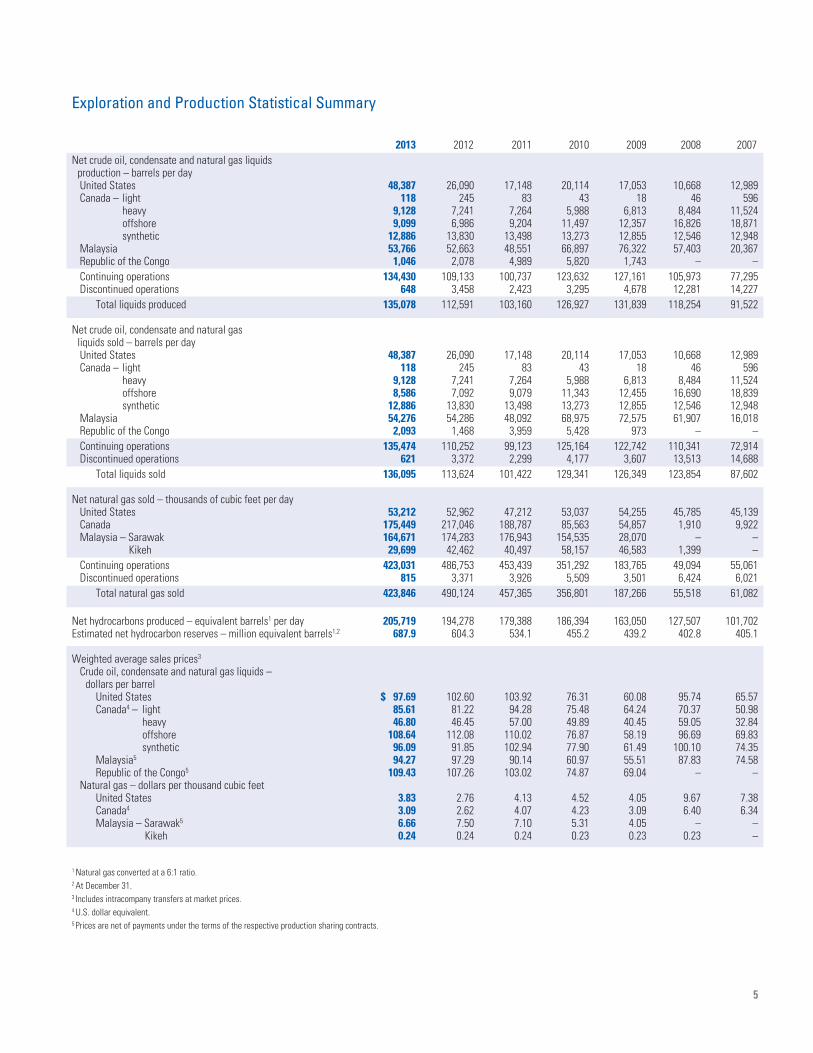
Exploration and Production Statistical Summary
2013 2012 2011 2010 2009 2008 2007Net crude oil, condensate and natural gas liquids production – barrels per day United States 48,387 26,090 17,148 20,114 17,053 10,668 12,989 Canada – light 118 245 83 43 18 46 596 heavy 9,128 7,241 7,264 5,988 6,813 8,484 11,524 offshore 9,099 6,986 9,204 11,497 12,357 16,826 18,871 synthetic 12,886 13,830 13,498 13,273 12,855 12,546 12,948 Malaysia 53,766 52,663 48,551 66,897 76,322 57,403 20,367 Republic of the Congo 1,046 2,078 4,989 5,820 1,743 – – Continuing operations 134,430 109,133 100,737 123,632 127,161 105,973 77,295 Discontinued operations 648 3,458 2,423 3,295 4,678 12,281 14,227 Total liquids produced 135,078 112,591 103,160 126,927 131,839 118,254 91,522
Net crude oil, condensate and natural gas liquids sold – barrels per day United States 48,387 26,090 17,148 20,114 17,053 10,668 12,989 Canada – light 118 245 83 43 18 46 596 heavy 9,128 7,241 7,264 5,988 6,813 8,484 11,524 offshore 8,586 7,092 9,079 11,343 12,455 16,690 18,839 synthetic 12,886 13,830 13,498 13,273 12,855 12,546 12,948 Malaysia 54,276 54,286 48,092 68,975 72,575 61,907 16,018 Republic of the Congo 2,093 1,468 3,959 5,428 973 – – Continuing operations 135,474 110,252 99,123 125,164 122,742 110,341 72,914 Discontinued operations 621 3,372 2,299 4,177 3,607 13,513 14,688 Total liquids sold 136,095 113,624 101,422 129,341 126,349 123,854 87,602
Net natural gas sold – thousands of cubic feet per day United States 53,212 52,962 47,212 53,037 54,255 45,785 45,139 Canada 175,449 217,046 188,787 85,563 54,857 1,910 9,922 Malaysia – Sarawak 164,671 174,283 176,943 154,535 28,070 – – Kikeh 29,699 42,462 40,497 58,157 46,583 1,399 – Continuing operations 423,031 486,753 453,439 351,292 183,765 49,094 55,061 Discontinued operations 815 3,371 3,926 5,509 3,501 6,424 6,021 Total natural gas sold 423,846 490,124 457,365 356,801 187,266 55,518 61,082
Net hydrocarbons produced – equivalent barrels1 per day 205,719 194,278 179,388 186,394 163,050 127,507 101,702Estimated net hydrocarbon reserves – million equivalent barrels1,2 687.9 604.3 534.1 455.2 439.2 402.8 405.1
Weighted average sales prices3
Crude oil, condensate and natural gas liquids – dollars per barrel United States $ 97.69 102.60 103.92 76.31 60.08 95.74 65.57 Canada4 – light 85.61 81.22 94.28 75.48 64.24 70.37 50.98 heavy 46.80 46.45 57.00 49.89 40.45 59.05 32.84 offshore 108.64 112.08 110.02 76.87 58.19 96.69 69.83 synthetic 96.09 91.85 102.94 77.90 61.49 100.10 74.35 Malaysia5 94.27 97.29 90.14 60.97 55.51 87.83 74.58 Republic of the Congo5 109.43 107.26 103.02 74.87 69.04 – – Natural gas – dollars per thousand cubic feet United States 3.83 2.76 4.13 4.52 4.05 9.67 7.38 Canada4 3.09 2.62 4.07 4.23 3.09 6.40 6.34 Malaysia – Sarawak5 6.66 7.50 7.10 5.31 4.05 – – Kikeh 0.24 0.24 0.24 0.23 0.23 0.23 –
1 Natural gas converted at a 6:1 ratio.2 At December 31.3 Includes intracompany transfers at market prices.4 U.S. dollar equivalent.5 Prices are net of payments under the terms of the respective production sharing contracts.
6
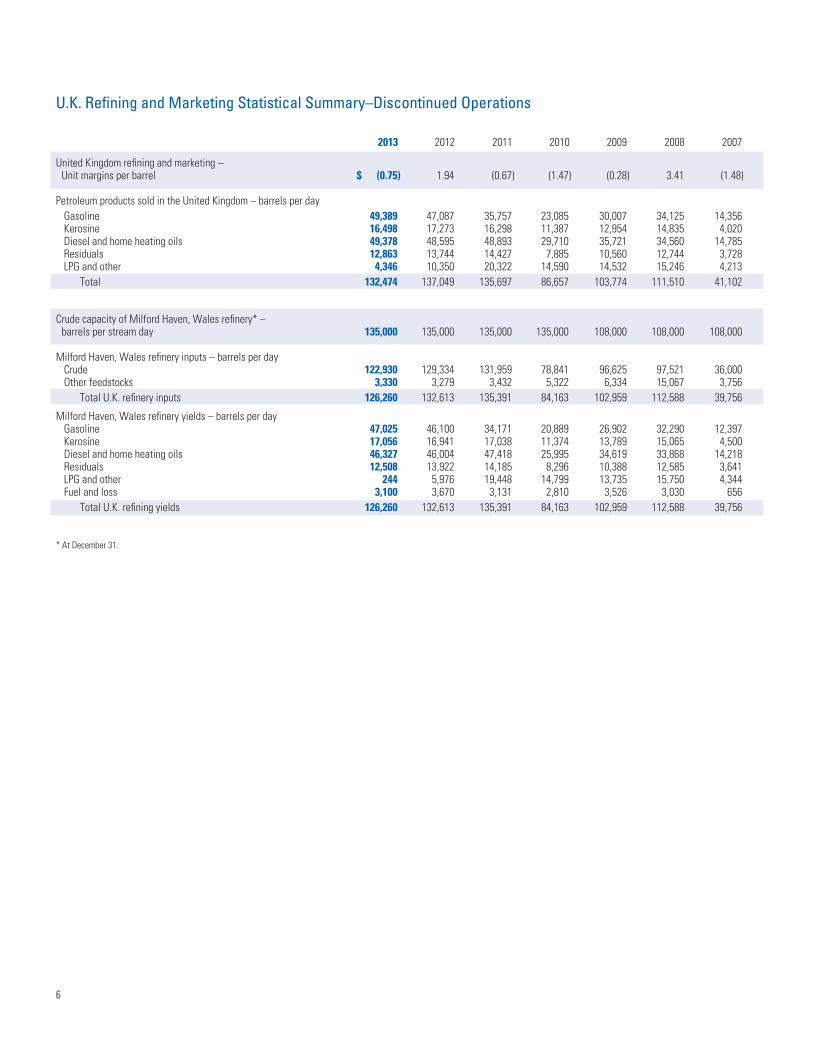
U.K. Refining and Marketing Statistical Summary–Discontinued Operations
2013 2012 2011 2010 2009 2008 2007
United Kingdom refining and marketing – Unit margins per barrel $ (0.75) 1.94 (0.67) (1.47) (0.28) 3.41 (1.48)
Petroleum products sold in the United Kingdom – barrels per day Gasoline 49,389 47,087 35,757 23,085 30,007 34,125 14,356 Kerosine 16,498 17,273 16,298 11,387 12,954 14,835 4,020 Diesel and home heating oils 49,378 48,595 48,893 29,710 35,721 34,560 14,785 Residuals 12,863 13,744 14,427 7,885 10,560 12,744 3,728 LPG and other 4,346 10,350 20,322 14,590 14,532 15,246 4,213 Total 132,474 137,049 135,697 86,657 103,774 111,510 41,102
Crude capacity of Milford Haven, Wales refinery* – barrels per stream day 135,000 135,000 135,000 135,000 108,000 108,000 108,000
Milford Haven, Wales refinery inputs – barrels per day Crude 122,930 129,334 131,959 78,841 96,625 97,521 36,000 Other feedstocks 3,330 3,279 3,432 5,322 6,334 15,067 3,756 Total U.K. refinery inputs 126,260 132,613 135,391 84,163 102,959 112,588 39,756
Milford Haven, Wales refinery yields – barrels per day Gasoline 47,025 46,100 34,171 20,889 26,902 32,290 12,397 Kerosine 17,056 16,941 17,038 11,374 13,789 15,065 4,500 Diesel and home heating oils 46,327 46,004 47,418 25,995 34,619 33,868 14,218 Residuals 12,508 13,922 14,185 8,296 10,388 12,585 3,641 LPG and other 244 5,976 19,448 14,799 13,735 15,750 4,344 Fuel and loss 3,100 3,670 3,131 2,810 3,526 3,030 656 Total U.K. refining yields 126,260 132,613 135,391 84,163 102,959 112,588 39,756
* At December 31.

7
Board of DirectorsBoard of Directors
Claiborne P. Deming President and Chief Executive Officer, Retired, Murphy Oil Corporation, El Dorado, Arkansas. Director since 1993. Chairman of the Board since March 2012. Committees: Executive (Chair); Health, Safety & Environmental
Roger W. Jenkins President and Chief Executive Officer, Murphy Oil Corporation, El Dorado, Arkansas. Director since 2013. Committees: Executive
Robert A. Hermes Chairman of the Board, Retired, Purvin & Gertz, Inc., Houston, Texas. Director since 1999. Committees: Nominating & Governance; Health, Safety & Environmental
James V. KelleyPresident and Chief Operating Officer, BancorpSouth, Inc., Tupelo, Mississippi. Director since 2006. Committees: Audit; Executive; Nominating & Governance
Walentin Mirosh President, Mircan Resources Ltd., Calgary, Alberta, Canada. Director since 2011. Committees: Executive Compensation; Health, Safety & Environmental
R. Madison Murphy Managing Member, Murphy Family Management, LLC, El Dorado, Arkansas. Director since 1993. Chairman from 1994–2002. Committees: Executive; Audit (Chair)
Jeffrey W. Nolan President and Chief Executive Officer, Loutre Land and Timber Company, El Dorado, Arkansas. Director since 2012. Committees: Executive Compensation; Nominating & Governance
Neal E. Schmale President and Chief Operating Officer, Retired, Sempra Energy, San Diego, California. Director since 2004. Committees: Audit; Executive Compensation (Chair)
David J. H. Smith Chief Executive Officer, Retired, Whatman plc, Maidstone, Kent, England. Director since 2001. Committees: Executive Compensation; Nominating & Governance
Caroline G. Theus President, Inglewood Land & Development Co., Alexandria, Louisiana. Director since 1985. Committees: Executive; Health, Safety & Environmental (Chair)
Frank W. BlueInternational Legal Advisor/Arbitrator, Santa Barbara, California. Director since 2003. Committees: Audit; Nominating & Governance (Chair)
T. Jay Collins President and Chief Executive Officer, Retired, Oceaneering International, Inc., Houston, Texas. Director since 2013. Committees: Executive Compensation
Steven A. Cossé President and Chief Executive Officer, Retired, Murphy Oil Corporation, El Dorado, Arkansas. Director since 2011. Committees: Executive; Health, Safety & Environmental
8
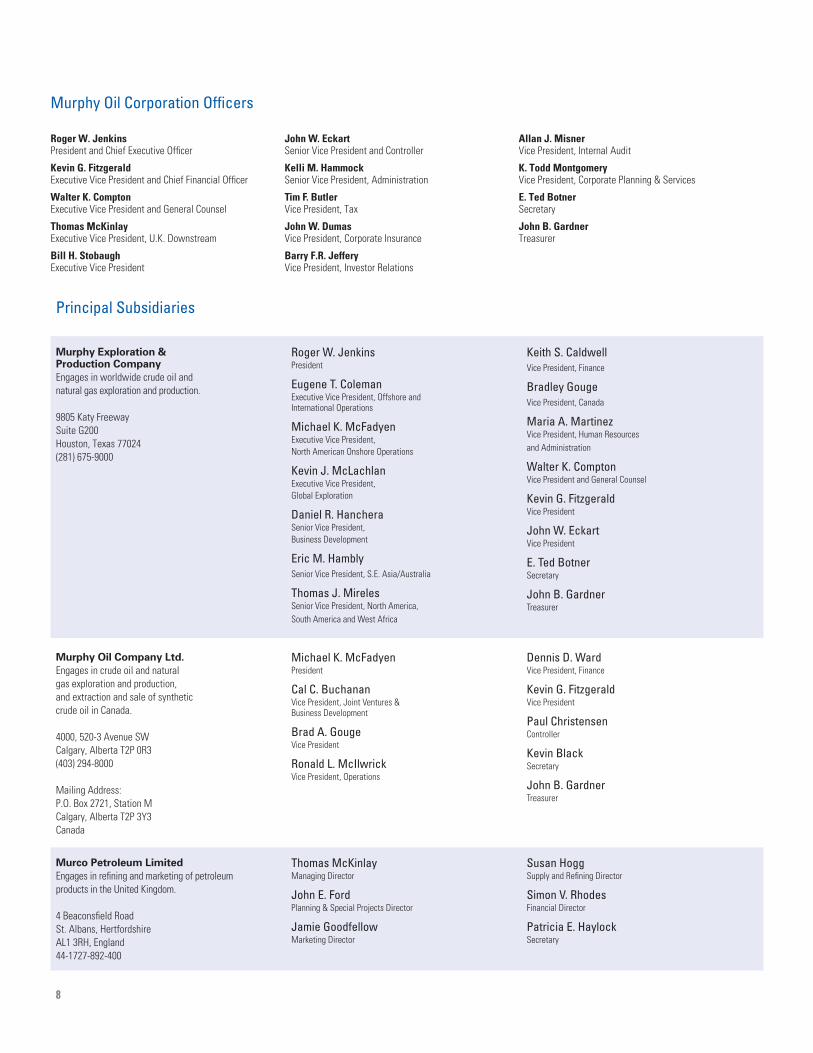
Murphy Exploration &Production Company
Engages in worldwide crude oil and natural gas exploration and production.
9805 Katy FreewaySuite G200Houston, Texas 77024(281) 675-9000
Roger W. JenkinsPresident
Eugene T. ColemanExecutive Vice President, Offshore and International Operations
Michael K. McFadyenExecutive Vice President, North American Onshore Operations
Kevin J. McLachlanExecutive Vice President,Global Exploration
Daniel R. HancheraSenior Vice President,Business Development
Eric M. HamblySenior Vice President, S.E. Asia/Australia
Thomas J. MirelesSenior Vice President, North America, South America and West Africa
Keith S. CaldwellVice President, Finance
Bradley GougeVice President, Canada
Maria A. MartinezVice President, Human Resources and Administration
Walter K. ComptonVice President and General Counsel
Kevin G. FitzgeraldVice President
John W. EckartVice President
E. Ted BotnerSecretary
John B. GardnerTreasurer
Principal Subsidiaries
Murphy Oil Company Ltd.
Engages in crude oil and natural gas exploration and production, and extraction and sale of synthetic crude oil in Canada.
4000, 520-3 Avenue SWCalgary, Alberta T2P 0R3(403) 294-8000
Mailing Address:P.O. Box 2721, Station MCalgary, Alberta T2P 3Y3Canada
Michael K. McFadyenPresident
Cal C. BuchananVice President, Joint Ventures & Business Development
Brad A. GougeVice President
Ronald L. McIlwrickVice President, Operations
Dennis D. WardVice President, Finance
Kevin G. FitzgeraldVice President
Paul ChristensenController
Kevin BlackSecretary
John B. GardnerTreasurer
Murco Petroleum Limited
Engages in refining and marketing of petroleum products in the United Kingdom.
4 Beaconsfield RoadSt. Albans, HertfordshireAL1 3RH, England44-1727-892-400
Thomas McKinlayManaging Director
John E. FordPlanning & Special Projects Director
Jamie GoodfellowMarketing Director
Susan HoggSupply and Refining Director
Simon V. RhodesFinancial Director
Patricia E. HaylockSecretary
Murphy Oil Corporation Officers
Roger W. Jenkins President and Chief Executive Officer
Kevin G. Fitzgerald Executive Vice President and Chief Financial Officer
Walter K. Compton Executive Vice President and General Counsel
Thomas McKinlay Executive Vice President, U.K. Downstream
Bill H. Stobaugh Executive Vice President
John W. Eckart Senior Vice President and Controller
Kelli M. Hammock Senior Vice President, Administration
Tim F. Butler Vice President, Tax
John W. Dumas Vice President, Corporate Insurance
Barry F.R. Jeffery Vice President, Investor Relations
Allan J. Misner Vice President, Internal Audit
K. Todd Montgomery Vice President, Corporate Planning & Services
E. Ted Botner Secretary
John B. Gardner Treasurer
UNITED STATESSECURITIES AND EXCHANGE COMMISSION
Washington, D.C. 20549
FORM 10-K(Mark One)
È ANNUAL REPORT PURSUANT TO SECTION 13 OR 15(d) OF THE SECURITIESEXCHANGE ACT OF 1934For the fiscal year ended December 31, 2013
OR
‘ TRANSITION REPORT PURSUANT TO SECTION 13 OR 15(d) OF THE SECURITIESEXCHANGE ACT OF 1934For the transition period from to
Commission file number 1-8590
MURPHY OIL CORPORATION(Exact name of registrant as specified in its charter)
Delaware 71-0361522(State or other jurisdiction ofincorporation or organization)
(I.R.S. EmployerIdentification Number)
200 Peach Street, P.O. Box 7000,El Dorado, Arkansas 71731-7000
(Address of principal executive offices) (Zip Code)
Registrant’s telephone number, including area code: (870) 862-6411
Securities registered pursuant to Section 12(b) of the Act:Title of each class Name of each exchange on which registered
Common Stock, $1.00 Par Value New York Stock ExchangeSeries A Participating CumulativePreferred Stock Purchase Rights
New York Stock Exchange
Securities registered pursuant to Section 12(g) of the Act:None
Indicate by check mark if the registrant is a well-known seasoned issuer, as defined in Rule 405 of the Securities Act. Yes È No ‘
Indicate by check mark if the registrant is not required to file reports pursuant to Section 13 or Section 15(d) of the Act. Yes ‘ No È
Indicate by check mark whether the registrant (1) has filed all reports required to be filed by Section 13 or 15(d) of the Securities ExchangeAct of 1934 during the preceding 12 months (or for such shorter period that the registrant was required to file such reports), and (2) has beensubject to such filing requirements for the past 90 days. Yes È No ‘
Indicate by check mark whether the registrant has submitted electronically and posted on its corporate Web site, if any, every Interactive DataFile required to be submitted and posted pursuant to Rule 405 of Regulation S-T (§232.405 of this chapter) during the preceding 12 months (orfor such shorter period that the registrant was required to submit and post such files). Yes È No ‘
Indicate by check mark if disclosure of delinquent filers pursuant to Item 405 of Regulation S-K (§229.405 of this chapter) is not containedherein, and will not be contained, to the best of registrant’s knowledge, in definitive proxy or information statements incorporated by referencein Part III of this Form 10-K or any amendment to this Form 10-K. È
Indicate by check mark whether the registrant is a large accelerated filer, an accelerated filer, a non-accelerated filer or a smaller reportingcompany. See the definitions of “large accelerated filer,” “accelerated filer” and “smaller reporting company” in Rule 12b-2 of the Exchange Act.
Large accelerated filer È Accelerated filer ‘
Non-accelerated filer ‘ Smaller reporting company ‘
Indicate by check mark whether the registrant is a shell company (as defined in Rule 12b-2 of the Act). Yes ‘ No È
Aggregate market value of the voting and non-voting common equity held by non-affiliates computed by reference to the price at which thecommon equity was last sold, or the average bid and asked price of such common equity, as of the last business day of the registrant’s mostrecently completed second fiscal quarter (as of June 30, 2013) – $9,733,180,000.
Number of shares of Common Stock, $1.00 Par Value, outstanding at January 31, 2014 was 183,181,954.
Documents incorporated by reference:
Portions of the Registrant’s definitive Proxy Statement relating to the Annual Meeting of Stockholders on May 14, 2014 have beenincorporated by reference in Part III herein.
MURPHY OIL CORPORATIONTABLE OF CONTENTS – 2013 FORM 10-K
PageNumber
PART I
Item 1. Business 1
Item 1A. Risk Factors 14
Item 1B. Unresolved Staff Comments 19
Item 2. Properties 19
Item 3. Legal Proceedings 21
Item 4. Mine Safety Disclosures 21
PART II
Item 5. Market for Registrant’s Common Equity, Related Stockholder Matters and Issuer Purchasesof Equity Securities 22
Item 6. Selected Financial Data 24
Item 7. Management’s Discussion and Analysis of Financial Condition and Results of Operations 25
Item 7A. Quantitative and Qualitative Disclosures About Market Risk 55
Item 8. Financial Statements and Supplementary Data 55
Item 9. Changes in and Disagreements with Accountants on Accounting and Financial Disclosure 55
Item 9A. Controls and Procedures 56
Item 9B. Other Information 56
PART III
Item 10. Directors, Executive Officers and Corporate Governance 57
Item 11. Executive Compensation 57
Item 12. Security Ownership of Certain Beneficial Owners and Management and Related StockholderMatters 57
Item 13. Certain Relationships and Related Transactions, and Director Independence 57
Item 14. Principal Accounting Fees and Services 57
PART IV
Item 15. Exhibits, Financial Statement Schedules 58
Signatures 61
i
PART I
Item 1. BUSINESS
Summary
Murphy Oil Corporation is a worldwide oil and gas exploration and production company, with refining andmarketing operations in the United Kingdom that are held for sale. The Company is in the process oftransitioning from an integrated oil company to an enterprise entirely focused on oil and gas exploration andproduction activities. As used in this report, the terms Murphy, Murphy Oil, we, our, its and Company may referto Murphy Oil Corporation or any one or more of its consolidated subsidiaries.
The Company was originally incorporated in Louisiana in 1950 as Murphy Corporation. It was reincorporated inDelaware in 1964, at which time it adopted the name Murphy Oil Corporation, and was reorganized in 1983 tooperate primarily as a holding company of its various businesses. For reporting purposes, Murphy’s explorationand production activities are subdivided into five geographic segments, including the United States, Canada,Malaysia, the Republic of the Congo and all other countries. Murphy’s refining and marketing activities are nowall located in the United Kingdom. As described further in this Form 10-K, Murphy has previously announced itsintention to sell its U.K. downstream business. On August 30, 2013, the Company completed the separation ofU.S. retail marketing operations with the spin-off of Murphy USA Inc. as a stand-alone company trading on theNew York Stock Exchange under the ticker symbol “MUSA”. Additionally, “Corporate” activities includeinterest income, interest expense, foreign exchange effects and administrative costs not allocated to the segments.The Company’s corporate headquarters are located in El Dorado, Arkansas.
The information appearing in the 2013 Annual Report to Security Holders (2013 Annual Report) is incorporatedin this Form 10-K report as Exhibit 13 and is deemed to be filed as part of this Form 10-K report as indicatedunder Items 1, 2 and 7.
In addition to the following information about each business activity, data about Murphy’s operations, propertiesand business segments, including revenues by class of products and financial information by geographic area, areprovided on pages 25 through 46, F-18 and F-19, F-50 through F-58 and F-60 of this Form 10-K report and onpages 5 and 6 of the 2013 Annual Report.
At December 31, 2013, Murphy had 1,875 employees. Approximately 450 of these employees staff theCompany’s U.K. refining and marketing business. The separation of Murphy USA Inc. in 2013 reduced theCompany’s employee count by approximately 1,700 full-time and 6,300 part-time staff.
Interested parties may obtain the Company’s public disclosures filed with the Securities and ExchangeCommission (SEC), including Form 10-K, Form 10-Q, Form 8-K and other documents, by accessing theInvestor Relations section of Murphy Oil Corporation’s Web site at www.murphyoilcorp.com.
Exploration and Production
The Company’s exploration and production business explores for and produces crude oil, natural gas and naturalgas liquids worldwide. The Company’s exploration and production management team in Houston, Texas, directsthe Company’s worldwide exploration and production activities. This business maintains upstream operatingoffices in other locations around the world, with the most significant of these including Calgary, Alberta andKuala Lumpur, Malaysia.
During 2013, Murphy’s principal exploration and production activities were conducted in the United States bywholly owned Murphy Exploration & Production Company – USA (Murphy Expro USA), in Malaysia,Indonesia, Suriname, Australia, Brunei, Cameroon, Vietnam, Equatorial Guinea, Republic of the Congo, and theKurdistan region of Iraq by wholly owned Murphy Exploration & Production Company – International
1
(Murphy Expro International) and its subsidiaries, and in Western Canada and offshore Eastern Canada bywholly-owned Murphy Oil Company Ltd. (MOCL) and its subsidiaries. Murphy’s hydrocarbon production in2013 was in the United States, Canada, Malaysia, the Republic of the Congo and the United Kingdom. MOCLowns a 5% undivided interest in Syncrude Canada Ltd. in northern Alberta, one of the world’s largest producersof synthetic crude oil. In 2013 the Company sold all exploration and production assets in the United Kingdom.The results for these U.K. operations have been reported as discontinued operations in the consolidated financialstatements for all periods presented. Unless otherwise indicated, all references to the Company’s oil and gasproduction volumes and proved oil and gas reserves are net to the Company’s working interest excludingapplicable royalties.
Murphy’s worldwide crude oil, condensate and natural gas liquids production in 2013 averaged 135,078 barrelsper day, an increase of 20% compared to 2012, and the highest oil volumes produced by the Company over anannual period. The increase was primarily due to higher 2013 oil production in the Eagle Ford Shale area ofSouth Texas. The Company’s worldwide sales volume of natural gas averaged 424 million cubic feet (MMCF)per day in 2013, down 14% from 2012 levels. The reduction in natural gas sales volume in 2013 was primarilyattributable to lower gas production in the Tupper area in Western Canada, where further development drillingwas voluntarily curtailed due to low local natural gas sales prices, and in Malaysia at the Kikeh field where thethird-party gas receiving facility had more downtime in 2013. Total worldwide 2013 production on a barrel of oilequivalent basis (six thousand cubic feet of natural gas equals one barrel of oil) was 205,719 barrels per day, anincrease of 6% compared to 2012, and also a Company record for a single year.
Total production in 2014 is currently expected to average between 235,000 and 240,000 barrels of oil equivalentper day. The projected production increase of 14% to 17% in 2014 includes approximately a 23% to 26%increase in oil and liquids volumes. The overall anticipated production increase in 2014 is primarily related tohigher oil volumes expected in the Eagle Ford Shale area as the Company continues its drilling program in theplay. Additionally, Malaysian oil production is anticipated to rise in 2014 due to ramp-up of production inBlocks SK 309/311 following start-up of four new oil fields in the second half of 2013, full field start up at theKakap-Gumusut field and new production at the Siakap North-Petai field. These higher oil volumes are expectedto more than offset production declines in 2013 at other producing fields. Natural gas production is expected todecline slightly in 2014 as start up of a new field in the Gulf of Mexico and higher volumes in Malaysia do notfully offset the effects of production decline associated with continued voluntary curtailment of developmentdrilling activities in the Tupper area in northeast British Columbia caused by historically depressedNorth American natural gas prices.
United States
In the United States, Murphy primarily has production of oil and/or natural gas from fields in the Eagle Ford Shalearea of South Texas and in the deepwater Gulf of Mexico. The Company produced approximately 48,400 barrels ofoil per day and 53 MMCF of natural gas per day in the U.S. in 2013. These amounts represented 36% of theCompany’s total worldwide oil and 13% of worldwide natural gas production volumes. During 2013, approximately31% of total U.S. hydrocarbon production was produced at fields in the Gulf of Mexico. Approximately two-thirdsof Gulf of Mexico production in 2013 was derived from three fields, including Medusa, Front Runner andThunder Hawk. The Company holds a 60% interest in Medusa in Mississippi Canyon Blocks 538/582, and 62.5%working interests in the Front Runner field in Green Canyon Blocks 338/339 and the Thunder Hawk field inMississippi Canyon Block 734. Total daily production in the Gulf of Mexico in 2013 was 12,500 barrels of oil and31 MMCF of natural gas. Total production in the Gulf of Mexico in 2014 is expected to increase to about 15,000barrels of oil per day and approximately 42 MMCF per day of natural gas; the increase in 2014 is primarily relatedto the anticipated start-up of the Dalmatian field in DeSoto Canyon Blocks 4 and 48. The Company has a 70%working interest in the Dalmatian properties. At December 31, 2013, Murphy has total proved reserves for Gulf ofMexico fields of 29.1 million barrels of oil and 77 billion cubic feet of natural gas.
The Company has acquired rights to approximately 164 thousand gross acres in South Texas in the Eagle FordShale unconventional oil and gas play. The Company currently has eight active drilling rigs and three hydraulic
2
fracturing teams operating in the Eagle Ford in early 2014. Current plans are to drill approximately 170 wells inthe play in 2014. The Company is concentrating drilling efforts in the areas of the Eagle Ford where oil is theprimary hydrocarbon produced. Total 2013 oil and natural gas production in the Eagle Ford area wasapproximately 35,600 barrels per day and 21 MMCF per day, respectively. On a barrel of oil equivalent basis,Eagle Ford production accounted for 68% of total U.S. production volumes in 2013. Due to ongoing drilling andinfrastructure development activities, 2014 production in the Eagle Ford Shale is expected to increase toapproximately 53,000 barrels of oil per day and 24 MMCF of natural gas per day. At December 31, 2013, theCompany’s proved reserves in the Eagle Ford Shale area totaled 185.3 million barrels of oil and 104 billion cubicfeet of natural gas. Total U.S. proved oil and natural gas reserves at December 31, 2013 were 214.7 millionbarrels and 185 billion cubic feet, respectively.
Canada
In Canada, the Company owns an interest in three significant non-operated assets – the Hibernia and Terra Novafields offshore Newfoundland in the Jeanne d’Arc Basin and Syncrude Canada Ltd. in northern Alberta. Inaddition, the Company owns interests in one heavy oil area and two significant natural gas areas in theWestern Canadian Sedimentary Basin (WCSB).
Murphy has a 6.5% working interest in Hibernia, while at Terra Nova the Company’s working interest is10.475%. Oil production in 2013 was about 5,600 barrels of oil per day at Hibernia and 3,500 barrels per day atTerra Nova. Hibernia production increased slightly in 2013 due to new wells brought on stream, whileTerra Nova production was significantly higher in 2013 due to an extended period of downtime for maintenanceduring the second half of 2012. Oil production for 2014 at Hibernia and Terra Nova is anticipated to beapproximately 5,000 barrels per day and 3,800 barrels per day, respectively. Total proved oil reserves atDecember 31, 2013 at Hibernia and Terra Nova were approximately 14.3 million barrels and 8.4 million barrels,respectively.
Murphy owns a 5% undivided interest in Syncrude Canada Ltd., a joint venture located about 25 miles north ofFort McMurray, Alberta. Syncrude utilizes its assets, which include three coking units, to extract bitumen fromoil sand deposits and to upgrade this bitumen into a high-value synthetic crude oil. Production in 2013 was about12,900 net barrels of synthetic crude oil per day and is expected to average about 13,700 barrels per day in 2014.Total proved reserves for Syncrude at year-end 2013 were 117 million barrels.
Daily production in 2013 in the WCSB averaged 9,200 barrels of mostly heavy oil and 175 MMCF of naturalgas. The Company has 133 thousand net acres of mineral rights in the Montney area, described as Tupper andTupper West. Natural gas production commenced at Tupper in December 2008, while Tupper West productionstarted up in February 2011. The Company has 326 thousand net acres of mineral rights in the Seal area locatedin the Peace River oil sands area of Northwest Alberta. Oil and natural gas daily production for 2014 in WesternCanada, excluding Syncrude, is expected to be about 9,000 barrels and 147 MMCF, respectively. The decrease innatural gas volumes in 2014 is primarily the result of natural well decline due to continued curtailment ofdevelopment drilling at Tupper West and Tupper associated with depressed North American natural gas prices.Total WCSB proved oil and natural gas reserves at December 31, 2013, excluding Syncrude, were 16 millionbarrels and 549 billion cubic feet, respectively.
Malaysia
In Malaysia, the Company has majority interests in seven separate production sharing contracts (PSCs). TheCompany serves as the operator of all these areas other than the unitized Kakap-Gumusut field. The productionsharing contracts cover approximately 2.87 million gross acres. Murphy has an 85% interest in oil and naturalgas discoveries made in two shallow-water blocks, SK 309 and SK 311, offshore Sarawak. The Companybrought on production from five new fields – Serendah, Patricia, South Acis, Permas and Merapuh – during thesecond half of 2013. These fields are producing through a series of new offshore platforms and pipelines tyingback to the Company’s existing infrastructure. About 11,000 barrels of oil per day were produced in 2013 at
3
Blocks SK 309/311, almost evenly split between the West Patricia field and other Sarawak fields. Oil productionin 2014 at fields in Blocks SK 309/311 is anticipated to total about 21,900 barrels of oil per day, with the increaseassociated with a full year of production at the new Sarawak oil fields. The Company has a gas sales contract forthe Sarawak area with PETRONAS, the Malaysian state-owned oil company, and has an ongoing multi-phasedevelopment plan for several natural gas discoveries on these blocks. The gas sales contract, including anextension option exercised in 2012, allows for gross sales volumes of up to 250 MMCF per day throughSeptember 2021. Total net natural gas sales volume offshore Sarawak was about 165 MMCF per day during2013 (gross 239 MMCF per day). Sarawak net natural gas sales volumes are anticipated to be approximately159 MMCF per day in 2014, with the reduction primarily attributable to an entitlement change to the Company.Total proved reserves of oil and natural gas at December 31, 2013 for Blocks SK 309/311 were 23 million barrelsand 331 billion cubic feet, respectively.
The Company made a major discovery at the Kikeh field in deepwater Block K, offshore Sabah, Malaysia, in2002 and added another discovery at Kakap in 2004. An additional discovery was made in Block K at SiakapNorth-Petai in 2009. In 2006, the Company relinquished a portion of Block K and was granted a 60% interest inan extension of a portion of Block K. In 2011, the Company relinquished the remainder of Block K except for thediscovered fields, which include Kikeh, Kakap-Gumusut and Siakap North-Petai. Total gross acreage held by theCompany in Block K as of December 31, 2013 was 80,000 acres. Production volumes at Kikeh averaged 40,400barrels of oil per day during 2013. Oil production at Kikeh is anticipated to average approximately 29,000 barrelsper day in 2014. The oil reduction in 2014 is primarily attributable to planned downtime for equipmentinstallation to allow Siakap North-Petai volumes to be produced through the Kikeh facility. The Company has aKikeh field natural gas sales contract with PETRONAS that calls for gross sales volumes of up to 120 MMCFper day. Gas production at Kikeh will continue until the earlier of lack of available commercial quantities ofKikeh associated gas reserves or expiry of the Block K production sharing contract. Natural gas production atKikeh in 2013 totaled approximately 30 MMCF per day. Daily gas production in 2014 at Kikeh is expected toaverage about 40 MMCF per day. The 2014 gas increase at Kikeh is due to less anticipated downtime at theonshore receiving facility owned by PETRONAS. The Kakap-Gumusut field in Block K is operated by anothercompany. The Kakap field is being jointly developed with the Gumusut field owned by others and Murphy holdsa 14% working interest in the unitized development. Early production began in late 2012 at Kakap-Gumusut, viaa temporary tie-back to the Kikeh production facility. Kakap-Gumusut development activities continued during2013. The primary Kakap-Gumusut production facility is expected to be completed in 2014, whereby oilproduction can be ramped up to a significantly higher volume. Kakap-Gumusut oil production in 2013 totaled2,400 net barrels of oil per day. Kakap-Gumusut production in 2014 is expected to average 8,100 barrels of oilper day. The Siakap North-Petai oil discovery is being developed as a unitized area operated by Murphy, with atie-back to the Kikeh field. Production is expected to begin in 2014 at Siakap North-Petai with a daily averageanticipated of 7,400 barrels of oil and 5 MMCF of gas during the year. Total proved reserves booked in Block Kas of year-end 2013 were 102 million barrels of oil and 75 billion cubic feet of natural gas.
The Company also has an interest in deepwater Block H offshore Sabah. In early 2007, the Company announceda significant natural gas discovery at the Rotan well in Block H. Since 2007, the Company has followed up Rotanwith several other nearby discoveries. In March 2008, the Company renewed the contract for Block H at a 60%interest while retaining 80% interest in the Rotan and Biris discoveries. In 2011, the Company relinquished 30%of Block H, but retained all discovered fields. Total gross acreage held by the Company at year-end 2013 inBlock H was 1.40 million acres. In early 2014, PETRONAS and the Company sanctioned a Floating LiquefiedNatural Gas project for Block H, and agreed terms for sales of natural gas to be produced with prices tied to anoil index.
The Company has a 60% interest in a gas holding area covering approximately 2,000 gross acres in Block P. Thisinterest can be retained until January 2018. The remainder of Block P was relinquished in early 2013.
In May 2013, the Company acquired an 85% working interest in shallow-water Malaysia Block SK 314A. Theproduction sharing contract covers a three-year exploration period. Total gross acreage for this block is 1.12 million
4
acres. The Company’s 15% partner in this concession is being carried by Murphy through the minimum workprogram. Geophysical studies were performed during 2013 and the first exploration wells are planned in 2015.
Murphy has a 75% interest in gas holding agreements for Kenarong and Pertang discoveries made in BlockPM 311 located offshore peninsular Malaysia. Development options are being studied for these discoveries.
Australia
The Company holds six exploration permits in Australia and serves as operator of four of them. A 40% interest inBlock AC/P36 in the Browse Basin offshore northwestern Australia was acquired in 2007 and one unsuccessfulwell has been drilled. The Company renewed the exploration permit for an additional five years and in thatprocess relinquished 50% of the gross acreage; the license now covers 482 thousand gross acres. Murphyincreased its working interest in the remaining acreage to 100% in 2012 and subsequently farmed out a 50%working interest and operatorship.
Block NT/P80 in the Bonaparte Basin, offshore northwestern Australia, was acquired in June 2009 and coversapproximately 1.20 million gross acres. The Company’s working interest is 70% and it acquired 3D seismic dataover this block during 2013.
In May 2012, Murphy was awarded permit WA-476-P in the Carnarvon Basin, offshore Western Australia. TheCompany holds 100% working interest in the permit which covers 177,000 gross acres. The work commitmentincludes seismic data reprocessing and geophysical work.
In August 2012, Murphy was awarded permit WA-481-P in the Perth Basin, offshore Western Australia. Thepermit covers approximately 4.30 million gross acres, with water depths ranging from 20 to 300 meters. TheCompany holds a 40% working interest. The work commitment calls for 2D and 3D seismic acquisition andprocessing, geophysical work and three exploration wells.
In November 2012, Murphy acquired a 20% non-operated working interest in permit WA-408-P in theBrowse Basin. The permit comprises approximately 417,000 gross acres. Two wells were drilled on the license in2013. The first well found hydrocarbon but was deemed unsuccessful and was written off to expense. The secondwell was also unsuccessful.
In October 2013, the Company was awarded permit EPP 43 in the Ceduna Basin, offshore South Australia. TheCompany operates the concession and holds a 50% working interest in the permit which covers approximately4.08 million gross acres. The exploration permit covers six years and requires commitments for 2D and 3Dseismic.
Indonesia
The Company currently has interests in four exploration licenses in Indonesia and serves as operator of all theseconcessions. In November 2008, Murphy entered into a production sharing contract in the Semai II blockoffshore West Papua. The Company has a 28.3% interest in the block which covers about 543 thousand grossacres after a required partial relinquishment of acreage during 2012. The permit calls for a 3D seismic programand three exploration wells. The 3D seismic was acquired in 2010, while the first exploration well in the Semai IIblock was drilled in early 2011 and was unsuccessful. The second and third exploration wells are planned for2014.
In December 2010, Murphy entered into a production sharing contract in the Wokam II block offshore WestPapua, Moluccas and Papua. Murphy has a 100% interest in the block which covers 918 thousand gross acres.The three-year work commitment calls for seismic acquisition and processing, which the Company completed in2013.
5
In November 2011, the Company acquired a 100% interest in a production sharing contract in the Semai IVblock offshore West Papua. The concession includes 873 thousand gross acres. The agreement calls for workcommitments of seismic acquisition and processing which are currently part of the Company’s 2014 explorationplan.
In May 2008, the Company entered into a production sharing contract at a 100% interest in the South Baritoblock in south Kalimantan on the island of Borneo. Following contractually mandated acreage relinquishment in2012, the block now covers approximately 745 thousand gross acres. The contract permits a six-year explorationterm with an optional four-year extension. The Company currently anticipates exiting this block in 2014.
Brunei
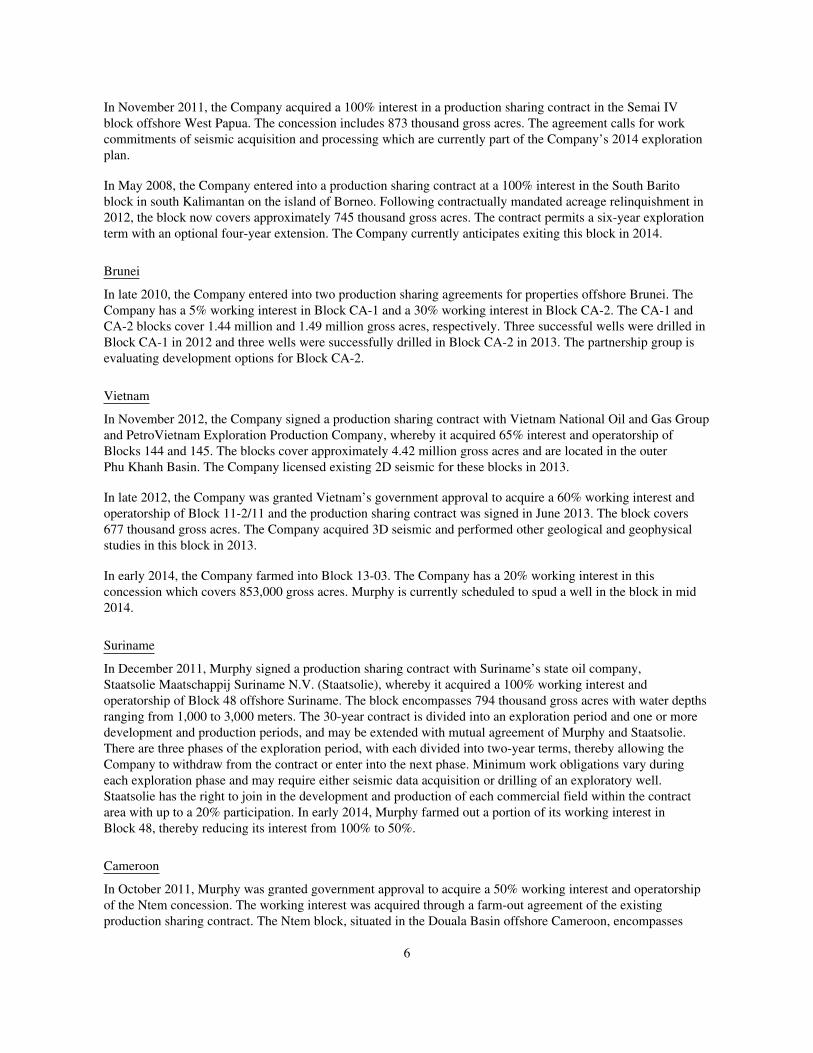
In late 2010, the Company entered into two production sharing agreements for properties offshore Brunei. TheCompany has a 5% working interest in Block CA-1 and a 30% working interest in Block CA-2. The CA-1 andCA-2 blocks cover 1.44 million and 1.49 million gross acres, respectively. Three successful wells were drilled inBlock CA-1 in 2012 and three wells were successfully drilled in Block CA-2 in 2013. The partnership group isevaluating development options for Block CA-2.
Vietnam
In November 2012, the Company signed a production sharing contract with Vietnam National Oil and Gas Groupand PetroVietnam Exploration Production Company, whereby it acquired 65% interest and operatorship ofBlocks 144 and 145. The blocks cover approximately 4.42 million gross acres and are located in the outerPhu Khanh Basin. The Company licensed existing 2D seismic for these blocks in 2013.
In late 2012, the Company was granted Vietnam’s government approval to acquire a 60% working interest andoperatorship of Block 11-2/11 and the production sharing contract was signed in June 2013. The block covers677 thousand gross acres. The Company acquired 3D seismic and performed other geological and geophysicalstudies in this block in 2013.
In early 2014, the Company farmed into Block 13-03. The Company has a 20% working interest in thisconcession which covers 853,000 gross acres. Murphy is currently scheduled to spud a well in the block in mid2014.
Suriname
In December 2011, Murphy signed a production sharing contract with Suriname’s state oil company,Staatsolie Maatschappij Suriname N.V. (Staatsolie), whereby it acquired a 100% working interest andoperatorship of Block 48 offshore Suriname. The block encompasses 794 thousand gross acres with water depthsranging from 1,000 to 3,000 meters. The 30-year contract is divided into an exploration period and one or moredevelopment and production periods, and may be extended with mutual agreement of Murphy and Staatsolie.There are three phases of the exploration period, with each divided into two-year terms, thereby allowing theCompany to withdraw from the contract or enter into the next phase. Minimum work obligations vary duringeach exploration phase and may require either seismic data acquisition or drilling of an exploratory well.Staatsolie has the right to join in the development and production of each commercial field within the contractarea with up to a 20% participation. In early 2014, Murphy farmed out a portion of its working interest inBlock 48, thereby reducing its interest from 100% to 50%.
Cameroon
In October 2011, Murphy was granted government approval to acquire a 50% working interest and operatorshipof the Ntem concession. The working interest was acquired through a farm-out agreement of the existingproduction sharing contract. The Ntem block, situated in the Douala Basin offshore Cameroon, encompasses
6
573 thousand gross acres, with water depths ranging from 300 to 1,900 meters. The concession was in forcemajeure until January 2014. With force majeure lifted, there are 15 months of the first renewal period remainingwhich can be extended for a further two years under the second renewal period option in the contract. Each of therenewal periods requires a minimum work obligation involving the drilling of exploratory wells. The Companyspud a well on the Ntem prospect in February 2014.
In 2012, Murphy acquired a 50% non-operated interest in the Elombo production sharing contract, immediatelyadjacent to the Ntem concession. The Elombo block, situated in the Douala Basin offshore Cameroon, betweenthe shoreline and the Ntem block, encompasses 594 thousand gross acres with water depths ranging up to 1,100meters. The initial exploration period was for three years and was scheduled to end in March 2013. Prior to theend of the initial period the Company drilled a shallow well which was unsuccessful. The initial explorationperiod was extended for two years through March 2015 with an obligation for one well. The exploration periodmay be extended one more time for an additional two years with a further one-well obligation. Murphy drilled anunsuccessful deepwater well in the block in 2013 as part of the obligations under the agreement.
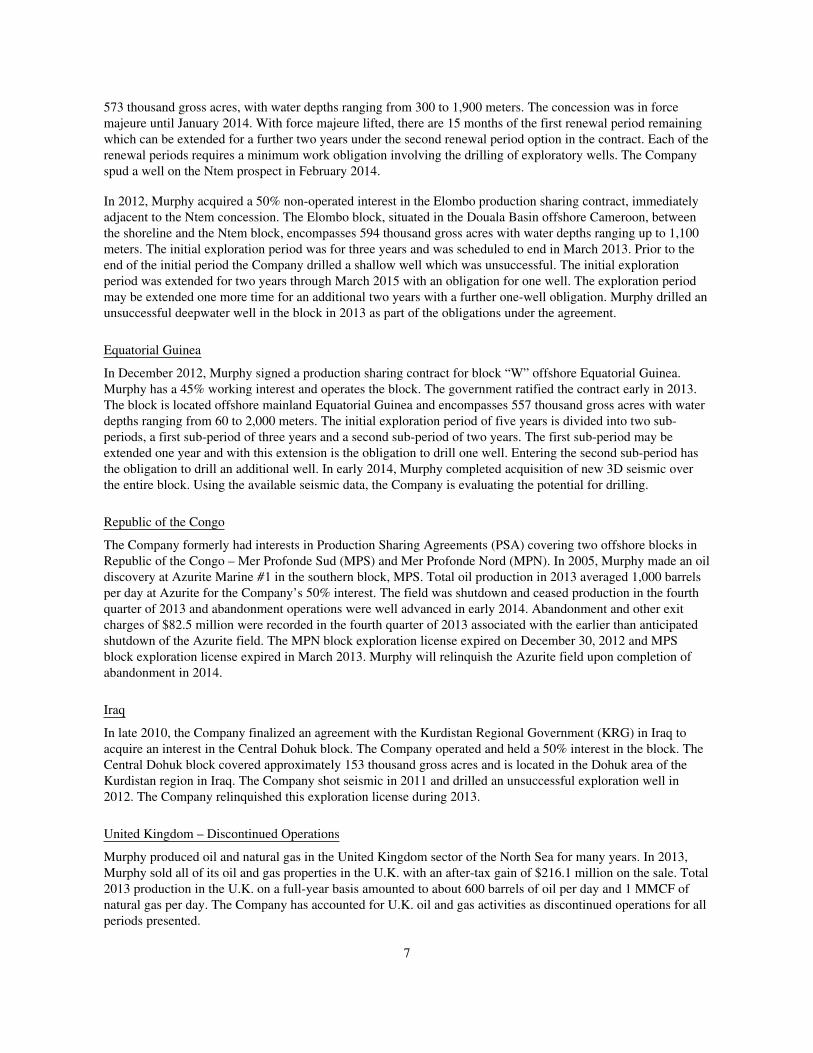
Equatorial Guinea
In December 2012, Murphy signed a production sharing contract for block “W” offshore Equatorial Guinea.Murphy has a 45% working interest and operates the block. The government ratified the contract early in 2013.The block is located offshore mainland Equatorial Guinea and encompasses 557 thousand gross acres with waterdepths ranging from 60 to 2,000 meters. The initial exploration period of five years is divided into two sub-periods, a first sub-period of three years and a second sub-period of two years. The first sub-period may beextended one year and with this extension is the obligation to drill one well. Entering the second sub-period hasthe obligation to drill an additional well. In early 2014, Murphy completed acquisition of new 3D seismic overthe entire block. Using the available seismic data, the Company is evaluating the potential for drilling.
Republic of the Congo
The Company formerly had interests in Production Sharing Agreements (PSA) covering two offshore blocks inRepublic of the Congo – Mer Profonde Sud (MPS) and Mer Profonde Nord (MPN). In 2005, Murphy made an oildiscovery at Azurite Marine #1 in the southern block, MPS. Total oil production in 2013 averaged 1,000 barrelsper day at Azurite for the Company’s 50% interest. The field was shutdown and ceased production in the fourthquarter of 2013 and abandonment operations were well advanced in early 2014. Abandonment and other exitcharges of $82.5 million were recorded in the fourth quarter of 2013 associated with the earlier than anticipatedshutdown of the Azurite field. The MPN block exploration license expired on December 30, 2012 and MPSblock exploration license expired in March 2013. Murphy will relinquish the Azurite field upon completion ofabandonment in 2014.
Iraq
In late 2010, the Company finalized an agreement with the Kurdistan Regional Government (KRG) in Iraq toacquire an interest in the Central Dohuk block. The Company operated and held a 50% interest in the block. TheCentral Dohuk block covered approximately 153 thousand gross acres and is located in the Dohuk area of theKurdistan region in Iraq. The Company shot seismic in 2011 and drilled an unsuccessful exploration well in2012. The Company relinquished this exploration license during 2013.
United Kingdom – Discontinued Operations
Murphy produced oil and natural gas in the United Kingdom sector of the North Sea for many years. In 2013,Murphy sold all of its oil and gas properties in the U.K. with an after-tax gain of $216.1 million on the sale. Total2013 production in the U.K. on a full-year basis amounted to about 600 barrels of oil per day and 1 MMCF ofnatural gas per day. The Company has accounted for U.K. oil and gas activities as discontinued operations for allperiods presented.
7
Ecuador – Discontinued Operations
Murphy sold its 20% working interest in Block 16, Ecuador in March 2009. The Company has accounted for allEcuador operations as discontinued operations. In October 2007, the government of Ecuador passed a law thatincreased its share of revenue for sales prices that exceed a base price (about $23.36 per barrel at December 31,2008) from 50% to 99%. The government had previously enacted a 50% revenue sharing rate in April 2006. TheCompany initiated arbitration proceedings against the government in one international jurisdiction claiming thatthe government did not have the right under the contract to enact the revenue sharing provision. In 2010, thearbitration panel determined that it lacked jurisdiction over the claim due to technicalities. The arbitration wasrefiled in 2011 under a different international jurisdiction and present activities involve preparation for a hearingon the merits of the filing. The arbitration proceeding is likely to take many months to reach conclusion. TheCompany’s total claim in the arbitration process is approximately $118 million.
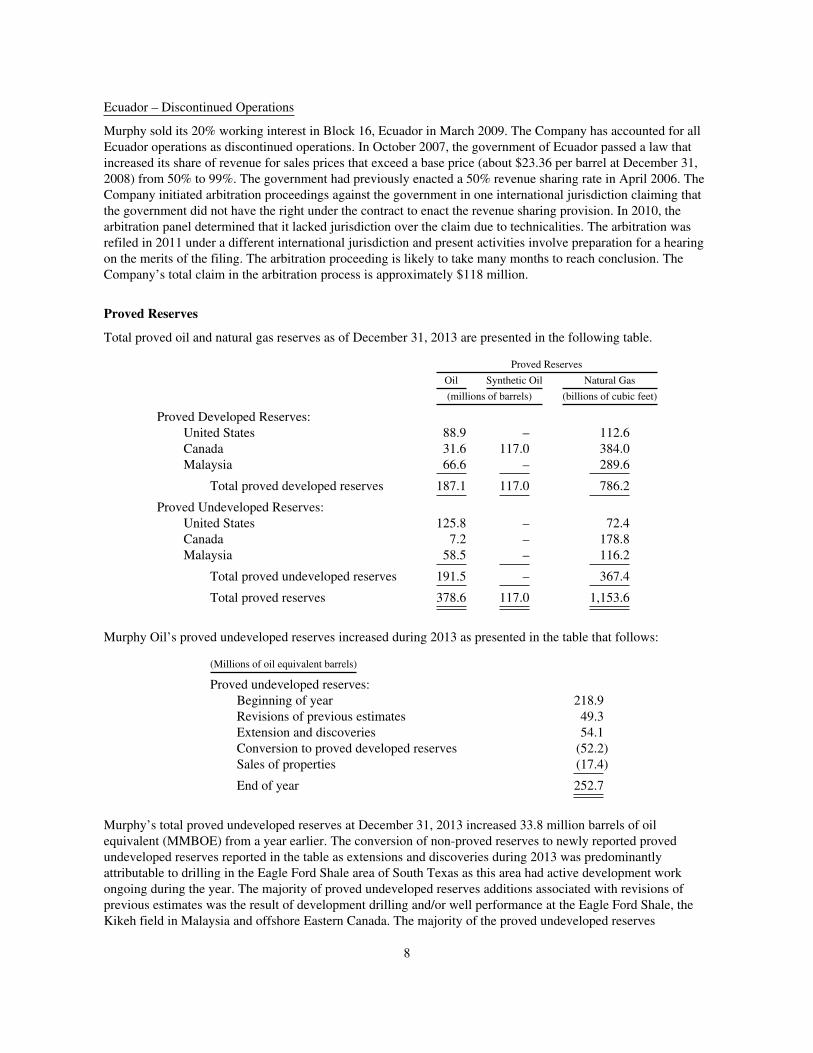
Proved Reserves
Total proved oil and natural gas reserves as of December 31, 2013 are presented in the following table.
Proved Reserves
Oil Synthetic Oil Natural Gas
(millions of barrels) (billions of cubic feet)
Proved Developed Reserves:United States 88.9 – 112.6Canada 31.6 117.0 384.0Malaysia 66.6 – 289.6
Total proved developed reserves 187.1 117.0 786.2
Proved Undeveloped Reserves:United States 125.8 – 72.4Canada 7.2 – 178.8Malaysia 58.5 – 116.2
Total proved undeveloped reserves 191.5 – 367.4
Total proved reserves 378.6 117.0 1,153.6
Murphy Oil’s proved undeveloped reserves increased during 2013 as presented in the table that follows:
(Millions of oil equivalent barrels)
Proved undeveloped reserves:Beginning of year 218.9Revisions of previous estimates 49.3Extension and discoveries 54.1Conversion to proved developed reserves (52.2)Sales of properties (17.4)
End of year 252.7
Murphy’s total proved undeveloped reserves at December 31, 2013 increased 33.8 million barrels of oilequivalent (MMBOE) from a year earlier. The conversion of non-proved reserves to newly reported provedundeveloped reserves reported in the table as extensions and discoveries during 2013 was predominantlyattributable to drilling in the Eagle Ford Shale area of South Texas as this area had active development workongoing during the year. The majority of proved undeveloped reserves additions associated with revisions ofprevious estimates was the result of development drilling and/or well performance at the Eagle Ford Shale, theKikeh field in Malaysia and offshore Eastern Canada. The majority of the proved undeveloped reserves
8
migration to the proved developed category occurred in the Eagle Ford Shale. The Company sold all of its U.K.oil and gas properties during the first half of 2013 which led to a reduction of proved undeveloped reserves of17.4 million barrels equivalent during the year. The Company spent approximately $1.2 billion in 2013 toconvert proved undeveloped reserves to proved developed reserves. The Company expects to spend about$1.1 billion in 2014, $1.0 billion in 2015 and $1.1 billion in 2016 to move currently undeveloped proved reservesto the developed category. The anticipated level of spend in 2014 includes significant drilling in severallocations, primarily in the Eagle Ford Shale area. In computing MMBOE, natural gas is converted to equivalentbarrels of oil using a ratio of six thousand cubic feet (MCF) to one barrel of oil.
At December 31, 2013, proved reserves are included for several development projects, including oil developments atthe Eagle Ford Shale in South Texas and the Kakap-Gumusut, Kikeh and Siakap North-Petai fields, offshore Sabah,Malaysia as well as a natural gas development offshore Sarawak, Malaysia. Total proved undeveloped reservesassociated with various development projects at December 31, 2013 were approximately 253 MMBOE, which is 37%of the Company’s total proved reserves. Certain of these development projects have proved undeveloped reserves thatwill take more than five years to bring to production. Three such projects have significant levels of such provedundeveloped reserves. The Company operates a deepwater field in the Gulf of Mexico that has two undevelopedlocations that exceed this five-year window. Total reserves associated with the two wells amount to less than 1% of theCompany’s total proved reserves at year-end 2013. The development of certain of this field’s reserves stretches beyondfive years due to limited well slots available on the production platform, thus making it necessary to wait for depletionof other wells prior to initiating further development of these two locations. The Kakap-Gumusut field oil developmentproject has undeveloped proved reserves that make up 5% of the Company’s total proved reserves at year-end 2013.This non-operated project has taken longer than five years to develop due to long lead-time equipment required tocomplete the development process in the deep waters offshore Sabah Malaysia. Full field start up is expected in 2014.The third project that will take more than five years to develop is offshore Malaysia and makes up approximately 2%of the Company’s total proved reserves at year-end 2013. This project is an extension of the Sarawak natural gasproject and should be on production in 2014 once current project production volumes decline.
Murphy Oil’s Reserves Processes and Policies
The Company employs a Manager of Corporate Reserves (Manager) who is independent of the Company’s oiland gas management. The Manager reports to a Vice President of Murphy Oil Corporation, who in turn reportsdirectly to the President and Chief Executive Officer of Murphy Oil. The Manager makes presentations to theBoard of Directors periodically about the Company’s reserves. The Manager reviews and discusses reservesestimates directly with the Company’s reservoir engineering staff in order to make every effort to ensurecompliance with the rules and regulations of the SEC and industry. The Manager coordinates and overseesreserves audits. These audits are performed annually and target coverage of approximately one-third of Companyreserves each year. The audits are performed by the Manager and qualified engineering staff from areas of theCompany other than the area being audited. The Manager may also utilize qualified independent reservesconsultants to assist with the internal audits or to perform separate audits as considered appropriate.
Each significant exploration and production office maintains one or more Qualified Reserve Estimators (QRE)on staff. The QRE is responsible for estimating and evaluating reserves and other reserves information for his orher assigned area. The QRE may personally make the estimates and evaluations of reserves or may supervise andapprove the estimation and evaluation thereof by others. A QRE is professionally qualified to perform thesereserves estimates due to having sufficient educational background, professional training and professionalexperience to enable him or her to exercise prudent professional judgment. Normally, this requires a minimum ofthree years practical experience in petroleum engineering or petroleum production geology, with at least one yearof such experience being in the estimation and evaluation of reserves, and either a bachelors or advanced degreein petroleum engineering, geology or other discipline of engineering or physical science from a college oruniversity of recognized stature, or the equivalent thereof from an appropriate government authority orprofessional organization.
9
Larger offices of the Company also employ a Regional Reserves Coordinator (RRC) who supervises the localQREs. The RRC is usually a senior QRE that has the primary responsibility for coordinating and submittingreserves information to senior management.
The Company’s QREs maintain files containing pertinent data regarding each significant reservoir. Each fileincludes sufficient data to support the calculations or analogies used to develop the values. Examples of dataincluded in the file, as appropriate, include: production histories; pertinent drilling and workover histories;bottom hole pressure data; volumetric, material balance, analogy or other pertinent reserve estimation data;production performance curves; narrative descriptions of the methods and logic used to determine reservesvalues; maps and logs; and a signed copy of the conclusion of the QRE stating, that in their opinion, the reserveshave been calculated, reviewed, documented and reported in compliance with the regulations and guidelinescontained in the reserves training manual. The Company’s reserves are maintained in an industry recognizedreservoir engineering software system, which has adequate access controls to avoid the possibility of impropermanipulation of data. When reserves calculations are completed by QREs and appropriately reviewed by RRCsand the Manager, the conclusions are reviewed and discussed with the head of the Company’s exploration andproduction business and other senior management as appropriate. The Company’s Controller’s department isresponsible for preparing and filing reserves schedules within Form 10-K.
Murphy provides annual training to all company reserves estimators to ensure SEC requirements associated withreserves estimation and associated Form 10-K reporting are fulfilled. The training includes materials provided toeach participant that outlines the latest guidance from the SEC as well as best practices for many engineering andgeologic matters related to reserves estimation.
Qualifications of Manager of Corporate Reserves
The Company believes that it has qualified employees preparing oil and gas reserves estimates. Mr. F. MichaelLasswell serves as Corporate Reserves Manager after joining the Company in 2012. Prior to joining Murphy,Mr. Lasswell was employed as a Regional Coordinator of reserves at a major integrated oil company. He workedin several capacities in the reservoir engineering department with the oil company from 2002 to 2012.Mr. Lasswell earned a Bachelors of Science degree in Civil Engineering and a Masters of Science degree inGeotechnical Engineering from Brigham Young University. Mr. Lasswell has experience working in thereservoir engineering field in numerous areas of the world, including the North Sea, the U.S. Arctic, the MiddleEast and Asia Pacific. He serves on the Society of Petroleum Engineers (SPE) Oil and Gas Reserves Committee(OGRC) and is also co-author of a paper on the Recognition of Reserves which was published by the SPE.Mr. Lasswell has also attended numerous industry training courses.
More information regarding Murphy’s estimated quantities of proved oil and gas reserves for the last three yearsare presented by geographic area on pages F-52 through F-55 of this Form 10-K report. Murphy has not filed andis not required to file any estimates of its total proved oil or gas reserves on a recurring basis with any federal orforeign governmental regulatory authority or agency other than the U.S. Securities and Exchange Commission.Annually, Murphy reports gross reserves of properties operated in the United States to the U.S. Department ofEnergy; such reserves are derived from the same data from which estimated proved reserves of such propertiesare determined.
Crude oil, condensate and gas liquids production and sales, and natural gas sales by geographic area withweighted average sales prices for each of the seven years ended December 31, 2013 are shown on page 5 of the2013 Annual Report. In 2013, the Company’s production of oil and natural gas represented approximately 0.1%of worldwide totals.
Production expenses for the last three years in U.S. dollars per equivalent barrel are discussed beginning onpage 32 of this Form 10-K report. For purposes of these computations, natural gas sales volumes are converted toequivalent barrels of oil using a ratio of six MCF of natural gas to one barrel of oil.
10
Supplemental disclosures relating to oil and gas producing activities are reported on pages F-50 through F-60 ofthis Form 10-K report.
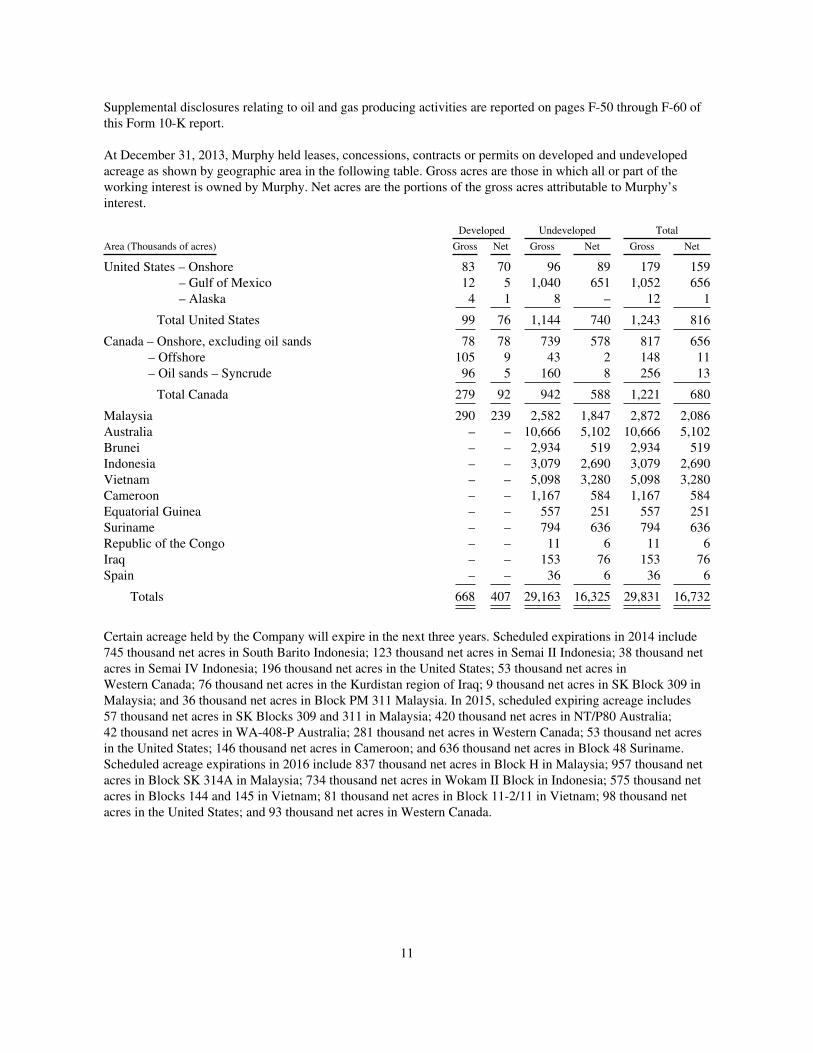
At December 31, 2013, Murphy held leases, concessions, contracts or permits on developed and undevelopedacreage as shown by geographic area in the following table. Gross acres are those in which all or part of theworking interest is owned by Murphy. Net acres are the portions of the gross acres attributable to Murphy’sinterest.
Developed Undeveloped Total
Area (Thousands of acres) Gross Net Gross Net Gross Net
United States – Onshore 83 70 96 89 179 159– Gulf of Mexico 12 5 1,040 651 1,052 656– Alaska 4 1 8 – 12 1
Total United States 99 76 1,144 740 1,243 816
Canada – Onshore, excluding oil sands 78 78 739 578 817 656– Offshore 105 9 43 2 148 11– Oil sands – Syncrude 96 5 160 8 256 13
Total Canada 279 92 942 588 1,221 680
Malaysia 290 239 2,582 1,847 2,872 2,086Australia – – 10,666 5,102 10,666 5,102Brunei – – 2,934 519 2,934 519Indonesia – – 3,079 2,690 3,079 2,690Vietnam – – 5,098 3,280 5,098 3,280Cameroon – – 1,167 584 1,167 584Equatorial Guinea – – 557 251 557 251Suriname – – 794 636 794 636Republic of the Congo – – 11 6 11 6Iraq – – 153 76 153 76Spain – – 36 6 36 6
Totals 668 407 29,163 16,325 29,831 16,732
Certain acreage held by the Company will expire in the next three years. Scheduled expirations in 2014 include745 thousand net acres in South Barito Indonesia; 123 thousand net acres in Semai II Indonesia; 38 thousand netacres in Semai IV Indonesia; 196 thousand net acres in the United States; 53 thousand net acres inWestern Canada; 76 thousand net acres in the Kurdistan region of Iraq; 9 thousand net acres in SK Block 309 inMalaysia; and 36 thousand net acres in Block PM 311 Malaysia. In 2015, scheduled expiring acreage includes57 thousand net acres in SK Blocks 309 and 311 in Malaysia; 420 thousand net acres in NT/P80 Australia;42 thousand net acres in WA-408-P Australia; 281 thousand net acres in Western Canada; 53 thousand net acresin the United States; 146 thousand net acres in Cameroon; and 636 thousand net acres in Block 48 Suriname.Scheduled acreage expirations in 2016 include 837 thousand net acres in Block H in Malaysia; 957 thousand netacres in Block SK 314A in Malaysia; 734 thousand net acres in Wokam II Block in Indonesia; 575 thousand netacres in Blocks 144 and 145 in Vietnam; 81 thousand net acres in Block 11-2/11 in Vietnam; 98 thousand netacres in the United States; and 93 thousand net acres in Western Canada.
11
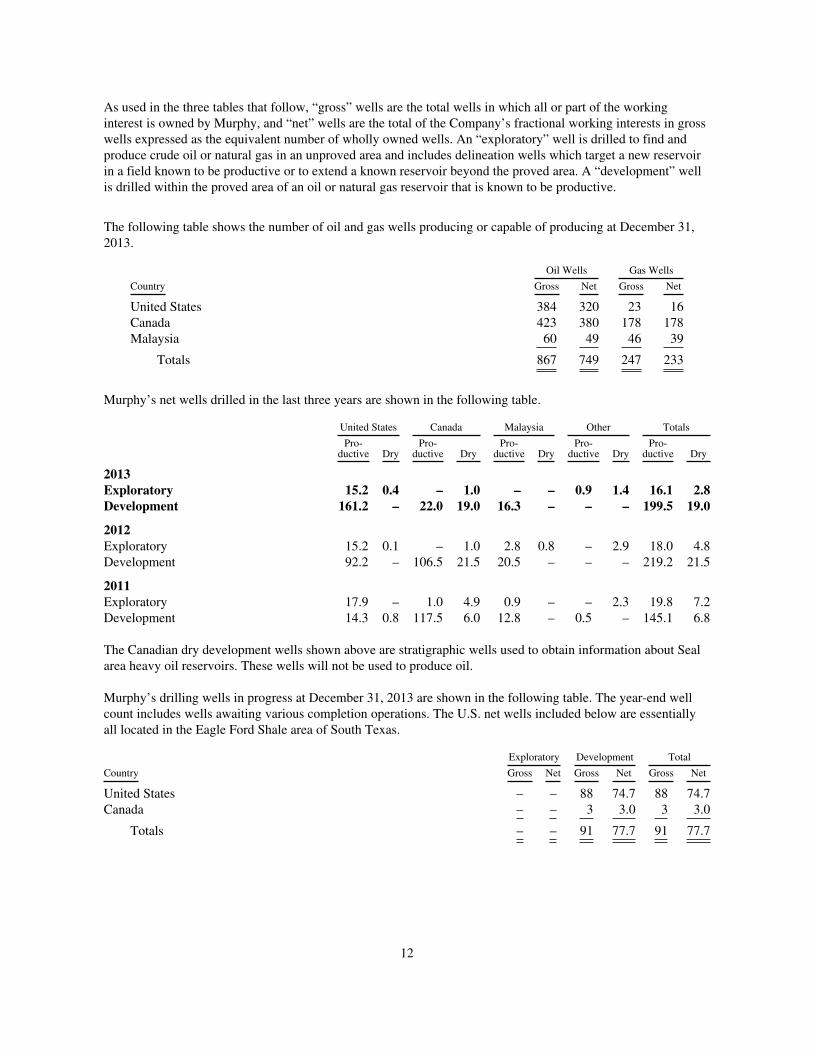
As used in the three tables that follow, “gross” wells are the total wells in which all or part of the workinginterest is owned by Murphy, and “net” wells are the total of the Company’s fractional working interests in grosswells expressed as the equivalent number of wholly owned wells. An “exploratory” well is drilled to find andproduce crude oil or natural gas in an unproved area and includes delineation wells which target a new reservoirin a field known to be productive or to extend a known reservoir beyond the proved area. A “development” wellis drilled within the proved area of an oil or natural gas reservoir that is known to be productive.
The following table shows the number of oil and gas wells producing or capable of producing at December 31,2013.
Oil Wells Gas Wells
Country Gross Net Gross Net
United States 384 320 23 16Canada 423 380 178 178Malaysia 60 49 46 39
Totals 867 749 247 233
Murphy’s net wells drilled in the last three years are shown in the following table.
United States Canada Malaysia Other Totals
Pro-ductive Dry
Pro-ductive Dry
Pro-ductive Dry
Pro-ductive Dry
Pro-ductive Dry
2013Exploratory 15.2 0.4 – 1.0 – – 0.9 1.4 16.1 2.8Development 161.2 – 22.0 19.0 16.3 – – – 199.5 19.0
2012Exploratory 15.2 0.1 – 1.0 2.8 0.8 – 2.9 18.0 4.8Development 92.2 – 106.5 21.5 20.5 – – – 219.2 21.5
2011Exploratory 17.9 – 1.0 4.9 0.9 – – 2.3 19.8 7.2Development 14.3 0.8 117.5 6.0 12.8 – 0.5 – 145.1 6.8
The Canadian dry development wells shown above are stratigraphic wells used to obtain information about Sealarea heavy oil reservoirs. These wells will not be used to produce oil.
Murphy’s drilling wells in progress at December 31, 2013 are shown in the following table. The year-end wellcount includes wells awaiting various completion operations. The U.S. net wells included below are essentiallyall located in the Eagle Ford Shale area of South Texas.
Exploratory Development Total
Country Gross Net Gross Net Gross Net
United States – – 88 74.7 88 74.7Canada – – 3 3.0 3 3.0
Totals – – 91 77.7 91 77.7
12
Refining and Marketing – Discontinued Operations
The Company completed the separation of its former retail marketing business in the United States during the year. OnAugust 30, 2013, the Company spun-off the U.S. downstream business through a distribution of 100% of the shares ofthis Company to shareholders of Murphy Oil. The new stand-alone, publicly owned company, which is now known asMurphy USA Inc. (MUSA), is listed on the New York Stock Exchange under the ticker symbol “MUSA”.
The Company has also announced its intention to sell its refining and marketing (“downstream”) business in theUnited Kingdom. The sale of the U.K. downstream business is subject to inherent risks and uncertainties. Factorsthat could cause this forecasted event not to occur are described in Item 1A on page 18 of this Form 10-K report.All of the results of the U.S. and U.K. downstream businesses have been reported as discontinued operations forall periods presented in this report.
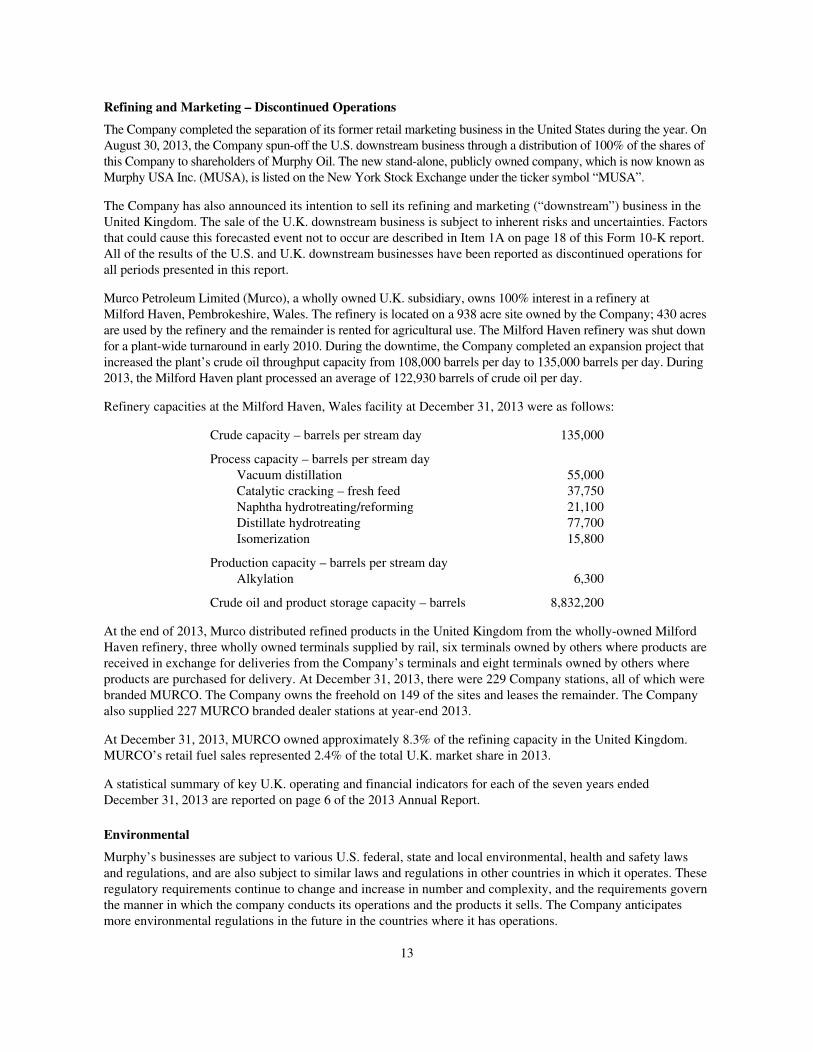
Murco Petroleum Limited (Murco), a wholly owned U.K. subsidiary, owns 100% interest in a refinery atMilford Haven, Pembrokeshire, Wales. The refinery is located on a 938 acre site owned by the Company; 430 acresare used by the refinery and the remainder is rented for agricultural use. The Milford Haven refinery was shut downfor a plant-wide turnaround in early 2010. During the downtime, the Company completed an expansion project thatincreased the plant’s crude oil throughput capacity from 108,000 barrels per day to 135,000 barrels per day. During2013, the Milford Haven plant processed an average of 122,930 barrels of crude oil per day.
Refinery capacities at the Milford Haven, Wales facility at December 31, 2013 were as follows:
Crude capacity – barrels per stream day 135,000
Process capacity – barrels per stream dayVacuum distillation 55,000Catalytic cracking – fresh feed 37,750Naphtha hydrotreating/reforming 21,100Distillate hydrotreating 77,700Isomerization 15,800
Production capacity – barrels per stream dayAlkylation 6,300
Crude oil and product storage capacity – barrels 8,832,200
At the end of 2013, Murco distributed refined products in the United Kingdom from the wholly-owned MilfordHaven refinery, three wholly owned terminals supplied by rail, six terminals owned by others where products arereceived in exchange for deliveries from the Company’s terminals and eight terminals owned by others whereproducts are purchased for delivery. At December 31, 2013, there were 229 Company stations, all of which werebranded MURCO. The Company owns the freehold on 149 of the sites and leases the remainder. The Companyalso supplied 227 MURCO branded dealer stations at year-end 2013.
At December 31, 2013, MURCO owned approximately 8.3% of the refining capacity in the United Kingdom.MURCO’s retail fuel sales represented 2.4% of the total U.K. market share in 2013.
A statistical summary of key U.K. operating and financial indicators for each of the seven years endedDecember 31, 2013 are reported on page 6 of the 2013 Annual Report.
Environmental
Murphy’s businesses are subject to various U.S. federal, state and local environmental, health and safety lawsand regulations, and are also subject to similar laws and regulations in other countries in which it operates. Theseregulatory requirements continue to change and increase in number and complexity, and the requirements governthe manner in which the company conducts its operations and the products it sells. The Company anticipatesmore environmental regulations in the future in the countries where it has operations.
13
Further information on environmental matters and their impact on Murphy are contained in Management’sDiscussion and Analysis of Financial Condition and Results of Operations on pages 42 through 46.
Web site Access to SEC Reports
Murphy Oil’s internet Web site address is http://www.murphyoilcorp.com. Information contained on theCompany’s Web site is not part of this report on Form 10-K.
The Company’s Annual Reports on Form 10-K, Quarterly Reports on Form 10-Q, Current Reports on Form 8-Kand any amendments to these reports filed or furnished pursuant to Section 13(a) or 15(d) of the SecuritiesExchange Act of 1934 are available on Murphy’s Web site, free of charge, as soon as reasonably practicable aftersuch reports are filed with, or furnished to, the SEC. You may also access these reports at the SEC’s Web site athttp://www.sec.gov.
Item 1A. RISK FACTORS
Murphy Oil’s businesses operate in highly competitive environments, which could adversely affect it inmany ways, including its profitability, its ability to grow, and its ability to manage its businesses.
Murphy operates in the oil and gas industry and experiences intense competition from other oil and gascompanies, which include state-owned foreign oil companies, major integrated oil companies, independentproducers of oil and natural gas and independent refining and marketing companies. Virtually all of the state-owned and major integrated oil companies and many of the independent producers and refiners that compete withthe Company have substantially greater resources than Murphy. In addition, the oil industry as a whole competeswith other industries in supplying energy requirements around the world. Murphy competes, among other things,for valuable acreage positions, exploration licenses, drilling equipment and human resources.
If Murphy cannot replace its oil and natural gas reserves, it may not be able to sustain or grow itsbusiness.
Murphy continually depletes its oil and natural gas reserves as production occurs. In order to sustain and grow itsbusiness, the Company must successfully replace the crude oil and natural gas it produces with additionalreserves. Therefore, it must create and maintain a portfolio of good prospects for future reserves additions andproduction by obtaining rights to explore for, develop and produce hydrocarbons in promising areas. In addition,it must find, develop and produce and/or purchase reserves at a competitive cost structure to be successful in thelong-term. Murphy’s ability to operate profitably in the exploration and production segments of its business,therefore, is dependent on its ability to find, develop and produce and/or purchase oil and natural gas reserves atcosts that are less than the realized sales price for these products and at costs competitive with competingcompanies in the industry.
Murphy’s proved reserves are based on the professional judgment of its engineers and may be subject torevision.
Proved oil and natural gas reserves included in this report on pages F-52 through F-55 have been prepared byqualified Company personnel or qualified independent engineers based on an unweighted average of oil andnatural gas prices in effect at the beginning of each month as well as other conditions and information availableat the time the estimates were prepared. Estimation of reserves is a subjective process that involves professionaljudgment by engineers about volumes to be recovered in future periods from underground oil and natural gasreservoirs. Estimates of economically recoverable oil and natural gas reserves and future net cash flows dependupon a number of variable factors and assumptions, and consequently, different engineers could arrive atdifferent estimates of reserves and future net cash flows based on the same available data and using industryaccepted engineering practices and scientific methods. Under existing SEC rules, reported proved reserves mustbe reasonably certain of recovery in future periods.
14
Murphy’s actual future oil and natural gas production may vary substantially from its reported quantity of provedreserves due to a number of factors, including:
• Oil and natural gas prices which are materially different than prices used to compute proved reserves
• Operating and/or capital costs which are materially different than those assumed to compute provedreserves
• Future reservoir performance which is materially different from models used to compute provedreserves, and
• Governmental regulations or actions which materially change operations of a field.
The Company’s proved undeveloped reserves represent significant portions of total proved reserves. As ofDecember 31, 2013, approximately 39% of the Company’s proved oil reserves and 32% of proved natural gasreserves are undeveloped. The ability of the Company to reclassify these undeveloped proved reserves to theproved developed classification is generally dependent on the successful completion of one or more operations,which might include further development drilling, construction of facilities or pipelines, and well workovers.
The discounted future net revenues from our proved reserves as reported on pages F-59 and F-60 should not beconsidered as the market value of the reserves attributable to our properties. As required by generally acceptedaccounting principles, the estimated discounted future net revenues from our proved reserves are based on anunweighted average of the oil and natural gas prices in effect at the beginning of each month during the year.Actual future prices and costs may be materially higher or lower than those used in the reserves computations. Inaddition, the 10 percent discount factor that is required to be used to calculate discounted future net revenues forreporting purposes under generally accepted accounting principles is not necessarily the most appropriatediscount factor based on our cost of capital and the risks associated with our business and the crude oil andnatural gas business in general.
Volatility in the global prices of oil, natural gas and petroleum products significantly affects theCompany’s operating results.
Among the most significant variables affecting the Company’s results of operations are the sales prices for crudeoil and natural gas that it produces. West Texas Intermediate (WTI) crude oil prices averaged about $98 perbarrel in 2013, compared to $94 per barrel in 2012 and $95 per barrel in 2011. Although WTI average prices in2013 were not significantly different than the two previous years, prices can be quite volatile as demonstrated bythe range of high and low prices during 2013 of about $110 per barrel and $87 per barrel, respectively. Theaverage NYMEX natural gas sales prices were $3.73 per thousand cubic feet (MCF) in 2013, up from $2.83 perMCF in 2012, but lower than the $4.03 per MCF average in 2011. This relatively low price for natural gas hurtthe Company’s profits in North America during the three years ended December 31, 2013. As demonstrated in2011 through 2013, the sales prices for oil and natural gas can be significantly different in U.S. marketscompared to markets in foreign locations. Certain of the Company’s crude oil production is heavy and more sourthan WTI quality crude; therefore, this crude oil usually sells at a discount to WTI and other light and sweetcrude oils. In addition, the sales prices for heavy and sour crude oils do not always move in relation to pricechanges for WTI and lighter/sweeter crude oils. Certain crude oils produced by the Company, including certainU.S. and Canadian crude oils and all crude oil produced in Malaysia, generally price off other oil indices thanWTI, and these indices are influenced by different supply and demand forces than those that affect the U.S. WTIprices. The most common crude oil indices used to price the Company’s crude include Louisiana Light Sweet(LLS), Brent and Malaysian crude oil indices. Certain natural gas production offshore Sarawak have been sold inrecent years at a premium to average North American natural gas prices due to pricing structures built into thesales contracts. Associated natural gas produced at fields in Block K offshore Sabah are sold at heavilydiscounted prices compared to North American gas prices as stipulated in the sales contract. The Companycannot predict how changes in the sales prices of oil and natural gas will affect its results of operations in futureperiods. The Company often seeks to hedge a portion of its exposure to the effects of changing prices of crude oiland natural gas by purchasing forwards, swaps and other forms of derivative contracts.
15
Exploration drilling results can significantly affect the Company’s operating results.
The Company generally drills numerous wildcat wells each year which subjects its exploration and productionoperating results to significant exposure to dry holes expense, which have adverse effects on, and create volatilityfor, the Company’s net income. In 2013, significant wildcat wells were primarily drilled offshore Cameroon,Brunei, Australia and in the Gulf of Mexico. The Company’s 2014 planned exploratory drilling program includeswells offshore in the Gulf of Mexico, Cameroon, Brunei, Australia, Vietnam and Indonesia.
Potential federal or state regulations regarding hydraulic fracturing could increase our costs and/orrestrict operating methods, which could adversely affect our production levels.
The Company uses a technique known as hydraulic fracturing whereby water, sand and other chemicals areinjected into deep oil and gas bearing reservoirs. This process creates fractures in the rock formation within thereservoir which enables oil and natural gas to migrate to the wellbore. The Company primarily uses thistechnique in the Eagle Ford Shale in South Texas and in Western Canada. This practice is generally regulated bythe states, but at times the U.S. has proposed regulation under the Safe Drinking Water Act. In June 2011, theState of Texas adopted a law requiring public disclosure of certain information regarding the components used inthe hydraulic fracturing process. The Provinces of British Columbia and Alberta have also issued regulationsrelated to hydraulic fracturing activities under their jurisdictions. It is possible that the states, the U.S., Canadianprovinces or certain municipalities may adopt further laws or regulations which could render the process lesseffective or drive up its costs. If any such action is taken in the future, our production levels could be adverselyaffected or our costs of drilling and completion could be increased.
Capital financing may not always be available to fund Murphy’s activities.
Murphy usually must spend and risk a significant amount of capital to find and develop reserves before revenueis generated from production. Although most capital needs are funded from operating cash flow, the timing ofcash flows from operations and capital funding needs may not always coincide, and the levels of cash flowgenerated by operations may not fully cover capital funding requirements. Therefore, the Company maintainsfinancing arrangements with lending institutions to meet certain funding needs. The Company must periodicallyrenew these financing arrangements based on foreseeable financing needs or as they expire. The Company’sprimary bank financing facility was renewed in 2011. In 2013, the Company increased the capacity of itsfinancing facility from $1.5 billion to $2.0 billion and extended the facility by one year such that it now expiresin June 2017. Although not considered likely, there is the possibility that financing arrangements may not alwaysbe available at sufficient levels required to fund the Company’s activities in future periods. The Company has ashelf registration statement on file with the U.S. Securities and Exchange Commission that permits the offer andsale of debt and/or equity securities through October 2015. Although not considered likely, the Company maynot be able in the future to sell notes at reasonable rates in the marketplace.
Murphy has limited or virtually no control over several factors that could adversely affect the Company.
The ability of the Company to successfully manage development and operating costs is important becausevirtually all of the products it sells are energy commodities such as crude oil, natural gas and refined products,for which the Company has little or no influence on the sales prices or regional and worldwide consumer demandfor these products. Economic slowdowns, such as those experienced in 2008 and 2009, had a detrimental effecton the worldwide demand for these energy commodities, which effectively led to reduced prices for oil, naturalgas and refined products for a period of time. Lower prices for crude oil and natural gas inevitably lead to lowerearnings for the Company. The Company also often experiences pressure on its operating and capitalexpenditures in periods of strong crude oil and natural gas prices because an increase in exploration andproduction activities due to high oil and gas sales prices generally leads to higher demand for, and consequentlyhigher costs for, goods and services in the oil and gas industry.
16
Many of the Company’s major oil and natural gas producing properties are operated by others. Therefore, Murphydoes not fully control all activities at certain of its significant revenue generating properties. During 2013,approximately 16% of the Company’s total production was at fields operated by others, while at December 31,2013, approximately 27% of the Company’s total proved reserves were at fields operated by others.
Murphy’s operations and earnings have been and will continue to be affected by worldwide politicaldevelopments.
Many governments, including those that are members of the Organization of Petroleum Exporting Countries(OPEC), unilaterally intervene at times in the orderly market of crude oil and natural gas produced in theircountries through such actions as setting prices, determining rates of production, and controlling who may buyand sell the production. As of December 31, 2013, approximately 28% of proved reserves, as defined by the U.S.Securities and Exchange Commission, were located in countries other than the U.S. and Canada. Certain of thereserves held outside these two countries could be considered to have more political risk. In addition, prices andavailability of crude oil, natural gas and refined products could be influenced by political unrest and by variousgovernmental policies to restrict or increase petroleum usage and supply. Other governmental actions that couldaffect Murphy’s operations and earnings include expropriation, tax changes, royalty increases, redefinition ofinternational boundaries, preferential and discriminatory awarding of oil and gas leases, restrictions on drillingand/or production, restraints and controls on imports and exports, safety, and relationships between employersand employees. Governments could also initiate regulations concerning matters such as currency fluctuations,protection and remediation of the environment, and concerns over the possibility of global warming beingaffected by human activity including the production and use of hydrocarbon energy. Additionally, because of thenumerous countries in which the Company operates, certain other risks exist, including the application of theU.S. Foreign Corrupt Practices Act, the Canada Corruption of Foreign Officials Act, the Malaysia Anti-Corruption Commission Act, the U.K. Bribery Act, and similar anti-corruption compliance statutes. Becausethese and other factors too numerous to list are subject to changes caused by governmental and politicalconsiderations and are often made in response to changing internal and worldwide economic conditions and toactions of other governments or specific events, it is not practical to attempt to predict the effects of such factorson Murphy’s future operations and earnings.
Murphy’s business is subject to operational hazards and risks normally associated with the exploration forand production of oil and natural gas and the refining and marketing of crude oil and petroleum products.
The Company operates in urban and remote, and often inhospitable, areas around the world. The occurrence of anevent, including but not limited to acts of nature such as hurricanes, floods, earthquakes and other forms of severeweather, and mechanical equipment failures, industrial accidents, fires, explosions, acts of war, civil unrest, piracy andacts of terrorism could result in the loss of hydrocarbons and associated revenues, environmental pollution orcontamination, and personal injury, including death, for which the Company could be deemed to be liable, and whichcould subject the Company to substantial fines and/or claims for punitive damages.
In April 2010, a drilling accident and subsequent oil spill occurred in the Gulf of Mexico at the Macondo wellowned by other companies. Impacts of the accident and oil spill include additional regulations covering offshoredrilling operations, a general lengthening in the time required for regulatory permitting, and higher costs forfuture drilling operations and offshore insurance. Additional regulations, possible further permitting delays andother restrictions associated with drilling and similar operations in the Gulf of Mexico could have an adverseaffect on the Company’s future costs of oil and natural gas produced in this area.
The location of many of Murphy’s key assets causes the Company to be vulnerable to severe weather, includinghurricanes and tropical storms. A number of significant oil and natural gas fields lie in offshore waters around theworld. Probably the most vulnerable of the Company’s offshore fields are in the U.S. Gulf of Mexico, where severehurricanes and tropical storms have often led to shutdowns and damages. The U.S. hurricane season runs from Junethrough November. Although the Company maintains insurance for such risks as described elsewhere in this Form10-K report, due to policy deductibles and possible coverage limits, weather-related risks are not fully insured.
17
Murphy may be unable to complete its announced reorganization plan.
The Company has announced the intended sale of its U.K. downstream business. Factors that could cause thisevent not to occur include, but are not limited to, a failure to obtain necessary regulatory approvals, adeterioration in the business or prospects of Murphy or its subsidiaries, adverse developments in Murphy or itssubsidiaries’ markets, adverse developments in the U.S. or global capital markets, credit markets or economiesgenerally or a failure to execute a sale of the U.K. downstream operations on acceptable terms.
With the separation of its U.S. downstream operations, and the intended sale of its U.K. downstreambusiness, Murphy will have fewer cash flow generating assets to service its debt.
With the separation of the Company’s U.S. downstream assets, Murphy no longer has the cash flow generatedfrom these assets to make interest and principal payments on its debt. Similarly, if the proposed sale of Murphy’sU.K. downstream operations is completed, the Company will no longer have ongoing cash flows generated fromthese assets to service its debt. If Murphy’s remaining exploration and production business is not successful as astand-alone company, the Company may not have sufficient cash flow needed to make interest payments onoutstanding notes, repay the notes at maturity or refinance the notes on acceptable terms, if at all.
Murphy’s insurance may not be adequate to offset costs associated with certain events and there can be noassurance that insurance coverage will continue to be available in the future on terms that justify itspurchase.
Murphy maintains insurance against certain, but not all, hazards that could arise from its operations. TheCompany maintains liability insurance sufficient to cover its share of gross insured claim costs up toapproximately $700 million per occurrence and in the annual aggregate. These policies have up to $10 million indeductibles. Generally, this insurance covers various types of third party claims related to personal injury, deathand property damage, including claims arising from “sudden and accidental” pollution events. The Company alsomaintains insurance coverage with an additional limit of $300 million per occurrence ($750 million for Gulf ofMexico operations not related to a named windstorm), all or part of which could be applicable to certain suddenand accidental pollution events. The occurrence of an event that is not insured or not fully insured could have amaterial adverse effect on the Company’s financial condition and results of operations in the future.
Lawsuits against Murphy and its subsidiaries could adversely affect its operating results.
The Company is involved in numerous lawsuits seeking cash settlements for alleged personal injuries, propertydamages and other business-related matters. Certain of these lawsuits will take many years to resolve throughcourt proceedings or negotiated settlements. None of these lawsuits are considered individually material oraggregate to a material amount in the opinion of management.
The Company is exposed to credit risks associated with sales of certain of its products to third parties.
Although Murphy limits its credit risk by selling its products to numerous entities worldwide, it still, at times,carries substantial credit risk from its customers. For certain oil and gas properties operated by the Company,other companies which own partial interests may not be able to meet their financial obligation to pay for theirshare of capital and operating costs as they come due. The inability of a purchaser of the Company’s oil ornatural gas or a partner of the Company to meet their respective payment obligations to the Company could havean adverse effect on Murphy’s future earnings and cash flows.
Murphy’s operations could be adversely affected by changes in foreign currency conversion rates.
The Company’s worldwide operational scope exposes it to risks associated with foreign currencies. Most of theCompany’s business is transacted in U.S. dollars, therefore, the Company and most of its subsidiaries are U.S.dollar functional entities for accounting purposes. However, the Canadian dollar is the functional currency for all
18
Canadian operations and the British pound is the functional currency for U.K. refining and marketing operations.In certain countries, such as Malaysia, the United Kingdom and Canada, significant levels of transactions occurin currencies other than the functional currency. In Malaysia, such transactions include tax payments, while inthe U.K., virtually all crude oil feedstock purchases and certain bulk product sales are priced in U.S. dollars, andin Canada, certain crude oil sales are priced in U.S. dollars. This exposure to currencies other than the functionalcurrency can lead to significant impacts on consolidated financial results. In Malaysia, known future taxpayments based in local currency are often hedged with contracts that match tax payment amounts and dates tolock in the exchange rate between the U.S. dollar and Malaysian ringgit. Exposures associated with deferredincome tax liability balances in Malaysia are not hedged. A strengthening of the Malaysian ringgit against theU.S. dollar would be expected to lead to currency losses in consolidated income; gains would be expected inincome if the ringgit weakens versus the dollar. Foreign exchange exposures between the U.S. dollar and theBritish pound are not hedged due to the frequency and volatility of U.S. dollar transactions in the U.K.downstream business. The Company would generally expect to incur currency losses when the U.S. dollarstrengthens against the British pound and would conversely expect currency gains when the U.S. dollar weakensagainst the pound. In Canada, currency risk is often managed by selling forward U.S. dollars to match thecollection dates for crude oil sold in that currency. See Note K in the consolidated financial statements foradditional information on derivative contracts.
The costs and funding requirements related to the Company’s retirement plans are affected by severalfactors.
A number of actuarial assumptions impact funding requirements for the Company’s retirement plans. The mostsignificant of these assumptions include return on assets, long-term interest rates and mortality. If the actualresults for the plans vary significantly from the actuarial assumptions used, or if laws regulating such retirementplans are changed, Murphy could be required to make more significant funding payments to one or more of itsretirement plans in the future and/or it could be required to record a larger liability for future obligations in itsConsolidated Balance Sheet.
Item 1B. UNRESOLVED STAFF COMMENTS
The Company had no unresolved comments from the staff of the U.S. Securities and Exchange Commission as ofDecember 31, 2013.
Item 2. PROPERTIES
Descriptions of the Company’s oil and natural gas properties and refining and marketing operations are includedin Item 1 of this Form 10-K report beginning on page 1. Information required by the Securities Exchange ActIndustry Guide No. 2 can be found in the Supplemental Oil and Gas Information section of this Annual Report onForm 10-K on pages F-50 to F-60 and in Note D – Property, Plant and Equipment beginning on page F-18.
19
Executive Officers of the Registrant
Present corporate office, length of service in office and age at February 1, 2014 of each of the Company’sexecutive officers are reported in the following listing. Executive officers are elected annually but may beremoved from office at any time by the Board of Directors.
Roger W. Jenkins – Age 52; Chief Executive Officer since August 2013. Mr. Jenkins served as Chief OperatingOfficer from June 2012 to August 2013. Mr. Jenkins was Executive Vice President Exploration and Productionfrom August 2009 through August 2013 and has served as President of the Company’s exploration andproduction subsidiary since January 2009. He was Senior Vice President, North America for this subsidiary fromSeptember 2007 to December 2008.
Kevin G. Fitzgerald – Age 58; Executive Vice President and Chief Financial Officer since December 2011.Mr. Fitzgerald was Senior Vice President and CFO from January 2007 to November 2011. He served asTreasurer from July 2001 through December 2006.
Walter K. Compton – Age 51; Executive Vice President and General Counsel since February 2014. Mr. Comptonwas Senior Vice President and General Counsel from March 2011 to February 2014. He was Vice President, Lawfrom February 2009 to February 2011 and was Manager, Law from November 1996 to January 2009.
Thomas McKinlay – Age 50; Executive Vice President, U.K. Downstream since January 2013. Mr. McKinlaywas Executive Vice President, Worldwide Downstream from January 2011 to January 2013 and Vice President,U.S. Manufacturing from August 2009 to January 2011. Mr. McKinlay was President of the Company’s U.S.refining and marketing subsidiary from January 2011 to January 2013, and was Vice President, Supply andTransportation of this subsidiary from April 2009 to January 2011. From August 2008 to March 2009,Mr. McKinlay was General Manager, Supply and Transportation of this U.S. subsidiary, and from January 2007to August 2008 was Supply Director for the Company’s U.K. refining and marketing subsidiary.
Bill H. Stobaugh – Age 62; Executive Vice President since February 2012. Mr. Stobaugh was Senior VicePresident from February 2005 to January 2012.
John W. Eckart – Age 55; Senior Vice President and Controller since December 2011. Mr. Eckart was VicePresident and Controller from January 2007 to November 2011, and has served as Controller since March 2000.
Kelli M. Hammock – Age 42; Senior Vice President, Administration since February 2014. Ms. Hammock wasVice President, Administration from December 2009 to February 2014 and was General Manager,Administration from June 2006 to November 2009.
Tim F. Butler – Age 51; Vice President, Tax since August 2013. Mr. Butler was General Manager, WorldwideTaxation from August 2007 to August 2013.
John W. Dumas – Age 59; Vice President, Corporate Insurance since February 2014. Mr. Dumas was Director,Corporate Insurance for the Company from 2005 to 2014.
Barry F.R. Jeffery – Age 55; Vice President, Investor Relations since August 2013. Mr. Jeffery was Director,Investor Relations from September 2010 to August 2013. Mr. Jeffery served as General Manager, BusinessDevelopment for the Company’s former U.S. downstream subsidiary from November 2009 to August 2010 andwas Manager, Crude Supply for this subsidiary from February 2007 to November 2009.
Allan J. Misner – Age 47; Vice President, Internal Audit since February 2014. Mr. Misner served as Director,Internal Audit from 2007 to 2014.
20
K. Todd Montgomery – Age 49; Vice President, Corporate Planning & Services since February 2014.Mr. Montgomery joined the Company in 2014 following 25 years of experience with another major independentoil company. With his prior employer, Mr. Montgomery’s duties included responsibilities covering globalproduction, reservoir engineering, strategic planning and development.
E. Ted Botner – Age 48; Secretary since August 2013. Mr. Botner has served as Manager, Law since August2013. He was Senior Attorney from February 2010 to August 2013 and was General Manager, Malaysia for theCompany’s exploration and production subsidiary from July 2007 to January 2010.
John B. Gardner – Age 45; Treasurer since August 2013. Mr. Gardner was Assistant Treasurer from January2012 to August 2013. He was Director of Planning and Special Projects for the Company’s U.K. downstreamsubsidiary from March 2010 to December 2011, and was Controller USA for the Company’s U.S. explorationand production subsidiary from January 2008 to February 2010.
Item 3. LEGAL PROCEEDINGS
Murphy and its subsidiaries are engaged in a number of other legal proceedings, all of which Murphy considersroutine and incidental to its business. Based on information currently available to the Company, the ultimateresolution of matters referred to in this item is not expected to have a material adverse effect on the Company’snet income, financial condition or liquidity in a future period.
Item 4. MINE SAFETY DISCLOSURES
Not applicable.
21
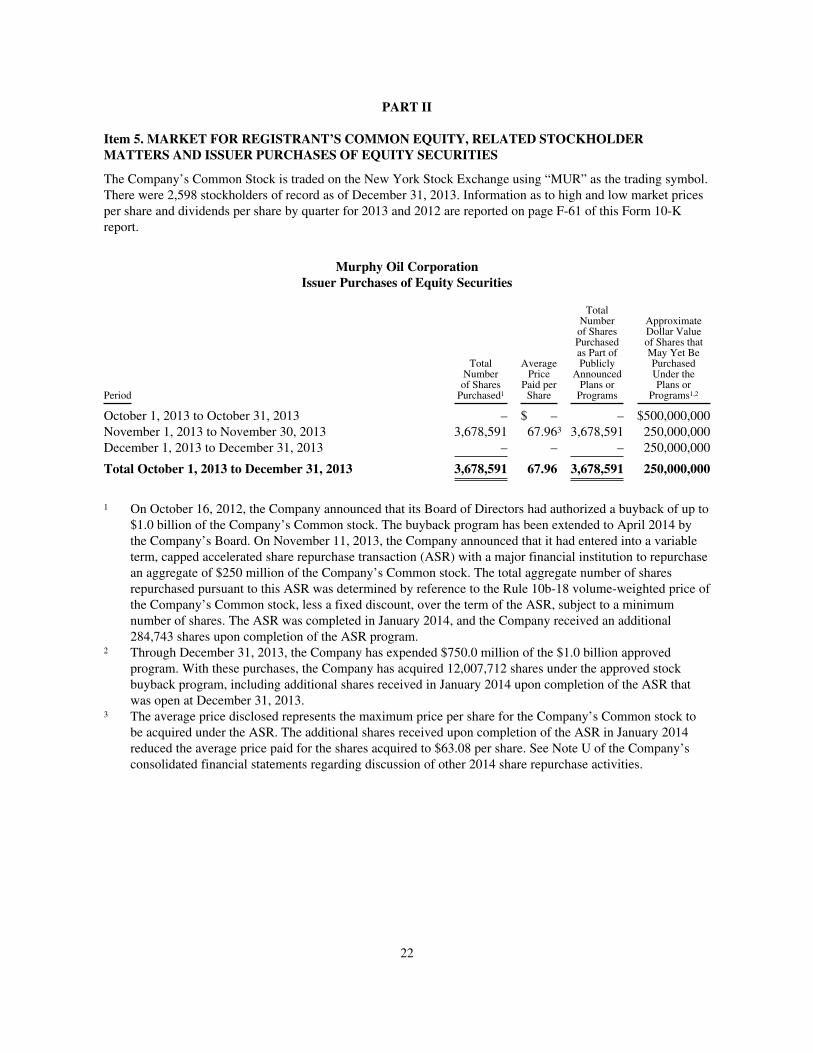
PART II
Item 5. MARKET FOR REGISTRANT’S COMMON EQUITY, RELATED STOCKHOLDERMATTERS AND ISSUER PURCHASES OF EQUITY SECURITIES
The Company’s Common Stock is traded on the New York Stock Exchange using “MUR” as the trading symbol.There were 2,598 stockholders of record as of December 31, 2013. Information as to high and low market pricesper share and dividends per share by quarter for 2013 and 2012 are reported on page F-61 of this Form 10-Kreport.
Murphy Oil CorporationIssuer Purchases of Equity Securities
Period
TotalNumberof SharesPurchased1
AveragePrice
Paid perShare
TotalNumberof SharesPurchasedas Part ofPublicly
AnnouncedPlans orPrograms
ApproximateDollar Valueof Shares thatMay Yet BePurchasedUnder thePlans or
Programs1,2
October 1, 2013 to October 31, 2013 – $ – – $500,000,000November 1, 2013 to November 30, 2013 3,678,591 67.963 3,678,591 250,000,000December 1, 2013 to December 31, 2013 – – – 250,000,000
Total October 1, 2013 to December 31, 2013 3,678,591 67.96 3,678,591 250,000,000
1 On October 16, 2012, the Company announced that its Board of Directors had authorized a buyback of up to$1.0 billion of the Company’s Common stock. The buyback program has been extended to April 2014 bythe Company’s Board. On November 11, 2013, the Company announced that it had entered into a variableterm, capped accelerated share repurchase transaction (ASR) with a major financial institution to repurchasean aggregate of $250 million of the Company’s Common stock. The total aggregate number of sharesrepurchased pursuant to this ASR was determined by reference to the Rule 10b-18 volume-weighted price ofthe Company’s Common stock, less a fixed discount, over the term of the ASR, subject to a minimumnumber of shares. The ASR was completed in January 2014, and the Company received an additional284,743 shares upon completion of the ASR program.
2 Through December 31, 2013, the Company has expended $750.0 million of the $1.0 billion approvedprogram. With these purchases, the Company has acquired 12,007,712 shares under the approved stockbuyback program, including additional shares received in January 2014 upon completion of the ASR thatwas open at December 31, 2013.
3 The average price disclosed represents the maximum price per share for the Company’s Common stock tobe acquired under the ASR. The additional shares received upon completion of the ASR in January 2014reduced the average price paid for the shares acquired to $63.08 per share. See Note U of the Company’sconsolidated financial statements regarding discussion of other 2014 share repurchase activities.
22
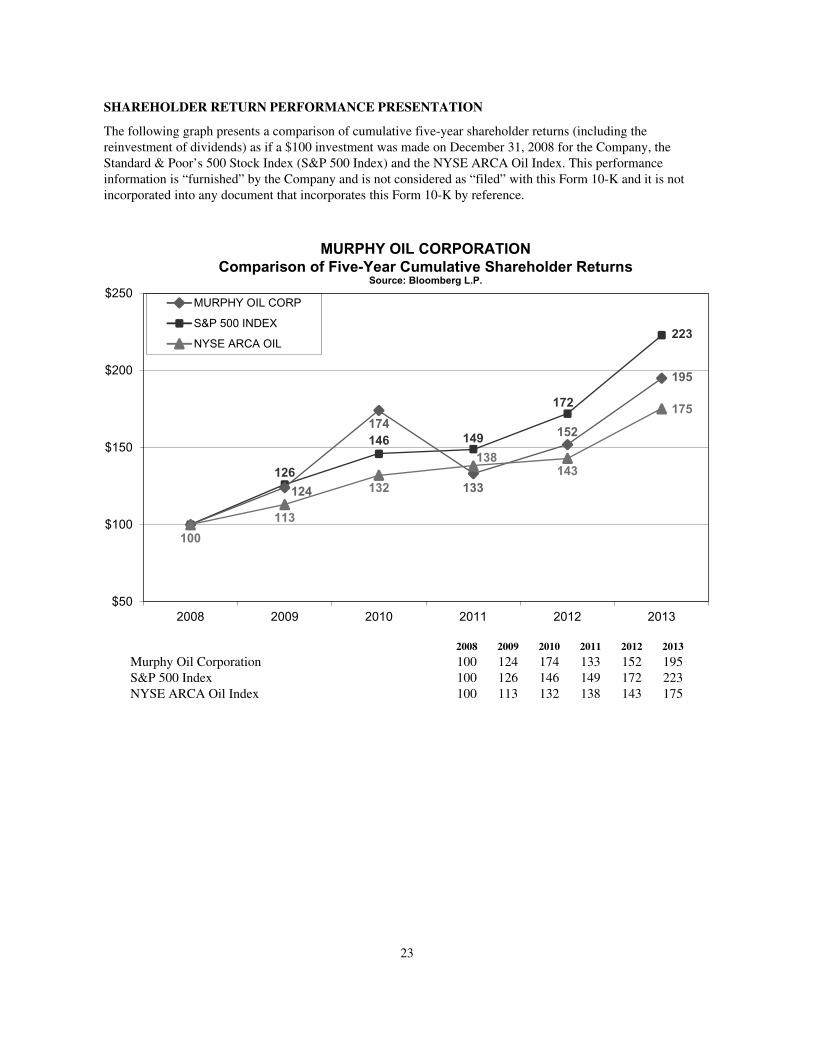
SHAREHOLDER RETURN PERFORMANCE PRESENTATION
The following graph presents a comparison of cumulative five-year shareholder returns (including thereinvestment of dividends) as if a $100 investment was made on December 31, 2008 for the Company, theStandard & Poor’s 500 Stock Index (S&P 500 Index) and the NYSE ARCA Oil Index. This performanceinformation is “furnished” by the Company and is not considered as “filed” with this Form 10-K and it is notincorporated into any document that incorporates this Form 10-K by reference.
124
174
133
152
195
126
146 149
172
223
100
113
132
138143
175
$50
$100
$150
$200
$250
MURPHY OIL CORPORATION
Comparison of Five-Year Cumulative Shareholder ReturnsSource: Bloomberg L.P.
MURPHY OIL CORP
S&P 500 INDEX
NYSE ARCA OIL
2008 2009 2010 2011 2012 2013
2008 2009 2010 2011 2012 2013
Murphy Oil Corporation 100 124 174 133 152 195S&P 500 Index 100 126 146 149 172 223NYSE ARCA Oil Index 100 113 132 138 143 175
23
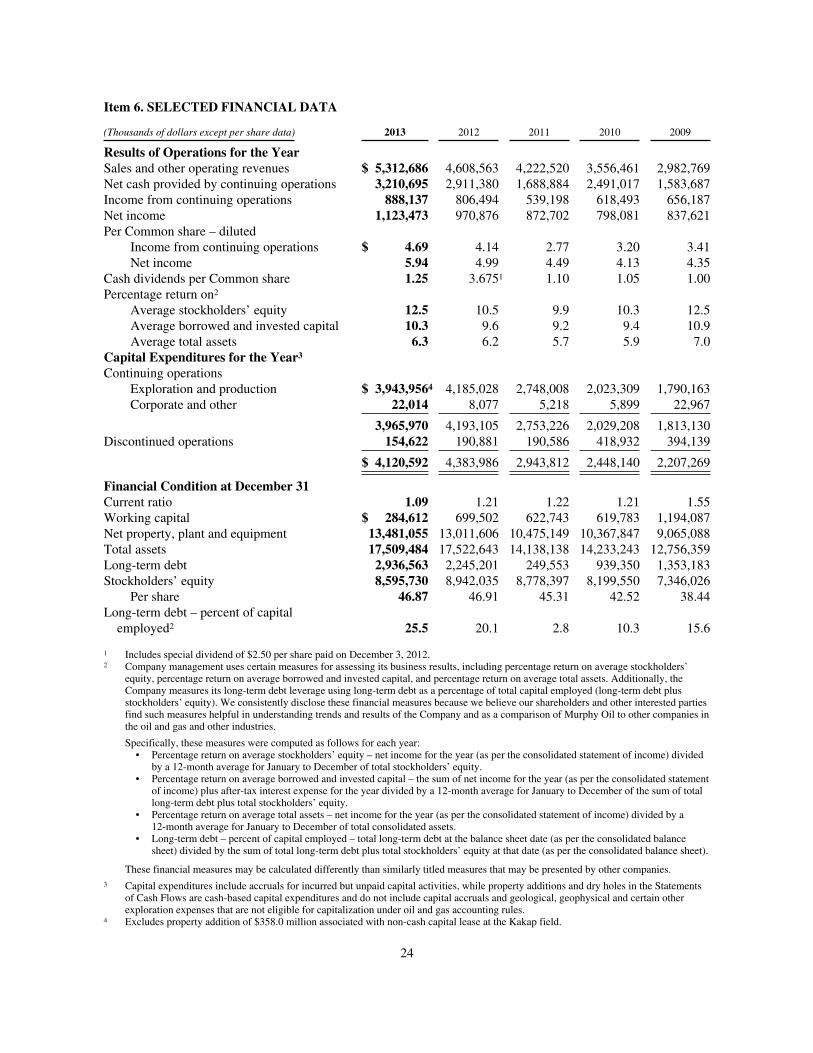
Item 6. SELECTED FINANCIAL DATA
(Thousands of dollars except per share data) 2013 2012 2011 2010 2009
Results of Operations for the YearSales and other operating revenues $ 5,312,686 4,608,563 4,222,520 3,556,461 2,982,769Net cash provided by continuing operations 3,210,695 2,911,380 1,688,884 2,491,017 1,583,687Income from continuing operations 888,137 806,494 539,198 618,493 656,187Net income 1,123,473 970,876 872,702 798,081 837,621Per Common share – diluted
Income from continuing operations $ 4.69 4.14 2.77 3.20 3.41Net income 5.94 4.99 4.49 4.13 4.35
Cash dividends per Common share 1.25 3.6751 1.10 1.05 1.00Percentage return on2
Average stockholders’ equity 12.5 10.5 9.9 10.3 12.5Average borrowed and invested capital 10.3 9.6 9.2 9.4 10.9Average total assets 6.3 6.2 5.7 5.9 7.0
Capital Expenditures for the Year3Continuing operations
Exploration and production $ 3,943,9564 4,185,028 2,748,008 2,023,309 1,790,163Corporate and other 22,014 8,077 5,218 5,899 22,967
3,965,970 4,193,105 2,753,226 2,029,208 1,813,130Discontinued operations 154,622 190,881 190,586 418,932 394,139
$ 4,120,592 4,383,986 2,943,812 2,448,140 2,207,269
Financial Condition at December 31Current ratio 1.09 1.21 1.22 1.21 1.55Working capital $ 284,612 699,502 622,743 619,783 1,194,087Net property, plant and equipment 13,481,055 13,011,606 10,475,149 10,367,847 9,065,088Total assets 17,509,484 17,522,643 14,138,138 14,233,243 12,756,359Long-term debt 2,936,563 2,245,201 249,553 939,350 1,353,183Stockholders’ equity 8,595,730 8,942,035 8,778,397 8,199,550 7,346,026
Per share 46.87 46.91 45.31 42.52 38.44Long-term debt – percent of capitalemployed2 25.5 20.1 2.8 10.3 15.6
1 Includes special dividend of $2.50 per share paid on December 3, 2012.2 Company management uses certain measures for assessing its business results, including percentage return on average stockholders’
equity, percentage return on average borrowed and invested capital, and percentage return on average total assets. Additionally, theCompany measures its long-term debt leverage using long-term debt as a percentage of total capital employed (long-term debt plusstockholders’ equity). We consistently disclose these financial measures because we believe our shareholders and other interested partiesfind such measures helpful in understanding trends and results of the Company and as a comparison of Murphy Oil to other companies inthe oil and gas and other industries.
Specifically, these measures were computed as follows for each year:• Percentage return on average stockholders’ equity – net income for the year (as per the consolidated statement of income) divided
by a 12-month average for January to December of total stockholders’ equity.• Percentage return on average borrowed and invested capital – the sum of net income for the year (as per the consolidated statement
of income) plus after-tax interest expense for the year divided by a 12-month average for January to December of the sum of totallong-term debt plus total stockholders’ equity.
• Percentage return on average total assets – net income for the year (as per the consolidated statement of income) divided by a12-month average for January to December of total consolidated assets.
• Long-term debt – percent of capital employed – total long-term debt at the balance sheet date (as per the consolidated balancesheet) divided by the sum of total long-term debt plus total stockholders’ equity at that date (as per the consolidated balance sheet).
These financial measures may be calculated differently than similarly titled measures that may be presented by other companies.3 Capital expenditures include accruals for incurred but unpaid capital activities, while property additions and dry holes in the Statements
of Cash Flows are cash-based capital expenditures and do not include capital accruals and geological, geophysical and certain otherexploration expenses that are not eligible for capitalization under oil and gas accounting rules.
4 Excludes property addition of $358.0 million associated with non-cash capital lease at the Kakap field.
24
Item 7. MANAGEMENT’S DISCUSSION AND ANALYSIS OF FINANCIAL CONDITION ANDRESULTS OF OPERATIONS
Overview
Murphy Oil Corporation is a worldwide oil and gas exploration and production company. Murphy owns refiningand marketing operations in the United Kingdom, but has announced its intention to sell these U.K. assets. Amore detailed description of the Company’s significant assets can be found in Item 1 of this Form 10-K report.
Significant Company operating and financial highlights during 2013 were as follows:
• Completed the separation of Murphy USA Inc. on August 30, 2013 creating a significant valueenhancement for shareholders.
• Continued to progress the sale of U.K. refining and marketing operations, with an expected completiondate during 2014.
• Generated the second highest net income in the Company’s history.
• Produced a Company record of more than 205,700 barrels of oil equivalent per day.
• Ended 2013 with a Company record level of proved reserves, and had organic replacement of provedreserves equal to 243% of production on a barrel of oil equivalent basis during the year.
• Repurchased almost eight million Common shares at a cost of $500 million.
• Made three natural gas discoveries in Block CA-2 in Brunei.
The year of 2013 was a period of significant transition for Murphy Oil Corporation. The Company hadpreviously announced its intention to fully divest its refining and marketing businesses to become an independentoil and gas exploration and production company. Steps taken in 2013 led to significant progress with meeting thisdesire to focus only on upstream operations.
On August 30, 2013, the Company completed the separation of its former U.S. retail marketing business bydistributing all common shares of this business to Murphy Oil’s shareholders. This separation, commonly knownas a “spin-off”, distributed one share of the retail marketing company, now known as Murphy USA Inc., forevery four shares of Murphy Oil Corporation common stock owned on the record date of August 21, 2013.Murphy USA Inc. shares trade on the New York Stock Exchange under the ticker symbol “MUSA”.Additionally, the Company progressed the sale of its U.K. refining and marketing operations. Achievement of theU.K. sale, expected to occur during 2014, will complete the Company’s transition to an independent oil and gascompany. Both the U.S. and U.K. downstream businesses are now reported as discontinued operations within theCompany’s consolidated financial statements. Additionally, the Company includes U.K. oil and gas operations,which were sold in a series of transactions in the first half of 2013, as discontinued operations.
Murphy generates revenue by selling oil and natural gas production to customers in the United States, Canadaand Malaysia. The Company’s revenue is highly affected by the prices of oil and natural gas. In order to make aprofit and generate cash in its exploration and production business, revenue generated from the sales of oil andnatural gas produced must exceed the combined costs of producing these products, depreciation of capitalexpenditures, and expenses related to exploration, administration, and for capital borrowed from lendinginstitutions and note holders.
Changes in the price of crude oil and natural gas have a significant impact on the profitability of the Company,especially the price of crude oil as oil represented approximately 66% of total hydrocarbons produced on anenergy equivalent basis (one barrel of crude oil equals six thousand cubic feet of natural gas) by the Company’supstream operations in 2013. In 2014, the Company’s ratio of hydrocarbon production represented by oil isexpected to increase to more than 70% due to a combination of growing oil production and declining NorthAmerican natural gas production. When oil-price linked natural gas is combined with oil production, the
25
Company’s 2014 total expected production is more than 80% linked to the price of oil. If the prices for crude oiland natural gas should weaken in 2014 or beyond, the Company would expect this to have an unfavorable impacton operating profits for its exploration and production business. As described on page 54, the Company hasentered into derivative and forward delivery contracts that will reduce its exposure to changes in certain oil andnatural gas prices in 2014 and 2015.
Worldwide oil prices in 2013 were generally comparable to 2012, while the sale prices for natural gas producedin North America was improved compared to the prior year. Among the various indices on which sales prices ofthe Company’s crude oil are marketed, prices were mixed in 2013 versus the prior year. The sales price for abarrel of West Texas Intermediate (WTI) crude oil averaged $98.05 in 2013, $94.15 in 2012 and $95.11 in 2011.The sales price for a barrel of Platts Dated Brent declined to $108.66 per barrel in 2013, following averages of$111.67 per barrel and $111.26 per barrel in 2012 and 2011, respectively. The NYMEX natural gas price permillion British Thermal Units (MMBTU) averaged $3.73 in 2013, $2.83 in 2012 and $4.03 in 2011. While theWTI index saw a 4% increase in 2013, Dated Brent fell back by 3% compared to 2012. During 2013 the discountfor WTI crude compared to Dated Brent narrowed a bit compared to the two prior years. The WTI to Dated Brentdiscount was $10.61 per barrel during 2013, compared to $17.52 per barrel in 2012 and $16.15 per barrel in2011. During 2012 the price of WTI fell slightly compared to 2011, however, certain other benchmark oil prices,including Dated Brent, experienced small increases in 2012 versus the prior year. NYMEX natural gas pricesincreased 32% in 2013 compared to 2012 generally due to more extreme weather conditions in North America inthe later year which created more demand by gas consumers. Natural gas prices fell in 2012 from 2011 levelsprimarily due to expansion of North American gas supply and a warmer than normal winter season in 2012 in theU.S. and Canada. On an energy equivalent basis, the market continued to discount North American natural gascompared to crude oil in 2013. However, compared to 2012, this natural gas to oil price discount narrowed a bitduring 2013. U.S. crude oil prices in early 2014 have been similar to 2013 average prices, while natural gasprices in North America in 2014 have thus far been above the 2013 levels due to cold temperatures across muchof the Northern U.S. during the early winter season.
Results of Operations
Murphy Oil’s results of operations, with associated diluted earnings per share (EPS), for the last three years arepresented in the following table.
Years Ended December 31
(Millions of dollars, except EPS) 2013 2012 2011
Net income $1,123.5 970.9 872.7Diluted EPS 5.94 4.99 4.49
Income from continuing operations $ 888.1 806.5 539.2Diluted EPS 4.69 4.14 2.77
Income from discontinued operations $ 235.4 164.4 333.5Diluted EPS 1.25 0.85 1.72
Murphy Oil’s net income in 2013 was 16% higher than 2012, with the improvement attributable to betterearnings for exploration and production (“E&P” or “upstream”) operations and higher income from discontinuedoperations. Continuing operations income improved 10% primarily due to growth in oil production in the E&Pbusiness, but the Company experienced higher costs for Corporate activities that were not allocated to operatingsegments during 2013. The improvement in discontinued operations results by 43% was attributable to a gain onsale of U.K. oil and gas assets in 2013 and better profits for U.S. retail marketing operations, but U.K.downstream results was significantly below 2012 levels.
Net income in 2012 increased 11% compared to 2011 primarily due to higher earnings for continuing E&Poperations, partially offset by both lower earnings for discontinued operations and higher net costs of corporateactivities not allocated to operating segments.
26
Further explanations of each of these variances are found in more detail in the following sections.
2013 vs. 2012 – Net income in 2013 totaled $1,123.5 million ($5.94 per diluted share) compared to net income in2012 of $970.9 million ($4.99 per diluted share). Income from continuing operations increased from$806.5 million ($4.14 per diluted share) in 2012 to $888.1 million ($4.69 per diluted share) in 2013. The 2013improvement in income from continuing operations was attributable to higher oil sales volumes, lowerimpairment expense and higher tax benefits associated with investments in foreign upstream operations whichare being exited. These were partially offset by higher extraction and exploration expenses, lower average oilsales prices, and higher costs associated with borrowed funds and company administration. Income fromdiscontinued operations was $235.4 million ($1.25 per diluted share) in 2013, up from $164.4 million ($0.85 perdiluted share) in 2012. Income from discontinued operations in both years included results for refining andmarketing (“R&M” or “downstream”) operations in the U.S. and U.K. and for oil and gas production operationsin the U.K. The improvement in discontinued operations in 2013 was attributable to a gain on disposal of all U.K.oil and gas assets during the year, coupled with stronger income contributions from the separated U.S. retailmarketing business in 2013. These favorable factors were partially offset by unfavorable results for U.K. R&Moperations caused by both significantly weaker operating margins and a $73.0 million charge to writedown thecarrying value of these operating assets.
Sales and other operating revenues grew $704.1 million in 2013 compared to the prior year. Sales rose in 2013primarily due to higher oil sales volumes associated with a 20% increase in oil production volumes. Sales alsobenefited from higher realized North American natural gas sales prices, which increased $0.61 per thousandcubic feet (MCF) in 2013 compared to the prior year. However, prices for worldwide average realized oil salesand Sarawak, Malaysia natural gas sales fell $1.98 per barrel and $0.84 per MCF, respectively, which had adetrimental effect on sales revenue. Additionally, natural gas sales volumes fell during 2013 due to both welldecline in Western Canada caused by voluntary curtailment of drilling operations and lower net gas salesvolumes offshore Malaysia caused by lower third party demand and a lower revenue share allocable to theCompany for Sarawak gas sold compared to the prior year. Interest and other income was $66.5 million higher in2013 than in 2012 primarily due to more favorable impacts from transactions denominated in foreign currenciesduring the most current year. Operating expenses increased $225.4 million in 2013 due to higher overallhydrocarbon production levels and costs related to shutdown of the Azurite field in Republic of the Congo.Exploration expenses in 2013 were $121.3 million more than 2012 due to higher unsuccessful exploratorydrilling costs, primarily in the U.S. Gulf of Mexico, Western Canada, Australia and Cameroon, plus highergeophysical data acquisition costs, primarily in Vietnam, Australia, Indonesia, West Africa and the U.S. Lowerundeveloped lease amortization in 2013 in the U.S., Canada and Kurdistan partially offset these higher drillingand geophysical costs. Selling and general expense rose $129.6 million in 2013 primarily due to highercompensation expense and costs related to separation of the U.S. retail marketing business. Depreciation,depletion and amortization expense increased $300.3 million in the current year due to both higher hydrocarbonsales volumes and higher per-unit depreciation rates mostly caused by increasing field development costs for newfields. Impairment of properties declined by $178.4 million in 2013 due to a $200.0 million charge at the Azuritefield in the prior year compared to a $21.6 million writedown of certain Western Canada producing propertiessold in 2013. Accretion of asset retirement obligations increased by $10.6 million in the current year due to bothhigher estimated upstream abandonment costs and a higher producing well count, which increased the level offuture well abandonment liabilities recorded on a discounted basis. Interest expense rose $70.3 million in 2013due to higher average borrowing levels in the current year, plus a higher average interest rate caused by a fullyear of interest applicable on notes payable issued near mid-year 2012. Interest capitalized to developmentoperations in 2013 exceeded the prior year by $13.4 million primarily due to a higher level of oil developmentprojects offshore Malaysia in the current year. Income tax expense increased $23.0 million in 2013 due to higherearnings before taxes partially offset by higher current year U.S. income tax benefits for tax deductions oninvestments in foreign upstream operations for which the Company is exiting. The consolidated effective tax ratewas 39.7% in 2013 compared to 41.0% in 2012, with the lower rate in the later year primarily caused by higherU.S. tax benefits for investments in Republic of the Congo. The tax rate in both 2013 and 2012 were higher thanthe U.S. federal statutory tax rate of 35.0% due to both foreign tax rates in certain areas that exceeded the U.S.
27
federal tax rate and certain exploration and other expenses in foreign taxing jurisdictions for which no income taxbenefit is currently being recognized because of the Company’s uncertain ability to obtain tax benefits for thesecosts in 2013 or future years.
2012 vs. 2011 – Net income in 2012 was $970.9 million ($4.99 per diluted share) compared to $872.7 million($4.49 per diluted share) in 2011. Income from continuing operations was $806.5 million ($4.14 per dilutedshare) in 2012, up from $539.2 million ($2.77 per diluted share) in 2011. Earnings from continuing operations in2012 increased primarily due to a combination of lower impairment charges, U.S. income tax benefits associatedwith investments in foreign upstream operations, higher crude oil sales volumes and lower exploration expenses.These were partially offset by lower North American natural gas sales prices and unfavorable effects of foreignexchange compared to the prior year. Net income in 2012 and 2011 included income from discontinuedoperations of $164.4 million ($0.85 per diluted share) and $333.5 million ($1.72 per diluted share), respectively.Income from discontinued operations in both years included results for downstream operations in the U.S. andU.K. and for oil and gas production operations in the U.K. In 2011 discontinued operations included theseoperations plus operating profits and a gain on disposal of two U.S. petroleum refineries sold in late 2011.Results for discontinued operations were $169.1 million less in 2012 primarily associated with no repeat of 2011operating income and net gain on disposal for two U.S. refineries (Meraux, Louisiana and Superior, Wisconsin)and associated marketing assets which were sold in 2011. Additionally, weaker results for U.S. retail marketingoperations in 2012 compared to 2011 were somewhat offset by improved results for U.K. refining and marketingoperations during 2012.
Sales and other operating revenues grew $386.0 million in 2012 compared to 2011 primarily due to higher crudeoil sales volumes for the E&P business. Gain (loss) on sale of assets was $23.1 million less in 2012 than 2011because the earlier year included a $23.1 million gain on sale of natural gas storage assets in Spain. Interest andother operating income was lower by $22.0 million in 2012 compared to 2011 mostly due to an $18.4 millionunfavorable pretax variance from the effects of transactions denominated in foreign currencies, plus interestincome in 2011 of $2.7 million associated with a recovery of Federal royalties for certain deepwater Gulf ofMexico fields. Operating expenses were $104.6 million more in 2012 than 2011 due to higher oil and natural gasproduction costs caused mostly by higher production volumes in the later year. Exploration expenses were$108.4 million lower in 2012 compared to 2011 due to more drilling success in 2012, plus lower geophysicalexpense in the Gulf of Mexico, Malaysia, Brunei and the Kurdistan region of Iraq compared to 2011. Selling andgeneral expenses were $40.7 million more in 2012 than in 2011 primarily due to higher employee compensationand professional services costs in the later year. Depreciation, depletion and amortization expense rose$288.4 million in 2012 versus 2011 due to higher crude oil and natural gas sales volumes in 2012 and higherE&P per-unit depreciation rates. Impairment of properties was $168.6 million lower in 2012 than in 2011 due toa smaller impairment charge in Republic of the Congo in 2012. Accretion of asset retirement obligations was$4.5 million more in 2012 than 2011 primarily due to higher discounted abandonment liabilities for wells drilledin 2012 in Malaysia, higher estimated abandonment costs for wells in the Gulf of Mexico, and higher futurereclamation costs for synthetic oil operations at Syncrude. Redetermination of working interest at the Terra Novafield was a $5.4 million benefit in 2011 due to nonrecurring income achieved upon final settlement of theredetermination process in early 2011. Interest expense in 2012 was $1.7 million less than 2011 primarily due tolower average interest rates paid on borrowed funds in the later year, partially offset by the effects of higheraverage outstanding debt levels in 2012. The benefit from capitalized interest was $24.0 million higher in 2012than the prior year due to larger levels of financing costs allocated to ongoing oil development projects in thelater year. Income tax expense in 2012 was $67.2 million less than 2011 primarily due to U.S. income taxbenefits of $108.3 million recognized in 2012 associated with investments in upstream operations in Republic ofthe Congo and Suriname. The consolidated effective tax rate was 41.0% in 2012 compared to 53.8% in 2011,with the lower rate in the later year caused by the U.S. tax benefits for Republic of the Congo and Suriname, alower percentage of earnings in higher tax jurisdictions in 2012, and lower current year exploration and otherexpenses in foreign jurisdictions where no income tax benefit can presently be recognized due to no assurancethat these expenses will be realized in 2012 or future years to reduce taxes owed. The tax rates in both 2012 and2011 were higher than the U.S. federal statutory tax rate of 35.0% due to foreign tax rates that exceeded the U.S.
28
federal tax rate in certain areas, and certain exploration and other expenses in foreign taxing jurisdictions forwhich no income tax benefit is currently being recognized because of the Company’s uncertain ability to obtaintax benefits for these costs in 2012 or future years.
Segment Results – In the following table, the Company’s results of operations for the three years endedDecember 31, 2013, are presented by segment. More detailed reviews of operating results for the Company’sexploration and production and other activities follow the table.
(Millions of dollars) 2013 2012 2011
Exploration and production – continuing operationsUnited States $ 435.4 168.0 152.7Canada 180.8 208.1 328.0Malaysia 786.4 894.2 812.7Republic of the Congo (9.0) (241.1) (385.3)Other (364.8) (124.2) (293.9)
Total exploration and production – continuing operations 1,028.8 905.0 614.2Corporate and other (140.7) (98.5) (75.0)
Income from continuing operations 888.1 806.5 539.2Income from discontinued operations 235.4 164.4 333.5
Net income $1,123.5 970.9 872.7
Exploration and Production – Earnings from exploration and production (E&P) continuing operations were$1,028.8 million in 2013, $905.0 million in 2012 and $614.2 million in 2011.
E&P income in 2013 was $123.8 million higher than in 2012 primarily due to higher crude oil sales volumes in2013 and lower impairment charges in the current year. The 2013 period also had higher North American naturalgas sales prices and higher U.S. income tax benefits for investments in foreign upstream operations where theCompany is exiting. The 2013 E&P results included lower crude oil sales realizations and higher expenses for oiland gas extraction, exploration and administrative activities. Crude oil sales volumes for continuing operations in2013 were 23% higher than 2012. The most significant increase occurred in the U.S. where ongoing developmentoperations during the year led to larger oil production in the Eagle Ford Shale area of South Texas. Oil salesvolumes also increased in the heavy oil area of Canada following an acquisition of properties in this area in late2012. Sales volumes were higher offshore Eastern Canada due to increased production at the Terra Nova field,which had more downtime for maintenance in 2012. Sales volumes of synthetic crude oil were lower in 2013 dueto more downtime for maintenance during the current year. The average realized sales price for crude oil,condensate and gas liquids declined 2% in 2013 to an average of $93.60 per barrel. Natural gas sales volumes forcontinuing operations decreased 13% in 2013 and the reduction was primarily attributable to lower gas volumesproduced during the current year at the Tupper and Tupper West areas in Western Canada. The Company hasvoluntarily curtailed drilling activities in this area during the last few years due to low North American gas salesprices. Natural gas sales volumes were also lower during 2013 in Malaysia due to reduced customer demand anda lower entitlement percentage allocable to the Company from fields offshore Sarawak. E&P productionexpenses were $225.4 million higher in 2013 primarily due to more volumes produced in the Eagle Ford Shaleand $82.5 million of costs associated with abandonment activities at the Azurite field, offshore Republic of theCongo. Depreciation, depletion and amortization increased $299.2 million due to both higher overall productionand a higher per-unit depreciation rate on new production volumes. Exploration expense rose $121.3 million in2013 due to higher costs for both unsuccessful exploratory drilling and geophysical data acquisitions, but thesewere partially offset by lower amortization expense for unproved oil and gas leases. The prior year included a$200.0 million impairment charge to reduce the carrying value of the Azurite oil field in Republic of the Congo.This field went off production in October 2013 and field abandonment operations were underway at year-end2013. Income tax benefits associated with investments in foreign upstream operations where the Company isexiting were $25.2 million higher in 2013 than 2012. These larger tax benefits were primarily related to U.S. taxdeductions associated with investments in Republic of the Congo.
29
Income for E&P continuing operations in 2012 was $290.8 million more than in 2011. The increase wasprimarily attributable to lower impairment charges of $168.6 million in Republic of the Congo in 2012, favorabletax benefits of $108.3 million in 2012 for investments in upstream operations in Republic of the Congo andSuriname, plus higher crude oil and natural gas sales volumes and stronger crude oil sales prices in the later year.The Company’s average realized sales price for crude oil, condensate and gas liquids in 2012 for continuingoperations increased $1.40 per barrel over 2011. The Company’s average natural gas sales prices in Sarawak,Malaysia were also higher in 2012 than 2011, but natural gas sales prices in 2012 in North America weresignificantly below 2011 levels. Crude oil and liquids sales volumes for continuing operations increased 11% in2012 while natural gas sales volumes rose 7%. The increase in hydrocarbon sales volumes in 2012 led to higherexpenses for production and depreciation of $104.5 million and $288.4 million, respectively. The 2012 year hadless exploration expenses of $108.5 million compared to 2011, essentially due to lower expenses related tounsuccessful exploratory drilling and geophysical activities. Crude oil sales volumes increased in 2012 in theU.S. primarily due to higher volumes produced in the Eagle Ford Shale area of South Texas. Conventional oilsales volumes in Canada in 2012 were less than 2011 primarily due to lower gross production at the Terra Novafield, where more downtime for maintenance occurred in 2012. Synthetic oil sales volumes at Syncrude increasedin 2012 due to higher gross production compared to 2011. Sales volumes for crude oil produced in Malaysia werehigher in 2012 primarily due to new wells brought on production at the Kikeh field offshore Sabah. Crude oilsales volumes decreased in 2012 in Republic of the Congo due to field decline and a well failure at the Azuritefield. Natural gas sales volumes in 2012 increased compared to the prior year principally due to more wellsproducing for a longer period in the Tupper area in Western Canada and higher gas volumes produced in theEagle Ford Shale.
The results of operations for oil and gas producing activities for each of the last three years are shown by majoroperating areas on pages F-57 and F-58 of this Form 10-K report. Average daily production and sales rates andweighted average sales prices are shown on page 5 of the 2013 Annual Report.
A summary of oil and gas revenues is presented in the following table.
(Millions of dollars) 2013 2012 2011
United States – Oil and gas liquids $1,724.7 976.1 648.8– Natural gas 72.7 54.2 71.1
Canada – Conventional oil and gas liquids 507.2 411.7 505.6– Synthetic oil 441.0 463.1 506.6– Natural gas 198.1 209.8 280.2
Malaysia – Oil and gas liquids 1,875.0 1,946.0 1,583.0– Natural gas 404.0 481.1 461.3
Republic of the Congo – oil 83.6 57.6 148.8
Total oil and gas revenues $5,306.3 4,599.6 4,205.4
The Company’s total crude oil, condensate and natural gas liquids production averaged 135,078 barrels per dayin 2013, compared to 112,591 barrels per day in 2012 and 103,160 barrels per day in 2011.
United States oil production increased from 26,090 barrels per day in 2012 to a U.S. Company record of 48,387barrels per day in 2013 with the 85% volume increase virtually all related to drilling and other developmentoperations in the Eagle Ford Shale area. The Company’s Eagle Ford Shale drilling program in South Texasutilized an average of almost eight drilling rigs throughout 2013 and drilling will continue throughout 2014.Production of heavy oil in Western Canada was 9,128 barrels per day in 2013, up from 7,241 barrels per day in2012, primarily due to volumes in the current year at properties acquired near the end of 2012. Oil productionoffshore Canada rose from 6,986 barrels per day in 2012 to 9,099 barrels per day in 2013 primarily due to lessdowntime in the current year at the Terra Nova field. Synthetic oil operations at Syncrude had net production of12,886 barrels per day in 2013, down from 13,830 barrels per day in 2012, with the decrease caused by more
30

facility downtime for maintenance in the current year. Oil production in Malaysia increased from 52,663 barrelsper day in 2012 to 53,766 barrels per day in 2013, primarily due to start-up of four new oil fields offshoreSarawak in the second half of 2013. Additionally, oil volumes benefited from the early production system at theKakap-Gumusut field being operational for all of 2013 following a late 2012 start-up. The full Kakap-Gumusutfield production system is expected to come onstream in 2014. Oil production at the Kikeh field decreased in2013 primarily due to well decline. Oil production in Republic of the Congo was lower in 2013 due to continuedwell decline that led to the field being shut down in October 2013. The Company sold all of its U.K. oil and gasproperties through a series of transactions during the first half of the year, and U.K. oil production thereforedeclined in 2013. All U.K. oil and gas production volumes have been reported as discontinued operations.
United States crude oil production averaged 26,090 barrels per day in 2012, a 52% increase from 17,148 barrelsper day in 2011. The U.S. increase was primarily attributable to development drilling in the Eagle Ford Shalearea. Heavy oil production in Western Canada of 7,241 barrels per day in 2012 was about flat with 2011. Crudeoil production offshore Canada fell from 9,204 barrels per day in 2011 to 6,986 barrels per day in 2012essentially due to more downtime for maintenance at the Terra Nova field and well decline at the Hibernia field.Synthetic oil production of 13,830 barrels per day in 2012 slightly exceeded 2011 volumes of 13,498 per day.Crude oil and liquids production in Malaysia averaged 52,663 barrels per day in 2012, up from 48,551 barrels perday in 2011, with the increase mainly due to additional wells brought on production at the Kikeh field. Oilproduction in Republic of the Congo fell to 2,078 barrels per day in 2012 after averaging 4,989 barrels per day in2011, with the reduction due to a well that went off production during 2012 and normal decline at other wells inthe field. Crude oil production from discontinued U.K. operations was 3,458 barrels per day in 2012 compared to2,423 barrels per day in 2011. The U.K. increase in 2012 was primarily at Schiehallion, where better overallperformance more than offset lower volumes produced at the Mungo/Monan field.
Worldwide sales of natural gas were 423.8 million cubic feet (MMCF) per day in 2013, after averaging aCompany record 490.1 MMCF per day in 2012 and 457.4 MMCF per day in 2011.
Natural gas sales volumes in the U.S. averaged 53.2 MMCF per day in 2013, slightly above the 53.0 MMCF perday in 2012 as higher production in the Eagle Ford Shale was essentially offset by declines in the Gulf of Mexicoand other onshore operations. Natural gas volumes in Canada fell from 217.0 MMCF per day in 2012 to 175.4MMCF per day in 2013 primarily due to well decline at the Tupper and Tupper West areas in Western Canada.The Company has voluntarily curtailed drilling activities in this dry gas basin due to historically low NorthAmerican natural gas sales prices. Natural gas sales volume offshore Sarawak, Malaysia declined to 164.7MMCF per day in 2013 compared to 174.3 MMCF per day in 2012. This reduction was caused by a combinationof lower third party demand and a lower entitlement percentage allocable to the Company under the productionsharing contract. Kikeh gas volumes offshore Sabah, Malaysia fell from 42.5 MMCF per day in 2012 to 29.7MMCF per day in 2013 primarily due to more downtime for maintenance at the third party onshore receivingfacility. Natural gas production from discontinued operations in the U.K. declined from 3.4 MMCF per day in2012 to 0.8 MMCF per day in 2013 due to the Company selling these properties during the first half of 2013.
Natural gas sales volumes in the U.S. were 53.0 MMCF per day in 2012, up from 2011 production of 47.2MMCF per day as higher gas volumes in the Eagle Ford Shale area more than offset declines at fields in the Gulfof Mexico. Natural gas volumes in Canada increased from 188.8 MMCF per day in 2011 to 217.0 MMCF perday in 2012 essentially due to higher gas volumes produced at the Tupper area, as more wells were on productionat Tupper West during 2012. Natural gas sales volumes offshore Sarawak, Malaysia averaged 174.3 MMCF perday in 2012 following volumes of 176.9 MMCF per day in 2011. Gas sales at the Kikeh field averaged 42.5MMCF per day in 2012, up from 40.5 MMCF per day during the prior year. Natural gas sales volumes in theU.K. reported as discontinued operations fell from 3.9 MMCF per day in 2011 to 3.4 MMCF per day in 2012 dueto well decline at the Mungo/Monan field during the later year.
The Company’s average worldwide realized sales price for crude oil, condensate and gas liquids from continuingoperations was $93.60 per barrel in 2013 compared to $95.58 per barrel in 2012 and $94.18 per barrel in 2011.
31
The average realized oil sales price for continuing operations fell by 2% in 2013 compared to the prior year. Oil priceson various indices were mixed in 2013 compared to the prior year. AlthoughWest Texas Intermediate crude oil pricesincreased about 4% in 2013, most of the Company’s oil is sold on other indices which actually declined in 2013compared to 2012. Dated Brent prices and Kikeh benchmark prices declined in 2013 by about 3% and 2%,respectively. Compared to 2012, the Company’s realized oil price in the U.S. declined by about 5% to $97.69 perbarrel primarily due to a higher mix of natural gas liquids in the later year. This average 2013 oil price includes a mixof $101.70 per barrel for crude oil and $30.31 per barrel for natural gas liquids. Heavy oil price realizations in Canadaincreased 1% to $46.80 per barrel. Oil prices offshore Eastern Canada were $108.64 per barrel, down 3% from 2012.Oil produced at the Syncrude project averaged $96.09 per barrel in 2013, an increase of 5%. Malaysian crude oil wassold at an average of $94.27 per barrel in 2013, which was a decline of 3% from the prior year. Average crude oil salesprices in Republic of the Congo were $109.43 per barrel in 2013, a 2% increase from the prior year.
During 2012, the average realized oil sales price for continuing operations increased 1% compared to 2011. The2012 higher realized price was favorable to the 1% reduction in West Texas Intermediate (WTI) sales pricebetween the years. Other benchmark oil prices used for sale of Company crude oil, such as Dated Brent,performed more favorably than WTI. During 2012, the Company began to sell its Kikeh crude oil based on a newKikeh benchmark price. Kikeh oil had been sold since late 2010 on a Brent crude oil benchmark. Compared to2011, the Company’s average 2012 crude oil sales prices fell 1% in the U.S. to average $102.60 per barrel.Heavy oil sales prices in Canada fell 19% in 2012 to an average of $46.45 per barrel. Offshore Canada oil sold at$112.08 per barrel in 2012, an increase of 2%. Canadian synthetic crude oil sold for 11% less in 2012 andaveraged $91.85 per barrel. The crude oil sales price in Malaysia increased 8% to an average price of $97.29 perbarrel in 2012. Crude oil sold in Republic of the Congo increased 4% to a price of $107.26 per barrel in 2012.
During 2013, the Company’s realized North American natural gas sales price averaged $3.26 per thousand cubicfeet (MCF), a 23% increase compared to 2012. Natural gas produced in 2013 offshore Sarawak was sold at anaverage price of $6.66 per MCF, a decline of 11% from 2012, which was essentially caused by contractuallyrequired revenue sharing for a higher percentage of gas produced during the just completed year.
The Company’s North American natural gas prices retracted in 2012 compared to 2011, while prices in otherareas were a bit stronger in 2012. North American natural gas sales prices were hurt by an oversupply of gascaused by both a growing profile of unconventional gas production on the continent and an unusually warmwinter season in the primary gas consuming markets in the U.S. during 2012. The Company’s average salesprices for natural gas in North America decreased 35% to $2.65 per MCF in 2012, which was composed of a33% decline to $2.76 per MCF in the U.S. and a 36% decline to $2.62 per MCF in Canada. Natural gas producedoffshore Sarawak sold for 6% more in 2012 than in 2011 and averaged $7.50 per MCF in the later year.
Based on 2013 sales volumes and deducting taxes at statutory rates, each $1.00 per barrel and $0.10 per MCFfluctuation in prices would have affected 2013 earnings from exploration and production continuing operationsby $32.2 million and $10.4 million, respectively. The effect of these price fluctuations on consolidated netincome cannot be measured precisely because operating results of the Company’s discontinued refining andmarketing operations could have been affected differently.
Production expenses for continuing operations were $1,340.2 million in 2013, $1,114.8 million in 2012 and$1,010.3 million in 2011. These amounts are shown by major operating area on pages F-57 and F-58 of thisForm 10-K report. Costs per equivalent barrel sold, excluding ad valorem and severance taxes as applicable,during the last three years are shown in the following table.
(Dollars per equivalent barrel) 2013 2012 2011
United States $13.10 17.64 17.30Canada
Excluding synthetic oil 10.50 8.86 8.55Synthetic oil 47.47 43.26 46.84
Malaysia 12.15 12.78 13.66Worldwide – excluding synthetic oil and Republic of the Congo 12.03 12.61 12.69
32
Production expense per equivalent barrel in the U.S. declined in 2013 compared to 2012 due to both higherproduction volumes and cost management actions in the Eagle Ford Shale area. In 2013, costs per barrel in theEagle Ford Shale were below the U.S. average rate. Continued cost management activities and anticipated higherproduction at the Eagle Ford Shale is expected to lead to lower U.S. production expense per barrel in 2014. Theper-unit costs for Canadian conventional oil and gas operations, excluding synthetic oil, was higher in 2013compared to 2012, which was caused by a higher mix of more expensive Seal area heavy oil coupled with areduction in less expensive natural gas production in the Tupper and Tupper West areas. Lower maintenancecosts anticipated in 2014 at the Terra Nova field should lead to a small reduction in per-unit costs in Canada inthat year. Higher cost per barrel in 2013 compared to 2012 at Canadian synthetic oil operations was primarilycaused by more overall maintenance costs and lower production volumes in the just completed year. No majorvariance in per-unit costs is anticipated at Syncrude in 2014. Production cost per unit in Malaysia was down in2013 compared to 2012, with the reduction primarily associated with lower costs for the early production systemat the Kakap-Gumusut field. A higher mix of oil-weighted production is anticipated to lead to an increase in per-unit costs in Malaysia in 2014. Production expense in Republic of the Congo in 2013 included $82.5 millionrelated to abandonment and other exit activities at the Azurite field. These costs will not repeat in 2014 and dueto field shutdown in late 2013, the effect of Azurite production has been omitted from the table on page 32.
Production expense per equivalent barrel in the U.S. increased in 2012 compared to 2011 due to a significantlylarger proportion of production in the later year coming from the Eagle Ford Shale in South Texas, where theaverage per-barrel cost exceeded the U.S. average. Cost per barrel for Canada conventional oil and gasoperations, excluding synthetic oil, was higher in 2012 than 2011 due to additional maintenance costs in the lateryear at the Terra Nova field. This Canadian cost increase was tempered by higher natural gas production at thelower cost Tupper area. The reduction in production costs per barrel for synthetic oil operations in 2012compared to 2011 was attributable to lower natural gas power costs in the later year. Production expense inMalaysia declined in 2012 compared to 2011 due to less well maintenance and workover costs at the Kikeh field.Per-barrel production expense in 2012 in Republic of the Congo was significantly higher than 2011 due to lowerproduction levels and unsuccessful workover costs at a well in the Azurite field.
Exploration expenses for continuing operations for each of the last three years are shown in total in the followingtable, and amounts are reported by major operating area on pages F-57 and F-58 on this Form 10-K report.Expenses other than undeveloped lease amortization are included in the capital expenditures total for explorationand production activities.
(Millions of dollars) 2013 2012 2011
Dry holes $262.9 181.9 251.0Geological and geophysical 117.5 32.2 79.3Other 54.9 37.0 40.9
435.3 251.1 371.2Undeveloped lease amortization 66.9 129.8 118.2
Total exploration expenses $502.2 380.9 489.4
Dry hole expense in 2013 was $81.0 million more than 2012 due to higher unsuccessful exploratory drilling costsin the just completed year in the Gulf of Mexico, Western Canada, Australia and Cameroon. Lower dry holecosts in 2013 in Malaysia, Republic of the Congo and Kurdistan somewhat offset the higher costs in other areas.Geological and geophysical (G&G) expenses were $85.3 million higher in 2013 compared to 2012. The increasein G&G expenses in 2013 was mostly attributable to higher spending on seismic in Vietnam, Indonesia,Australia, West Africa and the Gulf of Mexico, but 2013 included lower seismic spending offshore Malaysia.Other exploration costs were $17.9 million more in 2013 than 2012 mostly due to higher office costs forexploration activities primarily in West Africa, the Kurdistan region of Iraq, Vietnam and Australia.Undeveloped lease amortization expense was $62.9 million lower in 2013 than 2012 principally due to lessunproved lease amortization costs associated with concessions in the Kurdistan region of Iraq, the Eagle FordShale area and Western Canada.
33
Dry hole expense was $69.1 million lower in 2012 than in 2011 due to better drilling success coupled with lowerexploratory drilling spending. Dry hole expense in 2012 in other foreign areas was significantly lower than in2011 primarily due to unsuccessful wells drilled in the earlier year in Brunei, Indonesia and Suriname. Dry holeexpense in Canada was also significantly lower in 2012 due to fewer unsuccessful wells drilled in SouthernAlberta in 2012. Dry hole expense in the U.S. was higher in 2012 mostly due to a decision by the owners in 2012not to develop a well drilled in a prior year in the deepwater Gulf of Mexico; the well was expensed in 2012.Malaysian operations had higher dry hole expense in 2012 due to an unsuccessful well drilled in Block P andexpensing of two wells drilled in a prior year offshore Sarawak caused by a decision to forego development plansfor these wells. Dry hole expense in Republic of the Congo was higher in 2012 than 2011 due to expensing twowildcat wells following unsuccessful drilling in the MPN block in the later year. G&G expenses were $47.1million lower in 2012 than 2011. Areas with lower spending on seismic in 2012 included the Gulf of Mexico,Brunei, the Kurdistan region of Iraq, and Block H Malaysia. Other exploration costs in 2012 were $3.9 millionbelow 2011 levels primarily due to lower lease rentals on undeveloped acreage in Western Canada in 2012.Undeveloped leasehold amortization expense rose $11.6 million in 2012 compared to 2011, primarily due tohigher amortization associated with Eagle Ford Shale area leases.
The Company’s E&P operations had lower impairment expense of $178.4 million in 2013 when compared to theprior year. The 2013 expense was associated with a writedown of property value in the Kainai area of WesternCanada based on a sale of the property at a price below the carrying value. In 2012, the Company recorded animpairment charge of $200.0 million for oil production operations at the Azurite field, offshore Republic of theCongo. The 2012 charge for Azurite was required due to the removal of all proved reserves at year-end 2012following the Company’s decision to cease redrilling operations on a well that went off production during thatyear. The reserves associated with the remaining producing wells were insufficient to allow for booking asproved reserves due to uneconomic results. A $368.6 million impairment charge was recorded in 2011 to reducethe carrying value of Azurite necessitated by a reduction in the field’s proved oil reserves at year-end 2011 due topoor performance for certain wells.
Depreciation, depletion and amortization expense for continuing exploration and production operations totaled$1,543.6 million in 2013, $1,244.4 million in 2012 and $956.0 million in 2011. The $299.2 million increase in2013 was attributable to a combination of higher total sales volumes on a barrel equivalent basis and a higherper-unit depreciation rate. Additional production volumes at the Eagle Ford Shale and new oil produced at fieldsoffshore Sarawak had higher overall per-unit rates compared to the average rate for the Company. The$288.4 million increase in 2012 compared to 2011 was primarily caused by higher overall volumes of oil andnatural gas sold during 2012. Additionally, the average per-unit depreciation rate increased in 2012, primarilydue to a higher mix of production from the Eagle Ford Shale and a higher unit rate at Kikeh due to developmentdrilling activities at the field.
The exploration and production business recorded expenses of $49.0 million in 2013, $38.4 million in 2012 and$33.8 million in 2011 for accretion on discounted abandonment liabilities. Because the liability for futureabandonment of wells and other facilities is carried on the balance sheet at a discounted fair value, accretion mustbe recorded annually so that the liability will be recorded at full value at the projected time of abandonment. The$10.6 million increase in accretion expense in 2013 compared to the prior year was due to additional wells drilledin the Eagle Ford Shale area, as well as higher estimated abandonment liabilities for synthetic oil operations inCanada and oil fields in Malaysia and Congo. The $4.6 million increase in accretion expense in 2012 comparedto 2011 was due to additional wells drilled during the later year in Malaysia and higher estimated abandonmentcosts for wells in the Gulf of Mexico and for synthetic oil operations at Syncrude.
The effective income tax rate for exploration and production continuing operations was 38.9% in 2013, 40.1% in2012 and 52.6% in 2011. The 2013 overall effective tax rate for E&P operations was slightly lower than 2012due to recognizing higher U.S. income tax benefits associated with investments in upstream operations inRepublic of the Congo and Kurdistan, where the Company is exiting. These U.S. benefits amounted to$133.5 million in 2013. The effective income tax rate was significantly lower in 2012 than 2011 mostly due to
34
U.S. income tax benefits of $108.3 million recorded in 2012 associated with investments in upstream operationsin Republic of the Congo and Suriname. Additionally, 2012 had lower exploration expenses in foreignjurisdictions where no tax benefit is available at the present time due to lack of available revenue needed torealize a current or future benefit. Income tax expense in 2011 was reduced by a $25.6 million benefit forexpenses incurred in prior years in Block P, Malaysia. It was determined during 2011 that Block P expenses aredeductible against taxable income generated in Block K Malaysia. The effective tax rates in all three yearsexceeded the U.S. statutory tax rate of 35.0% due to higher overall foreign tax rates and exploration and otherexpenses in areas where current tax benefits cannot be recorded by the Company. Tax jurisdictions with nocurrent tax benefit on expenses primarily include certain non-revenue generating areas in Malaysia as well asother foreign exploration areas in which the Company operates. Each main exploration area in Malaysia iscurrently considered a distinct taxable entity and expenses in certain areas may not be used to offset revenuesgenerated in other areas. No tax benefits have thus far been recognized for costs incurred for Block H, offshoreSabah, and Blocks PM 311/312, offshore Peninsular Malaysia.
At December 31, 2013, 125.8 million barrels of the Company’s U.S. proved oil reserves and 72.4 billion cubicfeet of U.S. proved natural gas reserves were undeveloped. Approximately 93% of the total U.S. undevelopedreserves (on a barrel of oil equivalent basis) are associated with the Company’s Eagle Ford Shale operations inSouth Texas. Further drilling and facility construction are generally required to move the undeveloped reserves inthe Eagle Ford Shale area to developed. In the Western Canadian Sedimentary Basin, total proved undevelopednatural gas reserves totaled 178.8 billion cubic feet, with the migration of these reserves, primarily in the Tupperand Tupper West areas, dependent on both development drilling and completion of processing and transportationfacilities. In Block K Malaysia, oil reserves of 33.9 million barrels for the Kakap-Gumusut field are undevelopedpending completion of the main facilities and additional development drilling directed by another company.Additionally, the Kikeh field had undeveloped oil reserves of 7.7 million barrels, which are subject to furtherdrilling before being moved to developed, and the Siakap North-Petai field had undeveloped oil reserves of5.7 million barrels pending completion of development facilities. Also in Malaysia, there were 99.3 billion cubicfeet of undeveloped natural gas reserves at various fields offshore Sarawak at year-end 2013, which were heldunder the undeveloped category pending completion of development drilling and facilities. The deepwaters of theGulf of Mexico accounted for additional proved undeveloped reserves of 9.5 million equivalent barrels of oil atDecember 31, 2013. On a worldwide basis, the Company spent approximately $3.40 billion in 2013, $3.30billion in 2012 and $1.88 billion in 2011 to develop proved reserves.
Refining and Marketing – On August 30, 2013, the Company spun-off to shareholders its U.S. retail marketingbusiness. The now separate, publicly traded U.S. retail company named Murphy USA Inc. is listed on theNew York Stock Exchange under the symbol “MUSA”. Murphy Oil continues to actively market for sale its U.K.refining and marketing business. Both the U.S. and U.K. downstream businesses are reported as discontinuedoperations for all periods presented. Further discussion of the results of discontinued operations is includedfollowing the Corporate section.
Corporate – The after-tax costs of corporate activities, which include interest income, interest expense, foreignexchange gains and losses, and unallocated corporate overhead were $140.7 million in 2013, $98.5 million in2012 and $75.0 million in 2011.
The net cost of corporate activities in 2013 was $42.2 million more than in 2012, primarily due to higher netinterest and administrative expenses. These were partially offset by more favorable effects of foreign currencyexchange, which were associated with transactions denominated in currencies other than the respectiveoperation’s predominant functional currency. Interest income in 2013 was $2.5 million less than 2012,principally due to lower invested cash balances in Canada during the later year. Net interest expense, aftercapitalization of finance-related costs to development projects, was $57.0 million higher in 2013 than 2012. Thisunfavorable variance was principally due to higher average debt levels in the current year coupled with a higheraverage interest rate caused by a full year of long-term notes that were sold in 2012. These were partially offsetby higher amounts of interest capitalized to development projects in Malaysia in 2013. Administrative expenses
35
associated with corporate activities were $78.3 million higher in 2013 compared to 2012, primarily associatedwith higher overall employee compensation costs and professional service expenses related to separation of theU.S. downstream business. The effect of foreign currency exchange after taxes was a gain of $70.3 million in2013 compared to a minimal impact in 2012. The most significant impact from foreign currencies occurred inMalaysia, where the U.S. dollar generally strengthened against the Malaysian ringgit in 2013 after havingweakened against this currency during 2012. The stronger U.S. currency in 2013 reduced the dollar cost of taxliabilities in Malaysia which are payable in the local currency. The Malaysian operation’s functional currency isthe U.S. dollar. Foreign currency transaction effects in the U.K. were also favorable in 2013 compared to 2012.Income tax benefits associated with Corporate activities were $28.3 million higher in 2013, essentially in linewith the larger pretax net costs in the current year.
The net cost of corporate activities rose $23.5 million in 2012 compared to 2011. The most significant variancebetween years related to the effects of foreign currency exchange. While 2011 benefited from after-tax gains of$20.7 million from foreign currency exchange, the foreign currency effects in 2012 were minimal. During 2012,the after-tax impact of foreign exchange losses for Malaysian operations was essentially offset by after-taxforeign exchange benefits in the U.K. Interest income was $3.6 million less in 2012 compared to the prior year,with the variance primarily related to interest earned in 2011 on a U.S. Federal royalty refund. Administrativeexpenses for corporate activities were up $18.8 million in 2012 compared to 2011 due to both higher employeecompensation and higher professional services costs. The increase in professional services in 2012 was primarilyassociated with both preparing for separation of the U.S. R&M business and the intended sale of the U.K. R&Mbusiness. Net interest expense, after capitalization of finance-related costs to development projects, was $25.8million lower in 2012 than 2011 mostly due to larger amounts of interest capitalized on oil development projectsduring 2012. Income taxes associated with corporate activities in 2012 were unfavorable to 2011 primarily due topretax variances from foreign currency exchange effects.
Discontinued Operations – The Company has presented a number of businesses as discontinued operations inits consolidated financial statements. These businesses principally include:
• U.S. retail marketing company spun-off to shareholders on August 30, 2013. Results of operations areincluded in the Company’s financial statements through the date of spin-off.
• U.K. refining and marketing company held for sale at year-end 2013.
• U.K. oil and gas assets sold through a series of transactions in the first half of 2013. The Company’sfinancial statements include the results of operations through the respective date of asset sale, plus thecumulative gain realized upon sale. Total cash proceeds from sale of these assets were $282.2 million.
• Two former refineries in the U.S. that were sold on September 30, 2011 and October 1, 2011. TheCompany’s financial statements include the results of these operations through the date of sale, plus thenet gain associated with the disposals. Total cash proceeds from sale of these refineries amounted to$950.0 million.
The results of these operations for the last three years are reflected in the following table.
(Millions of dollars) 2013 2012 2011
U.S. refining and marketing $ 134.8 87.3 355.3U.K. refining and marketing (119.2) 52.2 (33.3)U.K. exploration and production 219.8 24.9 11.5
Income from discontinued operations $ 235.4 164.4 333.5
The U.S. refining and marketing (R&M) operations had better operating results in 2013 than 2012 primarily dueto an impairment charge of $61.0 million in 2012 ($39.6 million after taxes) to writedown the carrying value ofan ethanol plant. The U.K. R&M business incurred losses in 2013 following gains in 2012 due to both
36
significantly weaker margins at the Milford Haven, Wales refinery and a $73.0 million charge to writedown thecarrying value of the U.K. assets at year-end 2013. The overall composite unit margin for the U.K. R&Mbusiness was a negative $0.75 per barrel in 2013, down from a positive $1.94 per barrel in 2012. The U.K. E&Presults shown above include an after-tax gain on sale of $216.1 million in 2013, but operating profits were lowerin 2013 than 2012 due to only a partial year of operations prior to the property sales in the current year versus afull year of operations in the prior year. In 2012, U.S. R&M results were significantly below 2011 due to acombination of lower retail marketing margins, unfavorable results, including the impairment charge notedabove, for ethanol production operations in the later year, no repeat of U.S. refinery operating profits of$113.1 million from 2011, and a nonrecurring net gain after taxes of $18.7 million in 2011 on sale of the tworefineries. The net gain from disposal of the two refineries included a gain on sale of the Superior refinery andassociated inventories of $77.6 million and a loss on sale of the Meraux refinery and associated inventories of$58.9 million. The net gain on disposal was based on the selling prices of the refineries, plus the sales of allassociated inventories at fair value, which was significantly above the last-in, first-out carrying value of theseassets. U.K. R&M operations had much stronger results in 2012 compared to 2011 primarily due to strongerrefining margins in the later year. Overall unit margins were a positive $1.94 per barrel in 2012 and a negative$0.67 per barrel in 2011. The higher operating results for the U.K. E&P business in 2012 compared to 2011 wasmostly attributable to lower tax charges during the later year. In July 2012, the United Kingdom enacted taxchanges that limited tax relief on oil and gas decommissioning costs to 50%, a reduction from the 62% tax reliefpreviously allowed for these costs. This tax rate change led to a net reduction of income from this discontinuedoperation of $5.5 million in 2012. In 2011, the U.K. government enacted a 12% supplemental tax on oil and gascompany profits in that country. This tax increase reduced income from discontinued operations in 2011 by$14.5 million, primarily to increase the recorded balance for deferred income taxes that will be paid in futureyears at the new higher rate. The 2011 rate change increased the effective tax rate to 62% for oil and gasoperations in the U.K.
Capital Expenditures
As shown in the selected financial data on page 24 of this Form 10-K report, capital expenditures fromcontinuing operations, including exploration expenditures, were $3.97 billion in 2013, compared to $4.19 billionin 2012, and $2.75 billion in 2011. These amounts excluded capital expenditures of $154.6 million in 2013,$190.9 million in 2012 and $190.6 million in 2011 related to discontinued operations, which were associatedwith U.K. refining and marketing operations held for sale at the end of 2013, U.S. retail marketing operationsspun-off in August 2013, two U.S. petroleum refineries sold during 2011, and U.K. oil and gas assets sold in thefirst half of 2013. Capital expenditures included $435.3 million, $251.1 million and $371.2 million, respectively,in 2013, 2012 and 2011 for exploration costs that were expensed.
Capital expenditures for exploration and production continuing operations totaled $3.94 billion in 2013,$4.19 billion in 2012 and $2.75 billion in 2011. E&P capital expenditures in 2013 included $35.6 million forlease acquisitions, $493.7 million for exploration activities, and $3.41 billion for development projects. Leaseacquisitions were primarily related to acreage extensions in the Eagle Ford Shale area. Exploration activitiesincluded exploratory drilling primarily in the Gulf of Mexico, Australia, Cameroon and Brunei. Exploratoryactivities also included seismic and other geophysical costs primarily in the U.S., Australia, Indonesia, Vietnamand West Africa. Development expenditures in 2013 included $1.48 billion for the drilling and completionprogram in the Eagle Ford Shale; $230.9 million for fields in the Gulf of Mexico including Dalmatian whichstarts up in 2014; $156.7 million for synthetic oil operations; $140.4 million for heavy oil at Seal; $283.5 millionfor Kikeh; $136.7 million for Kakap-Gumusut; $214.6 million for Siakap North-Petai; $681.3 million forSarawak oil fields; and $49.6 million for Hibernia and Terra Nova offshore Newfoundland.
E&P capital expenditures in 2012 included $132.5 million for acquisition of undeveloped leases, which primarilyincluded leases acquired in the Gulf of Mexico, the Eagle Ford Shale area of South Texas and in NorthwestAlberta, Canada, $450.6 million for exploration activities, $3.29 billion for development projects and $311.5million for acquisition of proved properties in Canada and the Gulf of Mexico. Exploration activities primarily
37
included exploratory drilling in the United States, Southern Alberta in Canada, Block H in Malaysia, Republic ofthe Congo, the Kurdistan region of Iraq and Brunei. Other primary exploration activities were associated withgeophysical data acquisitions in the U.S. and various foreign countries. Development expenditures included$1.11 billion in the Eagle Ford Shale; $157.3 million at the Tupper and Tupper West areas; $200.1 million fordeepwater fields in the Gulf of Mexico; $627.8 million for Kikeh; $558.6 million for oil and natural gasdevelopment activities in SK Blocks 309/311; $107.0 million and $83.9 million for the Kakap-Gumusut andSiakap North-Petai developments, respectively, in Block K, Malaysia; $125.1 million for Syncrude; $222.4million for Western Canada heavy oil projects; and $73.1 million for the Terra Nova and Hibernia oil fields.
Capital expenditures in 2011 from E&P continuing operations included $279.3 million for undeveloped leaseacquisitions, $23.5 million associated with a contract revision at the Azurite field, $559.7 million of explorationactivities and $1.89 billion for development programs. Lease acquisitions were primarily associated withactivities in the Eagle Ford Shale area of South Texas and exploration concessions in the Kurdistan region ofIraq. Exploration costs principally related to exploratory drilling at resource plays in North America, includingthe Eagle Ford Shale in South Texas and new areas in Southern Alberta, plus wildcat drilling activities in Brunei,Indonesia and Suriname. Development projects in 2011 primarily included spend of $572.2 million at the Tupperand Tupper West natural gas areas in Western Canada; $153.7 million for Seal heavy oil area activities; $339.6million for the Kikeh field in Malaysia; $236.4 million for Sarawak SK Blocks 309/311 oil and gas projectsoffshore Malaysia; $115.7 million for the Kakap-Gumusut field in Block K, offshore Sabah Malaysia; $219.7million for work in the Eagle Ford Shale; and $73.9 million for synthetic oil operations at Syncrude.
Exploration and production capital expenditures are shown by major operating area on page F-56 of thisForm 10-K report.
Capital expenditures for discontinued operations included $114.3 million in 2013, $111.5 million in 2012 and$101.2 million in 2011 for U.S. retail marketing operations, which primarily included station construction andother improvements in each year. U.S. refining operations had capital expenditures of $47.0 million in 2011.U.K. refining and marketing operations had capital expenditures during the three years ended December 31, 2013of $32.2 million, $22.2 million and $22.2 million, respectively. U.K. E&P operations had capital expenditure of$8.1 million in 2013, $57.2 million in 2012 and $20.2 million in 2011.
Cash Flows
Operating activities – Cash provided by operating activities was $3.64 billion in 2013, $3.06 billion in 2012 and$2.15 billion in 2011. Cash flows associated with formerly owned U.S. downstream and U.K. oil and gasproduction businesses, plus the held for sale U.K. downstream businesses, have been classified as discontinuedoperations in the Company’s consolidated financial statements. Cash provided by operating activities includedcash from these discontinued operations of $427.8 million in 2013, $144.9 million in 2012 and $456.5 million in2011. Cash flow provided by continuing operations was $299.3 million higher in 2013 compared to 2012. Theincrease in 2013 was attributable to higher income from continuing operations, plus higher dry hole costs, higherdepreciation expense and a favorable impact from changes in working capital other than cash compared to theprior year. Cash provided by continuing operations in 2012 was $1.22 billion more than 2011 primarily due to alower use of cash to build working capital other than cash, higher income from continuing operations, and highernon-cash expenses for depreciation and deferred taxes in 2012. Cash provided by operating activities wasreduced by expenditures for abandonment of oil and gas properties totaling $51.6 million in 2013, $40.4 millionin 2012 and $21.5 million in 2011. Operating cash flows were reduced by payments of income taxes of$457.0 million in 2013, $567.0 million in 2012 and $938.9 million in 2011. The total reductions of operatingcash flows for interest paid during the three years ended December 31, 2013, 2012 and 2011 were$113.0 million, $48.7 million and $53.3 million, respectively.
Investing activities – Capital expenditures of the exploration and production business represent the mostsignificant component of investing activities. Property additions and dry hole costs for continuing operationsused cash of $3.59 billion in 2013, $3.54 billion in 2012 and $2.43 billion in 2011. Cash of $923.5 million,
38
$1.62 billion and $1.69 billion was spent in 2013, 2012 and 2011, respectively, to acquire Canadian governmentsecurities with maturities greater than 90 days at the time of purchase. Proceeds from maturities of Canadiangovernment securities with maturities greater than 90 days at date of acquisition were $664.3 million in 2013,$2.04 billion in 2012 and $1.77 billion in 2011. Cash proceeds of $27.4 million in 2011 from property salesclassified as continuing operations primarily related to disposal of gas storage assets in Spain. In 2013, the sale ofall U.K. oil and gas assets generated cash of $282.2 million. In 2011, the Company generated cash of $950.0million from sale of two U.S. refineries and associated marketing assets, including liquid inventories. Cashutilized for other investing activities of discontinued operations totaled $165.7 million in 2013, $192.5 million in2012 and $246.1 million in 2011 and mostly related to cash payments for capital expenditures.
Financing activities – During 2013, the Company borrowed additional long-term debt of $350.0 million, andprimarily used these borrowings to fund a portion of its capital program. The Company paid $500.0 million in2013 and $250.0 million in 2012 to repurchase 7.66 million shares and 3.87 million shares, respectively, of itsCommon stock. The Company received 0.28 million additional shares of its stock in 2014 upon completion of anaccelerated share repurchase agreement with a major financial institution that was still open at the end of 2013.Through December 31, 2013, the Company has spent $750.0 million of a $1.0 billion share buyback programapproved by the Board of Directors. Cash used for dividends to stockholders was $235.1 million in 2013, $714.4million in 2012 and $212.8 million in 2011. The Company increased its normal dividend rate by 14% in 2012 asthe annualized dividend was raised from $1.10 per share to $1.25 per share effective in the third quarter 2012.Additionally, in December 2012, the Company paid a special dividend of $2.50 per share. At the date of the spin-off, Murphy USA Inc. paid Murphy Oil Corporation cash of $650.0 million, which the Company primarily usedto partially repay outstanding debt. However, Murphy USA retained cash of $55.5 million at the time of theseparation. At December 31, 2013, the Company’s held for sale U.K. downstream business had cash of$301.3 million. This cash is classified within current assets held for sale on the Consolidated Balance Sheet atyear-end 2013, effectively removing this amount from the Company’s reported cash balance. During 2012, theCompany sold $2.0 billion of long-term notes. The proceeds of these notes were primarily used to repay $350.0million of notes that matured in 2012, to repay other debt, to fund a special dividend totaling $486.1 million, tofund a $250.0 million repurchase of Common stock, and to fund a portion of the Company’s development capitalexpenditures. During 2011, the Company used available cash flow to repay $340.0 million of debt. The debtreduction in 2011 was accomplished with proceeds from sale of the two U.S. refineries. Cash proceeds fromstock option exercises and employee stock purchase plans, including income tax benefits received on stockoptions, amounted to $4.2 million in 2013, $15.0 million in 2012 and $20.4 million in 2011. In 2013, theCompany paid $3.3 million of fees to increase the size of its committed credit facility from $1.5 billion to$2.0 billion and to extend the maturity date by one year to June 2017. In 2012, the Company paid $7.0 million offees and other expenses associated with sales of $2.0 billion of long-term notes. In 2011, the Company used cashof $7.9 million for fees and other expenses associated with renewing its primary $1.5 billion committed creditfacility that has now been increased to $2.0 billion of capacity. In 2013, 2012 and 2011, cash of $16.7 million,$3.3 million and $8.0 million, respectively, was used to pay statutory withholding taxes on stock-based incentiveawards that vested with a net-of-tax payout.
Financial Condition
Year-end working capital (total current assets less total current liabilities) amounted to $284.6 million at year-end2013 and $699.5 million in 2012. The current level of working capital does not fully reflect the Company’sliquidity position as the carrying value for inventories under last-in, first-out accounting was $268.6 millionbelow fair value for the held for sale U.K. downstream operations at December 31, 2013. Cash and cashequivalents at the end of 2013 totaled $750.2 million compared to $947.3 million at year-end 2012. In addition,the Company had short-term investments in Canadian government treasury securities of $374.8 million atyear-end 2013, up $259.2 million compared to 2012. These short-term Canadian government investments couldquickly be converted to cash if a need for funds in Canada arose.
Long-term debt increased by $691.4 million in 2013. Of this increase, $342.0 million related to a non-cashcapital lease of production equipment at the Kakap-Gumusut field, offshore Malaysia. The remainder of the debt
39
increase in 2013 was necessitated by a combination of capital expenditures, share buybacks and cash dividends,which in total exceeded cash generated from operating activities, sale of assets, and amounts paid to theCompany by Murphy USA Inc. at the separation date. At December 31, 2013, long-term debt was 25.5% of totalcapital employed. During 2012, long-term debt increased by $2.00 billion. A portion of the increase in long-termdebt in 2012 was associated with issuance of $500.0 million of long-term notes in May 2012. The proceeds fromthese notes were partially used to repay $350.0 million of notes that matured in May 2012. In late 2012, theCompany sold an additional $1.5 billion of long-term notes in the market. Part of the proceeds of these noteswere used to pay a $2.50 per share special dividend that totaled $486.1 million and to fund a $250.0 million stockbuyback. The remainder of the note proceeds were used to repay debt that was then outstanding under theCompany’s committed credit facility and to fund capital expenditures. At December 31, 2012, long-term debtrepresented 20.1% of total capital employed. Stockholders’ equity was $8.60 billion at the end of 2013 comparedto $8.94 billion at the end of 2012 and $8.78 billion at the end of 2011. Stockholders’ equity declined in 2013principally due to the spin-off of Murphy USA Inc. and Common stock repurchases during the year. A summaryof transactions in stockholders’ equity accounts is presented on page F-8 of this Form 10-K report.
Other changes in Murphy’s year-end 2013 balance sheet compared to 2012 included a $259.2 million increase inthe balance of short-term investments in Canadian government securities with maturities greater than 90 days atthe time of purchase. The total investment in these Canadian government securities was $374.8 million at year-end 2013 and $115.6 million at year-end 2012. These short-term investments increased in 2013 primarily due torepayment of an intercompany loan to the Company’s Canadian subsidiary by the U.K. downstream business inearly 2013. These slightly longer-term Canadian investments were purchased in each year because of a tightsupply of shorter-term securities available for purchase in Canada. A $853.5 million decrease in accountsreceivable in 2013 was primarily caused by the separation of Murphy USA Inc. (MUSA) on August 30, 2013 andthe reclassification of the U.K. downstream business as held for sale at year-end 2013. Inventory values were$458.1 million less at year-end 2013 than in 2012 mostly due to the MUSA separation and U.K. downstream heldfor sale reclassification. Prepaid expenses decreased $252.0 million in 2013 primarily due to collection of arefund of prepaid U.S. income taxes during 2013. Short-term deferred income tax assets were $27.0 millionlower at year-end 2013 compared to 2012 mostly due to reclassification of U.K. downstream deferred tax assetsto held for sale classification at year-end 2013. Current assets held for sale amounted to $943.7 million atDecember 31, 2013 and $15.1 million at December 31, 2012. The year-end 2013 amount primarily consisted ofcash, accounts receivable and inventory held by the U.K. downstream business, while the 2012 amountsprimarily represented accounts receivable and crude oil and other inventory costs associated with U.K. oil andgas producing assets sold in the first half of 2013. Net property, plant and equipment increased by $469.4 millionin 2013 as the level of property additions during the year exceeded the cumulative property amounts either spun-off in the MUSA separation, reclassified to held for sale for the U.K. downstream business or depreciated duringthe year. Goodwill decreased $2.8 million in 2013 due to a weaker Canadian dollar exchange rate versus the U.S.dollar at year-end 2013 compared to the prior year. Deferred charges and other assets decreased $53.1 million in2013 primarily due to deferred turnaround costs and other assets associated with the Milford Haven refinerybeing reclassified to assets held for sale. Assets held for sale-noncurrent of $381.4 million at December 31, 2013related to property and equipment, deferred turnaround costs and other noncurrent assets of the U.K. downstreambusiness, while the $208.2 million balance at year-end 2012 represented property and equipment associated withU.K. oil and gas producing assets sold in the first half of 2013. Current maturities of long-term debt at year-end2013 was $26.2 million higher than at the prior year-end due to 2014 payment obligations on a new capital leasecovering production equipment at the Kakap-Gumusut field, offshore Malaysia. Accounts payable decreased by$644.8 million at year-end 2013 compared to 2012 primarily due to lower capital and operating expenses owed tovendors in the U.S., Malaysia and Republic of the Congo at year-end 2013, plus reclassification of amounts owedfor purchased crude oil feedstocks at the Milford Haven refinery to current liabilities associated with assets heldfor sale in 2013. Income taxes payable was $3.1 million higher at year-end 2013 than at the end of 2012,primarily due to higher levels of taxes owed in 2013 for Malaysian operations. Other taxes payable at year-end2013 was $165.9 million lower than in 2012 mostly due to excise taxes owed by U.K. downstream operationsbeing reclassified to held for sale and the 2013 separation of the U.S. downstream business. Other accruedliabilities increased by $7.3 million at year-end 2013 mostly due to higher amounts owed for employee
40
compensation. The current portion of deferred income tax liabilities decreased $2.6 million in 2013 due tononrecurring short-term temporary differences for tax deductions in Canada in the prior year. Current liabilitiesassociated with assets held for sale of $639.1 million at December 31, 2013 primarily represented accountspayable and accrued liabilities for the U.K. downstream business held for sale. The comparable amount of$47.5 million at December 31, 2012 mostly consisted of U.K. oil and gas operations payables to vendors and taxauthorities. Noncurrent deferred income tax liabilities were $78.2 million lower at year-end 2013 mostly due toseparation of U.S. downstream operations and reclassification of the U.K. downstream balances to noncurrentliabilities associated with assets held for sale, partially offset by higher balances for remaining E&P operationsfor accelerated tax depreciation associated with the Company’s 2013 capital expenditures in the U.S. andMalaysia. The non-current liability associated with future asset retirement obligations increased by$128.2 million at year-end 2013 mostly due to additional wells drilled in 2013 and higher estimated future coststo abandon oil and gas properties in the U.S., Canada and Malaysia. Deferred credits and other liabilities were$177.5 million less in 2013 compared to 2012 primarily due to lower noncurrent retirement and postretirementplan liabilities and other long-term obligations at year-end 2013. Non-current liabilities associated with assetsheld for sale of $95.5 million at December 31, 2013 primarily represented deferred tax and pension liabilities ofthe U.K. downstream business, while the December 2012 balance of $141.2 million primarily representedabandonment and deferred tax obligations associated with U.K. oil and gas assets sold in 2013. Totalstockholders’ equity of the Company decreased by $346.3 million in 2013. The components of this decrease instockholders’ equity are reflected in the Consolidated Statement of Stockholders’ Equity on page F-8 of theconsolidated financial statements.
Murphy had commitments for future capital projects of approximately $1.84 billion at December 31, 2013. Thesecommitments included $706.9 million for field development and future work in Malaysia, $561.4 million forwork in the Eagle Ford Shale, $184.8 million for costs to develop deepwater Gulf of Mexico fields, and$78.9 million, $78.0 million and $76.2 million for future work commitments offshore Cameroon,Equatorial Guinea and Vietnam, respectively.
The primary sources of the Company’s liquidity are internally generated funds, access to outside financing andworking capital. The Company uses its internally generated funds to finance the major portion of its capital andother expenditures, but it also maintains lines of credit with banks and borrows as necessary to meet spendingrequirements. At December 31, 2013, the Company had access to a long-term committed credit facility in theamount of $2.0 billion. A total of $350.0 million was borrowed under the committed credit facility at year-end2013, leaving an additional $1.65 billion available for future needs. The most restrictive covenants under thiscommitted credit facility limit the Company’s long-term debt to capital ratio (as defined in the agreements) to60%. The committed credit facility expires in June 2017. At December 31, 2013, the Company had uncommittedbank credit lines of approximately $345.0 million, but no borrowings were outstanding under these lines. TheCompany’s ratio of long-term debt to total capital was 25.5% at year-end 2013. In October 2012, the Companyfiled a Form S-3 registration statement with the U.S. Securities and Exchange Commission which permits theoffer and sale of debt and/or equity securities. The Company used this shelf registration and a former one to selllong-term notes totaling $2.0 billion in 2012. The current shelf registration will expire in October 2015. Currentfinancing arrangements are set forth more fully in Note E to the consolidated financial statements. Based on theanticipated level of capital expenditures the Company has budgeted during 2014, the Company anticipates that itwill need to borrow under its long-term credit facility during 2014. The Company’s ratio of earnings to fixedcharges was 9.5 to 1 in 2013, 15.1 to 1 in 2012 and 13.0 to 1 in 2011.
Cash and invested cash are maintained in several operating locations outside the United States. At December 31,2013, cash, cash equivalents and cash temporarily invested in Canadian government securities with greater than90 day maturities held outside the U.S. included $421.1 million in Canada and $620.1 million in Malaysia. Incertain cases, the Company could incur taxes or other costs should these cash balances be repatriated to the U.S.in future periods. This could occur due to withholding taxes and/or potential additional U.S. tax burden when lessthan the U.S. tax rate of 35% has been paid for cash taxes in foreign locations. A lower cash tax rate is often paidin the U.S. and foreign countries in the early years of operations when accelerated tax deductions exist to incent
41
oil and gas investments; cash tax rates are generally higher in later years after accelerated tax deductions in earlyyears are exhausted. Canada collects a 5% withholding tax on any cash repatriated to the U.S. See Note H of theconsolidated financial statements for further information regarding potential tax expense that could be incurredupon distribution of foreign earnings back to the United States.
Environmental Matters
Murphy and other companies in the oil and gas industry are subject to numerous federal, state, local and foreignlaws and regulations dealing with the environment. Virtually all operations of the Company are affected by lawsand regulations covering environmental, health and safety matters. Compliance with existing and anticipatedenvironmental regulations affects Murphy’s overall cost of business, including capital costs to construct,maintain and upgrade equipment and facilities, and operating costs for ongoing environmental compliance.Murphy’s competitive position may be impacted to the extent that regulatory requirements with respect to aparticular production technology may give rise to costs that competitors might not bear. Environmentalregulations have historically been subject to frequent change by regulatory authorities and these are expected tocontinue to evolve in the foreseeable future. The Company is unable to predict the ongoing cost of complyingwith these laws and regulations or the future impact of such regulations on its operations. Violation of federal orstate environmental laws, regulations and permits can result in the imposition of significant civil and criminalpenalties, injunctions and construction bans or delays. A discharge of hazardous substances into the environmentcould, to the extent such event is not insured, subject Murphy to substantial expense, including both the cost tocomply with applicable regulations and claims by neighboring landowners and other third parties for anypersonal injury and property damage that might result. See page 18 for discussion of insurance coveragemaintained by the Company.
Murphy allocates a portion of its capital expenditure program to comply with environmental laws andregulations, and such capital expenditures were approximately $79 million in 2013 and are projected to beapproximately $104 million in 2014.
The most significant of those laws and the corresponding regulations affecting Murphy’s operations are:
• The U.S. Clean Air Act, which regulates air emissions, including greenhouse gas emissions
• The U.S. Clean Water Act, which regulates discharges into U.S. waters
• The U.S. Comprehensive Environmental Response, Compensation and Liability Act (CERCLA), whichaddresses liability for hazardous substance releases
• The U.S. Federal Resource Conservation and Recovery Act (RCRA), which regulates solid waste andhazardous waste treatment, storage and disposal
• The U.S. Federal Oil Pollution Act of 1990 (OPA90), which addresses liability for discharges of oilinto navigable waters of the United States
• The U.S Safe Drinking Water Act, which regulates disposal of wastewater into underground injectionwells
• The Federal Water Pollution Control Act of 1972 (FWPCA) also addressing discharge of pollutantsinto navigable waters
• The Department of the Interior governing offshore oil and gas operations.
• The European Union Regulation for Registration, Evaluation, Authorization and Restriction ofChemicals (REACH)
• The European Union Trading Directive resulting in European Emissions Trading Scheme
These laws and their associated regulations establish limits on emissions and standards for quality of air, waterand solid waste discharges. They also generally require permits for new or modified operations. Many states and
42
foreign countries where the Company operates also have or are in the process of developing similar statutes andregulations governing air and water as well as the characteristics and composition of refined products, which insome cases impose or could impose additional and more stringent requirements. Murphy is also subject to certainacts and regulations, including legal and administrative proceedings, governing remediation of wastes or oil spillsfrom current and past operations, which include but may not be limited to leaks from pipelines, undergroundstorage tanks and general environmental operations. Murphy is actively engaged in the legislative and regulatoryprocess, both nationally and internationally, in response to climate change issues and environmental and healthrelated matters.
Murphy’s Health, Safety & Environmental (HSE) Committee, a standing committee of the Board of Directors,was created to oversee and monitor the Company’s health, safety and environmental policies and practices. TheBoard has approved a worldwide health, safety and environmental (the HSE Policy), which is available on theCompany’s Web site. In addition to requiring that the Company comply with all applicable HSE laws andregulations, the HSE Policy includes a directive that the Company will continue to minimize the impact of itsoperations, products and services on the environment by implementing economically feasible projects thatpromote energy efficiency and use natural resources effectively.
CERCLA
CERCLA commonly referred to as the Superfund Act, and comparable state statutes, primarily address historiccontamination and impose joint and several liability upon Potentially Responsible Parties (PRP), without regardto fault or the legality of the original act that contributed to the release of a “hazardous substance” into theenvironment. Cleanup of contaminated sites is the responsibility of the owners and operators of the sites thatreleased, disposed, or arranged for the disposal of the hazardous substances found at the site. CERCLA requiresreporting to the National Response Center for releases to the environment of substances defined as hazardous orextremely hazardous if the released quantities exceed an EPA established reportable level. CERCLA alsoauthorizes the U.S. Environmental Protection Agency (EPA) and, in some instances, third parties to act inresponse to threats to the public health or the environment and to seek to recover the costs they incur from theresponsible persons. In the course of ordinary operations, the Company generates waste that falls withinCERCLA’s definition of a “hazardous substance.” Murphy may be jointly and severally liable under CERCLAfor all or part of the costs required to remediate sites at which such hazardous substances have been disposed ofor released into the environment.
The EPA currently considers Murphy to be a PRP at one Superfund site. The Company has thus far been unableto ascertain any association with the Superfund site based on its research of the facts associated with the site, andthe Company has notified the EPA accordingly. Based on currently available information, the Company believesthat it has no responsibility at this Superfund site. The potential total cost to all parties to perform necessaryremedial work at the site may be substantial. If proven to be responsible, the Company could be required to beara pro rata share of costs attributable to nonparticipating PRPs or could be assigned additional responsibility forremediation at this site. The Company believes that its share of the ultimate costs to remediate this Superfund sitewill be immaterial and will not have a material adverse effect on net income, financial condition or liquidity in afuture period. Murphy Oil Corporation has assigned its potential liability for one other Superfund site toMurphy USA Inc., and this company has accepted any potential responsibility for this site.
Waste
The Company currently owns or leases, and has in the past owned or leased, properties at which hazardoussubstances have been or are being handled. Although the Company has used operating and disposal practices thatwere standard in the industry at the time, hazardous substances may have been disposed of or released on orunder the properties owned or leased by the Company or on or under other locations where these wastes havebeen taken for disposal. In addition, many of these properties have been operated by third parties whosetreatment and disposal or release of hydrocarbons or other wastes were not under Murphy’s control. These
43
properties and the wastes disposed thereon may be subject to CERCLA, RCRA and analogous state laws. Undersuch laws Murphy could be required to remove or remediate previously disposed wastes (including wastesdisposed of or released by prior owners or operators), to clean up contaminated property (including contaminatedgroundwater) or to perform remedial plugging operations to prevent future contamination. While some of thesehistorical properties are in various stages of negotiation, investigation, and/or cleanup, Murphy is investigatingthe extent of any such liability and the availability of applicable defenses, and believe costs related to these siteswill not have a material adverse affect on its net income, financial condition or liquidity in a future period.Although certain environmental expenditures may be recovered from other sources, no assurance can be giventhat future recoveries from these sources will occur. Therefore, the Company has not recorded a benefit for likelyrecoveries as of December 31, 2013.
RCRA and comparable state statutes govern the management and disposal of solid wastes, with the moststringent regulations applicable to treatment, storage or disposal of hazardous wastes. Murphy generates non-hazardous solid wastes that are subject to the requirements of RCRA and comparable state statutes. TheCompany’s operating sites also incur costs to handle and dispose of hazardous waste and other chemicalsubstances. The costs of disposing of these substances are expensed as incurred and are not expected to have amaterial adverse effect on net income, financial condition or liquidity in a future period. However, it is possiblethat additional wastes, which could include wastes currently generated during operations, will in the future bedesignated as “hazardous wastes.” Hazardous wastes are subject to more rigorous and costly disposalrequirements than are non-hazardous wastes. Such changes in the regulations could result in additional capitalexpenditures and operating expenses.
Water
Under OPA90, owners and operators of tankers, owners and operators of onshore facilities and pipelines, andlessees or permittees of an area in which an offshore facility is located are liable for removal and cleanup costs ofoil discharges into navigable waters of the United States. The Company is not aware of OPA90 claims madeagainst Murphy.
Each Murphy offshore facility in the Gulf of Mexico has in place an Emergency Evacuation Plan (EEP) and allsuch facilities are covered by an Oil Spill Response Plan (OSRP). In the event of an explosion, personnel wouldbe evacuated immediately in accordance with the EEP. The appropriate OSRP would be activated if needed. Inthe event of an oil spill or containment event, the appropriate OSRP and Containment Plan would be executed asneeded. The EEP is approved by the U.S. Coast Guard (USCG) and the OSRP and Containment Plan areapproved by the Bureau of Ocean Energy Management (BOEM). The Company also has comprehensiveemergency and spill response plans for offshore facilities in international waters.
Murphy’s OSRP utilizes a consortium of seasoned and well equipped contract service companies to provideresponse equipment and personnel. One company has been contracted to provide spill containment and recoveryequipment, including skimmers, boom, and vessels such as fast response boats and high volume open seaskimmer barges. This company has hired other companies to store and maintain response equipment and providecertified tanks and barges. Murphy is a founding member of Marine Preservation Association, which providesaccess to Marine Spill Response Corporation assets to support marine spills in the Gulf of Mexico and otheroffshore areas. Additionally, Murphy has an agreement with another company to provide aerial dispersantspraying services, and has further contracted with another company to utilize their equipment for oil containmentshould a well blowout occur.
The Federal Water Pollution Control Act of 1972 (FWPCA) imposes restrictions and strict controls regarding thedischarge of pollutants into navigable waters. Permits must be obtained to discharge pollutants into state andfederal waters. The FWPCA imposes substantial potential liability for the costs of removal, remediation anddamages. Murphy maintains wastewater discharge permits for its facilities where required pursuant to theFWPCA and comparable state laws. Murphy has also applied for all necessary permits to discharge storm water
44
under such laws. The Company believes that compliance with existing permits and foreseeable new permitrequirements will not have a material adverse effect on net income, financial condition or liquidity in a futureperiod.
Murphy utilizes hydraulic fracturing technology for its exploration and production activities in the U.S. andCanada. Murphy is actively engaged in exploration and production in the Eagle Ford Shale play in South Texas.The State of Texas has adopted a law that requires oil and gas operators to publicly disclose to the RailroadCommission the chemicals and amount of water used in hydraulic fracturing of wells. The Provinces ofBritish Columbia and Alberta have also issued regulations related to hydraulic fracturing activities under theirjurisdictions. Murphy is in substantial compliance with these rules.
Air
Murphy’s U.S. operations are subject to the Federal Clean Air Act and comparable state and local statutes. TheCompany believes that its operations are in substantial compliance with these statutes in all states in which itoperates.
The European Union has adopted an Emissions Trading Scheme in response to the Kyoto Protocol in order toachieve reductions in greenhouse gas emissions. Murphy’s refinery at Milford Haven, Wales, currently has themost exposure to these requirements and may require purchase of emission allowances to maintain compliancewith environmental permit requirements. These environmental expenditures are expensed as incurred. In 2011,Murphy was notified by the Environment Agency (EA) that it failed to surrender proper emission allowances,which Murphy self-reported to the EA in 2010. The EA originally recommended a civil penalty of $1.7 millionfor this matter, however the matter has been resolved and no civil penalty was assessed or paid by the Company.
Climate Change
Currently, various national and international legislative and regulatory measures to address greenhouse gasemissions (including carbon dioxide, methane and nitrous oxides) are in various phases of discussion orimplementation. These include a promulgated EPA regulation, Mandatory Reporting of Greenhouse Gases fornumerous industrial business segments, including offshore production operations, which became effectiveDecember 29, 2009. These were followed by a regulation requiring Mandatory Reporting of Greenhouse Gasesfor Petroleum and Natural Gas Systems, including onshore exploration and production facilities, which becameeffective December 31, 2010 and was revised December 23, 2011. During 2011, U.S. federal legislation (EPA’sGreenhouse Gas Endangerment Finding, EPA’s Prevention of Significant Deterioration and Title V GreenhouseGas Tailoring Rule, Low Carbon Fuel Standards, etc.) and various state actions were proposed/finalized todevelop statewide or regional programs, each of which have or could impose mandatory reductions and reportingof greenhouse gas emissions. Murphy believes it has met all of the EPA required reporting deadlines and strivesto ensure accurate and consistent emissions data reporting. The impact of existing and pending climate changelegislation, regulations, international treaties and accords could result in increased costs to the Company to(i) operate and maintain facilities; (ii) install new emission controls on facilities; and (iii) administer and manageany greenhouse gas emissions trading program. The physical impacts of climate change present potential risksfor severe weather (floods, hurricanes, tornadoes, etc.) at its offshore platforms in the Gulf of Mexico and itsonshore operations in the Eagle Ford Shale play in South Texas. Commensurate with this risk is the possibility ofindirect financial and operational impacts to the Company from disruptions to the operations of major customersor suppliers caused by severe weather. The Company is unable to predict at this time how much the cost ofcompliance with any future legislation or regulation of greenhouse gas emissions, or the cost impact of naturalcatastrophic events resulting from climate change, if it occurs, will be in future periods.
Environmental Stewardship
The Company recognizes the importance of environmental stewardship as a core component of its mission as aresponsible international energy company and has implemented sufficient disclosure controls and procedures tocapture and process environmental, safety and climate-change related information. As a companion to Murphy’s
45
worldwide HSE Policy, the Company’s Web site also contains a statement on climate change. Not only does thisstatement on climate change include Murphy’s goal of reducing greenhouse gas emissions on an absolute basiswhile growing its upstream operations, the information on the Company’s Web site describes actions alreadytaken to move towards that goal. These efforts include incorporating climate change into the Company’splanning processes, reducing emissions, pursuing new opportunities and engaging legislative and regulatoryentities externally. In support of these efforts, worldwide greenhouse gas inventories have been conducted since2001. Additionally, Murphy participates in the Massachusetts Institute of Technology (MIT) Joint Program onthe Science and Policy of Global Change. The initiatives cited above demonstrate the Company’s commitmentregarding environmental issues, which are at the forefront of today’s global public policy dialogue.
Other Matters
The Company is involved in personal injury and property damage claims, allegedly caused by exposure to or bythe release or disposal of materials manufactured or used in its operations. Under Murphy’s accounting policies,an environmental liability is recorded when such an obligation is probable and the cost can be reasonablyestimated. If there is a range of reasonably estimated costs, the most likely amount will be recorded, or if noamount is most likely, the minimum of the range is used. Recorded liabilities are reviewed routinely. Actual cashexpenditures often occur one or more years after a liability is recognized.
Safety Matters
The Company is subject to the requirements of the Federal Occupational Safety and Health Act (OSHA) andcomparable state statutes that regulate the protection of the health and safety of workers. In addition, the OSHAhazard communication standard requires that certain information be maintained about hazardous materials usedor produced in Murphy’s operations and that this information be provided to employees, state and localgovernment authorities and citizens. The Company believes that its operations are in substantial compliance withOSHA requirements, including general industry standards, record-keeping requirements and monitoring ofoccupational exposure to regulated substances.
Other Matters
Impact of inflation – General inflation was moderate during the last three years in most countries where theCompany operates; however, the Company’s revenues and capital and operating costs are influenced to a largerextent by specific price changes in the oil and gas and allied industries than by changes in general inflation.Crude oil and petroleum product prices generally reflect the balance between supply and demand, with crude oilprices being particularly sensitive to OPEC production levels and/or attitudes of traders concerning supply anddemand in the near future. Natural gas prices are affected by supply and demand, which are often affected by theweather and by the fact that delivery of gas is generally restricted to specific geographic areas. Prices for oil fieldgoods and services have generally risen (with certain of these price increases such as drilling rig day rates havingbeen significant at times) during the last few years primarily driven by high demand for such goods and servicesin a strong oil price environment. As noted elsewhere, oil and natural gas prices have been extremely volatileover the last several years. Oil prices have been strong in the last few years, while North American natural gasprices have been weak due to oversupply of natural gas in this market. Oil prices in the current range of $90 perbarrel and above generally lead to strong demand for oil field services. The prices for oil field goods and servicesgenerally rise in periods of higher oil prices and do not usually decline as significantly when oil and gas pricesretreat. Should oil prices rise further in future periods, the Company anticipates that prices for certain oil fieldequipment and services could rise sharply. Due to the volatility of oil and natural gas prices, it is not possible todetermine what effect these prices will have on the future cost of oil field goods and services.
Accounting changes and recent accounting pronouncements – In December 2011, the FASB issued anaccounting standards update that requires enhanced disclosures about financial instruments and derivativeinstruments that are either offset in the balance sheet or are subject to an enforceable master netting arrangementor similar agreement. The guidance was effective for all interim and annual periods beginning on or afterJanuary 1, 2013. These disclosures are presented in Note P to the consolidated financial statements.
46
In February 2013, the FASB issued an accounting standards update that requires additional disclosures forreclassification adjustments from accumulated other comprehensive income (AOCI). These additionaldisclosures include changes in AOCI balances by component and significant items reclassified out of AOCI.These disclosures must be presented either on the face of the affected financial statement or in the notes to thefinancial statements. The disclosures were effective for Murphy Oil beginning in 2013 and are to be provided ona prospective basis. These disclosures are presented in Note O to the consolidated financial statements.
The United States Congress passed the Dodd-Frank Act (the Act) in 2010. As mandated by the Act, the U.S.Securities and Exchange Commission (SEC) issued rules regarding annual disclosures for purchases of “conflictminerals” and payments made to the U.S. Federal and all foreign governments by extractive industries, includingoil and gas companies. “Conflict minerals”’ are defined as tin, tantalum, tungsten and gold which originate fromthe Democratic Republic of Congo or adjoining countries. For companies to whom the rule applies, the firstannual report for conflict minerals must be filed by May 31, 2014 for the calendar year of 2013. Based on itsassessment, the Company has determined that the rule does not currently apply to it and, therefore, it is notrequired to file an annual “conflict minerals” report.
On July 2, 2013, the United States District Court for the District of Columbia vacated the SEC’s rules regardingreporting of payments made to the U.S. Federal and foreign governments. The D.C. Court found that the SECmisread the Act to mandate public disclosure of reports and that the denial of exemptions in the case of countriesthat prohibit public disclosures was improper. The Court remanded the matter to the SEC, which has indicatedthat it will restart the rulemaking process. The Company cannot predict how the SEC will alter its rules based onthe Court’s findings.
Significant accounting policies – In preparing the Company’s consolidated financial statements in accordancewith U.S. generally accepted accounting principles, management must make a number of estimates andassumptions related to the reporting of assets, liabilities, revenues and expenses and the disclosure of contingentassets and liabilities. Application of certain of the Company’s accounting policies requires significant estimates.The most significant of these accounting policies and estimates are described below.
• Proved oil and gas reserves – Proved oil and gas reserves are defined by the SEC as those quantities of oiland gas, which, by analysis of geoscience and engineering data, can be estimated with reasonable certaintyto be economically producible from a given date forward, from known reservoirs, and under existingeconomic conditions, operating methods, and government regulations before the time at which contractsproviding the right to operate expire, unless evidence indicates that renewal is reasonably certain, regardlessof whether a deterministic method or probabilistic method is used for the estimation. Proved developed oiland gas reserves are proved reserves that can be expected to be recovered through existing wells withexisting equipment and operating methods or in which the cost of the required equipment is relatively minorcompared with the cost of a new well, or through installed extraction equipment and infrastructureoperational at the time of the reserves estimate if the extraction is by means not involving a well. Althoughthe Company’s engineers are knowledgeable of and follow the guidelines for reserves as established by theSEC, the estimation of reserves requires the engineers to make a significant number of assumptions basedon professional judgment. SEC rules require the Company to use an unweighted average of the oil and gasprices in effect at the beginning of each month of the year for determining quantities of proved reserves.These historical prices often do not approximate the average price that the Company expects to receive forits oil and natural gas production in the future. The Company often uses significantly different oil andnatural gas price and reserve assumptions when making its own internal economic property evaluations.Estimated reserves are subject to future revision, certain of which could be substantial, based on theavailability of additional information, including: reservoir performance, new geological and geophysicaldata, additional drilling, technological advancements, price changes and other economic factors. Changes inoil and gas prices can lead to a decision to start-up or shut-in production, which can lead to revisions toreserves quantities. Reserves revisions inherently lead to adjustments of the Company’s depreciation ratesand the timing of settlement of asset retirement obligations. Downward reserves revisions can also lead to
47
significant impairment expense. The Company cannot predict the type of oil and natural gas reservesrevisions that will be required in future periods. The Company’s proved reserves of oil and natural gas arepresented on pages F-52 to F-55 of this Form 10-K report.
Murphy’s estimations for proved reserves were generated through the integration of available geoscience,engineering, and economic data, and commercially available technologies, to establish ‘reasonablecertainty’ of economic producibility. As defined by the SEC, reasonable certainty of proved reservesdescribes a high-degree of confidence that the quantities will be recovered. In estimating proved reserves,Murphy uses familiar industry-accepted methods for subsurface evaluations, including performance,volumetric, and analogue based studies. Where appropriate, Murphy includes reliable geologic andengineering technology to estimate proved reserves. Reliable geologic and engineering technology is amethod or combination of methods that are field-tested and have demonstrated to provide reasonably certainresults with consistency and repeatability in the formation being evaluated or in an analogous formation.This integrated approach increases the quality of and confidence in Murphy’s proved reserves estimates, andwas utilized in certain undrilled acreage at distances greater than the directly offsetting development spacingareas, and in certain reservoirs developed with the application of improved recovery techniques. Murphyutilized a combination of 3D seismic interpretation, core analysis, wellbore log measurements, well testdata, historic production and pressure data, and commercially available seismic processing and numericalreservoir simulation programs. Reservoir parameters from analogous reservoirs were used to strengthen thereserves estimates when available.
Oil proved reserves revisions
In 2013, a positive proved oil reserves revision in the U.S. was attributable to better well performance in theEagle Ford Shale, conversion of proved wet gas reserves to proved oil reserves that include natural gasliquids, and minor adds to several fields in the Gulf of Mexico. The 2013 positive revision for conventionaloil in Canada was caused by well performance at the Hibernia and Terra Nova fields. Synthetic oil revisionswere positive in 2013 primarily due to revised cost recovery factors for bitumen extraction followingrenegotiated royalty terms with the government. Positive revisions in Malaysia in 2013 were principallyattributable to well performance at Kikeh.
In 2012, proved oil reserves in the U.S. had positive revisions which arose from improved well performancein the Eagle Ford Shale area and at the Medusa field in the Gulf of Mexico. Negative conventional provedoil reserves revisions in Canada in 2012 occurred due to a lower recovery assessment for certain wellsdrilled in the Seal heavy oil area in Western Canada. Negative synthetic oil reserves revisions in 2012 atSyncrude were related to a change in entitlement that increased government royalties based on a recentprojection for future operating and capital spending. The negative proved oil reserves revision in Republicof the Congo was associated with poor well performance, a well that prematurely went off production, andgenerally uneconomic remaining future production levels.
In 2011, positive proved oil reserves revisions in the U.S. were primarily associated with better productionat the Medusa field in the Gulf of Mexico. Positive 2011 revisions for oil reserves of conventionaloperations in Canada were mostly attributable to better well performance at the Hibernia field, offshoreEastern Canada. Synthetic oil operations had positive reserves revisions in 2011 due to a change in royaltyrate. Positive oil reserves revisions in 2011 in Malaysia were primarily attributable to better productionperformance at the Kikeh field. Positive oil reserves revisions in the U.K. in 2011 were associated with theSchiehallion field which is being redeveloped by its owners. The negative revision in oil reserves inRepublic of the Congo in 2011 was attributable to poor production results for wells in the Azurite field.
Natural gas proved reserves revisions
In 2013, proved natural gas reserves in the U.S. had negative revisions primarily due to conversion ofproved wet gas reserves to proved residual gas reserves. Positive revisions in Canada in 2013 were mostly
48
attributable to better well performance in the Tupper West area. Malaysia had 2013 positive gas revisionsprincipally due to better well performance at gas fields offshore Sarawak. The Kikeh field also had positiverevisions due to better overall well performance.
During 2012, proved natural gas reserves in the U.S. had positive revisions due to improved wellperformance at several fields in the Gulf of Mexico, plus better well performance in the Eagle Ford Shalearea. Proved natural gas reserves in Canada were revised downward in 2012 due to weaker average naturalgas prices in the current year that adversely affected certain areas in the Montney formation of WesternCanada. Proved natural gas reserves in Malaysia in 2012 had positive revisions due to better wellperformance and favorable entitlement effects for gas operations offshore Sarawak.
In 2011, proved natural gas reserves in the U.S. had negative revisions due to well performance being lessthan expected in early wells drilled in the gas-prone regions of the Eagle Ford Shale in South Texas.Positive gas reserves revisions in Canada in 2011 were primarily at the Tupper and Tupper West areas basedon better than anticipated well performance. Negative gas reserves revisions in Malaysia in 2011 wereprimarily due to higher sales prices which effectively reduced the entitlement percentage for futureproduction at the Sarawak gas fields. Negative gas reserves revisions in the U.K. in 2011 were essentiallycaused by revised estimate of gas-cap volumes at the Mungo/Monan field.
• Successful efforts accounting – The Company utilizes the successful efforts method to account forexploration and development expenditures. Unsuccessful exploration wells are expensed and can have asignificant effect on net income. Successful exploration drilling costs and all development capitalexpenditures are capitalized and systematically charged to expense using the units of production methodbased on proved developed oil and natural gas reserves as estimated by the Company’s engineers. In somecases, a determination of whether a drilled well has found proved reserves cannot be made immediately.This is generally due to the need for a major capital expenditure to produce and/or evacuate thehydrocarbon(s) found. The determination of whether to make such a capital expenditure is, in turn, usuallydependent on whether additional exploratory wells find a sufficient quantity of additional reserves. Undercurrent accounting rules, the Company holds well costs in Property, Plant and Equipment in theConsolidated Balance Sheet when the well has found a sufficient quantity of reserves to justify itscompletion as a producing well and the Company is making sufficient progress assessing the reserves andthe economic and operating viability of the project.
Based on the time required to complete further exploration and appraisal drilling in areas wherehydrocarbons have been found but proved reserves have not been booked, dry hole expense may berecorded one or more years after the original drilling costs are incurred. In 2013, two wells offshoreSarawak drilled in 2005 and 2006 were expensed when the Company decided not to move forward withdevelopment plans for this area. In 2012, a well in the MPN block offshore Republic of the Congo wasexpensed. This well had been drilled in late 2010 and was held until another well nearby could be drilled;the nearby well was unsuccessfully drilled in 2012. Also in 2012, two wells drilled offshore Sarawak in2008 were expensed following a decision to halt development plans for these wells. Additionally in 2012, awell drilled in the Gulf of Mexico in 2010 was expensed following the owners’ decision not to develop thewell. In 2011, a dry hole was recorded for a well drilled in Republic of the Congo in 2009. A significantreduction in proved oil reserves at the Azurite field in the same MPS block during 2011 reduced thelikelihood of this well being produced in future years.
• Impairment of long-lived assets – The Company continually monitors its long-lived assets recorded inProperty, Plant and Equipment and Goodwill in the Consolidated Balance Sheet to make sure that they arefairly presented. The Company must evaluate its properties for potential impairment when circumstancesindicate that the carrying value of an asset may not be recoverable from future cash flows. Goodwill isevaluated for impairment at least annually. A significant amount of judgment is involved in performingthese evaluations since the results are based on estimated future events. Such events include a projection offuture oil and natural gas sales prices, an estimate of the amount of oil and natural gas that will be producedfrom a field, the timing of this future production, future costs to produce the oil and natural gas, future
49
capital and abandonment costs, future margins on refined products, and future inflation levels. The need totest a long-lived asset for impairment can be based on several factors, including but not limited to asignificant reduction in sales prices for oil and/or natural gas, unfavorable revisions of oil or natural gasreserves, expected deterioration of future margins for refining and/or marketing operations, or other changesto contracts, environmental regulations or tax laws. All of these same factors must be considered whenevaluating a property’s carrying value for possible impairment. In making its impairment assessmentsinvolving exploration and production property and equipment, the Company must make a number ofprojections involving future oil and natural gas sales prices, future production volumes, and future capitaland operating costs. Due to the volatility of world oil and gas markets, the actual sales prices for oil andnatural gas have often been quite different from the Company’s projections. Estimates of future oil and gasproduction and sales volumes are based on a combination of proved and risked probable and possiblereserves. Although the estimation of reserves and future production is uncertain, the Company believes thatits estimates are reasonable; however, there have been cases where actual production volumes were higheror lower than projected and the timing was different than the original projection. The Company adjustsreserves and production estimates as new information becomes available. The Company generally projectsfuture costs by using historical costs adjusted for both assumed long-term inflation rates and known orexpected changes in future operations. Although the projected future costs are considered to be reasonable,at times, costs have been higher or lower than originally estimated. In assessing potential impairmentinvolving refining and marketing assets, the Company evaluates its properties when circumstances indicatethat the carrying value of an asset may not be recoverable from future cash flows. A significant amount ofjudgment is involved in performing these evaluations since the results are based on estimated future events,which include projections of future margins, future capital expenditures and future operating expenses.
Future marketing or operating decisions, such as closing or selling certain assets, and future regulatory ortax changes could also impact the Company’s conclusion about potential asset impairment. Murphyrecorded impairment expense of $21.6 million in 2013 related to the sale of Kainai properties in WesternCanada at less than carrying value. The Company recorded a $73.0 million writedown in 2013 fordiscontinued U.K. refining and marketing operations based on an assessment of the fair value of these assetsbased on the status of the ongoing sale process. The Company recorded impairment expense in 2012 of$200.0 million for the Azurite field, offshore Republic of the Congo, and $61.0 million in discontinuedoperations for the Hereford, Texas ethanol production facility. The Congo impairment was necessitated byremoval of all proved oil reserves at Azurite following an unsuccessful redrill of a well; this result led touneconomic future oil production operations for the field. The Hereford ethanol plant impairment was basedon an expectation of continued weak future ethanol margins at the production facility owned by theCompany’s U.S. downstream subsidiary that was spun-off in 2013. The Hereford impairment wasdetermined using available years of futures prices for corn and ethanol, plus a terminal value based on areasonable multiple of the final year’s cash flow. Impairment expense of $368.6 million was recognized in2011 to reduce the carrying value of the Azurite oil field, offshore Republic of the Congo, to fair value. Theexpense was necessitated by a significant year-end 2011 reduction of proved oil reserves at this field whichwas caused by poor well performance. Based on an evaluation of expected future cash flows from propertiesat year-end 2013, the Company does not believe it had any other significant properties with carrying valuesthat were impaired at that date. The expected future sales prices for crude oil and natural gas used in theevaluation were based on quoted future prices for the respective production periods. These quoted prices areoften based on an expectation of continued strong oil prices, and normally stronger North American naturalgas prices in the future compared to the existing spot prices at the time of assessment. If quoted prices forfuture years had been lower, the smaller projected cash flows for properties could have led to significantimpairment charges being recorded for certain properties in 2013. In addition, one or a combination of otherfactors such as lower future production volumes, higher future costs, lower future margins on refining andmarketing, or the actions of government authorities could lead to impairment expenses in future periods.Based on these unknown future factors as described herein, the Company cannot predict the amount ortiming of impairment expenses that may be recorded in the future.
50
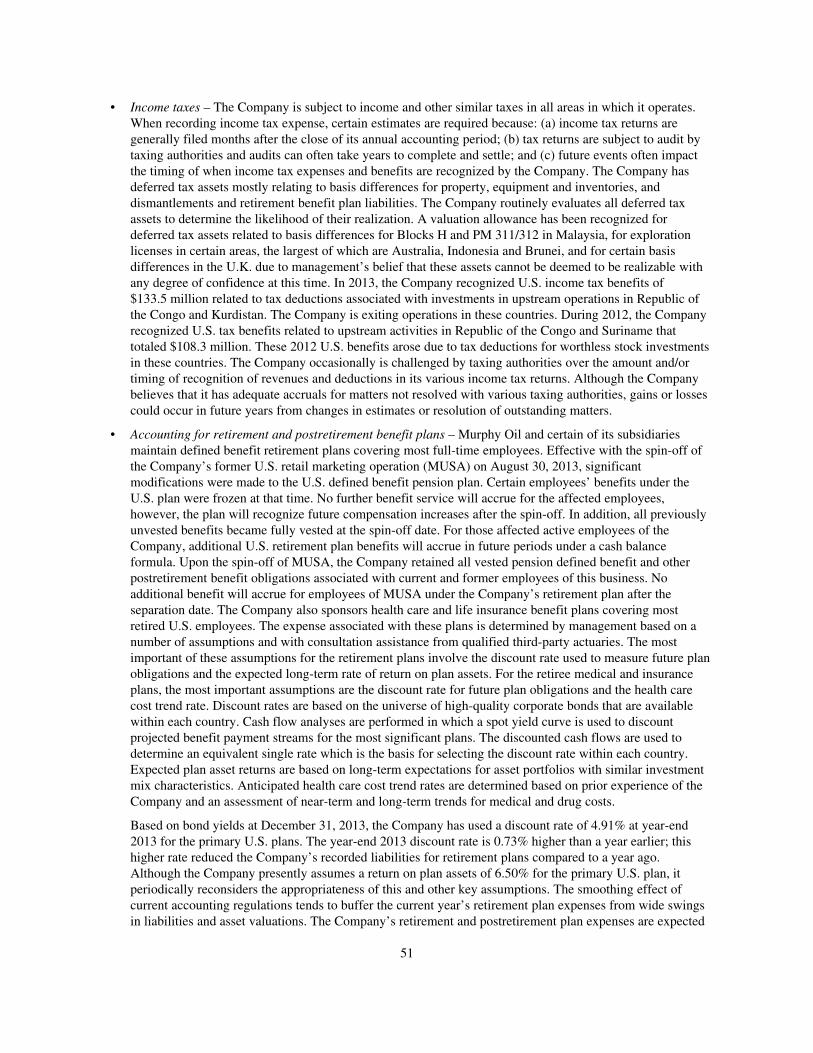
• Income taxes – The Company is subject to income and other similar taxes in all areas in which it operates.When recording income tax expense, certain estimates are required because: (a) income tax returns aregenerally filed months after the close of its annual accounting period; (b) tax returns are subject to audit bytaxing authorities and audits can often take years to complete and settle; and (c) future events often impactthe timing of when income tax expenses and benefits are recognized by the Company. The Company hasdeferred tax assets mostly relating to basis differences for property, equipment and inventories, anddismantlements and retirement benefit plan liabilities. The Company routinely evaluates all deferred taxassets to determine the likelihood of their realization. A valuation allowance has been recognized fordeferred tax assets related to basis differences for Blocks H and PM 311/312 in Malaysia, for explorationlicenses in certain areas, the largest of which are Australia, Indonesia and Brunei, and for certain basisdifferences in the U.K. due to management’s belief that these assets cannot be deemed to be realizable withany degree of confidence at this time. In 2013, the Company recognized U.S. income tax benefits of$133.5 million related to tax deductions associated with investments in upstream operations in Republic ofthe Congo and Kurdistan. The Company is exiting operations in these countries. During 2012, the Companyrecognized U.S. tax benefits related to upstream activities in Republic of the Congo and Suriname thattotaled $108.3 million. These 2012 U.S. benefits arose due to tax deductions for worthless stock investmentsin these countries. The Company occasionally is challenged by taxing authorities over the amount and/ortiming of recognition of revenues and deductions in its various income tax returns. Although the Companybelieves that it has adequate accruals for matters not resolved with various taxing authorities, gains or lossescould occur in future years from changes in estimates or resolution of outstanding matters.
• Accounting for retirement and postretirement benefit plans – Murphy Oil and certain of its subsidiariesmaintain defined benefit retirement plans covering most full-time employees. Effective with the spin-off ofthe Company’s former U.S. retail marketing operation (MUSA) on August 30, 2013, significantmodifications were made to the U.S. defined benefit pension plan. Certain employees’ benefits under theU.S. plan were frozen at that time. No further benefit service will accrue for the affected employees,however, the plan will recognize future compensation increases after the spin-off. In addition, all previouslyunvested benefits became fully vested at the spin-off date. For those affected active employees of theCompany, additional U.S. retirement plan benefits will accrue in future periods under a cash balanceformula. Upon the spin-off of MUSA, the Company retained all vested pension defined benefit and otherpostretirement benefit obligations associated with current and former employees of this business. Noadditional benefit will accrue for employees of MUSA under the Company’s retirement plan after theseparation date. The Company also sponsors health care and life insurance benefit plans covering mostretired U.S. employees. The expense associated with these plans is determined by management based on anumber of assumptions and with consultation assistance from qualified third-party actuaries. The mostimportant of these assumptions for the retirement plans involve the discount rate used to measure future planobligations and the expected long-term rate of return on plan assets. For the retiree medical and insuranceplans, the most important assumptions are the discount rate for future plan obligations and the health carecost trend rate. Discount rates are based on the universe of high-quality corporate bonds that are availablewithin each country. Cash flow analyses are performed in which a spot yield curve is used to discountprojected benefit payment streams for the most significant plans. The discounted cash flows are used todetermine an equivalent single rate which is the basis for selecting the discount rate within each country.Expected plan asset returns are based on long-term expectations for asset portfolios with similar investmentmix characteristics. Anticipated health care cost trend rates are determined based on prior experience of theCompany and an assessment of near-term and long-term trends for medical and drug costs.
Based on bond yields at December 31, 2013, the Company has used a discount rate of 4.91% at year-end2013 for the primary U.S. plans. The year-end 2013 discount rate is 0.73% higher than a year earlier; thishigher rate reduced the Company’s recorded liabilities for retirement plans compared to a year ago.Although the Company presently assumes a return on plan assets of 6.50% for the primary U.S. plan, itperiodically reconsiders the appropriateness of this and other key assumptions. The smoothing effect ofcurrent accounting regulations tends to buffer the current year’s retirement plan expenses from wide swingsin liabilities and asset valuations. The Company’s retirement and postretirement plan expenses are expected
51
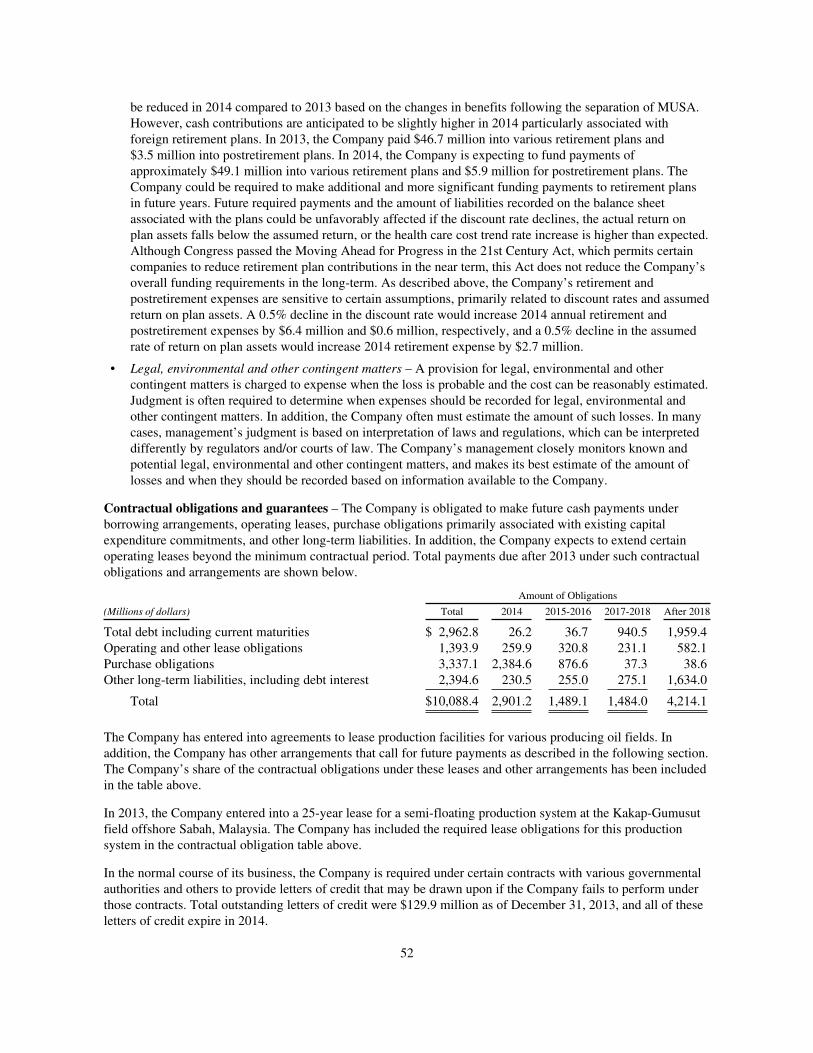
be reduced in 2014 compared to 2013 based on the changes in benefits following the separation of MUSA.However, cash contributions are anticipated to be slightly higher in 2014 particularly associated withforeign retirement plans. In 2013, the Company paid $46.7 million into various retirement plans and$3.5 million into postretirement plans. In 2014, the Company is expecting to fund payments ofapproximately $49.1 million into various retirement plans and $5.9 million for postretirement plans. TheCompany could be required to make additional and more significant funding payments to retirement plansin future years. Future required payments and the amount of liabilities recorded on the balance sheetassociated with the plans could be unfavorably affected if the discount rate declines, the actual return onplan assets falls below the assumed return, or the health care cost trend rate increase is higher than expected.Although Congress passed the Moving Ahead for Progress in the 21st Century Act, which permits certaincompanies to reduce retirement plan contributions in the near term, this Act does not reduce the Company’soverall funding requirements in the long-term. As described above, the Company’s retirement andpostretirement expenses are sensitive to certain assumptions, primarily related to discount rates and assumedreturn on plan assets. A 0.5% decline in the discount rate would increase 2014 annual retirement andpostretirement expenses by $6.4 million and $0.6 million, respectively, and a 0.5% decline in the assumedrate of return on plan assets would increase 2014 retirement expense by $2.7 million.
• Legal, environmental and other contingent matters – A provision for legal, environmental and othercontingent matters is charged to expense when the loss is probable and the cost can be reasonably estimated.Judgment is often required to determine when expenses should be recorded for legal, environmental andother contingent matters. In addition, the Company often must estimate the amount of such losses. In manycases, management’s judgment is based on interpretation of laws and regulations, which can be interpreteddifferently by regulators and/or courts of law. The Company’s management closely monitors known andpotential legal, environmental and other contingent matters, and makes its best estimate of the amount oflosses and when they should be recorded based on information available to the Company.
Contractual obligations and guarantees – The Company is obligated to make future cash payments underborrowing arrangements, operating leases, purchase obligations primarily associated with existing capitalexpenditure commitments, and other long-term liabilities. In addition, the Company expects to extend certainoperating leases beyond the minimum contractual period. Total payments due after 2013 under such contractualobligations and arrangements are shown below.
Amount of Obligations
(Millions of dollars) Total 2014 2015-2016 2017-2018 After 2018
Total debt including current maturities $ 2,962.8 26.2 36.7 940.5 1,959.4Operating and other lease obligations 1,393.9 259.9 320.8 231.1 582.1Purchase obligations 3,337.1 2,384.6 876.6 37.3 38.6Other long-term liabilities, including debt interest 2,394.6 230.5 255.0 275.1 1,634.0
Total $10,088.4 2,901.2 1,489.1 1,484.0 4,214.1
The Company has entered into agreements to lease production facilities for various producing oil fields. Inaddition, the Company has other arrangements that call for future payments as described in the following section.The Company’s share of the contractual obligations under these leases and other arrangements has been includedin the table above.
In 2013, the Company entered into a 25-year lease for a semi-floating production system at the Kakap-Gumusutfield offshore Sabah, Malaysia. The Company has included the required lease obligations for this productionsystem in the contractual obligation table above.
In the normal course of its business, the Company is required under certain contracts with various governmentalauthorities and others to provide letters of credit that may be drawn upon if the Company fails to perform underthose contracts. Total outstanding letters of credit were $129.9 million as of December 31, 2013, and all of theseletters of credit expire in 2014.
52
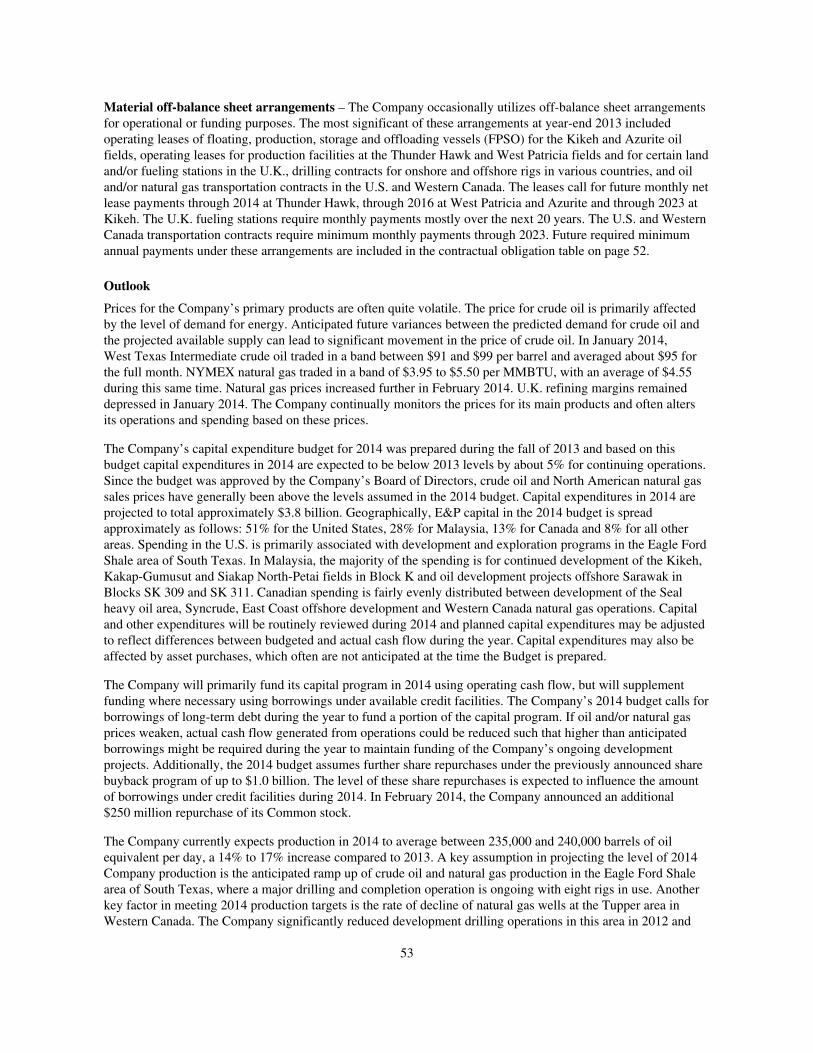
Material off-balance sheet arrangements – The Company occasionally utilizes off-balance sheet arrangementsfor operational or funding purposes. The most significant of these arrangements at year-end 2013 includedoperating leases of floating, production, storage and offloading vessels (FPSO) for the Kikeh and Azurite oilfields, operating leases for production facilities at the Thunder Hawk and West Patricia fields and for certain landand/or fueling stations in the U.K., drilling contracts for onshore and offshore rigs in various countries, and oiland/or natural gas transportation contracts in the U.S. and Western Canada. The leases call for future monthly netlease payments through 2014 at Thunder Hawk, through 2016 at West Patricia and Azurite and through 2023 atKikeh. The U.K. fueling stations require monthly payments mostly over the next 20 years. The U.S. and WesternCanada transportation contracts require minimum monthly payments through 2023. Future required minimumannual payments under these arrangements are included in the contractual obligation table on page 52.
Outlook
Prices for the Company’s primary products are often quite volatile. The price for crude oil is primarily affectedby the level of demand for energy. Anticipated future variances between the predicted demand for crude oil andthe projected available supply can lead to significant movement in the price of crude oil. In January 2014,West Texas Intermediate crude oil traded in a band between $91 and $99 per barrel and averaged about $95 forthe full month. NYMEX natural gas traded in a band of $3.95 to $5.50 per MMBTU, with an average of $4.55during this same time. Natural gas prices increased further in February 2014. U.K. refining margins remaineddepressed in January 2014. The Company continually monitors the prices for its main products and often altersits operations and spending based on these prices.
The Company’s capital expenditure budget for 2014 was prepared during the fall of 2013 and based on thisbudget capital expenditures in 2014 are expected to be below 2013 levels by about 5% for continuing operations.Since the budget was approved by the Company’s Board of Directors, crude oil and North American natural gassales prices have generally been above the levels assumed in the 2014 budget. Capital expenditures in 2014 areprojected to total approximately $3.8 billion. Geographically, E&P capital in the 2014 budget is spreadapproximately as follows: 51% for the United States, 28% for Malaysia, 13% for Canada and 8% for all otherareas. Spending in the U.S. is primarily associated with development and exploration programs in the Eagle FordShale area of South Texas. In Malaysia, the majority of the spending is for continued development of the Kikeh,Kakap-Gumusut and Siakap North-Petai fields in Block K and oil development projects offshore Sarawak inBlocks SK 309 and SK 311. Canadian spending is fairly evenly distributed between development of the Sealheavy oil area, Syncrude, East Coast offshore development and Western Canada natural gas operations. Capitaland other expenditures will be routinely reviewed during 2014 and planned capital expenditures may be adjustedto reflect differences between budgeted and actual cash flow during the year. Capital expenditures may also beaffected by asset purchases, which often are not anticipated at the time the Budget is prepared.
The Company will primarily fund its capital program in 2014 using operating cash flow, but will supplementfunding where necessary using borrowings under available credit facilities. The Company’s 2014 budget calls forborrowings of long-term debt during the year to fund a portion of the capital program. If oil and/or natural gasprices weaken, actual cash flow generated from operations could be reduced such that higher than anticipatedborrowings might be required during the year to maintain funding of the Company’s ongoing developmentprojects. Additionally, the 2014 budget assumes further share repurchases under the previously announced sharebuyback program of up to $1.0 billion. The level of these share repurchases is expected to influence the amountof borrowings under credit facilities during 2014. In February 2014, the Company announced an additional$250 million repurchase of its Common stock.
The Company currently expects production in 2014 to average between 235,000 and 240,000 barrels of oilequivalent per day, a 14% to 17% increase compared to 2013. A key assumption in projecting the level of 2014Company production is the anticipated ramp up of crude oil and natural gas production in the Eagle Ford Shalearea of South Texas, where a major drilling and completion operation is ongoing with eight rigs in use. Anotherkey factor in meeting 2014 production targets is the rate of decline of natural gas wells at the Tupper area inWestern Canada. The Company significantly reduced development drilling operations in this area in 2012 and
53
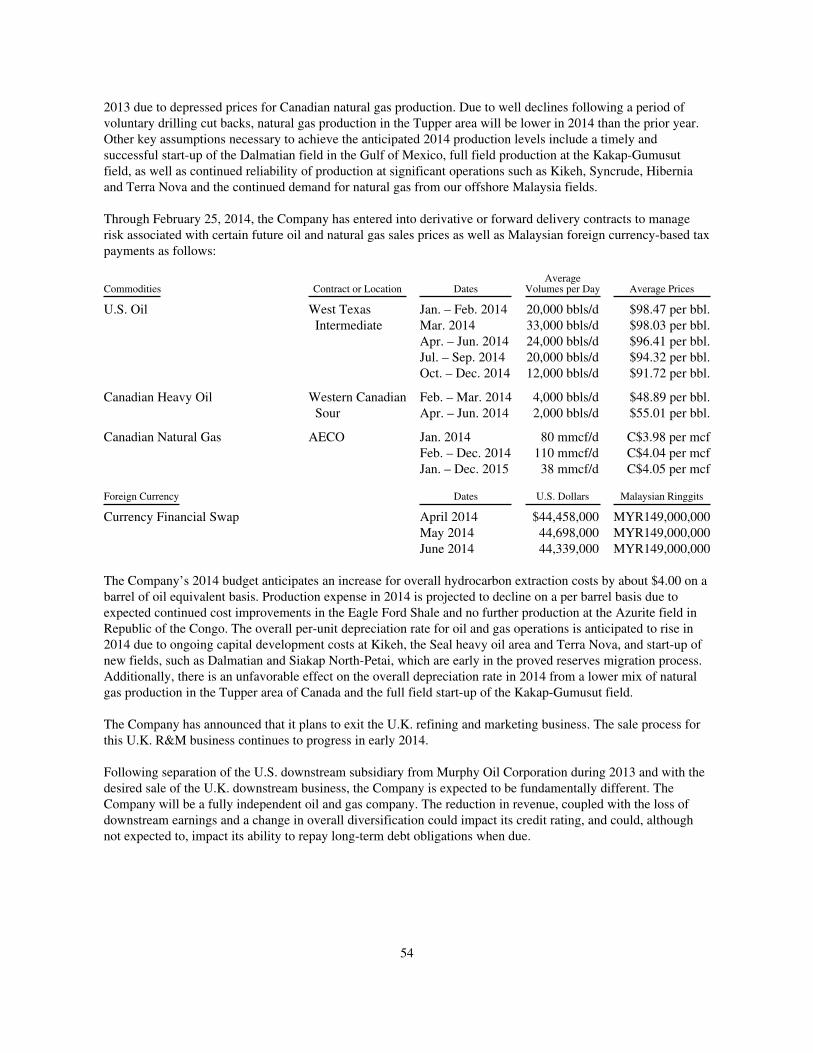
2013 due to depressed prices for Canadian natural gas production. Due to well declines following a period ofvoluntary drilling cut backs, natural gas production in the Tupper area will be lower in 2014 than the prior year.Other key assumptions necessary to achieve the anticipated 2014 production levels include a timely andsuccessful start-up of the Dalmatian field in the Gulf of Mexico, full field production at the Kakap-Gumusutfield, as well as continued reliability of production at significant operations such as Kikeh, Syncrude, Hiberniaand Terra Nova and the continued demand for natural gas from our offshore Malaysia fields.
Through February 25, 2014, the Company has entered into derivative or forward delivery contracts to managerisk associated with certain future oil and natural gas sales prices as well as Malaysian foreign currency-based taxpayments as follows:
Commodities Contract or Location DatesAverage
Volumes per Day Average Prices
U.S. Oil West Texas Jan. – Feb. 2014 20,000 bbls/d $98.47 per bbl.Intermediate Mar. 2014 33,000 bbls/d $98.03 per bbl.
Apr. – Jun. 2014 24,000 bbls/d $96.41 per bbl.Jul. – Sep. 2014 20,000 bbls/d $94.32 per bbl.Oct. – Dec. 2014 12,000 bbls/d $91.72 per bbl.
Canadian Heavy Oil Western Canadian Feb. – Mar. 2014 4,000 bbls/d $48.89 per bbl.Sour Apr. – Jun. 2014 2,000 bbls/d $55.01 per bbl.
Canadian Natural Gas AECO Jan. 2014 80 mmcf/d C$3.98 per mcfFeb. – Dec. 2014 110 mmcf/d C$4.04 per mcfJan. – Dec. 2015 38 mmcf/d C$4.05 per mcf
Foreign Currency Dates U.S. Dollars Malaysian Ringgits
Currency Financial Swap April 2014 $44,458,000 MYR149,000,000May 2014 44,698,000 MYR149,000,000June 2014 44,339,000 MYR149,000,000
The Company’s 2014 budget anticipates an increase for overall hydrocarbon extraction costs by about $4.00 on abarrel of oil equivalent basis. Production expense in 2014 is projected to decline on a per barrel basis due toexpected continued cost improvements in the Eagle Ford Shale and no further production at the Azurite field inRepublic of the Congo. The overall per-unit depreciation rate for oil and gas operations is anticipated to rise in2014 due to ongoing capital development costs at Kikeh, the Seal heavy oil area and Terra Nova, and start-up ofnew fields, such as Dalmatian and Siakap North-Petai, which are early in the proved reserves migration process.Additionally, there is an unfavorable effect on the overall depreciation rate in 2014 from a lower mix of naturalgas production in the Tupper area of Canada and the full field start-up of the Kakap-Gumusut field.
The Company has announced that it plans to exit the U.K. refining and marketing business. The sale process forthis U.K. R&M business continues to progress in early 2014.
Following separation of the U.S. downstream subsidiary from Murphy Oil Corporation during 2013 and with thedesired sale of the U.K. downstream business, the Company is expected to be fundamentally different. TheCompany will be a fully independent oil and gas company. The reduction in revenue, coupled with the loss ofdownstream earnings and a change in overall diversification could impact its credit rating, and could, althoughnot expected to, impact its ability to repay long-term debt obligations when due.
54
Forward-Looking Statements
This Form 10-K contains forward-looking statements as defined in the Private Securities Litigation Reform Actof 1995. These statements, which express management’s current views concerning future events or results, aresubject to inherent risks and uncertainties. Factors that could cause actual results to differ materially from thoseexpressed or implied in our forward-looking statements include, but are not limited to, the volatility and level ofcrude oil and natural gas prices, the level and success rate of our exploration programs, our ability to maintainproduction rates and replace reserves, customer demand for our products, adverse foreign exchange movements,political and regulatory instability, and uncontrollable natural hazards. Factors that could cause the forecastedsale of the Company’s U.K. downstream business, as discussed in this Form 10-K, not to occur include, but arenot limited to, a failure to obtain necessary regulatory approvals, a deterioration in the business or prospects ofMurphy or its U.K. downstream subsidiary, adverse developments in Murphy or its U.K. downstreamsubsidiary’s markets, adverse developments in the U.S. or global capital markets, credit markets or economiesgenerally, and a failure to execute a sale of these U.K. operations on acceptable terms. For further discussion ofrisk factors, see Item 1A. Risk Factors, which begins on page 14 of this Annual Report on Form 10-K. Murphyundertakes no duty to publicly update or revise any forward-looking statements.
Item 7A. QUANTITATIVE AND QUALITATIVE DISCLOSURES ABOUTMARKET RISK
The Company is exposed to market risks associated with interest rates, prices of crude oil, natural gas andpetroleum products, and foreign currency exchange rates. Murphy uses derivative financial and commodityinstruments to manage risks associated with existing or anticipated transactions.
As described in Note K, there were short-term derivative foreign exchange contracts in place at December 31,2013 to hedge the value of U.S. dollar based receivables against the Canadian dollar. A 10% strengthening of theU.S. dollar against the Canadian dollar would have increased the recorded net liability associated with thesecontracts by approximately $2.9 million, while a 10% weakening of the U.S. dollar would have reduced therecorded net liability by approximately $3.6 million. Changes in the fair value of these derivative contractsgenerally offset the financial statement impact of an equivalent volume of foreign currency exposures associatedwith other assets and/or liabilities.
There were also commodity derivative contracts in place at December 31, 2013 to hedge the sales price of certainEagle Ford Shale oil production in 2014. A 10% increase in the respective benchmark price of these commoditieswould have reduced the recorded net asset associated with these derivative contracts by approximately$41.5 million, while a 10% decrease would have increased the recorded net asset by a similar amount.
Item 8. FINANCIAL STATEMENTS AND SUPPLEMENTARY DATA
Information required by this item appears on pages F-1 through F-61, which follow page 61 of this Form 10-Kreport.
Item 9. CHANGES IN AND DISAGREEMENTSWITH ACCOUNTANTS ON ACCOUNTING ANDFINANCIAL DISCLOSURE
None
55
Item 9A. CONTROLS AND PROCEDURES
Under the direction of its principal executive officer and principal financial officer, controls and procedures havebeen established by Murphy to ensure that material information relating to the Company and its consolidatedsubsidiaries is made known to the officers who certify the Company’s financial reports and to other members ofsenior management and the Board of Directors.
Based on their evaluation, with the participation of the Company’s management, as of December 31, 2013, theprincipal executive officer and principal financial officer of Murphy Oil Corporation have concluded that theCompany’s disclosure controls and procedures (as defined in Rules 13a-15(e) and 15d-15(e) under the SecuritiesExchange Act of 1934) were effective to ensure that the information required to be disclosed by Murphy OilCorporation in reports that it files or submits under the Securities Exchange Act of 1934 is recorded, processed,summarized and reported within the time periods specified in SEC rules and forms.
Murphy’s management is responsible for establishing and maintaining adequate internal control over financialreporting, as such term is defined in Exchange Act Rules 13a-15(f). Management has conducted an evaluation ofthe effectiveness of the Company’s internal control over financial reporting based on the criteria set forth inInternal Control – Integrated Framework issued by the Committee of Sponsoring Organizations of the TreadwayCommission. Based on the results of this evaluation, management concluded that the Company’s internal controlover financial reporting was effective as of December 31, 2013. Management’s report is included on page F-1 ofthis Form 10-K report. KPMG LLP, an independent registered public accounting firm, has made an independentassessment of the effectiveness of the Company’s internal control over financial reporting as of December 31,2013 and their report is included on page F-3 of this Form 10-K report.
There were no changes in the Company’s internal controls over financial reporting that occurred during thefourth quarter of 2013 that have materially affected, or are reasonably likely to materially affect, the Company’sinternal control over financial reporting.
Item 9B. OTHER INFORMATION
None
56
PART III
Item 10. DIRECTORS, EXECUTIVE OFFICERS AND CORPORATE GOVERNANCE
Certain information regarding executive officers of the Company is included on pages 20 and 21 of this Form 10-Kreport. Other information required by this item is incorporated by reference to the Registrant’s definitive ProxyStatement for the Annual Meeting of Stockholders on May 14, 2014 under the captions “Election of Directors” and“Committees.”
Murphy Oil has adopted a Code of Ethical Conduct for Executive Management, which can be found under theCorporate Governance and Responsibility tab at www.murphyoilcorp.com. Stockholders may also obtain free ofcharge a copy of the Code of Ethical Conduct for Executive Management by writing to the Company’s Secretaryat P.O. Box 7000, El Dorado, AR 71731-7000. Any future amendments to or waivers of the Company’s Code ofEthical Conduct for Executive Management will be posted on the Company’s Web site.
Item 11. EXECUTIVE COMPENSATION
Information required by this item is incorporated by reference to Murphy’s definitive Proxy Statement for theAnnual Meeting of Stockholders on May 14, 2014 under the captions “Compensation Discussion and Analysis”and “Compensation of Directors” and in various compensation schedules.
Item 12. SECURITY OWNERSHIP OF CERTAIN BENEFICIAL OWNERS ANDMANAGEMENTAND RELATED STOCKHOLDERMATTERS
Information required by this item is incorporated by reference to Murphy’s definitive Proxy Statement for theAnnual Meeting of Stockholders on May 14, 2014 under the captions “Security Ownership of Certain BeneficialOwners,” “Security Ownership of Management,” and “Equity Compensation Plan Information.”
Item 13. CERTAIN RELATIONSHIPS AND RELATED TRANSACTIONS, AND DIRECTORINDEPENDENCE
Information required by this item is incorporated by reference to Murphy’s definitive Proxy Statement for theAnnual Meeting of Stockholders on May 14, 2014 under the caption “Election of Directors.”
Item 14. PRINCIPAL ACCOUNTING FEES AND SERVICES
Information required by this item is incorporated by reference to Murphy’s definitive Proxy Statement for theAnnual Meeting of Stockholders on May 14, 2014 under the caption “Audit Committee Report.”
57
PART IV
Item 15. EXHIBITS, FINANCIAL STATEMENT SCHEDULES
(a) 1. Financial Statements – The consolidated financial statements of Murphy Oil Corporation andconsolidated subsidiaries are located or begin on the pages of this Form 10-K report as indicated below.
Page No.
Report of Management – Consolidated Financial Statements F-1Report of Management – Internal Control Over Financial Reporting F-1Report of Independent Registered Public Accounting Firm F-2Report of Independent Registered Public Accounting Firm F-3Consolidated Balance Sheets F-4Consolidated Statements of Income F-5Consolidated Statements of Comprehensive Income F-6Consolidated Statements of Cash Flows F-7Consolidated Statements of Stockholders’ Equity F-8Notes to Consolidated Financial Statements F-9Supplemental Oil and Gas Information (unaudited) F-50Supplemental Quarterly Information (unaudited) F-61
2. Financial Statement Schedules
Schedule II – Valuation Accounts and Reserves F-62
All other financial statement schedules are omitted because either they are not applicable or the requiredinformation is included in the consolidated financial statements or notes thereto.
3. Exhibits – The following is an index of exhibits that are hereby filed as indicated by asterisk (*), that areconsidered furnished rather than filed, or that are incorporated by reference. Exhibits other than thoselisted have been omitted since they either are not required or are not applicable.
ExhibitNo. Incorporated by Reference to
2.1 Asset Purchase Agreement between CalumetSpecialty Products Partners, L.P. and Murphy OilCorporation covering the Superior, Wisconsinrefinery
Exhibit 2.1 of Murphy’s Form 10-Q report filedNovember 4, 2011
2.2 Asset Purchase Agreement between ValeroRefining-Meraux LLC and Murphy OilCorporation covering the Meraux, Louisianarefinery
Exhibit 2.2 of Murphy’s Form 10-Q report filedNovember 4, 2011
2.3 Separation and Distribution Agreement, datedAugust 30, 2013, between Murphy OilCorporation and Murphy USA Inc.
Exhibit 2.1 of Murphy’s Form 8-K report filedSeptember 5, 2013
3.1 Certificate of Incorporation of Murphy OilCorporation as amended, effective May 11, 2005
Exhibit 3.1 of Murphy’s Form 10-K report filedFebruary 28, 2011
3.2 By-Laws of Murphy Oil Corporation as amendedeffective August 7, 2013
Exhibit 3.1 of Murphy’s Form 8-K report filedAugust 9, 2013
58
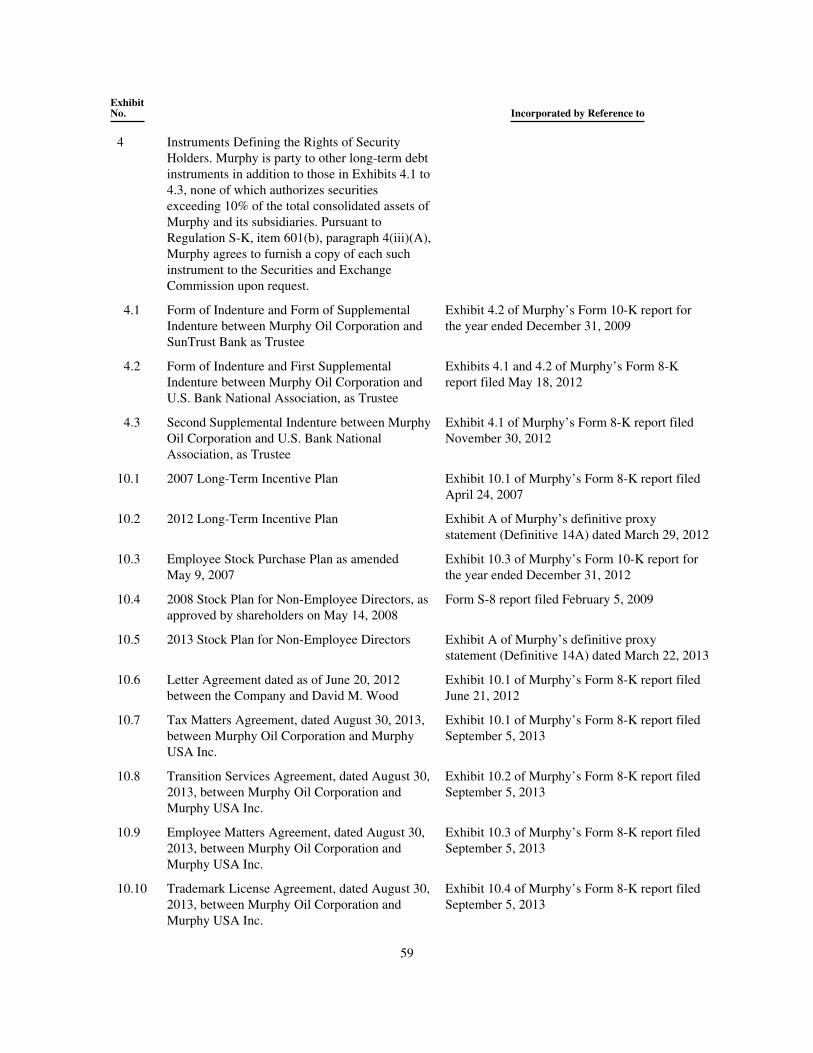
ExhibitNo. Incorporated by Reference to
4 Instruments Defining the Rights of SecurityHolders. Murphy is party to other long-term debtinstruments in addition to those in Exhibits 4.1 to4.3, none of which authorizes securitiesexceeding 10% of the total consolidated assets ofMurphy and its subsidiaries. Pursuant toRegulation S-K, item 601(b), paragraph 4(iii)(A),Murphy agrees to furnish a copy of each suchinstrument to the Securities and ExchangeCommission upon request.
4.1 Form of Indenture and Form of SupplementalIndenture between Murphy Oil Corporation andSunTrust Bank as Trustee
Exhibit 4.2 of Murphy’s Form 10-K report forthe year ended December 31, 2009
4.2 Form of Indenture and First SupplementalIndenture between Murphy Oil Corporation andU.S. Bank National Association, as Trustee
Exhibits 4.1 and 4.2 of Murphy’s Form 8-Kreport filed May 18, 2012
4.3 Second Supplemental Indenture between MurphyOil Corporation and U.S. Bank NationalAssociation, as Trustee
Exhibit 4.1 of Murphy’s Form 8-K report filedNovember 30, 2012
10.1 2007 Long-Term Incentive Plan Exhibit 10.1 of Murphy’s Form 8-K report filedApril 24, 2007
10.2 2012 Long-Term Incentive Plan Exhibit A of Murphy’s definitive proxystatement (Definitive 14A) dated March 29, 2012
10.3 Employee Stock Purchase Plan as amendedMay 9, 2007
Exhibit 10.3 of Murphy’s Form 10-K report forthe year ended December 31, 2012
10.4 2008 Stock Plan for Non-Employee Directors, asapproved by shareholders on May 14, 2008
Form S-8 report filed February 5, 2009
10.5 2013 Stock Plan for Non-Employee Directors Exhibit A of Murphy’s definitive proxystatement (Definitive 14A) dated March 22, 2013
10.6 Letter Agreement dated as of June 20, 2012between the Company and David M. Wood
Exhibit 10.1 of Murphy’s Form 8-K report filedJune 21, 2012
10.7 Tax Matters Agreement, dated August 30, 2013,between Murphy Oil Corporation and MurphyUSA Inc.
Exhibit 10.1 of Murphy’s Form 8-K report filedSeptember 5, 2013
10.8 Transition Services Agreement, dated August 30,2013, between Murphy Oil Corporation andMurphy USA Inc.
Exhibit 10.2 of Murphy’s Form 8-K report filedSeptember 5, 2013
10.9 Employee Matters Agreement, dated August 30,2013, between Murphy Oil Corporation andMurphy USA Inc.
Exhibit 10.3 of Murphy’s Form 8-K report filedSeptember 5, 2013
10.10 Trademark License Agreement, dated August 30,2013, between Murphy Oil Corporation andMurphy USA Inc.
Exhibit 10.4 of Murphy’s Form 8-K report filedSeptember 5, 2013
59
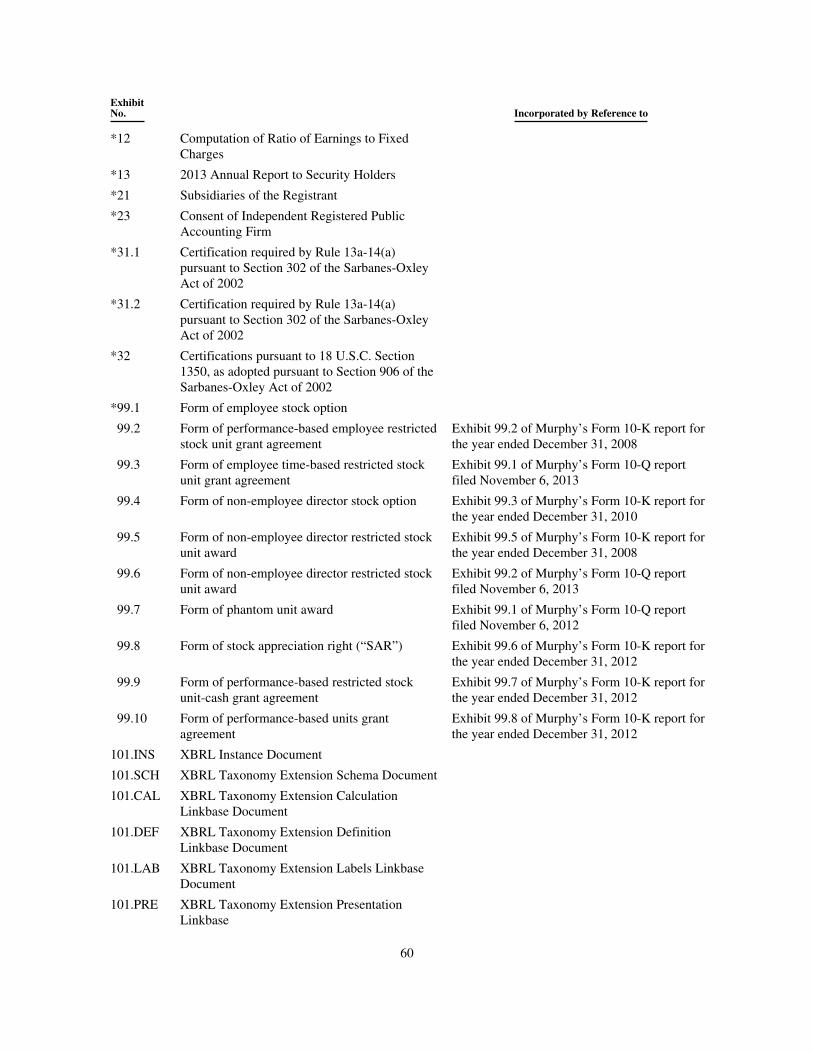
ExhibitNo. Incorporated by Reference to
*12 Computation of Ratio of Earnings to FixedCharges
*13 2013 Annual Report to Security Holders
*21 Subsidiaries of the Registrant
*23 Consent of Independent Registered PublicAccounting Firm
*31.1 Certification required by Rule 13a-14(a)pursuant to Section 302 of the Sarbanes-OxleyAct of 2002
*31.2 Certification required by Rule 13a-14(a)pursuant to Section 302 of the Sarbanes-OxleyAct of 2002
*32 Certifications pursuant to 18 U.S.C. Section1350, as adopted pursuant to Section 906 of theSarbanes-Oxley Act of 2002
*99.1 Form of employee stock option
99.2 Form of performance-based employee restrictedstock unit grant agreement
Exhibit 99.2 of Murphy’s Form 10-K report forthe year ended December 31, 2008
99.3 Form of employee time-based restricted stockunit grant agreement
Exhibit 99.1 of Murphy’s Form 10-Q reportfiled November 6, 2013
99.4 Form of non-employee director stock option Exhibit 99.3 of Murphy’s Form 10-K report forthe year ended December 31, 2010
99.5 Form of non-employee director restricted stockunit award
Exhibit 99.5 of Murphy’s Form 10-K report forthe year ended December 31, 2008
99.6 Form of non-employee director restricted stockunit award
Exhibit 99.2 of Murphy’s Form 10-Q reportfiled November 6, 2013
99.7 Form of phantom unit award Exhibit 99.1 of Murphy’s Form 10-Q reportfiled November 6, 2012
99.8 Form of stock appreciation right (“SAR”) Exhibit 99.6 of Murphy’s Form 10-K report forthe year ended December 31, 2012
99.9 Form of performance-based restricted stockunit-cash grant agreement
Exhibit 99.7 of Murphy’s Form 10-K report forthe year ended December 31, 2012
99.10 Form of performance-based units grantagreement
Exhibit 99.8 of Murphy’s Form 10-K report forthe year ended December 31, 2012
101.INS XBRL Instance Document
101.SCH XBRL Taxonomy Extension Schema Document
101.CAL XBRL Taxonomy Extension CalculationLinkbase Document
101.DEF XBRL Taxonomy Extension DefinitionLinkbase Document
101.LAB XBRL Taxonomy Extension Labels LinkbaseDocument
101.PRE XBRL Taxonomy Extension PresentationLinkbase
60
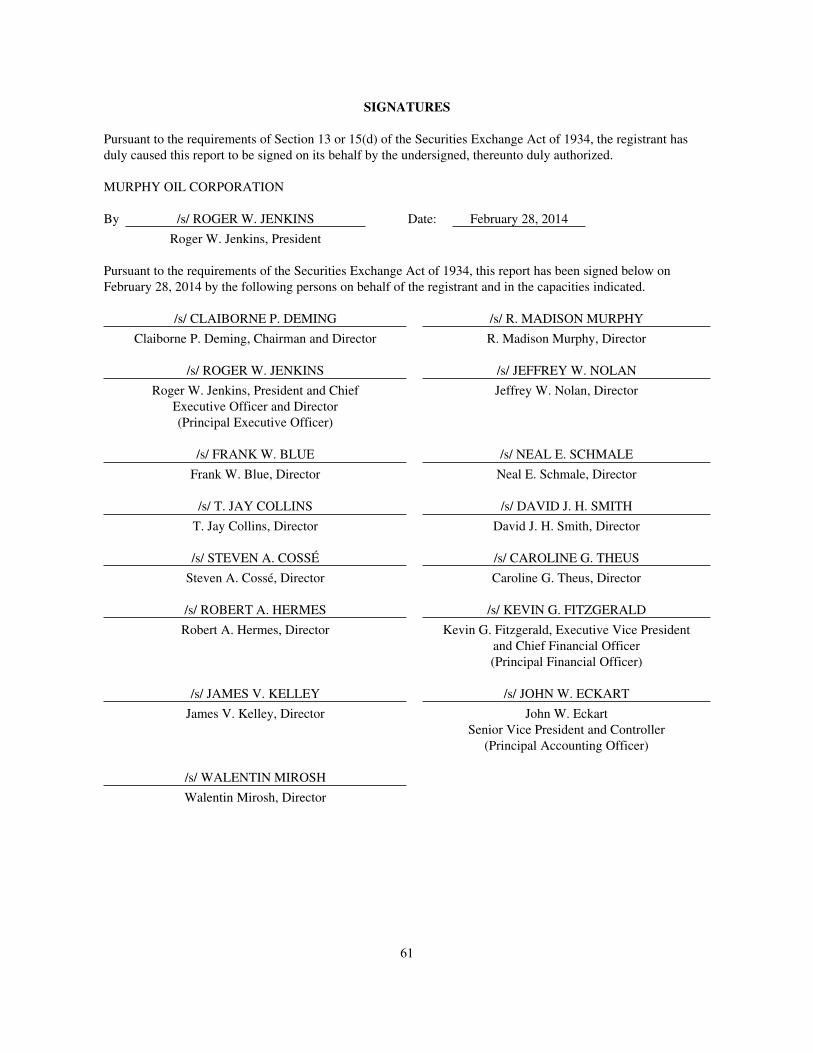
SIGNATURES
Pursuant to the requirements of Section 13 or 15(d) of the Securities Exchange Act of 1934, the registrant hasduly caused this report to be signed on its behalf by the undersigned, thereunto duly authorized.
MURPHY OIL CORPORATION
By /s/ ROGER W. JENKINS Date: February 28, 2014
Roger W. Jenkins, President
Pursuant to the requirements of the Securities Exchange Act of 1934, this report has been signed below onFebruary 28, 2014 by the following persons on behalf of the registrant and in the capacities indicated.
/s/ CLAIBORNE P. DEMING /s/ R. MADISON MURPHY
Claiborne P. Deming, Chairman and Director R. Madison Murphy, Director
/s/ ROGER W. JENKINS /s/ JEFFREY W. NOLAN
Roger W. Jenkins, President and ChiefExecutive Officer and Director(Principal Executive Officer)
Jeffrey W. Nolan, Director
/s/ FRANKW. BLUE /s/ NEAL E. SCHMALE
Frank W. Blue, Director Neal E. Schmale, Director
/s/ T. JAY COLLINS /s/ DAVID J. H. SMITH
T. Jay Collins, Director David J. H. Smith, Director
/s/ STEVEN A. COSSÉ /s/ CAROLINE G. THEUS
Steven A. Cossé, Director Caroline G. Theus, Director
/s/ ROBERT A. HERMES /s/ KEVIN G. FITZGERALD
Robert A. Hermes, Director Kevin G. Fitzgerald, Executive Vice Presidentand Chief Financial Officer(Principal Financial Officer)
/s/ JAMES V. KELLEY /s/ JOHN W. ECKART
James V. Kelley, Director John W. EckartSenior Vice President and Controller
(Principal Accounting Officer)
/s/ WALENTIN MIROSH
Walentin Mirosh, Director
61
REPORT OF MANAGEMENT – CONSOLIDATED FINANCIAL STATEMENTS
The management of Murphy Oil Corporation is responsible for the preparation and integrity of the accompanyingconsolidated financial statements and other financial data. The statements were prepared in conformity with U.S.generally accepted accounting principles appropriate in the circumstances and include some amounts based oninformed estimates and judgments, with consideration given to materiality.
An independent registered public accounting firm, KPMG LLP, has audited the Company’s consolidatedfinancial statements in accordance with the standards of the Public Company Accounting Oversight Board andprovides an objective, independent opinion about the Company’s consolidated financial statements. The AuditCommittee of the Board of Directors appoints the independent registered public accounting firm; ratification ofthe appointment is solicited annually from the shareholders. KPMG LLP’s opinion covering the Company’sconsolidated financial statements can be found on page F-2.
The Board of Directors appoints an Audit Committee annually to implement and to support the Board’s oversightfunction of the Company’s financial reporting, accounting policies, internal controls and independent registeredpublic accounting firm. This Committee is composed solely of directors who are not employees of the Company.The Committee meets routinely with representatives of management, the Company’s audit staff and theindependent registered public accounting firm to review and discuss the adequacy and effectiveness of theCompany’s internal controls, the quality and clarity of its financial reporting, the scope and results ofindependent and internal audits, and to fulfill other responsibilities included in the Committee’s Charter. Theindependent registered public accounting firm and the Company’s audit staff have unrestricted access to theCommittee, without management presence, to discuss audit findings and other financial matters.
REPORT OF MANAGEMENT – INTERNAL CONTROL OVER FINANCIAL REPORTING
Management is responsible for establishing and maintaining adequate internal control over financial reporting, assuch term is defined in Exchange Act Rules 13a-15(f). The Company’s internal controls have been designed toprovide reasonable assurance regarding the reliability of financial reporting and the preparation of consolidatedfinancial statements in accordance with U.S. generally accepted accounting principles. All internal controlsystems have inherent limitations, and therefore, can provide only reasonable assurance with respect to thereliability of financial reporting and preparation of consolidated financial statements.
Management has conducted an evaluation of the effectiveness of the Company’s internal control over financialreporting based on the criteria set forth in Internal Control – Integrated Framework issued by the Committee ofSponsoring Organizations of the Treadway Commission in 1992. Based on the results of this evaluation,management concluded that the Company’s internal control over financial reporting was effective as ofDecember 31, 2013.
KPMG LLP has performed an audit of the Company’s internal control over financial reporting and their opinionthereon can be found on page F-3.
F-1
REPORT OF INDEPENDENT REGISTERED PUBLIC ACCOUNTING FIRM
The Board of Directors and Stockholders of Murphy Oil Corporation:
We have audited the accompanying consolidated balance sheets of Murphy Oil Corporation and subsidiaries asof December 31, 2013 and 2012, and the related consolidated statements of income, comprehensive income, cashflows, and stockholders’ equity for each of the years in the three-year period ended December 31, 2013. Inconnection with our audits of the consolidated financial statements, we also have audited financial statementSchedule II. These consolidated financial statements and financial statement schedule are the responsibility of theCompany’s management. Our responsibility is to express an opinion on these consolidated financial statementsand financial statement schedule based on our audits.
We conducted our audits in accordance with the standards of the Public Company Accounting Oversight Board(United States). Those standards require that we plan and perform the audit to obtain reasonable assurance aboutwhether the financial statements are free of material misstatement. An audit includes examining, on a test basis,evidence supporting the amounts and disclosures in the financial statements. An audit also includes assessing theaccounting principles used and significant estimates made by management, as well as evaluating the overallfinancial statement presentation. We believe that our audits provide a reasonable basis for our opinion.
In our opinion, the consolidated financial statements referred to above present fairly, in all material respects, thefinancial position of Murphy Oil Corporation and subsidiaries as of December 31, 2013 and 2012, and the resultsof their operations and their cash flows for each of the years in the three-year period ended December 31, 2013,in conformity with U.S. generally accepted accounting principles. Also, in our opinion, the related financialstatement schedule, when considered in relation to the basic consolidated financial statements taken as a whole,presents fairly, in all material respects, the information set forth therein.
We also have audited, in accordance with the standards of the Public Company Accounting Oversight Board(United States), Murphy Oil Corporation’s internal control over financial reporting as of December 31, 2013,based on criteria established in Internal Control – Integrated Framework (1992) issued by the Committee ofSponsoring Organizations of the Treadway Commission (COSO), and our report dated February 28, 2014expressed an unqualified opinion on the effectiveness of the Company’s internal control over financial reporting.
/s/ KPMG LLP
Houston, TexasFebruary 28, 2014
F-2
REPORT OF INDEPENDENT REGISTERED PUBLIC ACCOUNTING FIRM
The Board of Directors and Stockholders of Murphy Oil Corporation:
We have audited Murphy Oil Corporation’s internal control over financial reporting as of December 31, 2013,based on criteria established in Internal Control – Integrated Framework (1992) issued by the Committee ofSponsoring Organizations of the Treadway Commission (COSO). Murphy Oil Corporation’s management isresponsible for maintaining effective internal control over financial reporting and for its assessment of theeffectiveness of internal control over Financial Reporting. Our responsibility is to express an opinion on theCompany’s internal control over financial reporting based on our audit.
We conducted our audit in accordance with the standards of the Public Company Accounting Oversight Board(United States). Those standards require that we plan and perform the audit to obtain reasonable assurance aboutwhether effective internal control over financial reporting was maintained in all material respects. Our auditincluded obtaining an understanding of internal control over financial reporting, assessing the risk that a materialweakness exists, and testing and evaluating the design and operating effectiveness of internal control based onthe assessed risk. Our audit also included performing such other procedures as we considered necessary in thecircumstances. We believe that our audit provides a reasonable basis for our opinion.
A company’s internal control over financial reporting is a process designed to provide reasonable assuranceregarding the reliability of financial reporting and the preparation of financial statements for external purposes inaccordance with generally accepted accounting principles. A company’s internal control over financial reportingincludes those policies and procedures that (1) pertain to the maintenance of records that, in reasonable detail,accurately and fairly reflect the transactions and dispositions of the assets of the company; (2) provide reasonableassurance that transactions are recorded as necessary to permit preparation of financial statements in accordancewith generally accepted accounting principles, and that receipts and expenditures of the company are being madeonly in accordance with authorizations of management and directors of the company; and (3) provide reasonableassurance regarding prevention or timely detection of unauthorized acquisition, use, or disposition of thecompany’s assets that could have a material effect on the financial statements.
Because of its inherent limitations, internal control over financial reporting may not prevent or detectmisstatements. Also, projections of any evaluation of effectiveness to future periods are subject to the risk thatcontrols may become inadequate because of changes in conditions, or that the degree of compliance with thepolicies or procedures may deteriorate.
In our opinion, Murphy Oil Corporation maintained, in all material respects, effective internal control overfinancial reporting as of December 31, 2013, based on criteria established in Internal Control – IntegratedFramework (1992) issued by the Committee of Sponsoring Organizations of the Treadway Commission (COSO).
We also have audited, in accordance with the standards of the Public Company Accounting Oversight Board(United States), the consolidated balance sheets of Murphy Oil Corporation as of December 31, 2013 and 2012,and the related consolidated statements of income, comprehensive income, cash flows, and stockholders’ equityfor each of the years in the three-year period ended December 31, 2013, and our report dated February 28, 2014expressed an unqualified opinion on those consolidated financial statements.
/s/ KPMG LLP
Houston, TexasFebruary 28, 2014
F-3
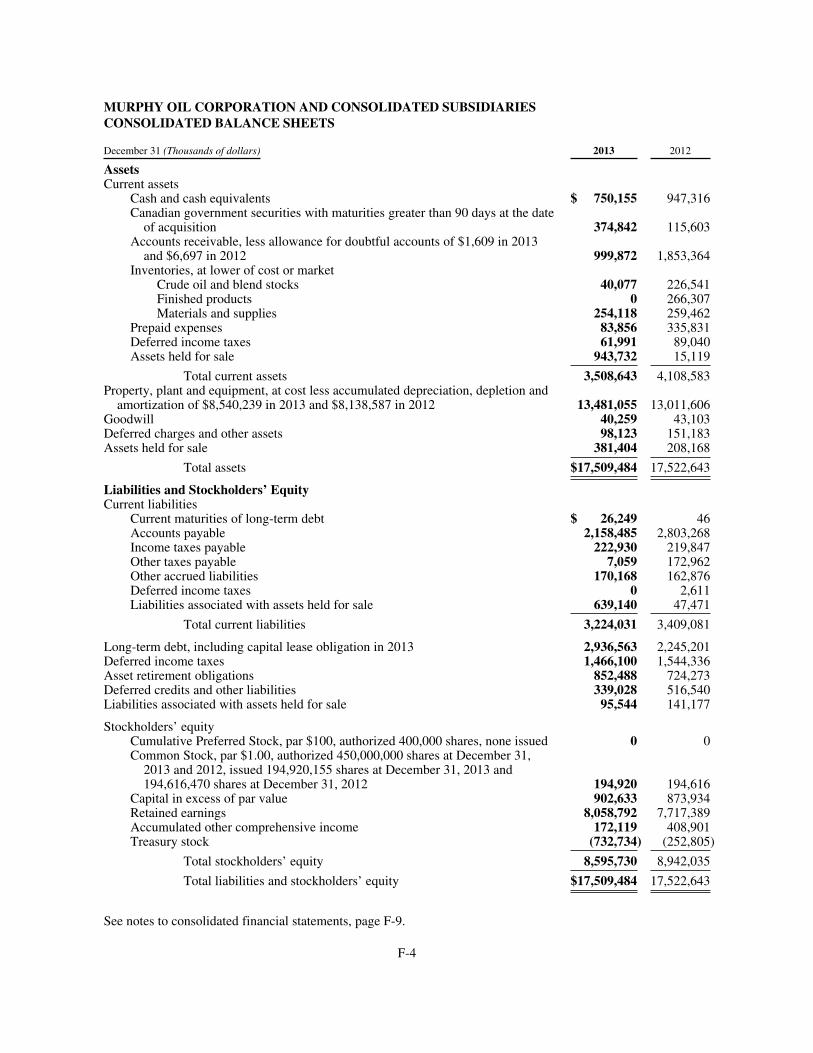
MURPHY OIL CORPORATION AND CONSOLIDATED SUBSIDIARIESCONSOLIDATED BALANCE SHEETS
December 31 (Thousands of dollars) 2013 2012
AssetsCurrent assets
Cash and cash equivalents $ 750,155 947,316Canadian government securities with maturities greater than 90 days at the dateof acquisition 374,842 115,603
Accounts receivable, less allowance for doubtful accounts of $1,609 in 2013and $6,697 in 2012 999,872 1,853,364
Inventories, at lower of cost or marketCrude oil and blend stocks 40,077 226,541Finished products 0 266,307Materials and supplies 254,118 259,462
Prepaid expenses 83,856 335,831Deferred income taxes 61,991 89,040Assets held for sale 943,732 15,119
Total current assets 3,508,643 4,108,583Property, plant and equipment, at cost less accumulated depreciation, depletion andamortization of $8,540,239 in 2013 and $8,138,587 in 2012 13,481,055 13,011,606
Goodwill 40,259 43,103Deferred charges and other assets 98,123 151,183Assets held for sale 381,404 208,168
Total assets $17,509,484 17,522,643
Liabilities and Stockholders’ EquityCurrent liabilities
Current maturities of long-term debt $ 26,249 46Accounts payable 2,158,485 2,803,268Income taxes payable 222,930 219,847Other taxes payable 7,059 172,962Other accrued liabilities 170,168 162,876Deferred income taxes 0 2,611Liabilities associated with assets held for sale 639,140 47,471
Total current liabilities 3,224,031 3,409,081
Long-term debt, including capital lease obligation in 2013 2,936,563 2,245,201Deferred income taxes 1,466,100 1,544,336Asset retirement obligations 852,488 724,273Deferred credits and other liabilities 339,028 516,540Liabilities associated with assets held for sale 95,544 141,177
Stockholders’ equityCumulative Preferred Stock, par $100, authorized 400,000 shares, none issued 0 0Common Stock, par $1.00, authorized 450,000,000 shares at December 31,2013 and 2012, issued 194,920,155 shares at December 31, 2013 and194,616,470 shares at December 31, 2012 194,920 194,616
Capital in excess of par value 902,633 873,934Retained earnings 8,058,792 7,717,389Accumulated other comprehensive income 172,119 408,901Treasury stock (732,734) (252,805)
Total stockholders’ equity 8,595,730 8,942,035
Total liabilities and stockholders’ equity $17,509,484 17,522,643
See notes to consolidated financial statements, page F-9.
F-4
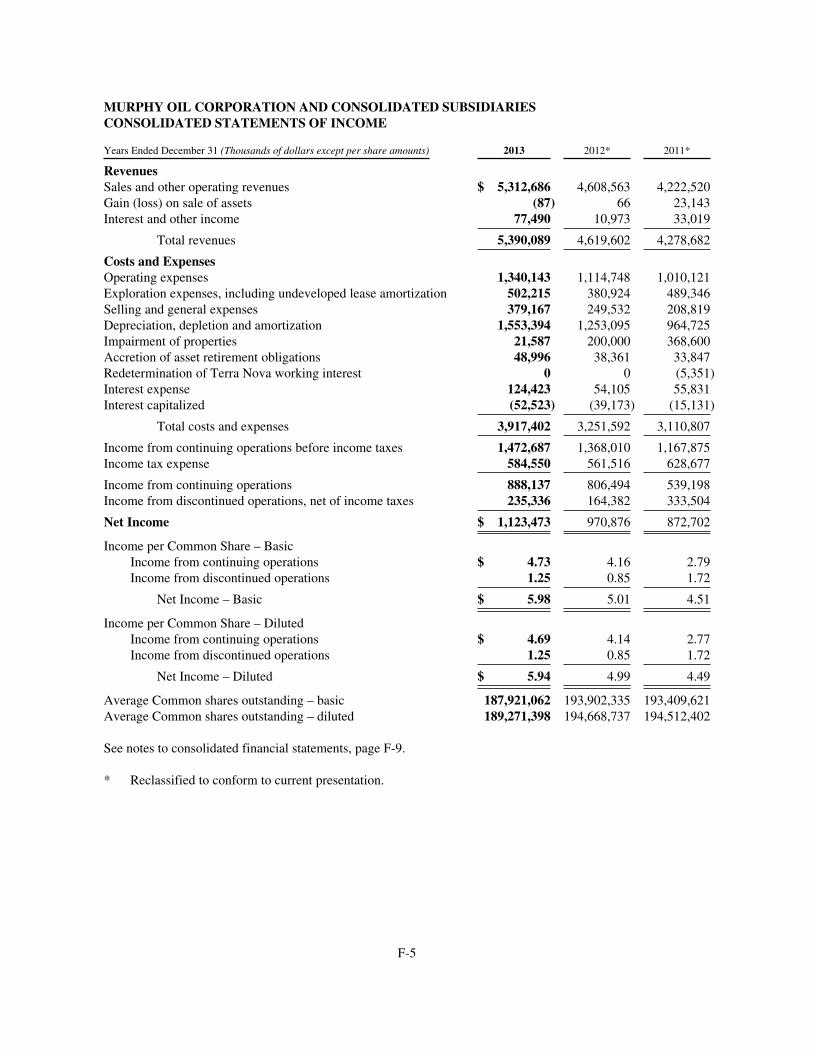
MURPHY OIL CORPORATION AND CONSOLIDATED SUBSIDIARIESCONSOLIDATED STATEMENTS OF INCOME
Years Ended December 31 (Thousands of dollars except per share amounts) 2013 2012* 2011*
RevenuesSales and other operating revenues $ 5,312,686 4,608,563 4,222,520Gain (loss) on sale of assets (87) 66 23,143Interest and other income 77,490 10,973 33,019
Total revenues 5,390,089 4,619,602 4,278,682
Costs and ExpensesOperating expenses 1,340,143 1,114,748 1,010,121Exploration expenses, including undeveloped lease amortization 502,215 380,924 489,346Selling and general expenses 379,167 249,532 208,819Depreciation, depletion and amortization 1,553,394 1,253,095 964,725Impairment of properties 21,587 200,000 368,600Accretion of asset retirement obligations 48,996 38,361 33,847Redetermination of Terra Nova working interest 0 0 (5,351)Interest expense 124,423 54,105 55,831Interest capitalized (52,523) (39,173) (15,131)
Total costs and expenses 3,917,402 3,251,592 3,110,807
Income from continuing operations before income taxes 1,472,687 1,368,010 1,167,875Income tax expense 584,550 561,516 628,677
Income from continuing operations 888,137 806,494 539,198Income from discontinued operations, net of income taxes 235,336 164,382 333,504
Net Income $ 1,123,473 970,876 872,702
Income per Common Share – BasicIncome from continuing operations $ 4.73 4.16 2.79Income from discontinued operations 1.25 0.85 1.72
Net Income – Basic $ 5.98 5.01 4.51
Income per Common Share – DilutedIncome from continuing operations $ 4.69 4.14 2.77Income from discontinued operations 1.25 0.85 1.72
Net Income – Diluted $ 5.94 4.99 4.49
Average Common shares outstanding – basic 187,921,062 193,902,335 193,409,621Average Common shares outstanding – diluted 189,271,398 194,668,737 194,512,402
See notes to consolidated financial statements, page F-9.
* Reclassified to conform to current presentation.
F-5
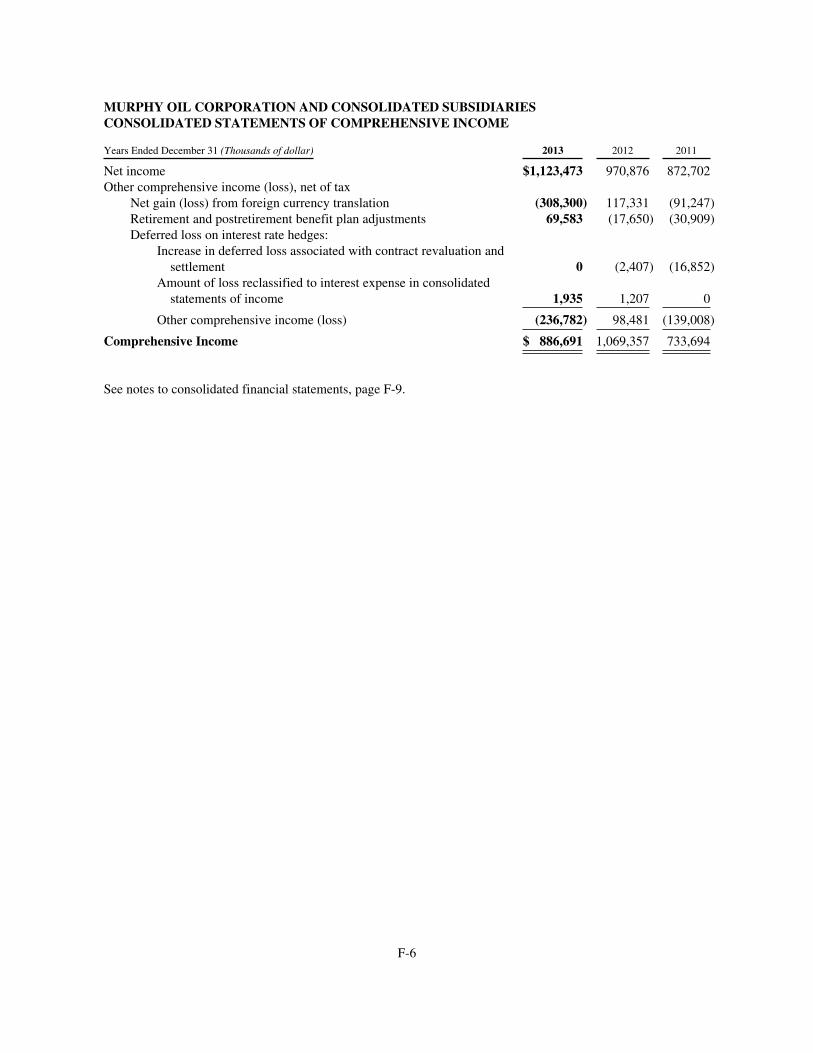
MURPHY OIL CORPORATION AND CONSOLIDATED SUBSIDIARIESCONSOLIDATED STATEMENTS OF COMPREHENSIVE INCOME
Years Ended December 31 (Thousands of dollar) 2013 2012 2011
Net income $1,123,473 970,876 872,702Other comprehensive income (loss), net of tax
Net gain (loss) from foreign currency translation (308,300) 117,331 (91,247)Retirement and postretirement benefit plan adjustments 69,583 (17,650) (30,909)Deferred loss on interest rate hedges:
Increase in deferred loss associated with contract revaluation andsettlement 0 (2,407) (16,852)
Amount of loss reclassified to interest expense in consolidatedstatements of income 1,935 1,207 0
Other comprehensive income (loss) (236,782) 98,481 (139,008)
Comprehensive Income $ 886,691 1,069,357 733,694
See notes to consolidated financial statements, page F-9.
F-6
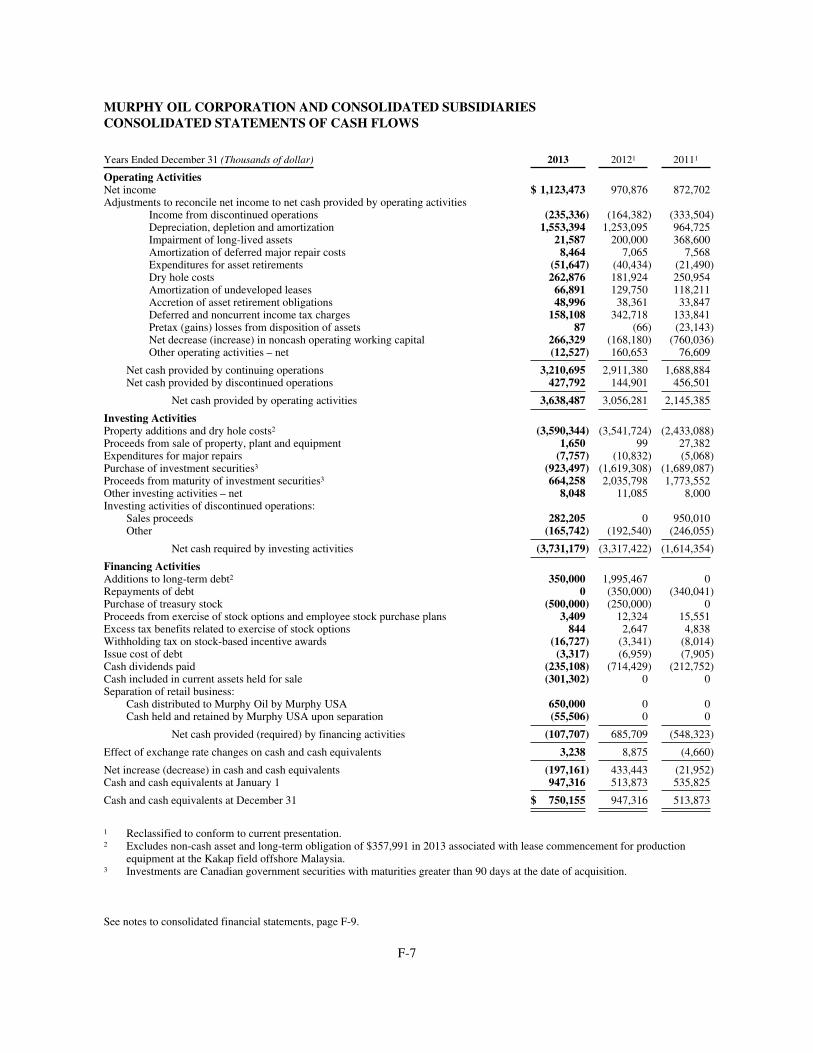
MURPHY OIL CORPORATION AND CONSOLIDATED SUBSIDIARIESCONSOLIDATED STATEMENTS OF CASH FLOWS
Years Ended December 31 (Thousands of dollar) 2013 20121 20111
Operating ActivitiesNet income $ 1,123,473 970,876 872,702Adjustments to reconcile net income to net cash provided by operating activities
Income from discontinued operations (235,336) (164,382) (333,504)Depreciation, depletion and amortization 1,553,394 1,253,095 964,725Impairment of long-lived assets 21,587 200,000 368,600Amortization of deferred major repair costs 8,464 7,065 7,568Expenditures for asset retirements (51,647) (40,434) (21,490)Dry hole costs 262,876 181,924 250,954Amortization of undeveloped leases 66,891 129,750 118,211Accretion of asset retirement obligations 48,996 38,361 33,847Deferred and noncurrent income tax charges 158,108 342,718 133,841Pretax (gains) losses from disposition of assets 87 (66) (23,143)Net decrease (increase) in noncash operating working capital 266,329 (168,180) (760,036)Other operating activities – net (12,527) 160,653 76,609
Net cash provided by continuing operations 3,210,695 2,911,380 1,688,884Net cash provided by discontinued operations 427,792 144,901 456,501
Net cash provided by operating activities 3,638,487 3,056,281 2,145,385
Investing ActivitiesProperty additions and dry hole costs2 (3,590,344) (3,541,724) (2,433,088)Proceeds from sale of property, plant and equipment 1,650 99 27,382Expenditures for major repairs (7,757) (10,832) (5,068)Purchase of investment securities3 (923,497) (1,619,308) (1,689,087)Proceeds from maturity of investment securities3 664,258 2,035,798 1,773,552Other investing activities – net 8,048 11,085 8,000Investing activities of discontinued operations:
Sales proceeds 282,205 0 950,010Other (165,742) (192,540) (246,055)
Net cash required by investing activities (3,731,179) (3,317,422) (1,614,354)
Financing ActivitiesAdditions to long-term debt2 350,000 1,995,467 0Repayments of debt 0 (350,000) (340,041)Purchase of treasury stock (500,000) (250,000) 0Proceeds from exercise of stock options and employee stock purchase plans 3,409 12,324 15,551Excess tax benefits related to exercise of stock options 844 2,647 4,838Withholding tax on stock-based incentive awards (16,727) (3,341) (8,014)Issue cost of debt (3,317) (6,959) (7,905)Cash dividends paid (235,108) (714,429) (212,752)Cash included in current assets held for sale (301,302) 0 0Separation of retail business:
Cash distributed to Murphy Oil by Murphy USA 650,000 0 0Cash held and retained by Murphy USA upon separation (55,506) 0 0
Net cash provided (required) by financing activities (107,707) 685,709 (548,323)
Effect of exchange rate changes on cash and cash equivalents 3,238 8,875 (4,660)
Net increase (decrease) in cash and cash equivalents (197,161) 433,443 (21,952)Cash and cash equivalents at January 1 947,316 513,873 535,825
Cash and cash equivalents at December 31 $ 750,155 947,316 513,873
1 Reclassified to conform to current presentation.2 Excludes non-cash asset and long-term obligation of $357,991 in 2013 associated with lease commencement for production
equipment at the Kakap field offshore Malaysia.3 Investments are Canadian government securities with maturities greater than 90 days at the date of acquisition.
See notes to consolidated financial statements, page F-9.
F-7
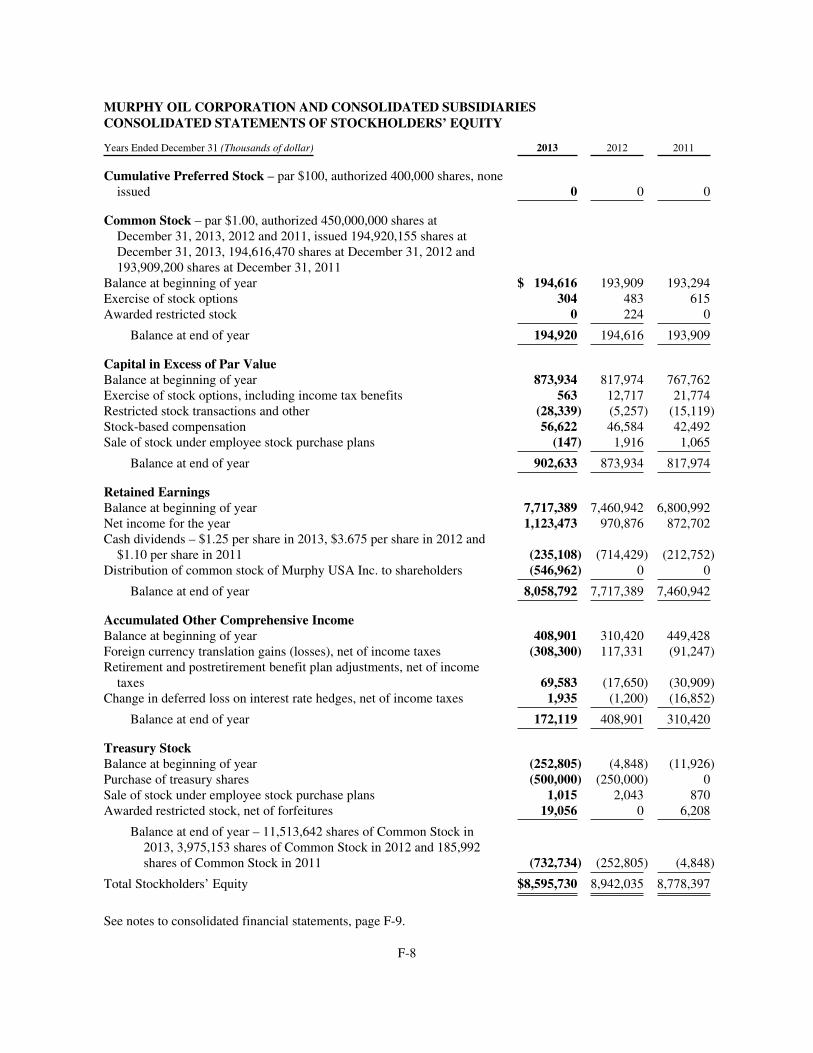
MURPHY OIL CORPORATION AND CONSOLIDATED SUBSIDIARIESCONSOLIDATED STATEMENTS OF STOCKHOLDERS’ EQUITY
Years Ended December 31 (Thousands of dollar) 2013 2012 2011
Cumulative Preferred Stock – par $100, authorized 400,000 shares, noneissued 0 0 0
Common Stock – par $1.00, authorized 450,000,000 shares atDecember 31, 2013, 2012 and 2011, issued 194,920,155 shares atDecember 31, 2013, 194,616,470 shares at December 31, 2012 and193,909,200 shares at December 31, 2011
Balance at beginning of year $ 194,616 193,909 193,294Exercise of stock options 304 483 615Awarded restricted stock 0 224 0
Balance at end of year 194,920 194,616 193,909
Capital in Excess of Par ValueBalance at beginning of year 873,934 817,974 767,762Exercise of stock options, including income tax benefits 563 12,717 21,774Restricted stock transactions and other (28,339) (5,257) (15,119)Stock-based compensation 56,622 46,584 42,492Sale of stock under employee stock purchase plans (147) 1,916 1,065
Balance at end of year 902,633 873,934 817,974
Retained EarningsBalance at beginning of year 7,717,389 7,460,942 6,800,992Net income for the year 1,123,473 970,876 872,702Cash dividends – $1.25 per share in 2013, $3.675 per share in 2012 and$1.10 per share in 2011 (235,108) (714,429) (212,752)
Distribution of common stock of Murphy USA Inc. to shareholders (546,962) 0 0
Balance at end of year 8,058,792 7,717,389 7,460,942
Accumulated Other Comprehensive IncomeBalance at beginning of year 408,901 310,420 449,428Foreign currency translation gains (losses), net of income taxes (308,300) 117,331 (91,247)Retirement and postretirement benefit plan adjustments, net of incometaxes 69,583 (17,650) (30,909)
Change in deferred loss on interest rate hedges, net of income taxes 1,935 (1,200) (16,852)
Balance at end of year 172,119 408,901 310,420
Treasury StockBalance at beginning of year (252,805) (4,848) (11,926)Purchase of treasury shares (500,000) (250,000) 0Sale of stock under employee stock purchase plans 1,015 2,043 870Awarded restricted stock, net of forfeitures 19,056 0 6,208
Balance at end of year – 11,513,642 shares of Common Stock in2013, 3,975,153 shares of Common Stock in 2012 and 185,992shares of Common Stock in 2011 (732,734) (252,805) (4,848)
Total Stockholders’ Equity $8,595,730 8,942,035 8,778,397
See notes to consolidated financial statements, page F-9.
F-8
MURPHY OIL CORPORATION AND CONSOLIDATED SUBSIDIARIESNOTES TO CONSOLIDATED FINANCIAL STATEMENTS
Note A – Significant Accounting Policies
NATURE OF BUSINESS – Murphy Oil Corporation is an international oil and gas company that conducts itsbusiness through various operating subsidiaries. The Company produces oil and natural gas in the United States,Canada and Malaysia and conducts oil and natural gas exploration activities worldwide. The Company has aninterest in a Canadian synthetic oil operation. Murphy owns one petroleum refinery in the United Kingdom andmarkets petroleum products in that country under various brand names and to unbranded wholesale customers.The Company has announced its intention to sell the U.K. refining and marketing assets. On August 30, 2013, theCompany completed the spin-off of Murphy USA Inc. (MUSA) to its shareholders. MUSA formerly was theCompany’s U.S. downstream operations. MUSA is now a separate, publicly owned company traded on theNew York Stock Exchange under the symbol “MUSA.” In addition, Murphy Oil sold all its United Kingdom oiland natural gas producing assets during 2013. In 2011, the Company sold two U.S. petroleum refineries andcertain associated marketing assets. See Note C regarding more information regarding the spin-off and sale ofthese assets.
PRINCIPLES OF CONSOLIDATION – The consolidated financial statements include the accounts of MurphyOil Corporation and all majority-owned subsidiaries. For consolidated subsidiaries that are less than whollyowned, the noncontrolling interest is reflected in the balance sheet as a component of Stockholders’ Equity.Undivided interests in oil and gas joint ventures are consolidated on a proportionate basis. Investments inaffiliates in which the Company owns from 20% to 50% are accounted for by the equity method. Otherinvestments are generally carried at cost. All significant intercompany accounts and transactions have beeneliminated.
REVENUE RECOGNITION – Revenues from sales of crude oil, natural gas and refined petroleum products arerecorded when deliveries have occurred and legal ownership of the commodity transfers to the customer.Revenues from the production of oil and natural gas properties in which Murphy shares an undivided interestwith other producers are recognized based on the actual volumes sold by the Company during the period. Naturalgas imbalances occur when the Company’s actual gas sales volumes differ from its entitlement under existingworking interests. The Company records a liability for gas imbalances when it has sold more than its workinginterest of gas production and the estimated remaining reserves make it doubtful that partners can recoup theirshare of production from the field. At December 31, 2013 and 2012, the liabilities for natural gas balancing wereimmaterial.
Refined products sold at retail are recorded when the customer takes delivery at the pump. Title transfer for bulkmotor fuel products generally occurs at pipeline custody points or upon truck loading at product terminals.Merchandise revenues are recorded at the point of sale.
The Company enters into buy/sell and similar arrangements when crude oil and other petroleum products areheld at one location but are needed at a different location. The Company often pays or receives funds related tothe buy/sell arrangement based on location or quality differences. The Company accounts for such transactionson a net basis in its Consolidated Statement of Income.
TAXES COLLECTED FROM CUSTOMERS AND REMITTED TO GOVERNMENT AUTHORITIES –Excise and other taxes collected on sales of refined products and remitted to governmental agencies are excludedfrom revenues and costs and expenses in the Consolidated Statement of Income.
CASH EQUIVALENTS – Short-term investments, which include government securities and other instrumentswith government securities as collateral, that have a maturity of three months or less from the date of purchaseare classified as cash equivalents.
F-9
MURPHY OIL CORPORATION AND CONSOLIDATED SUBSIDIARIESNOTES TO CONSOLIDATED FINANCIAL STATEMENTS – Continued
MARKETABLE SECURITIES – The Company classifies investments in marketable securities as available-for-sale or held-to-maturity. The Company does not have any investments classified as trading securities. Available-for-sale securities are carried at fair value with the unrealized gain or loss, net of tax, reported in othercomprehensive income. Held-to-maturity securities are recorded at amortized cost. Premiums and discounts areamortized or accreted into earnings over the life of the related available-for-sale or held-to-maturity security.
Dividend and interest income is recognized when earned. Unrealized losses considered to be other thantemporary are recognized currently in earnings. The cost of securities sold is based on the specific identificationmethod. The fair value of investment securities is determined by available market prices. At December 31, 2013,the Company owned Canadian government securities with maturities greater than 90 days at date of acquisitionthat had a carrying value of $374,842,000. These securities are readily marketable and could be quicklyconverted to cash if needed to meet operating cash needs in Canada.
ACCOUNTS RECEIVABLE – At December 31, 2013, the Company’s accounts receivable primarily consistedof amounts owed to the Company by customers for sales of crude oil and natural gas. In 2012 this balanceincluded receivables for oil and gas sales and amounts owed for refined products sold under varying creditarrangements in the U.S. and U.K. The allowance for doubtful accounts is the Company’s best estimate of theamount of probable credit losses on these receivables. The Company reviews this allowance for adequacy at leastquarterly and bases its assessment on a combination of current information about its customers and historicalwrite-off experience. Any trade accounts receivable balances written off are charged against the allowance fordoubtful accounts. The Company has not experienced any significant credit-related losses in the past three years.
INVENTORIES – Crude oil and blend stocks inventories include unsold crude oil production in 2013 and 2012,and in 2012 also included Milford Haven refinery feedstocks. Unsold crude oil production is carried in inventoryat the lower of cost, generally applied on a first-in, first-out (FIFO) basis, or market, and includes costs incurredto bring the inventory to its existing condition. Refinery inventories of crude oil and other feedstocks and certainfinished product inventories are valued at the lower of cost, generally applied on a last-in, first-out (LIFO) basis,or market. Merchandise inventory held for resale at retail marketing stations in 2012 was generally carried ataverage cost and was included in Finished products inventories. Materials and supplies inventories are valued atthe lower of average cost or estimated value and generally consist of tubulars and other drilling equipment andadditionally at year-end 2012 it included spare parts for refinery operations. Cash collected upon the sale ofinventory to customers is classified as an operating activity in the Consolidated Statement of Cash Flows.
PROPERTY, PLANT AND EQUIPMENT – The Company uses the successful efforts method to account forexploration and development expenditures. Leasehold acquisition costs are capitalized. If proved reserves arefound on an undeveloped property, leasehold cost is transferred to proved properties. Costs of undeveloped leasesassociated with unproved properties are expensed over the life of the leases. Exploratory well costs arecapitalized pending determination about whether proved reserves have been found. In certain cases, adetermination of whether a drilled exploratory well has found proved reserves cannot be made immediately. Thisis generally due to the need for a major capital expenditure to produce and/or evacuate the hydrocarbon(s) found.The determination of whether to make such a capital expenditure is usually dependent on whether furtherexploratory wells find a sufficient quantity of additional reserves. The Company continues to capitalizeexploratory well costs in Property, Plant and Equipment when the well has found a sufficient quantity of reservesto justify its completion as a producing well and the Company is making sufficient progress assessing thereserves and the economic and operating viability of the project. The Company reevaluates its capitalized drillingcosts at least annually to ascertain whether drilling costs continue to qualify for ongoing capitalization. Otherexploratory costs, including geological and geophysical costs, are charged to expense as incurred. Developmentcosts, including unsuccessful development wells, are capitalized. Interest is capitalized on significantdevelopment projects that are expected to take one year or more to complete.
F-10
MURPHY OIL CORPORATION AND CONSOLIDATED SUBSIDIARIESNOTES TO CONSOLIDATED FINANCIAL STATEMENTS – Continued
Oil and gas properties are evaluated by field for potential impairment. Other properties are evaluated forimpairment on a specific asset basis or in groups of similar assets as applicable. An impairment is recognizedwhen the estimated undiscounted future net cash flows of an asset are less than its carrying value. If animpairment occurs, the carrying value of the impaired asset is reduced to fair value.
The Company records a liability for asset retirement obligations (ARO) equal to the fair value of the estimatedcost to retire an asset. The ARO liability is initially recorded in the period in which the obligation meets thedefinition of a liability, which is generally when a well is drilled or the asset is placed in service. The AROliability is estimated by the Company’s engineers using existing regulatory requirements and anticipated futureinflation rates.
When the liability is initially recorded, the Company increases the carrying amount of the related long-lived assetby an amount equal to the original liability. The liability is increased over time to reflect the change in its presentvalue, and the capitalized cost is depreciated over the useful life of the related long-lived asset. The Companyreevaluates the adequacy of its recorded ARO liability at least annually. Actual costs of asset retirements such asdismantling oil and gas production facilities and site restoration are charged against the related liability. Anydifference between costs incurred upon settlement of an asset retirement obligation and the recorded liability isrecognized as a gain or loss in the Company’s earnings.
Depreciation and depletion of producing oil and gas properties is recorded based on units of production. Unitrates are computed for unamortized exploration drilling and development costs using proved developed reserves;unit rates for unamortized leasehold costs and asset retirement costs are amortized over proved reserves. Provedreserves are estimated by the Company’s engineers and are subject to future revisions based on availability ofadditional information. The Milford Haven, Wales refinery, certain marketing facilities and certain natural gasprocessing facilities are depreciated primarily using the composite straight-line method with depreciable livesranging from 14 to 25 years. Gasoline stations and other properties are depreciated over 3 to 20 years byindividual unit on the straight-line method. Gains and losses on asset disposals or retirements are included inincome as a separate component of revenues. Property and equipment of U.K. refining and marketing operationsare no longer depreciated following the recognition of these assets as held for sale in late 2013.
Turnarounds for major processing units at the Milford Haven, Wales refinery are scheduled at four to five yearintervals. Turnarounds for coking units at Syncrude Canada Ltd. are scheduled at intervals of two to three years.Turnaround work associated with various other less significant units at Milford Haven and Syncrude variesdepending on operating requirements and events. Murphy defers turnaround costs incurred and amortizes suchcosts over the period until the next scheduled turnaround. This amortization is recorded in Operating Expensesfor Syncrude and through results of discontinued operation for the Milford Haven refinery. Also in 2014,amortization of deferred turnaround costs will cease for the U.K. downstream operations that are held for sale.All other maintenance and repairs are expensed as incurred. Renewals and betterments are capitalized. A majorturnaround occurred in 2010 at the Milford Haven, Wales refinery.
CAPITALIZED INTEREST – Interest associated with borrowings from third parties is capitalized on significantoil and gas development projects when the expected development period extends for one year or more. Interestcapitalized is credited in the Consolidated Statement of Income and is added to the cost of the underlying assetfor the development project in Property, Plant and Equipment in the Consolidated Balance Sheet. Capitalizedinterest is amortized over the useful life of the asset in the same manner as other development costs.
GOODWILL – Goodwill is recorded in an acquisition when the purchase price exceeds the fair value of netassets acquired. All recorded goodwill arose from the purchase of an oil and natural gas company by Murphy’swholly owned Canadian subsidiary in 2000. Goodwill is not amortized, but is assessed annually for
F-11
MURPHY OIL CORPORATION AND CONSOLIDATED SUBSIDIARIESNOTES TO CONSOLIDATED FINANCIAL STATEMENTS – Continued
recoverability of the carrying value. The Company assesses goodwill recoverability at each year-end bycomparing the fair value of net assets for conventional oil and natural gas properties in Canada with the carryingvalue of these net assets including goodwill. The fair value of the conventional oil and natural gas reporting unitis determined using the expected present value of future cash flows. The change in the carrying value of goodwillduring 2013 was primarily caused by a change in the foreign currency translation rate between years. Based onits assessment of the fair value of its Canadian conventional oil and natural gas operations, the Company believesthe recorded value of goodwill is not impaired at December 31, 2013. Should a future assessment indicate thatgoodwill is not fully recoverable, an impairment charge to write down the carrying value of goodwill would berequired.
ENVIRONMENTAL LIABILITIES – A liability for environmental matters is established when it is probablethat an environmental obligation exists and the cost can be reasonably estimated. If there is a range of reasonablyestimated costs, the most likely amount will be recorded, or if no amount is most likely, the minimum of therange is used. Related expenditures are charged against the liability. Environmental remediation liabilities havenot been discounted for the time value of future expected payments. Environmental expenditures that have futureeconomic benefit are capitalized.
INCOME TAXES – The Company accounts for income taxes using the asset and liability method. Under thismethod, income taxes are provided for amounts currently payable and for amounts deferred as tax assets andliabilities based on differences between the financial statement carrying amounts and the tax bases of existingassets and liabilities. Deferred income taxes are measured using the enacted tax rates that are assumed will be ineffect when the differences reverse. The Company routinely assesses the realizability of deferred tax assets basedon available evidence including assumptions of future taxable income, tax planning strategies and other pertinentfactors. A deferred tax asset valuation allowance is recorded when evidence indicates that it is more likely thannot that all or a portion of these deferred tax assets will not be realized in a future period. The Company does notprovide U.S. deferred taxes for the portion of undistributed earnings of foreign subsidiaries when these earningsare considered indefinitely reinvested in the respective foreign operations. The accounting rules for income taxuncertainties permit recognition of income tax benefits only when they are more likely than not to be realized.The Company includes potential penalties and interest for uncertain income tax positions in income tax expense.
FOREIGN CURRENCY – Local currency is the functional currency used for recording operations in Canada andfor refining and marketing activities in the United Kingdom. The U.S. dollar is the functional currency used torecord all other operations. Exchange gains or losses from transactions in a currency other than the functionalcurrency are included in earnings. Gains or losses from translating foreign functional currencies into U.S. dollarsare included in Accumulated Other Comprehensive Income in Stockholders’ Equity.
DERIVATIVE INSTRUMENTS AND HEDGING ACTIVITIES – The fair value of a derivative instrument isrecognized as an asset or liability in the Company’s Consolidated Balance Sheet. Upon entering into a derivativecontract, the Company may designate the derivative as either a fair value hedge or a cash flow hedge, or decidethat the contract is not a hedge for accounting purposes, and thenceforth, recognize changes in the fair value ofthe contract in earnings. The Company documents the relationship between the derivative instrument designatedas a hedge and the hedged items as well as its objective for risk management and strategy for use of the hedginginstrument to manage the risk. Derivative instruments designated as fair value or cash flow hedges are linked tospecific assets and liabilities or to specific firm commitments or forecasted transactions. The Company assessesat inception and on an ongoing basis whether a derivative instrument accounted for as a hedge is highly effectivein offsetting changes in the fair value or cash flows of the hedged item. A derivative that is not a highly effectivehedge does not qualify for hedge accounting. The change in the fair value of a qualifying fair value hedge isrecorded in earnings along with the gain or loss on the hedged item. The effective portion of the change in thefair value of a qualifying cash flow hedge is recorded in other comprehensive income until the hedged item is
F-12
MURPHY OIL CORPORATION AND CONSOLIDATED SUBSIDIARIESNOTES TO CONSOLIDATED FINANCIAL STATEMENTS – Continued
recognized in earnings. When the income effect of the underlying cash flow hedged item is recognized in theConsolidated Statement of Income, the fair value of the associated cash flow hedge is reclassified from othercomprehensive income into earnings. The ineffective portion of the change in fair value of a cash flow hedge isrecognized currently in earnings. If a derivative instrument no longer qualifies as a cash flow hedge and theunderlying forecasted transaction is no longer probable of occurring, hedge accounting is discontinued and thegain or loss recorded in other comprehensive income is recognized immediately in earnings.
FAIR VALUE MEASUREMENTS – The Company carries certain assets and liabilities at fair value in itsConsolidated Balance Sheet. Fair value is determined using various techniques depending on the availability ofobservable inputs. Level 1 inputs include quoted prices in active markets for identical assets or liabilities. Level 2inputs include observable inputs other than quoted prices included within Level 1. Level 3 inputs areunobservable inputs which reflect assumptions about pricing by market participants.
STOCK-BASED COMPENSATIONEquity-Settled Awards – The fair value of awarded stock options, restricted stock units and other stock-basedcompensation that are settled with Company shares is determined based on a combination of managementassumptions and the market value of the Company’s common stock. The Company uses the Black-Scholesoption pricing model for computing the fair value of equity-settled stock options. The primary assumptions madeby management include the expected life of the stock option award and the expected volatility of Murphy’scommon stock prices. The Company uses both historical data and current information to support its assumptions.Stock option expense is recognized on a straight-line basis over the respective vesting period of two or threeyears. The Company uses a Monte Carlo valuation model to determine the fair value of performance-basedrestricted stock units that are equity settled and expense is recognized over the three-year vesting period. The fairvalue of time-lapse restricted stock units is determined based on the price of Company stock on the date of grantand expense is recognized over the vesting period. The Company estimates the number of stock options andperformance-based restricted stock units that will not vest and adjusts its compensation expense accordingly.Differences between estimated and actual vested amounts are accounted for as an adjustment to expense whenknown.
Cash-Settled Awards – The Company accounts for stock appreciation rights (SAR), cash-settled restricted stockunits (CRSU) and phantom stock units as liability awards. Expense associated with these awards are recognizedover the vesting period based on the latest available estimate of the fair value of the awards, which is generallydetermined using a Black-Scholes method for SAR, a Monte Carlo method for CRSU, and the period-end priceof the Company’s common stock for phantom units. When SAR are exercised and when CRSU and phantomunits expire, the Company adjusts previously recorded expense to the final amounts paid out in cash for theseawards.
NET INCOME PER COMMON SHARE – Basic income per common share is computed by dividing net incomefor each reporting period by the weighted average number of common shares outstanding during the period.Diluted income per common share is computed by dividing net income for each reporting period by the weightedaverage number of common shares outstanding during the period plus the effects of all potentially dilutivecommon shares.
USE OF ESTIMATES – In preparing the financial statements of the Company in conformity with U.S. generallyaccepted accounting principles, management has made a number of estimates and assumptions related to thereporting of assets, liabilities, revenues, and expenses and the disclosure of contingent assets and liabilities.Actual results may differ from the estimates.
F-13
MURPHY OIL CORPORATION AND CONSOLIDATED SUBSIDIARIESNOTES TO CONSOLIDATED FINANCIAL STATEMENTS – Continued
Note B – New Accounting Principles and Recent Accounting Pronouncements
Accounting Principles Adopted
In February 2013, the Financial Accounting Standards Board (FASB) issued an accounting standards update thatrequires additional disclosures for reclassification adjustments from accumulated other comprehensive income(AOCI). These additional disclosures include changes in AOCI balances by component and significant itemsreclassified out of AOCI. These disclosures must be presented either on the face of the affected financialstatement or in the notes to the financial statements. The disclosures are effective for Murphy Oil beginning inthe first quarter of 2013 and are to be provided on a prospective basis. These disclosures are presented in Note O.
In December 2011, the FASB issued an accounting standards update that requires enhanced disclosures aboutfinancial instruments and derivative instruments that are either offset in the balance sheet or are subject to anenforceable master netting arrangement or similar agreement. The guidance was effective for all interim andannual periods beginning on or after January 1, 2013. These disclosures are presented in Note P.
Note C – Discontinued Operations
Separation of U.S. Downstream Business
On August 30, 2013, Murphy Oil Corporation (the “Company”) distributed 100% of the outstanding commonstock of Murphy USA Inc. (“MUSA”) to its shareholders in a generally tax-free spin-off for U.S. federal incometax purposes. After the close of the New York Stock Exchange on August 30, 2013, the Company’s shareholdersof record as of 5:00 p.m. Eastern time on August 21, 2013 received one share of MUSA common stock for everyfour common shares of the Company held by such shareholders. Prior to the separation, MUSA held all of theCompany’s U.S. downstream operations, including retail gasoline stations and other marketing assets, plus twoethanol production facilities. In connection with the separation, Murphy Oil USA, Inc., MUSA’s 100% ownedprimary operating subsidiary, distributed $650,000,000 to the Company in the form of a cash dividend. Thesefunds were raised from the proceeds of $500,000,000 secured notes issued by Murphy Oil USA, Inc. plus$150,000,000 borrowed under credit facilities entered into by MUSA and Murphy Oil USA, Inc. in connectionwith the separation. The shares of MUSA common stock are traded on the New York Stock Exchange under theticker symbol “MUSA.” The Company has no continuing involvement with MUSA operations. Accordingly, theoperating results and the cash flows for these former U.S. downstream operations have been reported asdiscontinued operations for all periods presented in the consolidated financial statements. These operations wereformerly reported as the U.S. refining and marketing segment in prior years’ financial statements.
In order to effect the separation and govern the Company’s relationship with MUSA after the separation, bothparties entered into a series of agreements governing each party’s rights and obligations after the separation.Among such agreements, the Separation and Distribution Agreement governs the separation of the U.S.downstream business, the transfer of assets, cross-indemnities between the Company and MUSA, handling ofclaims subject to indemnification and related matters, and other matters related to the Company’s relationshipwith MUSA.
The Tax Matters Agreement governs the respective rights, responsibilities and obligations of the Company andMUSA with respect to taxes, tax attributes, tax returns, tax proceedings and certain other tax matters. In addition,the Tax Matters Agreement imposes certain restrictions on MUSA and its subsidiaries (including restrictions onshare issuances, business combinations, sales of assets and similar transactions) that are designed to preserve thetax-free status of the distribution.
The Employee Matters Agreement governs the compensation and employee benefit obligations with respect tothe current and former employees and non-employee directors of the Company and MUSA, and generally
F-14
MURPHY OIL CORPORATION AND CONSOLIDATED SUBSIDIARIESNOTES TO CONSOLIDATED FINANCIAL STATEMENTS – Continued
allocates liabilities and responsibilities relating to employee compensation, benefit plans and programs. TheEmployee Matters Agreement provides that employees of MUSA will no longer participate in benefit planssponsored or maintained by the Company. In addition, the Employee Matters Agreement provides that each ofthe parties will be responsible for their respective current employees and compensation plans for such currentemployees, and that the Company will be responsible for liabilities relating to former employees who left prior tothe separation. The Employee Matters Agreement sets forth the general principles relating to employee mattersand also addresses any special circumstances during the transition period. The Employee Matters Agreement alsoprovides that (i) the distribution does not constitute a change in control under existing plans, programs,agreements or arrangements, and (ii) the distribution and the assignment, transfer or continuation of theemployment of employees with another entity will not constitute a severance event under the applicable plans,programs, agreements or arrangements.
The Transition Service Agreement sets forth the terms on which the Company and MUSA will provide certainservices or functions to the other party. Transition services include administration, payroll, human resources, dataprocessing, environmental health and safety, audit support, financial transaction support, and other supportservices, information technology systems and various other corporate services. The agreement provides for theprovision of specified services, generally for a period of up to 18 months, with a possible extension of six months(an aggregate of 24 months), on a full cost basis.
Other Discontinued Operations
Additionally, the Company completed the sale of all of its U.K. oil and natural gas production assets during2013. The Company recognized an after-tax gain of $216,147,000 on sale of these U.K. oil and gas assets during2013. The results of the operations have also been reported as discontinued operations for all periods presented inthese consolidated financial statements.
The Company has previously announced its intention to sell its U.K. refining and marketing operations.Beginning in 2013, the Company has accounted for the U.K. downstream business as discontinued operations forall periods presented, including a reclassification of all the prior years’ operating results for this business todiscontinued operations. The U.K. downstream operations were formerly reported as a separate segment withinthe Company’s refining and marketing business. The sale process continues in 2014.
F-15
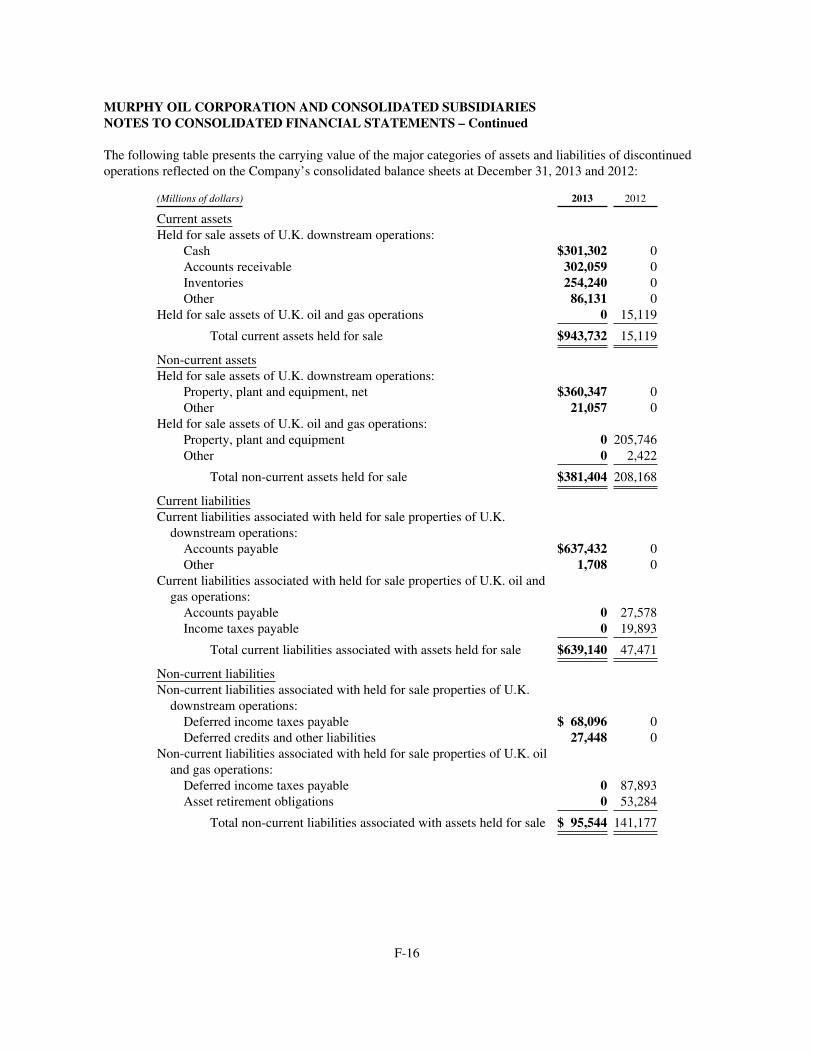
MURPHY OIL CORPORATION AND CONSOLIDATED SUBSIDIARIESNOTES TO CONSOLIDATED FINANCIAL STATEMENTS – Continued
The following table presents the carrying value of the major categories of assets and liabilities of discontinuedoperations reflected on the Company’s consolidated balance sheets at December 31, 2013 and 2012:
(Millions of dollars) 2013 2012
Current assetsHeld for sale assets of U.K. downstream operations:
Cash $301,302 0Accounts receivable 302,059 0Inventories 254,240 0Other 86,131 0
Held for sale assets of U.K. oil and gas operations 0 15,119
Total current assets held for sale $943,732 15,119
Non-current assetsHeld for sale assets of U.K. downstream operations:
Property, plant and equipment, net $360,347 0Other 21,057 0
Held for sale assets of U.K. oil and gas operations:Property, plant and equipment 0 205,746Other 0 2,422
Total non-current assets held for sale $381,404 208,168
Current liabilitiesCurrent liabilities associated with held for sale properties of U.K.downstream operations:Accounts payable $637,432 0Other 1,708 0
Current liabilities associated with held for sale properties of U.K. oil andgas operations:Accounts payable 0 27,578Income taxes payable 0 19,893
Total current liabilities associated with assets held for sale $639,140 47,471
Non-current liabilitiesNon-current liabilities associated with held for sale properties of U.K.downstream operations:Deferred income taxes payable $ 68,096 0Deferred credits and other liabilities 27,448 0
Non-current liabilities associated with held for sale properties of U.K. oiland gas operations:Deferred income taxes payable 0 87,893Asset retirement obligations 0 53,284
Total non-current liabilities associated with assets held for sale $ 95,544 141,177
F-16
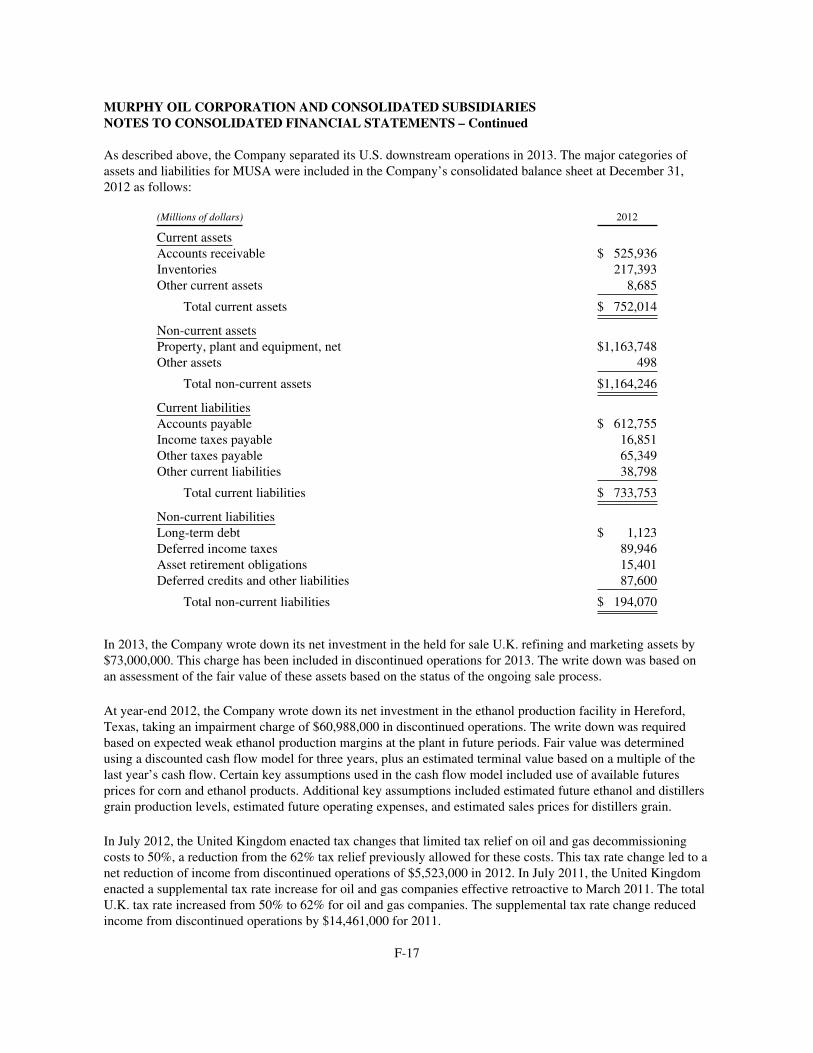
MURPHY OIL CORPORATION AND CONSOLIDATED SUBSIDIARIESNOTES TO CONSOLIDATED FINANCIAL STATEMENTS – Continued
As described above, the Company separated its U.S. downstream operations in 2013. The major categories ofassets and liabilities for MUSA were included in the Company’s consolidated balance sheet at December 31,2012 as follows:
(Millions of dollars) 2012
Current assetsAccounts receivable $ 525,936Inventories 217,393Other current assets 8,685
Total current assets $ 752,014
Non-current assetsProperty, plant and equipment, net $1,163,748Other assets 498
Total non-current assets $1,164,246
Current liabilitiesAccounts payable $ 612,755Income taxes payable 16,851Other taxes payable 65,349Other current liabilities 38,798
Total current liabilities $ 733,753
Non-current liabilitiesLong-term debt $ 1,123Deferred income taxes 89,946Asset retirement obligations 15,401Deferred credits and other liabilities 87,600
Total non-current liabilities $ 194,070
In 2013, the Company wrote down its net investment in the held for sale U.K. refining and marketing assets by$73,000,000. This charge has been included in discontinued operations for 2013. The write down was based onan assessment of the fair value of these assets based on the status of the ongoing sale process.
At year-end 2012, the Company wrote down its net investment in the ethanol production facility in Hereford,Texas, taking an impairment charge of $60,988,000 in discontinued operations. The write down was requiredbased on expected weak ethanol production margins at the plant in future periods. Fair value was determinedusing a discounted cash flow model for three years, plus an estimated terminal value based on a multiple of thelast year’s cash flow. Certain key assumptions used in the cash flow model included use of available futuresprices for corn and ethanol products. Additional key assumptions included estimated future ethanol and distillersgrain production levels, estimated future operating expenses, and estimated sales prices for distillers grain.
In July 2012, the United Kingdom enacted tax changes that limited tax relief on oil and gas decommissioningcosts to 50%, a reduction from the 62% tax relief previously allowed for these costs. This tax rate change led to anet reduction of income from discontinued operations of $5,523,000 in 2012. In July 2011, the United Kingdomenacted a supplemental tax rate increase for oil and gas companies effective retroactive to March 2011. The totalU.K. tax rate increased from 50% to 62% for oil and gas companies. The supplemental tax rate change reducedincome from discontinued operations by $14,461,000 for 2011.
F-17
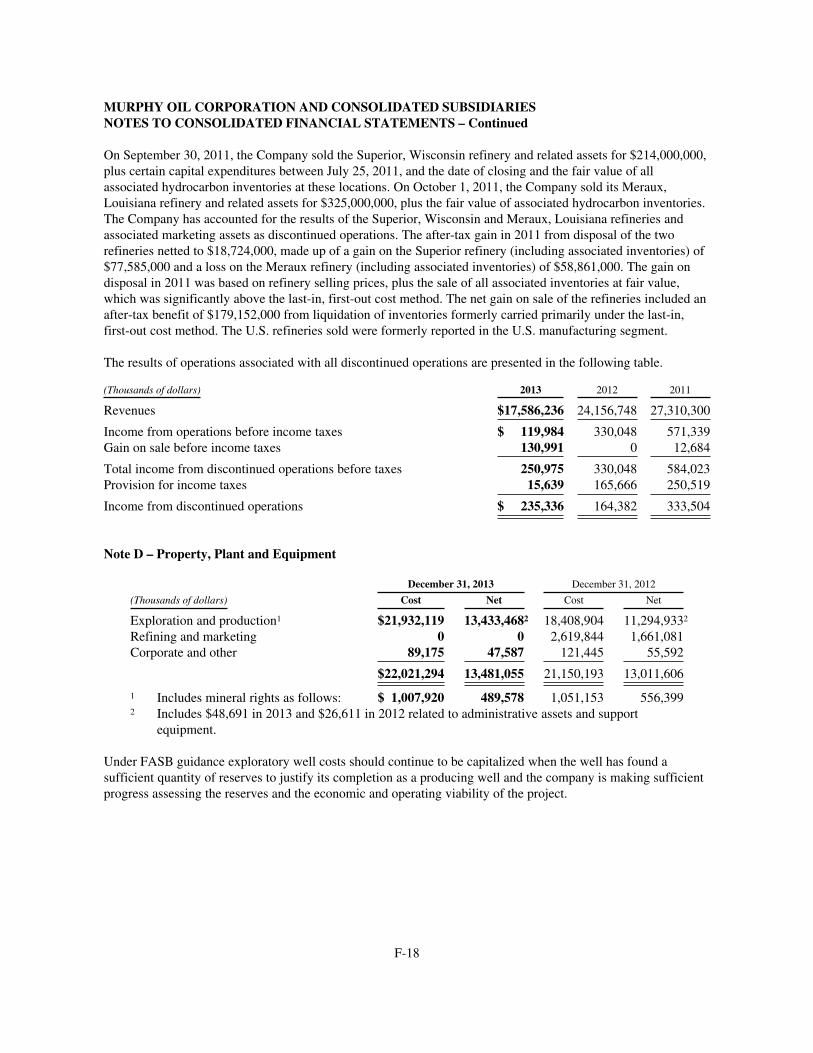
MURPHY OIL CORPORATION AND CONSOLIDATED SUBSIDIARIESNOTES TO CONSOLIDATED FINANCIAL STATEMENTS – Continued
On September 30, 2011, the Company sold the Superior, Wisconsin refinery and related assets for $214,000,000,plus certain capital expenditures between July 25, 2011, and the date of closing and the fair value of allassociated hydrocarbon inventories at these locations. On October 1, 2011, the Company sold its Meraux,Louisiana refinery and related assets for $325,000,000, plus the fair value of associated hydrocarbon inventories.The Company has accounted for the results of the Superior, Wisconsin and Meraux, Louisiana refineries andassociated marketing assets as discontinued operations. The after-tax gain in 2011 from disposal of the tworefineries netted to $18,724,000, made up of a gain on the Superior refinery (including associated inventories) of$77,585,000 and a loss on the Meraux refinery (including associated inventories) of $58,861,000. The gain ondisposal in 2011 was based on refinery selling prices, plus the sale of all associated inventories at fair value,which was significantly above the last-in, first-out cost method. The net gain on sale of the refineries included anafter-tax benefit of $179,152,000 from liquidation of inventories formerly carried primarily under the last-in,first-out cost method. The U.S. refineries sold were formerly reported in the U.S. manufacturing segment.
The results of operations associated with all discontinued operations are presented in the following table.
(Thousands of dollars) 2013 2012 2011
Revenues $17,586,236 24,156,748 27,310,300
Income from operations before income taxes $ 119,984 330,048 571,339Gain on sale before income taxes 130,991 0 12,684
Total income from discontinued operations before taxes 250,975 330,048 584,023Provision for income taxes 15,639 165,666 250,519
Income from discontinued operations $ 235,336 164,382 333,504
Note D – Property, Plant and Equipment
December 31, 2013 December 31, 2012
(Thousands of dollars) Cost Net Cost Net
Exploration and production1 $21,932,119 13,433,4682 18,408,904 11,294,9332
Refining and marketing 0 0 2,619,844 1,661,081Corporate and other 89,175 47,587 121,445 55,592
$22,021,294 13,481,055 21,150,193 13,011,606
1 Includes mineral rights as follows: $ 1,007,920 489,578 1,051,153 556,3992 Includes $48,691 in 2013 and $26,611 in 2012 related to administrative assets and support
equipment.
Under FASB guidance exploratory well costs should continue to be capitalized when the well has found asufficient quantity of reserves to justify its completion as a producing well and the company is making sufficientprogress assessing the reserves and the economic and operating viability of the project.
F-18
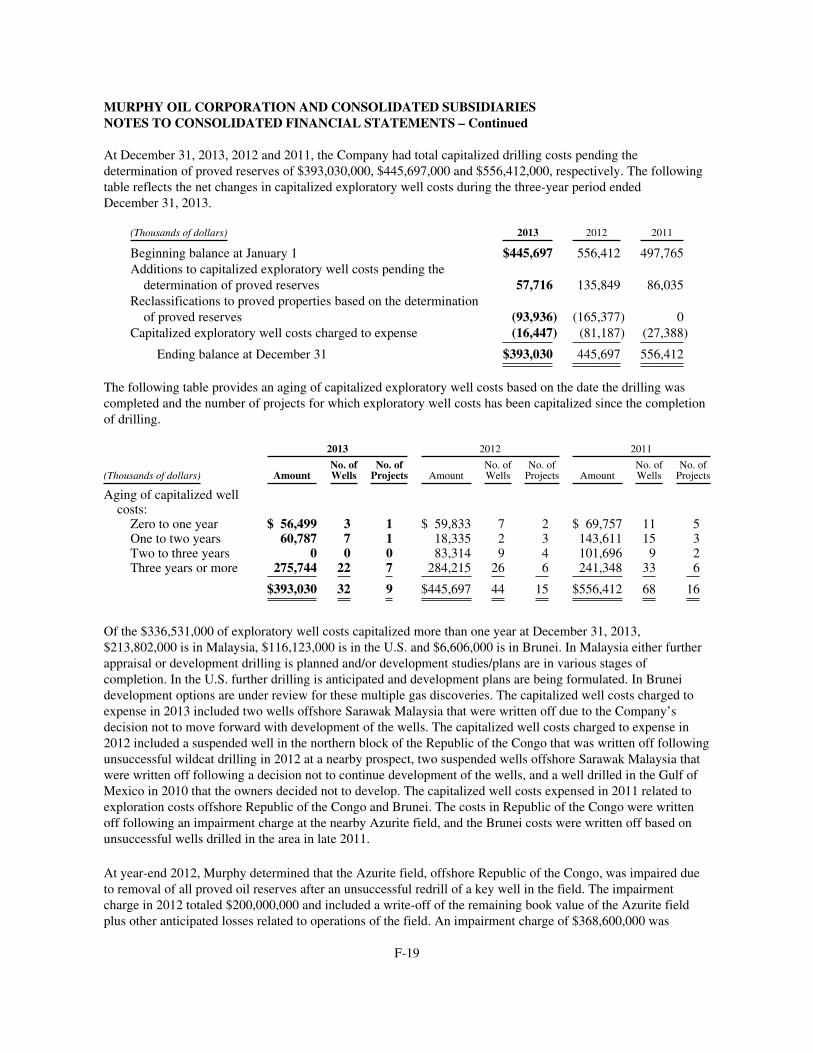
MURPHY OIL CORPORATION AND CONSOLIDATED SUBSIDIARIESNOTES TO CONSOLIDATED FINANCIAL STATEMENTS – Continued
At December 31, 2013, 2012 and 2011, the Company had total capitalized drilling costs pending thedetermination of proved reserves of $393,030,000, $445,697,000 and $556,412,000, respectively. The followingtable reflects the net changes in capitalized exploratory well costs during the three-year period endedDecember 31, 2013.
(Thousands of dollars) 2013 2012 2011
Beginning balance at January 1 $445,697 556,412 497,765Additions to capitalized exploratory well costs pending thedetermination of proved reserves 57,716 135,849 86,035
Reclassifications to proved properties based on the determinationof proved reserves (93,936) (165,377) 0
Capitalized exploratory well costs charged to expense (16,447) (81,187) (27,388)
Ending balance at December 31 $393,030 445,697 556,412
The following table provides an aging of capitalized exploratory well costs based on the date the drilling wascompleted and the number of projects for which exploratory well costs has been capitalized since the completionof drilling.
2013 2012 2011
(Thousands of dollars) AmountNo. ofWells
No. ofProjects Amount
No. ofWells
No. ofProjects Amount
No. ofWells
No. ofProjects
Aging of capitalized wellcosts:Zero to one year $ 56,499 3 1 $ 59,833 7 2 $ 69,757 11 5One to two years 60,787 7 1 18,335 2 3 143,611 15 3Two to three years 0 0 0 83,314 9 4 101,696 9 2Three years or more 275,744 22 7 284,215 26 6 241,348 33 6
$393,030 32 9 $445,697 44 15 $556,412 68 16
Of the $336,531,000 of exploratory well costs capitalized more than one year at December 31, 2013,$213,802,000 is in Malaysia, $116,123,000 is in the U.S. and $6,606,000 is in Brunei. In Malaysia either furtherappraisal or development drilling is planned and/or development studies/plans are in various stages ofcompletion. In the U.S. further drilling is anticipated and development plans are being formulated. In Bruneidevelopment options are under review for these multiple gas discoveries. The capitalized well costs charged toexpense in 2013 included two wells offshore Sarawak Malaysia that were written off due to the Company’sdecision not to move forward with development of the wells. The capitalized well costs charged to expense in2012 included a suspended well in the northern block of the Republic of the Congo that was written off followingunsuccessful wildcat drilling in 2012 at a nearby prospect, two suspended wells offshore Sarawak Malaysia thatwere written off following a decision not to continue development of the wells, and a well drilled in the Gulf ofMexico in 2010 that the owners decided not to develop. The capitalized well costs expensed in 2011 related toexploration costs offshore Republic of the Congo and Brunei. The costs in Republic of the Congo were writtenoff following an impairment charge at the nearby Azurite field, and the Brunei costs were written off based onunsuccessful wells drilled in the area in late 2011.
At year-end 2012, Murphy determined that the Azurite field, offshore Republic of the Congo, was impaired dueto removal of all proved oil reserves after an unsuccessful redrill of a key well in the field. The impairmentcharge in 2012 totaled $200,000,000 and included a write-off of the remaining book value of the Azurite fieldplus other anticipated losses related to operations of the field. An impairment charge of $368,600,000 was
F-19
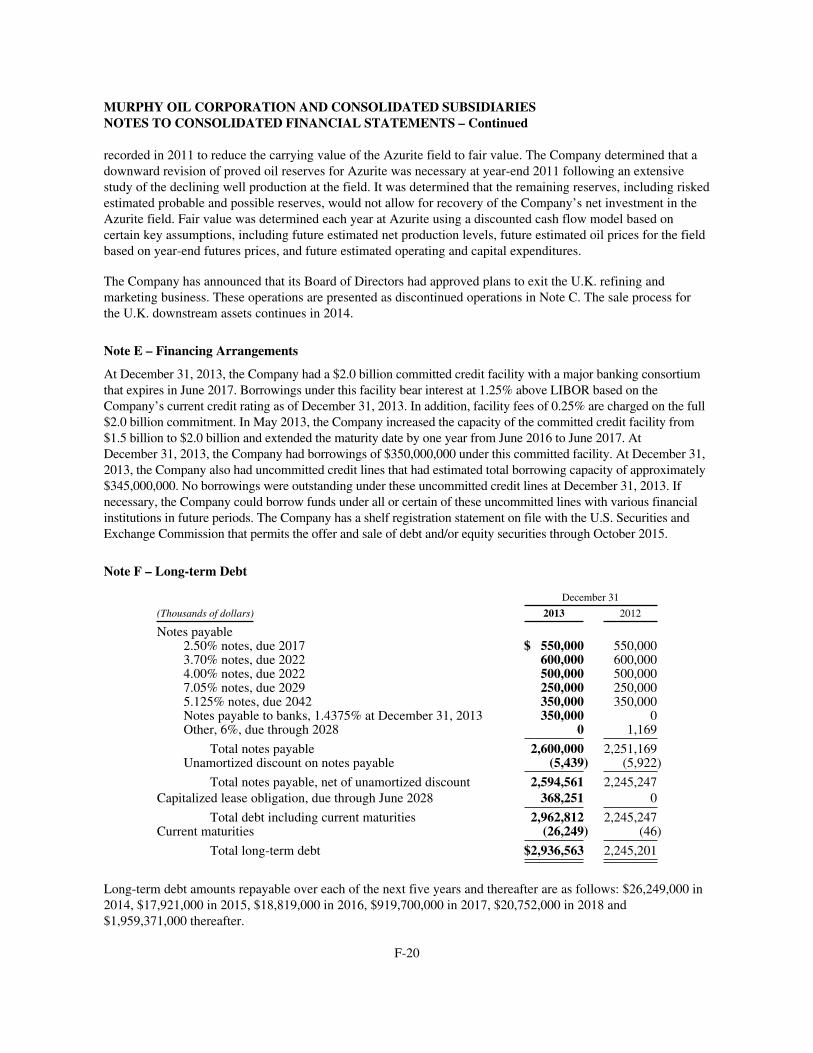
MURPHY OIL CORPORATION AND CONSOLIDATED SUBSIDIARIESNOTES TO CONSOLIDATED FINANCIAL STATEMENTS – Continued
recorded in 2011 to reduce the carrying value of the Azurite field to fair value. The Company determined that adownward revision of proved oil reserves for Azurite was necessary at year-end 2011 following an extensivestudy of the declining well production at the field. It was determined that the remaining reserves, including riskedestimated probable and possible reserves, would not allow for recovery of the Company’s net investment in theAzurite field. Fair value was determined each year at Azurite using a discounted cash flow model based oncertain key assumptions, including future estimated net production levels, future estimated oil prices for the fieldbased on year-end futures prices, and future estimated operating and capital expenditures.
The Company has announced that its Board of Directors had approved plans to exit the U.K. refining andmarketing business. These operations are presented as discontinued operations in Note C. The sale process forthe U.K. downstream assets continues in 2014.
Note E – Financing Arrangements
At December 31, 2013, the Company had a $2.0 billion committed credit facility with a major banking consortiumthat expires in June 2017. Borrowings under this facility bear interest at 1.25% above LIBOR based on theCompany’s current credit rating as of December 31, 2013. In addition, facility fees of 0.25% are charged on the full$2.0 billion commitment. In May 2013, the Company increased the capacity of the committed credit facility from$1.5 billion to $2.0 billion and extended the maturity date by one year from June 2016 to June 2017. AtDecember 31, 2013, the Company had borrowings of $350,000,000 under this committed facility. At December 31,2013, the Company also had uncommitted credit lines that had estimated total borrowing capacity of approximately$345,000,000. No borrowings were outstanding under these uncommitted credit lines at December 31, 2013. Ifnecessary, the Company could borrow funds under all or certain of these uncommitted lines with various financialinstitutions in future periods. The Company has a shelf registration statement on file with the U.S. Securities andExchange Commission that permits the offer and sale of debt and/or equity securities through October 2015.
Note F – Long-term Debt
December 31
(Thousands of dollars) 2013 2012
Notes payable2.50% notes, due 2017 $ 550,000 550,0003.70% notes, due 2022 600,000 600,0004.00% notes, due 2022 500,000 500,0007.05% notes, due 2029 250,000 250,0005.125% notes, due 2042 350,000 350,000Notes payable to banks, 1.4375% at December 31, 2013 350,000 0Other, 6%, due through 2028 0 1,169
Total notes payable 2,600,000 2,251,169Unamortized discount on notes payable (5,439) (5,922)
Total notes payable, net of unamortized discount 2,594,561 2,245,247Capitalized lease obligation, due through June 2028 368,251 0
Total debt including current maturities 2,962,812 2,245,247Current maturities (26,249) (46)
Total long-term debt $2,936,563 2,245,201
Long-term debt amounts repayable over each of the next five years and thereafter are as follows: $26,249,000 in2014, $17,921,000 in 2015, $18,819,000 in 2016, $919,700,000 in 2017, $20,752,000 in 2018 and$1,959,371,000 thereafter.
F-20
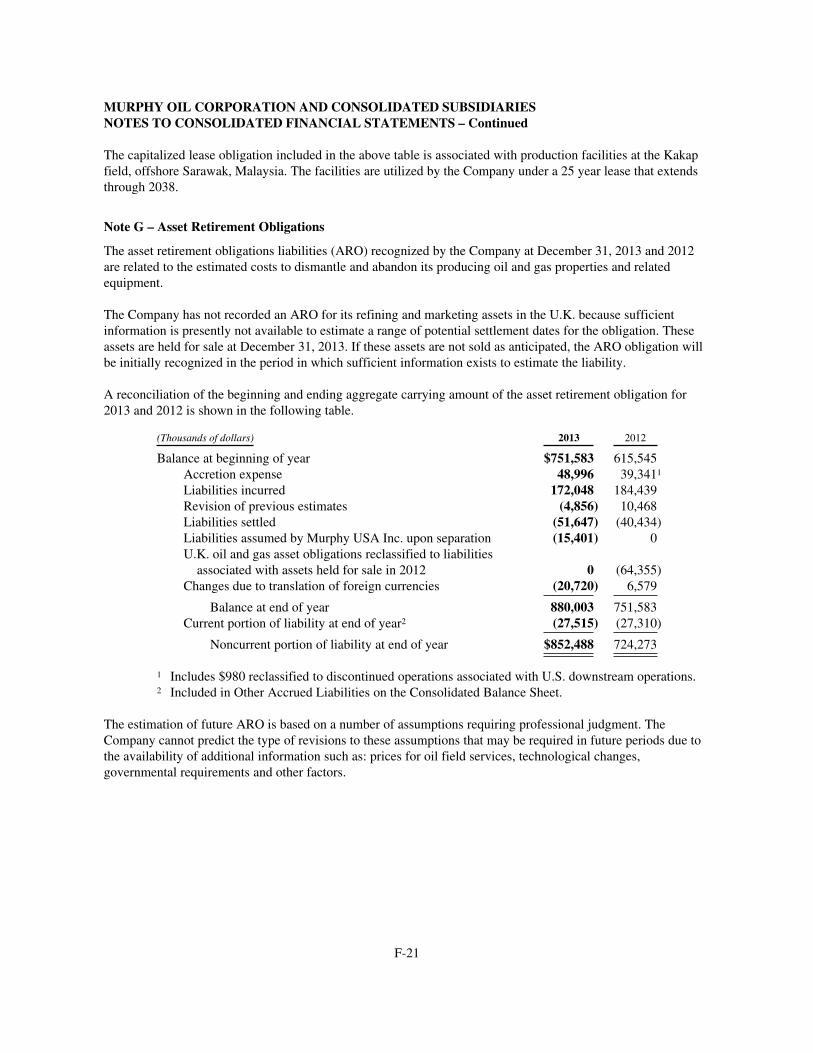
MURPHY OIL CORPORATION AND CONSOLIDATED SUBSIDIARIESNOTES TO CONSOLIDATED FINANCIAL STATEMENTS – Continued
The capitalized lease obligation included in the above table is associated with production facilities at the Kakapfield, offshore Sarawak, Malaysia. The facilities are utilized by the Company under a 25 year lease that extendsthrough 2038.
Note G – Asset Retirement Obligations
The asset retirement obligations liabilities (ARO) recognized by the Company at December 31, 2013 and 2012are related to the estimated costs to dismantle and abandon its producing oil and gas properties and relatedequipment.
The Company has not recorded an ARO for its refining and marketing assets in the U.K. because sufficientinformation is presently not available to estimate a range of potential settlement dates for the obligation. Theseassets are held for sale at December 31, 2013. If these assets are not sold as anticipated, the ARO obligation willbe initially recognized in the period in which sufficient information exists to estimate the liability.
A reconciliation of the beginning and ending aggregate carrying amount of the asset retirement obligation for2013 and 2012 is shown in the following table.
(Thousands of dollars) 2013 2012
Balance at beginning of year $751,583 615,545Accretion expense 48,996 39,3411
Liabilities incurred 172,048 184,439Revision of previous estimates (4,856) 10,468Liabilities settled (51,647) (40,434)Liabilities assumed by Murphy USA Inc. upon separation (15,401) 0U.K. oil and gas asset obligations reclassified to liabilitiesassociated with assets held for sale in 2012 0 (64,355)
Changes due to translation of foreign currencies (20,720) 6,579
Balance at end of year 880,003 751,583Current portion of liability at end of year2 (27,515) (27,310)
Noncurrent portion of liability at end of year $852,488 724,273
1 Includes $980 reclassified to discontinued operations associated with U.S. downstream operations.2 Included in Other Accrued Liabilities on the Consolidated Balance Sheet.
The estimation of future ARO is based on a number of assumptions requiring professional judgment. TheCompany cannot predict the type of revisions to these assumptions that may be required in future periods due tothe availability of additional information such as: prices for oil field services, technological changes,governmental requirements and other factors.
F-21
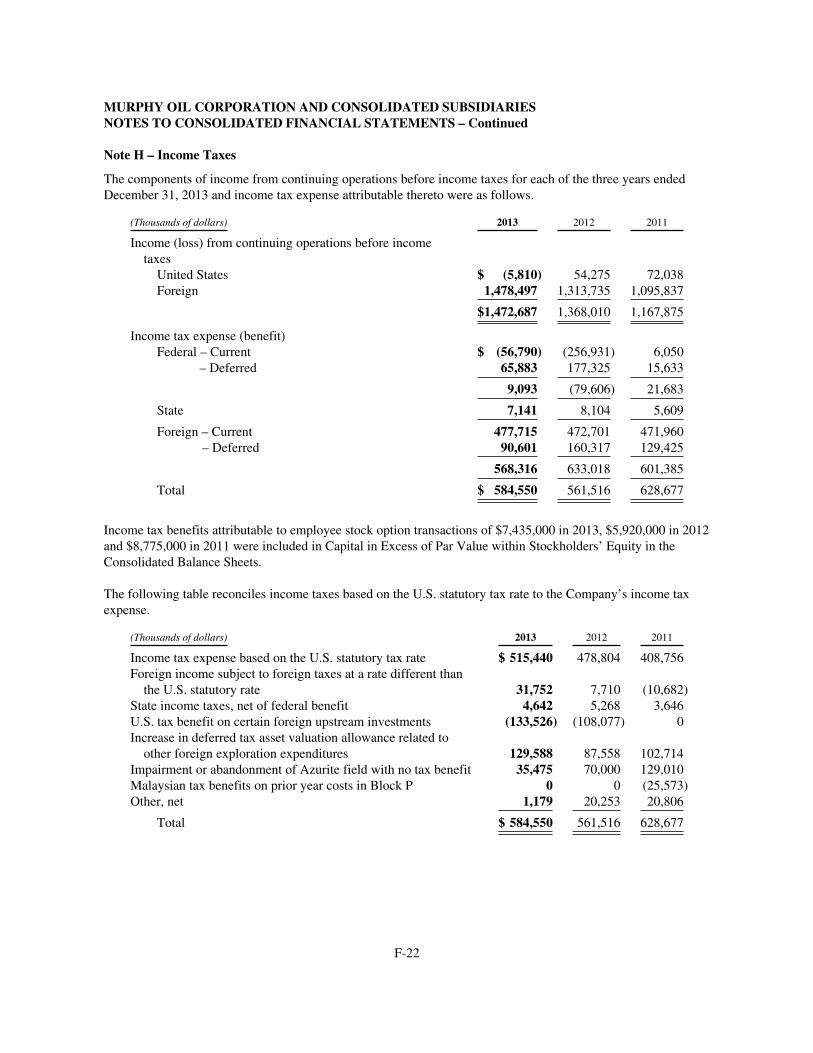
MURPHY OIL CORPORATION AND CONSOLIDATED SUBSIDIARIESNOTES TO CONSOLIDATED FINANCIAL STATEMENTS – Continued
Note H – Income Taxes
The components of income from continuing operations before income taxes for each of the three years endedDecember 31, 2013 and income tax expense attributable thereto were as follows.
(Thousands of dollars) 2013 2012 2011
Income (loss) from continuing operations before incometaxesUnited States $ (5,810) 54,275 72,038Foreign 1,478,497 1,313,735 1,095,837
$1,472,687 1,368,010 1,167,875
Income tax expense (benefit)Federal – Current $ (56,790) (256,931) 6,050
– Deferred 65,883 177,325 15,633
9,093 (79,606) 21,683
State 7,141 8,104 5,609
Foreign – Current 477,715 472,701 471,960– Deferred 90,601 160,317 129,425
568,316 633,018 601,385
Total $ 584,550 561,516 628,677
Income tax benefits attributable to employee stock option transactions of $7,435,000 in 2013, $5,920,000 in 2012and $8,775,000 in 2011 were included in Capital in Excess of Par Value within Stockholders’ Equity in theConsolidated Balance Sheets.
The following table reconciles income taxes based on the U.S. statutory tax rate to the Company’s income taxexpense.
(Thousands of dollars) 2013 2012 2011
Income tax expense based on the U.S. statutory tax rate $ 515,440 478,804 408,756Foreign income subject to foreign taxes at a rate different thanthe U.S. statutory rate 31,752 7,710 (10,682)
State income taxes, net of federal benefit 4,642 5,268 3,646U.S. tax benefit on certain foreign upstream investments (133,526) (108,077) 0Increase in deferred tax asset valuation allowance related toother foreign exploration expenditures 129,588 87,558 102,714
Impairment or abandonment of Azurite field with no tax benefit 35,475 70,000 129,010Malaysian tax benefits on prior year costs in Block P 0 0 (25,573)Other, net 1,179 20,253 20,806
Total $ 584,550 561,516 628,677
F-22
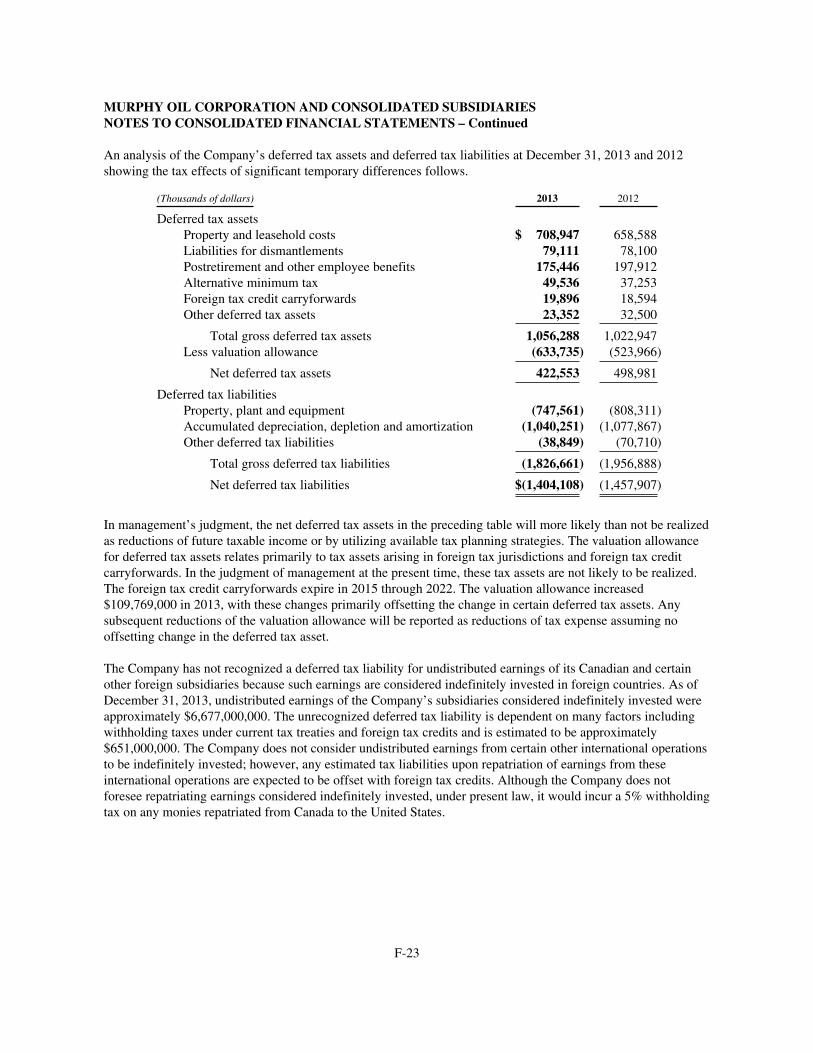
MURPHY OIL CORPORATION AND CONSOLIDATED SUBSIDIARIESNOTES TO CONSOLIDATED FINANCIAL STATEMENTS – Continued
An analysis of the Company’s deferred tax assets and deferred tax liabilities at December 31, 2013 and 2012showing the tax effects of significant temporary differences follows.
(Thousands of dollars) 2013 2012
Deferred tax assetsProperty and leasehold costs $ 708,947 658,588Liabilities for dismantlements 79,111 78,100Postretirement and other employee benefits 175,446 197,912Alternative minimum tax 49,536 37,253Foreign tax credit carryforwards 19,896 18,594Other deferred tax assets 23,352 32,500
Total gross deferred tax assets 1,056,288 1,022,947Less valuation allowance (633,735) (523,966)
Net deferred tax assets 422,553 498,981
Deferred tax liabilitiesProperty, plant and equipment (747,561) (808,311)Accumulated depreciation, depletion and amortization (1,040,251) (1,077,867)Other deferred tax liabilities (38,849) (70,710)
Total gross deferred tax liabilities (1,826,661) (1,956,888)
Net deferred tax liabilities $(1,404,108) (1,457,907)
In management’s judgment, the net deferred tax assets in the preceding table will more likely than not be realizedas reductions of future taxable income or by utilizing available tax planning strategies. The valuation allowancefor deferred tax assets relates primarily to tax assets arising in foreign tax jurisdictions and foreign tax creditcarryforwards. In the judgment of management at the present time, these tax assets are not likely to be realized.The foreign tax credit carryforwards expire in 2015 through 2022. The valuation allowance increased$109,769,000 in 2013, with these changes primarily offsetting the change in certain deferred tax assets. Anysubsequent reductions of the valuation allowance will be reported as reductions of tax expense assuming nooffsetting change in the deferred tax asset.
The Company has not recognized a deferred tax liability for undistributed earnings of its Canadian and certainother foreign subsidiaries because such earnings are considered indefinitely invested in foreign countries. As ofDecember 31, 2013, undistributed earnings of the Company’s subsidiaries considered indefinitely invested wereapproximately $6,677,000,000. The unrecognized deferred tax liability is dependent on many factors includingwithholding taxes under current tax treaties and foreign tax credits and is estimated to be approximately$651,000,000. The Company does not consider undistributed earnings from certain other international operationsto be indefinitely invested; however, any estimated tax liabilities upon repatriation of earnings from theseinternational operations are expected to be offset with foreign tax credits. Although the Company does notforesee repatriating earnings considered indefinitely invested, under present law, it would incur a 5% withholdingtax on any monies repatriated from Canada to the United States.
F-23
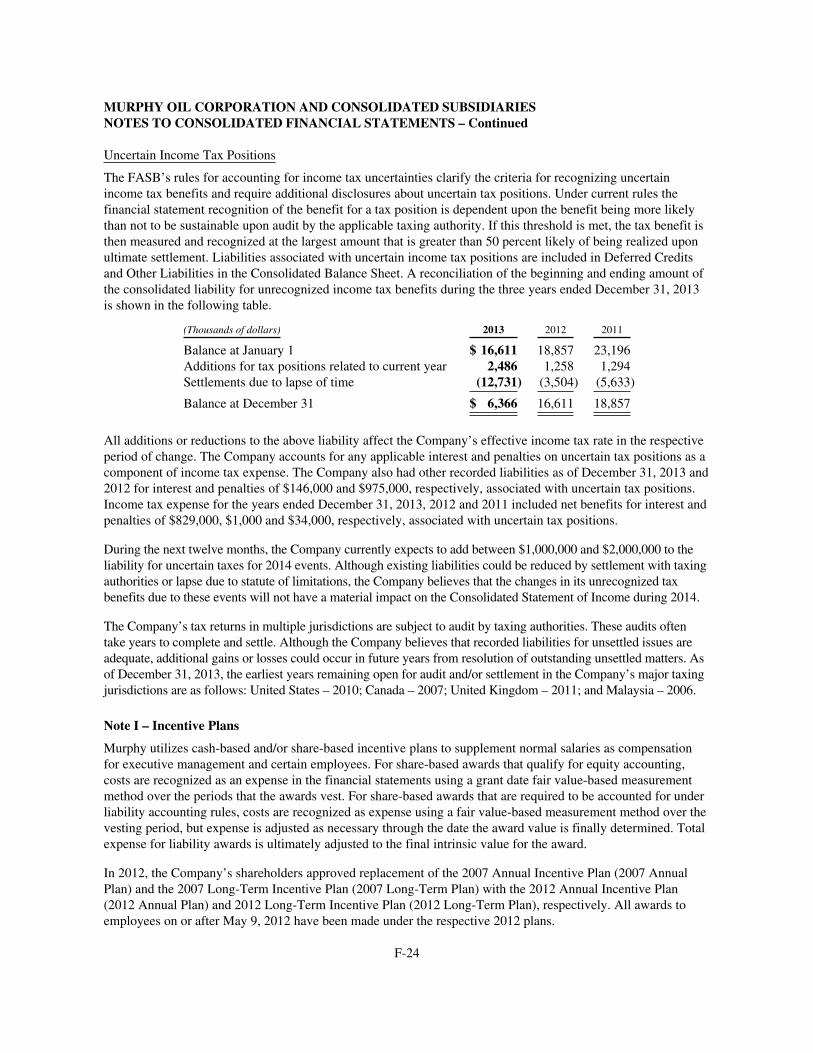
MURPHY OIL CORPORATION AND CONSOLIDATED SUBSIDIARIESNOTES TO CONSOLIDATED FINANCIAL STATEMENTS – Continued
Uncertain Income Tax Positions
The FASB’s rules for accounting for income tax uncertainties clarify the criteria for recognizing uncertainincome tax benefits and require additional disclosures about uncertain tax positions. Under current rules thefinancial statement recognition of the benefit for a tax position is dependent upon the benefit being more likelythan not to be sustainable upon audit by the applicable taxing authority. If this threshold is met, the tax benefit isthen measured and recognized at the largest amount that is greater than 50 percent likely of being realized uponultimate settlement. Liabilities associated with uncertain income tax positions are included in Deferred Creditsand Other Liabilities in the Consolidated Balance Sheet. A reconciliation of the beginning and ending amount ofthe consolidated liability for unrecognized income tax benefits during the three years ended December 31, 2013is shown in the following table.
(Thousands of dollars) 2013 2012 2011
Balance at January 1 $ 16,611 18,857 23,196Additions for tax positions related to current year 2,486 1,258 1,294Settlements due to lapse of time (12,731) (3,504) (5,633)
Balance at December 31 $ 6,366 16,611 18,857
All additions or reductions to the above liability affect the Company’s effective income tax rate in the respectiveperiod of change. The Company accounts for any applicable interest and penalties on uncertain tax positions as acomponent of income tax expense. The Company also had other recorded liabilities as of December 31, 2013 and2012 for interest and penalties of $146,000 and $975,000, respectively, associated with uncertain tax positions.Income tax expense for the years ended December 31, 2013, 2012 and 2011 included net benefits for interest andpenalties of $829,000, $1,000 and $34,000, respectively, associated with uncertain tax positions.
During the next twelve months, the Company currently expects to add between $1,000,000 and $2,000,000 to theliability for uncertain taxes for 2014 events. Although existing liabilities could be reduced by settlement with taxingauthorities or lapse due to statute of limitations, the Company believes that the changes in its unrecognized taxbenefits due to these events will not have a material impact on the Consolidated Statement of Income during 2014.
The Company’s tax returns in multiple jurisdictions are subject to audit by taxing authorities. These audits oftentake years to complete and settle. Although the Company believes that recorded liabilities for unsettled issues areadequate, additional gains or losses could occur in future years from resolution of outstanding unsettled matters. Asof December 31, 2013, the earliest years remaining open for audit and/or settlement in the Company’s major taxingjurisdictions are as follows: United States – 2010; Canada – 2007; United Kingdom – 2011; and Malaysia – 2006.
Note I – Incentive Plans
Murphy utilizes cash-based and/or share-based incentive plans to supplement normal salaries as compensationfor executive management and certain employees. For share-based awards that qualify for equity accounting,costs are recognized as an expense in the financial statements using a grant date fair value-based measurementmethod over the periods that the awards vest. For share-based awards that are required to be accounted for underliability accounting rules, costs are recognized as expense using a fair value-based measurement method over thevesting period, but expense is adjusted as necessary through the date the award value is finally determined. Totalexpense for liability awards is ultimately adjusted to the final intrinsic value for the award.
In 2012, the Company’s shareholders approved replacement of the 2007 Annual Incentive Plan (2007 AnnualPlan) and the 2007 Long-Term Incentive Plan (2007 Long-Term Plan) with the 2012 Annual Incentive Plan(2012 Annual Plan) and 2012 Long-Term Incentive Plan (2012 Long-Term Plan), respectively. All awards toemployees on or after May 9, 2012 have been made under the respective 2012 plans.
F-24
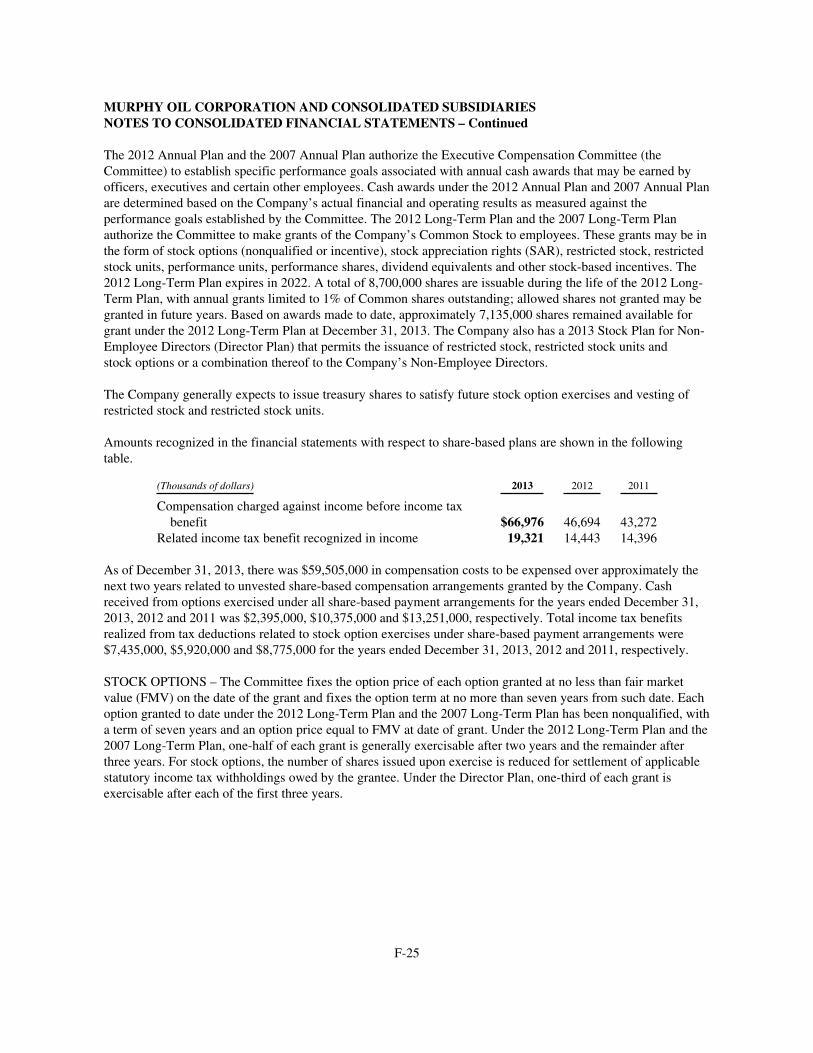
MURPHY OIL CORPORATION AND CONSOLIDATED SUBSIDIARIESNOTES TO CONSOLIDATED FINANCIAL STATEMENTS – Continued
The 2012 Annual Plan and the 2007 Annual Plan authorize the Executive Compensation Committee (theCommittee) to establish specific performance goals associated with annual cash awards that may be earned byofficers, executives and certain other employees. Cash awards under the 2012 Annual Plan and 2007 Annual Planare determined based on the Company’s actual financial and operating results as measured against theperformance goals established by the Committee. The 2012 Long-Term Plan and the 2007 Long-Term Planauthorize the Committee to make grants of the Company’s Common Stock to employees. These grants may be inthe form of stock options (nonqualified or incentive), stock appreciation rights (SAR), restricted stock, restrictedstock units, performance units, performance shares, dividend equivalents and other stock-based incentives. The2012 Long-Term Plan expires in 2022. A total of 8,700,000 shares are issuable during the life of the 2012 Long-Term Plan, with annual grants limited to 1% of Common shares outstanding; allowed shares not granted may begranted in future years. Based on awards made to date, approximately 7,135,000 shares remained available forgrant under the 2012 Long-Term Plan at December 31, 2013. The Company also has a 2013 Stock Plan for Non-Employee Directors (Director Plan) that permits the issuance of restricted stock, restricted stock units andstock options or a combination thereof to the Company’s Non-Employee Directors.
The Company generally expects to issue treasury shares to satisfy future stock option exercises and vesting ofrestricted stock and restricted stock units.
Amounts recognized in the financial statements with respect to share-based plans are shown in the followingtable.
(Thousands of dollars) 2013 2012 2011
Compensation charged against income before income taxbenefit $66,976 46,694 43,272
Related income tax benefit recognized in income 19,321 14,443 14,396
As of December 31, 2013, there was $59,505,000 in compensation costs to be expensed over approximately thenext two years related to unvested share-based compensation arrangements granted by the Company. Cashreceived from options exercised under all share-based payment arrangements for the years ended December 31,2013, 2012 and 2011 was $2,395,000, $10,375,000 and $13,251,000, respectively. Total income tax benefitsrealized from tax deductions related to stock option exercises under share-based payment arrangements were$7,435,000, $5,920,000 and $8,775,000 for the years ended December 31, 2013, 2012 and 2011, respectively.
STOCK OPTIONS – The Committee fixes the option price of each option granted at no less than fair marketvalue (FMV) on the date of the grant and fixes the option term at no more than seven years from such date. Eachoption granted to date under the 2012 Long-Term Plan and the 2007 Long-Term Plan has been nonqualified, witha term of seven years and an option price equal to FMV at date of grant. Under the 2012 Long-Term Plan and the2007 Long-Term Plan, one-half of each grant is generally exercisable after two years and the remainder afterthree years. For stock options, the number of shares issued upon exercise is reduced for settlement of applicablestatutory income tax withholdings owed by the grantee. Under the Director Plan, one-third of each grant isexercisable after each of the first three years.
F-25
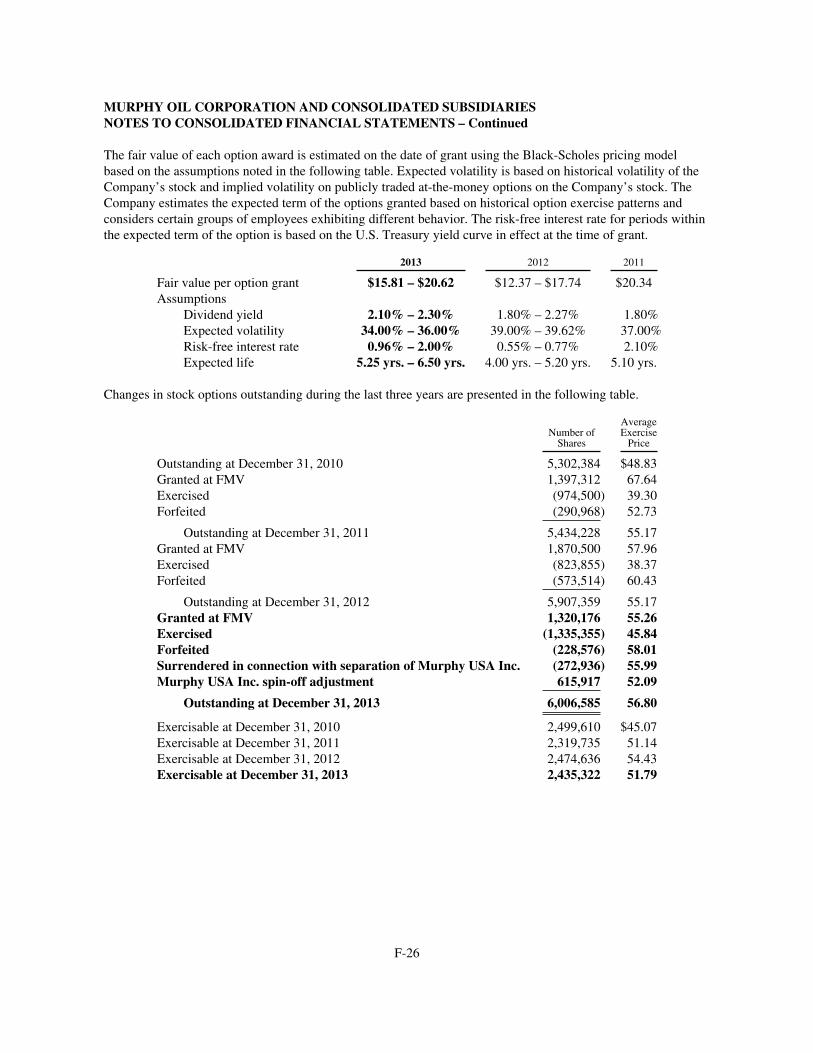
MURPHY OIL CORPORATION AND CONSOLIDATED SUBSIDIARIESNOTES TO CONSOLIDATED FINANCIAL STATEMENTS – Continued
The fair value of each option award is estimated on the date of grant using the Black-Scholes pricing modelbased on the assumptions noted in the following table. Expected volatility is based on historical volatility of theCompany’s stock and implied volatility on publicly traded at-the-money options on the Company’s stock. TheCompany estimates the expected term of the options granted based on historical option exercise patterns andconsiders certain groups of employees exhibiting different behavior. The risk-free interest rate for periods withinthe expected term of the option is based on the U.S. Treasury yield curve in effect at the time of grant.
2013 2012 2011
Fair value per option grant $15.81 – $20.62 $12.37 – $17.74 $20.34Assumptions
Dividend yield 2.10% – 2.30% 1.80% – 2.27% 1.80%Expected volatility 34.00% – 36.00% 39.00% – 39.62% 37.00%Risk-free interest rate 0.96% – 2.00% 0.55% – 0.77% 2.10%Expected life 5.25 yrs. – 6.50 yrs. 4.00 yrs. – 5.20 yrs. 5.10 yrs.
Changes in stock options outstanding during the last three years are presented in the following table.
Number ofShares
AverageExercisePrice
Outstanding at December 31, 2010 5,302,384 $48.83Granted at FMV 1,397,312 67.64Exercised (974,500) 39.30Forfeited (290,968) 52.73
Outstanding at December 31, 2011 5,434,228 55.17Granted at FMV 1,870,500 57.96Exercised (823,855) 38.37Forfeited (573,514) 60.43
Outstanding at December 31, 2012 5,907,359 55.17Granted at FMV 1,320,176 55.26Exercised (1,335,355) 45.84Forfeited (228,576) 58.01Surrendered in connection with separation of Murphy USA Inc. (272,936) 55.99Murphy USA Inc. spin-off adjustment 615,917 52.09
Outstanding at December 31, 2013 6,006,585 56.80
Exercisable at December 31, 2010 2,499,610 $45.07Exercisable at December 31, 2011 2,319,735 51.14Exercisable at December 31, 2012 2,474,636 54.43Exercisable at December 31, 2013 2,435,322 51.79
F-26
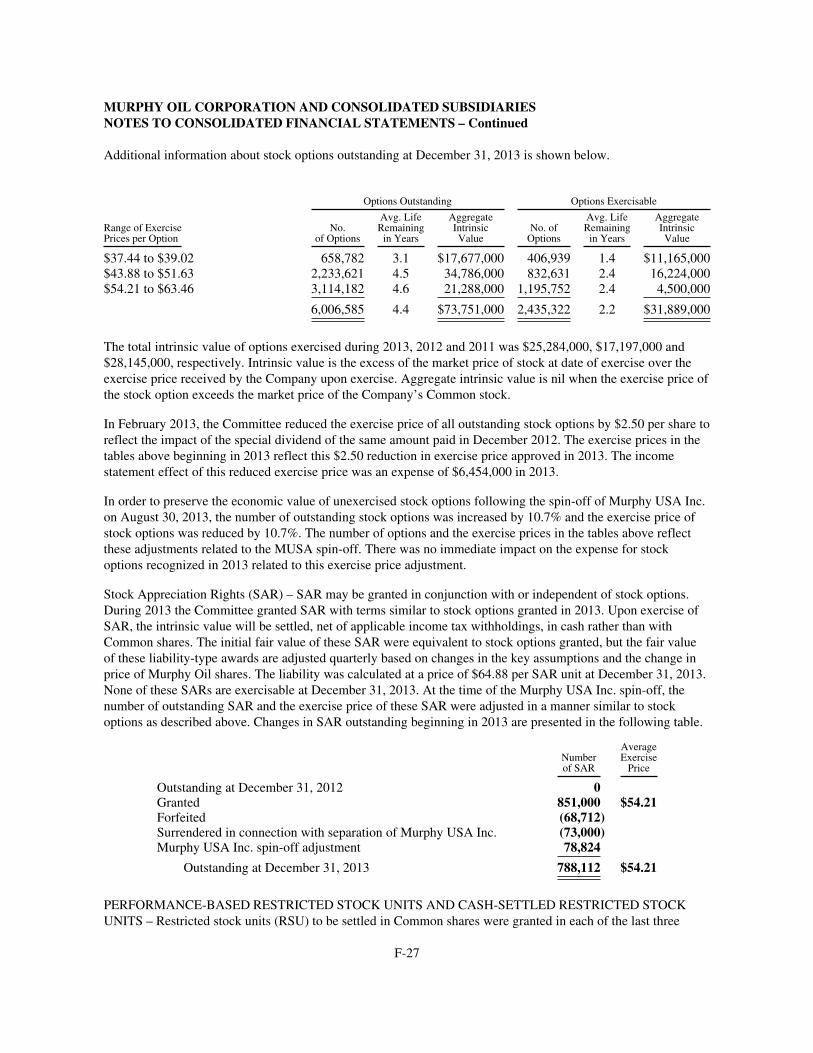
MURPHY OIL CORPORATION AND CONSOLIDATED SUBSIDIARIESNOTES TO CONSOLIDATED FINANCIAL STATEMENTS – Continued
Additional information about stock options outstanding at December 31, 2013 is shown below.
Options Outstanding Options Exercisable
Range of ExercisePrices per Option
No.of Options
Avg. LifeRemainingin Years
AggregateIntrinsicValue
No. ofOptions
Avg. LifeRemainingin Years
AggregateIntrinsicValue
$37.44 to $39.02 658,782 3.1 $17,677,000 406,939 1.4 $11,165,000$43.88 to $51.63 2,233,621 4.5 34,786,000 832,631 2.4 16,224,000$54.21 to $63.46 3,114,182 4.6 21,288,000 1,195,752 2.4 4,500,000
6,006,585 4.4 $73,751,000 2,435,322 2.2 $31,889,000
The total intrinsic value of options exercised during 2013, 2012 and 2011 was $25,284,000, $17,197,000 and$28,145,000, respectively. Intrinsic value is the excess of the market price of stock at date of exercise over theexercise price received by the Company upon exercise. Aggregate intrinsic value is nil when the exercise price ofthe stock option exceeds the market price of the Company’s Common stock.
In February 2013, the Committee reduced the exercise price of all outstanding stock options by $2.50 per share toreflect the impact of the special dividend of the same amount paid in December 2012. The exercise prices in thetables above beginning in 2013 reflect this $2.50 reduction in exercise price approved in 2013. The incomestatement effect of this reduced exercise price was an expense of $6,454,000 in 2013.
In order to preserve the economic value of unexercised stock options following the spin-off of Murphy USA Inc.on August 30, 2013, the number of outstanding stock options was increased by 10.7% and the exercise price ofstock options was reduced by 10.7%. The number of options and the exercise prices in the tables above reflectthese adjustments related to the MUSA spin-off. There was no immediate impact on the expense for stockoptions recognized in 2013 related to this exercise price adjustment.
Stock Appreciation Rights (SAR) – SAR may be granted in conjunction with or independent of stock options.During 2013 the Committee granted SAR with terms similar to stock options granted in 2013. Upon exercise ofSAR, the intrinsic value will be settled, net of applicable income tax withholdings, in cash rather than withCommon shares. The initial fair value of these SAR were equivalent to stock options granted, but the fair valueof these liability-type awards are adjusted quarterly based on changes in the key assumptions and the change inprice of Murphy Oil shares. The liability was calculated at a price of $64.88 per SAR unit at December 31, 2013.None of these SARs are exercisable at December 31, 2013. At the time of the Murphy USA Inc. spin-off, thenumber of outstanding SAR and the exercise price of these SAR were adjusted in a manner similar to stockoptions as described above. Changes in SAR outstanding beginning in 2013 are presented in the following table.
Numberof SAR
AverageExercisePrice
Outstanding at December 31, 2012 0Granted 851,000 $54.21Forfeited (68,712)Surrendered in connection with separation of Murphy USA Inc. (73,000)Murphy USA Inc. spin-off adjustment 78,824
Outstanding at December 31, 2013 788,112 $54.21
PERFORMANCE-BASED RESTRICTED STOCK UNITS AND CASH-SETTLED RESTRICTED STOCKUNITS – Restricted stock units (RSU) to be settled in Common shares were granted in each of the last three
F-27
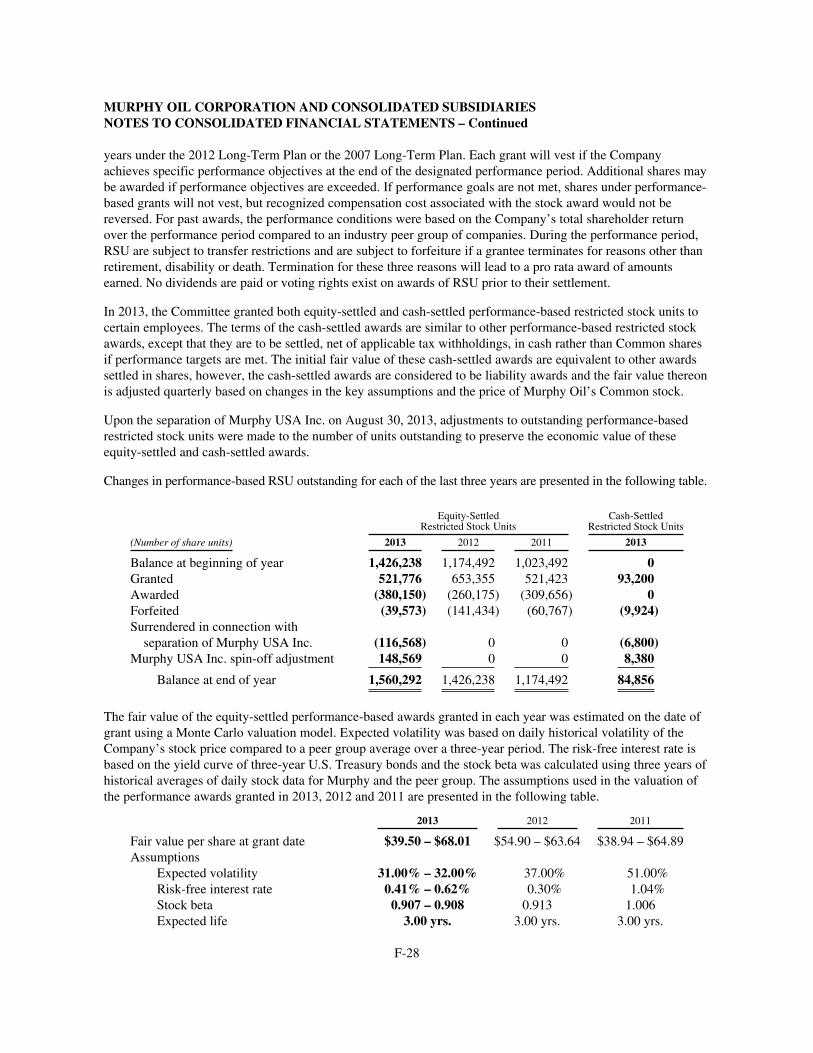
MURPHY OIL CORPORATION AND CONSOLIDATED SUBSIDIARIESNOTES TO CONSOLIDATED FINANCIAL STATEMENTS – Continued
years under the 2012 Long-Term Plan or the 2007 Long-Term Plan. Each grant will vest if the Companyachieves specific performance objectives at the end of the designated performance period. Additional shares maybe awarded if performance objectives are exceeded. If performance goals are not met, shares under performance-based grants will not vest, but recognized compensation cost associated with the stock award would not bereversed. For past awards, the performance conditions were based on the Company’s total shareholder returnover the performance period compared to an industry peer group of companies. During the performance period,RSU are subject to transfer restrictions and are subject to forfeiture if a grantee terminates for reasons other thanretirement, disability or death. Termination for these three reasons will lead to a pro rata award of amountsearned. No dividends are paid or voting rights exist on awards of RSU prior to their settlement.
In 2013, the Committee granted both equity-settled and cash-settled performance-based restricted stock units tocertain employees. The terms of the cash-settled awards are similar to other performance-based restricted stockawards, except that they are to be settled, net of applicable tax withholdings, in cash rather than Common sharesif performance targets are met. The initial fair value of these cash-settled awards are equivalent to other awardssettled in shares, however, the cash-settled awards are considered to be liability awards and the fair value thereonis adjusted quarterly based on changes in the key assumptions and the price of Murphy Oil’s Common stock.
Upon the separation of Murphy USA Inc. on August 30, 2013, adjustments to outstanding performance-basedrestricted stock units were made to the number of units outstanding to preserve the economic value of theseequity-settled and cash-settled awards.
Changes in performance-based RSU outstanding for each of the last three years are presented in the following table.
Equity-SettledRestricted Stock Units
Cash-SettledRestricted Stock Units
(Number of share units) 2013 2012 2011 2013
Balance at beginning of year 1,426,238 1,174,492 1,023,492 0Granted 521,776 653,355 521,423 93,200Awarded (380,150) (260,175) (309,656) 0Forfeited (39,573) (141,434) (60,767) (9,924)Surrendered in connection withseparation of Murphy USA Inc. (116,568) 0 0 (6,800)
Murphy USA Inc. spin-off adjustment 148,569 0 0 8,380
Balance at end of year 1,560,292 1,426,238 1,174,492 84,856
The fair value of the equity-settled performance-based awards granted in each year was estimated on the date ofgrant using a Monte Carlo valuation model. Expected volatility was based on daily historical volatility of theCompany’s stock price compared to a peer group average over a three-year period. The risk-free interest rate isbased on the yield curve of three-year U.S. Treasury bonds and the stock beta was calculated using three years ofhistorical averages of daily stock data for Murphy and the peer group. The assumptions used in the valuation ofthe performance awards granted in 2013, 2012 and 2011 are presented in the following table.
2013 2012 2011
Fair value per share at grant date $39.50 – $68.01 $54.90 – $63.64 $38.94 – $64.89Assumptions
Expected volatility 31.00% – 32.00% 37.00% 51.00%Risk-free interest rate 0.41% – 0.62% 0.30% 1.04%Stock beta 0.907 – 0.908 0.913 1.006Expected life 3.00 yrs. 3.00 yrs. 3.00 yrs.
F-28
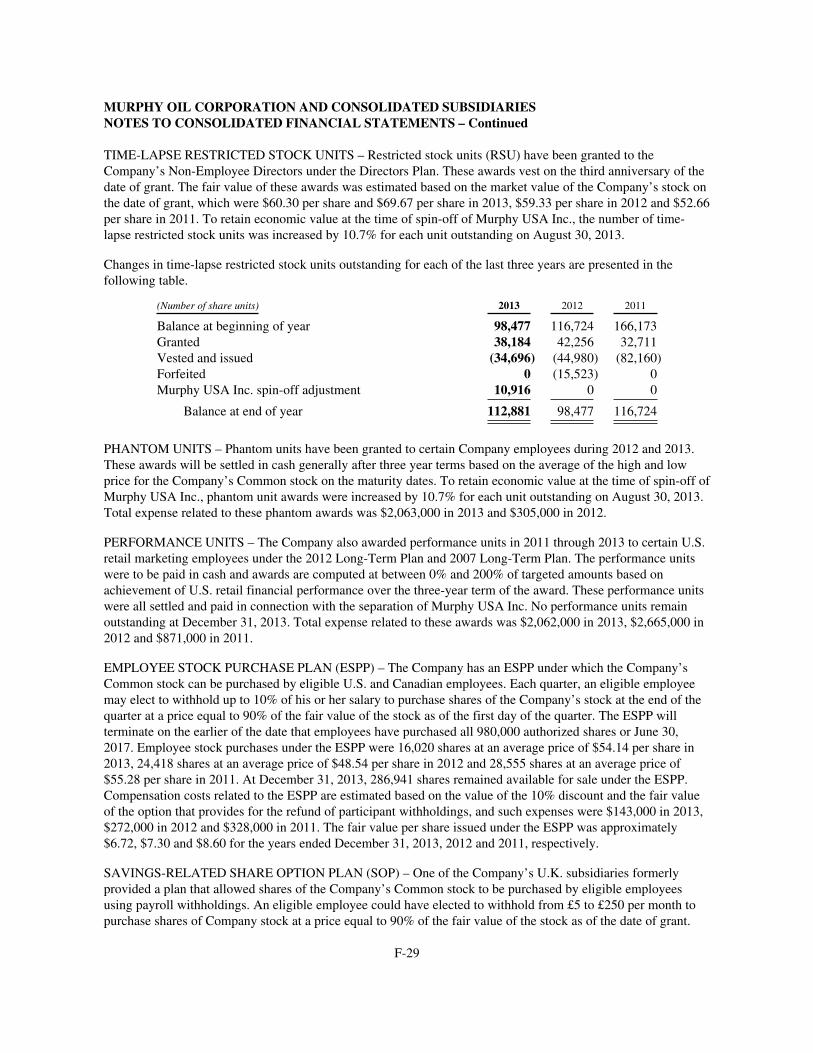
MURPHY OIL CORPORATION AND CONSOLIDATED SUBSIDIARIESNOTES TO CONSOLIDATED FINANCIAL STATEMENTS – Continued
TIME-LAPSE RESTRICTED STOCK UNITS – Restricted stock units (RSU) have been granted to theCompany’s Non-Employee Directors under the Directors Plan. These awards vest on the third anniversary of thedate of grant. The fair value of these awards was estimated based on the market value of the Company’s stock onthe date of grant, which were $60.30 per share and $69.67 per share in 2013, $59.33 per share in 2012 and $52.66per share in 2011. To retain economic value at the time of spin-off of Murphy USA Inc., the number of time-lapse restricted stock units was increased by 10.7% for each unit outstanding on August 30, 2013.
Changes in time-lapse restricted stock units outstanding for each of the last three years are presented in thefollowing table.
(Number of share units) 2013 2012 2011
Balance at beginning of year 98,477 116,724 166,173Granted 38,184 42,256 32,711Vested and issued (34,696) (44,980) (82,160)Forfeited 0 (15,523) 0Murphy USA Inc. spin-off adjustment 10,916 0 0
Balance at end of year 112,881 98,477 116,724
PHANTOM UNITS – Phantom units have been granted to certain Company employees during 2012 and 2013.These awards will be settled in cash generally after three year terms based on the average of the high and lowprice for the Company’s Common stock on the maturity dates. To retain economic value at the time of spin-off ofMurphy USA Inc., phantom unit awards were increased by 10.7% for each unit outstanding on August 30, 2013.Total expense related to these phantom awards was $2,063,000 in 2013 and $305,000 in 2012.
PERFORMANCE UNITS – The Company also awarded performance units in 2011 through 2013 to certain U.S.retail marketing employees under the 2012 Long-Term Plan and 2007 Long-Term Plan. The performance unitswere to be paid in cash and awards are computed at between 0% and 200% of targeted amounts based onachievement of U.S. retail financial performance over the three-year term of the award. These performance unitswere all settled and paid in connection with the separation of Murphy USA Inc. No performance units remainoutstanding at December 31, 2013. Total expense related to these awards was $2,062,000 in 2013, $2,665,000 in2012 and $871,000 in 2011.
EMPLOYEE STOCK PURCHASE PLAN (ESPP) – The Company has an ESPP under which the Company’sCommon stock can be purchased by eligible U.S. and Canadian employees. Each quarter, an eligible employeemay elect to withhold up to 10% of his or her salary to purchase shares of the Company’s stock at the end of thequarter at a price equal to 90% of the fair value of the stock as of the first day of the quarter. The ESPP willterminate on the earlier of the date that employees have purchased all 980,000 authorized shares or June 30,2017. Employee stock purchases under the ESPP were 16,020 shares at an average price of $54.14 per share in2013, 24,418 shares at an average price of $48.54 per share in 2012 and 28,555 shares at an average price of$55.28 per share in 2011. At December 31, 2013, 286,941 shares remained available for sale under the ESPP.Compensation costs related to the ESPP are estimated based on the value of the 10% discount and the fair valueof the option that provides for the refund of participant withholdings, and such expenses were $143,000 in 2013,$272,000 in 2012 and $328,000 in 2011. The fair value per share issued under the ESPP was approximately$6.72, $7.30 and $8.60 for the years ended December 31, 2013, 2012 and 2011, respectively.
SAVINGS-RELATED SHARE OPTION PLAN (SOP) – One of the Company’s U.K. subsidiaries formerlyprovided a plan that allowed shares of the Company’s Common stock to be purchased by eligible employeesusing payroll withholdings. An eligible employee could have elected to withhold from £5 to £250 per month topurchase shares of Company stock at a price equal to 90% of the fair value of the stock as of the date of grant.
F-29
MURPHY OIL CORPORATION AND CONSOLIDATED SUBSIDIARIESNOTES TO CONSOLIDATED FINANCIAL STATEMENTS – Continued
The SOP plan had a term of three years and employee withholdings were fixed over the life of the plan. At theend of the term of the SOP plan an employee received interest on withholdings and had six months to either useall or part of the withholdings plus credited interest to purchase shares of Company stock or receive a repaymentof withholdings plus credited interest. The SOP expired in 2012. Compensation costs related to the SOP planwere estimated based on the value of the 10% discount and the fair value of the option that allowed the employeeto receive a repayment of withholdings plus credited interest. The fair value per share of the SOP plans withholding periods that ended in April 2011 and May 2012 were $23.77 and $22.85, respectively. Total expenseassociated with this plan was nil in 2013, $110,000 in 2012 and $538,000 in 2011.
CASH AWARDS – The Committee also administers the Company’s incentive compensation plans, whichprovide for annual or periodic cash awards to officers, directors and certain other employees. These cash awardsare generally determinable based on the Company achieving specific financial and/or operational objectives.Compensation expense of $53,250,000, $32,417,000 and $33,035,000 was recorded in 2013, 2012 and 2011,respectively, for these plans.
Note J – Employee and Retiree Benefit Plans
PENSION AND OTHER POSTRETIREMENT PLANS – The Company has defined benefit pension plans thatare principally noncontributory and cover most full-time employees. All pension plans are funded except for theU.S. and Canadian nonqualified supplemental plans and the U.S. directors’ plan. All U.S. tax qualified plansmeet the funding requirements of federal laws and regulations. Contributions to foreign plans are based on locallaws and tax regulations. The Company also sponsors health care and life insurance benefit plans, which are notfunded, that cover most retired U.S. employees. The health care benefits are contributory; the life insurancebenefits are noncontributory.
Effective with the spin-off of Murphy’s former U.S. retail marketing operation, Murphy USA Inc. (MUSA) onAugust 30, 2013, significant modifications were made to the U.S. defined benefit pension plan. Certain Murphyemployees’ benefits under the U.S. plan were frozen at that time. No further benefit service will accrue for theaffected employees, however, the plan will recognize future earnings after the spin-off. In addition, all previouslyunvested benefits became fully vested at the spin-off date. For those affected active employees of the Company,additional U.S. retirement plan benefits will accrue in future periods under a cash balance formula. Upon thespin-off of MUSA, Murphy retained all vested pension defined benefit and other postretirement benefitobligations associated with current and former employees of this separated business. No additional benefit willaccrue for any employees of MUSA under the Company’s retirement plan after the spin-off date.
Generally accepted accounting principles require the Company to recognize the overfunded or underfundedstatus of its defined benefit plans as an asset or liability in its year-end consolidated balance sheet and torecognize changes in that funded status between periods through comprehensive income.
F-30
MURPHY OIL CORPORATION AND CONSOLIDATED SUBSIDIARIESNOTES TO CONSOLIDATED FINANCIAL STATEMENTS – Continued
The tables that follow provide a reconciliation of the changes in the plans’ benefit obligations and fair value ofassets for the years ended December 31, 2013 and 2012 and a statement of the funded status as of December 31,2013 and 2012.
PensionBenefits
OtherPostretirement
Benefits
(Thousands of dollars) 2013 2012 2013 2012
Change in benefit obligationObligation at January 1 $ 721,531 629,568 124,134 114,962Service cost 26,346 23,500 4,566 3,958Interest cost 30,903 29,869 5,189 5,174Plan amendments 1,989 0 0 0Participant contributions 21 30 1,376 1,035Actuarial loss (gain) (9,876) 55,479 (8,324) 4,686Medicare Part D subsidy 0 0 384 432Exchange rate changes 1,852 7,125 (36) 14Benefits paid (38,745) (30,217) (5,211) (6,127)Special termination benefits 849 6,177 0 0Curtailments (26,463) 0 (15,077) 0Obligation assumed by MUSA at separation (1,153) 0 0 0
Obligation at December 31 707,254 721,531 107,001 124,134
Change in plan assetsFair value of plan assets at January 1 463,546 404,350 0 0Actual return on plan assets 61,932 41,674 0 0Employer contributions 46,726 42,207 3,451 4,660Participant contributions 21 30 1,376 1,035Medicare Part D subsidy 0 0 384 432Exchange rate changes 1,594 6,289 0 0Benefits paid (38,745) (30,217) (5,211) (6,127)Other (1,966) (787) 0 0
Fair value of plan assets at December 31 533,108 463,546 0 0
Funded status and amounts recognized in the ConsolidatedBalance Sheets at December 31
Deferred charges and other assets 10,254 9,679 0 0Other accrued liabilities (5,565) (5,556) (5,920) (5,646)Deferred credits and other liabilities (158,589) (262,108) (101,081) (118,488)Liabilities associated with assets held for sale (20,246) 0 0 0
Funded status and net plan liability recognized atDecember 31 $(174,146) (257,985) (107,001) (124,134)
At December 31, 2013, amounts included in accumulated other comprehensive income (AOCI), before reductionfor associated deferred income taxes, which have not been recognized in net periodic benefit expense are shownin the following table.
(Thousands of dollars)PensionBenefits
OtherPostretirement
Benefits
Net actuarial loss $(150,682) (13,815)Prior service (cost) credit (3,559) 372Transitional asset (liability) 517 0
$(153,724) (13,443)
F-31
MURPHY OIL CORPORATION AND CONSOLIDATED SUBSIDIARIESNOTES TO CONSOLIDATED FINANCIAL STATEMENTS – Continued
Amounts included in AOCI at December 31, 2013 that are expected to be amortized into net periodic benefitexpense during 2014 are shown in the following table.
(Thousands of dollars)PensionBenefits
OtherPostretirement
Benefits
Net actuarial loss $(8,190) (242)Prior service (cost) credit (951) 82Transitional asset (liability) 517 0
$(8,624) (160)
The table that follows includes projected benefit obligations, accumulated benefit obligations and fair value ofplan assets for plans where the accumulated benefit obligation exceeded the fair value of plan assets.
ProjectedBenefit Obligations
AccumulatedBenefit Obligations
Fair Valueof Plan Assets
(Thousands of dollars) 2013 2012 2013 2012 2013 2012
Funded qualified plans where accumulatedbenefit obligation exceeds fair value of planassets $571,217 587,318 520,610 523,773 502,308 431,788
Unfunded nonqualified and directors’ planswhere accumulated benefit obligation exceedsfair value of plan assets 115,492 112,135 102,198 98,498 0 0
Unfunded other postretirement plans 107,001 124,134 107,001 124,134 0 0
The table that follows provides the components of net periodic benefit expense for each of the three years endedDecember 31, 2013.
Pension BenefitsOther
Postretirement Benefits
(Thousands of dollars) 2013 2012 2011 2013 2012 2011
Service cost $ 26,346 23,500 22,406 4,566 3,958 4,547Interest cost 30,903 29,869 30,785 5,189 5,174 6,141Expected return on plan assets (28,974) (25,826) (25,919) 0 0 0Amortization of prior service cost (credit) 1,006 1,254 1,314 (143) (173) (240)Amortization of transitional (asset) liability (514) (529) (536) 8 8 8Recognized actuarial loss 17,338 16,389 12,484 1,484 1,317 2,329
46,105 44,657 40,534 11,104 10,284 12,785Termination benefits expense 849 6,177 695 0 0 0Curtailment expense (benefit) 1,365 0 1,036 (442) 0 (605)
Net periodic benefit expense $ 48,319 50,834 42,265 10,662 10,284 12,180
Termination and curtailment expenses in 2013 primarily related to plan amendments made at the time ofseparation of Murphy USA Inc. The increase in net periodic pension benefit expense in 2012 compared to 2011was primarily related to expense recognized in 2012 for enhanced retirement benefits provided to a formerexecutive officer. Termination and curtailment expenses in 2011 related to sale of two U.S. petroleum refineriesduring that year. The reduction in the net periodic benefit expense for other postretirement plans in 2012 was dueto no further service costs and lower other costs associated with postretirement benefits for the Meraux andSuperior refineries sold in 2011.
F-32
MURPHY OIL CORPORATION AND CONSOLIDATED SUBSIDIARIESNOTES TO CONSOLIDATED FINANCIAL STATEMENTS – Continued
The preceding tables in this note include the following amounts related to foreign benefit plans.
PensionBenefits
OtherPostretirement
Benefits
(Thousands of dollars) 2013 2012 2013 2012
Benefit obligation at December 31 $211,799 184,550 541 525Fair value of plan assets at December 31 188,575 164,111 0 0Net plan liabilities recognized 23,224 20,439 541 525Net periodic benefit expense 12,622 11,022 92 88
The following table provides the weighted-average assumptions used in the measurement of the Company’sbenefit obligations at December 31, 2013 and 2012 and net periodic benefit expense for 2013 and 2012.
Benefit Obligations Net Periodic Benefit Expense
PensionBenefits
OtherPostretirement
BenefitsPensionBenefits
OtherPostretirement
Benefits
December 31 December 31 Year Year
2013 2012 2013 2012 2013 2012 2013 2012
Discount rate 4.78% 4.24% 4.91% 4.18% 4.23% 4.80% 4.18% 4.87%Expected return on plan assets 6.24% 6.20% 0% 0% 6.24% 6.20% 0% 0%Rate of compensation increase 4.14% 4.13% 0% 0% 4.12% 4.10% 0% 0%
The discount rates used for determining the plan obligations and expense are based on the universe of high-quality corporate bonds that are available within each country. Cash flow analyses are performed in which a spotyield curve is used to discount projected benefit payment streams for the most significant plans. The discountedcash flows are used to determine an equivalent single rate which is the basis for selecting the discount rate withineach country. Expected plan asset returns are based on long-term expectations for asset portfolios with similarinvestment mix characteristics. Expected compensation increases are based on anticipated future averages for theCompany.
Benefit payments, reflecting expected future service as appropriate, which are expected to be paid in future yearsfrom the assets of the plans or by the Company are shown in the following table.
(Thousands of dollars)PensionBenefits
OtherPostretirement
Benefits
2014 $ 32,822 6,7462015 33,459 6,9712016 33,723 7,1482017 34,455 7,3032018 35,383 7,5002019-2023 194,717 41,148
For purposes of measuring postretirement benefit obligations at December 31, 2013, the future annual rates ofincrease in the cost of health care were assumed to be 7.4% for 2014 decreasing each year to an ultimate rate of5.0% in 2020 and thereafter.
F-33
MURPHY OIL CORPORATION AND CONSOLIDATED SUBSIDIARIESNOTES TO CONSOLIDATED FINANCIAL STATEMENTS – Continued
Assumed health care cost trend rates have a significant effect on the expense and obligation reported for thepostretirement benefit plan. A 1% change in assumed health care cost trend rates would have the followingeffects.
(Thousands of dollars) 1% Increase 1% Decrease
Effect on total service and interest cost components of net periodic postretirementbenefit expense for the year ended December 31, 2013 $ 2,011 (1,551)
Effect on the health care component of the accumulated postretirement benefitobligation at December 31, 2013 14,331 (11,812)
During 2013, the Company made contributions of $30,570,000 to its domestic defined benefit pension plans,$16,156,000 to its foreign defined benefit pension plans, $3,412,000 to its domestic postretirement benefits plan and$39,000 to its foreign postretirement benefits plan. The Company currently expects during 2014 to make contributionsof $27,133,000 to its domestic defined benefit pension plans, $21,977,000 to its foreign defined benefit pension plans,$5,883,000 to its domestic postretirement benefits plan and $36,000 to its foreign postretirement benefits plan.
U.S. Health Care Reform – In March 2010, the United States Congress enacted a health care reform law. Alongwith other provisions, the law (a) eliminated the tax free status of federal subsidies to companies with qualifiedretiree prescription drug plans that are actuarially equivalent to Medicare Part D plans beginning in 2013;(b) imposes a 40% excise tax on high-cost health plans as defined in the law beginning in 2018; (c) eliminatedlifetime or annual coverage limits and required coverage for preventative health services beginning in September2010; and (d) imposed a fee of $2 (subsequently adjusted for inflation) for each person covered by a healthinsurance policy beginning in September 2010. The Company provides a health care benefit plan to eligible U.S.employees and most U.S. retired employees. The law did not significantly affect the Company’s consolidatedfinancial statements as of December 31, 2013, 2012 and 2011 and for the years then ended. The Companycontinues to evaluate the various components of the law as guidance is issued and cannot predict with certaintyall the ways it may impact the Company. However, based on information available to date, the Companycurrently believes that the health care reform law will not have a material effect on its financial condition, netincome or cash flow in future periods.
Plan Investments – Murphy Oil Corporation maintains an Investment Policy Statement (Statement) thatestablishes investment standards related to its two funded domestic qualified retirement plans. The Statementspecifies that all assets will be held in a Master Trust sponsored by the Company, which is administrated by atrustee appointed by the Investment Committee (Committee). Members of the Committee are appointed by theBoard of Directors. The Committee hires Investment Managers to invest trust assets within the guidelinesestablished by the Committee as allowed by the Statement. The investment goals call for a portfolio of assetsconsisting of equity, fixed income and cash equivalent securities. The primary consideration for investments isthe preservation of capital, and investment growth should exceed the rate of inflation. The Committee hasdirected the asset investment advisors of its benefit plans to maintain a portfolio consisting of both equity andfixed income securities. The Company believes that over time a balanced to slightly heavier weighting of theportfolio in equity securities compared to fixed income securities represents the most appropriate long-term mixfor future investment return on assets held by domestic plans. The parameters for asset allocation call for thefollowing minimum and maximum percentages: equity securities of between 40% and 70%; fixed incomesecurities of between 30% and 60%; long/short equity of between 0% and 15%; and cash and equivalents ofbetween 0% and 15%. The Committee is authorized to direct investments within these parameters. Equityinvestments may include common, preferred and convertible preferred stocks, emerging markets stocks andsimilar funds, and long/short equity funds. Long/short equity is a strategy invested in a portfolio of long stockshedged with short sales of stocks and/or stock index options, with the combination of investment intended toproduce equity-like returns with lower volatility over the long term. Generally no more than 10% of an
F-34
MURPHY OIL CORPORATION AND CONSOLIDATED SUBSIDIARIESNOTES TO CONSOLIDATED FINANCIAL STATEMENTS – Continued
Investment Manager’s portfolio is to be held in equity securities of any one issuer, and equity securities shouldhave a minimum market capitalization of $100 million. Equities held in the trust should be listed on theNew York or American Stock Exchanges, principal U.S. regional exchanges, major foreign exchanges or quotedin significant over-the-counter markets. Equity or fixed income securities issued by the Company may not beheld in the trust. Fixed income securities include maturities greater than one year to maturity. The fixed incomeportfolio should not exceed an average maturity of 11 years. The portfolio may include investment gradecorporate bonds, issues of the U.S. government, its agencies and government sponsored entities, governmentagency issued collateralized mortgage backed securities, agency issued mortgage backed securities, municipalbonds, asset backed securities, commercial mortgage backed securities and international and emerging marketsbond funds. The Committee routinely reviews the investment performance of Investment Managers.
For the U.K. retirement plan, trustees have been appointed by the wholly-owned subsidiary that sponsors the planfor U.K. employees. The trustees have hired an investment consultant to manage the assets of the plan within theparameters of the Investment Policy Implementation Document (Document). The objective of investments is toearn a reasonable return within the allocation strategy permitted in the Document while limiting the risk for thefunded position of the plan. The Document specifies a strategy with an allocation goal of 60% equities and 40%bonds. The Document allows for ranges of equity investments from 27% to 98%, fixed income securities mayrange from 25% to 60%, and cash can be held for up to 5% of investments. Approximately one-half of the equityallocation is to be invested in U.K. securities and the remainder split between North American, European,Japanese and other Pacific Basin securities. A minimum of 95% of the fixed income allocation is to be investedin U.K. securities with up to 5% in international or high yield bonds. Tolerance ranges are specified in theDocument within the general equity/bond allocation guidelines. Asset performance is compared to a benchmarkreturn based on the allocation guidelines and is targeted to outperform the benchmark by 0.75% per annum over arolling three-year period. Small working cash balances are permitted to facilitate daily management of paymentsand receipts within the plan. The trustees routinely review the investment performance of the plan.
For the Canadian retirement plan, the wholly-owned subsidiary that sponsors the plan has a Statement ofInvestment Policies and Procedures (Policy) applicable to the plan assets. A pension committee appointed by theboard of directors of the subsidiary oversees the plan, selects the investment advisors and routinely reviewsperformance of the asset portfolio. The Policy permits assets to be invested in various Canadian and foreignequity securities, various fixed income securities, real estate, natural resource properties or participation rightsand cash. The objective for plan investments is to achieve a total rate of return equal to the long-term interest rateassumption used for the going-concern actuarial funding valuation. The normal allocation includes total equitysecurities of 60% with a range of 40% to 75% of total assets. Fixed income securities have a normal allocation of35% with a range of 25% to 45%. Cash will normally have an allocation of 5% with a range of 0% to 15%. ThePolicy calls for diversification norms within the investment portfolios of both equity securities and fixed incomesecurities.
The weighted average asset allocation for the Company’s funded pension benefit plans at December 31, 2013 and2012 are presented in the following table.
December 31,
2013 2012
Equity securities 68.4% 62.9%Fixed income securities 30.7 36.1Cash equivalents 0.9 1.0
100.0% 100.0%
F-35
MURPHY OIL CORPORATION AND CONSOLIDATED SUBSIDIARIESNOTES TO CONSOLIDATED FINANCIAL STATEMENTS – Continued
The Company’s weighted average expected return on plan assets was 6.24% in 2013 and the return wasdetermined based on an assessment of actual long-term historical returns and expected future returns for aportfolio with investment characteristics similar to that maintained by the plans. The 6.24% expected return wasbased on an expected average future equity securities return of 8.40% and a fixed income securities return of3.90% and is net of average expected investment expenses of 0.45%. Over the last 10 years, the return on fundedretirement plan assets has averaged 6.93%.
At December 31, 2013, the fair value measurements of retirement plan assets within the fair value hierarchy areincluded in the table that follows.
Fair Value Measurements Using
(Thousands of dollars)Fair Value at
December 31, 2013
Quoted Pricesin Active Marketsfor Identical Assets
(Level 1)
SignificantOther Observable
Inputs(Level 2)
SignificantUnobservable
Inputs(Level 3)
Domestic PlansEquity securities:
U.S. core equity $ 89,255 89,255 0 0U.S. small/midcap 37,149 37,149 0 0Hedged funds and otheralternative strategies 32,788 0 0 32,788
International commingled trustfund 77,041 0 77,041 0
Emerging market commingledequity fund 9,654 0 9,654 0
Fixed income securities:U.S. fixed income 72,240 0 72,240 0International commingled trustfund 14,865 0 14,865 0
Emerging market mutual fund 8,549 0 8,549 0Cash and equivalents 2,992 2,992 0 0
Total Domestic Plans 344,533 129,396 182,349 32,788
Foreign PlansEquity securities funds 99,085 0 99,085 0Fixed income securities funds 57,030 0 57,030 0Diversified pooled fund 30,800 0 30,800 0Cash and equivalents 1,660 1,660 0 0
Total Foreign Plans 188,575 1,660 186,915 0
Total $533,108 131,056 369,264 32,788
F-36
MURPHY OIL CORPORATION AND CONSOLIDATED SUBSIDIARIESNOTES TO CONSOLIDATED FINANCIAL STATEMENTS – Continued
At December 31, 2012, the fair value measurements of retirement plan assets within the fair value hierarchy areincluded in the table that follows.
Fair Value Measurements Using
(Thousands of dollars)Fair Value at
December 31, 2012
Quoted Pricesin Active Marketsfor Identical Assets
(Level 1)
SignificantOther Observable
Inputs(Level 2)
SignificantUnobservable
Inputs(Level 3)
Domestic PlansEquity securities:
U.S. core equity $ 83,392 83,392 0 0U.S. small/midcap 20,894 20,894 0 0Hedged funds and other alternativestrategies 14,654 0 0 14,654*
International commingled trust fund 62,111 0 62,111 0Emerging market commingled equityfund 9,535 0 9,535 0
Fixed income securities:U.S. fixed income 80,203 0 80,203 0International commingled trust fund 15,179 0 15,179 0Emerging market mutual fund 10,060 0 10,060 0
Cash and equivalents 3,407 3,407 0 0
Total Domestic Plans 299,435 107,693 177,088 14,654
Foreign PlansEquity securities funds 79,233 0 79,233 0Fixed income securities funds 51,777 0 51,777 0Diversified pooled fund 31,758 0 31,758 0Cash and equivalents 1,343 1,343 0 0
Total Foreign Plans 164,111 1,343 162,768 0
Total $463,546 109,036 339,856 14,654
* Reclassified to Level 3 to conform to current presentation.
The definition of levels within the fair value hierarchy in the tables above is included in Note P.
For domestic plans, U.S. core and small/midcap equity securities are valued based on daily market prices asquoted on national stock exchanges or in the over-the-counter market. U.S. long/short equity securities are valuedmonthly based on a pro-rata share of value. International equities held in a commingled trust are valued monthlybased on prices as quoted on various international stock exchanges. The emerging market commingled equityfund is valued monthly based on net asset value. U.S. fixed income securities are valued daily based on bids forthe same or similar securities or using net asset values. International fixed income securities held in acommingled trust are valued on a monthly basis using net asset values. The fixed income emerging marketmutual fund is valued daily based on net asset value. The domestic plan commingled trusts have waiting periodsfor withdrawals ranging from 6 to 30 days. Hedged funds and other alternative strategies funds consist of oneinvestment which permits withdrawals semi-annually and another investment which has a three year lock-upperiod and a 95 day notice following the lock-up period. For foreign plans, the equity securities funds arecomprised of U.K. and foreign equity funds valued daily based on fund net asset values. Fixed income securitiesfunds are U.K. securities valued daily at net asset values. The diversified pooled fund is valued daily at net assetvalue and contains a combination of Canadian and foreign equity securities, Canadian fixed income securitiesand cash.
F-37
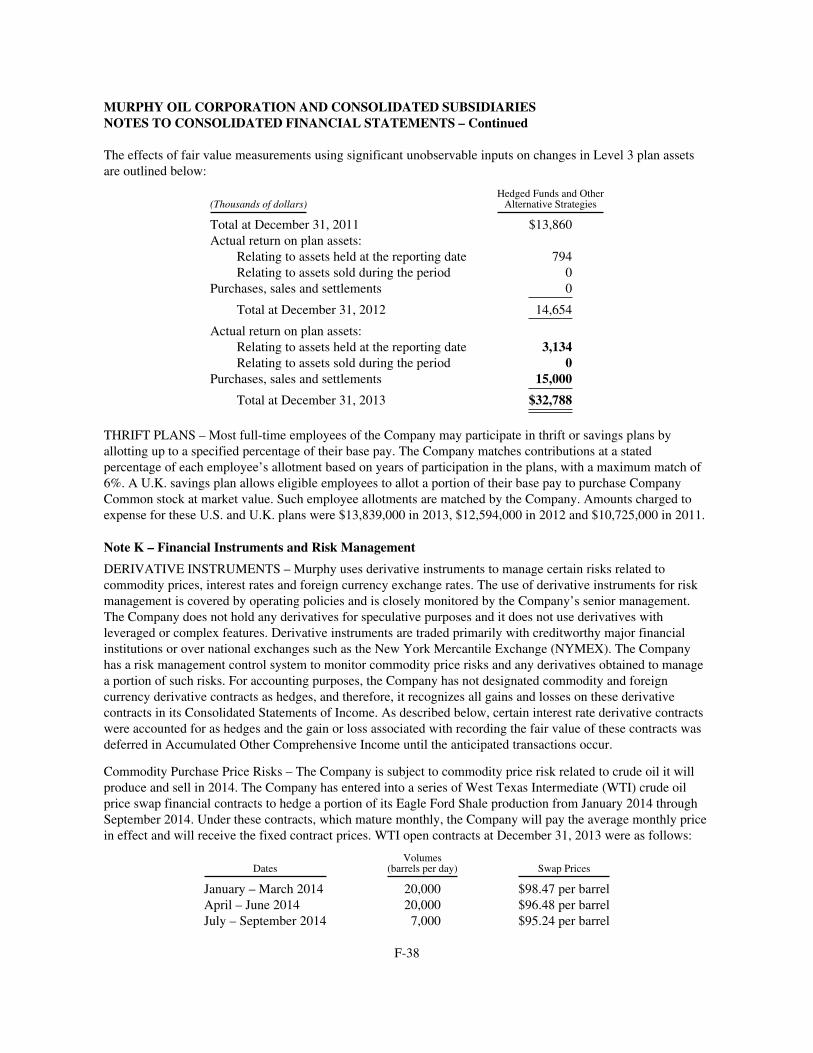
MURPHY OIL CORPORATION AND CONSOLIDATED SUBSIDIARIESNOTES TO CONSOLIDATED FINANCIAL STATEMENTS – Continued
The effects of fair value measurements using significant unobservable inputs on changes in Level 3 plan assetsare outlined below:
(Thousands of dollars)Hedged Funds and OtherAlternative Strategies
Total at December 31, 2011 $13,860Actual return on plan assets:
Relating to assets held at the reporting date 794Relating to assets sold during the period 0
Purchases, sales and settlements 0
Total at December 31, 2012 14,654
Actual return on plan assets:Relating to assets held at the reporting date 3,134Relating to assets sold during the period 0
Purchases, sales and settlements 15,000
Total at December 31, 2013 $32,788
THRIFT PLANS – Most full-time employees of the Company may participate in thrift or savings plans byallotting up to a specified percentage of their base pay. The Company matches contributions at a statedpercentage of each employee’s allotment based on years of participation in the plans, with a maximum match of6%. A U.K. savings plan allows eligible employees to allot a portion of their base pay to purchase CompanyCommon stock at market value. Such employee allotments are matched by the Company. Amounts charged toexpense for these U.S. and U.K. plans were $13,839,000 in 2013, $12,594,000 in 2012 and $10,725,000 in 2011.
Note K – Financial Instruments and Risk Management
DERIVATIVE INSTRUMENTS – Murphy uses derivative instruments to manage certain risks related tocommodity prices, interest rates and foreign currency exchange rates. The use of derivative instruments for riskmanagement is covered by operating policies and is closely monitored by the Company’s senior management.The Company does not hold any derivatives for speculative purposes and it does not use derivatives withleveraged or complex features. Derivative instruments are traded primarily with creditworthy major financialinstitutions or over national exchanges such as the New York Mercantile Exchange (NYMEX). The Companyhas a risk management control system to monitor commodity price risks and any derivatives obtained to managea portion of such risks. For accounting purposes, the Company has not designated commodity and foreigncurrency derivative contracts as hedges, and therefore, it recognizes all gains and losses on these derivativecontracts in its Consolidated Statements of Income. As described below, certain interest rate derivative contractswere accounted for as hedges and the gain or loss associated with recording the fair value of these contracts wasdeferred in Accumulated Other Comprehensive Income until the anticipated transactions occur.
Commodity Purchase Price Risks – The Company is subject to commodity price risk related to crude oil it willproduce and sell in 2014. The Company has entered into a series of West Texas Intermediate (WTI) crude oilprice swap financial contracts to hedge a portion of its Eagle Ford Shale production from January 2014 throughSeptember 2014. Under these contracts, which mature monthly, the Company will pay the average monthly pricein effect and will receive the fixed contract prices. WTI open contracts at December 31, 2013 were as follows:
VolumesDates (barrels per day) Swap Prices
January – March 2014 20,000 $98.47 per barrelApril – June 2014 20,000 $96.48 per barrelJuly – September 2014 7,000 $95.24 per barrel
F-38
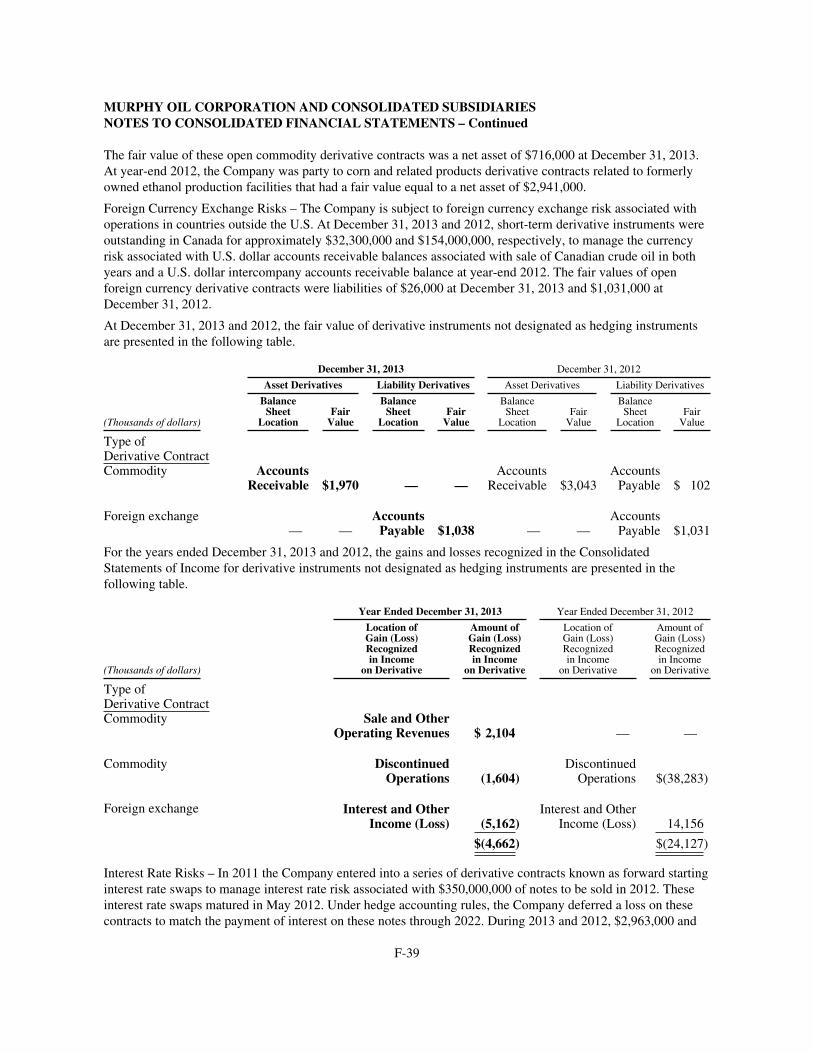
MURPHY OIL CORPORATION AND CONSOLIDATED SUBSIDIARIESNOTES TO CONSOLIDATED FINANCIAL STATEMENTS – Continued
The fair value of these open commodity derivative contracts was a net asset of $716,000 at December 31, 2013.At year-end 2012, the Company was party to corn and related products derivative contracts related to formerlyowned ethanol production facilities that had a fair value equal to a net asset of $2,941,000.
Foreign Currency Exchange Risks – The Company is subject to foreign currency exchange risk associated withoperations in countries outside the U.S. At December 31, 2013 and 2012, short-term derivative instruments wereoutstanding in Canada for approximately $32,300,000 and $154,000,000, respectively, to manage the currencyrisk associated with U.S. dollar accounts receivable balances associated with sale of Canadian crude oil in bothyears and a U.S. dollar intercompany accounts receivable balance at year-end 2012. The fair values of openforeign currency derivative contracts were liabilities of $26,000 at December 31, 2013 and $1,031,000 atDecember 31, 2012.
At December 31, 2013 and 2012, the fair value of derivative instruments not designated as hedging instrumentsare presented in the following table.
December 31, 2013 December 31, 2012
Asset Derivatives Liability Derivatives Asset Derivatives Liability Derivatives
(Thousands of dollars)
BalanceSheet
LocationFairValue
BalanceSheet
LocationFairValue
BalanceSheet
LocationFairValue
BalanceSheet
LocationFairValue
Type ofDerivative ContractCommodity Accounts
Receivable $1,970 — —Accounts
Receivable $3,043AccountsPayable $ 102
Foreign exchange— —
AccountsPayable $1,038 — —
AccountsPayable $1,031
For the years ended December 31, 2013 and 2012, the gains and losses recognized in the ConsolidatedStatements of Income for derivative instruments not designated as hedging instruments are presented in thefollowing table.
Year Ended December 31, 2013 Year Ended December 31, 2012
(Thousands of dollars)
Location ofGain (Loss)Recognizedin Income
on Derivative
Amount ofGain (Loss)Recognizedin Income
on Derivative
Location ofGain (Loss)Recognizedin Income
on Derivative
Amount ofGain (Loss)Recognizedin Income
on Derivative
Type ofDerivative ContractCommodity Sale and Other
Operating Revenues $ 2,104 — —
Commodity DiscontinuedOperations (1,604)
DiscontinuedOperations $(38,283)
Foreign exchange Interest and OtherIncome (Loss) (5,162)
Interest and OtherIncome (Loss) 14,156
$(4,662) $(24,127)
Interest Rate Risks – In 2011 the Company entered into a series of derivative contracts known as forward startinginterest rate swaps to manage interest rate risk associated with $350,000,000 of notes to be sold in 2012. Theseinterest rate swaps matured in May 2012. Under hedge accounting rules, the Company deferred a loss on thesecontracts to match the payment of interest on these notes through 2022. During 2013 and 2012, $2,963,000 and
F-39
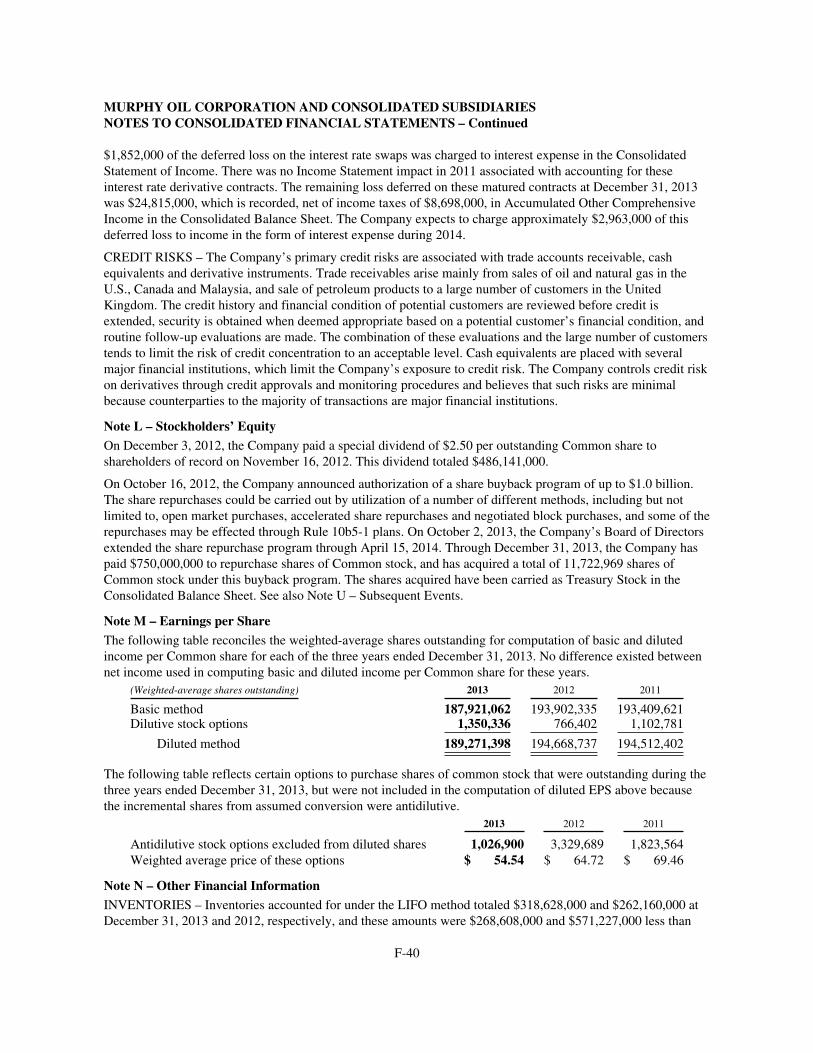
MURPHY OIL CORPORATION AND CONSOLIDATED SUBSIDIARIESNOTES TO CONSOLIDATED FINANCIAL STATEMENTS – Continued
$1,852,000 of the deferred loss on the interest rate swaps was charged to interest expense in the ConsolidatedStatement of Income. There was no Income Statement impact in 2011 associated with accounting for theseinterest rate derivative contracts. The remaining loss deferred on these matured contracts at December 31, 2013was $24,815,000, which is recorded, net of income taxes of $8,698,000, in Accumulated Other ComprehensiveIncome in the Consolidated Balance Sheet. The Company expects to charge approximately $2,963,000 of thisdeferred loss to income in the form of interest expense during 2014.
CREDIT RISKS – The Company’s primary credit risks are associated with trade accounts receivable, cashequivalents and derivative instruments. Trade receivables arise mainly from sales of oil and natural gas in theU.S., Canada and Malaysia, and sale of petroleum products to a large number of customers in the UnitedKingdom. The credit history and financial condition of potential customers are reviewed before credit isextended, security is obtained when deemed appropriate based on a potential customer’s financial condition, androutine follow-up evaluations are made. The combination of these evaluations and the large number of customerstends to limit the risk of credit concentration to an acceptable level. Cash equivalents are placed with severalmajor financial institutions, which limit the Company’s exposure to credit risk. The Company controls credit riskon derivatives through credit approvals and monitoring procedures and believes that such risks are minimalbecause counterparties to the majority of transactions are major financial institutions.
Note L – Stockholders’ EquityOn December 3, 2012, the Company paid a special dividend of $2.50 per outstanding Common share toshareholders of record on November 16, 2012. This dividend totaled $486,141,000.
On October 16, 2012, the Company announced authorization of a share buyback program of up to $1.0 billion.The share repurchases could be carried out by utilization of a number of different methods, including but notlimited to, open market purchases, accelerated share repurchases and negotiated block purchases, and some of therepurchases may be effected through Rule 10b5-1 plans. On October 2, 2013, the Company’s Board of Directorsextended the share repurchase program through April 15, 2014. Through December 31, 2013, the Company haspaid $750,000,000 to repurchase shares of Common stock, and has acquired a total of 11,722,969 shares ofCommon stock under this buyback program. The shares acquired have been carried as Treasury Stock in theConsolidated Balance Sheet. See also Note U – Subsequent Events.
Note M – Earnings per ShareThe following table reconciles the weighted-average shares outstanding for computation of basic and dilutedincome per Common share for each of the three years ended December 31, 2013. No difference existed betweennet income used in computing basic and diluted income per Common share for these years.
(Weighted-average shares outstanding) 2013 2012 2011
Basic method 187,921,062 193,902,335 193,409,621Dilutive stock options 1,350,336 766,402 1,102,781
Diluted method 189,271,398 194,668,737 194,512,402
The following table reflects certain options to purchase shares of common stock that were outstanding during thethree years ended December 31, 2013, but were not included in the computation of diluted EPS above becausethe incremental shares from assumed conversion were antidilutive.
2013 2012 2011
Antidilutive stock options excluded from diluted shares 1,026,900 3,329,689 1,823,564Weighted average price of these options $ 54.54 $ 64.72 $ 69.46
Note N – Other Financial InformationINVENTORIES – Inventories accounted for under the LIFO method totaled $318,628,000 and $262,160,000 atDecember 31, 2013 and 2012, respectively, and these amounts were $268,608,000 and $571,227,000 less than
F-40
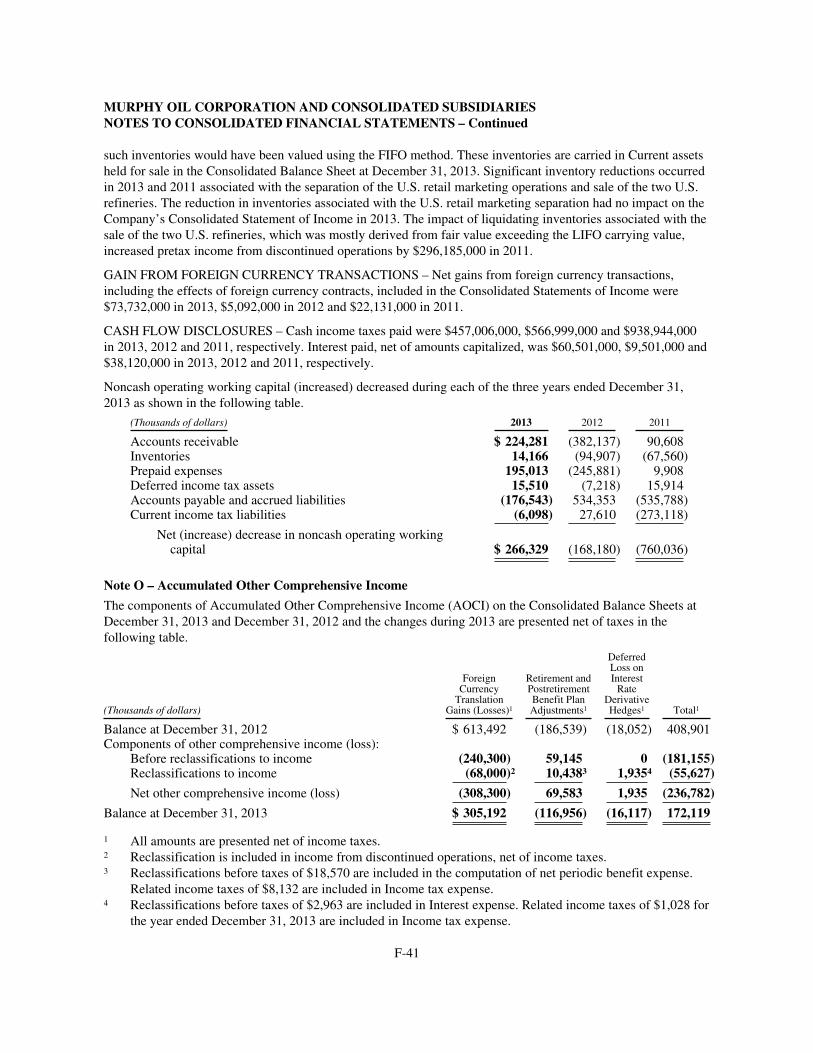
MURPHY OIL CORPORATION AND CONSOLIDATED SUBSIDIARIESNOTES TO CONSOLIDATED FINANCIAL STATEMENTS – Continued
such inventories would have been valued using the FIFO method. These inventories are carried in Current assetsheld for sale in the Consolidated Balance Sheet at December 31, 2013. Significant inventory reductions occurredin 2013 and 2011 associated with the separation of the U.S. retail marketing operations and sale of the two U.S.refineries. The reduction in inventories associated with the U.S. retail marketing separation had no impact on theCompany’s Consolidated Statement of Income in 2013. The impact of liquidating inventories associated with thesale of the two U.S. refineries, which was mostly derived from fair value exceeding the LIFO carrying value,increased pretax income from discontinued operations by $296,185,000 in 2011.
GAIN FROM FOREIGN CURRENCY TRANSACTIONS – Net gains from foreign currency transactions,including the effects of foreign currency contracts, included in the Consolidated Statements of Income were$73,732,000 in 2013, $5,092,000 in 2012 and $22,131,000 in 2011.
CASH FLOW DISCLOSURES – Cash income taxes paid were $457,006,000, $566,999,000 and $938,944,000in 2013, 2012 and 2011, respectively. Interest paid, net of amounts capitalized, was $60,501,000, $9,501,000 and$38,120,000 in 2013, 2012 and 2011, respectively.
Noncash operating working capital (increased) decreased during each of the three years ended December 31,2013 as shown in the following table.
(Thousands of dollars) 2013 2012 2011
Accounts receivable $ 224,281 (382,137) 90,608Inventories 14,166 (94,907) (67,560)Prepaid expenses 195,013 (245,881) 9,908Deferred income tax assets 15,510 (7,218) 15,914Accounts payable and accrued liabilities (176,543) 534,353 (535,788)Current income tax liabilities (6,098) 27,610 (273,118)
Net (increase) decrease in noncash operating workingcapital $ 266,329 (168,180) (760,036)
Note O – Accumulated Other Comprehensive Income
The components of Accumulated Other Comprehensive Income (AOCI) on the Consolidated Balance Sheets atDecember 31, 2013 and December 31, 2012 and the changes during 2013 are presented net of taxes in thefollowing table.
(Thousands of dollars)
ForeignCurrencyTranslation
Gains (Losses)1
Retirement andPostretirementBenefit PlanAdjustments1
DeferredLoss onInterestRate
DerivativeHedges1 Total1
Balance at December 31, 2012 $ 613,492 (186,539) (18,052) 408,901Components of other comprehensive income (loss):
Before reclassifications to income (240,300) 59,145 0 (181,155)Reclassifications to income (68,000)2 10,4383 1,9354 (55,627)
Net other comprehensive income (loss) (308,300) 69,583 1,935 (236,782)
Balance at December 31, 2013 $ 305,192 (116,956) (16,117) 172,119
1 All amounts are presented net of income taxes.2 Reclassification is included in income from discontinued operations, net of income taxes.3 Reclassifications before taxes of $18,570 are included in the computation of net periodic benefit expense.
Related income taxes of $8,132 are included in Income tax expense.4 Reclassifications before taxes of $2,963 are included in Interest expense. Related income taxes of $1,028 for
the year ended December 31, 2013 are included in Income tax expense.
F-41
MURPHY OIL CORPORATION AND CONSOLIDATED SUBSIDIARIESNOTES TO CONSOLIDATED FINANCIAL STATEMENTS – Continued
At December 31, 2013, the net foreign currency translation gain of $305,192,000 was primarily related toexploration and production operations in Canada.
Note P – Assets and Liabilities Measured at Fair Value
The Company carries certain assets and liabilities at fair value in its Consolidated Balance Sheet. The fair valuehierarchy is based on the quality of inputs used to measure fair value, with Level 1 being the highest quality andLevel 3 being the lowest quality. Level 1 inputs are quoted prices in active markets for identical assets orliabilities. Level 2 inputs are observable inputs other than quoted prices included within Level 1. Level 3 inputsare unobservable inputs which reflect assumptions about pricing by market participants.
The fair value measurements for these assets and liabilities at December 31, 2013 and 2012 are presented in thefollowing table.
Fair Value Measurements at Reporting Date Using
(Thousands of dollars)Fair Value at
December 31, 2013
Quoted Pricesin Active Markets
for IdenticalAssets (Liabilities)
(Level 1)
SignificantOther Observable
Inputs(Level 2)
SignificantUnobservable
Inputs(Level 3)
AssetsCommodity derivative contracts $ 1,970 0 1,970 0
LiabilitiesNonqualified employee savings plan $(13,267) (13,267) 0 0Foreign currency exchange derivativecontracts (1,038) 0 (1,038) 0
Total $(14,305) (13,267) (1,038) 0
Fair Value Measurements at Reporting Date Using
(Thousands of dollars)Fair Value at
December 31, 2012
Quoted Pricesin Active Markets
for IdenticalAssets (Liabilities)
(Level 1)
SignificantOther Observable
Input(Level 2)
SignificantUnobservable
Inputs(Level 3)
AssetsCommodity derivative contracts $ 3,043 0 3,043 0
LiabilitiesNonqualified employee savings plan $(10,293) (10,293) 0 0Foreign currency exchange derivativecontracts (1,031) 0 (1,031) 0
Commodity derivative contracts (102) 0 (102) 0
Total $(11,426) (10,293) (1,133) 0
The fair value of West Texas Intermediate (WTI) crude oil contracts was based on active market quotes for WTIcrude oil. The fair value of foreign exchange derivative contracts was based on market quotes for similarcontracts at the balance sheet date. The fair value of commodity derivative contracts for corn and wet and drieddistillers grain in 2012 was determined based on market quotes for No. 2 yellow corn. The income effect ofchanges in fair value of crude oil derivative contracts is recorded in Sales and Other Operating Revenues in the
F-42
MURPHY OIL CORPORATION AND CONSOLIDATED SUBSIDIARIESNOTES TO CONSOLIDATED FINANCIAL STATEMENTS – Continued
Consolidated Statements of Income, while the effects of changes in fair value of foreign exchange derivativecontracts is recorded in Interest and Other Income and changes in fair value of corn and distillers grain isrecorded in Income from Discontinued Operations. The nonqualified employee savings plan is an unfundedsavings plan through which participants seek a return via phantom investments in equity securities and/or mutualfunds. The fair value of this liability was based on quoted prices for these equity securities and mutual funds. Theincome effect of changes in the fair value of the nonqualified employee savings plan is recorded in Selling andGeneral Expenses.
The Company offsets certain assets and liabilities related to derivative contracts when the legal right of offsetexists. There were no offsetting positions recorded at December 31, 2013. At December 31, 2012 derivativeassets and liabilities which had offsetting positions are presented in the following tables.
(Thousands of dollars)
Gross Amountsof Recognized
Assets
Gross AmountsOffset in theConsolidatedBalance Sheet
Net Amounts ofAssets Presented
in the ConsolidatedBalance Sheet
At December 31, 2012Commodity derivatives $3,111 (2,169) 942
(Thousands of dollars)
Gross Amountsof RecognizedLiabilities
Gross AmountsOffset in theConsolidatedBalance Sheet
Net Amounts ofLiabilities Presentedin the Consolidated
Balance Sheet
At December 31, 2012Commodity derivatives $2,271 (2,169) 102
All commodity derivatives noted in the above table at December 31, 2012 were corn-based contracts associatedwith the Company’s two former U.S. ethanol plants. Net derivative assets in the table above are included inAccounts Receivable on the Consolidated Balance Sheet at December 31, 2012; likewise, net derivativeliabilities in the above table are included in Accounts Payable and Accrued Liabilities on the 2012 ConsolidatedBalance Sheet. Separate derivative agreements existed for each of the ethanol plants. These contracts permittednet settlement and the Company generally availed itself of this right to settle net.
The following table presents the carrying amounts and estimated fair values of financial instruments held by theCompany at December 31, 2013 and 2012. The fair value of a financial instrument is the amount at which theinstrument could be exchanged in a current transaction between willing parties. The table excludes cash and cashequivalents, trade accounts receivable, trade accounts payable and accrued expenses, all of which had fair valuesapproximating carrying amounts. The carrying value of Canadian government securities is determined based oncost plus earned interest. The fair value of current and long-term debt was estimated based on rates offered to theCompany at that time for debt of the same maturities. The Company has off-balance sheet exposures relating tocertain letters of credit. The fair value of these, which represents fees associated with obtaining the instruments,was nominal.
At December 31,
2013 2012
(Thousands of dollars)CarryingAmount
FairValue
CarryingAmount
FairValue
Financial assets (liabilities):Canadian government securities with maturitiesgreater than 90 days at the date of acquisition $ 374,842 375,623 115,603 115,802
Current and long-term debt (2,962,812) (2,822,827) (2,245,247) (2,357,972)
F-43
MURPHY OIL CORPORATION AND CONSOLIDATED SUBSIDIARIESNOTES TO CONSOLIDATED FINANCIAL STATEMENTS – Continued
Note Q – Commitments
The Company leases production and other facilities under operating leases. The most significant operating leases areassociated with floating, production, storage and offloading facilities at the Kikeh and Azurite oil fields, productionfacilities at the Thunder Hawk and West Patricia fields, and certain motor fuel stations in the U.K. During each ofthe next five years, expected future rental payments under all operating leases are approximately $259,365,000 in2014, $185,957,000 in 2015, $134,754,000 in 2016, $117,555,000 in 2017 and $113,585,000 in 2018. Rentalexpense for noncancellable operating leases, including contingent payments when applicable, was $192,482,000 in2013, $178,292,000 in 2012 and $185,016,000 in 2011. A lease of production equipment at the Kakap field offshoreSabah, Malaysia has been accounted for as a capital lease and is included in long-term debt discussed in Note F.
The Company has entered into contracts to hire various drilling rigs and associated equipment for periods beyondDecember 31, 2013. These rigs will primarily be utilized for drilling operations in the Gulf of Mexico, onshoreU.S. and Canada, and offshore Malaysia, Cameroon and Australia. Future commitments under these contracts, allof which expire by 2016, total $1,302,284,000. A significant portion of these costs are expected to be borne byother working interest owners as partners of the Company when the wells are drilled. These drilling costs aregenerally expected to be accounted for as capital expenditures as incurred during the contract periods.
The Company has operating, production handling and transportation service agreements for oil and/or natural gasoperations in the U.S. and Western Canada. These agreements require minimum monthly or annual payments forprocessing and/or transportation charges through 2023. Future required minimum monthly payments for the nextfive years are $57,787,000 in 2014, $35,157,000 in 2015, $23,439,000 in 2016, $17,961,000 in 2017 and$12,792,000 in 2018. Under certain circumstances, the Company is required to pay additional amountsdepending on the actual hydrocarbon quantities processed under the agreement. Costs incurred under thesearrangements were $40,254,000 in 2013, $19,733,000 in 2012 and $24,791,000 in 2011.
In 2006, the Company committed to fund an educational assistance program known as the “El Dorado Promise.”Under this commitment, the Company will pay $5,000,000 per year for ten years through 2016 to providescholarships for a specified amount of college expenses for eligible graduates of El Dorado High School inArkansas. The first eight payments have been made through January 2014. The Company recorded a discountedliability of $38,700,000 in 2006 for this unconditional commitment. The liability was discounted at theCompany’s 10-year borrowing rate and the discounted liability increases for accretion monthly with acorresponding charge to Selling and General Expenses in the Consolidated Statement of Income. Total accretioncost was $805,000 in 2013, $1,063,000 in 2012 and $1,317,000 in 2011.
Commitments for capital expenditures were approximately $1,837,394,000 at December 31, 2013, including$706,889,000 for field development and future work commitments in Malaysia, $561,410,000 for work in the EagleFord Shale, $184,840,000 for costs to develop deepwater Gulf of Mexico fields, and $78,851,000, $78,000,000 and$76,150,000 for future work commitments offshore Cameroon, Equatorial Guinea and Vietnam, respectively.
Note R – Contingencies
The Company’s operations and earnings have been and may be affected by various forms of governmental actionboth in the United States and throughout the world. Examples of such governmental action include, but are by nomeans limited to: tax increases and retroactive tax claims; royalty and revenue sharing increases; import andexport controls; price controls; currency controls; allocation of supplies of crude oil and petroleum products andother goods; expropriation of property; restrictions and preferences affecting the issuance of oil and gas ormineral leases; restrictions on drilling and/or production; laws and regulations intended for the promotion ofsafety and the protection and/or remediation of the environment; governmental support for other forms of energy;and laws and regulations affecting the Company’s relationships with employees, suppliers, customers,
F-44
MURPHY OIL CORPORATION AND CONSOLIDATED SUBSIDIARIESNOTES TO CONSOLIDATED FINANCIAL STATEMENTS – Continued
stockholders and others. Because governmental actions are often motivated by political considerations, may betaken without full consideration of their consequences, and may be taken in response to actions of othergovernments, it is not practical to attempt to predict the likelihood of such actions, the form the actions may takeor the effect such actions may have on the Company.
ENVIRONMENTAL MATTERS – Murphy and other companies in the oil and gas industry are subject tonumerous federal, state, local and foreign laws and regulations dealing with the environment. Violation of federalor state environmental laws, regulations and permits can result in the imposition of significant civil and criminalpenalties, injunctions and construction bans or delays. A discharge of hazardous substances into the environmentcould, to the extent such event is not insured, subject the Company to substantial expense, including both the costto comply with applicable regulations and claims by neighboring landowners and other third parties for anypersonal injury and property damage that might result.
The Company currently owns or leases, and has in the past owned or leased, properties at which hazardoussubstances have been or are being handled. Although the Company has used operating and disposal practices thatwere standard in the industry at the time, hazardous substances may have been disposed of or released on orunder the properties owned or leased by the Company or on or under other locations where these wastes havebeen taken for disposal. In addition, many of these properties have been operated by third parties whosetreatment and disposal or release of hydrocarbons or other wastes were not under Murphy’s control. Underexisting laws the Company could be required to remove or remediate previously disposed wastes (includingwastes disposed of or released by prior owners or operators), to clean up contaminated property (includingcontaminated groundwater) or to perform remedial plugging operations to prevent future contamination. Certainof these historical properties are in various stages of negotiation, investigation, and/or cleanup, and the Companyis investigating the extent of any such liability and the availability of applicable defenses. The Company hasretained certain liabilities related to environmental matters at formerly owned U.S. refineries that were sold in2011. The Company also obtained insurance covering certain levels of environmental exposures related to pastoperations of these refineries. The Company believes costs related to these sites will not have a material adverseaffect on Murphy’s net income, financial condition or liquidity in a future period.
The U.S. Environmental Protection Agency (EPA) currently considers the Company to be a Potentially ResponsibleParty (PRP) at one Superfund site. The Company has thus far been unable to ascertain any association with theSuperfund site based on its research of the facts associated with the site, and the Company has notified the EPAaccordingly. Based on currently available information, the Company believes that it has no responsibility at thisSuperfund site. Accordingly, the Company has not recorded a liability for remedial costs at the Superfund site atDecember 31, 2013. The potential total cost to all parties to perform necessary remedial work at the site may besubstantial. If proven to be responsible, the Company could be required to bear a pro rata share of costs attributableto nonparticipating PRPs or could be assigned additional responsibility for remediation at the site. The Companybelieves that its share of the ultimate costs to remediate the Superfund site will be immaterial and will not have amaterial adverse effect on its net income, financial condition or liquidity in a future period.
With the spin-off of Murphy’s U.S. retail marketing business in 2013, the newly formed public company,Murphy USA Inc., has retained any environmental exposure associated with U.S. marketing operations. MurphyOil has assigned its potential liability for one other Superfund site to Murphy USA Inc., and this company hasaccepted any potential responsibility for this site.
There is the possibility that environmental expenditures could be required at currently unidentified sites, and newor revised regulations could require additional expenditures at known sites. However, based on informationcurrently available to the Company, the amount of future remediation costs incurred at known or currentlyunidentified sites is not expected to have a material adverse effect on the Company’s future net income, cashflows or liquidity.
F-45
MURPHY OIL CORPORATION AND CONSOLIDATED SUBSIDIARIESNOTES TO CONSOLIDATED FINANCIAL STATEMENTS – Continued
LEGAL MATTERS – Murphy and its subsidiaries are engaged in a number of other legal proceedings, all ofwhich Murphy considers routine and incidental to its business. Based on information currently available to theCompany, the ultimate resolution of environmental and legal matters referred to in this note is not expected tohave a material adverse effect on the Company’s net income, financial condition or liquidity in a future period.
OTHER MATTERS – In the normal course of its business, the Company is required under certain contracts withvarious governmental authorities and others to provide financial guarantees or letters of credit that may be drawnupon if the Company fails to perform under those contracts. At December 31, 2013, the Company had contingentliabilities of $129,866,000 on outstanding letters of credit. The Company has not accrued a liability in its balancesheet related to the letters of credit because it is believed that the likelihood of having these drawn is remote.
Note S – Terra Nova Working Interest Redetermination
The joint agreement between the owners of the Terra Nova field, offshore Eastern Canada, required a one-timeredetermination of working interests based on an analysis of reservoir quality among fault separated areas wherevarying ownership interests existed. Under the redetermination, which was essentially completed in 2010, theCompany’s working interest at Terra Nova was reduced from its original 12.0% to 10.475% effective in January2011. The Company made a cash settlement payment to certain Terra Nova partners in January 2011 to equalizeall partners’ interest in the field since about February 2005 related to the Company’s working interest reduction.Based on the final settlement paid in 2011, the Company recorded a pretax benefit of $5,351,000 in 2011 due tothe ultimate cost of the redetermination settlement being less than originally recorded. The benefit has beenreflected as Redetermination of Terra Nova Working Interest in the 2011 Consolidated Statement of Income.
Note T – Common Stock Issued and Outstanding
Activity in the number of shares of Common Stock issued and outstanding for the three years endedDecember 31, 2013 is shown below.
(Number of shares outstanding) 2013 2012 2011
At beginning of year 190,641,317 193,723,208 192,836,008Stock options exercised* 303,685 482,974 615,674Employee stock purchase and thrift plans 16,020 78,389 33,390Restricted stock awards, net of forfeitures 300,910 224,296 238,136Treasury shares purchased (7,855,419) (3,867,550) 0
At end of year 183,406,513 190,641,317 193,723,208
* Shares issued upon exercise of stock options are less than the amount reflected in Note I due towithholdings for statutory income taxes owed upon exercise.
Note U – Subsequent Events
On February 5, 2014, the Company entered into a variable term, capped accelerated share repurchase (ASR)transaction with a major financial institution to repurchase a total of $250,000,000 of the Company’s Commonstock. Through February 28, 2014, the Company has received 4,018,000 shares under the ASR. The total numberof shares to be repurchased under the ASR will be determined by references to the Rule 10b-18 volume-weightedprice of the Company’s Common stock, less a fixed discount. The ASR is expected to be completed within threemonths of the transaction. Also on February 5, 2014, the Company’s Board of Directors declared a quarterlydividend of $0.3125 per share payable on March 3, 2014 to shareholders of record on February 18, 2014.
F-46
MURPHY OIL CORPORATION AND CONSOLIDATED SUBSIDIARIESNOTES TO CONSOLIDATED FINANCIAL STATEMENTS – Continued
Note V – Business Segments
Murphy’s reportable segments are organized into geographic areas of operations. The Company’s explorationand production activity is subdivided into segments for the United States, Canada, Malaysia, Republic of theCongo and all other countries. Each of these segments derives revenues primarily from the sale of crude oil and/or natural gas. The Company’s management evaluates segment performance based on income from operations,excluding interest income and interest expense. Intersegment transfers of crude oil, natural gas and petroleumproducts are at market prices and intersegment services are recorded at cost.
The Company has announced an intention to sell its U.K. refining and marketing operations. The Companycarries the assets and liabilities of the U.K. business as held for sale at December 31, 2013, and the associatedresults of operations are reported as discontinued operations for all periods presented.
The Company sold all of its oil and natural gas producing assets in the United Kingdom during the first half of2013. The Company also completed the separation of its U.S. retail marketing business on August 30, 2013. In2011, the Company sold its two U.S. oil refineries. All of these operations have also been reported asdiscontinued operations for all periods presented in these consolidated financial statements.
The Company has several customers that purchase a significant portion of its oil and natural gas production.During 2013, sales to Phillips 66 and affiliated companies represented approximately 17% of the Company’stotal sales revenue, and sales to Shell Oil and its affiliates represented approximately 14% of total sales revenue.In 2012, Shell Oil, BP and Petronas represented approximately 17%, 13% and 12%, respectively, of consolidatedsales. In 2011, Shell Oil, BP and Petronas represented approximately 16%, 15% and 11%, respectively, ofconsolidated sales. Due to the quantity of active oil and natural gas purchasers in the markets where it produceshydrocarbons, the Company does not foresee any difficulty with selling its hydrocarbon production at fair marketprices.
Information about business segments and geographic operations is reported in the following tables. Forgeographic purposes, revenues are attributed to the country in which the sale occurs. Corporate and otheractivities, including interest income, miscellaneous gains and losses, interest expense and unallocated overhead,are shown in the tables to reconcile the business segments to consolidated totals. As used in the table on thefollowing page, Certain Long-Lived Assets at December 31 exclude investments, noncurrent receivables,deferred tax assets and goodwill and other intangible assets.
F-47
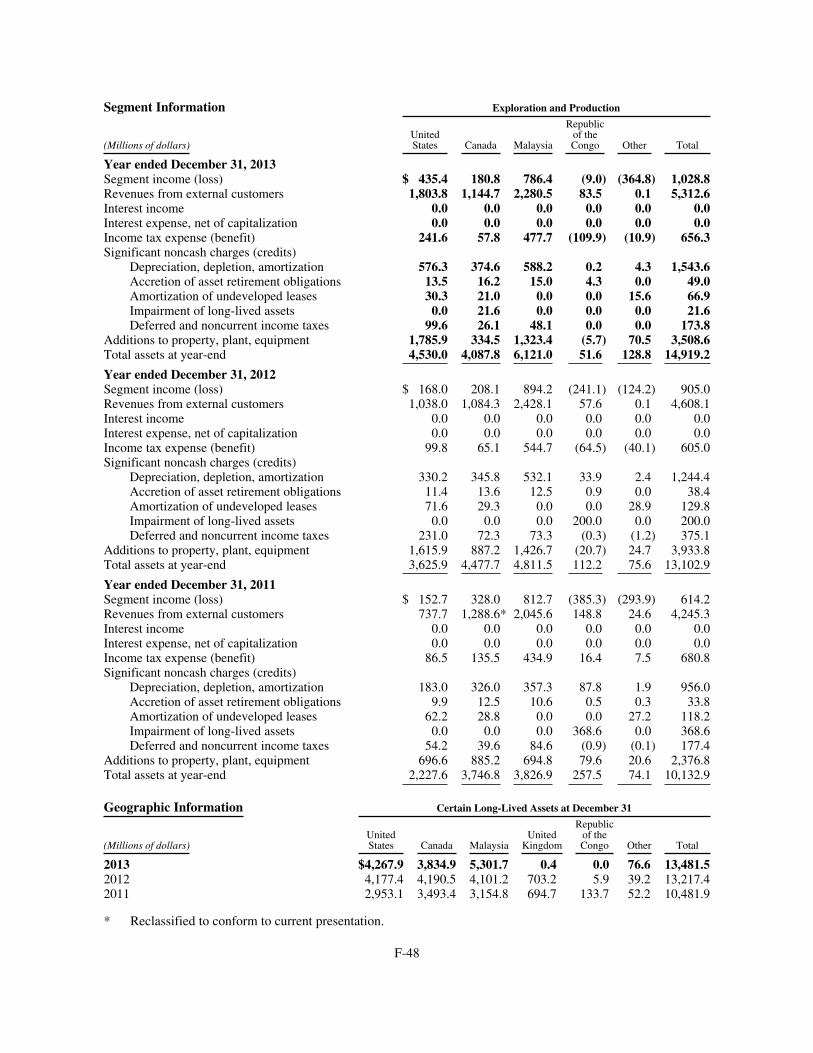
Segment Information Exploration and Production
(Millions of dollars)UnitedStates Canada Malaysia
Republicof theCongo Other Total
Year ended December 31, 2013Segment income (loss) $ 435.4 180.8 786.4 (9.0) (364.8) 1,028.8Revenues from external customers 1,803.8 1,144.7 2,280.5 83.5 0.1 5,312.6Interest income 0.0 0.0 0.0 0.0 0.0 0.0Interest expense, net of capitalization 0.0 0.0 0.0 0.0 0.0 0.0Income tax expense (benefit) 241.6 57.8 477.7 (109.9) (10.9) 656.3Significant noncash charges (credits)
Depreciation, depletion, amortization 576.3 374.6 588.2 0.2 4.3 1,543.6Accretion of asset retirement obligations 13.5 16.2 15.0 4.3 0.0 49.0Amortization of undeveloped leases 30.3 21.0 0.0 0.0 15.6 66.9Impairment of long-lived assets 0.0 21.6 0.0 0.0 0.0 21.6Deferred and noncurrent income taxes 99.6 26.1 48.1 0.0 0.0 173.8
Additions to property, plant, equipment 1,785.9 334.5 1,323.4 (5.7) 70.5 3,508.6Total assets at year-end 4,530.0 4,087.8 6,121.0 51.6 128.8 14,919.2
Year ended December 31, 2012Segment income (loss) $ 168.0 208.1 894.2 (241.1) (124.2) 905.0Revenues from external customers 1,038.0 1,084.3 2,428.1 57.6 0.1 4,608.1Interest income 0.0 0.0 0.0 0.0 0.0 0.0Interest expense, net of capitalization 0.0 0.0 0.0 0.0 0.0 0.0Income tax expense (benefit) 99.8 65.1 544.7 (64.5) (40.1) 605.0Significant noncash charges (credits)
Depreciation, depletion, amortization 330.2 345.8 532.1 33.9 2.4 1,244.4Accretion of asset retirement obligations 11.4 13.6 12.5 0.9 0.0 38.4Amortization of undeveloped leases 71.6 29.3 0.0 0.0 28.9 129.8Impairment of long-lived assets 0.0 0.0 0.0 200.0 0.0 200.0Deferred and noncurrent income taxes 231.0 72.3 73.3 (0.3) (1.2) 375.1
Additions to property, plant, equipment 1,615.9 887.2 1,426.7 (20.7) 24.7 3,933.8Total assets at year-end 3,625.9 4,477.7 4,811.5 112.2 75.6 13,102.9
Year ended December 31, 2011Segment income (loss) $ 152.7 328.0 812.7 (385.3) (293.9) 614.2Revenues from external customers 737.7 1,288.6* 2,045.6 148.8 24.6 4,245.3Interest income 0.0 0.0 0.0 0.0 0.0 0.0Interest expense, net of capitalization 0.0 0.0 0.0 0.0 0.0 0.0Income tax expense (benefit) 86.5 135.5 434.9 16.4 7.5 680.8Significant noncash charges (credits)
Depreciation, depletion, amortization 183.0 326.0 357.3 87.8 1.9 956.0Accretion of asset retirement obligations 9.9 12.5 10.6 0.5 0.3 33.8Amortization of undeveloped leases 62.2 28.8 0.0 0.0 27.2 118.2Impairment of long-lived assets 0.0 0.0 0.0 368.6 0.0 368.6Deferred and noncurrent income taxes 54.2 39.6 84.6 (0.9) (0.1) 177.4
Additions to property, plant, equipment 696.6 885.2 694.8 79.6 20.6 2,376.8Total assets at year-end 2,227.6 3,746.8 3,826.9 257.5 74.1 10,132.9
Geographic Information Certain Long-Lived Assets at December 31
(Millions of dollars)UnitedStates Canada Malaysia
UnitedKingdom
Republicof theCongo Other Total
2013 $4,267.9 3,834.9 5,301.7 0.4 0.0 76.6 13,481.52012 4,177.4 4,190.5 4,101.2 703.2 5.9 39.2 13,217.42011 2,953.1 3,493.4 3,154.8 694.7 133.7 52.2 10,481.9
* Reclassified to conform to current presentation.
F-48
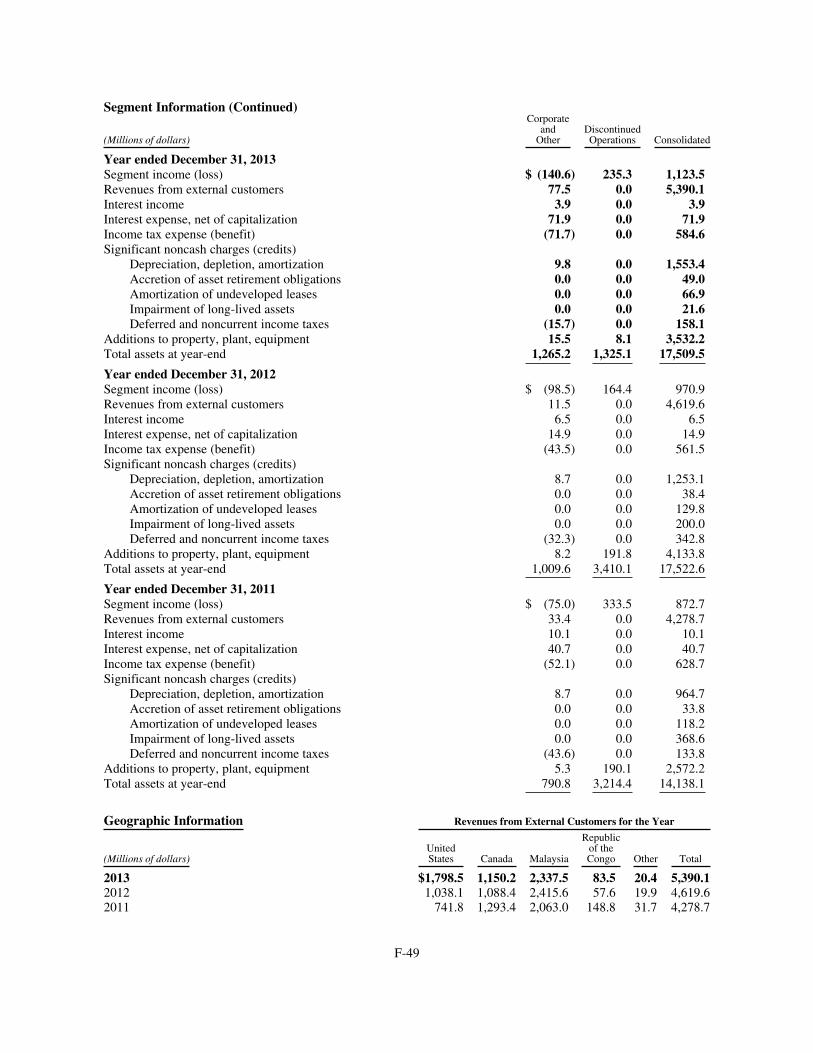
Segment Information (Continued)
(Millions of dollars)
CorporateandOther
DiscontinuedOperations Consolidated
Year ended December 31, 2013Segment income (loss) $ (140.6) 235.3 1,123.5Revenues from external customers 77.5 0.0 5,390.1Interest income 3.9 0.0 3.9Interest expense, net of capitalization 71.9 0.0 71.9Income tax expense (benefit) (71.7) 0.0 584.6Significant noncash charges (credits)
Depreciation, depletion, amortization 9.8 0.0 1,553.4Accretion of asset retirement obligations 0.0 0.0 49.0Amortization of undeveloped leases 0.0 0.0 66.9Impairment of long-lived assets 0.0 0.0 21.6Deferred and noncurrent income taxes (15.7) 0.0 158.1
Additions to property, plant, equipment 15.5 8.1 3,532.2Total assets at year-end 1,265.2 1,325.1 17,509.5
Year ended December 31, 2012Segment income (loss) $ (98.5) 164.4 970.9Revenues from external customers 11.5 0.0 4,619.6Interest income 6.5 0.0 6.5Interest expense, net of capitalization 14.9 0.0 14.9Income tax expense (benefit) (43.5) 0.0 561.5Significant noncash charges (credits)
Depreciation, depletion, amortization 8.7 0.0 1,253.1Accretion of asset retirement obligations 0.0 0.0 38.4Amortization of undeveloped leases 0.0 0.0 129.8Impairment of long-lived assets 0.0 0.0 200.0Deferred and noncurrent income taxes (32.3) 0.0 342.8
Additions to property, plant, equipment 8.2 191.8 4,133.8Total assets at year-end 1,009.6 3,410.1 17,522.6
Year ended December 31, 2011Segment income (loss) $ (75.0) 333.5 872.7Revenues from external customers 33.4 0.0 4,278.7Interest income 10.1 0.0 10.1Interest expense, net of capitalization 40.7 0.0 40.7Income tax expense (benefit) (52.1) 0.0 628.7Significant noncash charges (credits)
Depreciation, depletion, amortization 8.7 0.0 964.7Accretion of asset retirement obligations 0.0 0.0 33.8Amortization of undeveloped leases 0.0 0.0 118.2Impairment of long-lived assets 0.0 0.0 368.6Deferred and noncurrent income taxes (43.6) 0.0 133.8
Additions to property, plant, equipment 5.3 190.1 2,572.2Total assets at year-end 790.8 3,214.4 14,138.1
Geographic Information Revenues from External Customers for the Year
(Millions of dollars)UnitedStates Canada Malaysia
Republicof theCongo Other Total
2013 $1,798.5 1,150.2 2,337.5 83.5 20.4 5,390.12012 1,038.1 1,088.4 2,415.6 57.6 19.9 4,619.62011 741.8 1,293.4 2,063.0 148.8 31.7 4,278.7
F-49
MURPHY OIL CORPORATION AND CONSOLIDATED SUBSIDIARIESSUPPLEMENTAL OIL AND GAS INFORMATION (UNAUDITED)
The following unaudited schedules are presented in accordance with required disclosures about Oil and GasProducing Activities to provide users with a common base for preparing estimates of future cash flows andcomparing reserves among companies. Additional background information follows concerning four of theschedules.
SCHEDULE 1 – SUMMARY OF PROVED OIL RESERVES AND SCHEDULE 2 – SUMMARY OF PROVEDNATURAL GAS RESERVES – Reserves of crude oil, condensate, natural gas liquids, natural gas and syntheticoil are estimated by the Company’s or independent engineers and are adjusted to reflect contractual arrangementsand royalty rates in effect at the end of each year. Many assumptions and judgmental decisions are required toestimate reserves. Reported quantities are subject to future revisions, some of which may be substantial, asadditional information becomes available from reservoir performance, new geological and geophysical data,additional drilling, technological advancements, price changes and other economic factors.
Murphy’s estimations for proved reserves were generated through the integration of available geoscience,engineering, and economic data, and commercially available technologies, to establish ‘reasonable certainty’ ofeconomic producibility. As defined by the SEC, reasonable certainty of proved reserves describes a high degreeof confidence that the quantities will be recovered. In estimating proved reserves, Murphy uses familiar industry-accepted methods for subsurface evaluations, including performance, volumetric, and analogue based studies.Where appropriate, Murphy includes reliable geologic and engineering technology to estimate proved reserves.Reliable geologic and engineering technology is a method or combination of methods that are field tested andhave demonstrated to provide reasonably certain results with consistency and repeatability in the formation beingevaluated or in an analogous formation. This integrated approach increases the quality of and confidence inMurphy’s proved reserves estimates, and was utilized in certain undrilled acreage at distances greater than thedirectly offsetting development spacing areas, and in certain reservoirs developed with the application ofimproved recovery techniques. Murphy utilized a combination of 3D seismic interpretation, core analysis,wellbore log measurements, well test data, historic production and pressure data, and commercially availableseismic processing and numerical reservoir simulation programs. Reservoir parameters from analogous reservoirswere used to strengthen the reserves estimates when available.
Murphy includes synthetic crude oil from its 5% interest in the Syncrude project in Alberta, Canada in its provedoil reserves. This operation involves a process of mining tar sands and converting the raw bitumen into apipeline-quality crude. The proved reserves associated with this project are estimated through a combination ofcore-hole drilling and realized process efficiencies. The high-density core-hole drilling, at a spacing of less than500 meters (proved area), provides engineering and geologic data needed to estimate the volumes of tar sand inplace and its associated bitumen content. The bitumen generally constitutes approximately 10% of the total bulktar sand that is mined. The bitumen extraction process is fairly efficient and removes about 90% of the bitumenthat is contained within the tar sand. The final step of the process converts the 8.4° API bitumen into 30°-34° APIcrude oil. A catalytic cracking process is used to crack the long hydrocarbon chains into shorter ones yielding afinal crude oil that can be shipped via pipelines. The cracking process has an efficiency ranging from 85% to90%. Overall, it takes approximately two metric tons of oil sand to produce one barrel of synthetic crude oil. Allsynthetic oil volumes reported as proved reserves in Schedule 1 are the final synthetic crude oil product.
Production quantities shown are net volumes withdrawn from reservoirs. These may differ from sales quantitiesdue to inventory changes, volumes consumed for fuel and/or shrinkage from extraction of natural gas liquids.Proved oil reserves shown in Schedule 1 include insignificant volumes of natural gas liquids.
Oil and natural gas reserves in Malaysia are associated with production sharing contracts for Blocks SK 309/311and K. Malaysia reserves include oil and gas to be received for both cost recovery and profit provisions under thecontracts. Oil and natural gas proved reserves associated with the production sharing contracts in Malaysia
F-50
totaled 125.1 million barrels and 405.8 billion cubic feet, respectively, at December 31, 2013. Approximately74.9 billion cubic feet of natural gas proved reserves in Malaysia relate to fields in Block K for which theCompany expects to receive sale proceeds of approximately $0.24 per thousand cubic feet.
SCHEDULE 4 – RESULTS OF OPERATIONS FOR OIL AND GAS PRODUCING ACTIVITIES – Results ofoperations from exploration and production activities by geographic area are reported as if these activities werenot part of an operation that also refines crude oil and sells refined products.
SCHEDULE 5 – STANDARDIZED MEASURE OF DISCOUNTED FUTURE NET CASH FLOWSRELATING TO PROVED OIL AND GAS RESERVES – Generally accepted accounting principles requirecalculation of future net cash flows using a 10% annual discount factor, an unweighted average of oil and naturalgas prices in effect at the beginning of each month of the year, and year-end costs and statutory tax rates, exceptfor known future changes such as contracted prices and legislated tax rates.
The reported value of proved reserves is not necessarily indicative of either fair market value or present value offuture cash flows because prices, costs and governmental policies do not remain static; appropriate discount ratesmay vary; and extensive judgment is required to estimate the timing of production. Other logical assumptionswould likely have resulted in significantly different amounts.
Schedule 5 also presents the principal reasons for change in the standardized measure of discounted future netcash flows for each of the three years ended December 31, 2013.
F-51
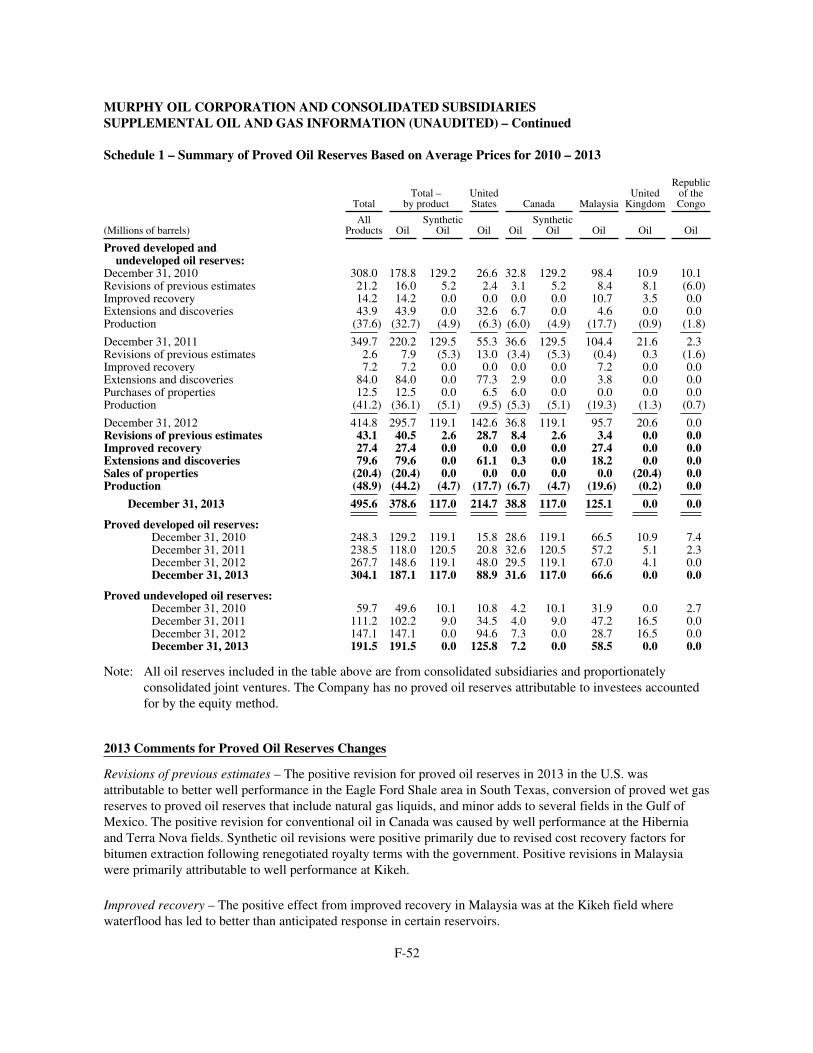
MURPHY OIL CORPORATION AND CONSOLIDATED SUBSIDIARIESSUPPLEMENTAL OIL AND GAS INFORMATION (UNAUDITED) – Continued
Schedule 1 – Summary of Proved Oil Reserves Based on Average Prices for 2010 – 2013
TotalTotal –
by productUnitedStates Canada Malaysia
UnitedKingdom
Republicof theCongo
(Millions of barrels)All
Products OilSynthetic
Oil Oil OilSynthetic
Oil Oil Oil Oil
Proved developed andundeveloped oil reserves:
December 31, 2010 308.0 178.8 129.2 26.6 32.8 129.2 98.4 10.9 10.1Revisions of previous estimates 21.2 16.0 5.2 2.4 3.1 5.2 8.4 8.1 (6.0)Improved recovery 14.2 14.2 0.0 0.0 0.0 0.0 10.7 3.5 0.0Extensions and discoveries 43.9 43.9 0.0 32.6 6.7 0.0 4.6 0.0 0.0Production (37.6) (32.7) (4.9) (6.3) (6.0) (4.9) (17.7) (0.9) (1.8)
December 31, 2011 349.7 220.2 129.5 55.3 36.6 129.5 104.4 21.6 2.3Revisions of previous estimates 2.6 7.9 (5.3) 13.0 (3.4) (5.3) (0.4) 0.3 (1.6)Improved recovery 7.2 7.2 0.0 0.0 0.0 0.0 7.2 0.0 0.0Extensions and discoveries 84.0 84.0 0.0 77.3 2.9 0.0 3.8 0.0 0.0Purchases of properties 12.5 12.5 0.0 6.5 6.0 0.0 0.0 0.0 0.0Production (41.2) (36.1) (5.1) (9.5) (5.3) (5.1) (19.3) (1.3) (0.7)
December 31, 2012 414.8 295.7 119.1 142.6 36.8 119.1 95.7 20.6 0.0Revisions of previous estimates 43.1 40.5 2.6 28.7 8.4 2.6 3.4 0.0 0.0Improved recovery 27.4 27.4 0.0 0.0 0.0 0.0 27.4 0.0 0.0Extensions and discoveries 79.6 79.6 0.0 61.1 0.3 0.0 18.2 0.0 0.0Sales of properties (20.4) (20.4) 0.0 0.0 0.0 0.0 0.0 (20.4) 0.0Production (48.9) (44.2) (4.7) (17.7) (6.7) (4.7) (19.6) (0.2) 0.0
December 31, 2013 495.6 378.6 117.0 214.7 38.8 117.0 125.1 0.0 0.0
Proved developed oil reserves:December 31, 2010 248.3 129.2 119.1 15.8 28.6 119.1 66.5 10.9 7.4December 31, 2011 238.5 118.0 120.5 20.8 32.6 120.5 57.2 5.1 2.3December 31, 2012 267.7 148.6 119.1 48.0 29.5 119.1 67.0 4.1 0.0December 31, 2013 304.1 187.1 117.0 88.9 31.6 117.0 66.6 0.0 0.0
Proved undeveloped oil reserves:December 31, 2010 59.7 49.6 10.1 10.8 4.2 10.1 31.9 0.0 2.7December 31, 2011 111.2 102.2 9.0 34.5 4.0 9.0 47.2 16.5 0.0December 31, 2012 147.1 147.1 0.0 94.6 7.3 0.0 28.7 16.5 0.0December 31, 2013 191.5 191.5 0.0 125.8 7.2 0.0 58.5 0.0 0.0
Note: All oil reserves included in the table above are from consolidated subsidiaries and proportionatelyconsolidated joint ventures. The Company has no proved oil reserves attributable to investees accountedfor by the equity method.
2013 Comments for Proved Oil Reserves Changes
Revisions of previous estimates – The positive revision for proved oil reserves in 2013 in the U.S. wasattributable to better well performance in the Eagle Ford Shale area in South Texas, conversion of proved wet gasreserves to proved oil reserves that include natural gas liquids, and minor adds to several fields in the Gulf ofMexico. The positive revision for conventional oil in Canada was caused by well performance at the Hiberniaand Terra Nova fields. Synthetic oil revisions were positive primarily due to revised cost recovery factors forbitumen extraction following renegotiated royalty terms with the government. Positive revisions in Malaysiawere primarily attributable to well performance at Kikeh.
Improved recovery – The positive effect from improved recovery in Malaysia was at the Kikeh field wherewaterflood has led to better than anticipated response in certain reservoirs.
F-52
MURPHY OIL CORPORATION AND CONSOLIDATED SUBSIDIARIESSUPPLEMENTAL OIL AND GAS INFORMATION (UNAUDITED) – Continued
Schedule 1 – Summary of Proved Oil Reserves Based on Average Prices for 2010 – 2013 Continued
2013 Comments for Proved Oil Reserves Changes – Continued
Extensions and discoveries – The U.S. proved oil reserve additions were all in the Eagle Ford Shale where theCompany has used reliable technology to add offset locations associated with well downspacing in certain areas.Proved oil adds in Canada were associated with extensions at Seal. Additions to oil reserves in Malaysiaprimarily related to four new oil fields offshore Sarawak which were put on production during the second half of2013.
Sales of properties – The Company sold all its oil fields in the U.K. during the first half of 2013.
2012 Comments for Proved Oil Reserves Changes
Revisions of previous estimates – A positive proved oil reserves revision in 2012 in the U.S. were due toimproved well performance in the Eagle Ford Shale and at the Medusa field in the Gulf of Mexico. Downwardrevisions for conventional oil in Canada related to a lower recovery assessment for certain heavy oil wells in theSeal area. Negative proved oil revisions for synthetic oil in Canada related to an entitlement change based onrecent spending projections that increased royalties estimated to be paid to the government. Negative proved oilrevisions in Republic of the Congo arose due to a combination of poor well performance on existing wells, a wellthat went off production in 2012, and generally uneconomic remaining future production due to oil recoveryprojections.
Improved recovery – The improved recovery in 2012 in Malaysia was essentially caused by better waterfloodresponse in certain Kikeh field reservoir sands.
Extensions and discoveries – The U.S. proved oil reserves added in 2012 were primarily in the Eagle Ford Shaleand were based on use of reliable technology to recognize additional offset undeveloped locations with 80 acredownspacing in certain areas of the play. The oil reserves added in Canada mostly related to additionaldevelopment drilling off the East Coast at Hibernia and Terra Nova. Malaysia reserves increases primarily arosedue to development drilling at fields offshore Sarawak.
Purchases of properties – Proved oil reserves added from property acquisitions in 2012 were associated withinterests added at the Front Runner and Thunder Hawk fields in the U.S. Gulf of Mexico and in the Seal heavyoil area of Western Canada.
2011 Comments for Proved Oil Reserves Changes
Revisions of previous estimates – Positive proved oil reserve revisions in the U.S. in 2011 were primarilyassociated with better production at the Medusa field in the Gulf of Mexico. Positive revisions for Canadaconventional operations were mostly attributable to better well performance at the Hibernia field, offshoreEastern Canada. Synthetic oil operations had positive reserve revisions due to a change in royalty rate. Positiverevisions in Malaysia were primarily at the Kikeh field caused by production performance. Positive revisions inthe U.K. were associated with the Schiehallion field due to redevelopment by its owners. The negative revision inreserves in Republic of the Congo was attributable to poor production results for wells in the Azurite field.
Improved recovery – The improved recovery in Malaysia in 2011 was primarily at Kikeh due to improvedwaterflood response in certain reservoir sands. U.K. reserves were at Schiehallion due to additional wells thatpermit better waterflood recovery.
Extensions and discoveries – The U.S. and Canadian reserves in 2011 related to the Eagle Ford Shale area andthe Seal heavy oil area, respectively, where extensive drilling occurred during the year and many undevelopedlocations will be drilled in upcoming years. The majority of Malaysia reserves related to the Block K SiakapNorth field, which was sanctioned for development by the government and Company in 2011.
F-53
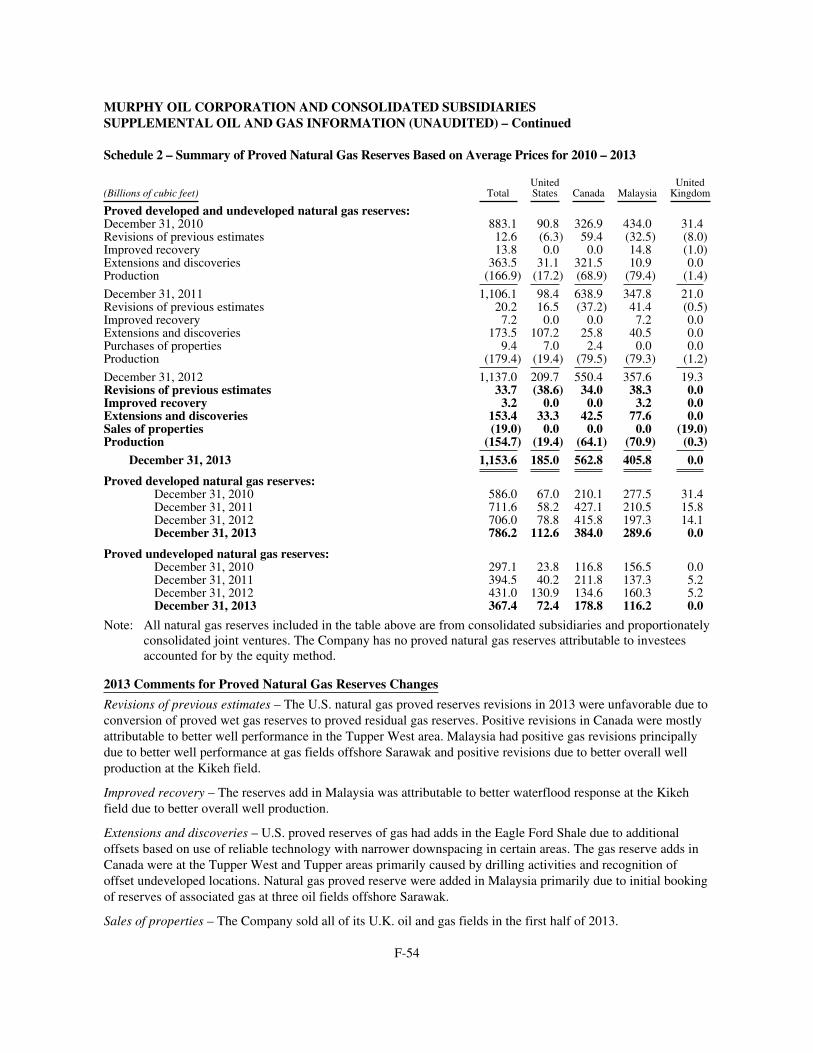
MURPHY OIL CORPORATION AND CONSOLIDATED SUBSIDIARIESSUPPLEMENTAL OIL AND GAS INFORMATION (UNAUDITED) – Continued
Schedule 2 – Summary of Proved Natural Gas Reserves Based on Average Prices for 2010 – 2013
(Billions of cubic feet) TotalUnitedStates Canada Malaysia
UnitedKingdom
Proved developed and undeveloped natural gas reserves:December 31, 2010 883.1 90.8 326.9 434.0 31.4Revisions of previous estimates 12.6 (6.3) 59.4 (32.5) (8.0)Improved recovery 13.8 0.0 0.0 14.8 (1.0)Extensions and discoveries 363.5 31.1 321.5 10.9 0.0Production (166.9) (17.2) (68.9) (79.4) (1.4)
December 31, 2011 1,106.1 98.4 638.9 347.8 21.0Revisions of previous estimates 20.2 16.5 (37.2) 41.4 (0.5)Improved recovery 7.2 0.0 0.0 7.2 0.0Extensions and discoveries 173.5 107.2 25.8 40.5 0.0Purchases of properties 9.4 7.0 2.4 0.0 0.0Production (179.4) (19.4) (79.5) (79.3) (1.2)
December 31, 2012 1,137.0 209.7 550.4 357.6 19.3Revisions of previous estimates 33.7 (38.6) 34.0 38.3 0.0Improved recovery 3.2 0.0 0.0 3.2 0.0Extensions and discoveries 153.4 33.3 42.5 77.6 0.0Sales of properties (19.0) 0.0 0.0 0.0 (19.0)Production (154.7) (19.4) (64.1) (70.9) (0.3)
December 31, 2013 1,153.6 185.0 562.8 405.8 0.0
Proved developed natural gas reserves:December 31, 2010 586.0 67.0 210.1 277.5 31.4December 31, 2011 711.6 58.2 427.1 210.5 15.8December 31, 2012 706.0 78.8 415.8 197.3 14.1December 31, 2013 786.2 112.6 384.0 289.6 0.0
Proved undeveloped natural gas reserves:December 31, 2010 297.1 23.8 116.8 156.5 0.0December 31, 2011 394.5 40.2 211.8 137.3 5.2December 31, 2012 431.0 130.9 134.6 160.3 5.2December 31, 2013 367.4 72.4 178.8 116.2 0.0
Note: All natural gas reserves included in the table above are from consolidated subsidiaries and proportionatelyconsolidated joint ventures. The Company has no proved natural gas reserves attributable to investeesaccounted for by the equity method.
2013 Comments for Proved Natural Gas Reserves Changes
Revisions of previous estimates – The U.S. natural gas proved reserves revisions in 2013 were unfavorable due toconversion of proved wet gas reserves to proved residual gas reserves. Positive revisions in Canada were mostlyattributable to better well performance in the Tupper West area. Malaysia had positive gas revisions principallydue to better well performance at gas fields offshore Sarawak and positive revisions due to better overall wellproduction at the Kikeh field.
Improved recovery – The reserves add in Malaysia was attributable to better waterflood response at the Kikehfield due to better overall well production.
Extensions and discoveries – U.S. proved reserves of gas had adds in the Eagle Ford Shale due to additionaloffsets based on use of reliable technology with narrower downspacing in certain areas. The gas reserve adds inCanada were at the Tupper West and Tupper areas primarily caused by drilling activities and recognition ofoffset undeveloped locations. Natural gas proved reserve were added in Malaysia primarily due to initial bookingof reserves of associated gas at three oil fields offshore Sarawak.
Sales of properties – The Company sold all of its U.K. oil and gas fields in the first half of 2013.
F-54
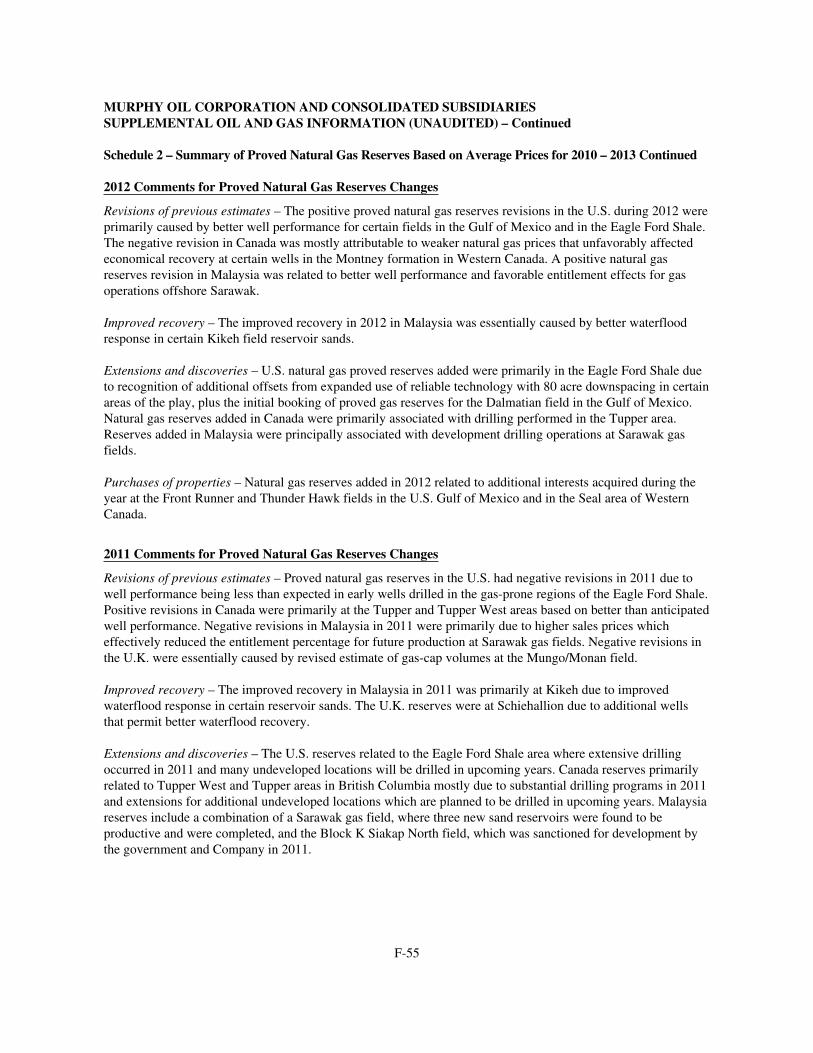
MURPHY OIL CORPORATION AND CONSOLIDATED SUBSIDIARIESSUPPLEMENTAL OIL AND GAS INFORMATION (UNAUDITED) – Continued
Schedule 2 – Summary of Proved Natural Gas Reserves Based on Average Prices for 2010 – 2013 Continued
2012 Comments for Proved Natural Gas Reserves Changes
Revisions of previous estimates – The positive proved natural gas reserves revisions in the U.S. during 2012 wereprimarily caused by better well performance for certain fields in the Gulf of Mexico and in the Eagle Ford Shale.The negative revision in Canada was mostly attributable to weaker natural gas prices that unfavorably affectedeconomical recovery at certain wells in the Montney formation in Western Canada. A positive natural gasreserves revision in Malaysia was related to better well performance and favorable entitlement effects for gasoperations offshore Sarawak.
Improved recovery – The improved recovery in 2012 in Malaysia was essentially caused by better waterfloodresponse in certain Kikeh field reservoir sands.
Extensions and discoveries – U.S. natural gas proved reserves added were primarily in the Eagle Ford Shale dueto recognition of additional offsets from expanded use of reliable technology with 80 acre downspacing in certainareas of the play, plus the initial booking of proved gas reserves for the Dalmatian field in the Gulf of Mexico.Natural gas reserves added in Canada were primarily associated with drilling performed in the Tupper area.Reserves added in Malaysia were principally associated with development drilling operations at Sarawak gasfields.
Purchases of properties – Natural gas reserves added in 2012 related to additional interests acquired during theyear at the Front Runner and Thunder Hawk fields in the U.S. Gulf of Mexico and in the Seal area of WesternCanada.
2011 Comments for Proved Natural Gas Reserves Changes
Revisions of previous estimates – Proved natural gas reserves in the U.S. had negative revisions in 2011 due towell performance being less than expected in early wells drilled in the gas-prone regions of the Eagle Ford Shale.Positive revisions in Canada were primarily at the Tupper and Tupper West areas based on better than anticipatedwell performance. Negative revisions in Malaysia in 2011 were primarily due to higher sales prices whicheffectively reduced the entitlement percentage for future production at Sarawak gas fields. Negative revisions inthe U.K. were essentially caused by revised estimate of gas-cap volumes at the Mungo/Monan field.
Improved recovery – The improved recovery in Malaysia in 2011 was primarily at Kikeh due to improvedwaterflood response in certain reservoir sands. The U.K. reserves were at Schiehallion due to additional wellsthat permit better waterflood recovery.
Extensions and discoveries – The U.S. reserves related to the Eagle Ford Shale area where extensive drillingoccurred in 2011 and many undeveloped locations will be drilled in upcoming years. Canada reserves primarilyrelated to Tupper West and Tupper areas in British Columbia mostly due to substantial drilling programs in 2011and extensions for additional undeveloped locations which are planned to be drilled in upcoming years. Malaysiareserves include a combination of a Sarawak gas field, where three new sand reservoirs were found to beproductive and were completed, and the Block K Siakap North field, which was sanctioned for development bythe government and Company in 2011.
F-55
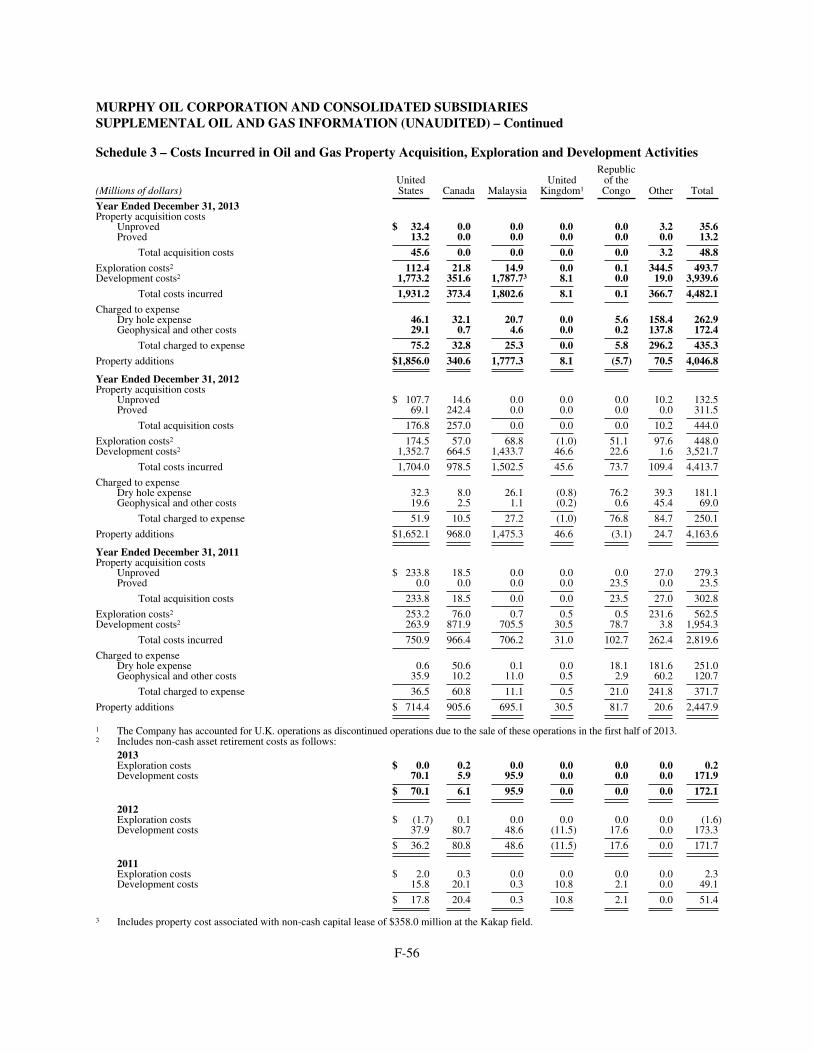
MURPHY OIL CORPORATION AND CONSOLIDATED SUBSIDIARIESSUPPLEMENTAL OIL AND GAS INFORMATION (UNAUDITED) – Continued
Schedule 3 – Costs Incurred in Oil and Gas Property Acquisition, Exploration and Development Activities
(Millions of dollars)UnitedStates Canada Malaysia
UnitedKingdom1
Republicof theCongo Other Total
Year Ended December 31, 2013Property acquisition costs
Unproved $ 32.4 0.0 0.0 0.0 0.0 3.2 35.6Proved 13.2 0.0 0.0 0.0 0.0 0.0 13.2
Total acquisition costs 45.6 0.0 0.0 0.0 0.0 3.2 48.8
Exploration costs2 112.4 21.8 14.9 0.0 0.1 344.5 493.7Development costs2 1,773.2 351.6 1,787.73 8.1 0.0 19.0 3,939.6
Total costs incurred 1,931.2 373.4 1,802.6 8.1 0.1 366.7 4,482.1
Charged to expenseDry hole expense 46.1 32.1 20.7 0.0 5.6 158.4 262.9Geophysical and other costs 29.1 0.7 4.6 0.0 0.2 137.8 172.4
Total charged to expense 75.2 32.8 25.3 0.0 5.8 296.2 435.3
Property additions $1,856.0 340.6 1,777.3 8.1 (5.7) 70.5 4,046.8
Year Ended December 31, 2012Property acquisition costs
Unproved $ 107.7 14.6 0.0 0.0 0.0 10.2 132.5Proved 69.1 242.4 0.0 0.0 0.0 0.0 311.5
Total acquisition costs 176.8 257.0 0.0 0.0 0.0 10.2 444.0
Exploration costs2 174.5 57.0 68.8 (1.0) 51.1 97.6 448.0Development costs2 1,352.7 664.5 1,433.7 46.6 22.6 1.6 3,521.7
Total costs incurred 1,704.0 978.5 1,502.5 45.6 73.7 109.4 4,413.7
Charged to expenseDry hole expense 32.3 8.0 26.1 (0.8) 76.2 39.3 181.1Geophysical and other costs 19.6 2.5 1.1 (0.2) 0.6 45.4 69.0
Total charged to expense 51.9 10.5 27.2 (1.0) 76.8 84.7 250.1
Property additions $1,652.1 968.0 1,475.3 46.6 (3.1) 24.7 4,163.6
Year Ended December 31, 2011Property acquisition costs
Unproved $ 233.8 18.5 0.0 0.0 0.0 27.0 279.3Proved 0.0 0.0 0.0 0.0 23.5 0.0 23.5
Total acquisition costs 233.8 18.5 0.0 0.0 23.5 27.0 302.8
Exploration costs2 253.2 76.0 0.7 0.5 0.5 231.6 562.5Development costs2 263.9 871.9 705.5 30.5 78.7 3.8 1,954.3
Total costs incurred 750.9 966.4 706.2 31.0 102.7 262.4 2,819.6
Charged to expenseDry hole expense 0.6 50.6 0.1 0.0 18.1 181.6 251.0Geophysical and other costs 35.9 10.2 11.0 0.5 2.9 60.2 120.7
Total charged to expense 36.5 60.8 11.1 0.5 21.0 241.8 371.7
Property additions $ 714.4 905.6 695.1 30.5 81.7 20.6 2,447.9
1 The Company has accounted for U.K. operations as discontinued operations due to the sale of these operations in the first half of 2013.2 Includes non-cash asset retirement costs as follows:
2013Exploration costs $ 0.0 0.2 0.0 0.0 0.0 0.0 0.2Development costs 70.1 5.9 95.9 0.0 0.0 0.0 171.9
$ 70.1 6.1 95.9 0.0 0.0 0.0 172.1
2012Exploration costs $ (1.7) 0.1 0.0 0.0 0.0 0.0 (1.6)Development costs 37.9 80.7 48.6 (11.5) 17.6 0.0 173.3
$ 36.2 80.8 48.6 (11.5) 17.6 0.0 171.7
2011Exploration costs $ 2.0 0.3 0.0 0.0 0.0 0.0 2.3Development costs 15.8 20.1 0.3 10.8 2.1 0.0 49.1
$ 17.8 20.4 0.3 10.8 2.1 0.0 51.4
3 Includes property cost associated with non-cash capital lease of $358.0 million at the Kakap field.
F-56
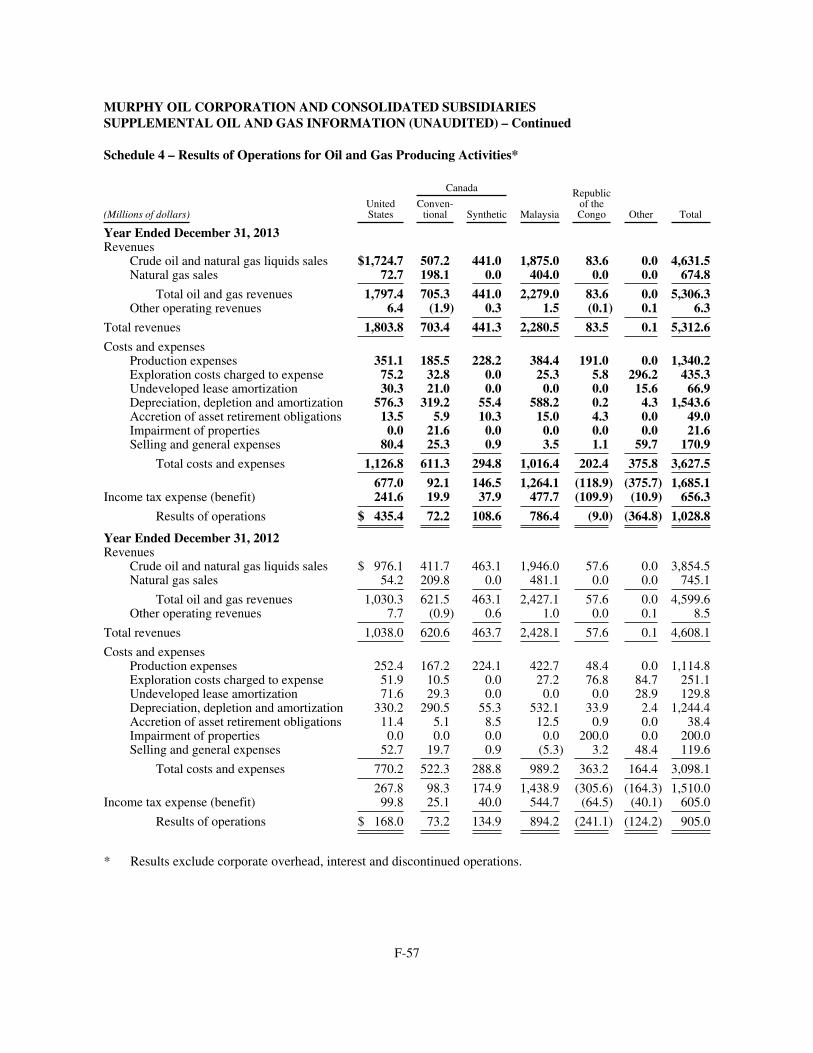
MURPHY OIL CORPORATION AND CONSOLIDATED SUBSIDIARIESSUPPLEMENTAL OIL AND GAS INFORMATION (UNAUDITED) – Continued
Schedule 4 – Results of Operations for Oil and Gas Producing Activities*
Canada Republicof theCongo(Millions of dollars)
UnitedStates
Conven-tional Synthetic Malaysia Other Total
Year Ended December 31, 2013Revenues
Crude oil and natural gas liquids sales $1,724.7 507.2 441.0 1,875.0 83.6 0.0 4,631.5Natural gas sales 72.7 198.1 0.0 404.0 0.0 0.0 674.8
Total oil and gas revenues 1,797.4 705.3 441.0 2,279.0 83.6 0.0 5,306.3Other operating revenues 6.4 (1.9) 0.3 1.5 (0.1) 0.1 6.3
Total revenues 1,803.8 703.4 441.3 2,280.5 83.5 0.1 5,312.6
Costs and expensesProduction expenses 351.1 185.5 228.2 384.4 191.0 0.0 1,340.2Exploration costs charged to expense 75.2 32.8 0.0 25.3 5.8 296.2 435.3Undeveloped lease amortization 30.3 21.0 0.0 0.0 0.0 15.6 66.9Depreciation, depletion and amortization 576.3 319.2 55.4 588.2 0.2 4.3 1,543.6Accretion of asset retirement obligations 13.5 5.9 10.3 15.0 4.3 0.0 49.0Impairment of properties 0.0 21.6 0.0 0.0 0.0 0.0 21.6Selling and general expenses 80.4 25.3 0.9 3.5 1.1 59.7 170.9
Total costs and expenses 1,126.8 611.3 294.8 1,016.4 202.4 375.8 3,627.5
677.0 92.1 146.5 1,264.1 (118.9) (375.7) 1,685.1Income tax expense (benefit) 241.6 19.9 37.9 477.7 (109.9) (10.9) 656.3
Results of operations $ 435.4 72.2 108.6 786.4 (9.0) (364.8) 1,028.8
Year Ended December 31, 2012Revenues
Crude oil and natural gas liquids sales $ 976.1 411.7 463.1 1,946.0 57.6 0.0 3,854.5Natural gas sales 54.2 209.8 0.0 481.1 0.0 0.0 745.1
Total oil and gas revenues 1,030.3 621.5 463.1 2,427.1 57.6 0.0 4,599.6Other operating revenues 7.7 (0.9) 0.6 1.0 0.0 0.1 8.5
Total revenues 1,038.0 620.6 463.7 2,428.1 57.6 0.1 4,608.1
Costs and expensesProduction expenses 252.4 167.2 224.1 422.7 48.4 0.0 1,114.8Exploration costs charged to expense 51.9 10.5 0.0 27.2 76.8 84.7 251.1Undeveloped lease amortization 71.6 29.3 0.0 0.0 0.0 28.9 129.8Depreciation, depletion and amortization 330.2 290.5 55.3 532.1 33.9 2.4 1,244.4Accretion of asset retirement obligations 11.4 5.1 8.5 12.5 0.9 0.0 38.4Impairment of properties 0.0 0.0 0.0 0.0 200.0 0.0 200.0Selling and general expenses 52.7 19.7 0.9 (5.3) 3.2 48.4 119.6
Total costs and expenses 770.2 522.3 288.8 989.2 363.2 164.4 3,098.1
267.8 98.3 174.9 1,438.9 (305.6) (164.3) 1,510.0Income tax expense (benefit) 99.8 25.1 40.0 544.7 (64.5) (40.1) 605.0
Results of operations $ 168.0 73.2 134.9 894.2 (241.1) (124.2) 905.0
* Results exclude corporate overhead, interest and discontinued operations.
F-57
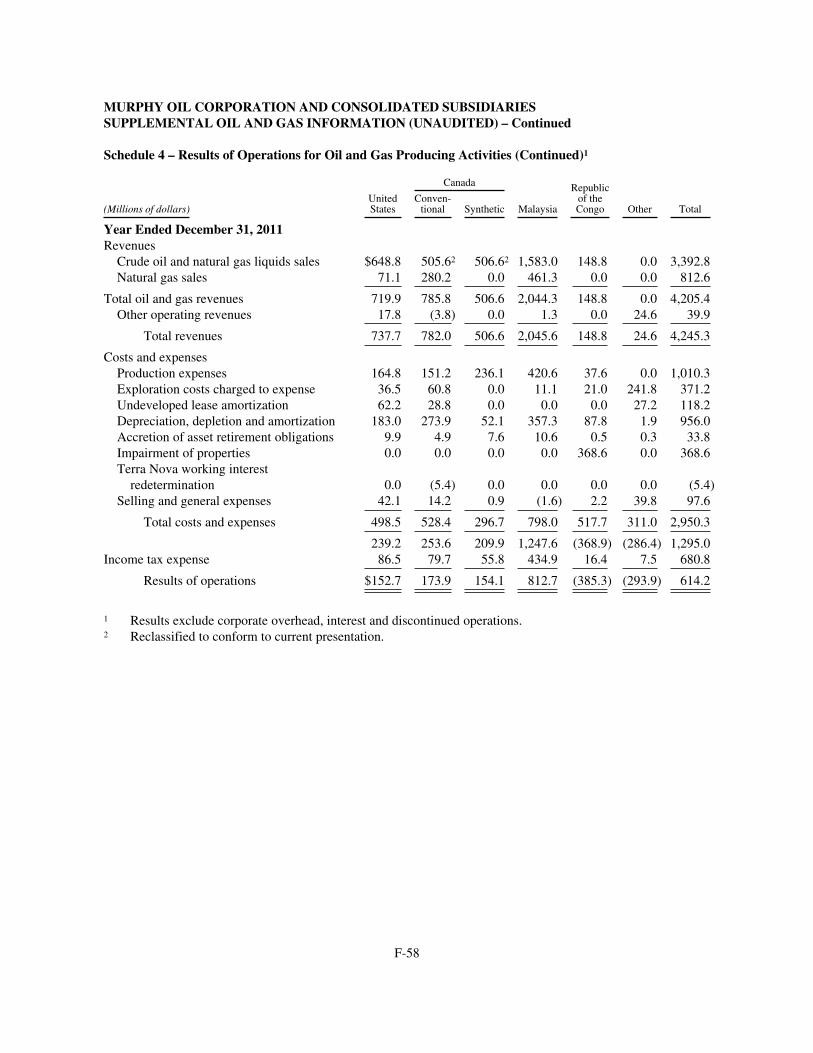
MURPHY OIL CORPORATION AND CONSOLIDATED SUBSIDIARIESSUPPLEMENTAL OIL AND GAS INFORMATION (UNAUDITED) – Continued
Schedule 4 – Results of Operations for Oil and Gas Producing Activities (Continued)1
(Millions of dollars)UnitedStates
Canada
Malaysia
Republicof theCongo Other Total
Conven-tional Synthetic
Year Ended December 31, 2011RevenuesCrude oil and natural gas liquids sales $648.8 505.62 506.62 1,583.0 148.8 0.0 3,392.8Natural gas sales 71.1 280.2 0.0 461.3 0.0 0.0 812.6
Total oil and gas revenues 719.9 785.8 506.6 2,044.3 148.8 0.0 4,205.4Other operating revenues 17.8 (3.8) 0.0 1.3 0.0 24.6 39.9
Total revenues 737.7 782.0 506.6 2,045.6 148.8 24.6 4,245.3
Costs and expensesProduction expenses 164.8 151.2 236.1 420.6 37.6 0.0 1,010.3Exploration costs charged to expense 36.5 60.8 0.0 11.1 21.0 241.8 371.2Undeveloped lease amortization 62.2 28.8 0.0 0.0 0.0 27.2 118.2Depreciation, depletion and amortization 183.0 273.9 52.1 357.3 87.8 1.9 956.0Accretion of asset retirement obligations 9.9 4.9 7.6 10.6 0.5 0.3 33.8Impairment of properties 0.0 0.0 0.0 0.0 368.6 0.0 368.6Terra Nova working interestredetermination 0.0 (5.4) 0.0 0.0 0.0 0.0 (5.4)
Selling and general expenses 42.1 14.2 0.9 (1.6) 2.2 39.8 97.6
Total costs and expenses 498.5 528.4 296.7 798.0 517.7 311.0 2,950.3
239.2 253.6 209.9 1,247.6 (368.9) (286.4) 1,295.0Income tax expense 86.5 79.7 55.8 434.9 16.4 7.5 680.8
Results of operations $152.7 173.9 154.1 812.7 (385.3) (293.9) 614.2
1 Results exclude corporate overhead, interest and discontinued operations.2 Reclassified to conform to current presentation.
F-58
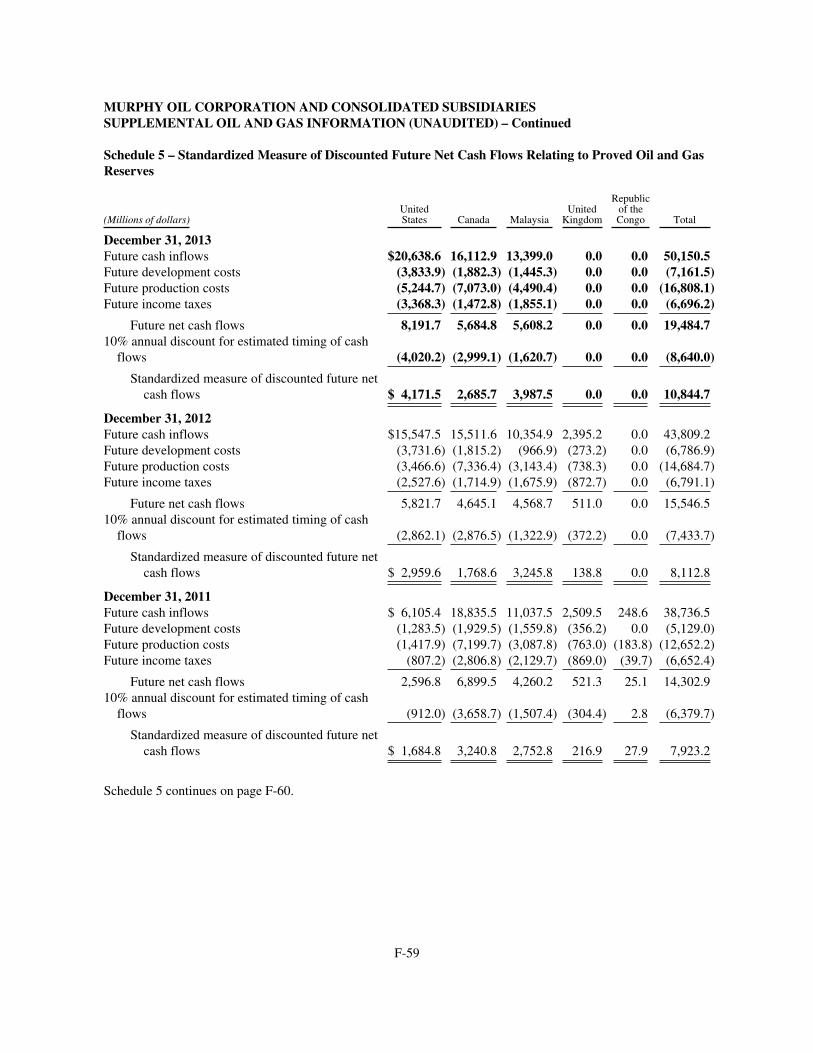
MURPHY OIL CORPORATION AND CONSOLIDATED SUBSIDIARIESSUPPLEMENTAL OIL AND GAS INFORMATION (UNAUDITED) – Continued
Schedule 5 – Standardized Measure of Discounted Future Net Cash Flows Relating to Proved Oil and GasReserves
(Millions of dollars)UnitedStates Canada Malaysia
UnitedKingdom
Republicof theCongo Total
December 31, 2013Future cash inflows $20,638.6 16,112.9 13,399.0 0.0 0.0 50,150.5Future development costs (3,833.9) (1,882.3) (1,445.3) 0.0 0.0 (7,161.5)Future production costs (5,244.7) (7,073.0) (4,490.4) 0.0 0.0 (16,808.1)Future income taxes (3,368.3) (1,472.8) (1,855.1) 0.0 0.0 (6,696.2)
Future net cash flows 8,191.7 5,684.8 5,608.2 0.0 0.0 19,484.710% annual discount for estimated timing of cashflows (4,020.2) (2,999.1) (1,620.7) 0.0 0.0 (8,640.0)
Standardized measure of discounted future netcash flows $ 4,171.5 2,685.7 3,987.5 0.0 0.0 10,844.7
December 31, 2012Future cash inflows $15,547.5 15,511.6 10,354.9 2,395.2 0.0 43,809.2Future development costs (3,731.6) (1,815.2) (966.9) (273.2) 0.0 (6,786.9)Future production costs (3,466.6) (7,336.4) (3,143.4) (738.3) 0.0 (14,684.7)Future income taxes (2,527.6) (1,714.9) (1,675.9) (872.7) 0.0 (6,791.1)
Future net cash flows 5,821.7 4,645.1 4,568.7 511.0 0.0 15,546.510% annual discount for estimated timing of cashflows (2,862.1) (2,876.5) (1,322.9) (372.2) 0.0 (7,433.7)
Standardized measure of discounted future netcash flows $ 2,959.6 1,768.6 3,245.8 138.8 0.0 8,112.8
December 31, 2011Future cash inflows $ 6,105.4 18,835.5 11,037.5 2,509.5 248.6 38,736.5Future development costs (1,283.5) (1,929.5) (1,559.8) (356.2) 0.0 (5,129.0)Future production costs (1,417.9) (7,199.7) (3,087.8) (763.0) (183.8) (12,652.2)Future income taxes (807.2) (2,806.8) (2,129.7) (869.0) (39.7) (6,652.4)
Future net cash flows 2,596.8 6,899.5 4,260.2 521.3 25.1 14,302.910% annual discount for estimated timing of cashflows (912.0) (3,658.7) (1,507.4) (304.4) 2.8 (6,379.7)
Standardized measure of discounted future netcash flows $ 1,684.8 3,240.8 2,752.8 216.9 27.9 7,923.2
Schedule 5 continues on page F-60.
F-59
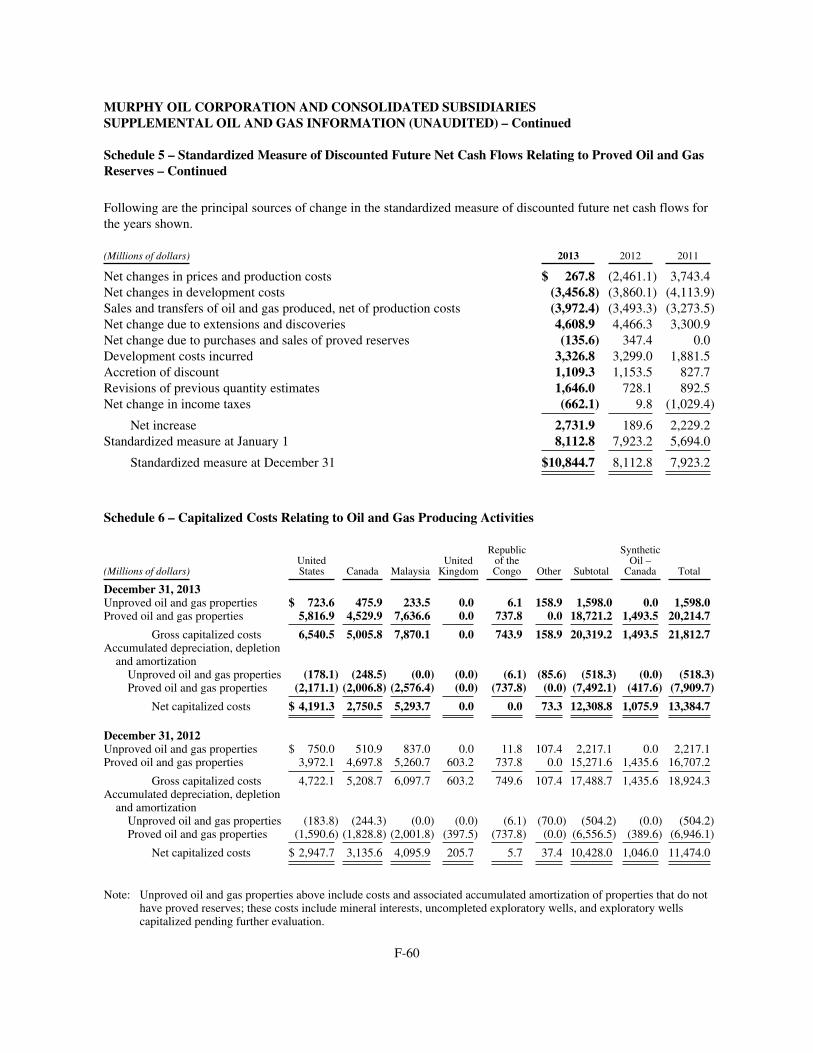
MURPHY OIL CORPORATION AND CONSOLIDATED SUBSIDIARIESSUPPLEMENTAL OIL AND GAS INFORMATION (UNAUDITED) – Continued
Schedule 5 – Standardized Measure of Discounted Future Net Cash Flows Relating to Proved Oil and GasReserves – Continued
Following are the principal sources of change in the standardized measure of discounted future net cash flows forthe years shown.
(Millions of dollars) 2013 2012 2011
Net changes in prices and production costs $ 267.8 (2,461.1) 3,743.4Net changes in development costs (3,456.8) (3,860.1) (4,113.9)Sales and transfers of oil and gas produced, net of production costs (3,972.4) (3,493.3) (3,273.5)Net change due to extensions and discoveries 4,608.9 4,466.3 3,300.9Net change due to purchases and sales of proved reserves (135.6) 347.4 0.0Development costs incurred 3,326.8 3,299.0 1,881.5Accretion of discount 1,109.3 1,153.5 827.7Revisions of previous quantity estimates 1,646.0 728.1 892.5Net change in income taxes (662.1) 9.8 (1,029.4)
Net increase 2,731.9 189.6 2,229.2Standardized measure at January 1 8,112.8 7,923.2 5,694.0
Standardized measure at December 31 $10,844.7 8,112.8 7,923.2
Schedule 6 – Capitalized Costs Relating to Oil and Gas Producing Activities
(Millions of dollars)UnitedStates Canada Malaysia
UnitedKingdom
Republicof theCongo Other Subtotal
SyntheticOil –Canada Total
December 31, 2013Unproved oil and gas properties $ 723.6 475.9 233.5 0.0 6.1 158.9 1,598.0 0.0 1,598.0Proved oil and gas properties 5,816.9 4,529.9 7,636.6 0.0 737.8 0.0 18,721.2 1,493.5 20,214.7
Gross capitalized costs 6,540.5 5,005.8 7,870.1 0.0 743.9 158.9 20,319.2 1,493.5 21,812.7Accumulated depreciation, depletionand amortizationUnproved oil and gas properties (178.1) (248.5) (0.0) (0.0) (6.1) (85.6) (518.3) (0.0) (518.3)Proved oil and gas properties (2,171.1) (2,006.8) (2,576.4) (0.0) (737.8) (0.0) (7,492.1) (417.6) (7,909.7)
Net capitalized costs $ 4,191.3 2,750.5 5,293.7 0.0 0.0 73.3 12,308.8 1,075.9 13,384.7
December 31, 2012Unproved oil and gas properties $ 750.0 510.9 837.0 0.0 11.8 107.4 2,217.1 0.0 2,217.1Proved oil and gas properties 3,972.1 4,697.8 5,260.7 603.2 737.8 0.0 15,271.6 1,435.6 16,707.2
Gross capitalized costs 4,722.1 5,208.7 6,097.7 603.2 749.6 107.4 17,488.7 1,435.6 18,924.3Accumulated depreciation, depletionand amortizationUnproved oil and gas properties (183.8) (244.3) (0.0) (0.0) (6.1) (70.0) (504.2) (0.0) (504.2)Proved oil and gas properties (1,590.6) (1,828.8) (2,001.8) (397.5) (737.8) (0.0) (6,556.5) (389.6) (6,946.1)
Net capitalized costs $ 2,947.7 3,135.6 4,095.9 205.7 5.7 37.4 10,428.0 1,046.0 11,474.0
Note: Unproved oil and gas properties above include costs and associated accumulated amortization of properties that do nothave proved reserves; these costs include mineral interests, uncompleted exploratory wells, and exploratory wellscapitalized pending further evaluation.
F-60
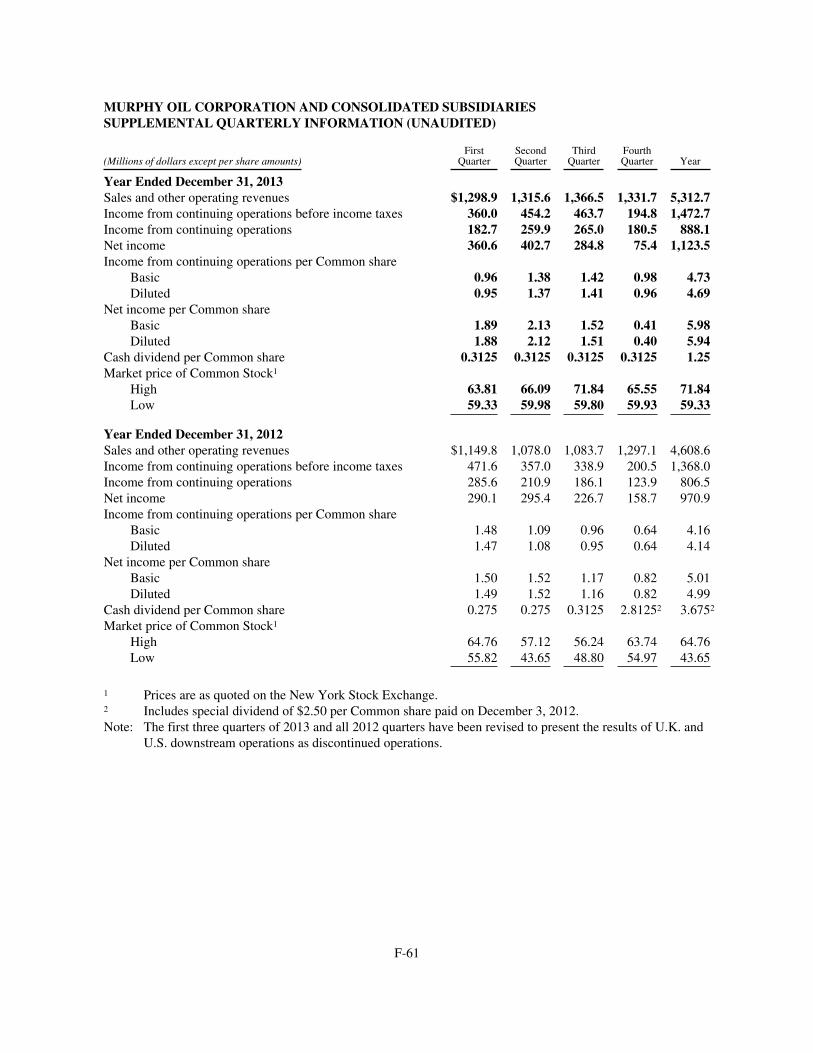
MURPHY OIL CORPORATION AND CONSOLIDATED SUBSIDIARIESSUPPLEMENTAL QUARTERLY INFORMATION (UNAUDITED)
(Millions of dollars except per share amounts)First
QuarterSecondQuarter
ThirdQuarter
FourthQuarter Year
Year Ended December 31, 2013Sales and other operating revenues $1,298.9 1,315.6 1,366.5 1,331.7 5,312.7Income from continuing operations before income taxes 360.0 454.2 463.7 194.8 1,472.7Income from continuing operations 182.7 259.9 265.0 180.5 888.1Net income 360.6 402.7 284.8 75.4 1,123.5Income from continuing operations per Common share
Basic 0.96 1.38 1.42 0.98 4.73Diluted 0.95 1.37 1.41 0.96 4.69
Net income per Common shareBasic 1.89 2.13 1.52 0.41 5.98Diluted 1.88 2.12 1.51 0.40 5.94
Cash dividend per Common share 0.3125 0.3125 0.3125 0.3125 1.25Market price of Common Stock1
High 63.81 66.09 71.84 65.55 71.84Low 59.33 59.98 59.80 59.93 59.33
Year Ended December 31, 2012Sales and other operating revenues $1,149.8 1,078.0 1,083.7 1,297.1 4,608.6Income from continuing operations before income taxes 471.6 357.0 338.9 200.5 1,368.0Income from continuing operations 285.6 210.9 186.1 123.9 806.5Net income 290.1 295.4 226.7 158.7 970.9Income from continuing operations per Common share
Basic 1.48 1.09 0.96 0.64 4.16Diluted 1.47 1.08 0.95 0.64 4.14
Net income per Common shareBasic 1.50 1.52 1.17 0.82 5.01Diluted 1.49 1.52 1.16 0.82 4.99
Cash dividend per Common share 0.275 0.275 0.3125 2.81252 3.6752
Market price of Common Stock1
High 64.76 57.12 56.24 63.74 64.76Low 55.82 43.65 48.80 54.97 43.65
1 Prices are as quoted on the New York Stock Exchange.2 Includes special dividend of $2.50 per Common share paid on December 3, 2012.Note: The first three quarters of 2013 and all 2012 quarters have been revised to present the results of U.K. and
U.S. downstream operations as discontinued operations.
F-61
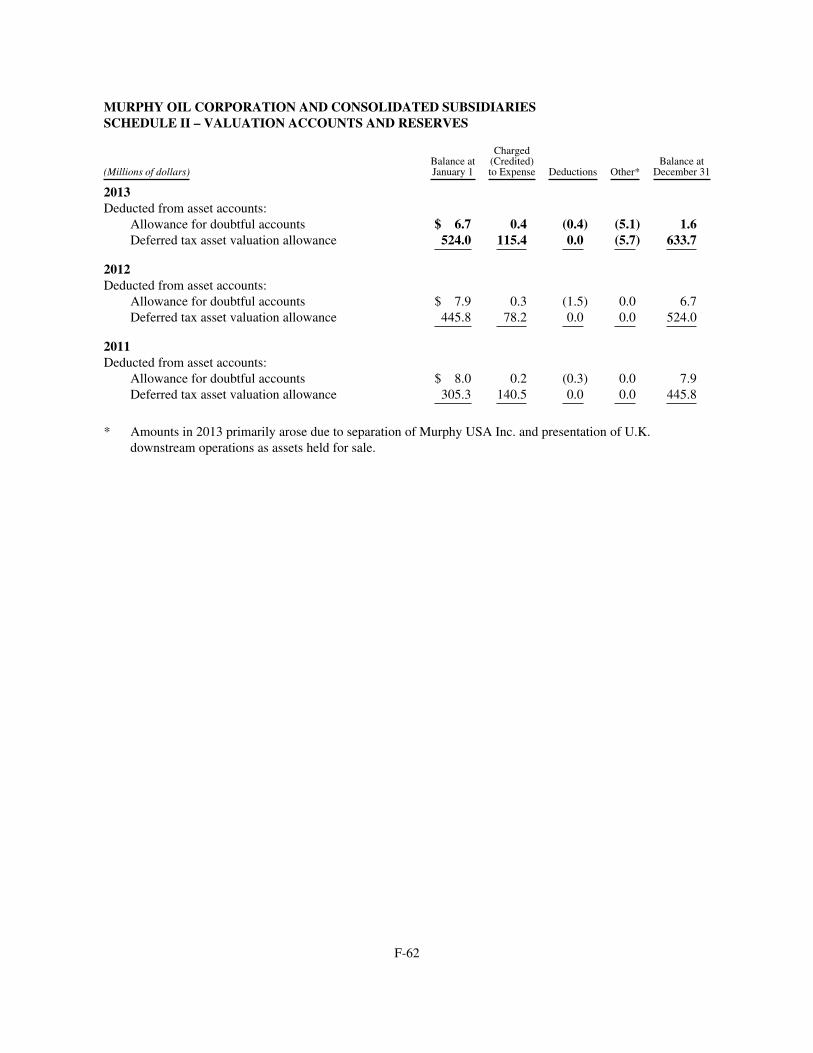
MURPHY OIL CORPORATION AND CONSOLIDATED SUBSIDIARIESSCHEDULE II – VALUATION ACCOUNTS AND RESERVES
(Millions of dollars)Balance atJanuary 1
Charged(Credited)to Expense Deductions Other*
Balance atDecember 31
2013Deducted from asset accounts:
Allowance for doubtful accounts $ 6.7 0.4 (0.4) (5.1) 1.6Deferred tax asset valuation allowance 524.0 115.4 0.0 (5.7) 633.7
2012Deducted from asset accounts:
Allowance for doubtful accounts $ 7.9 0.3 (1.5) 0.0 6.7Deferred tax asset valuation allowance 445.8 78.2 0.0 0.0 524.0
2011Deducted from asset accounts:
Allowance for doubtful accounts $ 8.0 0.2 (0.3) 0.0 7.9Deferred tax asset valuation allowance 305.3 140.5 0.0 0.0 445.8
* Amounts in 2013 primarily arose due to separation of Murphy USA Inc. and presentation of U.K.downstream operations as assets held for sale.
F-62
GLOSSARY OF TERMS
3D seismic
three-dimensional images created by bouncing soundwaves off underground rock formations that are usedto determine the best places to drill for hydrocarbons
bitumen or oil sands
tar-like hydrocarbon-bearing substance that occursnaturally in certain areas at the Earth’s surface or atrelatively shallow depths and which can berecovered, processed and upgraded into a light, sweetsynthetic crude oil
deepwater
offshore location in greater than 1,000 feet of water
downstream
refining and marketing operations
dry hole
an unsuccessful exploration well that is plugged andabandoned, with associated costs written off toexpense
exploratory
wildcat and delineation, e.g., exploratory wells
hydrocarbons
organic chemical compounds of hydrogen and carbonatoms that form the basis of all petroleum products
synthetic oil
a light, sweet crude oil produced by upgradingbitumen recovered from oil sands
throughput
average amount of raw material processed in a givenperiod by a facility
upstream
oil and natural gas exploration and productionoperations, including synthetic oil operation
wildcat
well drilled to target an untested or unprovedgeologic formation
F-63

[THIS PAGE INTENTIONALLY LEFT BLANK]

[THIS PAGE INTENTIONALLY LEFT BLANK]
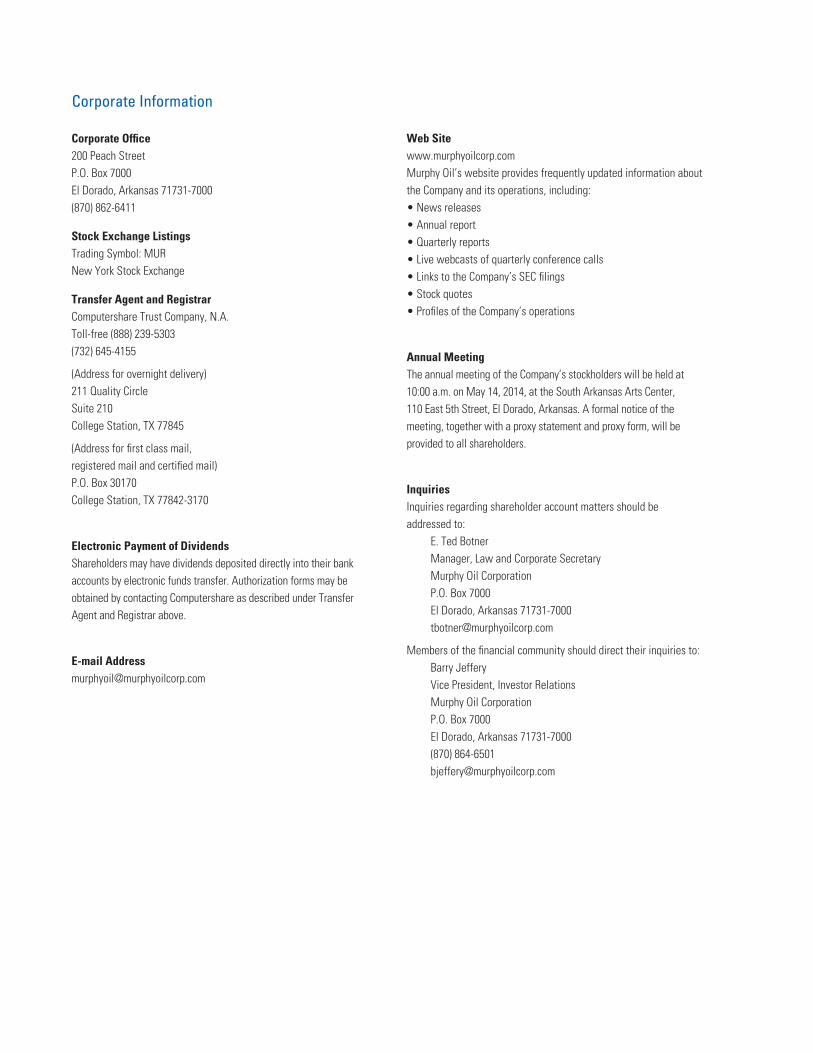
Corporate Information
Corporate Office200 Peach StreetP.O. Box 7000El Dorado, Arkansas 71731-7000(870) 862-6411
Stock Exchange ListingsTrading Symbol: MURNew York Stock Exchange
Transfer Agent and RegistrarComputershare Trust Company, N.A.Toll-free (888) 239-5303(732) 645-4155
(Address for overnight delivery)211 Quality CircleSuite 210College Station, TX 77845
(Address for first class mail,registered mail and certified mail)P.O. Box 30170College Station, TX 77842-3170
Electronic Payment of DividendsShareholders may have dividends deposited directly into their bank accounts by electronic funds transfer. Authorization forms may be obtained by contacting Computershare as described under Transfer Agent and Registrar above.
E-mail [email protected]
Web Sitewww.murphyoilcorp.comMurphy Oil’s website provides frequently updated information about the Company and its operations, including:• News releases• Annual report• Quarterly reports• Live webcasts of quarterly conference calls• Links to the Company’s SEC filings• Stock quotes• Profiles of the Company’s operations
Annual MeetingThe annual meeting of the Company’s stockholders will be held at 10:00 a.m. on May 14, 2014, at the South Arkansas Arts Center, 110 East 5th Street, El Dorado, Arkansas. A formal notice of the meeting, together with a proxy statement and proxy form, will be provided to all shareholders.
InquiriesInquiries regarding shareholder account matters should be addressed to:
E. Ted BotnerManager, Law and Corporate SecretaryMurphy Oil CorporationP.O. Box 7000El Dorado, Arkansas [email protected]
Members of the financial community should direct their inquiries to:Barry JefferyVice President, Investor RelationsMurphy Oil CorporationP.O. Box 7000El Dorado, Arkansas 71731-7000(870) [email protected]

Corporate Office200 Peach StreetP.O. Box 7000El Dorado, Arkansas 71731-7000