municipal solid waste incineration (mswi) bottom ash ... · ii within the two-weeks co-supervision,...
TRANSCRIPT

Municipal solid waste incineration (MSWI) bottom ash -from waste to valueCitation for published version (APA):Tang, P. (2017). Municipal solid waste incineration (MSWI) bottom ash - from waste to value: characterization,treatments and application Eindhoven: Technische Universiteit Eindhoven
Document status and date:Published: 14/12/2017
Document Version:Publisher’s PDF, also known as Version of Record (includes final page, issue and volume numbers)
Please check the document version of this publication:
• A submitted manuscript is the version of the article upon submission and before peer-review. There can beimportant differences between the submitted version and the official published version of record. Peopleinterested in the research are advised to contact the author for the final version of the publication, or visit theDOI to the publisher's website.• The final author version and the galley proof are versions of the publication after peer review.• The final published version features the final layout of the paper including the volume, issue and pagenumbers.Link to publication
General rightsCopyright and moral rights for the publications made accessible in the public portal are retained by the authors and/or other copyright ownersand it is a condition of accessing publications that users recognise and abide by the legal requirements associated with these rights.
• Users may download and print one copy of any publication from the public portal for the purpose of private study or research. • You may not further distribute the material or use it for any profit-making activity or commercial gain • You may freely distribute the URL identifying the publication in the public portal.
If the publication is distributed under the terms of Article 25fa of the Dutch Copyright Act, indicated by the “Taverne” license above, pleasefollow below link for the End User Agreement:
www.tue.nl/taverne
Take down policyIf you believe that this document breaches copyright please contact us at:
providing details and we will investigate your claim.
Download date: 18. Mar. 2019
Municipal solid waste incineration (MSWI)
bottom ash - from waste to value
Characterization, treatments and application
Pei Tang

De promotiecommissie is als volgt samengesteld:
Voorzitter: Prof. ir. E.S.M. Nelissen
Promotor: Prof. dr. ir. H.J.H. Brouwers
Co-promotor: Dr. Dipl. Eng. M.V.A. Florea
Leden: Prof. dr. H. Justnes (Norwegian University of Science and
Technology)
Prof. dr. W. Chen (Wuhan University of Technology)
Prof. dr. dr. H. Pöllmann (Martin Luther University of Halle-
Wittenberg)
Prof. dr. ir. N. De Belie (Ghent University)
Prof. dr. ir. D.M.J. Smeulders
CIP-DATA LIBRARY TECHNISCHE UNIVERSITEIT EINDHOVEN
Municipal solid waste incineration (MSWI) bottom ash - from waste to value:
Characterization, treatments and application/ by Pei Tang
A catalogue record is available from the Eindhoven University of Technology Library
ISBN: 978-90-386-4386-1
Bouwstenen 234
NUR 955
Copyright © 2017 by Pei Tang
Ph.D. Thesis, Eindhoven University of Technology, the Netherlands
Cover design: Pei Tang
Cover photographs supplied by Attero b.v.
Printed by: ProefschriftMaken || Vianen
All rights reserved. No part of this publication may be reproduced in any form or by any
means without permission in writing form from the author.

Municipal solid waste incineration (MSWI) bottom ash - from waste to value
characterization, treatments and application
PROEFSCHRIFT
ter verkrijging van de graad van doctor aan de Technische Universiteit Eindhoven, op gezag van de rector magnificus prof.dr.ir. F.P.T. Baaijens, voor een commissie aangewezen door het College voor Promoties, in het openbaar te verdedigen op donderdag 14 december 2017 om 14:00 uur
door
Pei Tang
geboren te Henan, China
Dit proefschrift is goedgekeurd door de promotoren en de samenstelling van de promotiecommissie is als volgt: voorzitter: prof.ir. E.S.M. Nelissen promotor: prof.dr.ir. H.J.H. Brouwers copromotor(en): dr.dipl.eng. M.V.A. Florea leden: prof.dr. H. Justnes (Norwegian University of Science
and Technology) prof.dr. W. Chen (Wuhan University of Technology) prof.dr.dr. H. Pöllmann (Martin Luther University of Halle-Wittenberg) prof.dr.ir. N. De Belie (Ghent University) prof.dr.ir. D.M.J. Smeulders
Het onderzoek of ontwerp dat in dit proefschrift wordt beschreven is uitgevoerd in overeenstemming met de TU/e Gedragscode Wetenschapsbeoefening.

i
Preface
When I started to write the preface of this thesis, I felt one more step close to the end of
my PhD period, all the memory rushed into my mind. It feels like just happened on
yesterday, I cannot believe that I have left the Netherlands, the group and the University
for more than half-year already. I remember clearly the night when I arrived at Eindhoven,
the Netherlands, on 19th November 2011 and since then I studied and performed research
in the Building Materials group of prof.dr.ir. H.J.H. (Jos) Brouwers in Eindhoven
University of Technology until 31st, October 2016. It is a place where I stayed the longest
besides my hometown. During the five-year PhD journey, there were happiness, challenges,
struggles, pressure and motivations which fulfilled my life and work. To be honest, it was
not easy at all for me to go through this period, no matter in life or in work. I never thought
there would be that many challenges and difficulties to do research as a PhD candidate, it
was completely different from knowledge learning as a student. This period gives me an
impressive experience which will benefit the rest of my life. Fortunately, with the
accompany and encouragement from the colleagues, friends and families, I am still
motivated to try hard to reach the destination on pursuing a PhD degree. Therefore, I want
to express my sincere acknowledgement to all these people.
First of all, I want to express my great thanks to my supervisor and promoter, prof.dr.ir.
H.J.H. (Jos) Brouwers, who provided me the precious chance to join the Building Materials
group in Eindhoven University of Technology to do my PhD research. It was deeply
remembered in my mind of the first-time meeting in Wuhan in October 2010. How times
flies. During the five-years PhD study under your supervision, you have paid great effort,
time and energy to guide me how to be professional in research study. Your suggestions,
comments and discussions promote the finishing of PhD research and my thesis, many
thanks for your patience and help. I was so grateful that you spent such long time reading
my thesis carefully, even during your traveling in Wuhan; and the comments you provided
really improve the quality of my thesis. The discussion of the thesis page by page with you
in Wuhan was so valuable. Furthermore, thank you for recommending me to prof. Poon
Chi-sun in The Hong Kong Polytechnic University to continue my research after my PhD
contract finished in October 2016.
My thanks also go to my daily supervisor and co-promoter, dr.dipl. Eng. M.V.A. (Miruna)
Florea, for her effort and contribution during my PhD study. You have spent a lot of your
time correcting my English and leading me into the research field of solid wastes, which
significantly promotes the writing of my thesis. I can imagine that it was also not easy for
you to supervise me when I had little background about solid waste at the beginning.
Especially in the first year, I had so many questions to ask you and you were so patient to
explain. I really appreciate what you have done and contributed during my PhD period,
which has deep effect in my life. In addition, I would also like to thank dr. Qingliang Yu
and dr.ir. P. Spiesz, who once co-supervised me, even though it was a short duration.

ii
Within the two-weeks co-supervision, dr. Qingliang Yu helped to build up the first
complete version of my thesis outline, and the suggestion on way of thinking for doing
research really helped me a lot. Dr.ir. P. Spiesz gave very useful comments on the
modification of my paper draft which were finally accepted and published. With the help,
guidance, and suggestions from these three persons in daily work, I gained many useful
skills related to research work.
My great appreciation goes to the Promotion Committee, prof.dr. H. Justnes (Norwegian
University of Science and Technology), prof.dr. W. Chen (Wuhan University of
Technology), prof.dr.dr. H. Pöllmann (Martin Luther University of Halle-Wittenberg),
prof.dr.ir. N. De Belie (Ghent University), prof.dr.ir. D.M.J. Smeulders (Eindhoven
University of Technology) for accepting to be members in my PhD committee. Their
research outcomes and contributions in the fields of building materials and solid wastes
provide valuable information and guidance during my PhD research, and I am grateful to
have you as advisors in this stage.
I would also like to thank prof. Zhe’an Lu as my master supervisor and prof. dr. Wei Chen
in Wuhan University of Technology. It was prof. Lu who advised me to do PhD in abroad
and then brought me in contact with prof.dr.ir. H.J.H. (Jos) Brouwers, this suggestion
opened a door to contact with completely new things and world. The encouragement prof.
Lu have given motivated me to continue and overcame the difficulties I met in those years.
I really appreciate the attitude you always told me: be happy and it is the most important
thing in life. I start to understand what you mean and try to follow it to make life simple,
easier and joyful. The talks with prof.dr. Wei Chen each time when we met in the
Netherlands or Wuhan were so meaningful and enjoyable, I learned from you the manners
of dealing things in work and life, which are very helpful.
I also appreciate the financial support of the Chinese Scholarship Council (CSC) and the
sponsors of Building Materials group chaired by prof.dr.ir. H.J.H. (Jos) Brouwers in
Eindhoven University of Technology. Furthermore, I would like to thank the additional
support from Attero b.v. and Smals b.v., especially the partial financial and technical
support in the fifth year of my research. There was a very nice cooperation on the project
with Abdullah Cakir and Bas Nauts from Attero b.v., and Daphne Sijtsma, Maarten Smals
and Harry Kouwenhoven from Smals b.v. The kindly help from Abdullah, Daphne,
Maarten and Harry on the project significantly speeded up the finishing of my research on
pelletization of solid wastes, the relevant work and outcomes make up one of the important
parts of the thesis.
During my PhD research, all the technicians in the laboratory provided so much
professional help, guidance and suggestion making my experiments efficient and
successful, especially from ing. A.C.A. (Anneke) Delsing, H.L.W. (Harrie) Smulders,
G.A.H. (Geert-Jan) Maas, P.H. Cappon, ir. H.M. (Hans) Lamers, ing. M.A.C.M. (Martien)
iii
Ceelen, and ing. J.J.P. (Johan) van den Oever, who gave a lot of support in the lab in the
last year when I had so many samples to test every day.
The building Materials group is such as large and international group, and is moving
forwards rapidly under the leading of prof.dr.ir. H.J.H. (Jos) Brouwers. It is my great
honour to be one member of it, and spent five years with my colleagues. The time we spent
playing Frisbee and volleyball, charting at the coffee corner, sky bar and joining the
conference, is a great memory for me. I still remember the first group dinner organized in
my apartment, it was such a joyful party. These colleagues are: Alberto, Ariën, Arno, Azee,
Bo, Chris, Florent, Gang, George, Guillaume, Hoss, Kaja, Kate, Katerina, Katrin, Miruna,
Peipeng, Perry, Przemek, Qadeer, Qingliang, Rui, Štěpán, Veronica, Xu, Yuri, and
Zhengyao. I also want to thank our BPS secretaries: Ginny, Léontine and Moniek. I am
hoping to keep in touch with all of you in the future.
Part of this thesis work was finished with the assistance of the master student -
Tamizhselvan Munuswamy, thank you for your help in this research. I hope my supervision
was useful for your future career.
I would like to express my appreciations to all my friends in the Netherlands, Chinese and
the Mrs. ‘crazy’, with who we had travelled around Europe, played sports and had parties.
Some of you gave me a lot of support and encouragement when I was suffering, I appreciate
a lot. Due to the very long list, I will not mention all the names here, to all of you: thank
you so much and wish you all the best.
Finally, and the most importantly, my sincere thanks goes to my family, my parents and
brother, and my aunts and uncles. Thanks for always supporting and encouraging me to go
through the tough time in life, and being on my side. My every forward step and success,
as well as this thesis, I dedicate to you.
Pei Tang
September 2017
Hong Kong, China

v
Contents
Preface……………………………………………………………………………………………. i
1 Introduction ..............................................................................................................................1
1.1 Municipal solid waste (MSW) management ....................................................................1
1.2 Municipal solid waste incineration (MSWI) ....................................................................3
1.3 Mortar and concrete ..........................................................................................................3
1.4 Research aim and strategy ................................................................................................5
1.5 Outline of the Thesis ........................................................................................................5
2 Solid residues from MSWI and their management...................................................................9
2.1 Introduction ......................................................................................................................9
2.2 Two Waste-to-Energy (WtE) plants in the Netherlands .................................................10
2.2.1 The WtE plant process ............................................................................................10
2.3 The solid residues from MSWI ......................................................................................12
2.3.1 The incineration residues ........................................................................................12
2.3.2 The relevant research studies on MSWI bottom ash ..............................................13
2.4 Conclusions ....................................................................................................................22
3 The characterization of MSWI bottom ashes from two WtE plants* .....................................25
3.1 Introduction ....................................................................................................................25
3.2 Materials collection and test methods ............................................................................25
3.2.1 Materials collection ................................................................................................25
3.2.2 Test methods ...........................................................................................................26
3.3 Characterization of MSWI bottom ashes ........................................................................30
3.3.1 Physical properties ..................................................................................................30
3.3.2 Chemical properties ................................................................................................32
3.3.3 Application potential in mortar ...............................................................................37
3.3.4 The influence of milled fine bottom ashes (MF-BA) on cement hydration ...........39
3.3.5 Leaching behaviour evaluation of MSWI bottom ashes .........................................42
3.4 Conclusions and recommendations ................................................................................46
4 Thermally activated MF-BA applied as binder substitute* ....................................................49
4.1 Introduction ....................................................................................................................49
4.2 Materials and methods ....................................................................................................50

vi
4.2.1 Materials and treatments .........................................................................................50
4.2.2 Analysis of material properties ...............................................................................51
4.2.3 Hydration properties study .....................................................................................52
4.2.4 Mechanical strength of mortar samples ..................................................................52
4.2.5 Leaching behaviour evaluation ...............................................................................52
4.3 Results and discussions ..................................................................................................52
4.3.1 Properties of materials ............................................................................................52
4.3.2 Hydration properties of bottom ash-cement mixes .................................................59
4.3.3 Mortar properties ....................................................................................................62
4.3.4 Leaching behaviour evaluation ...............................................................................65
4.4 Conclusions ....................................................................................................................66
5 Binding capacity of blended binders on contaminants in fine bottom ash (F-BA)* ..............69
5.1 Introduction ....................................................................................................................69
5.2 Materials and methods ....................................................................................................69
5.2.1 Materials .................................................................................................................69
5.2.2 Experimental procedure ..........................................................................................70
5.3 Washing treatment ..........................................................................................................71
5.4 Hydration of blended binders with NaCl and waste water from washing F-BA ............74
5.4.1 Hydration development of blended binders with NaCl ..........................................74
5.4.2 Hydration development of blended binders with waste water ................................76
5.5 Mortars with NaCl and the chloride binding capacity ....................................................78
5.6 Mortars with blended binders, F-BA and MF-BA..........................................................80
5.6.1 Strength development of mortars ...........................................................................80
5.6.2 Leaching behaviours evaluation of mortar containing bottom ashes .....................81
5.7 Conclusions ....................................................................................................................82
6 Employing cold bonded pelletization to recycle incineration fine bottom ash* .....................85
6.1 Introduction ....................................................................................................................85
6.2 Materials and methods ....................................................................................................87
6.2.1 Materials .................................................................................................................87
6.2.2 Cold bonded lightweight aggregate (CBLA) manufacture and characterization....88
6.3 Results and discussion ....................................................................................................90

vii
6.3.1 Integral recycling of F-BA by cold bonded pelletization .......................................90
6.3.2 Aggregate characteristics ........................................................................................96
6.3.3 Concrete properties with CBLAs .........................................................................102
6.3.4 Leaching behaviour evaluation of CBLAs ...........................................................103
6.4 Conclusions ..................................................................................................................105
7 Influence of raw material combinations on CBLA properties* ............................................107
7.1 Introduction ..................................................................................................................107
7.2 Materials and methodology ..........................................................................................107
7.3 Results and discussion ..................................................................................................108
7.3.1 Aggregate properties improvement ......................................................................108
7.3.2 Leaching behaviour evaluation of CBLAs ...........................................................116
7.4 Conclusions ..................................................................................................................123
8 The environmental properties and durability of concrete incorporating CBLAs* ...............125
8.1 Introduction ..................................................................................................................125
8.2 Materials and experimental methods ............................................................................125
8.2.1 Production of CBLAs and their properties ...........................................................125
8.2.2 Concrete mixture design and test ..........................................................................126
8.2.3 Leaching behaviour evaluation of F-BA, CBLAs and concrete ...........................128
8.3 Results and discussions ................................................................................................129
8.3.1 Properties of fresh concrete ..................................................................................129
8.3.2 Properties of hardened concrete ...........................................................................133
8.3.3 Durability properties of hardened concrete ..........................................................135
8.3.4 Leaching behaviour evaluation of hardened concrete ..........................................138
8.4 Conclusions ..................................................................................................................143
9 Leachability study of F-BA and cementitious immobilization .............................................145
9.1 Introduction ..................................................................................................................145
9.2 Leachability related to treatment and application purpose ...........................................145
9.2.1 Thermal treatment and binder substitute ..............................................................145
9.2.2 Washing treatment and sand replacement with blended binders ..........................147
9.2.3 Aggregate production with blended binders/cementitious materials ....................152
9.2.4 Application in concrete in the form of CBLAs ....................................................153
viii
9.3 Conclusions ..................................................................................................................155
10 Conclusions and recommendations ......................................................................................157
10.1 Conclusions ..................................................................................................................157
10.1.1 Stability of MSWI bottom ash properties .............................................................157
10.1.2 Application potential of F-BA ..............................................................................158
10.1.3 Treatments on F-BA .............................................................................................159
10.1.4 Integral recycling of F-BA ...................................................................................160
10.1.5 Contaminant leachability of F-BA regarding treatments and application ............160
10.2 Recommendations for future research ..........................................................................161
Bibliography .................................................................................................................................165
List of abbreviations and symbols ................................................................................................183
Appendix A ..................................................................................................................................187
Appendix B ...................................................................................................................................191
Summary ......................................................................................................................................193
List of publications .......................................................................................................................195
Curriculum vitae ...........................................................................................................................197

Chapter 1 1
Chapter 1
1 Introduction
1.1 Municipal solid waste (MSW) management
Municipal solid waste (MSW) is a type of wastes consisting of daily items discarded as
unwanted matter from human activities, which can be generally divided into several
categories according to its source - domestic solid waste from households and public areas,
commercial solid waste from restaurants, offices, and markets, etc., and industrial solid
waste, such as sewage sludge from wastewater treatment plants and construction and
demolition waste (CDW) (GovHK, 2015; Shekdar, 2009). Generally, the MSW consists of
a compostable fraction (such as food waste), a combustible fraction (such as glass, plastics,
paper and textiles), an inert fraction (such as stones, metals, glass and ceramics), as well as
a water content which normally exists in the compostable fraction (Preda, 2007). The
disposal of these solid wastes and their management have drawn attention widely, and
awareness on the development of systematic recycling of these solid wastes has been risen
recent years all over the word due to the following reasons. Firstly, these wastes contain
recyclable materials, such as plastic, metals, etc. The direct disposal or landfill of these
wastes is a wasting of potential resources to a certain extent. Secondly, the improper
management of these wastes may cause the pollution of the natural environment, soil and
water, etc., and consequently harm human beings. Thirdly but not last, the cost for the
remediation of the pollution or unexpected damage of environment related to the waste
disposal can be reduced significantly. Hence, proper waste management is of great need.
In the Netherlands, pre-separations of glass, paper and plastic wastes are required by the
government and then well conducted by the householders before they dispose their
household wastes, which significantly enlarges the recycling of reusable resource. Some
organic wastes are used for generating biogas through anaerobic digestion or gasification
technology (EBA, 2017), and some wastes containing heavy metals which are harmful to
environment are treated or sent for landfill, etc. The left municipal solid wastes are then
sent to the relevant plants for further treatment and recycling in proper ways, such as being
incinerated, which will be addressed in Section 1.2.
Regarding the management of the MSW, the main guiding principle is reduce, reuse and
recycle (3R) which became executed gradually since the 20th century in European countries
(Preda, 2007). Due to the early and fast development of the economy and then lack of
resource and space in many European countries, the waste management system also has
been first developed in EU countries (EPA, 2017; EEA, 2013). The way of managing these
wastes includes landfill, composting, incineration, etc. The main management types of

2 Chapter 1
solid wastes in the 28 EU member states since 1995 to 2015 were collected and published,
and the changes of managements have been summarized and shown in Figure 1.1 (Eurostat,
2017). It depicts that landfilling was the dominant way to manage these solid in 1995 in
these countries, however, this is in continuous decrease since then, while the incineration
and composing as waste management have a dramatic increase, with a great growth of
recycling of wastes. As landfilling of solid wastes can only store waste temporarily,
meanwhile, the generation of harmful gas and leachate also generates secondary pollution
to the surroundings (Calder & Stark, 2010). Moreover, the land space in most countries is
limited, such as in many EU countries, and also in Singapore, Japan, Hong Kong, etc.
Hence, the landfilling of wastes is generally avoided, only used when there is no other
option (Karanjekar et al., 2015). Beside landfilling, the wastes containing high organic
content could be treated through waste composting technique, which is a biological process
mainly used to deal with organic wastes for anaerobic or aerobic decomposition and the
resulted product can be used as soil fertilizer (Soares et al., 2016; Woon & Lo, 2016; Zhang
et al., 2013), or co-generated biogas which can be used as fuel.
Figure 1.1: Municipal waste treatments in 1995-2015 (Eurostat, 2017)
The recycling of solid wastes is a direct way to minimize their amount and cost spent on
the solid waste management, which meanwhile could enlarge the resource conservation.
The recyclable wastes include glass and metals (Kaya, 2016), plastics (Pivnenko et al.,
2016; Vazquez & Barbosa, 2016), paper (Pivnenko et al., 2015), etc. and relevant sorting
techniques (Gundupalli et al., 2017) are developed in order to recycle these wastes
effectively, which on one hand enlarge the recycling level, and on the other hand reduce
the labour needed, especially for developed countries.
The incineration of MSW is used widely nowadays as a waste-to-energy (WtE) technique,
and is well developed, particularly in developed countries. The MSW incineration (MSWI)
can reduce the volume and mass of solid wastes by around 80-90% which reduce the need
for landfill significantly; moreover, heat can be generated during the incineration process
0
50
100
150
200
250
300
350
400
450
500
550
19
95
19
96
19
97
19
98
19
99
20
00
20
01
20
02
20
03
20
04
20
05
20
06
20
07
20
08
20
09
20
10
20
11
20
12
20
13
20
14
20
15
kg
/ca
pit
al
Landfill Incineration Recycling Composting Other
Chapter 1 3
which can be used to produce electricity (Brunner & Rechberger, 2015). The MSWI is
adapted as a dominant treatment of solid waste in most of the developed countries, and in
recent years, in the developing countries as well (Abd Kadir et al., 2013; Li et al., 2015). It
was reported that the number of incinerators is around 220 in mainland China until 2015,
which has increased by 1.4 times since 2009 (NBS, 2015).
1.2 Municipal solid waste incineration (MSWI)
As mentioned above, MSW incineration (MSWI) is widely used and is considered as an
effective way to deal with the municipal solid wastes on reducing waste mass and volume.
In addition, during the incineration of MSW, energy in the form of heat is produced which
can be used for heating or electricity production; hence, MSWI is also called Waste-to-
Energy (WtE) technique. However, it is not a complete win-to-win strategy due to the
generation of the by-products in the incineration plants, such as MSWI bottom ash, fly ash,
air pollution control ash, etc. (Van der Sloot et al., 2001). As shown in Figure 1.1, the
number of incinerators is increasing in developed countries; similar trend is now found in
developing countries (NBS, 2015), and the importance of MSWI also generated increasing
awareness in recent years in developing countries. Subsequently, the amount of
incineration residues grows dramatically and the management of these by-products is
becoming a challenge on the sustainable development of resources and energy.
The Netherlands is far ahead on the municipal solid waste management and incineration
system, where MSWI residues are classified according to its national legislation (SQD-Soil
Quality Decree, 2013) based on its leaching behaviours and requirements of environmental
protection. Moreover, the residues are disposed in proper ways, such as landfilling or using
in road base. The MSWI bottom ash as the dominating by-product in WtE plants is mainly
used in road base covered with the isolation layers to avoid its pollution potential to the
surrounding environment (Born & Veelenturf, 1997). However, the intensively recycling
and use of MSWI residues are in great demand nowadays, especially in the Netherlands.
This is attributed to the raising awareness of environmental protecting and circular
development of resources, particularly in developed countries. Hence, in the Netherlands,
the government is promoting the further research on the MSWI residues for better
application and deeper recycling by increasing the tax fee for landfilling of solid wastes
and eventually forbidding landfill completely; meanwhile, a ‘greendeals’ (GD 076, 2010)
program was established to help the implement of the sustainable plans. Therefore, an
intensive research on the MSWI bottom ash is started on the purpose of its further recycling
and application than the current low-grade way.
1.3 Mortar and concrete
Mortar and concrete are composite materials consist cementitious binders, additives and
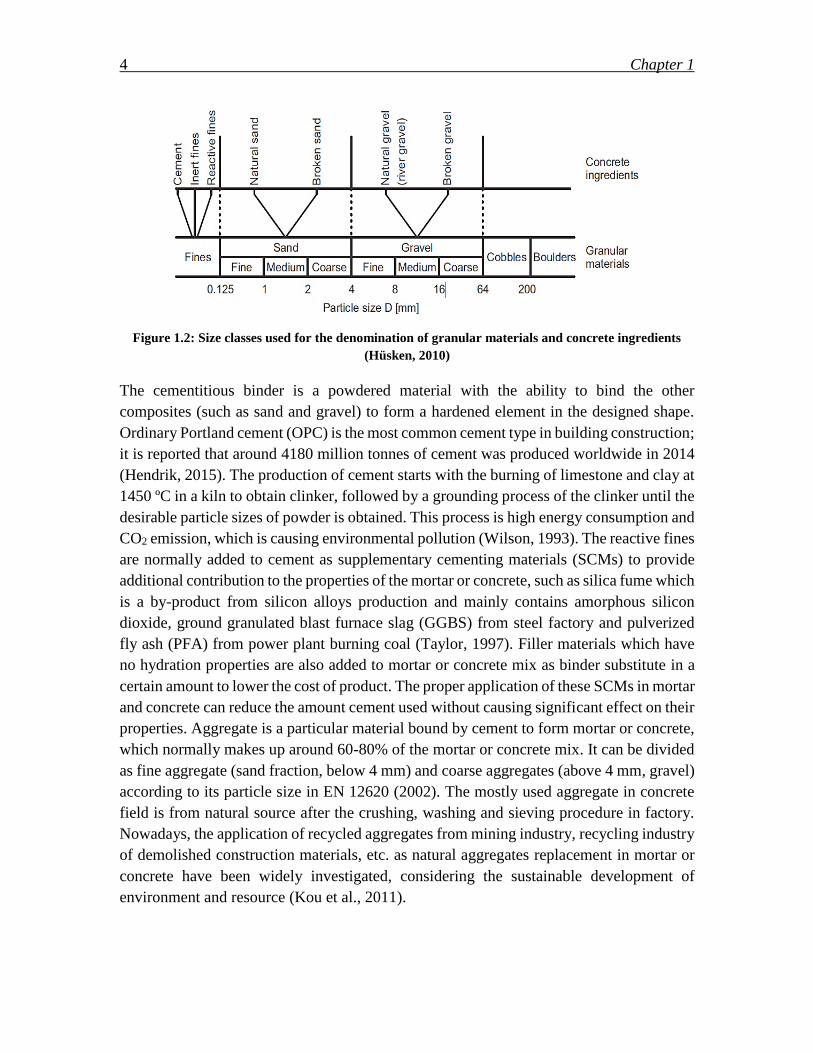
aggregates, and are widely used for construction elements (Sandor, 1992). Figure 1.2 shows
the ingredients used for concrete and their size classifications (Hüsken, 2010).
4 Chapter 1
Figure 1.2: Size classes used for the denomination of granular materials and concrete ingredients
(Hüsken, 2010)
The cementitious binder is a powdered material with the ability to bind the other
composites (such as sand and gravel) to form a hardened element in the designed shape.
Ordinary Portland cement (OPC) is the most common cement type in building construction;
it is reported that around 4180 million tonnes of cement was produced worldwide in 2014
(Hendrik, 2015). The production of cement starts with the burning of limestone and clay at
1450 ºC in a kiln to obtain clinker, followed by a grounding process of the clinker until the
desirable particle sizes of powder is obtained. This process is high energy consumption and
CO2 emission, which is causing environmental pollution (Wilson, 1993). The reactive fines
are normally added to cement as supplementary cementing materials (SCMs) to provide
additional contribution to the properties of the mortar or concrete, such as silica fume which
is a by-product from silicon alloys production and mainly contains amorphous silicon
dioxide, ground granulated blast furnace slag (GGBS) from steel factory and pulverized
fly ash (PFA) from power plant burning coal (Taylor, 1997). Filler materials which have
no hydration properties are also added to mortar or concrete mix as binder substitute in a
certain amount to lower the cost of product. The proper application of these SCMs in mortar
and concrete can reduce the amount cement used without causing significant effect on their
properties. Aggregate is a particular material bound by cement to form mortar or concrete,
which normally makes up around 60-80% of the mortar or concrete mix. It can be divided
as fine aggregate (sand fraction, below 4 mm) and coarse aggregates (above 4 mm, gravel)
according to its particle size in EN 12620 (2002). The mostly used aggregate in concrete
field is from natural source after the crushing, washing and sieving procedure in factory.
Nowadays, the application of recycled aggregates from mining industry, recycling industry
of demolished construction materials, etc. as natural aggregates replacement in mortar or
concrete have been widely investigated, considering the sustainable development of
environment and resource (Kou et al., 2011).
Chapter 1 5
1.4 Research aim and strategy
Currently, studies on MSWI residues are widely reported; however, the research is mainly
focused on the coarse fraction including treatments and applications, while the fine
fractions which have more issues are not so thoroughly investigated. The aim of this study
is to have a systematic and in-depth study on the MSWI bottom ash from two WtE plants
in the Netherlands, especially the fine fraction (0-2 mm), and to find a proper recycling
way based on its application purpose as ingredients of building materials (such as binder,
sand, gravel, etc.). The main work is divided into the following steps:
(1) The stability of MSWI bottom ash properties are evaluated by analysing 7 years’
historical data.
(2) The potential application fields for MSWI fine bottom ash are estimated
experimentally.
(3) Treatments on MSWI fine bottom ash are carried out focusing on increasing its
reactivity and reducing its leaching properties.
(4) The integral recycling of MSWI fine bottom ash combining of its application and
treatment are investigated.
Eventually, the integral treatments on MSWI fine bottom ash on the purposes of improving
its mechanic properties and reducing its negative environmental impact are provided, and
a granular artificial lightweight aggregate using MSWI fine bottom ash is produced which
can be used as supplementary aggregates in concrete. Subsequently, a closed recycling loop
of MSWI fine bottom ash is obtained.
1.5 Outline of the Thesis
To conduct an in-depth and systematic study on the MSWI bottom ashes from WtE plants
in the Netherlands for guiding their application in future, several series of experimental
work have been carried out, including the characterization, treatments and application of
MSWI bottom ash. Subsequently, part of this thesis focuses on the small MSWI bottom
ash fraction (0-2 mm), which has more issue compared with big MSWI bottom ash fraction.
The relevant research results are summarized and presented in this thesis, and the research
outline is shown in Figure 1.3. An explanation of the content in each chapter is given in the
following paragraphs.
Chapter 2 summaries the research studies which have been performed on municipal solid
waste (MSWI) bottom ash, including characteristics, treatments and application conditions
in the construction field. Moreover, the two waste-to-energy plants involved in this
research are described.
Chapter 3 describes the experimental methods used in this study for the characterization of
the MSWI bottom ashes, including particle size distribution (PSD), water content and water
absorption, densities, loss on ignition (LOI), metal content determination, as well as tests

6 Chapter 1
for determination of chemical properties, such as chemical composition by X-ray
fluorescence (XRF) and crystalline phases detection by X-ray diffraction (XRD). The
environmental impact of the MSWI bottom ashes were evaluated by column leaching test
according to the Dutch standards NEN 7383 (2004) and 7 years’ leaching data on MSWI
bottom ashes are collected and summarized. The fine MSWI bottom ashes are used as sand
and binder replacement in mortar. The aim of this chapter is to evaluate the stability of the
properties of the MSWI bottom ashes from the two WtE plants and to estimate the
application potential of fine bottom ashes in mortars.
Chapter 4 presents the thermal treatment on fine MSWI bottom ash combined with low
speed milling. The treated fine bottom ashes are used as binder substitute in mortars. Then,
the influence of the treated fine bottom ashes on the binder hydration are evaluated. The
leaching properties of the treated fine bottom ashes are estimated and compared with the
Dutch legislation. The aim of this chapter is to investigate the influence of thermal
treatment on the fine bottom ash with regard to increasing activity, separating metallic
aluminium and improving leaching properties.
Chapter 5 shows the leaching behaviour of fine bottom ash originally and after milling into
powder. The binding capacity of blended binders (Ordinary Portland cement, ground
granulate blast furnace slag, and coal fly ash) of chlorides and heavy metals are investigated.
This can be divided into two parts: (1) the binding capacity of chloride from adding NaCl
in mortars or binder pastes; (2) the binding capacity of blended binder in mortars when fine
bottom ash is used as sand. The main aim of this chapter is to qualify and quantify the
leaching behaviours of bottom ash regarding its application purposes and the bind capacity
of blended binders on fine bottom ash during its application in mortars.
Chapter 6 describes an integral method to recycle fine MSWI bottom ash, in combination
of the other industrial solid wastes through a pelletizing technique. As a trial study, the
compatibility of using mixed industrial solid wastes to produce cold bonded artificial
aggregates (CBLAs) by pelletization is investigated. The aim of this chapter is to evaluate
the possibility of recycling fine MSWI bottom ash by pelletization combined with the
function of stabilization of binders.
Chapter 7 addresses several methods to improve the properties of the produced CBLAs.
The parameters including binder content, industrial solid wastes combinations, fibre
reinforcement, etc. on the CBLAs’ properties are evaluated. Finally, CBLA with higher
crushing resistance and lower bulk density can be obtained.
Chapter 8 shows the concrete properties containing CBLAs. Three types of CBLAs are
used as natural aggregate replacement in self compacting concrete, and the fresh and
hardened properties of the concretes are tested. The influence of CBLAs on the durability
of concretes are evaluated using freeze thaw resistance tests.

Chapter 1 7
Chapter 1: Introduction
Chapter 2: Literature review on solid waste management
Case study of Waste-to-Energy plants in NL
Chapter 3: Characterization of MSWI bottom ashes from two WtE plants
Chapter 10: Conclusions and recommendations
Treatments on fine MSWI bottom ash
Chapter 4: Thermal treatment on
fine MSWI bottom ashes and
application as binder substitute
Chapter 5: Binding capacity of blended
binders on fine MSWI bottom ashes applied
as aggregate in mortar
Treatments on fine MSWI bottom ash
Chapter 4: Thermal treatment on
fine MSWI bottom ashes and
application as binder substitute
Chapter 5: Binding capacity of blended
binders on fine MSWI bottom ashes applied
as aggregate in mortar
Integral recycling of fine MSWI bottom ash for artificial aggregates production
Chapter 7: Improvement of cold bonded
lightweight aggregates produced from fine
MSWI bottom ash and industrial solid wastes
Chapter 6: Integral recycling of fine MSWI
bottom ashes by pelletizing technique with
other industrial solid wastes
Chapter 8: Application of artificial cold bonded lightweight
aggregates in self-compacting concrete
Chapter 9: Leachability of contaminants regarding treatments and applications
Chapter 1: Introduction
Chapter 2: Literature review on solid waste management
Case study of Waste-to-Energy plants in NL
Chapter 3: Characterization of MSWI bottom ashes from two WtE plants
Chapter 10: Conclusions and recommendations
Treatments on fine MSWI bottom ash
Chapter 4: Thermal treatment on
fine MSWI bottom ashes and
application as binder substitute
Chapter 5: Binding capacity of blended
binders on fine MSWI bottom ashes applied
as aggregate in mortar
Integral recycling of fine MSWI bottom ash for artificial aggregates production
Chapter 7: Improvement of cold bonded
lightweight aggregates produced from fine
MSWI bottom ash and industrial solid wastes
Chapter 6: Integral recycling of fine MSWI
bottom ashes by pelletizing technique with
other industrial solid wastes
Chapter 8: Application of artificial cold bonded lightweight
aggregates in self-compacting concrete
Chapter 9: Leachability of contaminants regarding treatments and applications
Figure 1.3: Outline of the thesis
Chapter 9 assesses the leachability of contaminants (Sb, Cu, Mo, chloride and sulphate) of
fine MSWI bottom ash, regarding the influence of treatments and application methods,
such as thermal and washing treatments, application as binder and sand replacement in
mortar, use for artificial aggregate production and application of artificial aggregates in
concrete.
Chapter 10 summarizes the conclusions of the current thesis and recommendations for
future research as continuation of the present work.


Chapter 2 9
Chapter 2
2 Solid residues from MSWI and their management
2.1 Introduction
In recent years, the Waste-to-Energy (WtE) technique in the form of incineration is
reported to be an efficient way to deal with the increasing amount of municipal solid wastes
(MSWs) worldwide (Leckner, 2015; Stehlík, 2009). The incineration reduces the mass and
volume of the solid waste dramatically (Wiles, 1996), thus the requirement for landfilling
is decreased (Bosmans et al., 2013). Moreover, energy in the form of heat, electricity, etc.
can be recovered from incineration (Cimpan & Wenzel, 2013), which can bring financial
benefits. Therefore, it is widely applied and used, especially in developed countries. More
and more municipal solid waste incinerators have been and are going to be built world-
wide, especially in developing countries where the generation of MSW had a rapid increase
in recent years. However, despite the benefits WtE bring, one of the downsides is the
considerable amount of solid residues generated, typically incineration bottom ash (IBA),
incineration fly ash (IFA), boiler ash, etc., of which IBA accounts for about 80% of the
total solid by-products in a WtE plant (Chimenos et al., 1999).
The traditional disposal method for these solid residues from incineration is landfilling,
during which the leachate and gas generation need to be monitored for environmental
protection (Klein et al., 2001). However, the disadvantages from the landfilling of
incineration residues are gradually getting attention. Firstly, the incineration residues
contain contaminants which are considered harmful when leaching into the environment
(Meima & Comans, 1999); secondly, the degradation of organic matter and the reaction of
metals in an alkaline environment may generate gas and eventually cause the expansion
and collapse of the landfill sites (Kowalski et al., 2016; He et al., 2015); thirdly, from the
sustainable development point of view, it is a waste of potential resource, due to the fact
that these residues have very similar properties as building materials, such as aggregates
(Van der Sloot et al., 2001); and last but not least, the available space for landfill is getting
less with the expansion of economic development all over the world, and governments are
trying to reduce landfilling by increasing tax and establishing new legislation (Abd Kadir
et al., 2013; Liu et al., 2015). For instance, the Dutch government is planning to prohibit
the landfilling of IBA completely by 2020, which means new disposal methods for the
incineration residues is urgent and necessary (Greendeals GD 076, 2010).
To explore the potential of better disposal methods, plenty of research studies have been
done on MSWI residues, including characterization, treatments and applications (Lam et
al., 2010). Moreover, the environmental legislation regarding the local requirement of each

10 Chapter 2
country has been established to limit the disposal of these incineration residues on behalf
of the environment and human health (Saner et al., 2011).
In this chapter, two WtE plants in the Netherlands, from which the MSW IBAs are obtained
in the following research study, are introduced and described briefly. Additionally, to have
an in-depth understanding of the current research status on incineration residues, the
research studies on MSWI residues, especially bottom ash (IBA), are summarized.
2.2 Two Waste-to-Energy (WtE) plants in the Netherlands
In this study, there are two WtE plants involved, which are located in Wijster and Moerdijk,
respectively, in the Netherlands. Figure 2.1 shows the procedure in a typical WtE. The WtE
plant in Wijster started to be in operation in 1996, and includes three parallel processing
lines with an annual capacity of around 800,000 tonnes of solid waste. The WtE plant in
Moerdijk is in operation since 1997 and the incinerator capacity is around 1,000,000 tonnes.
Differently from Moerdijk, the Wijster plant has the pre-separation of metals, paper and
plastic, while in Moerdijk, the solid waste is mixed and directly incinerated.
Figure 2.1: The schemic representation of WtE plants in Wijster (1:discharge hall; 2: coarse filling
bunker; 3&5: sieve drum; 4: air separator; 6: filling bunker; 7: inicineration boiler; 8: electro filter;
9: spary drier; 10: fabric filter; 11: acidic and neutral washers; 12: oxycat unit; 13: flue gas control;
14: air-cooled condenser; 15: turbine/generator (Attero b.v.)
2.2.1 The WtE plant process
• Pre-separation of raw solid wastes (only in Wijster)
The pre-treatment of the collected municipal solid waste starts with the size reduction using
rotating sieve drums with holes. The size of holes on the first drum is 190 mm; waste which
cannot pass through the holes is blown away by the air separator, so large non-recyclable
paper and plastic parts are removed from the waste and then are pressed into big cubes
which can be used as fuel for power plants and the cement industry.
The rest of the waste is send to the second drum which has 45 mm holes. There is a rotating
drum above the conveyor belt with steel pins called film separator; when the waste from
the sieve drum travels on the belt, soft plastics and plastic films can be taken out by the
pins. The hard and rigid plastic can be recognized by the infrared equipment fixed above
Chapter 2 11
the belt, which then sends a signal to the computer and the computer controls the action of
the blow nozzles at the end of the belt to blow the plastic out of the waste.
These plastics removed from the waste can be used as substitute fuel. The wet part passed
from the second drum mainly contains organic matter, sand, stone, and glass. The organic
part is sent to the fermentation plants for the generation of green gas and composting. The
residue of the waste is sent to the next bunker before being incinerated.
• Combustion and energy recovery
The waste is sent to the incinerator by the feeding tube, and air from the storage bunker is
pushed into the incinerator in order to reduce the smell in the WtE plants. After burning,
the material is transported into a container with water, in which the material is quenched
and slag can be removed from the material. After that, the quenched material is stored in
the bunker before the separation. The heat in the boiler produces high pressure steam which
is used for generating electricity. There are steel tubes around the wall of the boiler with
water running inside. The temperature of the boiler is between 1000 and 1300 ºC, which is
high enough to turn water into steam with high pressure and temperature because of the
closed system. This steam can pass through the turbine blades to generate electricity for
the company itself and the public. It can also be used for the heating of the nearby residents.
After the burning of the waste there is still solid matter left, called ash or slag. This material
is sent to the treatment of separating the ferrous and non-ferrous parts which can be reused
in the metal industry.
• Separation/recycling of metals from original IBA
The water-quenched bottom ash contains an unburned fraction, and ferrous and non-ferrous
fractions which need to be removed to upgrade the bottom ash. The quenched bottom ash
is stored for 6-8 weeks and then sent to the separation line. The material put on the moving
belt goes through a magnet which is fixed above the running belt, thus the ferrous fraction
in the material is removed and sent to storage before reuse. The belt sends the left material
to the eddy current separator to remove the non-ferrous fraction. After the separation of
ferrous and non-ferrous metals, the leftover bottom ash is much cleaner and contains fewer
metallic parts which are not wanted. The ferrous and non-ferrous materials are stored for
further use or sold to recycling companies.
• Flue gas and waste water cleaning
There are gas and waste water generated during the incineration procedure from the
incinerator and the cleaning of flue gas. They contain contaminants which can be harmful
to ground water and air, and therefore need to be cleaned before release back in the
environment. The flue gas from the incinerator is blown to the electrostatic filter, where
the dust in the gas can be picked up which is named incineration fly ash. The next cleaning
step is performed in a huge ‘multi-stage wet scrubber’ where the flue gas is washed by the

12 Chapter 2
water shower; after that hydrochloric acid, heavy metals and sulphur dioxide are left in the
water. The treatment setup of gas consists of spray drier, fabric filter, acidic and neutral
washers, electrostatic precipitator, and ammonia injecting. The cleaned flue gas is released
from the high chimney using a vacuum-draft fan. The gas is continuously tested and
monitored. The waste water used during the whole process needs to be treated; during the
treatment process gypsum and chemical contaminated filter cakes are obtained. The
gypsum can be reused and filter cakes can be sent to special landfills.
2.3 The solid residues from MSWI
2.3.1 The incineration residues
• Incineration bottom ash (IBA)
The IBA is generated at the incinerator gate and then send to the water tank for cooling
down. After the separation of ferrous and non-ferrous matter, the stony solid left accounts
for around 70-80% of the total residues generated in the WtE plant; the other 20-30% of
the solid wastes in the WtE plant are fly ash and air pollution control residues. Figure 2.2
shows the MSWI bottom ash received from the WtE plant in Wijster, which has a particle
size of 0-31.5 mm. It can be seen that it contains stony granulates, ceramics, unburned
matters, and the granulates are covered by a dust layer. Normally, there is also remining
metals found in bottom ash, which is not recycled sufficiently by the magnetic and eddy
current separators.
CeramicUnburned
matter
Stony
granulate
CeramicUnburned
matter
Stony
granulate
Figure 2.2: The MSWI bottom ash
• Incineration fly ash (IFA)
Incineration fly ash is collected from the bag separator (Figure 2.1 (8)) which is much finer
than bottom ash, and has a particle size under 250 µm. It is reported that this fraction
contains very high amounts of heavy metals and in most of the countries it is treated as
hazardous materials which cannot be used except in special landfills and treatments (Del
Valle-Zermeño et al., 2013).

Chapter 2 13
• Air pollution control (APC) residues
The APC residues are produced due to the cleaning of waste gas from the combustion
process. They are classified as hazardous materials according to environmental legislation
due to their high content of heavy metals (Amutha Rani et al., 2008).
2.3.2 The relevant research studies on MSWI bottom ash
To investigate the potential applications of MSWI bottom ash in the construction field,
plenty of research studies have been performed, including the characterization, treatments,
related environmental legislations and applications of bottom ashes from different
countries.
• Characterization
Figure 2.3 summarizes the research aspects performed on the characteristics of the MSWI
bottom ash.
Characterization
Metal contentCivil engineering
propertiesLeaching behavior
Aggre
gat
e st
rength
Wat
er a
bso
rpti
on
Hea
vy m
etal
s
Conte
nt
Dis
trib
uti
on
Sal
ts
Leg
isla
tion c
lass
ific
aito
n
Characterization
Metal contentCivil engineering
propertiesLeaching behavior
Aggre
gat
e st
rength
Wat
er a
bso
rpti
on
Hea
vy m
etal
s
Conte
nt
Dis
trib
uti
on
Sal
ts
Leg
isla
tion c
lass
ific
aito
n
Figure 2.3: The research aspects related to the characterization of MSWI BA
o Physical and chemical properties
Chimenos et al. (1999) studied the properties of MSWI bottom ash (> 1 mm) and identified
its main components; meanwhile, the distribution of heavy metals in the bottom ash
collected in Spain was identified. The relevant MSWI bottom ash studied was a
heterogenous stony material, and the metal content was mainly concentrated in fraction 1-
6 mm; the heavy metals were concentrated in bottom ash particles under 1 mm, while glass
particles were mostly found in fraction 4-6 mm, which was assumed due to the breakage
mechanical system or thermal shock. Li et al. (2004) characterized the solid residues from
two municipal solid waste incinerators in Shenzhen, mainland China. It was figured out
that the bottom ash was more heterogeneous than incineration fly ash, and the leaching of
14 Chapter 2
heavy metals from bottom ash was less than incineration fly ash and it could be landfilled
directly.
The study on the chemical and mineralogical properties of one MSWI bottom ash from
Germany by Bayuseno & Schmahl (2010) showed that the mineral phases in fresh bottom
ash are not stable and they tend to transfer into stable phases during the aging process, and
ettringite and a C-S-H (calcium silicate hydrate) phase may form during this process, which
help the binding of the heavy metals. Hence, natural weathering is a prospective method to
reduce the leaching potential of contaminants from MSWI bottom ash.
o Metal contents and their recycling
There are ferrous and non-ferrous metals in the MSWI bottom ashes, which are sources
worth to be recycled from both economic and environmental aspects. The ferrous metals
in the MSWI bottom ashes in general are recycled by electrical magnetic separators in most
of the incineration plants, and eddy current separators are applied to recycle the non-ferrous
metals. The distribution and content of the metals in the MSWI bottom ashes vary in
different countries, and are related significantly to the life style and recycling conditions of
the country. Hence, research studies have been done on the distribution and recycling of
metals from MSWI bottom ashes.
Kuo et al. (2007) studied the metal recovery potential from MSWI bottom ash, fly ash,
sludge and flue gas from Taiwan, R.O.C., and found that the majority of metals in bottom
ash are Fe, Al, Cu, Zn, Cr, and Pb. Xia et al. (2017) investigated the distribution of metals
in a MSWI bottom ash from mainland China and evaluated the recovery potential of the
metals. It was pointed out that the metal content in the MSWI bottom ash from Shanghai
is lower than that from developed countries. The Al was mainly concentrated in particles
bigger than 20 mm and in particles 5-20 mm, which originated from aluminium can scrap
and around 50-57% wt. of the Al was found in particles under 5 mm. The ferrous metals
were found evenly distributed in the bottom ash fractions and lower amount of ferrous
metals was in fraction 5-10 mmm, which is around 11-23 g/kg wt. of bottom ash; and
around 56-75% of Fe was cumulated in particles under 5 mm. It was also noticed that the
Fe exists in the form of hematite (Fe2O3), which is difficult to be separated by a general
magnetic separator. The content of copper and zinc in the MSWI bottom ash was lower
than that of Al, and they were mainly accumulated in fine fractions (such as particles
smaller than 5 mm). The Cu in MSWI bottom ash was mostly combined with organic
matter and Zn was mainly bound to carbonate fractions, while the content of metallic Zn
in bottom ash was rather marginal. It was suggested that the Cu and Zn recovery should
rely on advanced separation methods rather than common eddy current separation, such as
gravity separation for Cu and acid extraction for Zn, respectively. Even though the content
of metals in the MSWI bottom ashes from mainland China is lower than that from other
countries, it was suggested to recycle them for saving sources.

Chapter 2 15
Allegrini et al. (2014) carried out a detailed study on the MSWI bottom ash from a full-
scale facility in Denmark focusing on the quantification of recoverable resources and the
efficiency of the established recovery facility. It was reported that the recycling of non-
ferrous metals from the fine bottom ash particles should be more focused on in future
studies and the pre-sorting of waste before incineration would be a possible method to
recover the metals in bottom ash to avoid the oxidation of metals. The other valuable and
critical metals were too low to be further recovered from an economic aspect. Plenty of
research has been performed on the recycling of non-ferrous metals such as aluminium,
including quantification and qualification (Hu et al., 2011; Grosso et al., 2011; Biganzoli
et al., 2012), enhanced recycling technique (Rahman & Bakker, 2013), energy generation
potential (Biganzoli et al., 2013; Saffarzadeh et al., 2016), etc. due to the fact that the non-
ferrous particles in the MSWI bottom ashes are more difficult to be recycled compared
with ferrous ones, and in general they would cause more serious deterioration on the
products during application. It was concluded that the oxidation of metallic aluminium
during the incineration and water quenching process hinders its recycling efficiency. An
enhanced eddy current separator is necessary for the metallic Al recovery from fine bottom
ash fractions, or the metallic Al can be used as resource for hydrogen production, while
this depends on how much available metallic Al in the bottom ash fractions.
o Heavy metals and salts
Yao et al. (2010a) explored the heavy metal content and their distribution in MSWI bottom
ashes based on the samples collected from six cites of Zhejiang Province in mainland China.
Their results demonstrated that the major heavy metals in these bottom ashes were Zn, Cu,
Cr, Mn and Pb, higher than 300 mg/kg; and there was a high variation of the heavy metals
contents in bottom ashes, which was attributed to their contents in the input municipal solid
wastes. Yao et al. (2013) also studied the heavy metals, such as Cu, Zn and Cd, based on
the particle size of the MSWI bottom ash. It was reported that Cu was mainly distributed
in particles smaller than 0.45 mm and bigger than 4 mm, while Zn was evenly distributed;
Cd had a decreased trend with the increase of particle size. The organic matter bound Cu
and carbonate bound Cu increased with the increasing of particle size, and large ash
particles had higher contents of unstable Cu.
The leaching behaviours of heavy metals in MSWI bottom ash related to pH and time were
investigated (Dijkstra et al., 2006). It was reported that the leaching of Al was significantly
related to three minerals which were gibbsite, gypsum and ettringite, while the leaching of
Ca at pH 4-8 could be described by the dissolution of gypsum, and by calcite at pH 8-12.
Sulphate leaching showed pH independent behaviour, and gypsum solubility controlled the
sulphate leaching at pH 4 and 8. Dissolved organic carbon (DOC) was relatively
independent of pH and contained mainly humic acid (HA) and fluvic acid. The Cu leaching
could be described by the surface complexation to Fe- and Al(hydr)oxides. The leaching
of Ni at pH 4 to 8 was time dependent, and Zn leaching could be described by surface
16 Chapter 2
precipitation model under a large range of pH. The long term static immersing leaching
test conducted by Liu et al. (2008) showed that the leaching of Pb and Cu was solubility
controlled, which was in line with the results reported by others, even though different
leaching tests were applied; and the Cu leaching was related to the dissolved organic carbon
(DOC) in the bottom ash. The application of MSWI bottom ash as aggregate replacement
in hot mixed asphalt and Portland cement concrete (Roessler et al., 2015) demonstrated
that the elements in the monolith form had limited mobility and the Portland cement system
had better immobilization capacity than hot mixed asphalt.
• Environmental legislations
Due to the fact that the MSWI bottom ash contains heavy metals and has the potential to
leach into the environment surrounding, the reuse of bottom ash as secondary materials in
construction fields is limited. To guide the disposal of MSWI bottom ashes in a safe way,
environmental legislation was established according to respective conditions of different
countries. The legislation provides disposal suggestions based on the leaching properties
of the investigated MSWI bottom ash, and the various leaching tests are used accordingly.
The principles of the environmental legislation normally focus on the protection of water,
soil, or reducing the amount of waste, etc. (Liu et al., 2015). To qualify the category of a
solid waste according to relevant standards, there are two aspects involved - the limit level
of leached elements and the testing methods. The dominant leaching tests applied are the
shaking test and the column test, with the relevant and required liquid to solid ratio (L/S),
pH of solution, testing time, etc. which is a simulation of the real conditions in practice.
Table 2.1 shows the leaching limits in the Dutch legislation. In the Netherlands, the
environmental legislation - Soil Quality Decree (SQD, 2013) has the purpose of protecting
the soil and groundwater. This legislation specified the requirement for using the stony
waste materials in construction. Depending on the leaching behaviours, the investigated
materials are divided into three categories - shaped, non-shaped and IMC (Insulation,
Management, Control) construction materials.
The MSWI bottom ash undergoes column leaching test according to NEN 7383 (2004),
which simulates the leaching of inorganic components from the bottom ash in an aerobic
environment as a function of the L/S (0.1-10), and the cumulative leaching for the L/S of
10 l/kg is determined. The sample is firstly dried and crushed to under 4 mm and then put
into the vertical column (5 cm diameter and length > 20 cm). Demineralised water (pH≈ 7)
flows through the column from bottom to top at a low speed and this procedure may take
around three weeks until the L/S 10 is reached. Then the eluate is collected to be tested
including pH, electronic conductivity, and concentration of components. If the
concentrations of investigated components do not exceed the limit values shown in Table
2.1 (column 3), then the tested materials could be used as non-shaped materials in the
construction field; if the concentrations of components do not exceed the values in column

Chapter 2 17
four, then this material could be used, but isolated from the surrounding environment and
the monitoring of its leaching during its life cycle is required. The limit values in column
2 are for the moulded and monolithic materials being tested according to the diffusion
tested described in NEN 7375 (2004). The tested products are immersed in demineralised
water for 64 days, the liquid to volume ratio is 2-5 l/l product volume. The demineralised
water is renewed after 6 hours and 1, 2.25, 4, 9, 16, 36 and 64 days after the test started.
After 64 days, the pH, electronic conductivity, and concentration of components of the
leachate are determined and the leaching result is expressed in mg/m2.
Table 2.1: The leaching limits according to the Dutch legislation - Soil Quality Decree (2013)
Elements
(1)
1 Shaped
[4 ɛ64 in mg/m2]
(2)
2 Non-shaped
[5mg/kg d.m.]
(3)
3IMC building material
[mg/kg d.m.]
(4)
Antimony (Sb) 8.7 0.16 0.7
Arsenic (As) 260 0.9 2
Barium (Ba) 1500 22 100
Cadmium (Cd) 3.8 0.04 0.06
Chromium (Cr) 120 0.63 7
Cobalt (Co) 60 0.54 2.4
Copper (Cu) 98 0.9 10
Mercury (Hg) 1.4 0.02 0.08
Lead (Pb) 400 2.3 8.3
Molybdenum (Mo) 144 1 15
Nickel (Ni) 81 0.44 2.1
Selenium (Se) 4.8 0.15 3
Tin (Sn) 50 0.4 2.3
Vanadium (V) 320 1.8 20
Zinc (Zn) 800 4.5 14
Bromide (Br-) 670 20 34
Chloride (Cl-) 110000 616 8800
Fluoride (F-) 2500 55 1500
Sulphate (SO42-) 165000 1730 20000
1: building material with a minimum volume unit of at least 50 cm³, and has stable shape under normal conditions;
2: building material that has not been shaped;
3: materials can be used only when isolation, management and control measures are applied; in Dutch called IBC: ‘Isoleren-Beheersen-Controleren’;
4: the measured cumulative leaching for a component per unit surface area over 64 days, in mg/m2;
5: mg elements per kg of dry material; d.m.-dry mass.
• Treatments
In order to improve the properties of MSWI bottom ash physically or chemically, to obtain
a better material for application or to reduce the leaching concentration of contaminants
from MSWI bottom ash and lower it environmental risk potential, relevant treatments have
been performed and reported as summarized in Figure 2.4.
In general, incinerators are equipped with magnetic separators and non-ferrous separators
for the recycling of pure metals, and the major metals recovered are iron and aluminum.
For the incinerator plant, the aim is to maximize the recycling of metals, which firstly

18 Chapter 2
provide a financial benefit for the company and secondly a cleaner stony material can be
obtained. However, it was reported that the recovery level of metals is related to their
oxidation degree and is limited by their particle size (Biganzoli & Grosso, 2013; Biganzoli
et al., 2012). Hence, advanced recycle methods were developed, such as modified eddy
current separation (Rahman & Bakker, 2013; Settimo et al., 2004), optimized pretreatments
(Holm & Simon, 2016), advanced dry recovery (ADR) (De Vries, 2009), etc.
The majority of the research focused on the treatments for leaching of MSWI bottom ash,
which include the extraction and immobilization of contaminants. The extraction of
contaminants means to pre-leach out the contaminants from bottom ash and reduce the total
leachable contents before future application or disposal. The contaminants in the MSWI
bottom ashes include salts or heavy metals, and their extraction can be by water or chemical
washing. It was reported that the salts in the MSWI bottom ash, such as chlorides, are
highly soluble, and could be washed out by simple water washing; however, it was not
recommended to wash the MSWI bottom ash due to the large amount of generated waste
water (Chen & Chiou, 2007; Lin et al., 2011; Yang et al., 2012). The organic carbon in the
bottom ash could be extracted by hydrochloric acid (Guimaraes et al., 2005) and the heavy
metals can be extracted by ammonium citrate: Cu (Van Gerven et al., 2007) leaching could
be lowered below the limit values after extraction with a 0.2 M ammonium citrate solution
followed by three washing steps.
Treatments
Metals Leaching properties
• In
tensiv
e recyclin
g
• R
euse fo
r energ
y p
rod
uctio
n
Extraction Immobilization
• W
ashin
g
• C
hem
ical extractio
n
• W
eatherin
g
• C
arbo
natio
n
• B
ind
er stabilizatio
n
• T
herm
al treatmen
t
Treatments
Metals Leaching properties
• In
tensiv
e recyclin
g
• R
euse fo
r energ
y p
rod
uctio
n
Extraction Immobilization
• W
ashin
g
• C
hem
ical extractio
n
• W
eatherin
g
• C
arbo
natio
n
• B
ind
er stabilizatio
n
• T
herm
al treatmen
t
Figure 2.4: The research aspects regarding treatments on MSWIBA
The freshly produced bottom ash from the incinerators is generally dumped into water for
cooling down, followed by metals separation and several weeks or months natural
weathering. It was reported that the mobility of some metals or elements was reduced
during the weathering process (Freyssinet et al., 2002), which was due to the newly formed
minerals. It was also addressed that the pH of the bottom ash was stabilized which
contributed to the reduced solubility of metal hydroxides (Chimenos et al., 2000; Fléhoc et
al., 2006). Therefore, accelerated carbonation was applied as a treatment in order to

Chapter 2 19
accelerate this weathering process to reduce the leaching properties of the MSWI bottom
ash.
Rendek et al. (2006) performed accelerated carbonation using pure CO2 on lab scale on
original bottom ash and sieved bottom ash (< 4 mm). Their results displayed that calcite
was formed during carbonation and the pH was reduced from 12 to 8; meanwhile, the
leaching of Pb, Cr and Cd was reduced. Around 0.023 kg CO2 per kg of dry bottom ash
could be sequestrated; for bottom ash sieved under 4 mm, it was 0.044 kg. By accelerated
carbonation, the CO2 emission from incinerator could be reduced by 0.5-1%. Arickx et al.
(2006) conducted carbonation tests under several conditions on the bottom ash fractions,
and compared with natural carbonation. It was found that three months ageing was enough
for improving the MSWI bottom ash leaching properties considering recycling, while it
was still not enough for the sand (0.1-2 mm) and sludge (0-0.1 mm) fractions to meet the
requirement. After four weeks of accelerated carbonation, the leaching of Cu reduced
dramatically, and the leaching of the other elements could comply with the legislation. The
research carried out in (Meima et al., 2002) showed that the leaching of Cu and Mo after
carbonation could be decreased by 50% and 3%, respectively; the precipitates found in the
carbonated bottom ash were a mixture of Al-rich amorphous material, calcite and maybe
gibbsite which may contribute to the decrease of Cu leaching. Lin et al. (2015) reported
that the leaching of Cu was influenced by the degree of carbonation, while Cr leaching was
more pH dependent. The carbonation conditions, such as time, temperature, moisture
content, pH, DOC, IBA properties, etc. will influence the leaching of final treated bottom
ash. The research reported in (Baciocchi et al., 2010) revealed that the carbonation of
MSWI bottom ash resulted in the decrease of pH which subsequently reduced the solubility
of some heavy metals. Cornelis et al. (2006 & 2012) addressed that the Sb leaching from
MSWI bottom ash was reduced after a carbonation treatment; the calcium bearing minerals
play a significant role controlling Sb leaching at neutral to alkaline pH; when pH > 12, Sb
solubility was limited by portlandite and ettringite, when 10.8 < pH < 12, only ettringite
influenced Sb leaching; for pH <10, calcite and gypsum played the dominate role for Sb
leaching.
The (accelerated) carbonation was suggested as a promising treatment on MSWI bottom
ash, which on one hand reduces the leaching of heavy metals, and on the other hand can
uptake CO2.
The stabilization of MSWI bottom ash is a method to immobilize the leachable elements
and transfer them into a stable format or absorb/entrap them by the generated mineral
phases; this includes stabilization by other solution (Crannell et al., 2000), by binders or
alternatives (Van Caneghem et al., 2016; Li et al., 2012), or by chemical activators (Onori
et al., 2011; Polettini et al., 2009).

20 Chapter 2
Crannell et al. (2000) used soluble phosphate (PO43-) to stabilize heavy metals in MSWI
bottom ash; it was found that the Pb, Cu, Zn and Ca in the bottom ash could be effectively
stabilized due to the stable phases generated between the bottom ash and the phosphate
solution. Ca and Fe containing compounds were used as additives for the immobilization
of MSWI bottom ash by Van Caneghem et al. (2016). It reflected that the lower solubility
of romeites (calcium antimonate mineral) formed when Ca contained compounds were
used contributed to the reduced Sb leaching; co-precipitation of Sb with in-situ formed iron
(hydr)oxides under the appearance of Fe salts played a dominant role for the decreased Sb
leaching. Li et al. (2012) mixed the MSWI bottom ash with blended cement, and figured
out that the heavy metals were immobilized by the hydration products, such as C-S-H and
AFt (such as ettringite). Polettini et al. (2009) and Onori et al. (2011) utilized chemical
activators, such as NaOH, KOH, CaCl2 or CaSO4, to improve the leaching of MSWI bottom
ash in a cement-based system. It was demonstrated that the addition of KOH or CaCl2 could
reduce the leaching of heavy metals due to the stability of the main hydration phases, while
use of sulphate-based activators was not recommended considering the leaching of metals.
Generally, the treatments on MSWI bottom ash are also matched with their applications,
such as use bottom as in concrete and meanwhile, the binders in the concrete have an
immobilization effect on the heavy metals in the bottom ash.
• Applications of MSWI bottom ash
The application routes of MSWI bottom ash before or after treatment, can be summarized
as shown in Figure 2.5. At the early stage, MSWI bottom ash was mostly used as road base
due to its physical properties which are similar to normal aggregates, and its leaching
behaviors could comply with the legislation established for road construction (Forteza et
al., 2004). In the Netherlands, the MSWI bottom ash was used as road base with the
isolation layer and monitoring of leaching during service life due to the strict Dutch
legislation - SQD (2013). The use of MSWI bottom ash in roads in some countries was
successful and the leaching of metals during service life was reported to comply with
standards (Dabo et al., 2009; Hjelmar et al., 2007; Izquierdo et al., 2008; Olsson et al.,
2006). However, more application potentials for MSWI bottom ash should be explored due
to its increasing amount worldwide. Hence, the use of bottom ash was introduced into
building construction, such as being used as aggregates, binder alternatives, etc.
Müller & Rübner (2006) used MSWI bottom ash fractions (2-8, 2-32 mm) in concrete to
replace natural aggregates. It was found that the metallic Al causes cracks which deteriorate
the durability of concrete; the high amount of glass content in bottom ash resulted in alkali-
silica reaction (ASR) which contributed to the cracking or spalling of concrete. Hence, it
was suggested to reduce the content of Al and glass before use in concrete. The research
conducted in (Sorlini et al., 2011) stated that, after a washing treatment on their bottom ash,
it could be used in concrete without significant influence on concrete properties.

Chapter 2 21
Ferraris et al. vitrified the MSWI bottom ash at 1450 ºC and a type of dark brown glassy
material was obtained (Ferraris et al., 2009). This material could be used as cement
replacement for up to 20% wt. and could also be used as sand replacement in low strength
mortar.
Applications
Aggre
gat
es i
n c
oncr
ete
Aer
ated
concr
ete
Bin
der
subst
itute
or
ingre
die
nts
Lig
htw
eight
aggre
gat
es
Road
bas
e
Figure 2.5: The application routes of MSWIBA studied
The MSWI bottom ashes treated by a commercial washing and ADR technique could be
used in concrete as aggregates alternatives (Van Dr Wegen et al., 2013), and it was
suggested that up to 20% volume of bottom ash for structural concrete can be used to
replace aggregates or 50% volume for plain concrete. The washed MSWI bottom ash was
used in pervious concrete reported in (Kuo et al., 2013). Their results displayed that the
previous concrete with washed coarse bottom ash had higher compressive strength and
lower permeability compared with the one with natural aggregate and this concrete could
comply with the practical engineering requirement. The MSWI bottom ash treated by
enhancing the separation of metals during dry and wet separation in (Keulen et al., 2015)
was used as aggregates to produce earth-moist concrete. The results demonstrated that the
strength of the concrete was reduced with the increasing amount of treated bottom ash, as
well as the freeze thaw resistance. However, the obtained concrete with even 100% treated
bottom ash could comply with the standards requirement on curb stone or pavement stone.
The leaching of the crushed concrete with 100% treated bottom ash was below the limit
emission value defined in the Dutch legislation.
The MSWI bottom ash was used as cement replacement in (Juric et al., 2006); the results
showed that the strength of mortar decreased linearly with the increase of IBA amount, and
it was recommended that less than 15% of IBA could be used to replace cement. Similar
results were reported in (Saikia et al., 2008), where MSWI bottom ash was used as sand
replacement in mortar. Li et al. (2012) utilized milled MSWI bottom ash as replacement of
blended cement, and addressed that the use of milled bottom ash had very low reactivity
and had retardation effect on cement hydration, so up to 30% of milled bottom ash could
be used. The leaching of the blended mixture after curing was far below the Chinese
standard. The milled bottom ash was used to produce a geopolymerized binder in (Garcia-
22 Chapter 2
Lodeiro et al., 2016) and a type of hybrid cement with a 28-days compressive strength of
33 MPa was obtained. For the application of MSWI bottom ash in concrete, the metal
content was recommended to be efficiently separated; the milled bottom ash had a very
low reactivity. In general, low-strength concrete could be achieved with the use of MSWI
bottom ash. The application of milled MSWI bottom ash as raw material for the production
of cold bonded lightweight aggregates could be used to produce concrete blocks (Cioffi et
al., 2011). The produced aggregates had lower bulk density and the pellet strength was
dramatically influenced by the binder used during the pelletization process. However, no
further research work has been conducted in this direction.
It can be summarized that:
(1) There are physical and environmental problems in applying MSWI bottom ash in
construction without any pre-treatments - the heavy metals in bottom ash which
will leach out as the presence of water will pollute the ground water and are harmful
to human health;
(2) The metal content in bottom ash, especially metallic aluminium, will generate
hydrogen with alkali content when used in concrete which contribute to the spalling
and poor quality of concrete with bottom ash;
(3) Treatments are needed to upgrade the quality of MSWI bottom ash to meet the
physical and environmental requirements on building materials;
(4) The economic factor of the treatments and the value of the treated bottom ash for
application are the main barrier in practice for bottom ash application.
2.4 Conclusions
In this chapter, the incineration procedure of two WtE plants in the Netherlands was
introduced. The considered literature studies included the characteristics, treatments and
application of MSWI bottom ashes can be summarized:
(1) The procedures in the WtE plants are very similar worldwide, and generally include
solid waste storage, incineration, bottom ash collection and metals separation, fly
ash collection and flue gas cleaning. The efficiency of these procedures may be
diverse according to the operation conditions based on economic consideration.
(2) There are various environmental legislations on the disposal methods of MSWI
bottom ash in different countries and the limit value of leaching concentration from
bottom ash and the leaching tests are also different accordingly.
(3) The properties of MSWI bottom ash from different incineration plants vary. Its
potential environmental risk and its poor physical properties are the main barriers
for the application of MSWI bottom ash. The research in general focuses on the
application of MSWI bottom ash in concrete as binder alternatives, aggregates, etc.
The metallic aluminium in bottom ash particles which can generate hydrogen,
makes it not recommended to be used in concrete, while it could be used in aerated

Chapter 2 23
concrete. The calcite content in fine bottom ash particles suggests a thermal
treatment to active the chemical reactivity of bottom ash. The high porosity of
bottom ash particles supports the idea of application in lightweight concrete.
(4) The leaching behaviours of heavy metals in the MSWI solid residues are
investigated intensively. It is stated that most of the heavy metals are pH dependent
during the leaching process. Methods including washing, weathering/carbonation,
stabilization, etc. have been used to improve the leaching properties of MSWI
bottom ash for its application in the construction field.
(5) In the field of MSWI bottom ash, more effort is needed to focus on the reduction of
leaching contaminants, the chemical reactivity of bottom ash, the application of
bottom ash in different types of concretes, the upgrading of bottom ash to fit the
legislation, the optimization of bottom ash application and the benefit.
From the point of view of construction materials, environment protection and the economy,
there is a long way to go for the research on MSWI bottom ash. In this study, the MSWI
bottom ashes from different WtE plants in the Netherlands were characterized and
evaluated with the purpose of applying as building materials, which is shown in the next
chapter.

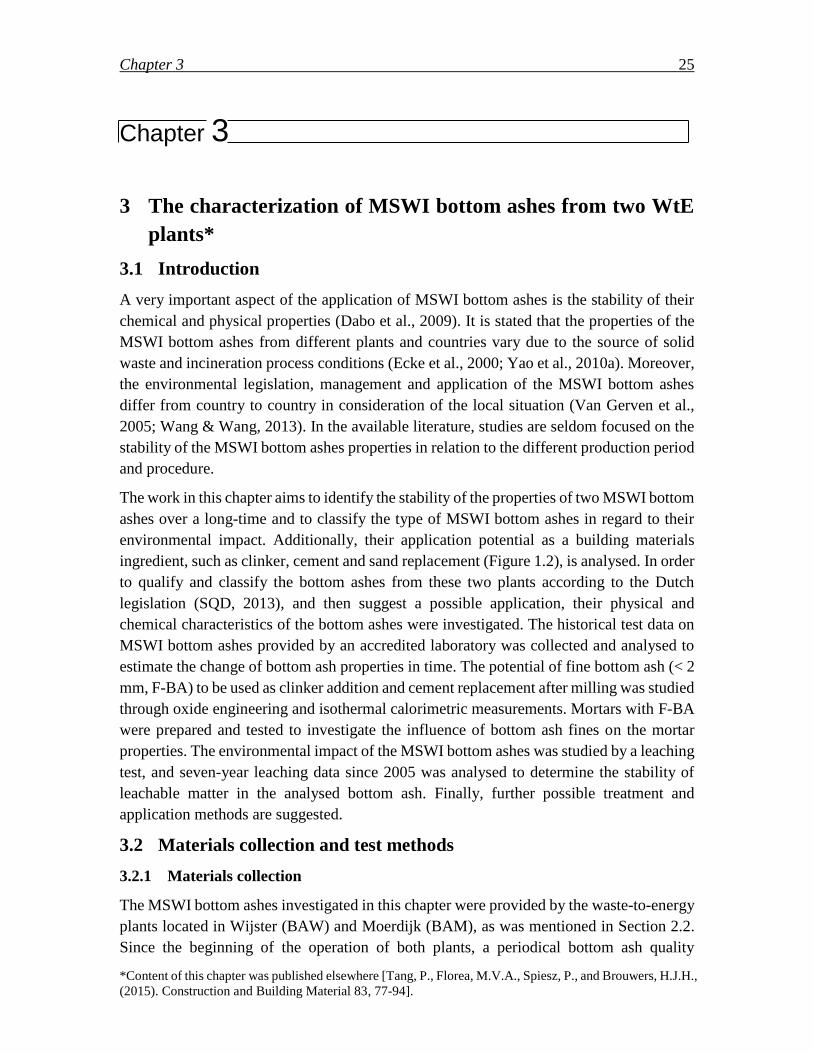
Chapter 3 25
*Content of this chapter was published elsewhere [Tang, P., Florea, M.V.A., Spiesz, P., and Brouwers, H.J.H.,
(2015). Construction and Building Material 83, 77-94].
Chapter 3
3 The characterization of MSWI bottom ashes from two WtE
plants*
3.1 Introduction
A very important aspect of the application of MSWI bottom ashes is the stability of their
chemical and physical properties (Dabo et al., 2009). It is stated that the properties of the
MSWI bottom ashes from different plants and countries vary due to the source of solid
waste and incineration process conditions (Ecke et al., 2000; Yao et al., 2010a). Moreover,
the environmental legislation, management and application of the MSWI bottom ashes
differ from country to country in consideration of the local situation (Van Gerven et al.,
2005; Wang & Wang, 2013). In the available literature, studies are seldom focused on the
stability of the MSWI bottom ashes properties in relation to the different production period
and procedure.
The work in this chapter aims to identify the stability of the properties of two MSWI bottom
ashes over a long-time and to classify the type of MSWI bottom ashes in regard to their
environmental impact. Additionally, their application potential as a building materials
ingredient, such as clinker, cement and sand replacement (Figure 1.2), is analysed. In order
to qualify and classify the bottom ashes from these two plants according to the Dutch
legislation (SQD, 2013), and then suggest a possible application, their physical and
chemical characteristics of the bottom ashes were investigated. The historical test data on
MSWI bottom ashes provided by an accredited laboratory was collected and analysed to
estimate the change of bottom ash properties in time. The potential of fine bottom ash (< 2
mm, F-BA) to be used as clinker addition and cement replacement after milling was studied
through oxide engineering and isothermal calorimetric measurements. Mortars with F-BA
were prepared and tested to investigate the influence of bottom ash fines on the mortar
properties. The environmental impact of the MSWI bottom ashes was studied by a leaching
test, and seven-year leaching data since 2005 was analysed to determine the stability of
leachable matter in the analysed bottom ash. Finally, further possible treatment and
application methods are suggested.
3.2 Materials collection and test methods
3.2.1 Materials collection
The MSWI bottom ashes investigated in this chapter were provided by the waste-to-energy
plants located in Wijster (BAW) and Moerdijk (BAM), as was mentioned in Section 2.2.
Since the beginning of the operation of both plants, a periodical bottom ash quality

26 Chapter 3
evaluation was conducted. The representative bottom ashes samples were collected from
different spots of the large bottom ash piles every 3 weeks and then sealed in plastic buckets
before further testing.
3.2.2 Test methods
• Water content determination
The received samples after weighting (m1) was dried in the ventilated oven at 105 °C until
a constant mass (m2) was obtained and the water content (ω) was determined as follows
(EN 1097-5 (1999)):
1 2
2
m - mω = × 100
m (3.1)
where ω represents the water content of the investigated samples (%), m1 is the initial mass
of the samples before drying (grams), m2 is the mass of the tested samples after the drying
procedure (grams).
• Particle size distribution (PSD)
The particle size distributions (PSDs) of the MSWI bottom ashes, sand and aggregate in
the whole research were determined by the sieving method according to EN 933-1 (1997).
Meanwhile, the sieving test was also performed on the oven dried bottom ashes to compare
with the standard test. The PSDs of powder materials used in this study were measured by
laser diffraction (Mastersizer 2000, Malvern).
• Specific density
The specific density of the materials in this study was measured using a Micrometrics
AccuPyc Ⅱ 1340 helium pycnometer as described in (Quercia Bianchi, 2014).
• Water absorption
The water absorption of the materials was measured according to EN 1097-6 (2013). The
sample was firstly saturated in water at room temperature for 24 hours, and then surface
dried. After that, the saturated and surface-dried material were further dried in a ventilated
oven at 110 ± 5 ºC until a constant mass was reached. The water absorption was expressed
as the mass percentage of the absorbed water per a mass unit of the dry material.
wet d24
d
m - mW = × 100
m (3.2)
Where: W is expressed in percentage (%); mwet is the mass of the original investigated
material (grams); md is the mass of the material cooled after drying following the procedure
mentioned above (grams).

Chapter 3 27
• Chemical compositions and crystalline phases
The tested materials were firstly dried and then milled into powder under 63 µm. For the
materials above 4 mm, they were firstly crushed using a jaw crusher, and then the crushed
material was fed into the planetary ball mill for further milling. The tested powders were
pressed into plate shape using a hand press tableting machine, and then X-ray fluorescence
(XRF) analysis was performed on the tablets using an Epsilon 3 (PANalytical) with
Omnian 3 analysing software for determining the chemical compositions. The X-ray
diffraction (XRD) measurement was performed on the milled powders using a Rigaku
Geigerflex X-ray diffraction spectrometer with Cu-radiation and a detection angle between
3° and 75° or 90°.
• Total heavy metals content determination
The milled materials were firstly digested by nitric acid and hydrochloric acid (aqua Regia)
according to NEN 6961 (2005) and then the heavy metals in the extracted leachate were
determined by inductively coupled plasma-atomic emission spectrometry (ICP-AES)
following the procedures given in NEN 6966 (2005).
• Loss on ignition (LOI) and unburned content determination
The unburned content in the MSWI bottom ash was measured according to NEN-EN 1744-
7 (2010). The bottom ash particles were crushed under 4 mm, and then oven heated at 480
± 25 ºC for 4 hours. The mass loss after heating is presented as percentage of the dried
mass before heating. The LOI of the investigated materials was determined by calculating
the mass loss percentage after heating at 950 ºC.
• Ferrous and non-ferrous content analysis
The ferrous components in the MSWI bottom ash were separated by a magnet, and the
loose metallic iron components (such as cans, screws, nuts, nails, etc.) were picked out
manually, and the amount was expressed as mass percentage in the total bottom ash.
• Metallic aluminium determination
To quantify the metallic aluminium content in the bottom ash samples, the test method as
described in (Qiao et al., 2008a) was applied. According to (Rahman & Bakker, 2013), the
separation of metallic Al in coarse bottom ash fractions can be enhanced by using more
efficient eddy current separators. However, the enhancement is not sufficient for fine
bottom ash particles (Biganzoli et al., 2013). Therefore, prior to the application of fine
bottom ash particles, the amount of metallic aluminium should be determined. In this study,
the bottom ash fines were milled into powder before the measurement and three samples
were tested for each bottom ash sample. The device used for the metallic Al reaction with
alkaline solution and the formed H2 gas collection device used in laboratory is shown in
Figure 3.1. The equation used for calculating the amount of metallic Al is described as:

28 Chapter 3
2 3 22Al + 6H O 2Al(OH) + 3H
(3.3)
According to this equation and the ideal gas law, about 1 g of metallic Al can produce
1.336 litre of hydrogen (H2) at 20ºC. The calculation is shown in Appendix 2.
(a)
Water
Measuring
cyclinder
NaOH
Magnetic
stirrer
Water
Measuring
cyclinder
NaOH
Magnetic
stirrer
(b)
Figure 3.1: The (a) lab set-up and (b) schematic graph to measure the volume of H2 in IBA
• Clinker characteristics
In cement production, the parameters normally used to define clinker characteristics based
on the oxide composition are hydraulic ratio (HR), silica ratio (SR), alumina ratio (AR)
and lime saturation factor (LSF) (Pan et al., 2008; Taylor, 1997). To evaluate the potential
use of MSWI bottom ashes as a raw material for clinker production, the HR, SR, AR and
LSF based on the chemical properties of investigated bottom ash samples were calculated
as follows (Taylor, 1997):
2 2 3 2 3HR = CaO/(SiO + Al O + Fe O ) (3.4)
2 2 3 2 3SR = SiO /(Al O + Fe O ) (3.5)
2 3 2 3AR = Al O /Fe O (3.6)
2 2 3 2 3LSF = CaO/(2.8 × SiO + 1.18 × Al O + 0.65 × Fe O ) × 100 (3.7)
These parameters calculated for the MSWI were compared with those for cement clinker
production, as will be shown later in Table 3.4.
• Reactivity analyse of waste materials (cement hydration study)
It is known that during the cement hydration, heat is generated due to chemical reactions
which occurs at different stages (Taylor, 1997). The isothermal calorimeter can record the
generated heat. By comparing the heat differences detected, the hydration of the sample
can be evaluated.
To analyse the reactivity of the bottom ashes, the cement hydration heat development with
bottom ash was studied by isothermal calorimetry (eight-channel TAM Air, Thermometric).

Chapter 3 29
The bottom ash sample was milled to under 125 µm using a planetary ball mill and then
blended with OPC (CEM I 42.5 N) at various F-BAW or F-BAM ratios (0%, 10%, 20%,
30%, 40% and 100%) and the water to powder ratio was kept constant (w/p = 0.7) for all
mixtures. After 5 minutes of manual mixing, the mixture was carefully transferred into the
glass ampoule to avoid loading the sample on the upper and side walls. Then the sealed
ampule with the sample was loaded into the isothermal calorimeter and the temperature
was kept at 23 ºC and the test was stopped after 5 days. The obtained data was analysed
and compared with that of plain cement paste.
• Application of fine MSWI bottom ash in mortars
To investigate the influence of the fine bottom ash particles (F-BAM and F-BAW) used as
sand replacement on the properties of mortar, the mortars were prepared following EN 196-
1 (2005). The OPC: water: sand mass ratio was 2: 1: 3 for the reference sample, and then
the sand was replaced by fine bottom ash particles by 10%, 20% and 30% by mass. The
OPC used in this part of the study was CEM I 42.5 N from ENCI (the Netherlands) and the
sand is CEN normalized sand 0 - 2 mm according to EN 196-1 (2005). The water to cement
ratio was kept at 0.5. Hardened mortar prisms (40 × 40 × 160 mm3) were used for the
determination of flexural and compressive strengths after 7, 28, and 91 days of water curing.
• Column leaching test
To estimate the environmental impact of BAW and BAM resulting from a possible
emission of harmful elements, the leaching test following NEN 7383 (2004) was performed
and compared with limit leaching values according to the Dutch legislation (SQD, 2013).
In order to evaluate the leaching behaviour of the elements in MSWI bottom ash samples
from both plants from different production periods, the leaching data from 2005 to 2012
for both BAW and BAM were collected and analysed.
Figure 3.2: The preparation of samples for column leaching test
The leaching tests were performed on two types of samples - MSWI bottom ash and mortar
or concrete containing MSWI bottom ash; the preparation of samples for leaching test is
shown in Figure 3.2. The prepared sample was placed in the column and water was forced

30 Chapter 3
to flow through the sample from the bottom to top for a certain period, till the water to solid
ratio (L/S) of 10 l/kg. The concentration of chemical elements in the eluate was analysed
using the ICP-AES according to NEN 6966 (2005), and the amount of chloride and
sulphate was determined through HPLC following NEN-EN-ISO 10304-2 (1996).
According to the Dutch legislation - SQD (2013), the leaching of the inorganic elements
should comply with the limiting values to protect the environment from the potential
pollution from emissions from MSWI bottom ash. The leachability of materials is
calculated according to the following equation:
Leached out concentrationLeachability (%) = × 100
Total concentration (3.8)
where the total concentrations of elements are determined using ICP-AES after the acid
digestion (aqua Regia) of the solid samples.
3.3 Characterization of MSWI bottom ashes
3.3.1 Physical properties
The seven-year average particle size distribution (PSD) data of BAW and BAM are shown
in Figure 3.3 together with newly measured data. The PSD curves of both bottom ashes are
relatively stable over a period of seven years. Despite the different production processes,
the PSD of BAW and BAM are very similar. Approximately 70% of the bottom ash
particles are in the range of 0.1 - 11.2 mm, which resembles the commonly used aggregates
in concrete (EN 12620, 2002).
Figure 3.3: The particle size distributions of BAW and BAM
Figure 3.4 depicts that the water content of BAW varies from 13% to 25% and the one of
BAM from 12% to 23% in a period of five to seven years. The various water contents of
both bottom ashes result from the water quenching and open-air storage.
0
20
40
60
80
100
0.001 0.01 0.1 1 10 100
Cum
ula
tive
mas
s [%
]
Particle size [mm]
Seven-year average value of BAW
Seven-year average value of BAM
New lab value of BAW
New lab value of BAM
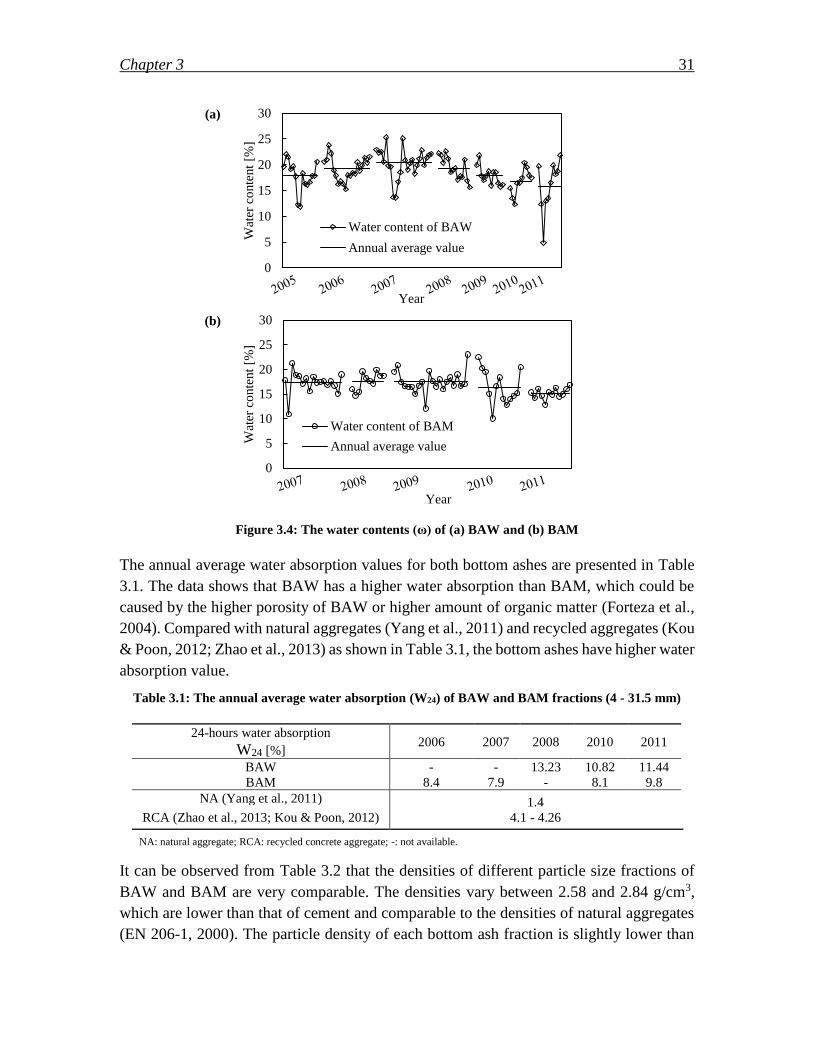
Chapter 3 31
(a)
(b)
Figure 3.4: The water contents (ω) of (a) BAW and (b) BAM
The annual average water absorption values for both bottom ashes are presented in Table
3.1. The data shows that BAW has a higher water absorption than BAM, which could be
caused by the higher porosity of BAW or higher amount of organic matter (Forteza et al.,
2004). Compared with natural aggregates (Yang et al., 2011) and recycled aggregates (Kou
& Poon, 2012; Zhao et al., 2013) as shown in Table 3.1, the bottom ashes have higher water
absorption value.
Table 3.1: The annual average water absorption (W24) of BAW and BAM fractions (4 - 31.5 mm)
24-hours water absorption
W24 [%] 2006 2007 2008 2010 2011
BAW - - 13.23 10.82 11.44
BAM 8.4 7.9 - 8.1 9.8
NA (Yang et al., 2011) 1.4
4.1 - 4.26 RCA (Zhao et al., 2013; Kou & Poon, 2012)
NA: natural aggregate; RCA: recycled concrete aggregate; -: not available.
It can be observed from Table 3.2 that the densities of different particle size fractions of
BAW and BAM are very comparable. The densities vary between 2.58 and 2.84 g/cm3,
which are lower than that of cement and comparable to the densities of natural aggregates
(EN 206-1, 2000). The particle density of each bottom ash fraction is slightly lower than
0
5
10
15
20
25
30
Wat
er c
onte
nt
[%]
Year
Water content of BAW
Annual average value
0
5
10
15
20
25
30
Wat
er c
onte
nt
[%]
Year
Water content of BAM
Annual average value

32 Chapter 3
the incineration bottom ash presented in (Yao et al., 2014), and the variation of the density
is very small. The densities of particles between 0.5 - 11.2 mm are higher than other
fractions; the possible explanation is the higher amount of remaining metals, which is in
line with (Yao et al., 2014).
Table 3.2. The densities of OPC, BAW and BAM fractions
Particle size
[mm]
Density [g/cm3] Particle size
[mm]
Density
[g/cm3]
BAW BAM BAW BAM
0 - 0.15 2.61 2.58 4 - 5.66 2.73 2.75
0.15 - 0.25 2.66 2.63 5.66 - 8 2.73 2.84
0.25 - 0.50 2.70 2.67 8 - 11.2 2.75 2.75
0.5 - 1 2.70 2.69 11.2 - 16 2.67 2.67
1 - 2 2.72 2.70 16 - 32 2.66 2.61
2 - 4 2.72 2.68
IBA (Yao et al., 2014) 2847±159 kg/m3 CEM I 42.5 N 3.10
IBA: incineration bottom ash
3.3.2 Chemical properties
• Chemical compositions
The total chemical compositions of BAW and BAM are summarized in Figure 3.5. It can
be observed that the dominant oxides in both bottom ashes are SiO2, CaO, Al2O3 and Fe2O3,
which cumulatively account for around 88% of the bottom ash, which is in line with
(Bayuseno & Schmahl, 2010; Wei et al., 2011).
SiO2 Fe2O3 Al2O3 K2O Na2O
Ti2OSO3 P2O5
CaO MgO
CuO ZnO Cl PbO
SiO2 Fe2O3 Al2O3 K2O Na2O
Ti2OSO3 P2O5
CaO MgO
CuO ZnO Cl PbO
SiO2 Fe2O3 Al2O3 K2O Na2O
Ti2OSO3 P2O5
CaO MgO
CuO ZnO Cl PbO
(a)
SiO2 Fe2O3 Al2O3 K2O Na2O
Ti2OSO3 P2O5
CaO MgO
CuO ZnO Cl PbO
SiO2 Fe2O3 Al2O3 K2O Na2O
Ti2OSO3 P2O5
CaO MgO
CuO ZnO Cl PbO
SiO2 Fe2O3 Al2O3 K2O Na2O
Ti2OSO3 P2O5
CaO MgO
CuO ZnO Cl PbO
(b)
Figure 3.5: The chemical compositions of (a) BAW and (b) BAM
Figure 3.6 shows the SiO2 distribution in different BAW and BAM size fractions. Other
oxides (CaO, Al2O3, Fe2O3, CuO, SO3) and chlorine content in the analyzed bottom ashes
are presented in Appendix A. The amount of SiO2 in each bottom ash particle size fraction

Chapter 3 33
was measured and calculated to the proportion of the mass of bottom ash fraction, and also
calculated to the total amount of all the bottom ash fractions.
0-0
.15
0.1
5-0
.25
0.2
5-0
.5
0.5
-1
1-2
2-4
4-5
.66
5.6
6-8
8-1
1.2
11.
2-1
6
16-
23
23-
40
>40
0
10
20
30
40
50
60
70
80
90
100
Particle size [mm]
Cumulative SiO2 in BAM
Cumulative SiO2 in BAW
SiO2 in BAM fractions
SiO2 in BAW fractions
Cum
ula
tive S
iO2 [%
]
0
10
20
30
40
50
60
70
80
SiO
2 [%
by m
ass]
Figure 3.6: The amount of SiO2 in BAW and BAM fractions
Table 3.3: The dominant chemical compositions of bottom ashes and other materials
Main chemical
components BAW BAM
CEM I
42.5 N (Deschner et
al., 2013)
SF (Saikia et
al., 2008)
WBA (Ginés et
al., 2009)
Fly ash (Rémond et
al., 2002)
CDW (Anastasiou et
al., 2014)
HCFA (Qiao et
al., 2009a)
SiO2 54.2 51.4 19.4 41.3 49.4 27.2 38.1 33.1
CaO 13.4 13.9 62.1 16.4 14.7 16.4 29.7 36.2
Fe2O3 13.8 15.1 3.6 13.5 8.4 1.8 3.7 5.4
Al2O3 7.9 7.9 5.2 9.57 6.6 11.7 6.3 10.8 SF: sand fraction (0.1 - 2 mm) of MSWI bottom ash; WBA: naturally weathered MSWI bottom ash; Fly ash: MSWI fly ash; CDW:
construction and demolition waste; HCFA: high calcium fly ash from coal combustion power plant
The finer particles contain higher amount of CaO, Al2O3 and Fe2O3 and a lower amount of
SiO2. Additionally, the distribution between main oxides of BAW and BAM is very similar.
This indicates that the main chemical composition is relatively stable, and is mostly
independent of the raw solid waste before the incineration process. Compared with the
dominant oxides in OPC (Deschner et al., 2013) and other wastes or secondary materials
(Anastasiou et al., 2014; Ginés et al., 2009; Rémond et al., 2002; Saikia et al., 2008) as
shown in Table 3.3, the bottom ashes in this study contain higher amounts of SiO2 and
lower amounts of CaO.
Based on the chemical properties of the bottom ash, the parameters for defining clinker
characteristics were calculated and the results are shown in Table 3.4. It can be seen that
the parameters HR, AR, LSF (defined previously in Section 3.2.2) of the bottom ash
particles under 2 mm, as well as the complete bottom ash PSD are under the required values
(shown in Table 3.4), except for SR. Therefore, the bottom ash analysed in this study is not
suitable to be used as raw material for clinker production. However, the high amount of
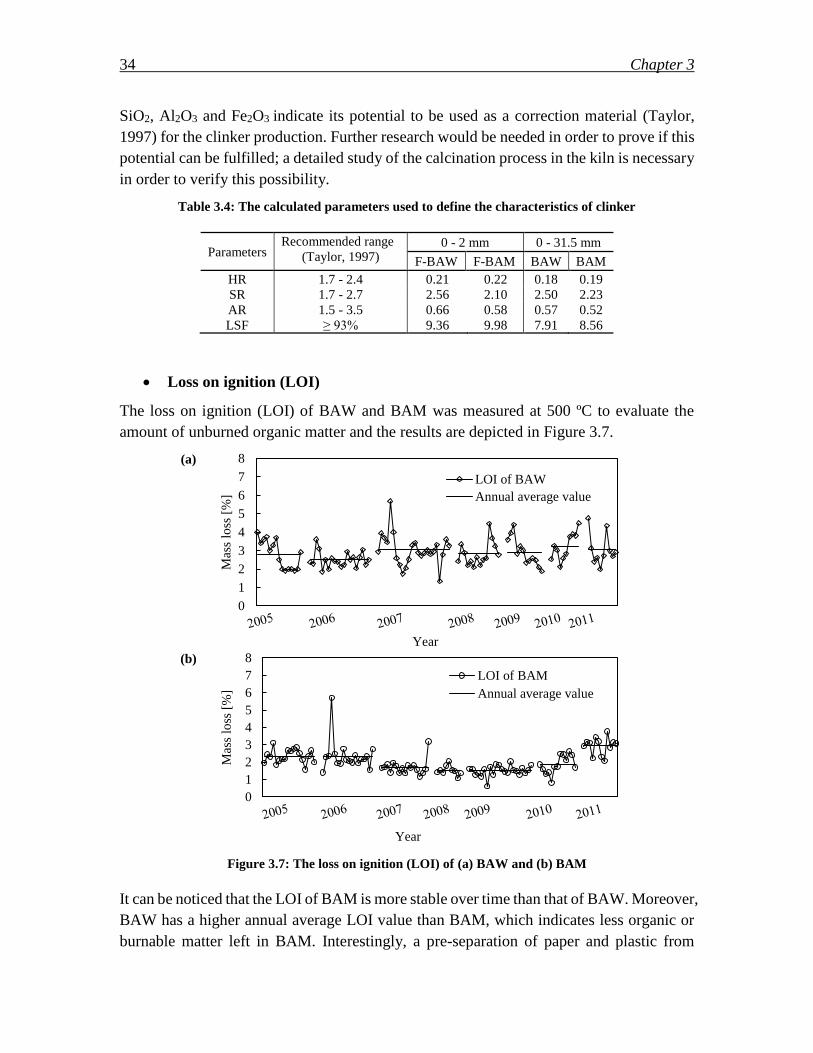
34 Chapter 3
SiO2, Al2O3 and Fe2O3 indicate its potential to be used as a correction material (Taylor,
1997) for the clinker production. Further research would be needed in order to prove if this
potential can be fulfilled; a detailed study of the calcination process in the kiln is necessary
in order to verify this possibility.
Table 3.4: The calculated parameters used to define the characteristics of clinker
Parameters Recommended range
(Taylor, 1997) 0 - 2 mm 0 - 31.5 mm
F-BAW F-BAM BAW BAM
HR 1.7 - 2.4 0.21 0.22 0.18 0.19
SR 1.7 - 2.7 2.56 2.10 2.50 2.23
AR 1.5 - 3.5 0.66 0.58 0.57 0.52
LSF ≥ 93% 9.36 9.98 7.91 8.56
• Loss on ignition (LOI)
The loss on ignition (LOI) of BAW and BAM was measured at 500 ºC to evaluate the
amount of unburned organic matter and the results are depicted in Figure 3.7.
(a)
(b)
Figure 3.7: The loss on ignition (LOI) of (a) BAW and (b) BAM
It can be noticed that the LOI of BAM is more stable over time than that of BAW. Moreover,
BAW has a higher annual average LOI value than BAM, which indicates less organic or
burnable matter left in BAM. Interestingly, a pre-separation of paper and plastic from
0
1
2
3
4
5
6
7
8
Mas
s lo
ss [
%]
Year
LOI of BAW
Annual average value
0
1
2
3
4
5
6
7
8
Mas
s lo
ss [
%]
Year
LOI of BAM
Annual average value

Chapter 3 35
municipal solid waste was conducted in the waste-to-energy plant of Wijster, so it was
expected that BAW would have a lower amount of unburned matter. This discrepancy
could be explained by the contribution of paper and plastic to reach a higher incineration
temperature and better contact between the heat source and the incinerated mass, which
eventually decomposes more organic matter.
• Mineralogical properties
The minerals identified in bottom ashes by XRD in literature were mainly quartz (SiO2),
calcite (CaCO3), anhydrite (CaSO4), gehlenite (Ca2Al2SiO7) and magnetite (Fe3O4) or
hematite (Fe2O3), in which quartz and calcite were the major crystalline phases (Qiao et al.,
2009; Saikia et al., 2008). In this study, the diffractograms of bottom ash particles under
0.15 mm of BAW and BAM are shown in Figure 3.8 as an example and the relative
intensities of the relevant peaks of other bottom ash fractions are shown qualitatively in
Tables 3.5 and 3.6.
Figure 3.8: The XRD patterns of BAW and BAM particles under 0.15 mm
The analysis of XRD results of BAW shows that the main crystalline phases are quartz
(SiO2), calcite (CaCO3), hematite (Fe2O3), zinc pyrophosphate (Zn2P2O7) and anhydrite
(CaSO4). In all the fractions, SiO2 as quartz is the main crystalline phase. The particles
under 0.15 mm of BAW contain relatively high amounts of CaCO3; Fe2O3 can be found in
all the fractions of BAW and particles above 5.66 mm contain relatively more Fe2O3, while
the particles under 2 mm have a higher amount of CaSO4. The main crystalline phases for
BAM fractions are SiO2, CaCO3, Fe2O3, Ca3Si3O9 (wollastonite), Zn2P2O7 and CaSO4. The
particles under 2 mm of BAM seem to contain large amounts of CaCO3 and CaSO4. The
variation of the same crystals in bottom ash fractions could be attributed to the hardness of
the crystalline phases. For instance, the CaSO4 and CaCO3 are softer than SiO2 and Fe2O3,
therefore the coarse fractions contain higher amounts of SiO2 and Fe2O3, while gypsum

36 Chapter 3
and limestone can be crushed during storage and transport and will be found mainly in the
finer fractions.
Table 3.5: The crystalline phases in BAW fractions (* represents the relative intensity of peaks)
Particles size
[mm] SiO2 CaCO3 Fe2O3 Ca3Si3O9 Zn2P2O7 CaSO4
0 - 0.15 **** *** * --- *** ***
0.15 - 0.25 **** * * *** * ***
0.25 - 0.5 **** * * ** * ***
0.5 - 1 **** ** * * * **
1 - 2 **** ** * * * **
2 - 4 **** * * * * **
4 - 5.66 **** * * ** ** *
5.66 - 8 **** * ** *** ** ***
8- 11.2 **** * ** * * *
11.2 - 16 **** -- ** * * *
16 - 23 **** * ** * * *
23 - 31.5 **** * ** * * **
Table 3.6: The crystalline phases in BAM fractions (* represents the relative intensity of the peaks)
Particles size
[mm] SiO2 CaCO3 Fe2O3 Ca3Si3O9 Zn2P2O7 CaSO4
0 - 0.15 **** *** * *** *** ***
0.15 - 0.25 **** *** * *** *** ***
0.25 - 0.5 **** ** * * ** ***
0.5 - 1 **** ** * ** ** ***
1 - 2 **** *** * *** *** ***
2 - 4 **** * ** * * *
4 - 5.66 **** * * ** *** **
5.66 - 8 **** ** ** * *** **
8 - 11.2 **** ** * * ** **
11.2 - 16 **** ** * * * **
16 - 23 **** * * * * *
23 - 31.5 **** ** * *** *** **
• The content of metallic matter
The annual average amounts of ferrous components and other loose metallic iron in the
investigated bottom ashes are shown in Figure 3.9. It can be noticed that the amount, of the
ferrous component and loose metallic iron in both BAW and BAM are quite stable in time.
The BAM contains a higher amount of both ferrous metals and loose metallic iron than
BAW. This result is in line with the chemical compositions as shown in Section 3.3.2 that
BAW has a lower amount of equivalent Fe2O3 than BAM. The above-mentioned
differences between BAW and BAM could be explained as follows: the pre-separation of
recyclable materials before incineration in Wijster increases the recycling efficiency of
metals. Hence, an enhancement of iron recycling in the Moerdijk plant could also be
necessary for improving the quality of the bottom ash.

Chapter 3 37
Figure 3.9: The amount of ferrous metals and loose metallic iron in BAW and BAM
The amount of metallic aluminium in fine bottom ash fractions (0-2 mm) of BAW (F-BAW)
and BAM (F-BAM) is depicted in Table 3.7. The F-BAW contain more metallic aluminium,
around twice as much compared to BAM. However, the XRF results show that F-BAW
and F-BAM have quite similar amounts of equivalent Al2O3 (Figure 3.5 and Appendix A).
Thus, it can be concluded that the aluminium in F-BAW has a lower level of oxidation.
Previous research addressed that the oxidation level of metallic aluminium in MSWI
bottom ash and the small size of non-ferrous scraps limit the recycling of aluminium; hence,
the production of energy from H2 generated by the chemical reaction between metallic
aluminium with a high pH solution is more beneficial (Biganzoli et al., 2012 & 2013).
Therefore, how to recover the metallic aluminium from the fine bottom ashes in the form
of hydrogen in a practical way might be more important and interesting than enhancing the
separation of metallic aluminium by an eddy current separator.
Table 3.7: The amount of metallic aluminum in F-BAW and F-BAM
Mass Volume of H2 Amount of metallic Al
[g] [ml] [mg] [% wt.]
F-BAW
5.30 44.80 38.64 0.73
5.54 45.90 39.58 0.71
6.20 50.30 43.38 0.70
F-BAM
5.01 21.50 18.54 0.37
5.48 23.00 19.84 0.36
5.65 24.50 21.09 0.37
3.3.3 Application potential in mortar
The bottom ash particles under 2 mm have a very similar particle size distribution (PSD)
and density with sand as shown in Figure 3.10 and Table 3.2. Therefore, in this chapter the
bottom ash particles under 2 mm were applied in mortar as sand replacement to investigate
their effect on the mortar properties. The flexural and compressive strengths of mortar with
various ratios of F-BAW or F-BAM after several periods of curing are shown in Figure
0
3
6
9
12
15
18
2005 2006 2007 2008 2009 2010 2011
Mas
s [%
]
Year
Ferrous component in BAM
Ferrous component in BAW
Loose metallic iron in BAM
Loose metallic iron in BAW

38 Chapter 3
3.11, as well as their reduction percentages compared with the strengths of the reference
mortars.
Figure 3.10: The particle size distribution (PSD) of standard sand and fine bottom ashes (0-2 mm)
Reference 10% F-BAW 20% F-BAW 30% F-BAW
3
4
5
6
7
8
9
Fle
xura
l str
en
gth
re
du
ctio
n [%
]
Fle
xura
l str
en
gth
[M
Pa
]
7d
28d
90d20
30
40
50
60
70
7d
28d
90d
(a) F-BAW
Reference 10% F-BAW 20% F-BAW 30% F-BAW
10
20
30
40
50
60
Co
mp
ress
ive
str
en
gth
[M
Pa
]
7d
28d
90d
0
10
20
30
40
50
60
70
80
90
100
Co
mp
ress
ive
str
en
gth
re
du
ctio
n [%
]
7d
28d
90d
(b) F-BAW
Reference 10% F-BAM 20% F-BAM 30% F-BAM
3
4
5
6
7
8
Fle
xura
l str
en
gth
[M
Pa
]
7d
28d
90d
20
30
40
50
60
70
Fle
xura
l str
en
gth
re
du
ctio
n [%
]
7d
28d
90d
(c) F-BAM
Reference 10% F-BAM 20% F-BAM 30% F-BAM
15
20
25
30
35
40
45
50
55
Co
mp
ress
ive
str
en
gth
[M
Pa
]
7d
28d
90d
30
40
50
60
70
Co
mp
ress
ive
str
en
gth
re
du
ctio
n [%
]
7d
28d
90d
(d) F-BAM
Figure 3.11: The flexural and compressive strengths of mortar with (a, b) F-BAW and (c, d) F-BAM
and their reduction percentages compared with the reference, respectively
It can be observed from Figure 3.11 that the use of both bottom ashes decreases the flexural
and compressive strengths by around 20%-50%, and the reduction of the strengths increase
0
20
40
60
80
100
0.1 1 10 100 1000
Cum
ula
tive
mas
s [%
]
Particle size (µm)
Sand
F-BAM
F-BAW

Chapter 3 39
with an increasing amount of the bottom ashes. In addition, the strength reductions for
mortar with F-BAW is slightly higher than that with F-BAM.
Similar results were reported in (Al-Rawas et al., 2005; Müller & Rübner, 2006). The
possible explanation of this phenomenon is that during the mixing of the mortar, part of
the water was absorbed by the bottom ash particles due to their high water absorption (as
shown in Figure 3.10 the F-BAW and F-BAM have more fine particles under 125 µm than
sand). Thus, the cement hydration progressed less, resulting in the reduction of the strength
(Tam et al., 2009). Meanwhile, the metallic Al in the F-BAs may react with the alkalis from
cement hydration and then generate cracks inside the mortar which in turn lowers the
mortar strength, even though no visible cracks or swelling were observed on the surfaces
of the samples.
3.3.4 The influence of milled fine bottom ashes (MF-BA) on cement hydration
To study the possibility of using fine bottom ashes as cement replacement, isothermal
calorimetry tests were performed. The fine bottom ashes BAM and BAW (0-2 mm) were
milled into powder and labelled as MF-BAM and MF-BAW, respectively, and mixed with
OPC respectively, as described in Section 3.2.1.
0 20 40 60 80 100
0.0
0.4
0.8
1.2
1.6
2.0
1
2
Hea
t flo
w [m
W/g
sol
ids]
Time [h]
100% OPC
90% OPC+10% MF-BAW
80% OPC+20% MF-BAW
70% OPC+30% MF-BAW
60% OPC+40% MF-BAW
100% MF-BAW3
4
(a)
0 20 40 60 80 100 120
0.0
0.4
0.8
1.2
1.6
2.0
4
3
2
1
Hea
t flo
w [m
W/g
sol
ids]
Time [h]
100% OPC
90% OPC+10% MF-BAM
80% OPC+20% MF-BAM
70% OPC+30% MF-BAM
60% OPC+40% MF-BAM
100% MF-BAM
(b)
Figure 3.12: Heat flow normalized to total mass of solids
Figure 3.12 shows the development of the heat flow of the hydration of OPC, and OPC
with various replacement ratios of MF-BAW and MF-BAM, normalized to the total
powder content. As described in (Bullard et al., 2011), the hydration of OPC can be divided
into four stages: the initial, the induction, the acceleration, and the deceleration stage.
Figure 3.12 (a) and (b) show that the plain MF-BAW and MF-BAM did not show typical
hydration curves as OPC, and their heat release rates tended to be stable after 40 hours.
This indicates that the MF-BAW and MF-BAM have lower hydraulic activities; this result
is in line with the very low HR value shown in Table 3.4. The low hydraulic property of
both bottom ashes is due to the existence of the high amount of crystalline phases, such as
SiO2 and CaCO3 (Figure 3.8) (Saikia et al., 2008).

40 Chapter 3
Figure 3.12 shows that the profiles of the heat release rate during cement hydration of
samples with cement and MF-BAW or MF-BAM are very similar to each other. For the
cement samples mixed with MF-BAW or MF-BAM the last three stages of cement
hydration is retarded and each reaction stage is extended. The more MF-BAW or MF-BAM
is added, the longer the retardation effect is observed on cement hydration. For samples
with 20%, 30% and 40% MF-BAW or MF-BAM, there is a heat release peak observed
after about 26 hours of hydration, as shown in Figure 3.12, position 1, 2, 3 on different
curves in the deceleration stage of cement hydration. According to (Bullard et al., 2011;
Jansen et al., 2012), these peaks refer to the dissolution of C3A and the precipitation of
ettringite, which is defined as “sulphate depletion peak” because of the participation of
sulphate to the reaction. Therefore, it can be concluded that adding bottom ash enhances
the reaction of sulphate.
The observed influence of bottom ashes on the cement hydration can be explained as
follows: (1) the heavy metals such as Cu, Pb, Zn, etc. may disturb the cement hydration
(Weeks et al., 2008); (2) the bottom ash contains a certain amount of organic matter, mainly
fulvic and humic acids as reported by Arickx et al. (2007), which may have a retardation
effect on cement hydration; (3) the high amount of CaSO4 present in bottom ashes enhances
the sulphate participation in the deceleration stage of cement hydration.
0 20 40 60 80 100 120 140 160
0
50
100
150
200
250
300
350
He
at [J
/g s
olid
s]
Time [h]
100% OPC
90% OPC+10% MF-BAW
80% OPC+20% MF-BAW
70% OPC+30% MF-BAW
60% OPC+40% MF-BAW
100% MF-BAW
(a)
0 20 40 60 80 100 120 140 160
0
50
100
150
200
250
300
350
He
at [J
/g s
olid
s]
Time [h]
100% OPC
90% OPC+10% MF-BAM
80% OPC+20% MF-BAM
70% OPC+30% MF-BAM
60% OPC+40% MF-BAM
100% MF-BAM
(b)
Figure 3.13: Released heat normalized to the total mass of solids
Figure 3.13 shows the cumulative heat released by the samples with MF-BAW or MF-
BAM, compared with plain OPC. The cumulative heat generated by the samples was
computed starting from the inflexion point when the heat flow starts to rise again after the
initial drop, in order to reduce the influence of sample preparation (Florea et al., 2014) (in
Figure 3.12, position 4). Figure 3.13 also reveals that the total heat release from the samples
with MF-BAW or MF-BAM after the same hydration time is lower than plain OPC and
decreases with an increasing amount of bottom ash.
Chapter 3 41
Samples with plain MF-BAW or MF-BAM have the lowest total generated heat. It is
known that the reaction of metallic aluminium with alkaline solutions generates 50 - 70
kJ/mol of heat (Porciúncula et al., 2012). Therefore, it can be calculated that the metallic
aluminium can produce 13 - 18 J or 7 - 9 J of heat per gram of MF-BAW or MF-BAM,
respectively. Thus, there is about 25 - 35% and 13 - 16% of the total heat released from
samples of plain MF-BAW or MF-BAM, respectively, due to the reaction of aluminium.
The other part of the total heat released can be attributed to the hydraulic reaction of MF-
BAW or MF-BAM.
0 10% 20% 30% 40% 100%
0
20
40
60
80
100
N
orm
aliz
ed
to
re
fere
nce
[%
]
Replacement ratio
MF-BAW
MF-BAM
Theoretical
Contributions from MF-BAW or MF-BAM
Figure 3.14: The total heat released after 111 hours from the solid mixtures normalized to the
reference (100% OPC), and the related to the replacement ratios of OPC by MF-BAW or MF-BAM,
and the theoretical total heat released if the added material has no heat contribution
It can be observed in Figure 3.14 that the samples with 10% MF-BAW or MF-BAM and
20% MF-BAM achieve higher cumulative heat than plain OPC, which indicates the
contribution of bottom ashes to cement hydration. For samples with 30% and 40% MF-
BAW or MF-BAM, the generated heat decreases. However, compared with the
replacement level, the reduction of cumulative heat is lower (e.g. 20% MF-BAW with 80%
OPC generated relative 97.1% heat of the reference, instead of 80%), which indicates the
contribution of bottom ashes.
The calorimetric results show that the MF-BAW and MF-BAM have low hydraulic
activities, and their addition to cement leads to the retardation of cement hydration. 10%
replacement of cement by bottom ashes can still have comparable or even higher total heat
release, hence, future studies can focus on its application in concrete. However, for higher
replacement levels, the activity of bottom ashes should be increased in order to reduce its
influence on cement hydration. Moreover, proper treatments should be considered in order
to reduce the retarding effect of bottom ashes on cement hydration (which is studied in the
next chapter).
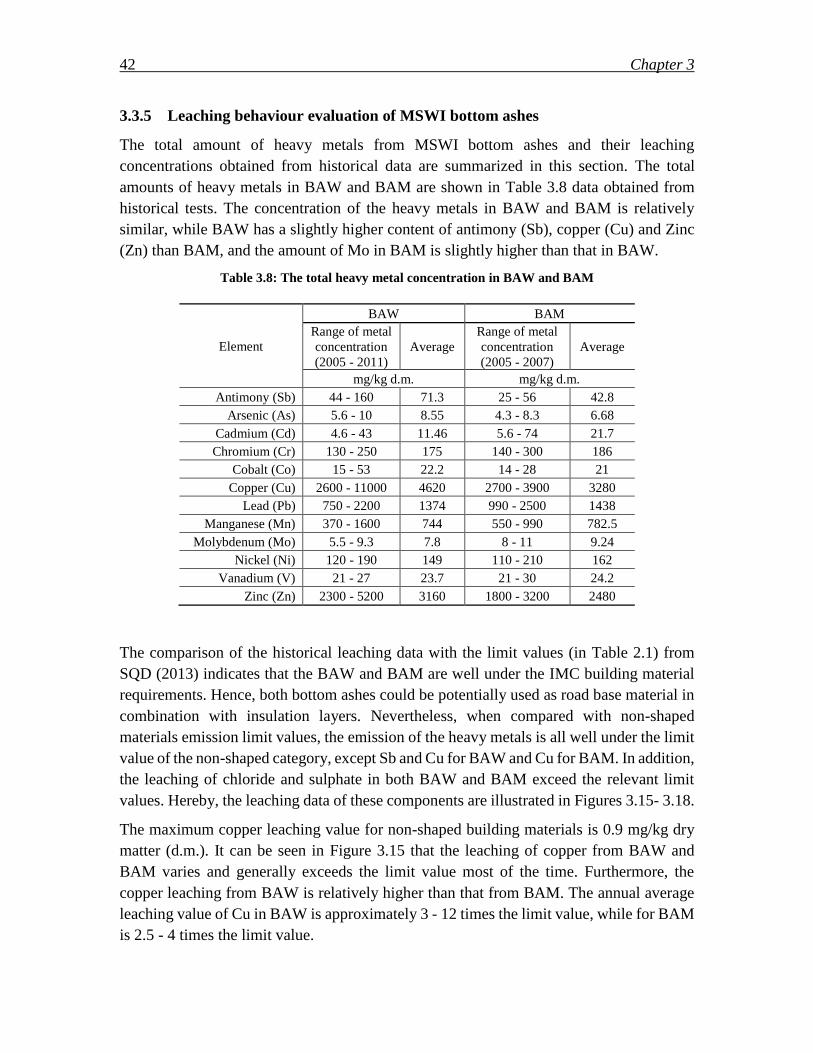
42 Chapter 3
3.3.5 Leaching behaviour evaluation of MSWI bottom ashes
The total amount of heavy metals from MSWI bottom ashes and their leaching
concentrations obtained from historical data are summarized in this section. The total
amounts of heavy metals in BAW and BAM are shown in Table 3.8 data obtained from
historical tests. The concentration of the heavy metals in BAW and BAM is relatively
similar, while BAW has a slightly higher content of antimony (Sb), copper (Cu) and Zinc
(Zn) than BAM, and the amount of Mo in BAM is slightly higher than that in BAW.
Table 3.8: The total heavy metal concentration in BAW and BAM
Element
BAW BAM
Range of metal
concentration
(2005 - 2011)
Average
Range of metal
concentration
(2005 - 2007)
Average
mg/kg d.m. mg/kg d.m.
Antimony (Sb) 44 - 160 71.3 25 - 56 42.8
Arsenic (As) 5.6 - 10 8.55 4.3 - 8.3 6.68
Cadmium (Cd) 4.6 - 43 11.46 5.6 - 74 21.7
Chromium (Cr) 130 - 250 175 140 - 300 186
Cobalt (Co) 15 - 53 22.2 14 - 28 21
Copper (Cu) 2600 - 11000 4620 2700 - 3900 3280
Lead (Pb) 750 - 2200 1374 990 - 2500 1438
Manganese (Mn) 370 - 1600 744 550 - 990 782.5
Molybdenum (Mo) 5.5 - 9.3 7.8 8 - 11 9.24
Nickel (Ni) 120 - 190 149 110 - 210 162
Vanadium (V) 21 - 27 23.7 21 - 30 24.2
Zinc (Zn) 2300 - 5200 3160 1800 - 3200 2480
The comparison of the historical leaching data with the limit values (in Table 2.1) from
SQD (2013) indicates that the BAW and BAM are well under the IMC building material
requirements. Hence, both bottom ashes could be potentially used as road base material in
combination with insulation layers. Nevertheless, when compared with non-shaped
materials emission limit values, the emission of the heavy metals is all well under the limit
value of the non-shaped category, except Sb and Cu for BAW and Cu for BAM. In addition,
the leaching of chloride and sulphate in both BAW and BAM exceed the relevant limit
values. Hereby, the leaching data of these components are illustrated in Figures 3.15- 3.18.
The maximum copper leaching value for non-shaped building materials is 0.9 mg/kg dry
matter (d.m.). It can be seen in Figure 3.15 that the leaching of copper from BAW and
BAM varies and generally exceeds the limit value most of the time. Furthermore, the
copper leaching from BAW is relatively higher than that from BAM. The annual average
leaching value of Cu in BAW is approximately 3 - 12 times the limit value, while for BAM
is 2.5 - 4 times the limit value.

Chapter 3 43
(a)
(b)
Figure 3.15: The leaching data of copper of (a) BAW and (b) BAM
Figure 3.16 shows the antimony emission from BAW in the column leaching test. The
antimony leaching for BAM is always under the limit emission value, hence, only the
leaching of BAW is shown here. It can be seen that the antimony leaching in BAW
fluctuates along with time and the annual average value has a slight increasing trend since
2005 (around 1 - 3.4 times the limit value).
Figure 3.16: The leaching data of antimony of BAW and BAM
The leaching of chloride from BAW frequently exceeds the limit value (Figure 3.17 (a)).
The annual average emission value is about 2.4 - 5.5 times the limit value, and since 2008
the value is lower than in previous years. Compared with BAW, BAM has a higher leaching
0
5
10
15
20
25
30
Cu [
mg/k
g d
.m.]
Year
Leaching test values of BAW
Annual average value of BAW
Limit value of SQD
0
2
4
6
8
10
12
14
Cu [
mg/k
g d
.m.]
Year
Leaching test values of BAM
Annual average value of BAM
Limit value of SQD
0
0.5
1
1.5
2
Sb
[m
g/k
g d
.m.]
Year
Leaching test values of BAW
Annual average value of BAW
Limit value of SQD

44 Chapter 3
value of Cl- and the annual average value is around 4.8 - 6.6 times the limit value (Figure
3.17 (b)).
(a)
(b)
Figure 3.17: The leaching data of chloride of (a) BAW and (b) BAM
The leaching of sulphate from BAW and BAM is shown in Figure 3.18 (a) and (b),
respectively. The sulphate emission from BAW always exceeds the limit level, and has an
increasing trend since 2006. The annual average value is approximately 1.7 - 5.7 times the
limit value. The sulphate leaching of BAM seems lower than that of BAW, and the
maximum annual average value is 3.6 times the limit.
It can be noticed from the above analysis that, for using the bottom ashes as non-shaped
material, the problematic leaching elements are very similar. Moreover, the emission level
of copper, antimony, sulphate of BAW is higher, while BAM has higher chloride emission
levels.
To understand the factors contributing to the abovementioned leaching differences between
BAW and BAM, and initially provide potential treatments, the leachability of the
problematic leaching elements was determined based on their total amount in bottom ashes
and the amount released in the leachate using Eq. (3.8) (Table 3.9). It is described in Table
3.9 that BAW contains a higher amount of Sb, and its average value is also higher than that
of BAM. The leachability of antimony in BAW is 1.8 times that in BAM, which indicates
the antimony in BAW is more leachable than in BAM. Hence, if a water washing treatment
is applied to reduce the amount of Sb in bottom ash, it could be expected that BAW would
0
2000
4000
6000
8000
Cl-
[mg/k
g d
.m.]
Year
Leaching test values of BAW
Annual average value of BAW
Limit value of SQD
0
2000
4000
6000
8000
Cl-
mg/k
g d
.m.
Year
Leaching test values of BAM
Annual average value of BAM
Limit value of SQD

Chapter 3 45
have a better washing efficiency. According to the previous research, the leaching of
copper from MSWI bottom ash is related with the organic matter content (Arickx et al.,
2010). Hence, the slightly higher leachability of copper in BAW than in BAM could be
explained as a result of a higher amount of organic matter. This is further proved by the
higher LOI value of BAW than BAM (Figure 3.7).
(a)
(b)
Figure 3.18: The leaching data of sulphate of (a) BAW and (b) BAM
The available data of the total amount of chloride and sulphate in BAW and BAM is limited.
However, the data shown in Table 3.9 briefly indicates the extremely high leachability of
the chloride and sulphate in both bottom ashes. Hence, the washing efficiency could be
expected to be the highest among other leachable elements in bottom ash. This is in line
with the findings presented in other studies (Cossu et al., 2012). The leachability of Sb and
Cu seems positively related to their total contents in MSWI bottom ash.
The study on the leaching behaviour of BAW and BAM along with time shows that the
leaching of most elements is well under the limit value of the legislation, only copper,
antimony, chloride and sulphate exceed the limit. For both BAW and BAM, despite the
different raw solid waste and different incineration method, the leaching contaminants are
the same. Hence, future studies should focus on the investigation of influential factors on
0
4000
8000
12000
16000
20000S
O42-[m
g/k
g d
.m.]
Year
Leaching test values of BAW
Annual average value of BAW
Limit value of SQD
0
5000
10000
15000
20000
SO
42-[m
g/k
g d
.m.]
Year
Leaching test values of BAM
Annual average value of BAM
Limit value of SQD

46 Chapter 3
copper, antimony, chloride and sulphate leaching from the bottom ash, and then potential
treatments can be suggested.
Table 3.9: The leachability of Sb, Cu, Cl- and SO42- in BAW and BAM
Components Sb Cu Cl- SO42-
[mg/kg d.m.] BAW BAM BAW BAM BAW BAM BAW BAM
Total amount 44 - 160 25 - 56 2600 -
11000
2700 -
3900
2600
(2400*) 3600
5100
(6100*) 4700
Average Value 71.30 42.80 4620 3280 - - - -
Leaching value 0.055 -
0.76
0.08 -
0.16
1.2 -
20
0.99 -
8.4
380 - 4300
(3000*)
280 -
6300
1000 - 15000
(5700*)
380 -
7900
Average value 0.37 0.12 7.37 4.18 - - - -
Leachability
[%] 0.11 - 1
0.19 -
0.52
0.03 -
0.54
0.03 -
0.22
-
(1*) -
-
(0.9*) -
Average value 0.59 0.33 0.18 0.12 - - - -
(*) The data tested in 2005; -: not available.
3.4 Conclusions and recommendations
This chapter presents the characteristics of MSWI bottom ashes from two waste-to-energy
plants with different facilities in the Netherlands. The leaching behaviour of both bottom
ashes was investigated by analysing seven years of leaching data. The application potential
of the bottom ash fines (< 2 mm, MF-BA) was studied experimentally. From the results
illustrated in this chapter, the following conclusions can be formulated:
(1) The physical and chemical properties of the bottom ashes from both waste-to-
energy plants were stable over time and were very similar with each other, despite
different production processes. The coarse bottom ash particles had a higher water
absorption than natural aggregate and recycled concrete aggregate.
(2) The dominant oxides found in the bottom ashes are SiO2, CaO, Al2O3 and Fe2O3,
and the main crystalline phases in BAW are quartz (SiO2), calcite (CaCO3),
hematite (Fe2O3), zinc pyrophosphate (Zn2P2O7) and anhydrite (CaSO4), and SiO2
as quartz is the main crystalline phase. And for BAM are SiO2, CaCO3, Fe2O3,
Ca3Si3O9 (wollastonite), Zn2P2O7 and CaSO4. Fine bottom ash particles below 2
mm contain higher amount of calcite and anhydrite. Based on the calculations of
relevant parameters, these bottom ashes could possibly be used as correction
material for clinker production. This possibility needs further research.
(3) The calorimetry results confirmed that the milled bottom ashes (milled from 0-2
mm to under 125 µm) had very low hydraulic activity and their addition to cement
leaded to the retardation of cement hydration. 10% cement replacement by bottom
ashes can reach comparable cumulative heat, while more than 20% replacement led
to the decrease of total heat release. However, the addition of bottom ashes
contributes to the total heat release of cement hydration.
(4) The MSWI bottom ash has a high amount of fine particles (< 125 µm) which leads
to higher water absorption and eventually reduces the amount of water available to
Chapter 3 47
react with cement and metallic aluminium in mortar. Hence, the fine bottom ashes
(< 2 mm) used as sand replacement reduce the strength of mortars with no visible
cracks on the mortar. Thus, zero-slump or roller-compacted concrete with low w/c
ratio and higher porosity can be an option for the use of bottom ash as aggregate to
avoid cracks.
(5) The leaching behaviour of bottom ashes was relatively stable over time. The
leaching contaminants which exceed the legislative limit were copper, antimony,
chloride and sulphate. Thus, a future study can be focused on the reduction of these
specific contaminants from the investigated bottom ashes
Based on the findings of the present chapter, it can be concluded that the proper treatments
are needed to improve the properties of the MSWI bottom ash in order to use it as building
materials, which is investigated in the next chapter.

Chapter 4 49
*Content of this chapter was published elsewhere [Tang, P., Florea, M.V.A., Spiesz, P., and Brouwers, H.J.H.,
(2016) Cem. Concr. Compos., 70, 194–205].
Chapter 4
4 Thermally activated MF-BA applied as binder substitute*
4.1 Introduction
The study in Chapter 3 showed that the milled MSWI fine bottom ash (MF-BA) had low
reactivity and contained heavy metals and salts which exceed the leaching limit according
to Dutch legislation (SQD, 2013). Hence, in this chapter, treatment was performed to
improve the properties of the fine MSWI bottom ash.
Cement clinker production contributes highly to the worldwide CO2 emission and
continuous consumption of raw materials (Schneider et al., 2011; Uwasu et al., 2014).
Considering the protection of the environment and sustainable development as a global
focus, a reduction of the production and use of cement worldwide is meaningful. In recent
years, a significant amount of research has been done on this topic, in which the application
of secondary materials as cement replacement attract extensive attention (Antoni et al.,
2012; Berryman et al., 2005; Tkaczewska et al., 2012; Xu et al., 2013). Furthermore, the
successful use of fly ash and ground blast furnace slag in concrete promotes the research
focus on other secondary materials as well, such as incineration wastes (Cheng, 2012; Lee
et al., 2011; Lin & Lin, 2006; Siddique & Bennacer, 2012).
Several studies focused on the utilization of municipal solid waste incineration (MSWI)
waste as binder, and it is reported that the milled bottom ash contributes very little to the
cement hydration because of its low pozzolanic properties. According to the research of Li
et al. (Li et al., 2012), 30% of cement replacement by bottom ash reduces the compressive
strength of mortars by about 26% after 28 days. However, the leaching properties of the
concrete with MSWI bottom ash as binder, performed under the environmental legislation,
are well under the limit value of China legislation, which indicates the immobilization of
the contaminants in concrete (Shi & Kan, 2009a). Therefore, it is considered that, if the
reactivity of the MSWI bottom ash could be increased, its application as binder substitute
would be facilitated.
According to previous research, thermal treatment on fine MSWI bottom ash should be an
effective way of increasing its reactivity, as well as reducing its leaching concentration of
heavy metals. As reported by Qiao et al. (2008b), the milled bottom ash is an inert material
and thermal treatment at 800 ˚C decreased the loss on ignition (LOI) and decomposed
calcite, subsequently increasing the reactivity of bottom ash by generating new active
phases (mayenite - Ca12Al14O33 and gehlenite - Ca2Al2SiO7). Furthermore, thermal
treatments of bottom ash are also proven to be efficient to reduce the leaching of heavy
metals (such as Cu and Pb), because of the burning of organic matter, which corresponds

50 Chapter 4
to the leaching of heavy metals (Arickx et al., 2007; Hyks et al., 2011). There are multiple
studies on the properties, treatment and application of MSWI wastes (Li et al., 2004; Lin
& Lin, 2006; Pera et al., 1997; Van der Sloot et al., 2001; Yao et al., 2010b). However,
research focused on the treatment and activation of MSWI bottom ash fines (0 - 2 mm) is
scarce.
Hence, this chapter shows the evaluation of the activation of MSWI fine bottom ash (0 - 2
mm) by thermal treatment, and its application as cement substitute in mortar. The
characteristics of the treated bottom ash samples are determined and the hydration of the
cement with treated bottom ash additions are investigated. Furthermore, the mechanical
properties of mortars with treated bottom ash are analysed after different curing times.
Finally, the environmental influence of the bottom ash-containing mortar is evaluated
through leaching tests.
4.2 Materials and methods
4.2.1 Materials and treatments
The MSWI bottom ash (IBA) used in this chapter is provided by the waste-to-energy plant
(Attero) in Wijster, the Netherlands. In this chapter, the bottom ash fines below 2 mm (F-
BAW) from the received bottom ash were chosen to be investigated.
The F-BAW was milled into powder to reduce its particle size and make it more
homogenous using a planetary ball mill, labelled as MF-BAW. Thermal treatment was
performed on the F-BAW and the MF-BAW in the muffle furnace for 24 hours, and the
temperatures chosen were 550 ˚C and 750 ˚C, based on the research in (Qiao et al., 2008b;
Shi & Kan, 2009a), the heating capacity of the incinerator, and the temperature used to
determine the loss on ignition (LOI) (NEN-EN 1744-7, 2010). Thermal treatment at 550
˚C was performed on the F-BAW before and after milling separately to investigate the
influence of treatment order on the bottom ash properties.
It is hypothesized that the IBA particles are covered by dust-like powders, which contain
higher amounts of soluble contaminants, and can have a higher reactivity than the particle
itself. In order to separate the fine powder attached on the surface of bottom ash particles
for investigation, lower speed and short duration of milling were applied during the milling
procedure. The treatments procedure is described as follows (Figure 4.1):
• Method 1 is to mill the F-BAW using a planetary ball mill with fixed milling
duration and speed in order to reduce the particle size to a maximum 125 µm; the
dark-grey powder obtained is labelled as MF-BAW.
• Method 2 and Method 3 are to thermally treat the milled bottom ash after Method
1 at 550 ˚C and 750 ˚C, respectively; reddish-brown powders are obtained, labelled
as M5T and M7T, respectively.

Chapter 4 51
• Method 4 is to heat the bottom ash particles at 550 ˚C firstly and then mill them
using the same milling procedure as in Method 1, listed as 5TM.
• Method 5 is to mill the thermally treated bottom ash (at 550 ˚C) at shorter duration
and lower speed compared to Method 1, followed by a sieving step to select the
material below 63 µm (5TMS); particles above 63 µm are labelled as 5TMS+. Due
to the fact that the dust or powder attached on the bottom ash particles could not be
removed manually one by one or by machine evenly, the lower speed milling
procedure was used in order to remove the attached powder from the particle
surface using the friction between the particles. The fines bellow 63 µm are chosen
to be investigated in order to distinguish the powder from the crushed bigger
particles during the milling.
The binder used in the work of this chapter was CEM I 52.5 R (Table 4.1) from ENCI
HeidelbergCement (the Netherlands) and the sand was CEN normalized sand 0 - 2 mm
according to EN 196-1 (2005).
Milling
F-BAW
(0-2 mm)
5T
MF-
BAW
550° C
M5T
M7T
550° C Milling 750° C
5TM
5TMS5TM
Milling Sieving (< 63 µm)
Milling
F-BAW
(0-2 mm)
5T
MF-
BAW
550° C
M5T
M7T
550° C Milling 750° C
5TM
5TMS5TM
Milling Sieving (< 63 µm)
Milling
F-BAW
(0-2 mm)
5T
MF-
BAW
550° C
M5T
M7T
550° C Milling 750° C
5TM
5TMS5TM
Milling Sieving (< 63 µm)
Method 1
Method 2
Method 3
Method 4
Method 5
Figure 4.1: The schematic description of treatment procedures on F-BAW and sample preparation
4.2.2 Analysis of material properties
The chemical compositions and crystalline phases of the treated bottom ash and other
materials are determined by XRF and XRD, receptively, as described in Section 3.2.2. The
particle surface properties of the investigated materials were observed by scanning electron
microscope (SEM, Quanta 650 FEG, FEI) and optical microscopy. The particle size
distribution (PSD) of all materials considered in this chapter was measured by laser

52 Chapter 4
diffraction (Mastersizer 2000 Malvern), and a helium pycnometer (AccuPyc II 1340) was
used to measure the specific densities. The content of metallic aluminium in the bottom
ashes are determined using the method described in Section 3.2.2.
4.2.3 Hydration properties study
The effect of the treated bottom ash on the cement hydration was investigated using an
isothermal calorimeter (eight-channel TAM Air, Thermometric) as described in Section
3.2.2. Previous studies on the bottom ash show that its use as cement replacement is better
to be limited under 30% (Al-Rawas et al., 2005; Juric et al., 2006; Li et al., 2012). Therefore,
the treated bottom ash is mixed with cement with the mass ratio of 3:7, and the water to
binder ratio is kept at 0.7, considering the loading of the samples into the ampoules. Cement
pastes containing different treated bottom ashes were cured in water at 20 ˚C for 7 days,
and subsequently small pieces were extracted from the hardened samples and dried with
acetone. The 7-days samples were milled and the crystalline phases were investigated by
XRD.
4.2.4 Mechanical strength of mortar samples
The treated bottom ash is pre-mixed with cement in a 3:7 ratio, and the mortar samples
were prepared according to EN 196-1 (2005). The flowability of the fresh mortars was
determined using the flow table test according to EN 1015-3 (2007). The test of
compressive and flexural strengths of mortar samples after different curing ages were
performed under the same procedure as described in Section 3.2.2. The obtained values
were expressed as the averages of three samples.
4.2.5 Leaching behaviour evaluation
The environmental impact of the fine bottom ashes before and after treatment and mortars
with these bottom ashes were evaluated by column leaching test with the same methods
described in Section 3.2.2.
4.3 Results and discussions
4.3.1 Properties of materials
As presented in Figure 4.2 (a) and according to the study in Chapter 3, the raw F-BAW is
a fraction with a similar particle size to sand (Figure 4.3 (a)), and has a dark-grey colour.
There are quartz particles, iron, glass particles, as well as heterogeneous particles visually
observed in bottom ash. Generally, these F-BAW particles are covered by a dust-like layer.
It is noticed that after the thermal treatment the colour changed to reddish and iron oxide
particles could be observed. The dust-like layer of particles still exists on the particles’
surface, as shown in Figure 4.2 (b).
According to a previous study (Saffarzadeh et al., 2011), after water quenching, the bottom
ash particles consist of about 60% particles which were coated by fine particles and other

Chapter 4 53
melted phases. This coat on the bottom ash particles results from the reaction occurred
during the rapid water quenching process (Yang et al., 2013), which influences the leaching
properties of the bottom ash.
Sand particles
Fused glass particle
Combined particle
Sand particles
Fused glass particle
Combined particle
(a)
Iron oxide
Dust-covered particle
Iron oxide
Dust-covered particle
(b)
Figure 4.2: MSWI bottom ash particles (a) before and (b) after 550 °C thermal treatment
(a)
(b)
Figure 4.3: (a) Particle size distribution and (b) F-BAW after treatment following Method 5
(particles above 63 µm)
After treatment following Method 5 (Figure 4.1), the bottom ash particles under 63 µm
account for 34.7% wt. of the milled bottom ash (compared to the initial 2.4% wt.). The
particles above 63 µm shown in Figure 4.3 (b) have a relatively cleaner surface than
untreated and thermally treated bottom ashes (Figure 4.2 (a), as the attached dust-like layers
on the surface were partially removed due to the friction during milling. Furthermore, these
particles are predominantly sand, glass, and iron particles; and some plate-shaped metals
were also observed (Figure 4.4 is shown as an example).
0
20
40
60
80
100
0.1 1 10 100 1000
Cum
ula
tive
mas
s[%
]
Particle size (µm)
Standard sand (0-2 mm)
F-BAW (0-2 mm)
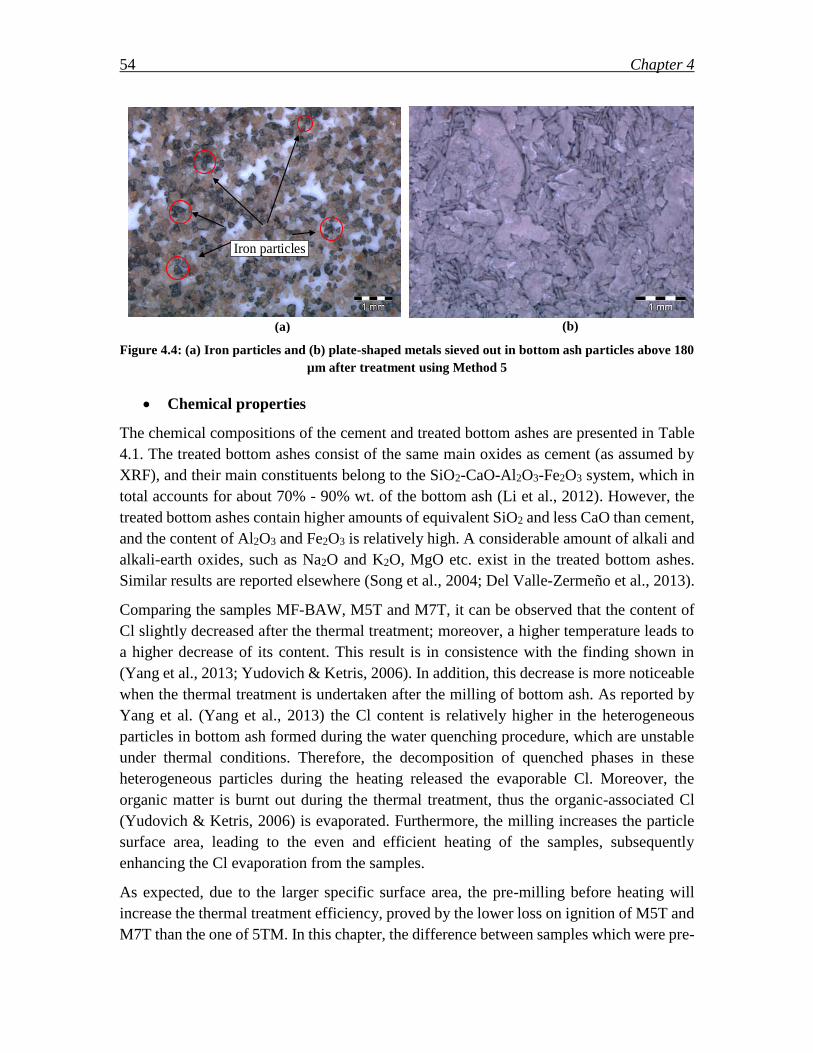
54 Chapter 4
Iron particles Iron particles
(a)
(b)
Figure 4.4: (a) Iron particles and (b) plate-shaped metals sieved out in bottom ash particles above 180
µm after treatment using Method 5
• Chemical properties
The chemical compositions of the cement and treated bottom ashes are presented in Table
4.1. The treated bottom ashes consist of the same main oxides as cement (as assumed by
XRF), and their main constituents belong to the SiO2-CaO-Al2O3-Fe2O3 system, which in
total accounts for about 70% - 90% wt. of the bottom ash (Li et al., 2012). However, the
treated bottom ashes contain higher amounts of equivalent SiO2 and less CaO than cement,
and the content of Al2O3 and Fe2O3 is relatively high. A considerable amount of alkali and
alkali-earth oxides, such as Na2O and K2O, MgO etc. exist in the treated bottom ashes.
Similar results are reported elsewhere (Song et al., 2004; Del Valle-Zermeño et al., 2013).
Comparing the samples MF-BAW, M5T and M7T, it can be observed that the content of
Cl slightly decreased after the thermal treatment; moreover, a higher temperature leads to
a higher decrease of its content. This result is in consistence with the finding shown in
(Yang et al., 2013; Yudovich & Ketris, 2006). In addition, this decrease is more noticeable
when the thermal treatment is undertaken after the milling of bottom ash. As reported by
Yang et al. (Yang et al., 2013) the Cl content is relatively higher in the heterogeneous
particles in bottom ash formed during the water quenching procedure, which are unstable
under thermal conditions. Therefore, the decomposition of quenched phases in these
heterogeneous particles during the heating released the evaporable Cl. Moreover, the
organic matter is burnt out during the thermal treatment, thus the organic-associated Cl
(Yudovich & Ketris, 2006) is evaporated. Furthermore, the milling increases the particle
surface area, leading to the even and efficient heating of the samples, subsequently
enhancing the Cl evaporation from the samples.
As expected, due to the larger specific surface area, the pre-milling before heating will
increase the thermal treatment efficiency, proved by the lower loss on ignition of M5T and
M7T than the one of 5TM. In this chapter, the difference between samples which were pre-

Chapter 4 55
milled and which were directly thermally treated is quantified through metallic Al content
determination and mechanical strength of hardened mortars.
Table 4.1: Chemical components and densities of CEM I 52.5 R, MF-BAW, M5T, M7T, 5TM, 5TMS
and 5TMS+
Chemical components
[% wt.] CEM I 52.5 R MF-BAW M5T M7T 5TM 5TMS 5TMS+
SiO2 17.11 35.98 40.55 41.20 35.80 24.49 50.74
CaO 64.99 19.34 19.49 20.03 21.67 28.29 16.02
Al2O3 3.80 9.00 9.44 9.82 9.93 11.07 8.64
Fe2O3 3.59 11.54 11.74 12.09 12.26 8.99 13.48
MgO 1.56 1.81 1.97 2.09 1.99 2.26 1.92
Na2O 0.00 1.35 1.49 1.89 1.48 1.37 1.59
K2O 0.16 1.15 0.94 1.09 1.10 1.22 1.06
CuO 0.02 0.43 0.50 0.53 0.55 0.65 0.48
ZnO 0.15 0.80 0.79 0.82 0.91 1.16 0.71
P2O5 0.63 1.02 1.07 1.14 1.13 1.12 1.12
TiO2 0.27 1.11 1.13 1.16 1.15 1.31 1.14
MnO 0.09 0.16 0.17 0.17 0.18 0.19 0.17
Cl 0.02 0.66 0.64 0.56 0.74 1.06 0.43
SO3 3.96 4.95 5.24 5.23 5.87 8.82 2.51
Other 2.01 0.69 1.19 0.71 1.31 1.10 *
LOI (550 °C) 0.41 7.37 2.02 1.16 2.86 2.54 *
LOI (950 °C) 1.64 9.99 3.66 1.46 3.93 6.90 *
Density [g/cm3] 3.10 2.74 2.91 2.97 2.87 2.85 *
*: not detected or tested
Differently from other treated bottom ash samples in this chapter, 5TMS has a relatively
higher content of CaO and Al2O3, and lower content of SiO2 and Fe2O3. Moreover, its Cl
and SO3 contents are also the highest among all the studied bottom ash samples. According
to the literature (Chimenos et al., 2003; Yao et al., 2013), the chemical compositions of
MSWI bottom ash differ by size fraction, especially for SiO2 and CaO. The finer bottom
ash particles have higher and lower contents of SiO2 and CaO, respectively, and this is
further confirmed by comparing 5TMS and 5TMS+. Additionally, the content of Cl and
SO3 in 5TMS is almost 1.5 times of that in other treated bottom ash samples in this study.
Also, the dust-like layer removed from the bottom ash particles contains a higher amount
of Cl than the bottom ash particles themselves, which is in line with the findings in (Chen
& Chiou, 2007; Song et al., 2004). The fine bottom ash particles have higher amounts of
chlorides and sulphates due to the large specific surface aggregated on the surface of coarse
bottom ash particles during the water cooling procedure, as shown in Figure 4.2. As also
explained in (Saffarzadeh et al., 2011), the newly formed phases on the surface layer during
water cooling and weathering enhanced the absorption sites of chloride and sulphate as
well. It is commonly known (Chimenos et al., 2003) that the fine particles contain higher

56 Chapter 4
amount of contaminates due to the large specific area of the particles. However, the
comparison of 5TMS and 5TMS+ shows that the finer particles or dust layers sticking on
the particle surfaces contribute to the higher amount of contaminants in the F-BAW. The
same trend is observed for heavy metals (details are discussed in Section 4.3.4). Hence, the
prevention of the finer dust sticking on the coarse particle might decrease the content of
contaminants in MSWI bottom ash.
Figure 4.5 illustrates the X-ray diffractograms of the investigated samples. The identified
predominant crystalline phases are quartz (SiO2), anhydrite (CaSO4), calcite (CaCO3),
hematite (Fe2O3) and magnetite (Fe3O4). The samples after thermal treatment have a
relatively higher peak at about 26.6˚, which represents the main quartz peak. This result is
consistent with the investigation of Qiao et al. (2008b). Furthermore, the peak heights
corresponding to hematite and magnetite increased, especially in sample M7T. This should
be attributed to the fact that heating results in the oxidation of iron in MF-BAW (as shown
in Figures 4.2 and 4.4 (b)), and a higher temperature could enhance this oxidation. It is
noticed that the calcite peaks decreased after the 550 ˚C thermal treatment, and are not
present in sample M7T, which results from the decomposition of calcite at high temperature
(Gabrovšek et al., 2006; Qiao et al., 2008c).
0 10 20 30 40 50 60 70 80
MF-BAW
M5T
M7T
5TM
2-Theta []
5TMS
A A A A A A A A A A
B B B B
C C C C C C
D D DE E E
A-quartz B-anhydrite C-calcite D-hematite E-magnetite
Figure 4.5: XRD diffractograms of the treated bottom ash samples
Qualitatively no significant differences can be observed between 5TMS, 5TM and M5T in
the X-ray diffractrograms. Nevertheless, in 5TMS, the quartz peak height is the lowest, this
result is in line with the chemical compositions determined in this study (in Table 4.1,
where 5TMS is shown to have 24.5% SiO2, compared to 35.8% and 40.5% for 5TM and
M5T, respectively). In addition, the peaks corresponding to anhydrite (CaSO4) and calcite
(CaCO3) here are much higher than in other samples. Based on the chemical composition

Chapter 4 57
of this sample, it could be concluded that part of the higher amount of the CaO (about 28%
compared to 16-21.7% in other MF-BAW samples in Table 4.1) can be attributed to the
anhydrite (CaSO4) and calcite (CaCO3), and the high amount of SO3 (about 8.8% compared
to 2.5-5.9% in other F-BAW samples in Table 4.1) might be related to the amount of
anhydrite.
To summarize, the MF-BAW mainly contains crystalline phases like quartz, anhydrite,
calcite and hematite, and there is no significant change after 550˚C thermal treatment.
However, higher temperatures (around 750˚C) enhance the iron oxidation and
decomposition of calcite in MF-BAW. Samples 5TMS, consisting of the fine powder in F-
BAW and the dust-like layer on the particles, possess lower quartz and higher calcite and
anhydrite contents and they also contain higher concentrations of Cl and SO3. Hence, the
feasible method to prevent or separate the fine powders sticking on the coarse bottom ash
particles is an interesting topic.
• Metallic Al
The amount of metallic Al in the investigated samples is determined as explained in Section
3.2.2. The results are presented in Table 4.2.
Table 4.2. Metallic aluminum content of bottom ash samples
Sample MF-BAW 5TM M7T 5TMS
Metallic Al
[% wt.] 0.44 0.48 0.46 < 0.2
It is apparent that the metallic Al content did not change significantly after the thermal
treatment. M7T has slightly less metallic Al than 5TM. This should be due to the fact that
the higher temperature enhances the oxidation of the metallic Al. 5TMS contains relatively
less metallic Al than all the other investigated samples. This can be due to numbers of
reasons: (1) the metallic Al in the original bottom ash particles under 63 µm is quite easily
oxidized during the heating period; (2) due to the good ductility of the metallic Al, it is
deformed into plate-shape particles through the action of the milling balls (as shown in
Figure 4.4 (b)), thus enlarging its surface, and consequently making it possible to be sieved
out. Therefore, to consider the removal and recovery of metallic Al in the fine bottom ash
fraction, special milling equipment should be used, such as an impact mill.
• Physical properties
Figure 4.6 illustrates the SEM images of M5T and 5TMS as examples. It can be seen that
most of the treated bottom ash particles have irregular shapes, which is a typical
characteristic of the milled bottom ash. Moreover, the surface of the particles has flocculent
matter attached to the particles, as reported in (Li et al., 2012).

58 Chapter 4
Flocculent matterFlocculent matter
(a)
AgglomerationAgglomeration
(b)
Figure 4.6: SEM images of (a) M5T and (b) 5TMS
The specific densities of the samples are shown in Table 4.1. Sample MF-BAW has a
slightly higher density than standard qualified quartz sand, which is about 2.65 g/cm3. This
is due to the fact that, besides other oxides, there are metals and ceramics in the F-BAW
which could not be separated completely. The densities of thermally treated bottom ash
increased. Moreover, a higher treatment temperature results in a higher density. The
variation of the density after thermal treatment can be attributed to the combined effect of
two opposing processes: burning out of the organic matter and the oxidation of the metals.
The density of 5TMS is lower than other thermally treated samples in this study, which
could be due to the removal of iron and quartz particles during sieving (Figure 4.4), as
previously explained.
0.1 1 10 100
0
20
40
60
80
100
Cu
mu
lativ
e V
ol.
[%]
Particle size [m]
CEM I 52.5 R
5TM
M5T
M7T
5TMS
Figure 4.7: The particle size distributions (PSDs) of the investigated materials.
Figure 4.7 presents the particle size distributions of the analysed materials. It can be
observed that all the samples are coarser than cement powder, 5TM excepted. Moreover,
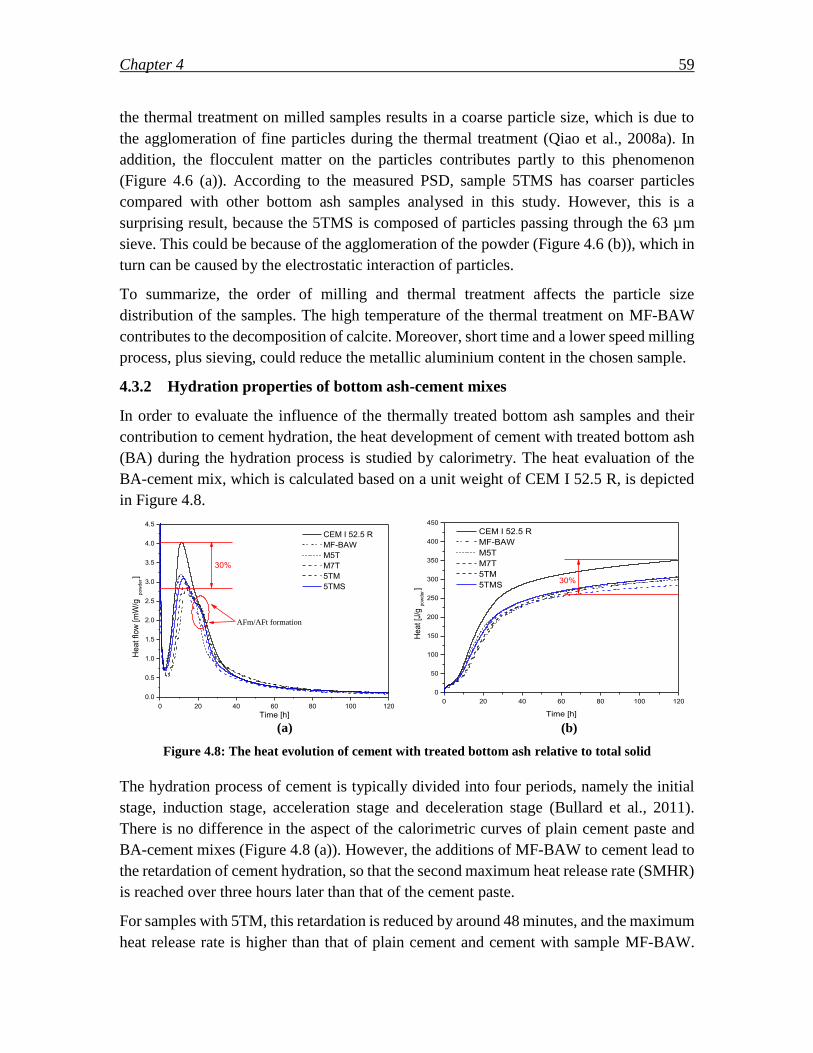
Chapter 4 59
the thermal treatment on milled samples results in a coarse particle size, which is due to
the agglomeration of fine particles during the thermal treatment (Qiao et al., 2008a). In
addition, the flocculent matter on the particles contributes partly to this phenomenon
(Figure 4.6 (a)). According to the measured PSD, sample 5TMS has coarser particles
compared with other bottom ash samples analysed in this study. However, this is a
surprising result, because the 5TMS is composed of particles passing through the 63 µm
sieve. This could be because of the agglomeration of the powder (Figure 4.6 (b)), which in
turn can be caused by the electrostatic interaction of particles.
To summarize, the order of milling and thermal treatment affects the particle size
distribution of the samples. The high temperature of the thermal treatment on MF-BAW
contributes to the decomposition of calcite. Moreover, short time and a lower speed milling
process, plus sieving, could reduce the metallic aluminium content in the chosen sample.
4.3.2 Hydration properties of bottom ash-cement mixes
In order to evaluate the influence of the thermally treated bottom ash samples and their
contribution to cement hydration, the heat development of cement with treated bottom ash
(BA) during the hydration process is studied by calorimetry. The heat evaluation of the
BA-cement mix, which is calculated based on a unit weight of CEM I 52.5 R, is depicted
in Figure 4.8.
0 20 40 60 80 100 120
0.0
0.5
1.0
1.5
2.0
2.5
3.0
3.5
4.0
4.5
He
at flo
w [m
W/g
po
wde
r]
Time [h]
CEM I 52.5 R
MF-BAW
M5T
M7T
5TM
5TMS
AFm/AFt formation
30%
(a)
0 20 40 60 80 100 120
0
50
100
150
200
250
300
350
400
450
He
at [J
/gp
ow
de
r]
Time [h]
CEM I 52.5 R
MF-BAW
M5T
M7T
5TM
5TMS30%
(b)
Figure 4.8: The heat evolution of cement with treated bottom ash relative to total solid
The hydration process of cement is typically divided into four periods, namely the initial
stage, induction stage, acceleration stage and deceleration stage (Bullard et al., 2011).
There is no difference in the aspect of the calorimetric curves of plain cement paste and
BA-cement mixes (Figure 4.8 (a)). However, the additions of MF-BAW to cement lead to
the retardation of cement hydration, so that the second maximum heat release rate (SMHR)
is reached over three hours later than that of the cement paste.
For samples with 5TM, this retardation is reduced by around 48 minutes, and the maximum
heat release rate is higher than that of plain cement and cement with sample MF-BAW.
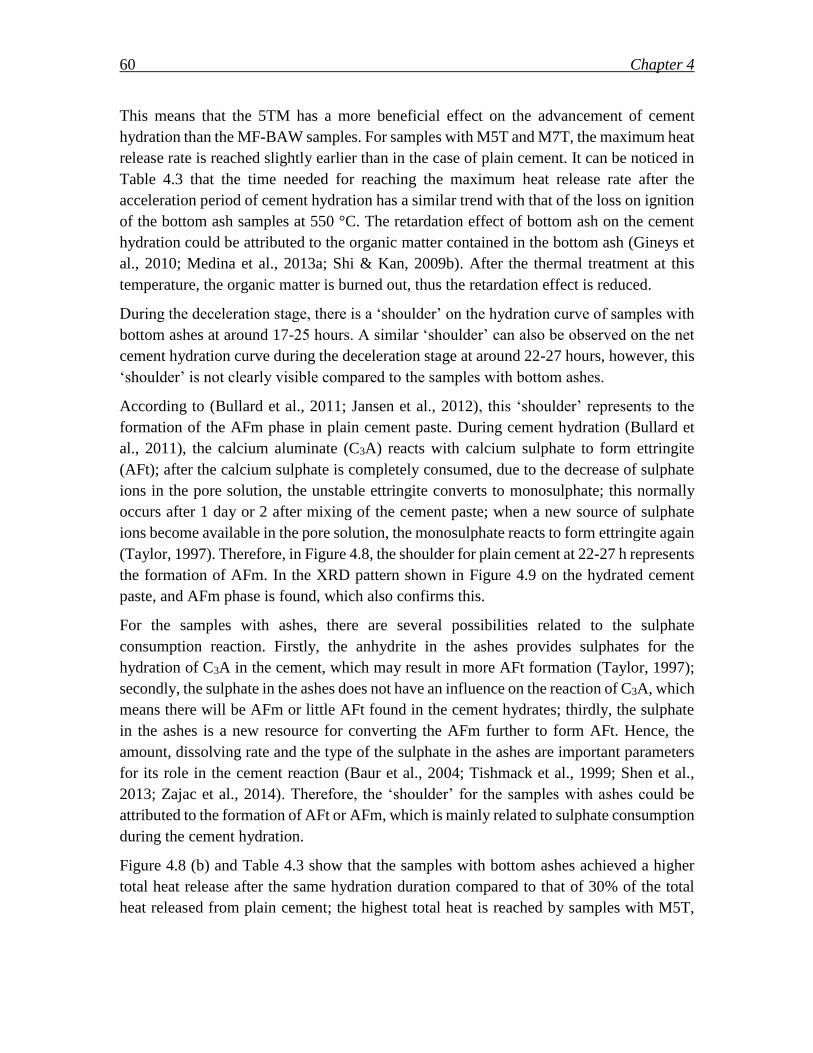
60 Chapter 4
This means that the 5TM has a more beneficial effect on the advancement of cement
hydration than the MF-BAW samples. For samples with M5T and M7T, the maximum heat
release rate is reached slightly earlier than in the case of plain cement. It can be noticed in
Table 4.3 that the time needed for reaching the maximum heat release rate after the
acceleration period of cement hydration has a similar trend with that of the loss on ignition
of the bottom ash samples at 550 °C. The retardation effect of bottom ash on the cement
hydration could be attributed to the organic matter contained in the bottom ash (Gineys et
al., 2010; Medina et al., 2013a; Shi & Kan, 2009b). After the thermal treatment at this
temperature, the organic matter is burned out, thus the retardation effect is reduced.
During the deceleration stage, there is a ‘shoulder’ on the hydration curve of samples with
bottom ashes at around 17-25 hours. A similar ‘shoulder’ can also be observed on the net
cement hydration curve during the deceleration stage at around 22-27 hours, however, this
‘shoulder’ is not clearly visible compared to the samples with bottom ashes.
According to (Bullard et al., 2011; Jansen et al., 2012), this ‘shoulder’ represents to the
formation of the AFm phase in plain cement paste. During cement hydration (Bullard et
al., 2011), the calcium aluminate (C3A) reacts with calcium sulphate to form ettringite
(AFt); after the calcium sulphate is completely consumed, due to the decrease of sulphate
ions in the pore solution, the unstable ettringite converts to monosulphate; this normally
occurs after 1 day or 2 after mixing of the cement paste; when a new source of sulphate
ions become available in the pore solution, the monosulphate reacts to form ettringite again
(Taylor, 1997). Therefore, in Figure 4.8, the shoulder for plain cement at 22-27 h represents
the formation of AFm. In the XRD pattern shown in Figure 4.9 on the hydrated cement
paste, and AFm phase is found, which also confirms this.
For the samples with ashes, there are several possibilities related to the sulphate
consumption reaction. Firstly, the anhydrite in the ashes provides sulphates for the
hydration of C3A in the cement, which may result in more AFt formation (Taylor, 1997);
secondly, the sulphate in the ashes does not have an influence on the reaction of C3A, which
means there will be AFm or little AFt found in the cement hydrates; thirdly, the sulphate
in the ashes is a new resource for converting the AFm further to form AFt. Hence, the
amount, dissolving rate and the type of the sulphate in the ashes are important parameters
for its role in the cement reaction (Baur et al., 2004; Tishmack et al., 1999; Shen et al.,
2013; Zajac et al., 2014). Therefore, the ‘shoulder’ for the samples with ashes could be
attributed to the formation of AFt or AFm, which is mainly related to sulphate consumption
during the cement hydration.
Figure 4.8 (b) and Table 4.3 show that the samples with bottom ashes achieved a higher
total heat release after the same hydration duration compared to that of 30% of the total
heat released from plain cement; the highest total heat is reached by samples with M5T,

Chapter 4 61
followed by 5TMS, which indicates the extra reaction of samples with ashes compared
with plain cement.
Table 4.2. Calorimetric parameters of cement hydration and LOI of the investigated sample
CEM I 52.5 R MF-BAW 5TM M5T M7T 5TMS
SMHR [hour] 11.32 14.38 13.61 11.00 11.11 12.31
MHR [mW/gcem] 4.03 4.10 4.26 4.57 4.56 4.40
TH [J/gcem] 366.65 453.18 461.62 444.39 422.17 457.15
LOI 550 °C [% wt.] 0.41 7.37 2.86 2.02 1.16 2.54 SMHR: second maximum heat release rate; MHR: maximum heat release rate; TH: Total heat after 168 hours.
(a)
10 20 30 40 50 60 70
QzQz
Qz
C2SC
2S
2-Theta []
7D CEM I 52.5R + 30% 5TMS 7D CEM I 52.5R + 30% 5TM
7D CEM I 52.5R + 30% M7T 7D CEM I 52.5R + 30% M5T
7D CEM I 52.5R + 30% MF-BAW 7D CEM I 52.5 R
Ms B
Cl-LDHQz
CHCH
CH CH
B
C C C
CH
C2S
B
(b)
10 20 30
2-Theta []
7D CEM I 52.5R + 30% 5TMS
7D CEM I 52.5R + 30% 5TM
7D CEM I 52.5R + 30% M7T
7D CEM I 52.5R + 30% M5T
7D CEM I 52.5R + 30% MF-BAW
7D CEM I 52.5 R
Ms B
Cl-LDH
Figure 4.9: XRD diffractograms of the cement pastes with bottom ashes after 7-days hydration (a) 3-
75° (b) 3-30° (Ms - monosulphate, B - brownmillite, C - calcite, CH - portlandite, Qz - quartz, C2S -
dicalcium silicate phase, Cl-LDH-chloride layered double hydroxide)
It can be seen from the XRD pattern (Figure 4.9) of the hydrated samples with and without
ashes that there is AFm found in the samples of plain cement, M5T and M7T. However,
for the other samples with ashes, there is no AFm or AFt found. Considering the
calorimetry results together, it can be explained that the samples with M5T and M7T may

62 Chapter 4
provide extra sulphate for cement to form AFm as explained above. For the other samples
with ashes, the shoulder can be attributed to the second formation of AFt from AFm
because of newly available sulphate; hence, these samples release a higher amount of heat
during the cement hydration after 7 days. Also, due to the consumption of the AFm and the
poor crystalline structure of AFm (Matschei et al., 2007), there is no AFm or AFt found in
the XRD pattern of these samples.
Nevertheless, the hydration of cement is influenced by the organic content, the water to
cement ratio, sulphate content, particle size distribution, etc.; thus, the results should not
only be explained by a single parameter. However, the total released heat results indicate
that the addition of bottom ashes partially contribute to the cement hydration. Moreover,
the retardation effect on cement hydration might be reduced by heating the milled bottom
ash samples.
4.3.3 Mortar properties
As previous research reported (Filipponi et al., 2003), the lower pozzolanic properties of
MF-BAW and its retardation effect on cement hydration limit the amount to be used as
cement replacement. Hence, based on literature, the replacement ratio of cement by treated
bottom ashes is fixed at 30% in this study. The standard mortars are prepared according to
EN 196-1 (2005), and the fresh and hardened states properties are tested. The results are
shown in the following section.
• Flowability of mortars with treated bottom ashes
The test results show that the flowability of mortar measured by its spread according to the
EN 1015-3 (2007) decreases when treated bottom ash is added, except for the sample with
MF-BAW (175 mm, compared with 170 mm of the reference). 5TMS leads to the lowest
flowability (160 mm), and M7T leads to a higher flowability (169 mm) than M5T (165
mm). However, the quantitative differences on the flowability of the mortars are not
significantly affected by adding the treated bottom ashes.
It is commonly known that the particle size distribution, particle shape, and particle texture
of the alternative powder influence the water demand and subsequently the flowability of
fresh mortar (Jamkar & Rao, 2004; Li et al., 2012). Hence, according to the previous
investigations shown in this chapter (Figures 4.5 and 4.6), these complex influential factors
contribute to the phenomenon observed here.
• Compressive and flexural strengths
The compressive and flexural strengths of mortars containing bottom ash additions after
various curing ages are displayed in Figures 4.10 and 4.11. It is demonstrated that both the
compressive and flexural strengths of all the samples at all curing ages decrease (Li et al.,
2012) when the treated bottom ash is applied. The mortar with 5TMS gains higher strength
than other bottom ash-containing samples. Moreover, the decrease of the flexural strength

Chapter 4 63
for all the samples is not as significant compared to the reduction of the compressive
strength.
Ref. MF-BAW M5T M7T 5TM 5TMS
10
20
30
40
50
60
Co
mp
ressiv
e s
tre
ng
th [M
Pa
]
1d
3d
7d
28d
(a)
MF-BAW M5T M7T 5TM 5TMS
0
10
20
30
40
50
60
70
Co
mp
ress
ive
str
en
gth
re
du
ctio
n [%
]
1d
3d
7d
28d
30% reduction line
(b)
Figure 4.10: (a) Compressive strength of mortars containing bottom ashes after 1, 3, 7, 28 days
curing and (b) its reduction percentage compared with reference
Ref. MF-BAW M5T M7T 5TM 5TMS
0
2
4
6
8
Fle
xura
l str
en
gth
[M
Pa
]
1d
3d
7d
28d
(a)
MF-BAW M5T M7T 5TM 5TMS
0
5
10
15
20
25
30
35
40
30% reduction line
Fle
xura
l str
en
gth
re
du
ctio
n [%
]
1d
3d
7d
28d
(b)
Figure 4.11: (a) Compressive strength of mortars containing bottom ashes after 1, 3, 7, 28 days’
curing and (b) its reduction percentage compared with reference
For all the investigated samples, the compressive strength increases with increasing curing
age. Furthermore, their differences to the reference are reducing with longer curing age. It
is noticed that the mortar with 5TM gains higher compressive strength at all curing ages
than the mortar with MF-BAW. This is attributed to the burning of organic matter in the
MF-BAW at 550 °C, which decreases the detrimental effect on cement hydration.
Additionally, after 28 days curing the decrease of compressive strength of the mortar with
MF-BAW is about 36%, while only about 30% decreasing of the mortar with 5TM,
indicating the detrimental influence of MF-BAW and 5TM. This is in agreement with the
finding presented in Section 4.3.2.
64 Chapter 4
However, the strength test results for the mortar with M5T and M7T are in conflict with
the calorimetry results. These mortars have a relatively higher decrease of the compressive
strength at all curing ages than other samples. For instance, after 28 days the compressive
strength of mortar with M5T and M7T is about 30 MPa and 37 MPa, respectively (51%
and 40% decrease compared with reference, respectively). Their strength is even lower
than the one of the mortar with MF-BAW. This higher reduction should be due to the inner
cracks in mortar (as shown in Figure 4.12) created by the gas generated upon the hardening
of mortar. Nevertheless, inner cracks (Yu et al., 2014) are not found in mortar with MF-
BAW, 5TM and 5TMS, of which the first two have similar contents of metallic Al. This
could be explained as follows: the thermal treatment on the milled bottom ash powder is
more efficient on burning out the organic matter, as well as causing the oxidation of
metallic aluminium. Hence, after thermal treatment, the surface of the metallic Al particles
is oxidized (Biganzoli et al., 2012). Subsequently the reaction between metallic Al and
alkalis takes a longer time, and the gas generated later could not be released before the
hardening of mortar. Eventually, inner cracks form, which reduce dramatically the strength
of mortar.
Inner cracksInner cracks
Figure 4.12: The fracture surface of mortars (reference and M5T)
Mortar with 5TMS gains the highest 28-days compressive strength, about 51 MPa, a 15%
reduction compared to the reference. This result should be due to the following reasons: (1)
the particle size of the 5TMS is controlled under 63 µm, which leads to a denser
microstructure of the mortars; (2) it has the lowest metallic Al content in comparison with
other treated bottom ash samples, in turn less inner cracks are generated; (3) it has a lower
content of SiO2 and a higher amount of CaO, which may participate in the cement hydration
process.
The flexural strength of the mortar decreases after the adding of bottom ash samples;
however, the effect of the treated bottom ash on the flexural strength is more complicated
than for the compressive strength. The flexural strength is significantly influenced by the
cement hydration (Singh & Siddique, 2013), and irregular particle shapes have a positive

Chapter 4 65
effect on flexural strength. As the bottom ash has lower pozzolanic properties and more
irregularly-shaped particles, part of the inert particles act as filler in the mortar matrix.
Hence, there is a better inter-locking effect between the cement paste and these particles,
which contributes to a lower reduction of the flexural strength (Figure 4.11). This finding
is consistent with results reported by other researchers (Chen et al., 2011; Sheen et al.,
2013).
To summarize, the cement blended with 30% MF-BAW could be used to produce low
strength mortar, its compressive strength comparable with that reported previously (Li et
al., 2012). The cement with 30% 5TMS could be used to produce a standard mortar which
has a 28-day compressive strength of 51 MPa (compared to the 61 MPa reference). The
addition of 30% of the treated bottom ashes to replace OPC shows a more than 30%
reduction on the mortar strengths, except the use of 30% of sample 5TMS which has only
15% strength reduction, which demonstrates that it might be possible that 15% of 5TMS
can be added to replace OPC without deteriorate influence on the mortar strength compared
with 100% OPC, as the application of coal fly ash in mortar of concrete (examples shown
in Chapter 5).
4.3.4 Leaching behaviour evaluation
• Leaching properties
The column leaching test is performed on the treated bottom ash samples, as well as on the
mortar with treated samples to evaluate their environmental impact, as detailed in Section
3.2.2. The total amount of investigated components and their leaching concentrations from
treated bottom ashes and mortar containing treated bottom ashes are shown in Table 4.4.
It is indicated in Table 4.4 that the leaching of Sb and Cu from the bottom ash without
thermal treatment exceeds the limit values (more than 4 times of the limit emission value).
However, their leaching concentration reduced significantly after the thermal treatment and
is well under the limiting level. This could be due to the burning of the organic matter,
which is related to the leaching of copper (Arickx et al., 2010; Meima et al., 1999b;
Polettini & Pomi, 2004).
It can be seen that samples MF-BAW and 5TMS have the same amount of Cu, however,
MF-BAW has a higher leaching of Cu. This confirms that the thermal treatment decreases
the leaching of Cu. Sample 5TM has a higher total amount of Cu than 5TMS, but lower
leaching of Cu than 5TMS. This is due to the fact that 5TMS has more soluble Cu, which
is mainly absorbed during the quenching process. Nevertheless, the leaching of
molybdenum is increased, and 5TMS which concentrated the most contaminated fine
powder in MF-BAW has a relatively higher leaching concentration, which further confirms
the finding in (Saffarzadeh et al., 2011; Yang et al., 2013) that the dust-layer on the particle
surface influences the heavy metal leaching. The chloride leaching of 5TM is lower than
that of MF-BAW, which confirms the removal of the highly soluble chlorides by the
66 Chapter 4
thermal treatment (Yang et al., 2013). However, this reduction is not remarkable and the
leaching is still above the limit level. The leaching of sulphates from the investigated
samples exceeds the limit value of the legislation, and it seems thermal treatment did not
influence the leaching of sulphate significantly.
Table 4.3. The Soil Quality Decree (SQD, 2013) limits and leaching properties of treated F-BAW
samples and mortar with the treated F-BAW after 28 days curing, and the total amount of certain
heavy metals and salts
SQD limit
Total amount [mg/kg d.m.] Leaching value [mg/kg d.m.]
MF-
BAW 5TM 5TMS
Treated F-BAW samples Mortar samples
MF-
BAW 5TM 5TMS
MF-
BAW 5TM 5TMS
Sb 0.16 75 86 110 0.79 0.037 0.023 < 0.0089 < 0.0059 < 0.0089 Cu 0.9 3100 4000 3100 3.6 < 0.050 0.3 0.17 < 0.050 0.06
Mo 1 11 10 12 0.67 1.4 2.6 0.09 0.11 0.092
Cl- 616 3800 5300 9200 4400 3300 6600 350 290 450 SO4
2- 1730 18100 24000 45700 16000 20000 23000 180 180 270
The leaching properties of the mortars with treated bottom ash samples are also studied to
investigate the immobilization of the contaminants in the samples. It can be seen in Table
4.4 that the leaching of all the investigated heavy metals and the salts is far below the limit
leaching level. Hence, the mortars with 30% cement replacement by the treated bottom ash
meet the environmental requirement. Moreover, the sulphate is more immobilized than the
chloride in the mortar, when comparing their total amount and leached concentration
(Table 4.4). This may further prove that the sulphate in bottom ash participates in the
cement reaction as explained in Section 4.3.2, hence the leaching of sulphate in the mortar
decreases more than that of chloride.
Consequently, in this chapter the leaching of Sb and Cu of the MF-BAW is reduced to
values under the limit by thermal treatment. Furthermore, the mortar with treated bottom
ash complies with the national environmental legislation considering the leaching of
contaminants in future life cycles.
4.4 Conclusions
In this chapter, milling and thermal treatment are applied to upgrade the properties of fine
MSWI bottom ash (0-2 mm) from Wijster (F-BAW), and the characteristics of the treated
bottom ashes are investigated. Moreover, their effect on cement hydration and mortar
properties containing 30% bottom ashes as cement replacement are illustrated. The
following conclusions can be drawn:
(1) The main chemical components of the MSWI bottom ash are SiO2, CaO, Al2O3,
Fe2O3 and the main crystalline phases are quartz, calcite, anhydrite and hematite.
After the thermal treatment at 550 ˚C and 750 ˚C, qualitative differences on the
chemical compositions are not identified. The higher temperature results in the

Chapter 4 67
decomposition of calcite and enhances the oxidation of iron. The amount of metallic
Al is not reduced significantly after the thermal treatment. However, the short time
and low speed milling followed by sieving can separate the metallic Al from the
fine powder chosen for the investigation. Additionally, this fine powder has a lower
amount of SiO2 and higher amounts of CaO and Al2O3.
(2) The hydration of the cement is retarded when milled raw F-BAW is added, which
is due to the organic matter and heavy metals. The thermal treatment can reduce the
retardation effect of the bottom ash on cement hydration. Furthermore, an efficient
thermal treatment on milled bottom ash enhances the contribution of the bottom ash
on cement hydration and minimizes its retardation effect. The sulphate content in
the bottom ash accelerates the hydration of C3A and then increases the formation
of AFm during the deceleration stage of cement hydration.
(3) The 28-day compressive strength of the mortar with 30% treated bottom ashes
replacement is 30-51 MPa, which is less than the reference (61 MPa). The highest
strength is obtained in mortars with 5TMS; the 30% cement replacement results in
15% compressive strength and 8% flexural strength reduction. Although an
efficient thermal treatment increases the contribution of bottom ash on cement
hydration, the oxidation of metallic Al delays the generation of gas. Eventually, the
cracks in the hardened mortar reduce its strength.
(4) The thermal treatment efficiently reduces the leaching of Sb and Cu, and slightly
decreases the chloride leaching of the bottom ash fines. The mortars with 30%
treated bottom ashes are environmentally acceptable according to the Dutch
legislation, as the leaching of heavy metals and salts is well under the limit level.
The fine dust-layers removed from the bottom ash particles have higher leaching of
heavy metals, which confirms that these layers influence the heavy metals leaching
of MSWI bottom ash.
(5) The technique for the removal of metallic Al by slow milling (and the formation of
metal plates which can be sieved out) was proposed and its applicability was proven.
To further study the influence of treatments on the leaching of contaminants related to the
application purpose of MSWI bottom ash, the use of fine MSWI bottom ash (0-2) as sand
replacement in mortar is investigated regarding blended binders in the next chapter. The
leaching behaviours of contaminants in fine bottom ashes during its application in mortar
is also investigated.

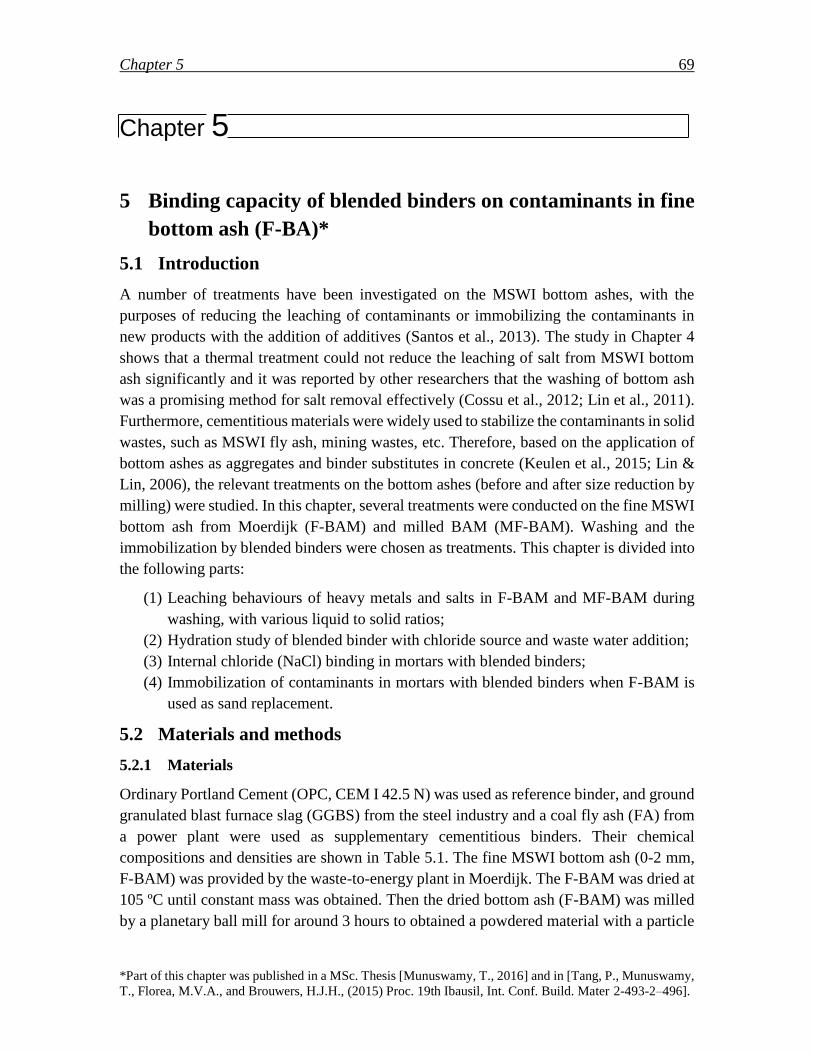
Chapter 5 69
*Part of this chapter was published in a MSc. Thesis [Munuswamy, T., 2016] and in [Tang, P., Munuswamy,
T., Florea, M.V.A., and Brouwers, H.J.H., (2015) Proc. 19th Ibausil, Int. Conf. Build. Mater 2-493-2–496].
Chapter 5
5 Binding capacity of blended binders on contaminants in fine
bottom ash (F-BA)*
5.1 Introduction
A number of treatments have been investigated on the MSWI bottom ashes, with the
purposes of reducing the leaching of contaminants or immobilizing the contaminants in
new products with the addition of additives (Santos et al., 2013). The study in Chapter 4
shows that a thermal treatment could not reduce the leaching of salt from MSWI bottom
ash significantly and it was reported by other researchers that the washing of bottom ash
was a promising method for salt removal effectively (Cossu et al., 2012; Lin et al., 2011).
Furthermore, cementitious materials were widely used to stabilize the contaminants in solid
wastes, such as MSWI fly ash, mining wastes, etc. Therefore, based on the application of
bottom ashes as aggregates and binder substitutes in concrete (Keulen et al., 2015; Lin &
Lin, 2006), the relevant treatments on the bottom ashes (before and after size reduction by
milling) were studied. In this chapter, several treatments were conducted on the fine MSWI
bottom ash from Moerdijk (F-BAM) and milled BAM (MF-BAM). Washing and the
immobilization by blended binders were chosen as treatments. This chapter is divided into
the following parts:
(1) Leaching behaviours of heavy metals and salts in F-BAM and MF-BAM during
washing, with various liquid to solid ratios;
(2) Hydration study of blended binder with chloride source and waste water addition;
(3) Internal chloride (NaCl) binding in mortars with blended binders;
(4) Immobilization of contaminants in mortars with blended binders when F-BAM is
used as sand replacement.
5.2 Materials and methods
5.2.1 Materials
Ordinary Portland Cement (OPC, CEM I 42.5 N) was used as reference binder, and ground
granulated blast furnace slag (GGBS) from the steel industry and a coal fly ash (FA) from
a power plant were used as supplementary cementitious binders. Their chemical
compositions and densities are shown in Table 5.1. The fine MSWI bottom ash (0-2 mm,
F-BAM) was provided by the waste-to-energy plant in Moerdijk. The F-BAM was dried at
105 ºC until constant mass was obtained. Then the dried bottom ash (F-BAM) was milled
by a planetary ball mill for around 3 hours to obtained a powdered material with a particle

70 Chapter 5
size under around 125 µm (MF-BAM). The 10% wt. NaCl solution was prepared by mixing
pure NaCl with distilled water.
Table 5.1: Material properties
Components
[% wt.] OPC GGBS FA F-BAM
CaO 67.9 40.0 6.2 18.6
SiO2 14.9 30.2 45.2 39.1
Al2O3 3.6 12.7 27.5 7.6
Fe2O3 3.3 0.6 6.6 12.9
Na2O 0 0 1.0 1.0
K2O 0.8 0.6 2.2 1.1
MgO 1.6 9.1 1.4 1.9
P2O5 0.4 0.0 0.8 0.9
TiO2 0.3 1.4 0.0 0.0
MnO 0.1 0.3 0.1 0.2
CuO 0.0 0.0 0.0 0.4
ZnO 0.1 0.0 0.1 0.7
Cl 0.11 0.1 0.0 0.3
SO3 4.5 3.6 1.7 4.3
others 0.4 0.3 2.1 1.9
LOI 2.2 1.2 5.3 9.2
Density
[g/cm3] 3.1 2.9 2.3 2.7
5.2.2 Experimental procedure
• Water washing of F-BAM and MF-BAM
A dynamic shaking test was conducted on the F-BAM and MF-BAM using a horizontal
shaker at a speed of 250 rpm for 24 hours; the liquid to solid ratios (L/S) chosen was 2, 4,
6, 8 and 10. After the shaking test, the samples were filtered through a 45 µm filter paper
and the leachate was collected for the determination of component content.
• Binder hydration investigation
The study in Chapter 4 shows that the chloride in the fine bottom ash is still quite high after
thermal treatment and controls the application amount of treated bottom ash in mortar, and
the bottom ashes has retardation effect on binder hydration (Chapter 3) which is assumed
due to the contaminants in fine bottom ash. Therefore, to further study the influence of
contaminants on binder hydration and the binding capacity of blended binders on the
contaminants, a salt solution containing 10% sodium chloride (NaCl) (as used for rapid
chloride migration test in concrete in NT BUILD 492, (1999)), and waste water from
washing of F-BAM were applied as mixing liquid, respectively. The blended binders are
OPC (named M1), OPC with 40% GGBS (named M2) and OPC with 15% FA (named M3).
The water to binder ratio was 0.5. The waste water from washing of F-BAM with liquid to
solid ratios of 2, 4, 6 and 8, respectively, was used.

Chapter 5 71
• Mortars with NaCl
The standard mortar was prepared with the three types of binders above-mentioned
according to EN 196-1 (2005) and the water used was the same salt solution used for the
calorimetry test. The flexural and compressive strengths were determined after different
curing ages. The crushed mortar samples were used for a leaching test with L/S 10 for 24
hours. The chloride content in the leachate was then determined using ion chromatography
(IC). The washed samples were milled and then digested using concentrated HNO3; the
chloride extracted in the liquid was then determined using IC.
• Mortars with F-BAM and MF-BAM
The F-BAM was used as sand replacement (100%) in standard mortars with three types of
blended binders and the MF-BAM was used as binder alternative (30% wt.). The flexural
and compressive strengths of the mortars were tested. Shaking testes with L/S of 10 and
for 24 hours were performed on the crushed mortar samples with bottom ashes, and the
concentrations of heavy metals and salts in the leachate were determined using inductively
coupled plasma (ICP) and IC methods, respectively.
5.3 Washing treatment
The total amount of investigated heavy metals and salts in F-BAM are shown in Table 5.2,
as well as their leaching concentrations during column leaching test; according to
legislation (SQD, 2013) (Chapters 3 and 4), the leaching of Sb, Cu, chloride and sulphate
exceed the limits defined for the non-shaped materials.
Table 5.2:The total amount of investigated salts and heavy metals in F-BAM and their leaching
concentrations during the column test, and the limit level in SQD (2013)
Sb Cu Mo Chloride Sulphate
[mg/kg d.m.]
Total amount 83 3100 19 2100 22900
Column leaching 0.47 1.1 0.68 950 11000
Leachability [%] 0.57 0.035 3.6 45 48
SQD limit 0.32 0.9 1.0 616 1730
Figure 5.1 shows the leached-out concentrations of Sb and Cu during the shaking test with
various L/S ratios. For both F-BAM and MF-BAM, the leaching of Sb has a linearly
increasing trend with the increase of L/S up to L/S 8, while there is a sharp increase when
the L/S ratio is 10. The Sb leaching of MF-BAM is around 0.4-1.2 times higher than that
of F-BAM, and this factor increases from 0.4 to 1.2 with the L/S ratio increase from 4 to

72 Chapter 5
10. The leaching concentration of Sb from F-BAM during the column leaching test is
around 0.47 mg/kg d.m. at a L/S ratio of 10, which is around 80% of that from F-BAM
during the shaking test. The concentration of Cu leached out from F-BAM during the
shaking test shows a direct correlation with the L/S ratio. For MF-BAM, the leaching
concentration of Cu is quite similar with various L/S ratios, and it is much lower than that
of F-BAM (around 3 times less). The Cu leaching from F-BAM by shaking test is about
1.6 times higher than that from the column leaching test.
2 4 6 8 10
0.0
0.1
0.2
0.3
0.4
0.5
0.6
0.7
0.8
0.9
Sb
[m
g/k
g d
.m.]
L/S
F-BAM
MF-BAM
(a)
2 4 6 8 10
0.5
1.0
1.5
2.0
2.5
3.0
Cu
[m
g/k
g d
.m.]
L/S
F-BAM
MF-BAM
(b)
Figure 5.1: The leaching behaviour of (a) Sb and (b) Cu with various L/S ratios in shaking test
2 4 6 8 10
400
600
800
1000
1200
1400
1600
Chlo
ride [m
g/k
g d
.m.]
L/S
F-BAM
F-MBAM
(a)
2 4 6 8 10
2000
4000
6000
8000
10000
12000
14000
16000
Su
lpha
te [
mg
/kg d
.m.]
L/S
F-BAM
F-MBAM
(b)
Figure 5.2: The leaching behavior of (a) chloride and (b) sulphate with various L/S ratios in shaking
test
It can be seen in Figure 5.2 (a) that the chloride leaching concentration during the shaking
test seems not to be influenced by the L/S ratio and also that the MF-BAM has a slightly
lower chloride leaching than F-BAM (around 10-30%). The sulphate leaching of both F-
BAM and MF-BAM increases when the L/S ratio increases, and the MF-BAM has a
slightly lower sulphate leaching (with around 20%). The sulphate leaching during column
leaching is approximately 20% lower than the one during the shaking leaching test.

Chapter 5 73
The leaching of Ni, Zn, Pb and Cr of F-BAM in shaking tests all show an increasing trend
with the increased L/S ratio, while their leaching from MF-BAM is much lower (even
under the detection levels). It seems that the leaching of elements from the MF-BAM is
lower than that from F-BAM during the shaking test with various L/S ratios, except for Sb.
The leaching of Cu from MF-BAM and chloride from both F-BAM and MF-BAM seem
independent of the L/S ratio.
2 4 6 8 10
0.00
0.02
0.04
0.06
0.08
Ni [m
g/k
g d
.m.]
L/S
F-BAM
MF-BAM
(a)
2 4 6 8 10
0.0
0.5
1.0
1.5
2.0
2.5
3.0
3.5
4.0
4.5
Zn
[m
g/k
g d
.m.]
L/S
F-BAM
(b)
2 4 6 8 10
0.0
0.5
1.0
1.5
2.0
2.5
Pb
[m
g/k
g d
.m.]
L/S
F-BAM
(c)
2 4 6 8 10
0.0
0.1
0.2
0.3
0.4
0.5
0.6
Cr
[mg
/kg
d.m
.]
L/S
F-BAM
MF-BAM
(d)
Figure 5.3: The leaching of (a) nickel, (b) zinc, (c) lead and (d) chrome with various L/S ratios in
shaking test
It was supposed that the leaching from the MF-BAM would be higher than that of F-BAM,
due to the increasing contact surface area with water during shaking, which increases the
chance for elements to be washed out. However, the test results show an opposite
phenomenon. There are several supposed mechanisms which may contribute to the testing
results.
(1) Chloride in MSWI bottom ash is highly soluble, hence, the L/S ratio does not have
a significant effect on its leaching, similar as reported in (Alam et al., 2017).
Sulphate leaching is related to the solubility of gypsum and other sulphate
containing phases in fine bottom ashes, and the increase of L/S ratio results in
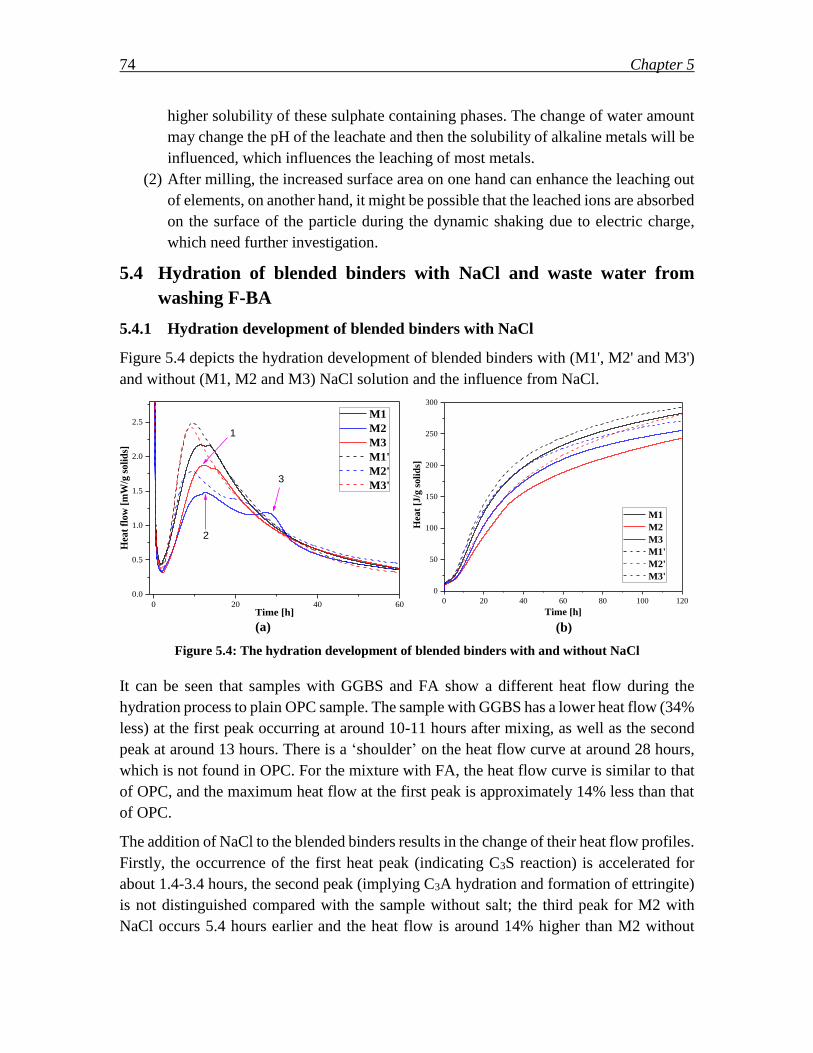
74 Chapter 5
higher solubility of these sulphate containing phases. The change of water amount
may change the pH of the leachate and then the solubility of alkaline metals will be
influenced, which influences the leaching of most metals.
(2) After milling, the increased surface area on one hand can enhance the leaching out
of elements, on another hand, it might be possible that the leached ions are absorbed
on the surface of the particle during the dynamic shaking due to electric charge,
which need further investigation.
5.4 Hydration of blended binders with NaCl and waste water from
washing F-BA
5.4.1 Hydration development of blended binders with NaCl
Figure 5.4 depicts the hydration development of blended binders with (M1', M2' and M3')
and without (M1, M2 and M3) NaCl solution and the influence from NaCl.
0 20 40 60
0.0
0.5
1.0
1.5
2.0
2.5
Hea
t fl
ow
[m
W/g
so
lid
s]
Time [h]
M1
M2
M3
M1'
M2'
M3'
1
2
3
(a)
0 20 40 60 80 100 120
0
50
100
150
200
250
300
Hea
t [J
/g s
oli
ds]
Time [h]
M1
M2
M3
M1'
M2'
M3'
(b)
Figure 5.4: The hydration development of blended binders with and without NaCl
It can be seen that samples with GGBS and FA show a different heat flow during the
hydration process to plain OPC sample. The sample with GGBS has a lower heat flow (34%
less) at the first peak occurring at around 10-11 hours after mixing, as well as the second
peak at around 13 hours. There is a ‘shoulder’ on the heat flow curve at around 28 hours,
which is not found in OPC. For the mixture with FA, the heat flow curve is similar to that
of OPC, and the maximum heat flow at the first peak is approximately 14% less than that
of OPC.
The addition of NaCl to the blended binders results in the change of their heat flow profiles.
Firstly, the occurrence of the first heat peak (indicating C3S reaction) is accelerated for
about 1.4-3.4 hours, the second peak (implying C3A hydration and formation of ettringite)
is not distinguished compared with the sample without salt; the third peak for M2 with
NaCl occurs 5.4 hours earlier and the heat flow is around 14% higher than M2 without

Chapter 5 75
NaCl. The maximum heat flow of the first peak for samples with NaCl addition increases
by 15%, 25% and 30% compared to M1, M2 and M3 without salt, respectively.
The total released heat after 160 hours from samples without salt decreases with the
addition of GGBS and FA, M2 (with 40% GGBS to replace OPC) has the lowest total heat
(12% less than M1) while M3 has 10% less total heat with 15% FA for OPC replacement.
This demonstrates the contribution of GGBS and FA during cement hydration. For samples
with NaCl addition, the total heat increases compared with samples without salt addition;
the increase is about 1%, 13% and 4% for samples M1', M2' and M3', respectively. From
the above results, it can be concluded that the NaCl has more influences on OPC blended
with GGBS and FA, at least at the early hydration age. Hence, it can be summarized from
the isothermal calorimetry results that the chloride sourced from NaCl accelerates the
hydration of C3S and C3A, and this effect is more pronounced on blended binders by OPC
with GGBS or FA.
Table 5.3:The heat flow and total heat of the mixtures with (M1', M 2' and M3') and without (M1
M2 and M3) NaCl
Samples
Peak 1 Peak 2 Peak 3 Total heat
Time Heat flow Time Heat flow Time Heat flow Time Heat
[hour] [mW/g] [hour] [mW/g] [hour] [mW/g] [hour] [J/g]
M1 11.4 2.2 13.4 2.2 * *
160
302
M2 10.7 1.4 13.0 1.5 27.5 1.2 267
M3 12.4 1.9 15.4 1.8 * * 273
M1' 9.6 2.5 * * * *
160
304
M2' 9.3 1.8 * * 22.0 1.4 303
M3' 9.0 2.4 * * * * 283
*: no peak
Figure 5.5 depicts the crystalline phases of the hydrated samples (28 days) with and without
NaCl addition. The samples blended by OPC and GGBS or FA shows relatively higher
peaks representing hydrotalcite, which is attributed to the higher amount of Al and Mg
content in GGBS or FA (Kayali et al., 2012). The XRD pattern of the samples with NaCl
addition shows peaks of Friedel’s salt (Fs) compared with the ones without chloride source;
moreover, the sample blended by OPC and GGBS shows relative higher Hc peak compared
with the other two mixtures.
It can be assumed that the generated AFm phases reacted with chloride to form Fs salt,
which continuously consume the AFm. Consequently, the transformation of AFt to AFm
is promoted, as well as the generation of AFt from the hydration of C3S.

76 Chapter 5
10 20 30 40 50 60 70
0
500
1000
1500
350036003700380039004000
Inte
nsi
ty [cp
s]
2-Theta []
M3
M2
M1
1
(a)
10 20 30 40 50 60 70
0
500
1000
1500
2000
350036003700380039004000
4
6
6
3
4
3
65
4
3
7
4
3
1
Inte
nsi
ty [cp
s]
2-Theta []
M3'
M2'
M1'
12
(b)
Figure 5.5: The XRD pattern of the hdyrated samples with and without NaCl addition (1-Ettringite;
2-Friedel’s salt (Fs)); 3-Portlandite; 4-Calcite; 5-Gypsum/C2S; 6-C2S/C3S; 7-Hydrotalcite (Hc))
5.4.2 Hydration development of blended binders with waste water
The waste water used for washing F-BAM was collected and mixed with cement to
investigate the influence of contaminants from F-BAM on the cement hydration; the
hydration development of blended binders is investigated through isothermal calorimetry.
The calorimeter profiles in Figure 5.6 depict that the waste water from F-BAM has a
retardation effect on the hydration of blended binders independent of the L/S ratio for F-
BAM washing. Moreover, this retardation effect is enhanced when the L/S ratio used for
washing F-BAM increased, and the total heat of the blended binders is higher than the
binders mixed with distilled water.
This could be explained by two reasons: (1) the heavy metals washed out from the F-BAM
retard the cement hydration and their concentrations increase with the L/S ratios as
described in Section 5.3 (Weeks et al., 2008); however, there were also research results
indicating that some heavy metals had an accelerating effect on cement hydration, such as
Cr, Pb, etc. (Chen et al., 2007); (2) the sulphate content in the waste water participated in
the binder hydration, which is demonstrated from the higher second ettringite generation
peaks; this has a retardation effect on cement hydration as reported (Zajac et al., 2014);
moreover, as shown in the above results on hydration development of blended cement with
NaCl, the chloride could accelerate the binder hydration; hence, it could be possible that
the chloride washed out from F-BAM in the leachate also has a similar accelerating effect;
(3) the organic matter washed out from the F-BAM also had a retardation effect on the
cement hydration. For instance, it was reported in (Chen & Wang, 2006) that the humic
and fluvic acid content (which were also detected as main organic matter in MSWI bottom
ash related to Cu leaching (Guimaraes et al., 2006; Van Zomeren & Comans, 2004)) in the
soil had a significant influence on the setting of cement treatment soil; (4) generally, the
pH of the leachate from bottom ash is around 9-10, which may also promote the binder
hydration.
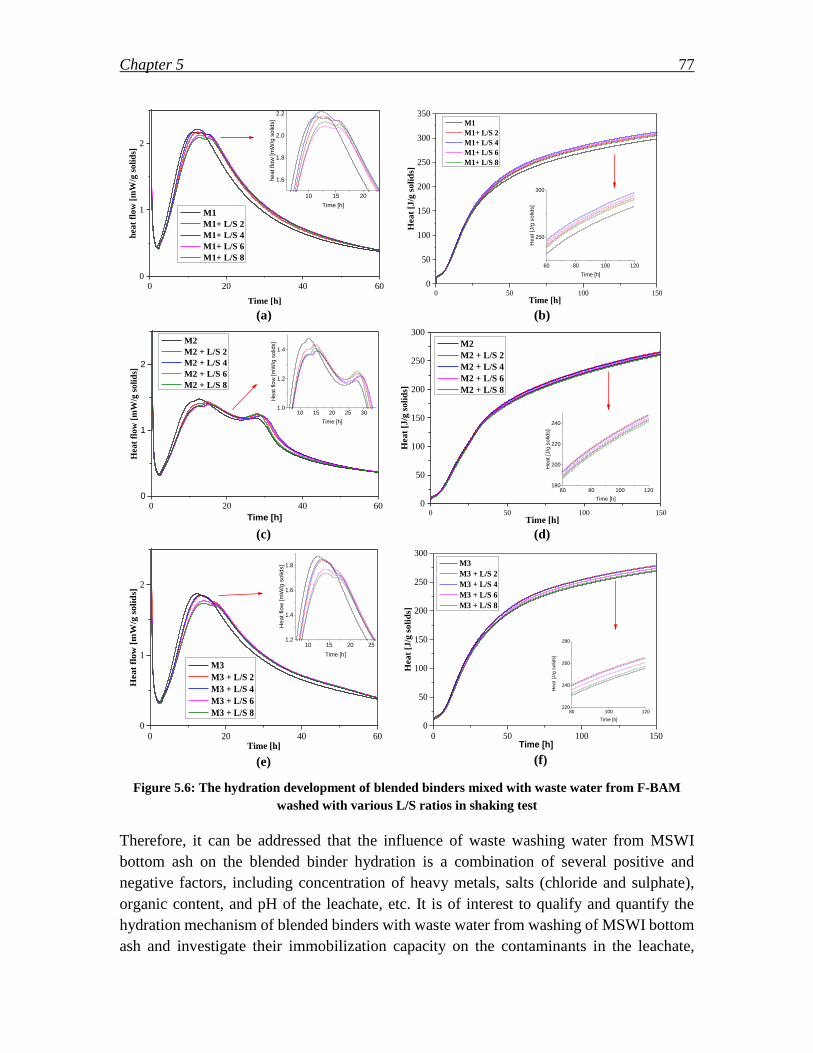
Chapter 5 77
0 20 40 600
1
2
hea
t fl
ow
[m
W/g
soli
ds]
Time [h]
M1
M1+ L/S 2
M1+ L/S 4
M1+ L/S 6
M1+ L/S 8
10 15 20
1.6
1.8
2.0
2.2
heat flow
[m
W/g
solid
s]
Time [h]
(a)
0 50 100 150
0
50
100
150
200
250
300
350
Heat
[J/g
soli
ds]
Time [h]
M1
M1+ L/S 2
M1+ L/S 4
M1+ L/S 6
M1+ L/S 8
60 80 100 120
250
300
Heat
[J/g
solid
s]
Time [h]
(b)
0 20 40 600
1
2
Hea
t fl
ow
[m
W/g
so
lid
s]
Time [h]
M2
M2 + L/S 2
M2 + L/S 4
M2 + L/S 6
M2 + L/S 8
10 15 20 25 301.0
1.2
1.4
He
at
flo
w [
mW
/g s
olid
s]
Time [h]
(c)
0 50 100 150
0
50
100
150
200
250
300
Hea
t [J
/g s
oli
ds]
Time [h]
M2
M2 + L/S 2
M2 + L/S 4
M2 + L/S 6
M2 + L/S 8
60 80 100 120180
200
220
240
Hea
t [J
/g s
olid
s]
Time [h]
(d)
0 20 40 600
1
2
Hea
t fl
ow
[m
W/g
so
lid
s]
Time [h]
M3
M3 + L/S 2
M3 + L/S 4
M3 + L/S 6
M3 + L/S 8
10 15 20 251.2
1.4
1.6
1.8
Heat
flow
[m
W/g
solid
s]
Time [h]
(e)
0 50 100 1500
50
100
150
200
250
300
Heat
[J/g
soli
ds]
Time [h]
M3
M3 + L/S 2
M3 + L/S 4
M3 + L/S 6
M3 + L/S 8
80 100 120220
240
260
280
He
at
[J/g
so
lids]
Time [h]
(f)
Figure 5.6: The hydration development of blended binders mixed with waste water from F-BAM
washed with various L/S ratios in shaking test
Therefore, it can be addressed that the influence of waste washing water from MSWI
bottom ash on the blended binder hydration is a combination of several positive and
negative factors, including concentration of heavy metals, salts (chloride and sulphate),
organic content, and pH of the leachate, etc. It is of interest to qualify and quantify the
hydration mechanism of blended binders with waste water from washing of MSWI bottom
ash and investigate their immobilization capacity on the contaminants in the leachate,

78 Chapter 5
which may provide indicating information of the integral treatments on MSWI bottom ash,
such as combined treatments of water washing and binder stabilization.
5.5 Mortars with NaCl and the chloride binding capacity
Figure 5.7 depicts the flexural and compressive strength of mortars with blended binders
and NaCl. It can be seen that the mortar with GGBS has the highest compressive strength
and the mortar with FA has the lowest strength, while the compressive strength after 56
days is almost the same as the mortar with OPC. This complies with the calorimetry results
shown in Section 5.4.
0 14 28 42 56 70 84 98
2
4
6
8
10
Fle
xura
l str
en
gth
[M
Pa
]
Curing days [day]
M1'
M2'
M3'
(a)
0 14 28 42 56 70 84 98
10
20
30
40
50
60
70
Co
mpre
ssiv
e s
tren
gth
[M
Pa
]
Curing days [day]
M1'
M2'
M3'
(b)
Figure 5.7: The flexural and compressive strengths of the mortar with NaCl addition
Figure 5.8 (a-b) describes the leaching profile of chloride from the crushed mortars with
the addition of NaCl and the chloride content left in the washed mortars samples after
shaking test. It can be seen that there is a decreasing trend of the concentration of leached
out chloride along with curing time for both mortars M1', M2' and M3'. Moreover, the
chloride leached out tends to be stable after 7 days curing. Comparing the chloride leaching
of M1', M2' and M3', it seems that M1' and M2' have less chloride leached out during most
of the tests; however, due to the fact there are too many influencing parameters on the
leaching results, it is hard to quantify their differences.
Hence, the total chloride content of the unwashed and washed mortars was tested (Figure
5.8 (c-d)). It was noticed that the total chloride in the unwashed mortars has a decreasing
trend with the curing age, this is due to the water curing methods. During the curing, the
free chloride which is not bounded diffuse into the water. However, it can be seen clearly
in Figure 5.8 (b) that the total amount of chloride left in the washed mortar samples
increases with curing time for all the mixes and M2' has much higher chloride content than
that in M1' and M3', while M3' has the lowest level of chloride bounded in the mortar
matrix. It is worth to mention that there is a sharp increase of chloride content in the washed
mortar of M2', which indicates the bound chloride increased dramatically. M3' has lower
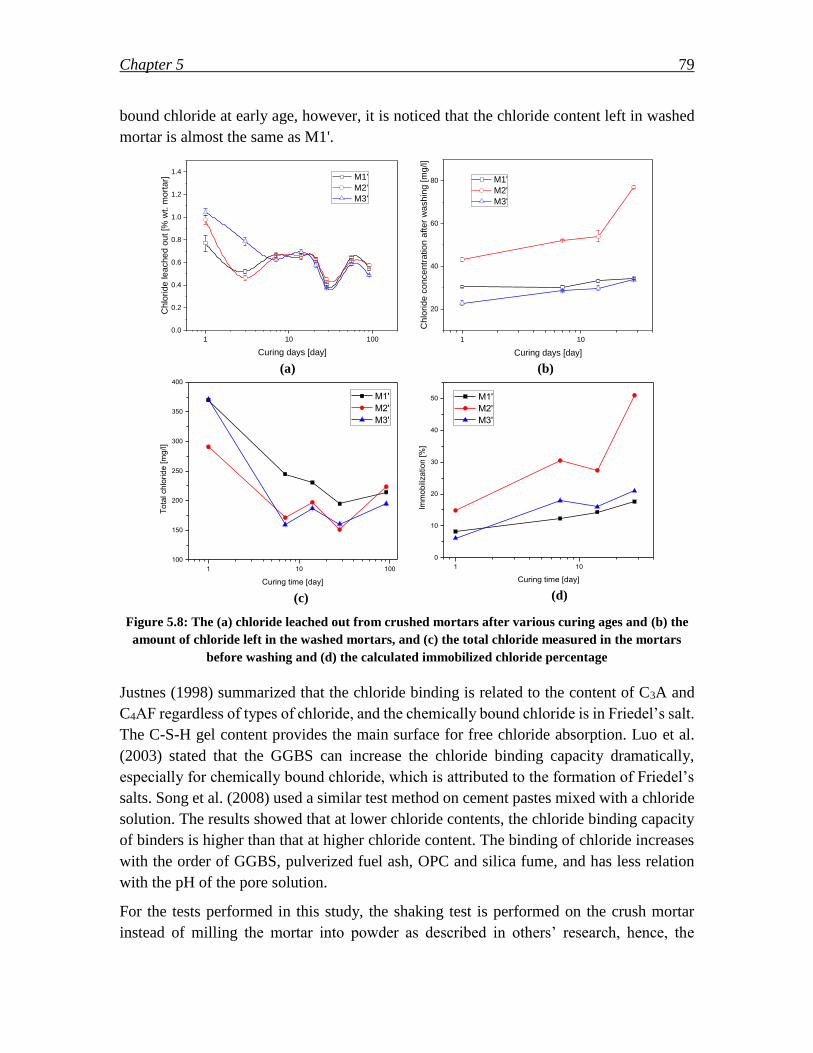
Chapter 5 79
bound chloride at early age, however, it is noticed that the chloride content left in washed
mortar is almost the same as M1'.
1 10 100
0.0
0.2
0.4
0.6
0.8
1.0
1.2
1.4C
hlo
ride leached o
ut [%
wt. m
ort
ar]
Curing days [day]
M1'
M2'
M3'
(a)
1 10
20
40
60
80
Chlo
ride c
oncentr
ation a
fter
washin
g [m
g/l]
Curing days [day]
M1'
M2'
M3'
(b)
1 10 100
100
150
200
250
300
350
400
To
tal ch
lori
de
[m
g/l]
Curing time [day]
M1'
M2'
M3'
(c)
1 10
0
10
20
30
40
50
Imm
ob
iliza
tio
n [%
]
Curing time [day]
M1'
M2'
M3'
(d)
Figure 5.8: The (a) chloride leached out from crushed mortars after various curing ages and (b) the
amount of chloride left in the washed mortars, and (c) the total chloride measured in the mortars
before washing and (d) the calculated immobilized chloride percentage
Justnes (1998) summarized that the chloride binding is related to the content of C3A and
C4AF regardless of types of chloride, and the chemically bound chloride is in Friedel’s salt.
The C-S-H gel content provides the main surface for free chloride absorption. Luo et al.
(2003) stated that the GGBS can increase the chloride binding capacity dramatically,
especially for chemically bound chloride, which is attributed to the formation of Friedel’s
salts. Song et al. (2008) used a similar test method on cement pastes mixed with a chloride
solution. The results showed that at lower chloride contents, the chloride binding capacity
of binders is higher than that at higher chloride content. The binding of chloride increases
with the order of GGBS, pulverized fuel ash, OPC and silica fume, and has less relation
with the pH of the pore solution.
For the tests performed in this study, the shaking test is performed on the crush mortar
instead of milling the mortar into powder as described in others’ research, hence, the

80 Chapter 5
chloride bounded in the washed mortar includes the one chemically bound by the formation
of Friedel’s salts, one part absorbed on the surface of hydration products and one part
entrapped into the matrix of the mortar.
5.6 Mortars with blended binders, F-BA and MF-BA
5.6.1 Strength development of mortars
The strength of the mortar with 100% sand replacement by fine MSWI bottom ash is shown
in Figure 5.9. The flexural strengths of mortar did not have significant differences based
on the binder types. Their compressive strengths have a similar trend, the mortar with
GGBS obtaining the highest value.
0 20 40 60 80 100
0
1
2
3
4
5
Fle
xu
ral str
en
gth
[M
Pa
]
Curing days [day]
M1
M2
M3
(a)
0 14 28 42 56 70 84 98
0
5
10
15
20
25
Co
mp
ressiv
e s
tre
ng
th [M
Pa
]
Curing days [day]
M1
M2
M3
(b)
Figure 5.9: The (a) flexural and (b) compressive strength of mortars with F-BAM as 100% sand
replacement in mortars with blended binders
0 7 14 21 28
0
10
20
30
40
50
60
70
Co
mp
ress
ive
str
en
gth
[M
Pa
]
Curing time [days]
M1-8% M1-15% M1-30%
M2-8% M2-15% M2-30%
M3-8% M3-15% M3-30%
(a)
0 7 14 21 28
1
2
3
4
5
6
7
8
9
10
Fle
xu
ral str
en
gth
[M
Pa
]
Curing time [days]
M1-8% M1-15% M1-30%
M2-8% M2-15% M2-30%
M3-8% M3-15% M3-30%
(b)
Figure 5.10: The flexural and compressive strength of mortars with MF-BAM replacement level of
8%, 15% and 30%
Figure 5.10 shows the strengths of the mortars with binder replacement by milled F-BAM
(MF-BAM) by 8%, 15% and 30% by mass, where number 1, 2 and 3 represent OPC, OPC
blended with GGBS, and OPC blended with coal fly ash, respectively.
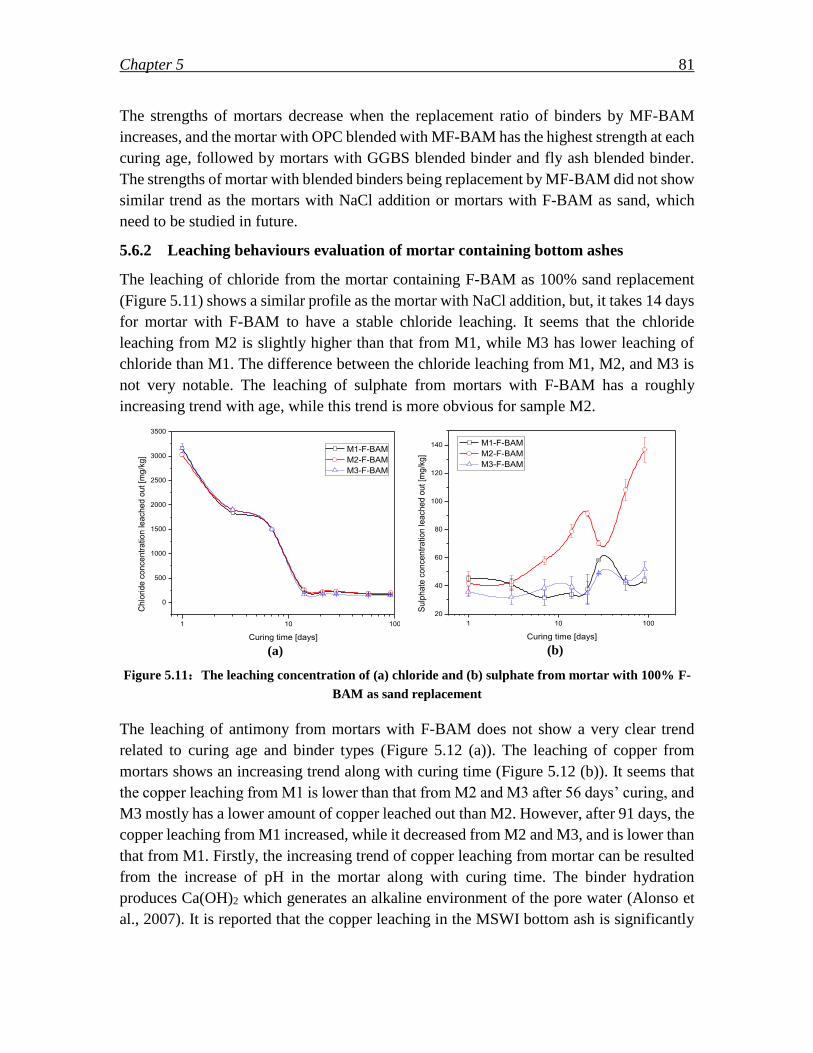
Chapter 5 81
The strengths of mortars decrease when the replacement ratio of binders by MF-BAM
increases, and the mortar with OPC blended with MF-BAM has the highest strength at each
curing age, followed by mortars with GGBS blended binder and fly ash blended binder.
The strengths of mortar with blended binders being replacement by MF-BAM did not show
similar trend as the mortars with NaCl addition or mortars with F-BAM as sand, which
need to be studied in future.
5.6.2 Leaching behaviours evaluation of mortar containing bottom ashes
The leaching of chloride from the mortar containing F-BAM as 100% sand replacement
(Figure 5.11) shows a similar profile as the mortar with NaCl addition, but, it takes 14 days
for mortar with F-BAM to have a stable chloride leaching. It seems that the chloride
leaching from M2 is slightly higher than that from M1, while M3 has lower leaching of
chloride than M1. The difference between the chloride leaching from M1, M2, and M3 is
not very notable. The leaching of sulphate from mortars with F-BAM has a roughly
increasing trend with age, while this trend is more obvious for sample M2.
1 10 100
0
500
1000
1500
2000
2500
3000
3500
Ch
lori
de
co
nce
ntr
atio
n le
ach
ed
ou
t [m
g/k
g]
Curing time [days]
M1-F-BAM
M2-F-BAM
M3-F-BAM
(a)
1 10 100
20
40
60
80
100
120
140
Su
lph
ate
co
nce
ntr
atio
n le
ach
ed
ou
t [m
g/k
g]
Curing time [days]
M1-F-BAM
M2-F-BAM
M3-F-BAM
(b)
Figure 5.11:The leaching concentration of (a) chloride and (b) sulphate from mortar with 100% F-
BAM as sand replacement
The leaching of antimony from mortars with F-BAM does not show a very clear trend
related to curing age and binder types (Figure 5.12 (a)). The leaching of copper from
mortars shows an increasing trend along with curing time (Figure 5.12 (b)). It seems that
the copper leaching from M1 is lower than that from M2 and M3 after 56 days’ curing, and
M3 mostly has a lower amount of copper leached out than M2. However, after 91 days, the
copper leaching from M1 increased, while it decreased from M2 and M3, and is lower than
that from M1. Firstly, the increasing trend of copper leaching from mortar can be resulted
from the increase of pH in the mortar along with curing time. The binder hydration
produces Ca(OH)2 which generates an alkaline environment of the pore water (Alonso et
al., 2007). It is reported that the copper leaching in the MSWI bottom ash is significantly
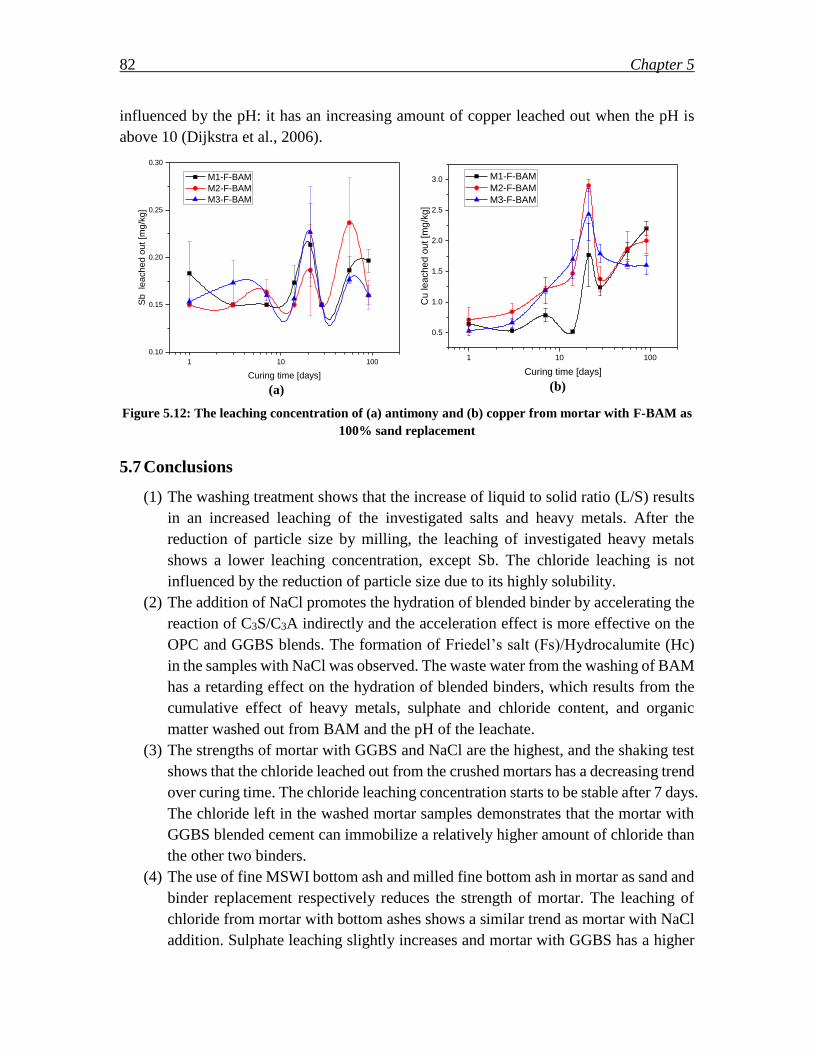
82 Chapter 5
influenced by the pH: it has an increasing amount of copper leached out when the pH is
above 10 (Dijkstra et al., 2006).
1 10 100
0.10
0.15
0.20
0.25
0.30
S
b le
ach
ed o
ut [m
g/k
g]
Curing time [days]
M1-F-BAM
M2-F-BAM
M3-F-BAM
(a)
1 10 100
0.5
1.0
1.5
2.0
2.5
3.0
Cu leached o
ut [m
g/k
g]
Curing time [days]
M1-F-BAM
M2-F-BAM
M3-F-BAM
(b)
Figure 5.12: The leaching concentration of (a) antimony and (b) copper from mortar with F-BAM as
100% sand replacement
5.7 Conclusions
(1) The washing treatment shows that the increase of liquid to solid ratio (L/S) results
in an increased leaching of the investigated salts and heavy metals. After the
reduction of particle size by milling, the leaching of investigated heavy metals
shows a lower leaching concentration, except Sb. The chloride leaching is not
influenced by the reduction of particle size due to its highly solubility.
(2) The addition of NaCl promotes the hydration of blended binder by accelerating the
reaction of C3S/C3A indirectly and the acceleration effect is more effective on the
OPC and GGBS blends. The formation of Friedel’s salt (Fs)/Hydrocalumite (Hc)
in the samples with NaCl was observed. The waste water from the washing of BAM
has a retarding effect on the hydration of blended binders, which results from the
cumulative effect of heavy metals, sulphate and chloride content, and organic
matter washed out from BAM and the pH of the leachate.
(3) The strengths of mortar with GGBS and NaCl are the highest, and the shaking test
shows that the chloride leached out from the crushed mortars has a decreasing trend
over curing time. The chloride leaching concentration starts to be stable after 7 days.
The chloride left in the washed mortar samples demonstrates that the mortar with
GGBS blended cement can immobilize a relatively higher amount of chloride than
the other two binders.
(4) The use of fine MSWI bottom ash and milled fine bottom ash in mortar as sand and
binder replacement respectively reduces the strength of mortar. The leaching of
chloride from mortar with bottom ashes shows a similar trend as mortar with NaCl
addition. Sulphate leaching slightly increases and mortar with GGBS has a higher

Chapter 5 83
sulphate leaching than the other mortars. The Sb and Cu have an increasing leaching
trend over curing time which is due the dissolving of heavy metals salts at high pH
over time. Therefore, other application methods should be considered for fine
MSWI bottom ashes, which is shown in the next chapter.


Chapter 6 85
*Content of this chapter was published elsewhere [Tang, P., Florea, M.V.A., and Brouwers, H.J.H., (2017)
J. Clean. Prod. 165, 1371–1384]
Chapter 6
6 Employing cold bonded pelletization to recycle incineration
fine bottom ash*
6.1 Introduction
The fine incineration bottom ash (0-2 mm, F-BA) without any treatment can only be used
when the material is isolated and monitored during the application period due to its leaching
of Sb, Cu, chloride and sulphate as shown in previous chapters. Moreover, it contains
metals which can lead to cracks when used in mortar or concrete, and then damage the
strength and decrease the durability of the concrete (Müller & Rübner, 2006). The F-BA
can also end up in landfills (Bosmans et al., 2013); however, due to the decreasing available
space and increasing cost for landfilling, this is not a preferable option and will not be
allowed by Dutch legislation in the future.
In Chapter 4, treatments which can remove the fine dust on the fine bottom ash particles
and then the use of the treated bottom ash as binder substitute are presented. However, the
cost may be too high compared with its application value. In Chapter 5, the use of F-BA as
sand and binder supplementary in mortar with blended binders showed that the mortar
strengths were decreased. In one of our previous work (Yu et al., 2014), the washed bottom
ash was used in concrete as sand replacement; however, the metallic Al was still a problem.
So far, the recycling and reuse of municipal solid waste incineration (MSWI) F-BA remains
an issue to be solved in practice. The integral recycling or reuse of F-BA without treatments
and consequent minimization of the deleterious effect of F-BA on the final products would
be more suitable for F-BA management.
The cold bonded pelletizing technique is a method to agglomerate the powdered materials
into bigger roundish particles with the assistance of a disc pelletizer and gluing agents, such
as water, binder, chemical activators, etc. The produced aggregates can be further used as
aggregates in concrete. Nowadays, the cold bonded pelletizing technique is widely used to
recycle industrial waste powders for producing artificial aggregates, and the raw materials
(powder level) used are extended to various waste powders in recent years, such as iron ore
fines, coal fly ash and bottom ash, granulated blast furnace slag, quarry dust, etc. (Dutta et
al., 1997; Ferone et al., 2013; Geetha & Ramamurthy, 2010a; Gesoğlu et al., 2007, 2012;
Thomas & Harilal, 2015). The widespread research on the production of artificial
aggregates using waste powders through cold bonding technique proposes a positive view
on the investigation of producing artificial aggregate using F-BA, which is rarely studied.
This could be a method for the integral purposes of immobilizing the contaminants of F-

86 Chapter 6
BA by cementitious materials, producing an artificial aggregate which can be used in
concrete, and in this way transfer F-BA from waste to value.
Regarding the recycling of industrial waste powdered materials by the cold bonded
pelletizing technique, there are several aspects which have been investigated from literature
(Baykal & Doven, 2000; Bui et al., 2012; Cioffi et al., 2011; Colangelo et al., 2015; Dutta
et al., 1992 & 1997, Geetha & Ramamurthy, 2010a, 2013, Gesoğlu et al., 2004, 2007, 2012,
2014; Güneyisi et al., 2015a; Manikandan & Ramamurthy, 2008; Thomas & Harilal, 2015)
and need to be considered for the design of pelletization, as listed below:
• Types of waste powders to be recycled as raw materials for pelletization
The most used solid waste is coal fly ash (FA), which accounts for over 50% of the total
solids used for pelletization. In most studies, the cold bonded pelletization is considered as
an efficient method to manage the coal fly ash (Colangelo et al., 2015; Thomas & Harilal,
2015). However, among all these recycled solid materials, the particle sizes are rather small
(<125 µm) compared to the corresponding pellets they produced (> 4 mm). The use of
relatively bigger particles (>125 µm) rather than only powders has rarely been reported.
Moreover, the inherent characteristics of the raw materials have a significant influence on
the properties of the produced lightweight aggregates.
• Binder/chemical activator
To guarantee the strength of the produced lightweight aggregates, a certain amount of
ordinary Portland cement (OPC) is added, which normally accounts for 5-10% of the total
solid mass (Dutta et al., 1997; Gesoğlu et al., 2004, 2014). Another binder system is an
alkali-activated binder (geopolymer), which consists of a chemical activator and slag or fly
ash (Bui et al., 2012; Geetha & Ramamurthy, 2013). Using this binder system for
pelletization, the chemical activator in liquid form is generally sprayed on the powder as
gluing agent instead of water, to promote the formation of granulates at the very early age
of pelletization and later activate the slag or fly ash to provide strength to the pellets.
• Additives
There is research which shows that the addition of CaO or Ca(OH)2 contributes positively
to the pelletization efficiency and the strength of the produced pellets (Cioffi et al., 2011;
Geetha & Ramamurthy, 2010a). Ground-granulated blast-furnace slag (GGBS) from the
steel industry and rice husk ash (RHA) from the combustion of rice hulls were also used to
improve the properties of the lightweight aggregates due to their contribution to cement
hydration, or their own chemical activation (Bui et al., 2012).
• Curing methods
Several curing methods were applied in other studies, including water curing, moisture
curing, steam curing at different temperatures, autoclave curing, etc. (Manikandan &
Chapter 6 87
Ramamurthy, 2008). In most of the studies, moisture curing is performed by sealing the
freshly produced aggregated in bags or buckets until the testing date, this is also possible
in large scale production. The other three types of curing can promote the strength
development of the aggregates; however, their efficiency depends on the properties of the
raw materials and the available conditions in practice.
• Pelletizing parameters
The pelletizing parameters include the diameter of the pan, its angle and speed, and the
feeding speed of raw materials. The effect of the pelletizing parameters on the properties
of the pellets depends on the pelletizer used and the other procedure parameters. The disc
pelletizer used in literature had a diameter between 40-80 cm, and the rotating angle and
speed were 45-55º and 35-55 rpm, respectively.
The applying of cold bonded pelletizing technique to recycle the F-BA involves the above-
mentioned parameters, and the compatibility of the F-BA during the pelletization is not
known. Hence, the main purpose in this chapter is to investigate the potential and
compatibility of recycling the MSWI fine bottom ash from Moerdijk (0-2 mm, F-BAM)
through the pelletizing technique to produce cold bonded lightweight aggregate. The
properties of the artificial aggregate produced (such as density, pellet strength, crushing
resistance, water absorption, etc.) are evaluated and compared with the ones produced by
other raw materials. The leaching properties of the F-BA and the aggregate are determined
and compared with the legislation. The practical application of this artificial aggregate in
concrete is also studied.
6.2 Materials and methods
6.2.1 Materials
The wet bottom ash fine particles fraction (F-BAM, 0-2 mm) is selected from the Moerdijk
MSWI plant for the investigation in this chapter. These bottom ash fine particles (F-BAM)
were obtained by sieving and sealed in a bag before use to avoid the variation of moisture
content (around 1000 kg was collected and stored at once to reduce sample variety). Three
other industrial powder wastes, which are facing similar reuse/recycling issue as F-BAM
in the Netherlands, were also used in this study. These powders are coal fly ash (FA) from
a Dutch power plant, paper sludge ash (PSA) from a Dutch paper recycling company, and
washing aggregate sludge (WAS) from a gravel washing factory (Smals, the Netherlands).
An Ordinary Portland Cement (OPC) CEM I 42.5N (ENCI, the Netherlands) is used as
binder. Figure 6.1 shows the raw materials used and the artificial aggregate produced.
The chemical compositions, crystalline phases, PSDs, and specific densities of the used
materials are determined as described in Section 3.2.2. Isothermal calorimetry is employed
to investigate the hydration development of the blended binders. The influence of the PSA
and FA on the cement hydration are studied by replacing the cement by different

88 Chapter 6
proportions of each respective material. The interaction between PSA, FA and cement is
studied as well.
PSA
OPC
FA
F-BAM
WAS
Artificial aggregate
Figure 6.1: The raw materials applied and produced artificial aggregate
The proportions of the raw materials used (based on total dried mass) are 10% OPC, 40%-
75% F-BAM (with a water content (ω) of around 22% wt.), 5% WAS (with a water content
(ω) of 53% wt.), while FA and PSA fill up the remaining part. The determination of the
recipe will be discussed in Section 6.3.1.
6.2.2 Cold bonded lightweight aggregate (CBLA) manufacture and
characterization
• Pelletizing procedure
The size of the disc pelletizer and parameters for the pelletization used in the literature
varies as summarized in Section 6.1; hence, the chosen pelletizing parameters are
determined based on the information from literature and the practical experience acquired
during the utilization of the disc pelletizer in this chapter.
The disc pelletizer used for the pelletization process has a diameter of 100 cm and collar
height of 15 cm in this chapter. The angle of the disc is fixed at 45° and the speed is 15
rpm following practical laboratory experience and suggestion from literature (Gesoğlu et
al., 2007). The pelletizing procedure is shown in Figure 6.3. The raw materials used for the
aggregate are firstly mixed homogeneously and then around 10 kg of the mixed materials
are put on the running disc (Zone 1 in Figure 6.2 (a)). After around 5 minutes running,
about 2 kg of water is sprayed continuously on to the materials in the pan and then running
again for 10 minutes. The next running cycle starts with the addition of another 10 kg of
mixed materials to the running pan (Zone 1), and the rounded artificial aggregates from the
last round will drop off automatically from the left lower corner of the pan (Zone 2 Figure

Chapter 6 89
6.2 (a)). Around 100 kg of granulates was produced and the freshly produced aggregates
are sealed in plastic bags for further use and tests.
D=100 cm
Scraping blades
Water supplying pipe
Zone 1:
Materials
addition
Zone 2:
Pellets
drop off
(a)
(b)
(d)
(c)
(e)
Figure 6.2: (a) The device and (b)-(e) produced aggregates ((b) pellets collected from zone 2; (c)
pellets collected between zone 1-2; (d) pellets collected in zone 1; (e) pellets collected for further use
F-BAM
PSA
FA
OPC
WAS
Stage 1
Pre-mix
Stage 2
Pelletizing
Stage 2-1
Spraying of water
Stage 2-2
Continuously
rotating
Stage 3
1st Adding new material
Stage 3
2nd Collecting green
pellet and curing
Next cycle
Figure 6.3: The pelletizing procedure
• Characterization of produced aggregates
After a certain curing time, a batch of aggregate is collected for relevant tests. The bulk
density of the aggregates is determined following EN 1097-3 (1998) and the water
absorption of the aggregate is measured following the EN 1097-6 (2013); the value is equal
to the average of three tested values.

90 Chapter 6
The individual pellet strength is tested using a similar test method to the one described and
used in (Gesoğlu et al., 2007, 2012) (Figure 6.4 (a)); 45 pellets are chosen to be tested for
each curing age. The crushing resistance of the aggregates is also evaluated after different
days of curing following EN 13055-1 (Annex A, procedure 1) (2002) to describe the
strength of the produced aggregates and three samples are tested for each value (Figure 6.4
(b)). Optical microscopy and scanning electron microscopy (SEM, Quanta 650 FEG, FEI)
are used to observe the cross section of the pellet.
Loading
plate
Support
plate
Pellet
Controlling
sensor
Loading
plate
Support
plate
Pellet
Controlling
sensor
(a)
(b)
Figure 6.4: The device for (a) individual pellet strength and (b) crushing resistance
• Application of artificial aggregates in concrete
The produced aggregate is used in concrete as aggregates with a proportion of 50% and
100% replacement by volume of the natural quartz aggregate (2-8 mm). Concrete cubes
with artificial aggregates (150 × 150 ×150 mm3) are produced; the proportions used are:
cement 280 kg/m3, sand (0-4 mm) 830 kg/m3, and the gravel (2-8 mm) 1248 kg/m3. The
water to cement ratio is 0.5 for samples with 50% gravel replacement, and 0.6 for samples
with 100% gravel replacement in order to get a similar flowability. The compressive
strengths of the cubes are determined after 28 days.
• Leaching property evaluation
The environmental impact of the F-BAM and the generated aggregate was evaluated using
column leaching tests according to Dutch standard NEN 7383 (2004) as described in
Section 3.2.2. The column leaching test is also performed on the crushed concrete cubes to
observe the leaching properties of recycled concrete. The concrete cubes are crushed under
4 mm and then column leaching as described above is conducted.
6.3 Results and discussion
6.3.1 Integral recycling of F-BA by cold bonded pelletization
Considering the recycling of F-BAM using the cold bonded pelletizing technique, the
influencing parameters summarized in Section 6.1 need to be considered and determined.

Chapter 6 91
Due to the fact that F-BAM has a particle size between 0-2 mm which is coarser than the
powders generally used for pelletization, it might be necessary to add other powdered
materials to make sure there are enough fines to fill the space between bigger particles and
then to glue all the particles together in a spherical shape when water is added. The
powdered materials chosen are expected: (1) to act as filler to condense the microstructure
of pellets which can significantly affect the pellet properties, and to have a good
compatibility with other materials during the pelletizing process; (2) to have pozzolanic or
hydraulic characteristics which will contribute to the binder hydration, and eventually
enhance the pellet properties; (3) the use of these chosen powdered materials can be eco-
and environmental friendly, such as using wastes from industrial fields. In this way, the
recycling of BAF by the pelletizing technique is further valorised.
In literature, the pelletization of FA to produce cold bonded lightweight aggregates
(CBLAs) has been widely studied and the technique is improved from both the mechanical
and economic points of view (Baykal & Döven, 2000; Gesoğlu et al., 2014). Secondly, it
is reported that FA could be used as filler, additive, or pozzolanic material in concrete,
having a positive influence (Berryman et al., 2005). Hence, coal fly ash (FA) is chosen as
one of the powder ingredients in this chapter. According to research (Cioffi et al., 2011;
Geetha & Ramamurthy, 2010b), the addition of Ca(OH)2 or lime can increase the
pelletizing efficiency, and improve the hydration of the binder, which improves the pellet
properties indirectly. It is known from literature that paper sludge ash (PSA) is a solid waste
from the paper recycling industry, which mainly contains of free lime and calcite. It could
be used as a hydraulic binder (Bin Mohd Sani et al., 2011; Wong et al., 2015), or raw
material for eco-cement (Yen et al., 2011) for concrete. Therefore, the PSA which is
available in the Netherlands is recycled and reused as a powder ingredient in this study
from both the technical and economic points of view. To obtain the granulate during the
pelletizing, particularly during the early stage, the moisture content and the plasticity of the
raw materials are very important. Washing aggregate sludge (WAS) is a water-solids
mixture (most of the solid particles are under 63 µm) collected from the aggregate washing
plant, which needs to be settled in the clarifier before further use or deposit. This procedure
is time consuming and not economically friendly. In other studies, this sludge is used to
produce artificial aggregate by sintering (González-Corrochano et al., 2009; Volland &
Brötz, 2015). The sludge normally contains 45%-55% liquid, which need to be drained out
in normal treatment procedure; however, when being used for pelletization, the sludge
mixture could be directly used without any other treatment (settling or draining). This is
due to the fact that firstly the dried sludge is generally agglomerated and needs to be
crushed or milled before use; secondly, during the pelletizing of raw material in this study,
a certain amount of water is needed. Hence, the utilization of washing aggregate sludge
(WAS) as one ingredient in pelletizing is a more cost-effective way to recycle it, which can
avoid the pre-treatment of the sludge and decrease the consuming of water during the
pelletizing process. In this way, the waste materials are directly used as raw resources for
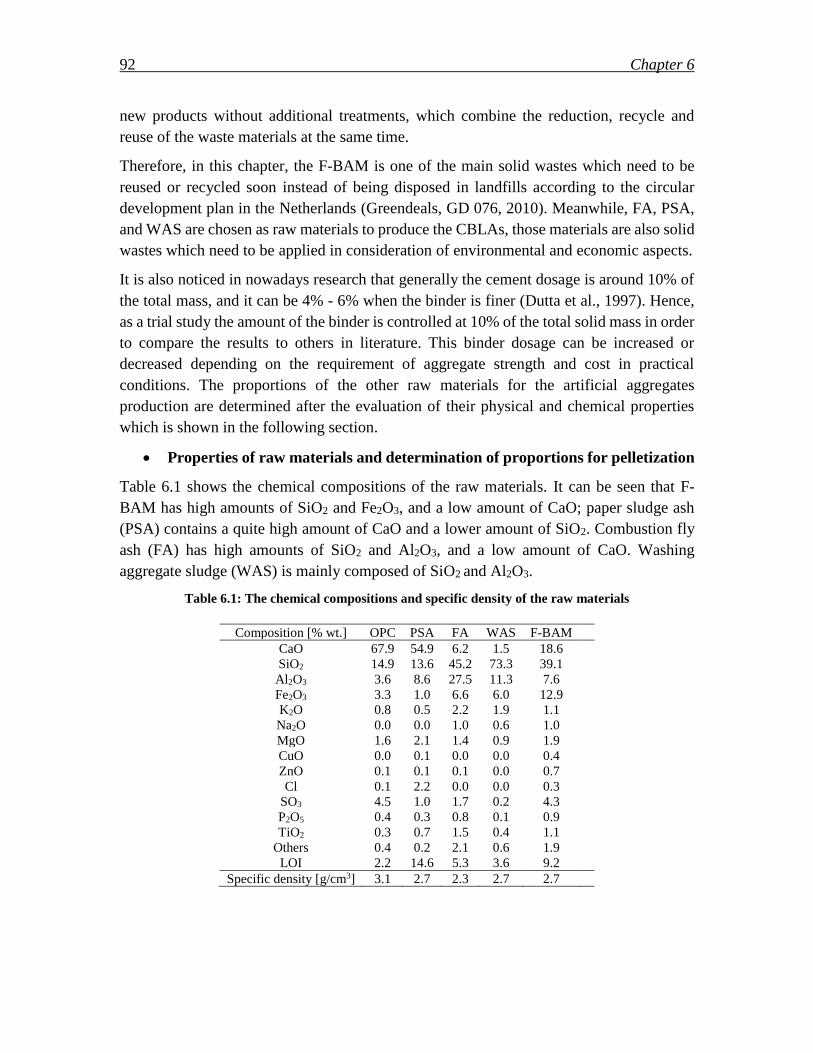
92 Chapter 6
new products without additional treatments, which combine the reduction, recycle and
reuse of the waste materials at the same time.
Therefore, in this chapter, the F-BAM is one of the main solid wastes which need to be
reused or recycled soon instead of being disposed in landfills according to the circular
development plan in the Netherlands (Greendeals, GD 076, 2010). Meanwhile, FA, PSA,
and WAS are chosen as raw materials to produce the CBLAs, those materials are also solid
wastes which need to be applied in consideration of environmental and economic aspects.
It is also noticed in nowadays research that generally the cement dosage is around 10% of
the total mass, and it can be 4% - 6% when the binder is finer (Dutta et al., 1997). Hence,
as a trial study the amount of the binder is controlled at 10% of the total solid mass in order
to compare the results to others in literature. This binder dosage can be increased or
decreased depending on the requirement of aggregate strength and cost in practical
conditions. The proportions of the other raw materials for the artificial aggregates
production are determined after the evaluation of their physical and chemical properties
which is shown in the following section.
• Properties of raw materials and determination of proportions for pelletization
Table 6.1 shows the chemical compositions of the raw materials. It can be seen that F-
BAM has high amounts of SiO2 and Fe2O3, and a low amount of CaO; paper sludge ash
(PSA) contains a quite high amount of CaO and a lower amount of SiO2. Combustion fly
ash (FA) has high amounts of SiO2 and Al2O3, and a low amount of CaO. Washing
aggregate sludge (WAS) is mainly composed of SiO2 and Al2O3.
Table 6.1: The chemical compositions and specific density of the raw materials
Composition [% wt.] OPC PSA FA WAS F-BAM
CaO 67.9 54.9 6.2 1.5 18.6
SiO2 14.9 13.6 45.2 73.3 39.1
Al2O3 3.6 8.6 27.5 11.3 7.6
Fe2O3 3.3 1.0 6.6 6.0 12.9
K2O 0.8 0.5 2.2 1.9 1.1
Na2O 0.0 0.0 1.0 0.6 1.0
MgO 1.6 2.1 1.4 0.9 1.9
CuO 0.0 0.1 0.0 0.0 0.4
ZnO 0.1 0.1 0.1 0.0 0.7
Cl 0.1 2.2 0.0 0.0 0.3
SO3 4.5 1.0 1.7 0.2 4.3
P2O5 0.4 0.3 0.8 0.1 0.9
TiO2 0.3 0.7 1.5 0.4 1.1
Others 0.4 0.2 2.1 0.6 1.9
LOI 2.2 14.6 5.3 3.6 9.2
Specific density [g/cm3] 3.1 2.7 2.3 2.7 2.7
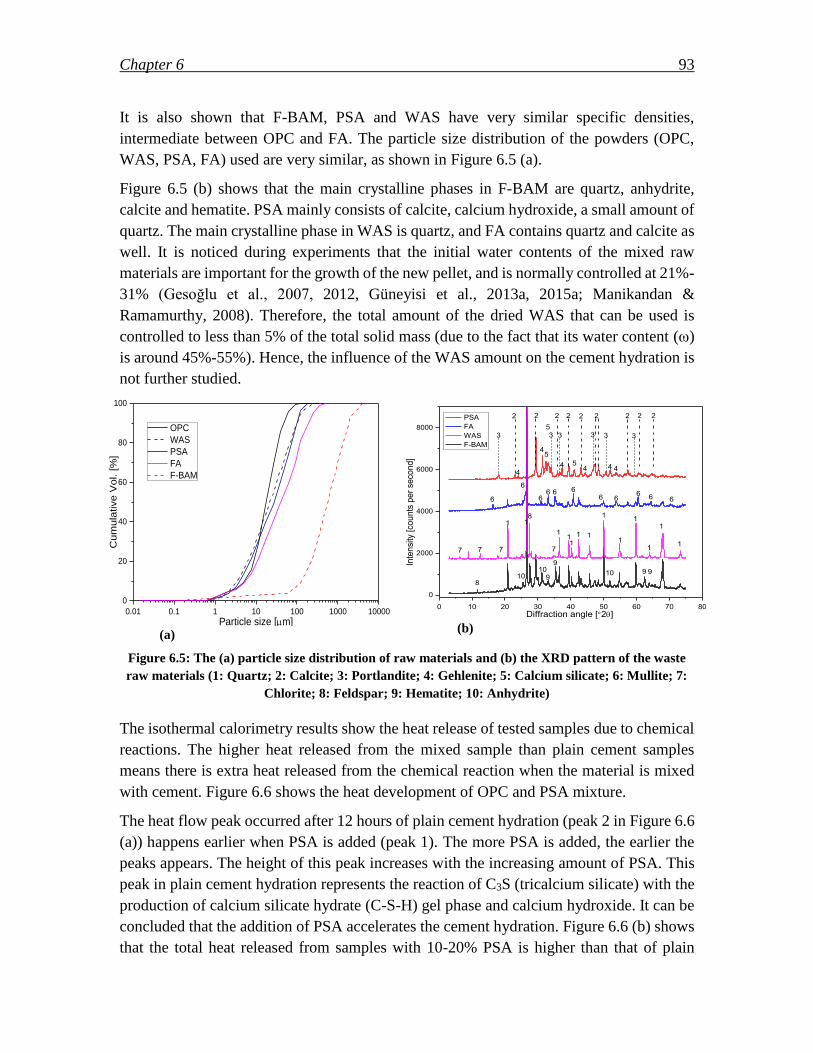
Chapter 6 93
It is also shown that F-BAM, PSA and WAS have very similar specific densities,
intermediate between OPC and FA. The particle size distribution of the powders (OPC,
WAS, PSA, FA) used are very similar, as shown in Figure 6.5 (a).
Figure 6.5 (b) shows that the main crystalline phases in F-BAM are quartz, anhydrite,
calcite and hematite. PSA mainly consists of calcite, calcium hydroxide, a small amount of
quartz. The main crystalline phase in WAS is quartz, and FA contains quartz and calcite as
well. It is noticed during experiments that the initial water contents of the mixed raw
materials are important for the growth of the new pellet, and is normally controlled at 21%-
31% (Gesoğlu et al., 2007, 2012, Güneyisi et al., 2013a, 2015a; Manikandan &
Ramamurthy, 2008). Therefore, the total amount of the dried WAS that can be used is
controlled to less than 5% of the total solid mass (due to the fact that its water content (ω)
is around 45%-55%). Hence, the influence of the WAS amount on the cement hydration is
not further studied.
0.01 0.1 1 10 100 1000 10000
0
20
40
60
80
100
Cu
mula
tive V
ol. [%
]
Particle size [m]
OPC
WAS
PSA
FA
F-BAM
(a)
0 10 20 30 40 50 60 70 80
0
2000
4000
6000
8000
910
9
9
1
8
1010
98
7 7 7 7
6 666
666
66
66
5
5
5
4
4
44
4 4
33 3333
2 22 22 2222
11
11
1
1
1
11
1
1
Inte
nsi
ty [co
un
ts p
er
seco
nd
]
Diffraction angle [2]
PSA
FA
WAS
F-BAM
1
(b)
Figure 6.5: The (a) particle size distribution of raw materials and (b) the XRD pattern of the waste
raw materials (1: Quartz; 2: Calcite; 3: Portlandite; 4: Gehlenite; 5: Calcium silicate; 6: Mullite; 7:
Chlorite; 8: Feldspar; 9: Hematite; 10: Anhydrite)
The isothermal calorimetry results show the heat release of tested samples due to chemical
reactions. The higher heat released from the mixed sample than plain cement samples
means there is extra heat released from the chemical reaction when the material is mixed
with cement. Figure 6.6 shows the heat development of OPC and PSA mixture.
The heat flow peak occurred after 12 hours of plain cement hydration (peak 2 in Figure 6.6
(a)) happens earlier when PSA is added (peak 1). The more PSA is added, the earlier the
peaks appears. The height of this peak increases with the increasing amount of PSA. This
peak in plain cement hydration represents the reaction of C3S (tricalcium silicate) with the
production of calcium silicate hydrate (C-S-H) gel phase and calcium hydroxide. It can be
concluded that the addition of PSA accelerates the cement hydration. Figure 6.6 (b) shows
that the total heat released from samples with 10-20% PSA is higher than that of plain
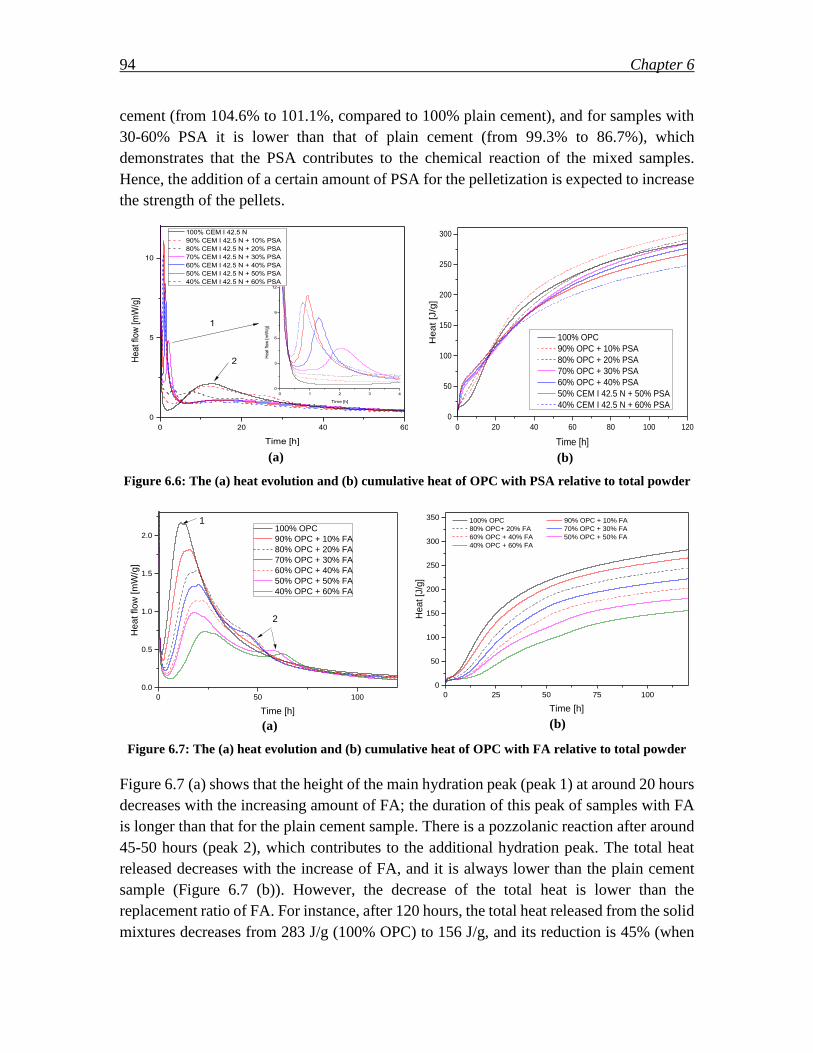
94 Chapter 6
cement (from 104.6% to 101.1%, compared to 100% plain cement), and for samples with
30-60% PSA it is lower than that of plain cement (from 99.3% to 86.7%), which
demonstrates that the PSA contributes to the chemical reaction of the mixed samples.
Hence, the addition of a certain amount of PSA for the pelletization is expected to increase
the strength of the pellets.
0 20 40 60
0
5
10
He
at flo
w [m
W/g
]
Time [h]
100% CEM I 42.5 N
90% CEM I 42.5 N + 10% PSA
80% CEM I 42.5 N + 20% PSA
70% CEM I 42.5 N + 30% PSA
60% CEM I 42.5 N + 40% PSA
50% CEM I 42.5 N + 50% PSA
40% CEM I 42.5 N + 60% PSA
1
2
0 1 2 3 4
0
3
6
9
12
Heat
flow
[m
W/g
]
Time [h]
(a)
0 20 40 60 80 100 120
0
50
100
150
200
250
300
Heat [J
/g]
Time [h]
100% OPC
90% OPC + 10% PSA
80% OPC + 20% PSA
70% OPC + 30% PSA
60% OPC + 40% PSA
50% CEM I 42.5 N + 50% PSA
40% CEM I 42.5 N + 60% PSA
(b)
Figure 6.6: The (a) heat evolution and (b) cumulative heat of OPC with PSA relative to total powder
0 50 100
0.0
0.5
1.0
1.5
2.0
Heat flow
[m
W/g
]
Time [h]
100% OPC
90% OPC + 10% FA
80% OPC + 20% FA
70% OPC + 30% FA
60% OPC + 40% FA
50% OPC + 50% FA
40% OPC + 60% FA
1
2
(a)
0 25 50 75 100
0
50
100
150
200
250
300
350
He
at [J
/g]
Time [h]
100% OPC 90% OPC + 10% FA
80% OPC+ 20% FA 70% OPC + 30% FA
60% OPC + 40% FA 50% OPC + 50% FA
40% OPC + 60% FA
(b)
Figure 6.7: The (a) heat evolution and (b) cumulative heat of OPC with FA relative to total powder
Figure 6.7 (a) shows that the height of the main hydration peak (peak 1) at around 20 hours
decreases with the increasing amount of FA; the duration of this peak of samples with FA
is longer than that for the plain cement sample. There is a pozzolanic reaction after around
45-50 hours (peak 2), which contributes to the additional hydration peak. The total heat
released decreases with the increase of FA, and it is always lower than the plain cement
sample (Figure 6.7 (b)). However, the decrease of the total heat is lower than the
replacement ratio of FA. For instance, after 120 hours, the total heat released from the solid
mixtures decreases from 283 J/g (100% OPC) to 156 J/g, and its reduction is 45% (when
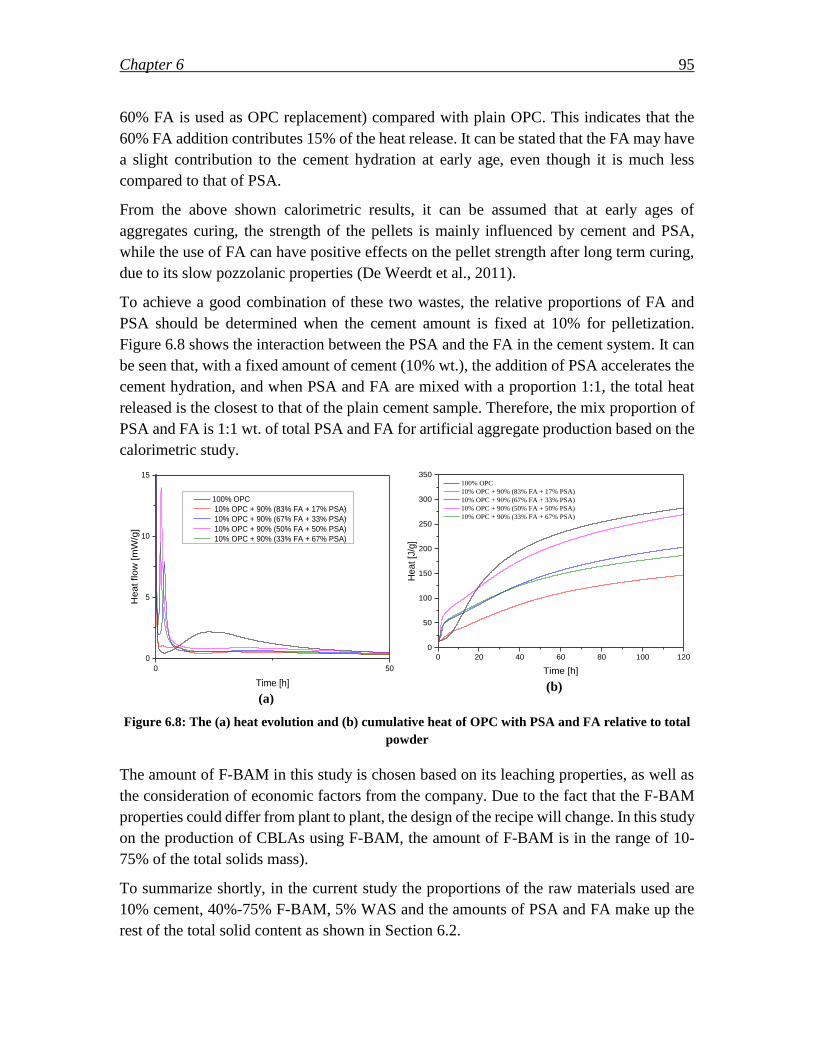
Chapter 6 95
60% FA is used as OPC replacement) compared with plain OPC. This indicates that the
60% FA addition contributes 15% of the heat release. It can be stated that the FA may have
a slight contribution to the cement hydration at early age, even though it is much less
compared to that of PSA.
From the above shown calorimetric results, it can be assumed that at early ages of
aggregates curing, the strength of the pellets is mainly influenced by cement and PSA,
while the use of FA can have positive effects on the pellet strength after long term curing,
due to its slow pozzolanic properties (De Weerdt et al., 2011).
To achieve a good combination of these two wastes, the relative proportions of FA and
PSA should be determined when the cement amount is fixed at 10% for pelletization.
Figure 6.8 shows the interaction between the PSA and the FA in the cement system. It can
be seen that, with a fixed amount of cement (10% wt.), the addition of PSA accelerates the
cement hydration, and when PSA and FA are mixed with a proportion 1:1, the total heat
released is the closest to that of the plain cement sample. Therefore, the mix proportion of
PSA and FA is 1:1 wt. of total PSA and FA for artificial aggregate production based on the
calorimetric study.
0 50
0
5
10
15
Heat flow
[m
W/g
]
Time [h]
100% OPC
10% OPC + 90% (83% FA + 17% PSA)
10% OPC + 90% (67% FA + 33% PSA)
10% OPC + 90% (50% FA + 50% PSA)
10% OPC + 90% (33% FA + 67% PSA)
(a)
0 20 40 60 80 100 120
0
50
100
150
200
250
300
350 100% OPC
10% OPC + 90% (83% FA + 17% PSA)
10% OPC + 90% (67% FA + 33% PSA)
10% OPC + 90% (50% FA + 50% PSA)
10% OPC + 90% (33% FA + 67% PSA)
He
at [J
/g]
Time [h] (b)
Figure 6.8: The (a) heat evolution and (b) cumulative heat of OPC with PSA and FA relative to total
powder
The amount of F-BAM in this study is chosen based on its leaching properties, as well as
the consideration of economic factors from the company. Due to the fact that the F-BAM
properties could differ from plant to plant, the design of the recipe will change. In this study
on the production of CBLAs using F-BAM, the amount of F-BAM is in the range of 10-
75% of the total solids mass).
To summarize shortly, in the current study the proportions of the raw materials used are
10% cement, 40%-75% F-BAM, 5% WAS and the amounts of PSA and FA make up the
rest of the total solid content as shown in Section 6.2.

96 Chapter 6
6.3.2 Aggregate characteristics
• Artificial aggregate (CBLA) properties
The particle size distribution (PSD) of the produced artificial aggregate is shown in Figure
6.9, and it can be seen that its particles are mainly between 2-8 mm. The PSDs of the 28-
days sample and 1 day sample are very similar, and the 28-dasy sample has slightly higher
amount of small particles (< 2 mm, 1% more) and a bit lower amount of coarse particles (>
8 mm, 3% less) compared with the 1 days samples. This could be due to the shrinkage of
the pellets and the metallic Al in the F-BAM which may cause the cracking and break down
of some pellets. Meanwhile, the powders on the pellets surface may be removed due to the
fraction between particles when the pellets are dried.
0 5 10 15 20 25
0
20
40
60
80
100
Cu
mu
lativ
e m
ass
[%
]
Particle size [mm]
28 days
1 day
Figure 6.9: The particle distribution of produced aggregates after 1 day and 28-days curing
Total > 11.2 > 8 > 4 > 2
2.0
2.5
Sp
ecific
de
nsity [
g/c
m3]
Particle size [mm]
1 day 3 days 7 days 28 days
(a)
1 3 7 28
935
940
945
950
955
960
965
970
975
980
985
Loo
se b
ulk
den
sity [kg
/m3]
Curing time [days]
(b)
Figure 6.10: The (a) specific density and (b) bulk density of the artificial aggregate after different
curing ages
Figure 6.10 shows the specific densities of the artificial aggregate fractions and the loose
bulk density of the investigated fraction (fraction 4-16 mm was chosen according to EN
1097-3 (1998). The specific density (Figure 6.10 (a)) of the aggregates produced is around

Chapter 6 97
2.50 g/cm3, which is slightly lower than that of natural quartz aggregates (2.65 g/cm3), and
the specific density of the fractions are very similar, which indicates the homogeneity of
the produced aggregates. It can be noticed as well that the specific densities are decreasing
slightly with the curing time; this could be attributed to the hydration of cement, the
hydration product of which fills the pores inside the aggregate, and eventually decreases
the porosity of the aggregates and finally their shrinkage. This could be further confirmed
by the loose bulk density of the aggregates above 4 mm, which shows an increasing trend
along with the curing days (Figure 6.10 (b)). The loose bulk density of the aggregates above
4 mm is around 985 g/cm3 after 28-days curing, which is lower than 1200 kg/m3; hence,
this aggregate fraction can be defined as lightweight aggregate according to standards EN
13055-1 (2002). The apparent density of the produced aggregate is 2323-2358 kg/m3; its
oven dried particle density is 1709-1730 kg/m3, and the saturated and surface-dried particle
density is 1975-1988 kg/m3.
5 minutes 60 minutes 24 hours
12.5
13.0
13.5
14.0
14.5
15.0
15.5
16.0
Wa
ter
ab
so
rptio
n [%
]
Exposure time
1 day
3 days
7 days
28 days
Figure 6.11: The water absorption of the artificial aggregate after different curing ages
Figure 6.11 shows the water absorption of the produced cold bonded lightweight
aggregates (CBLAs) above 4 mm. The 24 hours’ water absorption after 28 days curing is
around 14.9%, which is lower compared with the CBLAs produced by fly ash in literature
which is 21.2% (Güneyisi et al., 2015a) and 18.7-21.2% (Thomas & Harilal, 2015). It can
be seen that the water absorption has a decreasing trend along with the curing time, and the
difference between 7 and 28 days cured samples is small. Moreover, the water absorption
increases significantly during the first hour. After 5 minutes, the water absorption already
reaches 94% of the 24 hours’ water absorption for the 1-day cured sample, and this value
is decreasing with the curing days (from 88% to 85% for 3-days and 28-days cured samples,
respectively). After 1 hour, the water absorption of all the samples reach around 95-96%
of their 24 hours’ water absorption, respectively. It can be concluded that, the porosity of
the CBLA is decreasing along with the curing time, which also indicates the hydration of
the binder. The water absorption reflects the porosity of the aggregate, which is related to

98 Chapter 6
its strength. For the artificial aggregate, it also reflects the compaction of the pellets during
the pelletizing procedure.
0.4 0.6 0.8 1.0 1.2 1.4 1.6 1.8
0
150
300
450
600
750
1 day
3 days
7 days
28 days
Pelle
t S
tre
ng
th [N
]
Produced size [cm] (a)
0 7 14 21 28
4
5
6
7
8
Cru
shin
g r
esis
tance [M
Pa]
Curing time [day] (b)
Figure 6.12: The strength development of the produced pellets (a) individual pellet strength and (b)
crushing resistance of the CBLA
The strength of the pellets depends on the binder dosage and the microstructure of the pellet
(void ratio/porosity of the pellet). It can be seen in Figure 6.12 (a) that the strength of the
individual pellets increases with the curing age, and after 7 days the pellet strength is
around 84% of its 28-day pellet strength; the pellet strength also increases with the particle
size (around 125 N to 650 N for pellet size from 4 to 16 mm); these findings are in
agreement with the results in (Gesoğlu et al., 2007, 2012). However, the results of the
individual pellets strength are quite dispersing, as this test would be influenced
significantly by the chosen pellets. Therefore, the crushing resistance of the aggregate
according to EN 13055-1 (2002) was also evaluated to demonstrate the strength of the
produced CBLAs. The result is shown in Figure 6.12 (b). It can be seen that the crushing
resistance increases steeply during the first 7 days of curing; after that there is only a small
increase. The crushing resistance of 7 days-cured samples achieves 94% of the 28 days-
cured samples (around 7.5 MPa). This result suggests that after 7 days, the artificial CBLAs
can be ready for use or for delivery in practical conditions.
• Comparison with other artificial aggregates
In literature (Baykal & Doven, 2000; Bui et al., 2012; Cioffi et al., 2011; Colangelo et al.,
2015; Dutta et al., 1992, 1997, Geetha & Ramamurthy, 2010a, 2013, Gesoğlu et al., 2012,
2014, 2004, 2007; Güneyisi et al., 2015a; Manikandan & Ramamurthy, 2008; Thomas &
Harilal, 2015), the particle size of the cold bonded lightweight aggregates (CBLAs) was
below 20 mm and their bulk density was between 800-1600 kg/m3. The water absorption
of the pellets was between 14-27%. Gesoğlu et al. (2007) applied the cold bonded
pelletizing technique to recycle fly ash from a thermal power plant, in which the cement/fly
ash ratio was 0.1 by weight and the pelletizing duration was 20 minutes in total (compared

Chapter 6 99
to 15 minutes in the present study). The produced CBLA had a particle size between 4-14
mm, its water absorption was around 32%, and individual particle crushing strength after
28-days curing was around 70-310 N for particle sizes from 6 to 14 mm (125-650 N for 4-
16 mm in this study). Güneyisi et al. (2013b) produced a CBLA from a mix of powders of
class F fly ash and Portland cement (9:1 of wt.) using the same device and pelletizer as
described in (Gesoğlu et al., 2007). The particle size of the produced CBLA was 4-16 mm
with a water absorption of around 18%, and its maximum pellet strength for pellets between
4-8 mm was 127 N. Colangelo et al. (2015) used OPC, hydrated lime and coal fly ash as
binding materials to recycle MSWI fly ash, and the binder accounted for around 30-50%
of the total solid mass. The produced aggregate was surface treated using a cement/coal fly
ash mixture (1:1 by mass), and the total cement used for the pelletization accounted for
around 14% of the total mass. The produced CBLAs had a particle size of 4-18 mm, and
their crushing resistance was 2-6 MPa (7.5 MPa in the present study) and their maximum
water absorption was 15%. Comparing with other CBLAs, the one produced in this study
has a slightly lower water absorption, and higher pellet or crushing strength. Hence, it can
be concluded that the production of the artificial lightweight aggregate using MSWI F-
BAM together with other industrial solid powders is possible and F-BAM has good
compatibility with other industrial powdered materials during the pelletization. The
properties of the pellets are comparable or even better than the artificial aggregate reported
in literature. The benefits of integral recycling F-BAM with other industrial solid wastes
through cold bonded pelletizing technique are summarized below.
• Mechanical benefits of F-BAM in cold bonded aggregate
Figure 6.13 demonstrates the pellet microstructure produced with only powdered materials
(Figure 6.13 (a)) and with MSWI F-BAM (Figure 6.13 (b)).
The higher crushing resistance of the artificial CBLA produced in this chapter with F-BAM
particles compared with the others may be attributed to the following reasons: (1) the F-
BAM particles in the pellet can act as a skeleton of the single pellet, which has the similar
role as the aggregate acts in the concrete, resulting in the enhancement of the pellet strength
compared with pellets produced with only powders. In another study (Cioffi et al., 2011),
the incineration bottom ash was milled into powder for artificial aggregates production,
which on one hand increased the production cost; while on the other hand, disrupted the
contribution of bottom ash particles as skeleton to increase the pellet strength. Hence, the
direct use of F-BAM for pelletization in this study is more beneficial; (2) the angular
particle shape of F-BAM enhances the interlocking force and bonding between the powder
matrix and the F-BAM particles, which increase the failure force of the pellet; (3)
comparing the use of F-BAM with the use of only powder materials for producing artificial
aggregate, with a fixed amount of binder and pellet size, the F-BAM has lower specific
surface area than powder particles. This means less binder is needed for binding all the
particles together and the pellet shape will be more stable (less powder will be removed

100 Chapter 6
from the surface of the pellets), similar to the statement in (Kim et al., 2016). Hence, with
the same amount of binder, higher strength can be obtained for pellets with F-BAM than
pellets with only powders.
(a) (b)F-BAM
FA
Figure 6.13: Schematic representation of cross section of pellets produced with (a) only powders and
(b) with addition of F-BAM
• Valorisation of F-BAM by pelletization
Figure 6.14 shows the cross section of the pellets with F-BAM under optical and scanning
electron microscope, where the distribution of F-BAM particles, WAS and PSA can be
seen clearly, and the F-BAM particles are well embedded into the matrix (Figure 6.14 (a)).
Melted particles in F-BAM
Plastic residues in F-BAM
Glass particles in F-BAM
Melted particles in F-BAM
Plastic residues in F-BAM
Glass particles in F-BAM
Melted particles in F-BAM
Plastic residues in F-BAM
Glass particles in F-BAM
(a)
(b)
Figure 6.14: The cross surface of a produced pellet (a) under optical microscope and a F-BAM
particle (b) under scanning electron microscope
It can be seen in Figure 6.14 (b) that the F-BAM particle is porous and has an irregular
shape. Moreover, there are pores inside the F-BAM particles which contribute to the
slightly lower specific density and lower loose bulk density of the produced aggregates as
the results shown in Figure 6.10. In general, the F-BAM has an angular particle shape and
the surface of the particles is covered by dust, which contributes to the high water
absorption during its application in mortar or concrete. However, these disadvantages of
F-BAM in concrete can be positive factors during the pelletizing process in this study.

Chapter 6 101
The F-BAM used in this work is collected from the MSWI bottom ash by sieving and it
has a moisture content (ω) around 22% because of the water cooling of the bottom ash after
the combustion. When the wet F-BAM is mixed with the powders, some powder particles
are firstly agglomerated on the F-BAM particles due to their moisture content, which can
shorten the pelletization duration to save energy consumption on a large-scale industrial
production. When extra water is added, more fine powders are coated on the F-BAM
particles, also the fine powders themselves start to agglomerate. Moreover, due to the
bigger particle size compared to powder materials (such as fly ash) and rough surface
structure, the compaction of the pellets during the pelletizing procedure is more efficient.
The powder materials can easily absorb water on their surfaces, which generates a water
layer, contributing to a longer compaction duration or a porous microstructure of the dried
pellets. The agglomeration of powder and particles, and the compaction of the pellets
happen during the whole pelletizing process.
Metallic Al
particle
Reaction rim of
aluminium
hydroxide
Metallic Al
particle
Reaction rim of
aluminium
hydroxide
Figure 6.15: The cross surface of a pellet where a metallic Al particle was found
It is observed during the tests that there are pellets which have cracks on their surface before
crushing test or application. This could be attributed to the metallic Al in the F-BAM which
reacts with alkalis and then generates H2, leading to the cracking of the pellet before any
external force is applied. Figure 6.15 shows the cross section of a pellet and there is a piece
of metallic Al found. Around the metallic Al piece there is a white trace observed, which
might be the reaction rim of aluminium hydroxide due to the reaction of metallic Al with
the alkaline surroundings during curing (Müller & Rübner, 2006). When the F-BAM is
directly used in concrete, this gas formation could lead to the damage of the concrete like
cracking and spalling. The same phenomenon takes place in the pellets. However, this does
not mean that the crushing resistance of the whole pellet fraction will be decreased
dramatically, because few pellets will undergo cracking (as shown in Figure 6.9, the
difference between the particle size distribution of samples after 1 day and 28 days curing
is around 1-3%). Meanwhile, this reaction can take place during the curing of the pellets,
which means there will be less risk due to the metallic Al when the aggregates are later

102 Chapter 6
used in concrete. Hence, in the application of artificial aggregate with F-BAM, the metallic
Al is less of a problem.
Compared with traditional cold bonded artificial aggregate, the use of F-BAM is of more
beneficial considering both the properties of produced pellets and the recycling of F-BAM.
Therefore, the cold bonding technique is a good way to recycle the F-BAM for producing
lightweight cold bonded aggregate together with other industrial waste powders.
6.3.3 Concrete properties with CBLAs
The 28-days compressive strength of the concrete with this artificial aggregate decreases
with the increasing amount of aggregate replacement, from 37.1 MPa to 27.7 MPa when
the replacement ratio increases from 50% to 100%. This is attributed to the low strength of
the artificial aggregate, similar to (Colangelo et al., 2015; Güneyisi et al., 2015a, 2015b;
Thomas & Harilal, 2015).
Table 6.2: Literature summary of cold bonded aggregate application
Reference
Water to
binder
ratio
Cement
[kg/m3]
Diameter
[mm]
Replacement ratio
[%]
Compressive strength
[MPa]
This study 0.5
0.6 280 2-8
50
100
37.1
27.7
(Thomas & Harilal, 2015) 0.45
250
350 450
10-20 100
20-28
21-30 21-30
(Cioffi et al., 2011) 0.5 345 5-20 100 12.8-25.8
(Güneyisi et al., 2015a) 0.4 440 0.25-4 50
100
37
21
(Gesoğlu et al., 2004) 0.55 400 4-9.5
30
45
60
22
27
21
(Güneyisi et al., 2013b) 0.55 400 4-16 100 29
(Gesoğlu et al., 2006) 0.55 400 4-9.5 100 23.2-37.8
(Gesoğlu et al., 2013) 0.55 350 4-16 100 27.5
It can be seen from Table 6.2 that, with a similar water to binder ratio, comparable particle
size and replacement ratio of artificial aggregate, the compressive strength of concrete in
this study with much less amount of cement, is higher than that in literature (Cioffi et al.,
2011; Gesoğlu et al., 2006, 2013, Güneyisi et al., 2013b, 2015a; Thomas & Harilal, 2015).
It is reported in (Güneyisi et al., 2015a) that the concrete strength is decreased by 43.2%
when the replacement ratio increased by 50% (from 50% to 100%), and in (Güneyisi et al.,
2015b) the concrete strength decreased by 18.5% after the replacement ratio increased from
30% to 45%. It can be concluded that the concrete strength decrease is higher than the
replacement ratio of the aggregate, which indicates the adding of the artificial aggregate
could not contribute to the concrete strength properly. However, in this study, the
compressive strength of the concrete decreased by 25% when the replacement ratio
increased by 50% (from 50% to 100%), which means the artificial aggregates contribute to
the concrete strength. This could be attributed to the higher crushing strength of the

Chapter 6 103
artificial aggregate produced in this study than others. Therefore, it can be concluded that
the application of artificial aggregate in concrete produced in this study has better results
than other artificial aggregates.
There are several factors that influence the application of this kind of artificial aggregates
in concrete: aggregate strength which relates to the concrete strength directly; water
absorption which influence the fresh properties of concrete and aggregate density which is
related to the concrete density. Figure 6.16 shows the relationship between the water
absorption, crushing resistance and loose bulk density of the artificial aggregate produced
in this study. It can be seen that both the crushing resistance and loose bulk density of the
aggregate has a linear relation with its water absorption.
14.8 15.0 15.2 15.4 15.6 15.8 16.0
0
2
4
6
8
10
Cru
shin
g r
esis
tance [M
Pa]
Water absorption [%]
940
950
960
970
980
990
1000
1 day3 days
7 days
Loose
bulk
den
sity
[kg/m
3]
y = -3.1x + 53.1
R2 = 0.98
y = -39.7x + 1569.5
R2 = 0.98
28 days
Figure 6.16: The relation between water absorption, crushing resistance, and loose bulk density of
the artificial aggregate
A lower water absorption value means lower porosity of the aggregate. The loose bulk
density of artificial aggregate is influenced by raw material density and aggregate porosity.
The lower density of raw materials or higher porosity of aggregate results into lower loose
bulk density. The crushing resistance in this study is related to the pellet strength (which is
porosity related), packing of the sample during test, etc. Therefore, by adjusting the
porosity of the artificial aggregate to determine its application in concrete where the
concrete strength is more focused or the density of concrete, is more important. Moreover,
a lower porosity of the aggregate will also lead to decreased contaminant leaching.
6.3.4 Leaching behaviour evaluation of CBLAs
The F-BAM contains high amounts of Cu - around 3100 mg/kg of dry solid (d.m.), chloride
(2100 mg/kg d.m.) and sulphate (22900 mg/kg d.m.), and also Sb (83 mg/kg d.m.) and Mo
(19 mg/kg d.m.) (Table 5.2). The leachability of the elements is calculated by dividing their
leached-out amount from the tested samples (F-BAM or artificial aggregate) by the total
amount of the elements in the F-BAM according to Eq. (3.8), respectively. The column
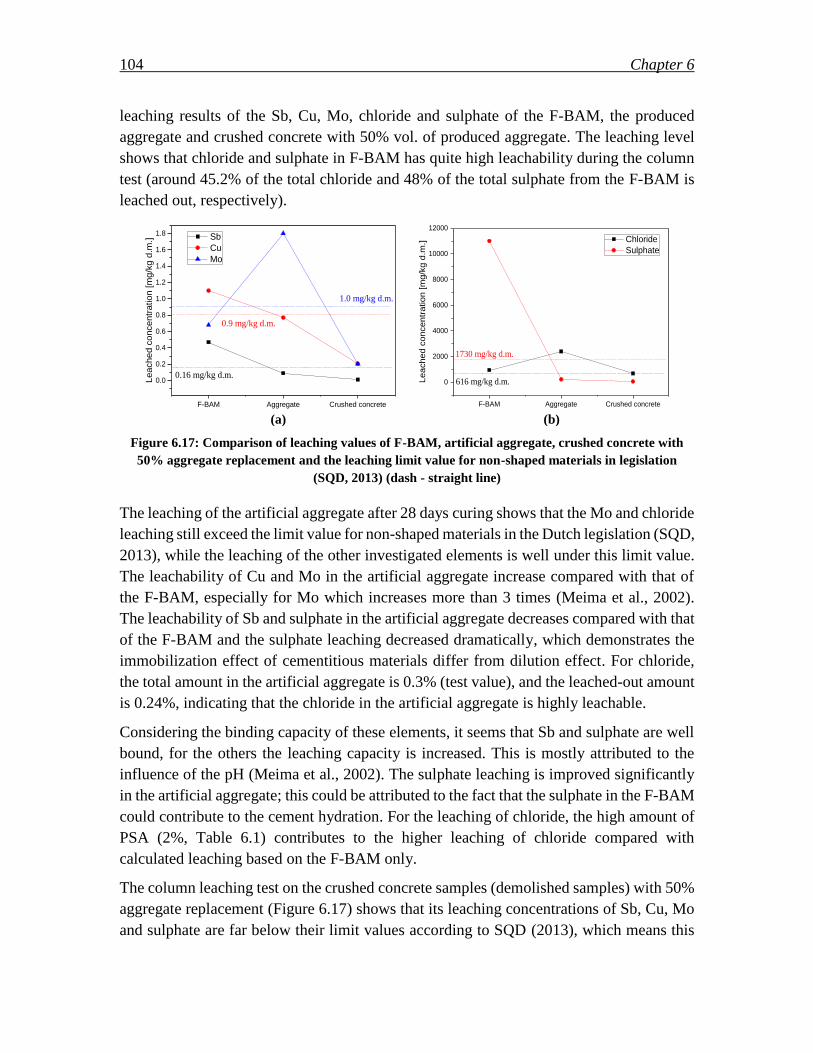
104 Chapter 6
leaching results of the Sb, Cu, Mo, chloride and sulphate of the F-BAM, the produced
aggregate and crushed concrete with 50% vol. of produced aggregate. The leaching level
shows that chloride and sulphate in F-BAM has quite high leachability during the column
test (around 45.2% of the total chloride and 48% of the total sulphate from the F-BAM is
leached out, respectively).
F-BAM Aggregate Crushed concrete
0.0
0.2
0.4
0.6
0.8
1.0
1.2
1.4
1.6
1.8
0.16 mg/kg d.m.
0.9 mg/kg d.m.
1.0 mg/kg d.m.
Leached c
oncentr
ation [m
g/k
g d
.m.] Sb
Cu
Mo
(a)
F-BAM Aggregate Crushed concrete
0
2000
4000
6000
8000
10000
12000
616 mg/kg d.m.
1730 mg/kg d.m.
Lea
che
d c
once
ntr
atio
n [
mg
/kg d
.m.] Chloride
Sulphate
(b)
Figure 6.17: Comparison of leaching values of F-BAM, artificial aggregate, crushed concrete with
50% aggregate replacement and the leaching limit value for non-shaped materials in legislation
(SQD, 2013) (dash - straight line)
The leaching of the artificial aggregate after 28 days curing shows that the Mo and chloride
leaching still exceed the limit value for non-shaped materials in the Dutch legislation (SQD,
2013), while the leaching of the other investigated elements is well under this limit value.
The leachability of Cu and Mo in the artificial aggregate increase compared with that of
the F-BAM, especially for Mo which increases more than 3 times (Meima et al., 2002).
The leachability of Sb and sulphate in the artificial aggregate decreases compared with that
of the F-BAM and the sulphate leaching decreased dramatically, which demonstrates the
immobilization effect of cementitious materials differ from dilution effect. For chloride,
the total amount in the artificial aggregate is 0.3% (test value), and the leached-out amount
is 0.24%, indicating that the chloride in the artificial aggregate is highly leachable.
Considering the binding capacity of these elements, it seems that Sb and sulphate are well
bound, for the others the leaching capacity is increased. This is mostly attributed to the
influence of the pH (Meima et al., 2002). The sulphate leaching is improved significantly
in the artificial aggregate; this could be attributed to the fact that the sulphate in the F-BAM
could contribute to the cement hydration. For the leaching of chloride, the high amount of
PSA (2%, Table 6.1) contributes to the higher leaching of chloride compared with
calculated leaching based on the F-BAM only.
The column leaching test on the crushed concrete samples (demolished samples) with 50%
aggregate replacement (Figure 6.17) shows that its leaching concentrations of Sb, Cu, Mo
and sulphate are far below their limit values according to SQD (2013), which means this
Chapter 6 105
crushed concrete can be used as recycled aggregate again after its useful service life and
the leaching of heavy metals would not be a problem. The leaching of chloride in the
concrete is slightly higher than its limit value, which may limit its application in reinforced
concrete. On the other hand, the binder amount of the concrete may influence the
immobilization of contaminants; in general, more binder can reduce the leaching of heavy
metals. Hence, for environmental considerations, the amount of produced aggregates
applied in concrete can be modified according to the binder content in practice.
Due to the fact that the leaching properties of the F-BAM will vary between plants, and
also the leaching legislation on the F-BAM and aggregate with F-BAM are different
between countries, the leaching properties can be adjusted by changing the amount of F-
BAM or binder used according to specific requirements. Additionally, the produced
aggregate can be used as aggregate replacement in concrete, even if its leaching properties
does not meet all requirements for non-shaped materials, by controlling its replacement
ratio to guarantee the leaching of the final shaped concrete products comply with the
environmental legislation (SQD, 2013). In this way, the concrete with artificial aggregate,
the leaching of which is under the limit value, will be the final product available for further
application, considering the environmental legislation. Therefore, it is of interest to study
the properties of concrete with this artificial aggregate from the mechanical point of view,
which is relevant to its applications in the construction field (which is shown in Chapters
7 and 8). The binding capacity of cementitious materials on contaminants from F-BAM
when used to produce artificial aggregates is summarized in Chapter 9.
6.4 Conclusions
This chapter presents the recycling of MSWI bottom ash fine particles (F-BAM, 0-2 mm)
through a cold bonding technique to produce lightweight aggregate, together with other
waste powders. From the results obtained in this paper the following conclusions can be
drawn:
(1) The cold bonded pelletizing technique, which is widely used to recycle the fly ash,
slag, or quarry dust, can also be used to recycle MSWI F-BAM successfully.
(2) The strength properties of the lightweight aggregate produced in this study are
comparable to, or even better, than other artificial aggregates reported in literature.
The use of F-BAM instead of powders only for pelletization has a positive effect on
the properties of the artificial aggregate.
(3) The F-BAM particles act as skeleton in the pellets, playing a similar role as aggregates
in concrete and the angular F-BAM particle shape improves the interlocking force and
bounding between the F-BAM particles and the powder matrix in the pellets, which
contributes to a higher crushing resistance of the produced lightweight aggregates.

106 Chapter 6
(4) Less cement is needed for producing artificial lightweight aggregate with similar
crushing resistance using F-BAM than using only powders, due to the lower specific
surface area of F-BAM comparing with powders.
(5) The leachability of sulphate and antimony in the artificial aggregate is decreased, while
for copper it is increased due to the influence of pH. The leaching of the sulphate,
copper and antimony of the produced artificial aggregate is well under the limit value
for the non-shaped material according to the Dutch legislation, while that of Mo and
chloride not. The leaching of Mo and chloride can be further decreased in the final
concrete samples by using a lower replacement ratio in case the requirements for non-
shaped produces are not met.
(6) Compared with concrete with other artificial aggregates, higher compressive strength
of concrete with artificial aggregate produced from F-BAM can be obtained due to the
higher aggregate crushing resistance compared with other artificial aggregates. The
leaching of heavy metals and salts from concrete with artificial aggregates is below
the limit values according to the Dutch legislation, which indicates that the recycle and
reuse of these concretes after their service life will comply with the current
environmental legislation.
In this chapter, the use of F-BAM to produce cold bonded lightweight aggregates (CBLAs)
shows positive results; however, the properties of the raw materials, such as binder types
and contents, additives properties, proportions of raw materials, etc., have significant
influence on the properties of CBLAs. Hence, it is necessary to optimize the combination
of raw materials for producing CBLAs with good properties based on the characteristics of
the raw materials applied, which is investigated in the next chapter.

Chapter 7 107
*Content of this chapter was published elsewhere [Tang, P., and Brouwers, H.J.H., (2017) Waste
Manag. 62, 125–138].
Chapter 7
7 Influence of raw material combinations on CBLA
properties*
7.1 Introduction
The study in Chapter 6 showed that the application of fine MSWI bottom ash to produce
cold bonded lightweight aggregate (CBLA) by pelletization is possible with the integral
combination of the chosen industrial powders; moreover, the properties of the obtained
aggregate are comparable with the ones in literature and it can be used as aggregate
replacement in concrete. However, it is also noticed that the strength of the pellets has a
remarkable influence on its application in concrete (Colangelo et al., 2015; Güneyisi et al.,
2015b; Thomas & Harilal, 2015), by decreasing the concrete strength due to its lower
strength compared with natural aggregates, which limits the amount of artificial aggregate
that can be used. In addition, the leaching of the produced artificial aggregates in Chapter
6 did not comply with the Dutch legislation completely. Hence, the investigation of
methods to improve the properties of the cold bonded lightweight aggregate by integrated
recycling of industrial powder wastes and F-BAM is the focus of this chapter, and the
influence of the raw materials combination on the aggregate properties are studied as well.
In current research, the general methods for improving the pellet strength are mainly
adjusting the pelletizing parameters (Baykal & Doven, 2000; Harikrishnan & Ramamurthy,
2006), changing the raw materials’ properties (Baykal & Doven, 2000; Dutta et al., 1997;
Manikandan & Ramamurthy, 2007; Thomas & Harilal, 2015) and curing conditions
(Gomathi & Sivakumar, 2015; Manikandan & Ramamurthy, 2008). In the present chapter,
the investigated parameters are binder amount, proper powder materials as additives,
various F-BAM amounts, polypropylene fibres, and nano-silica addition. The influences of
these parameters on the properties of the produced cold bonded aggregates are evaluated
and the corresponding mechanisms are discussed.
7.2 Materials and methodology
The raw materials used in this chapter are the same as described in Section 6.2.1. In addition,
ground granulated blast furnace slag (Gao et al., 2015) (GGBS, ENCI, the Netherlands)
and nano-silica (nS) produced from olivine dissolution (Lázaro García, 2014; Quercia
Bianchi, 2014) are used as OPC alternatives for the aggregate productions. Polypropylene
fibre (PPF) with a length of 3 mm, density of 0.91 kg/m3 provided by FBG (the Netherlands)
and Bonar (England) is used as reinforcing fibre (Figure 7.1).

108 Chapter 7
The chemical compositions, crystalline phases, PSDs, densities, of the raw materials are
present in Table 6.1 and Figure 6.5. The pelletizing procedure, the determination of the
properties of the obtained artificial aggregates and the evaluation of material leaching
properties are as described in Section 6.2.2. The proportions of solid materials of the
mixtures for the aggregate productions are shown in Table 7.1 and sample Ref. is used as
reference.
Figure 7.1: The raw materials used and aggregate produced
Table 7.1: The recipe design for artificial aggregate production (proportions of dried solid materials).
Samples
Binder Alternatives Coarser
particles Glue agent Reinforcement
OPC nS GGBS FA PSA F-BAM* WAS PPF
[% total
solid]
[%
OPC]
[%
OPC]
[% total
FA+PSA] [% total solid]
[% total
solid] [% vol.]
Ref. 10 0 0 100 0 10-40 5 0
5C
10C
15C
6C
5
10
15
6
0 0
50 50 40-75 5 0 0
0
67
No PSA
No WAS 10 0 0
100
50
0
50 40-75
5
0 0
0.5% PPF
1.0% PPF
2.5% PPF
4.5% PPF
10 0 0 50 50 40-75 5
0.5
1.0
2.5
4.5
0.4 nS
0.8 nS
9.6
9.2
4
8 0 50 50 40-75 5 0
*The amount of F-BAM is fixed and the exact value is in the range shown in the table. The OPC, FA, PSA, F-BAM, and WAS are the same as used in Chapter 6, and the GGBS is the same as used in Chapter 5).
7.3 Results and discussion
7.3.1 Aggregate properties improvement
• Particle size distributions
For all the samples, there is very small amount of pellets above 16 mm, and these big pellets
are not well compacted having an irregular shape and weak pellet strength. These fractions
generally account for less than 5% of the total pellets produced in this chapter, therefore,
this fraction is sieved out (as performed in the pilot plant of Attero & Smals).
PPF

Chapter 7 109
During the pelletizing procedure, it is observed that the generation and growth of pellets in
the samples with nS is earlier and faster than other samples, as well as in reference sample
(Ref.); while samples with PPF take longer time to grow. The generation speed of pellets
during the pelletization follows the order of: (0.8 or 0.4) nS > Ref. > 10C (5C, 6C, 15C) >
No WAS (No PSA) > samples with PPF. However, this difference is minor. It can be
concluded that increasing the F-BAM amount and adding PPF decrease slightly the
generation speed of the pellets, while adding PSA or WAS result in a shorter time needed
for the generation of pellets during pelletization. Finer particle sizes of the raw materials
can shorten the granulation time.
0 2 4 6 8 10 12 14 16
0
20
40
60
80
100
Cu
mu
lativ
e m
ass
[%
]
Particle size [mm]
5C
10C
15C
6C
Ref.
0.5% PPF
1.0% PPF
2.5% PPF
4.5% PPF
0.4 nS
0.8 nS
Figure 7.2: The particle size distributions of the produced lightweight aggregates
The particle size distributions of all the aggregates under 16 mm produced are shown in
Figure 7.2. The particle size of Ref. is mainly between 2-16 mm, of which particles between
4-16 mm account for around 96% wt. It can be seen that pellets below 2 mm accounts for
approximately less than 7% of the total for all the mixtures, and the pellets produced with
PPF have a slightly higher amount of particles under 2 mm than other samples. The samples
Ref., 0.4 nS and 0.8 nS have coarser particle size than other mixtures, while the samples
with PPF have finer particle sizes. This can be explained by the following reasons: firstly,
Ref. has a higher powder/F-BAM ratio, which means more water layers will be formed on
the small particles; this water layer will make the pellets grow fast, hence, the pellets are
bigger than other samples within the same pelletizing duration. It is also noticed that Ref.
has some particles which are irregular, similar as shown in other work (Colangelo et al.,
2015); while the particles of the samples except Ref. in this study are more rounded. This
may indicate that the pellets containing only powder materials are more difficult to be
compacted during the pelletizing procedure than the ones with more F-BAM. For
aggregates produced with nS, it was observed that the particles are more rounded than the
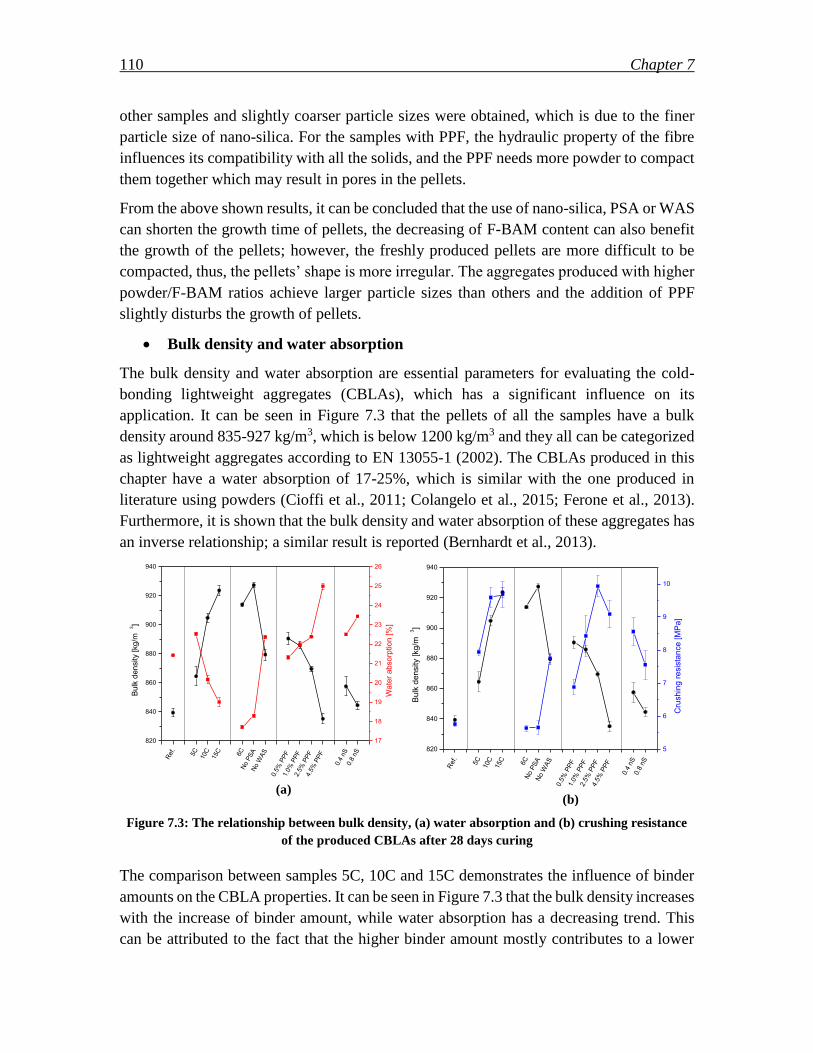
110 Chapter 7
other samples and slightly coarser particle sizes were obtained, which is due to the finer
particle size of nano-silica. For the samples with PPF, the hydraulic property of the fibre
influences its compatibility with all the solids, and the PPF needs more powder to compact
them together which may result in pores in the pellets.
From the above shown results, it can be concluded that the use of nano-silica, PSA or WAS
can shorten the growth time of pellets, the decreasing of F-BAM content can also benefit
the growth of the pellets; however, the freshly produced pellets are more difficult to be
compacted, thus, the pellets’ shape is more irregular. The aggregates produced with higher
powder/F-BAM ratios achieve larger particle sizes than others and the addition of PPF
slightly disturbs the growth of pellets.
• Bulk density and water absorption
The bulk density and water absorption are essential parameters for evaluating the cold-
bonding lightweight aggregates (CBLAs), which has a significant influence on its
application. It can be seen in Figure 7.3 that the pellets of all the samples have a bulk
density around 835-927 kg/m3, which is below 1200 kg/m3 and they all can be categorized
as lightweight aggregates according to EN 13055-1 (2002). The CBLAs produced in this
chapter have a water absorption of 17-25%, which is similar with the one produced in
literature using powders (Cioffi et al., 2011; Colangelo et al., 2015; Ferone et al., 2013).
Furthermore, it is shown that the bulk density and water absorption of these aggregates has
an inverse relationship; a similar result is reported (Bernhardt et al., 2013).
Ref.
5C
10C
15C 6C
No P
SA
No W
AS
0.5%
PP
F
1.0%
PP
F
2.5%
PP
F
4.5%
PP
F
0.4
nS0.
8 nS
820
840
860
880
900
920
940
Bu
lk d
en
sity [kg
/m3]
17
18
19
20
21
22
23
24
25
26
Wa
ter
ab
so
rptio
n [%
]
(a)
Ref.
5C
10C
15C 6C
No P
SA
No W
AS
0.5
% P
PF
1.0
% P
PF
2.5
% P
PF
4.5
% P
PF
0.4
nS
0.8
nS
820
840
860
880
900
920
940
Bu
lk d
en
sity [kg
/m3]
5
6
7
8
9
10
Cru
sh
ing
re
sis
tan
ce
[M
Pa
]
(b)
Figure 7.3: The relationship between bulk density, (a) water absorption and (b) crushing resistance
of the produced CBLAs after 28 days curing
The comparison between samples 5C, 10C and 15C demonstrates the influence of binder
amounts on the CBLA properties. It can be seen in Figure 7.3 that the bulk density increases
with the increase of binder amount, while water absorption has a decreasing trend. This
can be attributed to the fact that the higher binder amount mostly contributes to a lower
Chapter 7 111
porosity (Manikandan & Ramamurthy, 2008) and denser microstructure of the pellets; also,
cement has a higher density than the other raw materials, which increases the total density
when its amount is increased. Similar results were observed in a previous study (Thomas
& Harilal, 2015). For samples with PPF, the bulk densities decrease with the increase of
PPF content while their water absorption increases. This is due to the fact that the PPF is
not very easy to be glued and compacted in the pellets, hence the microstructure of the
pellets is not as dense as the other samples; in addition, the PPF has very low density
compared with OPC or F-BAM.
Comparison of sample Ref. and No PSA shows the influence of F-BAM content on the
CBLA properties. Sample Ref. has a lower bulk density and higher water absorption than
sample No PSA, which indicates that the increasing F-BAM amount can result in a lower
porosity of the produced aggregates. The higher surface area of the powders than F-BAM
results in a higher amount of water absorbed on their surface during pelletization, which
may form a water layer force between particles. Subsequently, the compaction of the pellets
is more difficult than the sample with F-BAM. Moreover, after the evaporation of the water,
higher amounts of capillary pores are left, which results in a higher porosity. Thus, the
sample with a higher powder/F-BAM ratio has a lower bulk density. When nS is used as
cement replacement, the bulk density of the CBLAs decrease compared with sample 10C;
and a higher content of nS results in lower bulk density and then higher water absorption.
The higher surface area of nS particles than OPC and subsequently a thicker water layer
(Quercia Bianchi, 2014) contributes to a porous microstructure.
Sample 6C shows an increased bulk density and decreased water absorption compared with
sample 10C, while sample No WAS shows the opposite trend. The WAS can enhance the
gluing of the particles, and also its finer particle size may contribute to a slightly denser
microstructure.
It can be briefly summarized that increasing the binder amount (comparison of 5C, 10C
and 15C), F-BAM content (Ref. and No PSA) and PSA (10C and No PSA) amount can
result in the decrease of the porosity of the produced lightweight aggregates while the use
of PPF and nS results in the increase of aggregate porosity.
• Crushing resistance
The cold bonded aggregates produced with similar methods as reported in (Cioffi et al.,
2011; Colangelo et al., 2015; Ferone et al., 2013) have a bulk density around 1200-1600
kg/m3 and water absorption about 8-20%, and the crushing resistance is between 2-6 MPa.
Hence, it is observed that the aggregate Ref. has a lower bulk density and higher water
absorption, which indicates that Ref. has higher porosity; while it has a higher crushing
resistance compared with others products, this may be attributed to the addition of MSWI
bottom ash fines (F-BAM) instead of powders only. The mechanism of the contribution
from F-BAM can be explained by the following hypothesis (as described in Chapter 6):

112 Chapter 7
firstly, the F-BAM can act as ‘aggregates’ in the pellets which enhance the skeleton
strength of pellets, and F-BAM has an irregular particle shape which can contribute to a
better bonding strength with the paste; secondly, F-BAM has smaller surface area
compared with powdered materials with same volume, which means less binder is needed
to bind the particles. Hence, Ref. can reach a higher crushing resistance with same binder
amount, although it has a higher porosity.
The 28-day crushing resistance (CR) of the samples produced in this study is around 5.64-
9.93 MPa (Figures 7.3 and 7.4). Figure 7.4 shows the CR development along with curing
time. The CR of all the samples is increasing with the curing time and this increase is more
dramatic at the early age (around 70-85% can be reached). The crushing resistance of Ref.
is increasing with the curing time and this increase is relatively slow after 7 days curing.
1 10 100
2
4
6
8
10
12
14
Cru
sh
ing
re
sis
tan
ce
[M
Pa
]
Curing time [days]
5C
10C
15C
(a)
1 10 100
2
4
6
8
10
12
14
Cru
sh
ing
re
sis
tan
ce
[M
Pa
]
Curing time [days]
10C
6C
NO PSA
NO WAS
Ref.
(b)
1 10 100
2
4
6
8
10
12
14
Cru
shin
g r
esi
sta
nce
[M
Pa
]
Curing time [days]
10C
0.5% PPF
1.0% PPF
2.5% PPF
4.5% PPF
(c)
1 10 100
2
4
6
8
10
12
14
Cru
shin
g r
esi
sta
nce
[M
Pa
]
Curing time [days]
10C
0.4 nS
0.8 nS
(d)
Figure 7.4: The crushing resistance of the aggregates after different curing ages
Figure 7.4 (a) shows that the CR has an increasing trend with the order of sample 5C, 10C
and 15C during the whole curing time. After 91 days, the CR of 10C and 15C is higher
than 5C by 14.7% and 22.5%, respectively. The binder amount has an influence on the CR

Chapter 7 113
and a higher amount of binder results in higher CR, and Figure 7.3 (b) shows that the bulk
density of these samples has a positive correlation with the binder amount. This is due to a
denser microstructure and better bonding strength between particles and matrix. Similar
results were obtained in other research regarding artificial aggregates produced from only
powder materials (Colangelo et al., 2015; Thomas & Harilal, 2015). It can be seen in Figure
7.5 (a) and (b) that the hydration products grow well around the particles, and the F-BAM
particle is well embedded in the matrix and surrounded by the binder hydrates and fly ash
particles, which contribute to the pellet strength.
The CR comparison of sample No PSA and 10C (Figure 7.4 (b)) shows that the addition
of paper sludge ash (PSA) has a positive effect on the CR: sample 10C containing PSA
obtains around 12% higher CR than sample No PSA after 91 days curing. In addition,
Figure 7.3 (b) shows that sample No PSA has a higher bulk density than 10C which
indicates a good compaction of aggregate, while its CR is lower compared to sample 10C.
This is due to the fact that, firstly, PSA contains calcium silicate and portlandite (as shown
in Figures 6.5-6.8) and contributes to cement hydration which manifest after longer curing
times (Ferrándiz-Mas et al., 2014), while FA is reported to have pozzolanic properties
(Bentz et al., 2011). Therefore, the early strength which is necessary for keeping the
aggregates shape can be improved by adding PSA, while the longer time strength can be
increased by FA. Hence, the combination of FA and PSA is beneficial for the aggregates
properties.
Sample No WAS and 10C has very similar CR (slightly higher after 91 days), and the
addition of washing aggregate sludge (WAS) slightly decreases the CR of pellets. The
WAS is an inert material which does not contribute to the cement hydration, however, the
production of the pellet can be shortened due to its fine particle size and high water
absorption. Sample 6C has lower CR compared with 10C and comparable to sample 5C
and its CR is increasing steadily. It is reported that the ground granulated blast furnace slag
(GGBS) can result in higher strength and lower porosity of concrete due to its pozzolanic
property (Oner & Akyuz, 2007), however, this is not observed in the produced aggregates.
The possible reasons can be that the pozzolanic reaction needs a longer time and higher pH
in order to make a significant contribution.
Samples with nS have a lower crushing resistance compared with 10C (Figure 7.4 (d))
when nS is used as OPC replacement, which is in contrast to the phenomenon in concrete
(Quercia Bianchi, 2014), which is due to the porous microstructure of the pellet with nS.
Comparing samples Ref. and No PSA, the amount of F-BAM is increased by around 25%
wt. Sample Ref. has a lower CR and after 91-days sample No PSA has a CR higher than
Ref. by 23%. Moreover, as addressed in Section 7.3, Ref. has a higher CR than other cold
bonded lightweight aggregates which were produced with only powders (Baykal & Doven,
2000). This demonstrates that the addition of F-BAM contributes to a higher CR. This can

114 Chapter 7
be comprehensively explained from two aspects: firstly, when more F-BAM is added to
replace coal fly ash, the amount of binder needed to bind them decreases as the surface area
of the F-BAM is lower than the powder coal fly ash. Hence, sample with more F-BAM has
higher CR when the binder amount is the same. Secondly, the F-BAM can act as ‘aggregate’
in the pellet to support the pellet strength and the irregular shape of the F-BAM also
increases the bonding strength between the matrix and F-BAM, also the F-BAM is stronger
than the matrix to support the loading. Therefore, the addition of F-BAM can improve the
artificial aggregate strength, which is in line with the findings in Chapter 6. Additionally,
in this way the F-BAM can be used as a suitable material for producing aggregates, instead
of as aggregate use directly, when the F-BAM only has a detrimental influence (Müller &
Rübner, 2006; Yu et al., 2014) or being disposed as waste material in landfill areas.
Furthermore, the F-BAM particles are mostly very porous, hence, the use of F-BAM
instead of powders would not increase the bulk density of the pellets, or even a lower bulk
density of pellets can be achieved.
Hence, the combination of these solid wastes with various proportions for producing
lightweight aggregates is an efficient way to recycle them, because they can be used to
improve the pellet properties based on their special characteristics. In future studies, other
waste fine fractions can also be added to modify the properties of the artificial aggregates,
such as sludge, finer bottom ashes, recycled concrete fines, etc.
The comparison of samples 10C, 0.5%-4.5% PPF demonstrates the influence of PPF on
the CR. The addition of the PPF contributes to comparable CR or even higher than 10C,
while achieving lower bulk densities; the more PPF is added, the higher CR can be reached.
Hereby, the functions of the PPF are similar to the fibres used in concrete (Bernhardt et al.,
2014; Bonakdar et al., 2013; Lee et al., 2010). Under the individual pellet test, the pellets
without PPF are broken into two hemispheres, while the pellets with PPF were still held
together after the crack almost penetrated the whole pellet (as shown in Figure 7.5 (c));
also the PPF embedded in the matrix goes through the voids (Figure 7.5 (d)), which in
general are the weak part of the pellets. It is observed that along the crack after loading,
some fibres were broken, some of them were pulled out, which means the PPF bear the
force during the loading procedure. However, the CR of samples with PPF at early stage is
lower than 10C, and the higher amount of PPF the sample contains, the lower CR it will
have at early age. This may attribute to the fact that these samples have high porosity and
the hydration of the binders is still ongoing, which leads to a lower capacity to bind the
fibre into the matrix. Hence, when the aggregates are under loading, most fibres are pulled
out easily, and do not play a significant role as reinforcement. The CR increase of samples
with 0.5%, 1.0%, 2.5% and 4.5% vol. PPF after 91 days is about 14.4%, 30.2%, 44.4% and
16.6% compared with 10C, respectively. It can be seen that when the PPF amount is 4.5%,
the CR is lower than the sample with 2.5% PPF. Firstly, when the amount of the PPF
exceeds a certain level, the pellets are more difficult to compact during the pelletizing
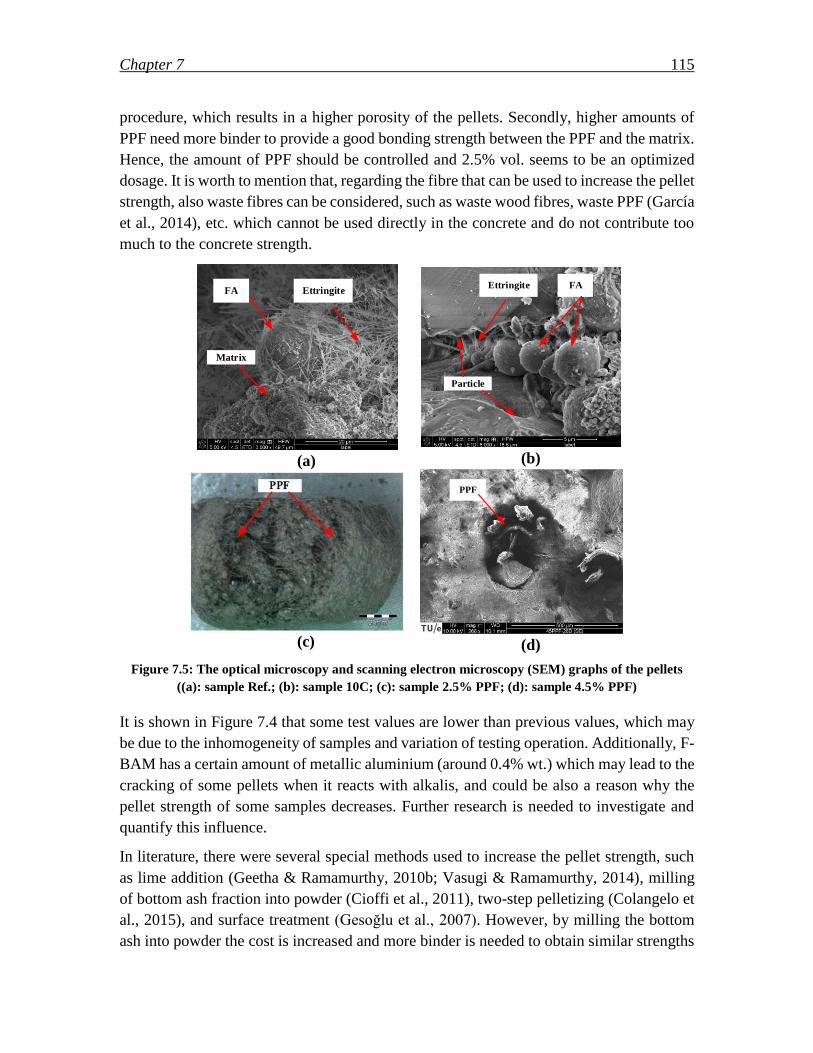
Chapter 7 115
procedure, which results in a higher porosity of the pellets. Secondly, higher amounts of
PPF need more binder to provide a good bonding strength between the PPF and the matrix.
Hence, the amount of PPF should be controlled and 2.5% vol. seems to be an optimized
dosage. It is worth to mention that, regarding the fibre that can be used to increase the pellet
strength, also waste fibres can be considered, such as waste wood fibres, waste PPF (García
et al., 2014), etc. which cannot be used directly in the concrete and do not contribute too
much to the concrete strength.
FA Ettringite
Matrix
FA Ettringite
Matrix
(a)
Ettringite FA
Particle
Ettringite FA
Particle
(b)
(c)
PPFPPF
(d)
Figure 7.5: The optical microscopy and scanning electron microscopy (SEM) graphs of the pellets
((a): sample Ref.; (b): sample 10C; (c): sample 2.5% PPF; (d): sample 4.5% PPF)
It is shown in Figure 7.4 that some test values are lower than previous values, which may
be due to the inhomogeneity of samples and variation of testing operation. Additionally, F-
BAM has a certain amount of metallic aluminium (around 0.4% wt.) which may lead to the
cracking of some pellets when it reacts with alkalis, and could be also a reason why the
pellet strength of some samples decreases. Further research is needed to investigate and
quantify this influence.
In literature, there were several special methods used to increase the pellet strength, such
as lime addition (Geetha & Ramamurthy, 2010b; Vasugi & Ramamurthy, 2014), milling
of bottom ash fraction into powder (Cioffi et al., 2011), two-step pelletizing (Colangelo et
al., 2015), and surface treatment (Gesoğlu et al., 2007). However, by milling the bottom
ash into powder the cost is increased and more binder is needed to obtain similar strengths

116 Chapter 7
due to the increasing surface area of raw materials. In this study, the F-BAM is used as
received without further treatment, and better results are obtained. Considering two-step
pelletization and aggregate surface treatment, the increase of the pellet strength is not so
substantial considering the binder amount added. This is due to the fact that the
microstructure of the pellet, which influences the pellet strength, is not densified by these
two methods (only the shell layer of the pellets is strengthened, but the core of the pellet is
still weak), even though the binder amount is quite high (almost 14% wt.). In the present
study, the F-BAM and other industrial powders are mixed homogenously and the F-BAM
is acting as ‘aggregates’ to support the pellet strength and this can decrease the amount of
binder used and increase pellet strength, which is one of the benefits of combining the use
of F-BAM with other wastes. Polypropylene fibres are introduced into the pelletizing
process to produce cold bonded lightweight aggregates for the first time, and the aggregates
produced have lower bulk density while achieving higher crushing resistance compared
with normal cold bonded lightweight aggregates.
It can be summarized that, to increase the crushing strength of the cold-bonding lightweight
aggregates, the binder amount, F-BAM addition, and applying appropriate waste powders
as additives can be considered. For decreasing the bulk density and increasing the crushing
strength of the lightweight aggregates, the addition of 2.5% vol. PPF can be an option.
7.3.2 Leaching behaviour evaluation of CBLAs
The total amount of investigated heavy metals and salts in raw materials for CBLAs and
their leaching concentrations in F-BAM are shown in Table 7.2.
Table 7.2:The total amount of chlorides, sulphates, antimony, copper and molybdenum in raw
materials and their leaching concentrations during the column test, and the limit level of their
leaching specified in Dutch legislation-SQD (2013) [mg/kg d.m.]
Total amount
F-BAM
Sb Cu Mo Chloride Sulphate
83 3100 19 2100 22900
FA 110 99 28 200 10300
PSA 11 22 <1.0 18300 6200
WAS 42 450 3.9 <100 1100
Column leaching F-BAM 0.47 1.1 0.68 950 11000
Leachability F-BAM (%) 0.57 0.035 3.58 45.24 48.03
SQD limit 0.32 0.9 1.0 616 1730
The leaching concentration of antimony (Sb), copper (Cu), molybdenum (Mo), chloride
and sulphate of the aggregate samples after 28 days and 91 days curing is shown in Figure
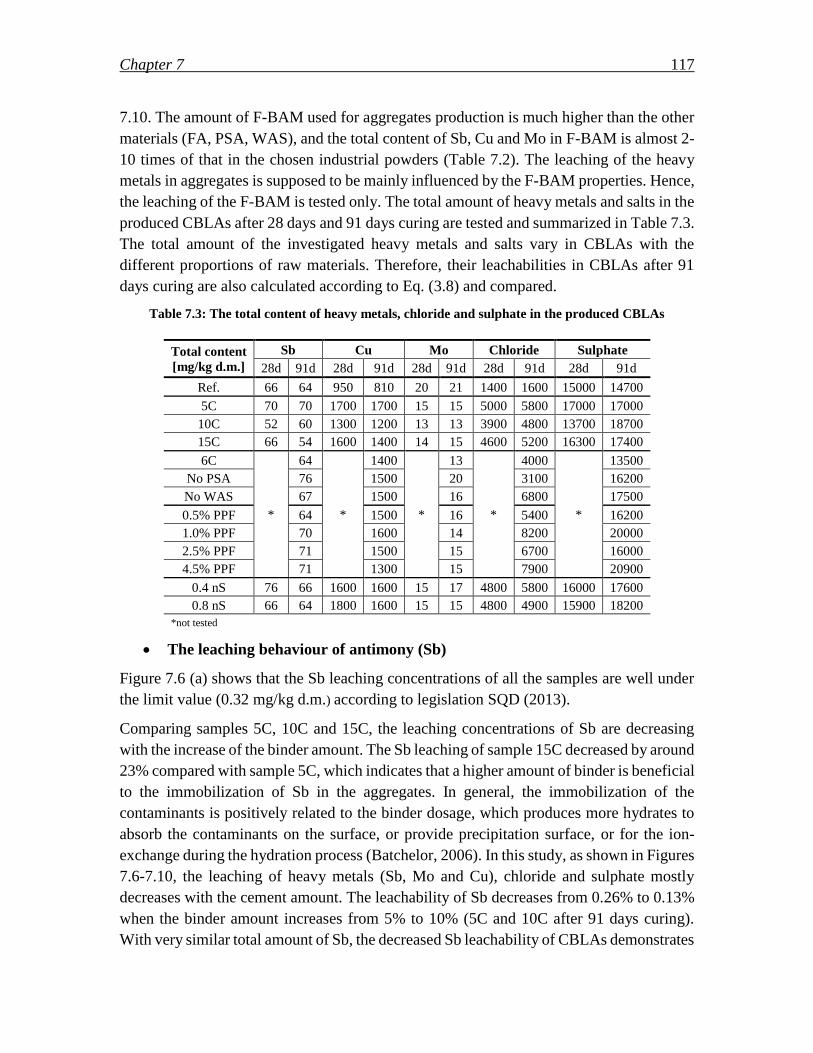
Chapter 7 117
7.10. The amount of F-BAM used for aggregates production is much higher than the other
materials (FA, PSA, WAS), and the total content of Sb, Cu and Mo in F-BAM is almost 2-
10 times of that in the chosen industrial powders (Table 7.2). The leaching of the heavy
metals in aggregates is supposed to be mainly influenced by the F-BAM properties. Hence,
the leaching of the F-BAM is tested only. The total amount of heavy metals and salts in the
produced CBLAs after 28 days and 91 days curing are tested and summarized in Table 7.3.
The total amount of the investigated heavy metals and salts vary in CBLAs with the
different proportions of raw materials. Therefore, their leachabilities in CBLAs after 91
days curing are also calculated according to Eq. (3.8) and compared.
Table 7.3: The total content of heavy metals, chloride and sulphate in the produced CBLAs
Total content
[mg/kg d.m.]
Sb Cu Mo Chloride Sulphate
28d 91d 28d 91d 28d 91d 28d 91d 28d 91d
Ref. 66 64 950 810 20 21 1400 1600 15000 14700
5C 70 70 1700 1700 15 15 5000 5800 17000 17000
10C 52 60 1300 1200 13 13 3900 4800 13700 18700
15C 66 54 1600 1400 14 15 4600 5200 16300 17400
6C
*
64
*
1400
*
13
*
4000
*
13500
No PSA 76 1500 20 3100 16200
No WAS 67 1500 16 6800 17500
0.5% PPF 64 1500 16 5400 16200
1.0% PPF 70 1600 14 8200 20000
2.5% PPF 71 1500 15 6700 16000
4.5% PPF 71 1300 15 7900 20900
0.4 nS 76 66 1600 1600 15 17 4800 5800 16000 17600
0.8 nS 66 64 1800 1600 15 15 4800 4900 15900 18200
*not tested
• The leaching behaviour of antimony (Sb)
Figure 7.6 (a) shows that the Sb leaching concentrations of all the samples are well under
the limit value (0.32 mg/kg d.m.) according to legislation SQD (2013).
Comparing samples 5C, 10C and 15C, the leaching concentrations of Sb are decreasing
with the increase of the binder amount. The Sb leaching of sample 15C decreased by around
23% compared with sample 5C, which indicates that a higher amount of binder is beneficial
to the immobilization of Sb in the aggregates. In general, the immobilization of the
contaminants is positively related to the binder dosage, which produces more hydrates to
absorb the contaminants on the surface, or provide precipitation surface, or for the ion-
exchange during the hydration process (Batchelor, 2006). In this study, as shown in Figures
7.6-7.10, the leaching of heavy metals (Sb, Mo and Cu), chloride and sulphate mostly
decreases with the cement amount. The leachability of Sb decreases from 0.26% to 0.13%
when the binder amount increases from 5% to 10% (5C and 10C after 91 days curing).
With very similar total amount of Sb, the decreased Sb leachability of CBLAs demonstrates
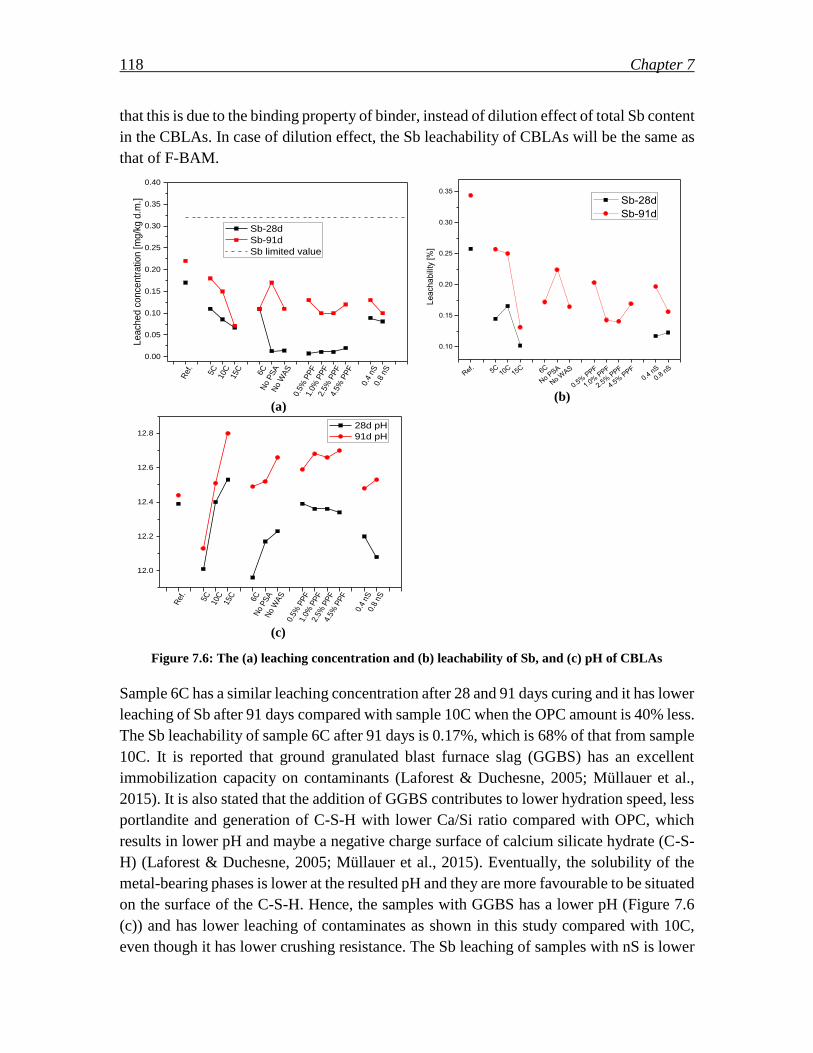
118 Chapter 7
that this is due to the binding property of binder, instead of dilution effect of total Sb content
in the CBLAs. In case of dilution effect, the Sb leachability of CBLAs will be the same as
that of F-BAM.
Ref
.
5C 10C
15C 6C
No
PS
AN
o W
AS
0.5%
PP
F1.
0% P
PF
2.5%
PP
F4.
5% P
PF
0.4
nS0.
8 nS
0.00
0.05
0.10
0.15
0.20
0.25
0.30
0.35
0.40
Leach
ed c
once
ntr
atio
n [m
g/k
g d
.m.]
Sb-28d
Sb-91d
Sb limited value
(a)
Ref. 5C10C
15C 6C
No PSA
No WAS
0.5%
PPF
1.0%
PPF
2.5%
PPF
4.5%
PPF
0.4 n
S
0.8 n
S
0.10
0.15
0.20
0.25
0.30
0.35
Le
ach
ab
ility
[%
]
Sb-28d
Sb-91d
(b)
Ref
.
5C 10C
15C 6C
No
PS
AN
o W
AS
0.5%
PP
F1.
0% P
PF
2.5%
PP
F4.
5% P
PF
0.4
nS0.
8 nS
12.0
12.2
12.4
12.6
12.8 28d pH
91d pH
(c)
Figure 7.6: The (a) leaching concentration and (b) leachability of Sb, and (c) pH of CBLAs
Sample 6C has a similar leaching concentration after 28 and 91 days curing and it has lower
leaching of Sb after 91 days compared with sample 10C when the OPC amount is 40% less.
The Sb leachability of sample 6C after 91 days is 0.17%, which is 68% of that from sample
10C. It is reported that ground granulated blast furnace slag (GGBS) has an excellent
immobilization capacity on contaminants (Laforest & Duchesne, 2005; Müllauer et al.,
2015). It is also stated that the addition of GGBS contributes to lower hydration speed, less
portlandite and generation of C-S-H with lower Ca/Si ratio compared with OPC, which
results in lower pH and maybe a negative charge surface of calcium silicate hydrate (C-S-
H) (Laforest & Duchesne, 2005; Müllauer et al., 2015). Eventually, the solubility of the
metal-bearing phases is lower at the resulted pH and they are more favourable to be situated
on the surface of the C-S-H. Hence, the samples with GGBS has a lower pH (Figure 7.6
(c)) and has lower leaching of contaminates as shown in this study compared with 10C,
even though it has lower crushing resistance. The Sb leaching of samples with nS is lower
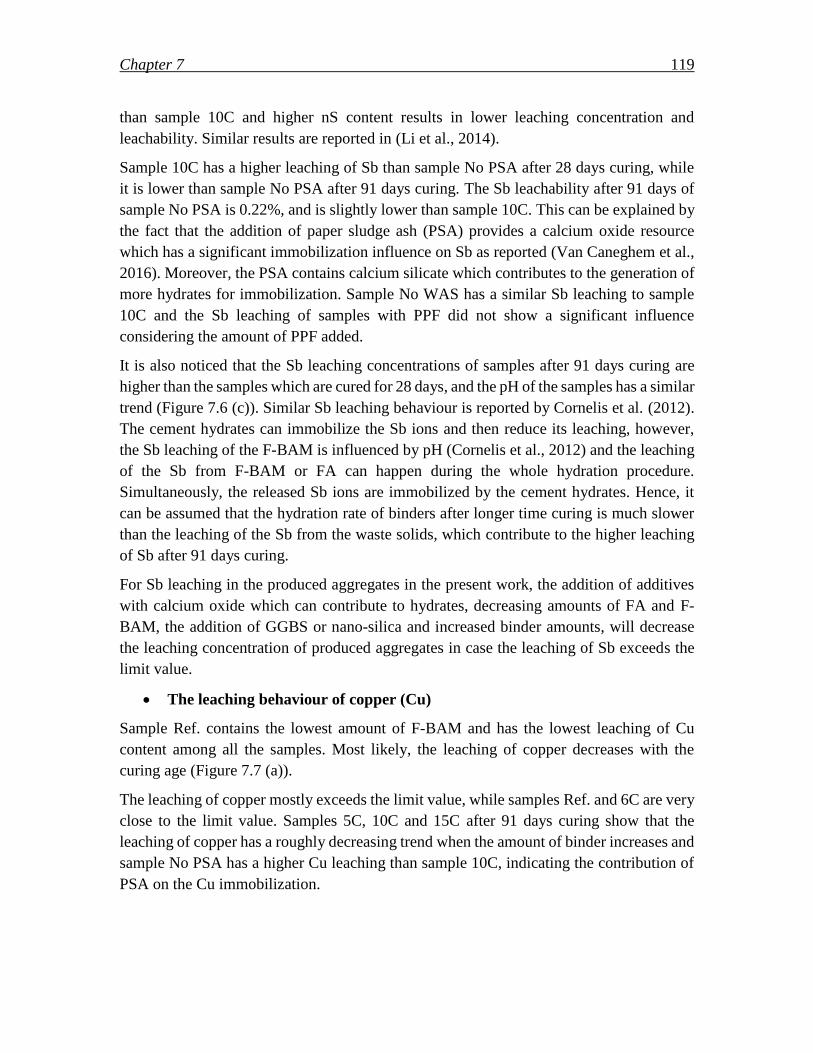
Chapter 7 119
than sample 10C and higher nS content results in lower leaching concentration and
leachability. Similar results are reported in (Li et al., 2014).
Sample 10C has a higher leaching of Sb than sample No PSA after 28 days curing, while
it is lower than sample No PSA after 91 days curing. The Sb leachability after 91 days of
sample No PSA is 0.22%, and is slightly lower than sample 10C. This can be explained by
the fact that the addition of paper sludge ash (PSA) provides a calcium oxide resource
which has a significant immobilization influence on Sb as reported (Van Caneghem et al.,
2016). Moreover, the PSA contains calcium silicate which contributes to the generation of
more hydrates for immobilization. Sample No WAS has a similar Sb leaching to sample
10C and the Sb leaching of samples with PPF did not show a significant influence
considering the amount of PPF added.
It is also noticed that the Sb leaching concentrations of samples after 91 days curing are
higher than the samples which are cured for 28 days, and the pH of the samples has a similar
trend (Figure 7.6 (c)). Similar Sb leaching behaviour is reported by Cornelis et al. (2012).
The cement hydrates can immobilize the Sb ions and then reduce its leaching, however,
the Sb leaching of the F-BAM is influenced by pH (Cornelis et al., 2012) and the leaching
of the Sb from F-BAM or FA can happen during the whole hydration procedure.
Simultaneously, the released Sb ions are immobilized by the cement hydrates. Hence, it
can be assumed that the hydration rate of binders after longer time curing is much slower
than the leaching of the Sb from the waste solids, which contribute to the higher leaching
of Sb after 91 days curing.
For Sb leaching in the produced aggregates in the present work, the addition of additives
with calcium oxide which can contribute to hydrates, decreasing amounts of FA and F-
BAM, the addition of GGBS or nano-silica and increased binder amounts, will decrease
the leaching concentration of produced aggregates in case the leaching of Sb exceeds the
limit value.
• The leaching behaviour of copper (Cu)
Sample Ref. contains the lowest amount of F-BAM and has the lowest leaching of Cu
content among all the samples. Most likely, the leaching of copper decreases with the
curing age (Figure 7.7 (a)).
The leaching of copper mostly exceeds the limit value, while samples Ref. and 6C are very
close to the limit value. Samples 5C, 10C and 15C after 91 days curing show that the
leaching of copper has a roughly decreasing trend when the amount of binder increases and
sample No PSA has a higher Cu leaching than sample 10C, indicating the contribution of
PSA on the Cu immobilization.
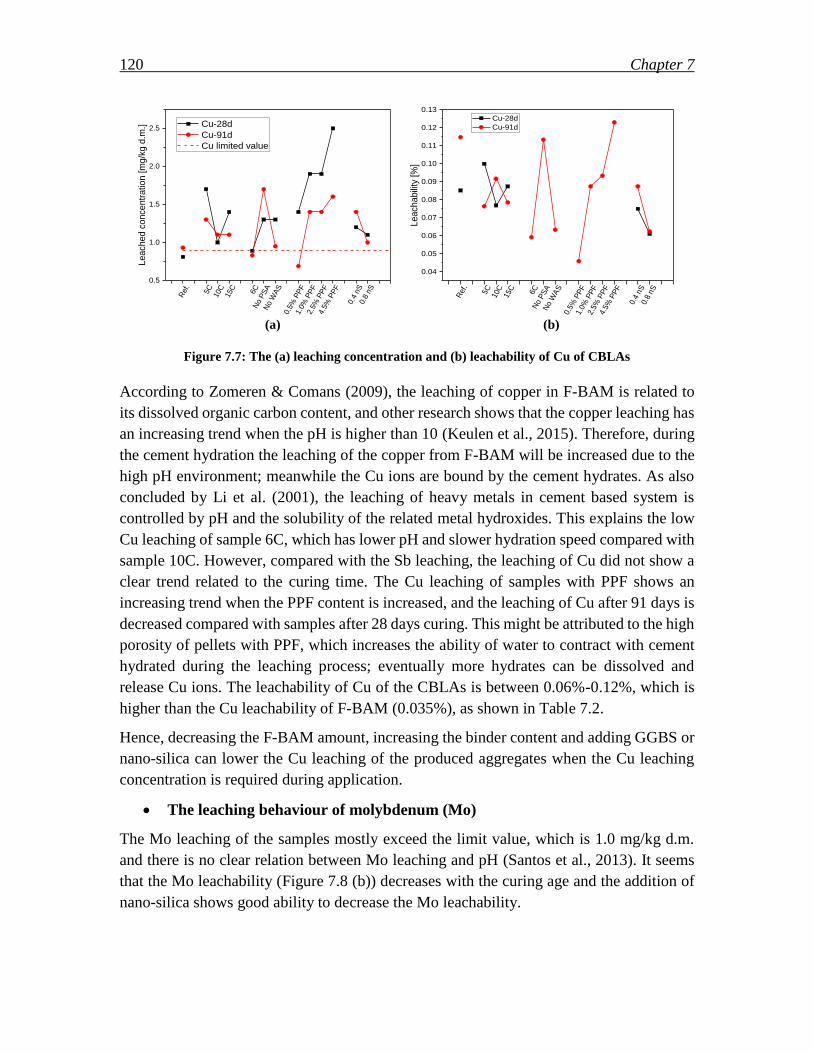
120 Chapter 7
Ref
.
5C 10C
15C 6C
No
PS
AN
o W
AS
0.5%
PP
F1.
0% P
PF
2.5%
PP
F4.
5% P
PF
0.4
nS0.
8 nS
0.5
1.0
1.5
2.0
2.5
Lea
che
d c
once
ntr
atio
n [
mg
/kg d
.m.] Cu-28d
Cu-91d
Cu limited value
(a)
Ref
.
5C 10C
15C 6C
No
PS
AN
o W
AS
0.5%
PP
F1.
0% P
PF
2.5%
PP
F4.
5% P
PF
0.4
nS0.
8 nS
0.04
0.05
0.06
0.07
0.08
0.09
0.10
0.11
0.12
0.13
Lea
cha
bili
ty [
%]
Cu-28d
Cu-91d
(b)
Figure 7.7: The (a) leaching concentration and (b) leachability of Cu of CBLAs
According to Zomeren & Comans (2009), the leaching of copper in F-BAM is related to
its dissolved organic carbon content, and other research shows that the copper leaching has
an increasing trend when the pH is higher than 10 (Keulen et al., 2015). Therefore, during
the cement hydration the leaching of the copper from F-BAM will be increased due to the
high pH environment; meanwhile the Cu ions are bound by the cement hydrates. As also
concluded by Li et al. (2001), the leaching of heavy metals in cement based system is
controlled by pH and the solubility of the related metal hydroxides. This explains the low
Cu leaching of sample 6C, which has lower pH and slower hydration speed compared with
sample 10C. However, compared with the Sb leaching, the leaching of Cu did not show a
clear trend related to the curing time. The Cu leaching of samples with PPF shows an
increasing trend when the PPF content is increased, and the leaching of Cu after 91 days is
decreased compared with samples after 28 days curing. This might be attributed to the high
porosity of pellets with PPF, which increases the ability of water to contract with cement
hydrated during the leaching process; eventually more hydrates can be dissolved and
release Cu ions. The leachability of Cu of the CBLAs is between 0.06%-0.12%, which is
higher than the Cu leachability of F-BAM (0.035%), as shown in Table 7.2.
Hence, decreasing the F-BAM amount, increasing the binder content and adding GGBS or
nano-silica can lower the Cu leaching of the produced aggregates when the Cu leaching
concentration is required during application.
• The leaching behaviour of molybdenum (Mo)
The Mo leaching of the samples mostly exceed the limit value, which is 1.0 mg/kg d.m.
and there is no clear relation between Mo leaching and pH (Santos et al., 2013). It seems
that the Mo leachability (Figure 7.8 (b)) decreases with the curing age and the addition of
nano-silica shows good ability to decrease the Mo leachability.
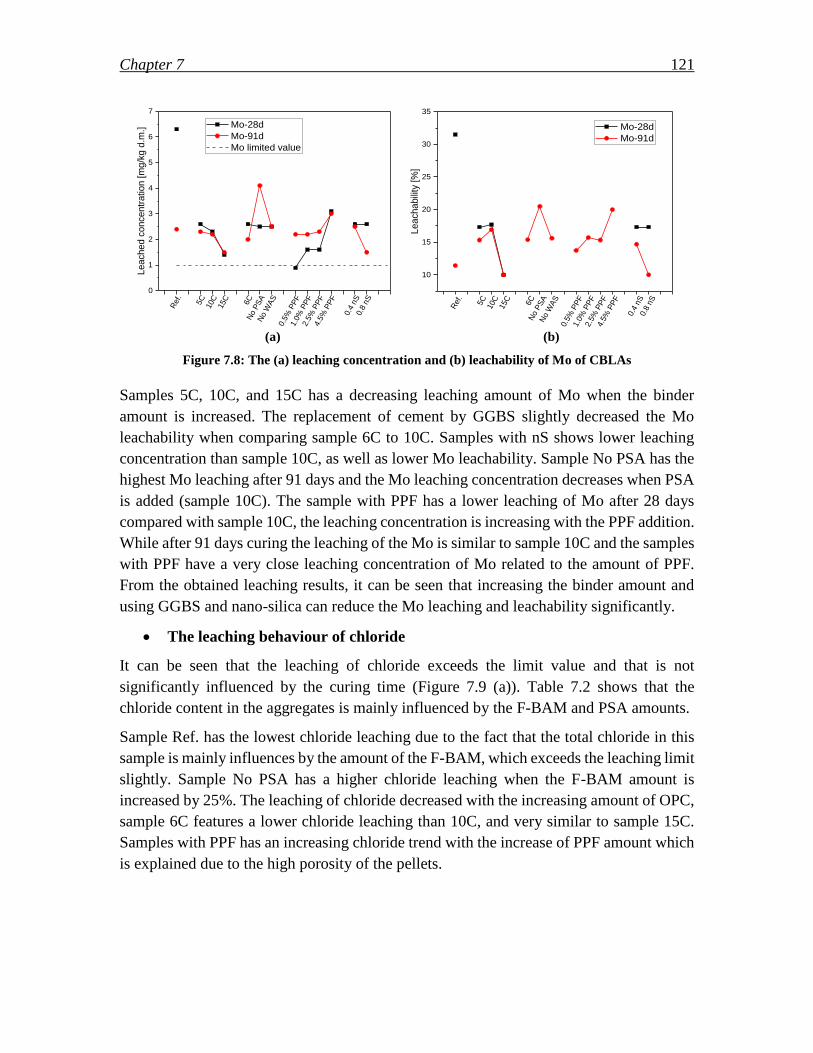
Chapter 7 121
Ref
.
5C 10C
15C 6C
No
PS
AN
o W
AS
0.5%
PP
F1.
0% P
PF
2.5%
PP
F4.
5% P
PF
0.4
nS0.
8 nS
0
1
2
3
4
5
6
7
Lea
che
d c
once
ntr
atio
n [
mg
/kg d
.m.] Mo-28d
Mo-91d
Mo limited value
(a)
Ref
.
5C 10C
15C 6C
No
PS
AN
o W
AS
0.5%
PP
F1.
0% P
PF
2.5%
PP
F4.
5% P
PF
0.4
nS0.
8 nS
10
15
20
25
30
35
Leachabili
ty [%
]
Mo-28d
Mo-91d
(b)
Figure 7.8: The (a) leaching concentration and (b) leachability of Mo of CBLAs
Samples 5C, 10C, and 15C has a decreasing leaching amount of Mo when the binder
amount is increased. The replacement of cement by GGBS slightly decreased the Mo
leachability when comparing sample 6C to 10C. Samples with nS shows lower leaching
concentration than sample 10C, as well as lower Mo leachability. Sample No PSA has the
highest Mo leaching after 91 days and the Mo leaching concentration decreases when PSA
is added (sample 10C). The sample with PPF has a lower leaching of Mo after 28 days
compared with sample 10C, the leaching concentration is increasing with the PPF addition.
While after 91 days curing the leaching of the Mo is similar to sample 10C and the samples
with PPF have a very close leaching concentration of Mo related to the amount of PPF.
From the obtained leaching results, it can be seen that increasing the binder amount and
using GGBS and nano-silica can reduce the Mo leaching and leachability significantly.
• The leaching behaviour of chloride
It can be seen that the leaching of chloride exceeds the limit value and that is not
significantly influenced by the curing time (Figure 7.9 (a)). Table 7.2 shows that the
chloride content in the aggregates is mainly influenced by the F-BAM and PSA amounts.
Sample Ref. has the lowest chloride leaching due to the fact that the total chloride in this
sample is mainly influences by the amount of the F-BAM, which exceeds the leaching limit
slightly. Sample No PSA has a higher chloride leaching when the F-BAM amount is
increased by 25%. The leaching of chloride decreased with the increasing amount of OPC,
sample 6C features a lower chloride leaching than 10C, and very similar to sample 15C.
Samples with PPF has an increasing chloride trend with the increase of PPF amount which
is explained due to the high porosity of the pellets.

122 Chapter 7
Ref
.
5C 10C
15C 6C
No
PS
AN
o W
AS
0.5%
PP
F1.
0% P
PF
2.5%
PP
F4.
5% P
PF
0.4
nS0.
8 nS
0
1000
2000
3000
4000
5000
6000
7000
8000
Lea
che
d c
once
ntr
atio
n [
mg
/kg d
.m.] Chloride-28d
Chloride-91d
Chloride limited value
(a)
Ref
.
5C
10C
15C
6C
No
PS
AN
o W
AS
0.5
% P
PF
1.0
% P
PF
2.5
% P
PF
4.5
% P
PF
0.4
nS
0.8
nS
50
55
60
65
70
75
80
85
90
Lea
cha
bili
ty [
%]
Chloride-28d
Chloride-91d
(b)
Figure 7.9: The (a) leaching concentration and (b) leachability of chloride of CBLAs
The chloride leachability of the CBLAs is in the range of 52%-75%, and the chloride
leaching after longer time curing did not show a large difference, which indicates that the
immobilization of the chloride by hydration is limited and the chloride in the aggregates is
highly soluble. Hence, the immobilization of chloride cannot be easily achieved by
increasing the binder content. Moreover, the amount of the produced aggregates should be
controlled when the chloride leaching is restricted during the application.
• The leaching behaviour of sulphate
Ref
.
5C 10C
15C 6C
No
PS
AN
o W
AS
0.5%
PP
F1.
0% P
PF
2.5%
PP
F4.
5% P
PF
0.4
nS0.
8 nS
0
500
1000
1500
2000
2500
Leached c
oncentr
ation [m
g/k
g d
.m.]
Sulphate-28d
Sulphate-91d
Sulphate limited value
(a)
Ref
.
5C 10C
15C 6C
No
PS
AN
o W
AS
0.5%
PP
F1.
0% P
PF
2.5%
PP
F4.
5% P
PF
0.4
nS0.
8 nS
0
2
4
6
8
10
12
Lea
cha
bili
ty [
%]
Sulphate-28d
Sulphate-91d
(b)
Figure 7.10: The (a) leaching concentration and (b) leachability of sulphate of CBLAs
The leaching of sulphate for all the samples decreased after longer curing times and is well
under the limit. Samples 5C, 10C and 15C show that the leaching of sulphate is increased
when binder is increasing; while the leaching of sulphate in 10C is higher than 5C and 15C.
Sample 6C shows a lower leaching of sulphate than sample 10C, and similar to sample
15C. Sample No PSA and Ref. have much higher amounts of sulphate leaching than other
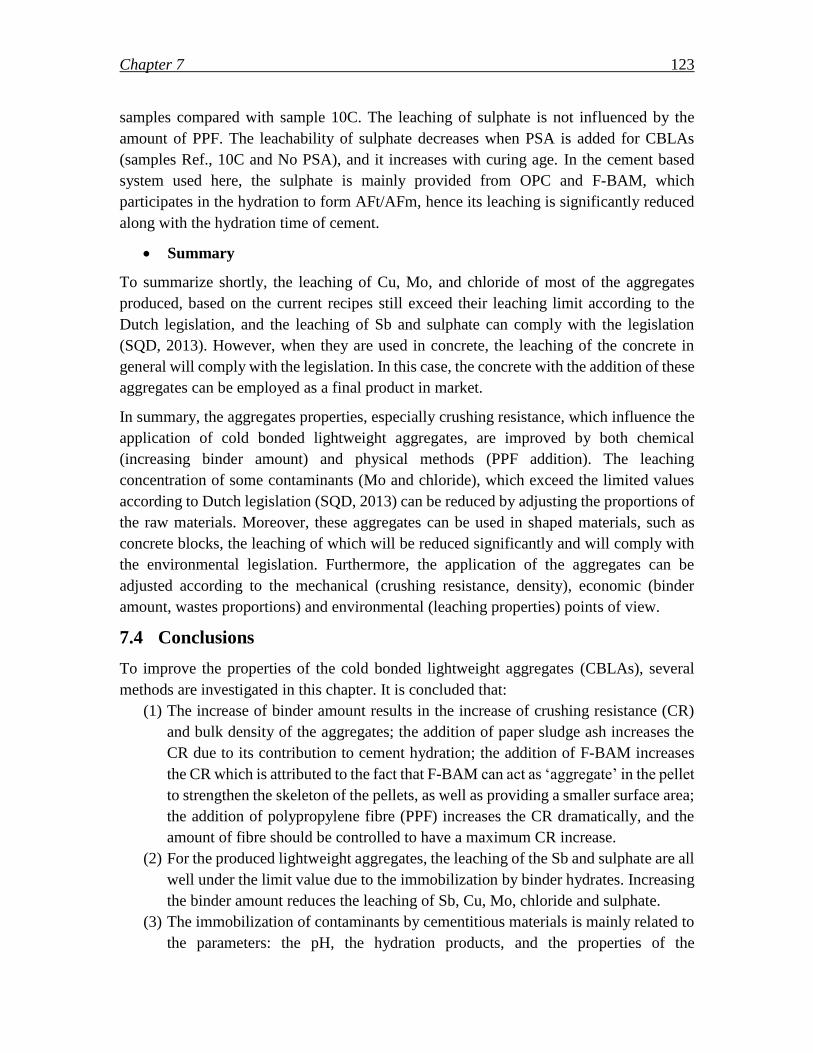
Chapter 7 123
samples compared with sample 10C. The leaching of sulphate is not influenced by the
amount of PPF. The leachability of sulphate decreases when PSA is added for CBLAs
(samples Ref., 10C and No PSA), and it increases with curing age. In the cement based
system used here, the sulphate is mainly provided from OPC and F-BAM, which
participates in the hydration to form AFt/AFm, hence its leaching is significantly reduced
along with the hydration time of cement.
• Summary
To summarize shortly, the leaching of Cu, Mo, and chloride of most of the aggregates
produced, based on the current recipes still exceed their leaching limit according to the
Dutch legislation, and the leaching of Sb and sulphate can comply with the legislation
(SQD, 2013). However, when they are used in concrete, the leaching of the concrete in
general will comply with the legislation. In this case, the concrete with the addition of these
aggregates can be employed as a final product in market.
In summary, the aggregates properties, especially crushing resistance, which influence the
application of cold bonded lightweight aggregates, are improved by both chemical
(increasing binder amount) and physical methods (PPF addition). The leaching
concentration of some contaminants (Mo and chloride), which exceed the limited values
according to Dutch legislation (SQD, 2013) can be reduced by adjusting the proportions of
the raw materials. Moreover, these aggregates can be used in shaped materials, such as
concrete blocks, the leaching of which will be reduced significantly and will comply with
the environmental legislation. Furthermore, the application of the aggregates can be
adjusted according to the mechanical (crushing resistance, density), economic (binder
amount, wastes proportions) and environmental (leaching properties) points of view.
7.4 Conclusions
To improve the properties of the cold bonded lightweight aggregates (CBLAs), several
methods are investigated in this chapter. It is concluded that:
(1) The increase of binder amount results in the increase of crushing resistance (CR)
and bulk density of the aggregates; the addition of paper sludge ash increases the
CR due to its contribution to cement hydration; the addition of F-BAM increases
the CR which is attributed to the fact that F-BAM can act as ‘aggregate’ in the pellet
to strengthen the skeleton of the pellets, as well as providing a smaller surface area;
the addition of polypropylene fibre (PPF) increases the CR dramatically, and the
amount of fibre should be controlled to have a maximum CR increase.
(2) For the produced lightweight aggregates, the leaching of the Sb and sulphate are all
well under the limit value due to the immobilization by binder hydrates. Increasing
the binder amount reduces the leaching of Sb, Cu, Mo, chloride and sulphate.
(3) The immobilization of contaminants by cementitious materials is mainly related to
the parameters: the pH, the hydration products, and the properties of the

124 Chapter 7
contaminants (stability, complexation, etc.). For the aggregates produced by F-
BAM and industrial wastes in this study, the Sb can be immobilized successfully
by increasing the binder amount, GGBS, nano-silica and PSA addition, which all
results in more hydration by-products. The leaching of Cu is mainly influenced by
the behaviour of organic matter in F-BAM, which can be immobilized by binder
addition, use of GGBS and nano-silica. The binding of Mo shows a good correlation
with binder content and its hydration. Sulphate leaching are well under the limit
value owing to its participation in cement hydration. The chloride in the aggregates
is highly soluble, and can partially be immobilized. Furthermore, the
immobilization procedure in the pellets is a combination of ions leaching from the
solid wastes and their stabilization by cement hydrates. Therefore, to modify the
leaching of ions, especially heavy metals, their leaching behaviour at high pH, and
the stabilization mechanism by cement is suggested to be determined individually
before the combination of solid wastes.
(4) The produced cold-bonding lightweight aggregates can be used as aggregate
replacement, and the amount of these aggregates can be controlled when the
leaching properties of the concrete is required. Further research can focus on the
integrated recycling of other wastes, durability and life cycle of the produced
artificial aggregates and comprehensive study on their application in concrete
which is studied in the next chapter.
The properties of the CBLAs can be modified through controlling the chosen combinations
of raw materials and their proportions, as well as changing pelletizing parameters. The use
of CBLAs in concrete has significant influence on the concrete properties, which is studied
in the next chapter.

Chapter 8 125
*Content of this chapter was submitted to Journal and now under review.
Chapter 8
8 The environmental properties and durability of concrete
incorporating CBLAs*
8.1 Introduction
In this chapter, three types of CBLAs are produced with consideration of improving their
strength, including the use of F-BAM, nano-silica from olivine dissolution and
polypropylene fibre. The properties of these CBLAs are evaluated and compared with the
ones produced by others in literature. These CBLAs are used in self-compacting concrete
to replace natural gravels, and the fresh and hardened properties of the concretes are tested.
The durability properties of the concretes are studied through the water penetration and
freeze-thaw tests. Finally, the environmental impact of the concretes with artificial
aggregates are evaluated and results are compared with the Dutch legislation.
8.2 Materials and experimental methods
8.2.1 Production of CBLAs and their properties
In this chapter, three recipes used to produce CBLAs in Chapter 7 are selected for further
study, and then three types of CBLAs were produced.
1000 10000
0
20
40
60
80
100
Cu
mu
lative
fin
es [%
]
Particle size [m]
Gravel 2-8 mm
S1 (10C)
S2 (2.5% PPF)
S3 (0.8 nS)
Gravel 8-16 mm
Figure 8.1: The particle size distributions of the gravels and the produced CBLAs used for concrete
The raw materials used for CBLA sample 1 (S1) are OPC (10%), F-BAM (a value between
40-75%), WAS (5%), PSA and FA (around 10-45% in total) based on total dry mass, the

126 Chapter 8
same as sample 10C in Chapter 7. For sample 2 (S2), around 2.5% vol. polypropylene fibre
(PPF) is added to the mixture of the raw materials (the sample as sample 2.5% PPF in
Chapter 7), the other proportion of the raw materials are the same as S1. For sample 3 (S3,
the same as sample 0.8 nS in Chapter 7), around 0.8% of the cement is replaced by nano-
silica, and the amount of the other materials are kept the same as S1.
The PSDs of the produced aggregates and gravels are shown in Figure 8.1. The bulk density
(BD) of S1, S2 and S3 is approximately 923 kg/m3, 870 kg/m3, and 844 kg/m3, respectively.
The water absorption (WA) and crushing resistance (CR) of S1, S2 and S3 are 19% and
9.6 MPa, 22.4% and 9.9 MPa, and 23% and 7.56 MPa, respectively. Figure 8.1 depicts that
the particle sizes of the produced aggregates are mainly between 4-12 mm, and the sample
S3 has coarser particles than S1 and S2, while samples S1 and S2 have very similar particle
size distribution.
8.2.2 Concrete mixture design and test
A self-compacting concrete (SCC) is designed; the materials used are OPC, coal fly ash,
sand with a particle size under 4 mm, crushed gravel with a particle size between 2-8 mm,
and gravel with a particle size between 8-16 mm. The proportions of materials for each
concrete mixture are listed in Table 8.1. A superplasticizer (SP, Glenium 51 (BASF)) is
used to adjust the flowability of concrete and its amount is fixed at 5.89% of the OPC for
all the concrete mixtures.
Table 8.1: The design for concrete mixtures
Materials Ref.
Mix 1 Mix 2 Mix 3
30%
vol.
60%
vol.
30%
vol.
60%
vol.
30%
vol.
60%
vol.
[kg/m3]
CEM I 42.5 N 310
Coal fly ash (FA) 179
Sand 0-4 mm 572.9
Gravel 2-8 mm 697.8 566.52 435.24 577.07 456.33 667.05 558.38
Artificial aggregates 0 241.43
(S1)
483.00
(S1)
234.29
(S2)
468.71
(S2)
236.14
(S3)
472.14
(S3)
Gravel 8-16 mm 376 249.57 123.13 239.02 102.04 149.04 0
Water 139.5 139.5 139.5 139.5 139.5 139.5 139.5
SP 5.89
The gravels (2-8 mm and 8-16 mm) in the concrete are replaced by the produced artificial
aggregates (S1, S2, S3) with 30% and 60% by volume. The amount of each aggregates in
concrete mixtures is calculated based on the idea that the particle size distribution of all the
aggregates for the concrete should be similar to that of the reference concrete. Before

Chapter 8 127
mixing, the artificial aggregates are immersed in water for 24 hours and then dried in open
air for 2 hours to avoid their absorption of water during concrete mixing.
The slump-flow of the freshly mixed concrete is tested following the procedure described
in EN 12350-8 (2010), the largest diameters of the flow spread on the two vertical
dimensions are recorded and their average value is presented as the slump-flow (S-F) of
the concrete. During this test, the time used for the concrete to first reach the 500mm circle
on the testing plat after the cone is lifted is recorded and presented as t500. The V-funnel
test is performed on the fresh concrete according to the procedure defined in EN 12350-9
(2010), and the time used for the concrete finishing flow out of the V-funnel is recorded as
tv. The bulk density of the fresh concrete is tested according to EN 12350-6 (2009). The
fresh concrete is filled in cubic moulds (150×150×150 mm3) and prism moulds
(100×100×500 mm3) and demoulded after 1 day, then sealed in plastic buckets until testing
date. The compressive strength tests are performed on the concrete cubes and two-point
loading flexural strength tests (Figure 8.2 (a)) are conducted on the concrete prisms after
28 and 56 days’ curing according to EN 12390-4 (2000) and EN 12390-5 (2009),
respectively.
(a)
(b)
(c)
Figure 8.2: The device for (a) flexural strength test, (b) water penetration test and (c) prepared
samples for freeze thaw test
The water penetration tests on the hardened concrete cubes under pressure are performed
following the procedure described in EN 12390-8 (2009) and the device used is shown in
Figure 8.2 (b). The freeze-thaw resistance of the hardened concretes is evaluated by

128 Chapter 8
performing the freeze-thaw attack with de-icing salt on the concrete slabs sawn from
concrete cubes (Figure 8.2 (c)) according to NPR-CEN/TS 12390-9 (part 5) (2006), the
mass loss of the tested samples after each testing cycling (7, 14, 28, 42 and 56 cycles) is
recorded.
8.2.3 Leaching behaviour evaluation of F-BA, CBLAs and concrete
The leaching properties of the F-BAM, artificial aggregates and crushed concrete
containing artificial aggregates were evaluated using the column leaching method
described in Section 3.2.2.
The hardened concrete cubes were sent for diffusion test according to NEN 7375 (2004).
The dried concrete samples were merged in demineralised water for specified time, and
then the leachate was renewed by new demineralised water. The volume ratio of liquid to
tested sample was 2. The pH and concentration (ɛ) of components in the changed leachate
were determined using ICP as described in Section 3.2.2. The time to renew the water is 6
hours after the samples were merged in water, and then 1, 2.25, 4, 9, 16, 36 and 64 days.
The cumulative leaching concentration of a component after 64 days (ɛ64) was a sum of its
concentration in each renewed leachate. The derived cumulative leaching of a component
was also calculated separately in each of the test periods. For each concrete mixture,
duplicate samples were tested.
To determine the leaching mechanism of components during diffusion test, the slop (rc) of
the linear regression line between the log (ɛ) and log (hour) was determined and used to
determine if the leaching of component is diffusion controlled or due to other leaching
mechanisms. As specified in NEN 7375 (2004), for the fully diffusion controlled leaching,
the rc is 0.5, when rc of the tested sample is between 0.35-0.65, then the leaching of this
sample is diffusion controlled (Table 8.2).
Table 8.2: The significance of rc in NEN 7375
Increment rc
≤0.35 >0.35 and ≤0.65 >0.65
2-7 Surface wash-off Diffusion Dissolution
5-8 Depletion Diffusion Dissolution
4-7 Depletion Diffusion Dissolution
3-6 Depletion Diffusion Dissolution
2-5 Depletion Diffusion Dissolution
1-4 Surface wash-off Diffusion Delayed diffusion or dissolution

Chapter 8 129
8.3 Results and discussions
8.3.1 Properties of fresh concrete
• Slump flow
Figure 8.3 shows the slump flow (S-F) diameter of the fresh mixed concrete with and
without CBLAs. The reference concrete (Ref.) has a S-F diameter around 753 mm, which
belong to class SF2 according to EN 206-9 (2007).
Ref
.
Mix1-
30%
Mix1-
60%
Mix2-
30%
Mix2-
60%
Mix3-
30%
Mix3-
60%
300
400
500
600
700
800
SF1
Slu
mp
flo
w d
iam
ete
r [m
m] SF2
Figure 8.3: The slump flow diameter of the fresh concrete mixtures
For concrete mixture 1, its S-F diameter has a slight increase (0.7% increase) compared to
the reference when 30% vol. of artificial aggregates (S1) is added to replace natural
aggregates, while a decrease of S-F diameter is observed when 60% vol. of aggregate is
replaced by S1 (around 3% reduction). The S-F diameter of concrete mixture 1 with
artificial aggregates (S1) with 30% and 60% vol. replacement still belongs to class SF2
according to EN 206-9 (2007). Concrete mixtures with CBLAs-S2 (Mix 2) shows a
decrease of S-F diameter, and this diameter decreases with the increase of the S2
replacement level. The S-F diameter decreases by 15% when 30% vol. of S2 is used
compared to the reference, and it belongs to SF1. Around 35% reduction of the S-F
diameter of the concrete with 60% vol. of S2 is observed. For concrete with CBLAs-S3
(Mix 3), its S-F diameter has a slight decrease (about 3%) compared to the reference for
both mixtures with 30% and 60% vol. of S3, which belongs to SF2 according to EN 206-9
(2007). The increased use of S3 to replace natural aggregates does not show a significant
influence on the SF diameter.
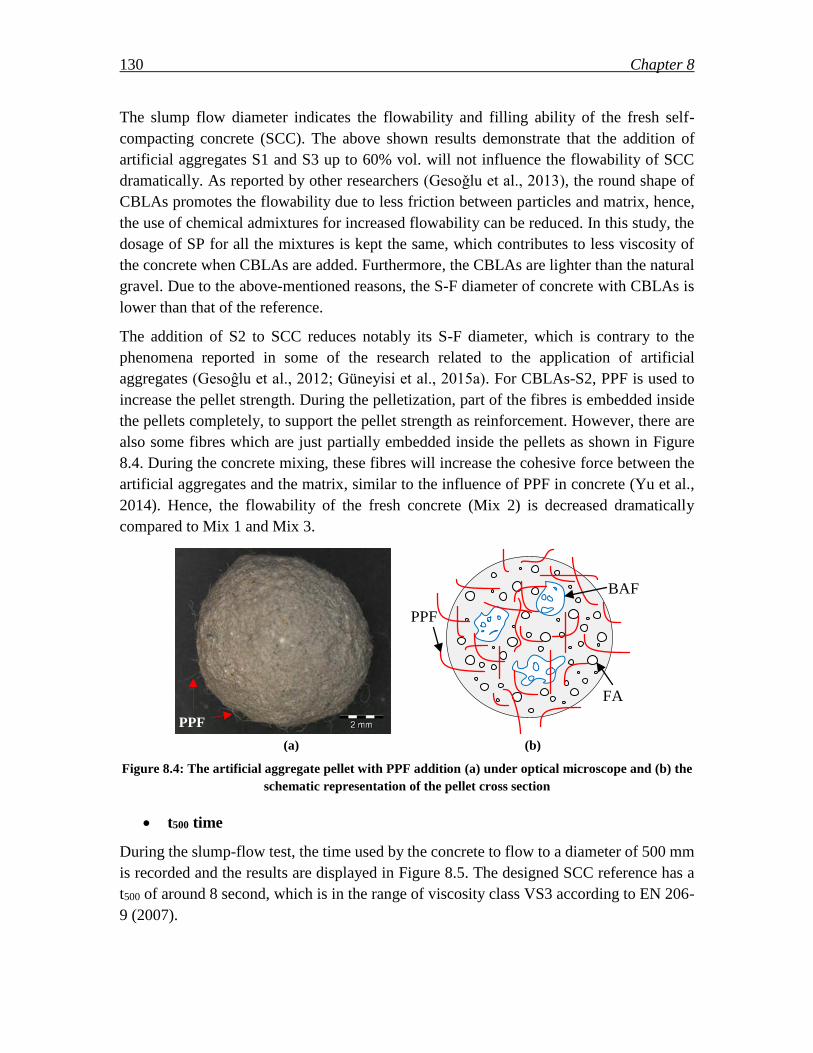
130 Chapter 8
The slump flow diameter indicates the flowability and filling ability of the fresh self-
compacting concrete (SCC). The above shown results demonstrate that the addition of
artificial aggregates S1 and S3 up to 60% vol. will not influence the flowability of SCC
dramatically. As reported by other researchers (Gesoǧlu et al., 2013), the round shape of
CBLAs promotes the flowability due to less friction between particles and matrix, hence,
the use of chemical admixtures for increased flowability can be reduced. In this study, the
dosage of SP for all the mixtures is kept the same, which contributes to less viscosity of
the concrete when CBLAs are added. Furthermore, the CBLAs are lighter than the natural
gravel. Due to the above-mentioned reasons, the S-F diameter of concrete with CBLAs is
lower than that of the reference.
The addition of S2 to SCC reduces notably its S-F diameter, which is contrary to the
phenomena reported in some of the research related to the application of artificial
aggregates (Gesoĝlu et al., 2012; Güneyisi et al., 2015a). For CBLAs-S2, PPF is used to
increase the pellet strength. During the pelletization, part of the fibres is embedded inside
the pellets completely, to support the pellet strength as reinforcement. However, there are
also some fibres which are just partially embedded inside the pellets as shown in Figure
8.4. During the concrete mixing, these fibres will increase the cohesive force between the
artificial aggregates and the matrix, similar to the influence of PPF in concrete (Yu et al.,
2014). Hence, the flowability of the fresh concrete (Mix 2) is decreased dramatically
compared to Mix 1 and Mix 3.
PPF
(a)
PPF
BAF
FA
(b)
Figure 8.4: The artificial aggregate pellet with PPF addition (a) under optical microscope and (b) the
schematic representation of the pellet cross section
• t500 time
During the slump-flow test, the time used by the concrete to flow to a diameter of 500 mm
is recorded and the results are displayed in Figure 8.5. The designed SCC reference has a
t500 of around 8 second, which is in the range of viscosity class VS3 according to EN 206-
9 (2007).

Chapter 8 131
For the concrete mixture with CBLAs-S1 (Mix 1), the t500 of Mix 1 with 30% vol. of S1 is
around 2% less than the reference, while Mix1 with 60% vol. of S1 has a t500 about 1%
longer than the reference. The t500 of Mix 2 with 30% vol. of S2 is around 8% longer than
the reference, while it is almost 13% higher than the reference when 60% vol. of S2 is used.
The t500 of Mix 1 and Mix 2 with 30% and 60% vol. of CBLAs indicates that their viscosity
class belongs to VS3 according to EN 206-9 (2007), the same as the reference. The t500 of
the concrete mixture with CBLAs-S3 (Mix 3) decreases significantly compared with the
reference: the reduction for Mix 3 with 30% and 60% vol. of S3 is around 48% and 54%,
respectively. The viscosity class of Mix 3 belongs to VS2 according to EN 206-9 (2007).
Ref
.
Mix1-
30%
Mix1-
60%
Mix2-
30%
Mix2-
60%
Mix3-
30%
Mix3-
60%
0
2
4
6
8
10
12
14
t 500 [s]
VS2
VS3
Figure 8.5: The t500 time of the fresh concrete mixtures
The t500 of concretes with S1 are not dramatically affected by the CBLAs’ replacement
level, while the t500 has a notable increase when more S2 aggregates are applied to replace
natural aggregates, which is due to the blocking effect of fibres on the surface of the pellets
as explained above. The reduction of t500 for concrete Mix 3 may be due to the following
reasons: the sample S3 has a coarser particle size than S1 and S2, and it can be seen from
Table 8.1 that all the coarser gravels are replaced by S3 in order to keep a similar total
particle size distribution of aggregates; in this way there is much less friction between the
mortar matrix and the coarse aggregates, which indirectly decreases the viscosity of the
matrix; thus less time is needed to reach the 500 mm spread.
• V-funnel test
Figure 8.6 shows the time used for the V-funnel test on the fresh mixed concrete samples.
It takes around 23 seconds for the reference concrete to flow out of the V-funnel, and this
demonstrates that the viscosity class of reference concrete is VF2 according to EN 206-9
(2007).
132 Chapter 8
Ref
.
Mix1-
30%
Mix1-
60%
Mix2-
30%
Mix2-
60%
Mix3-
30%
Mix3-
60%
0
10
20
30
40
50
60
70
VF2
V-f
unnel tim
e t
v [s]
VF1
Figure 8.6: The V-funnel time of the fresh concrete mixtures
The tv of Mix 1 with 30% vol. of S1 increases with around 7% compared with the reference
concrete, while it takes more than 2 times longer for Mix 1 with 60% vol. of S1 in the V-
funnel test. Mix 2 with 30% vol. of S2 has a longer tv than the reference by approximately
10%, and when 60% vol. of S2 is applied its tv is almost 3 times longer than the reference.
The use of 30% vol. of S3 in Mix 3 results in a 40% reduction of tv, while 60% vol. of S3
application in concrete causes a tv around 1.7 times longer. The tv for all the concrete
mixtures with CBLAs increases with the increasing amount of aggregate replacing level.
During the tests, it was observed that the artificial aggregates were pushed up and
accumulated on top of the tested samples due to their roundish particle shape and less
viscosity with the mortar matrix. They did not fell out of the V-funnel bottom until the
mortar matrix finishing flowing out, which is believed to result in the much longer tv during
test when 60% vol. of CBLAs are used. The small viscosity of concrete may lead to
segregation. Therefore, with the artificial aggregates replacement, the V-funnel test cannot
demonstrate the viscosity of the concrete mixture accurately in case the sample tends to
have segregation.
• Bulk density of fresh concrete mixtures
Figure 8.7 indicates the influence of artificial aggregates replacement on the fresh density
of concrete mixtures. It can be seen that the use of S1, S2 and S3 leads to the reduction of
the fresh density of the concrete, and the higher their replacement level, the lower the fresh
density of concrete. The fresh density of concrete with S3 is the lowest compared with
concrete with the same content of S1 or S2. The bulk density of sample S1 is higher than
the other two, and S3 has the lowest bulk density. The fresh density of the concrete is
related closely to the bulk density of the materials used for mixing; the results obtained in
this study are consistent with literature (Güneyisi et al., 2015a).

Chapter 8 133
Ref
.
Mix1-
30%
Mix1-
60%
Mix2-
30%
Mix2-
60%
Mix3-
30%
Mix3-
60%
2.0
2.1
2.2
2.3
2.4
2.5
2.6
Fre
sh d
ensity [g/c
m3]
Figure 8.7: The density of the fresh concrete mixtures
It can be shortly summarized that the use of cold bonded artificial aggregates (S1and S2)
does not influence the slump flow of the concrete, while the use of S2 decreases the slump
flow due to the blocking effect of PPF. The use of CBLAs (S1 and S3) can reduce the
viscosity of concrete due to their roundish particle shape, hence, the dosage to modify the
water requirement can be reduced. The use of CBLAs in concrete furthermore reduces the
bulk density of fresh concrete.
8.3.2 Properties of hardened concrete
Figure 8.8 displays the flexural strength of all the hardened concretes with and without
aggregates replacement.
Ref
.
Mix1-
30%
Mix1-
60%
Mix2-
30%
Mix2-
60%
Mix3-
30%
Mix3-
60%
0
2
4
6
8
10
Fle
xu
ral str
eng
th [
MP
a]
28 days
56 days
Figure 8.8: The flexural strength of concrete after 28 and 56 days
It can be observed that the use of CBLAs decreases the flexural strength of concrete, and
the increasing replacement level of aggregates contributes to a higher reduction of flexural
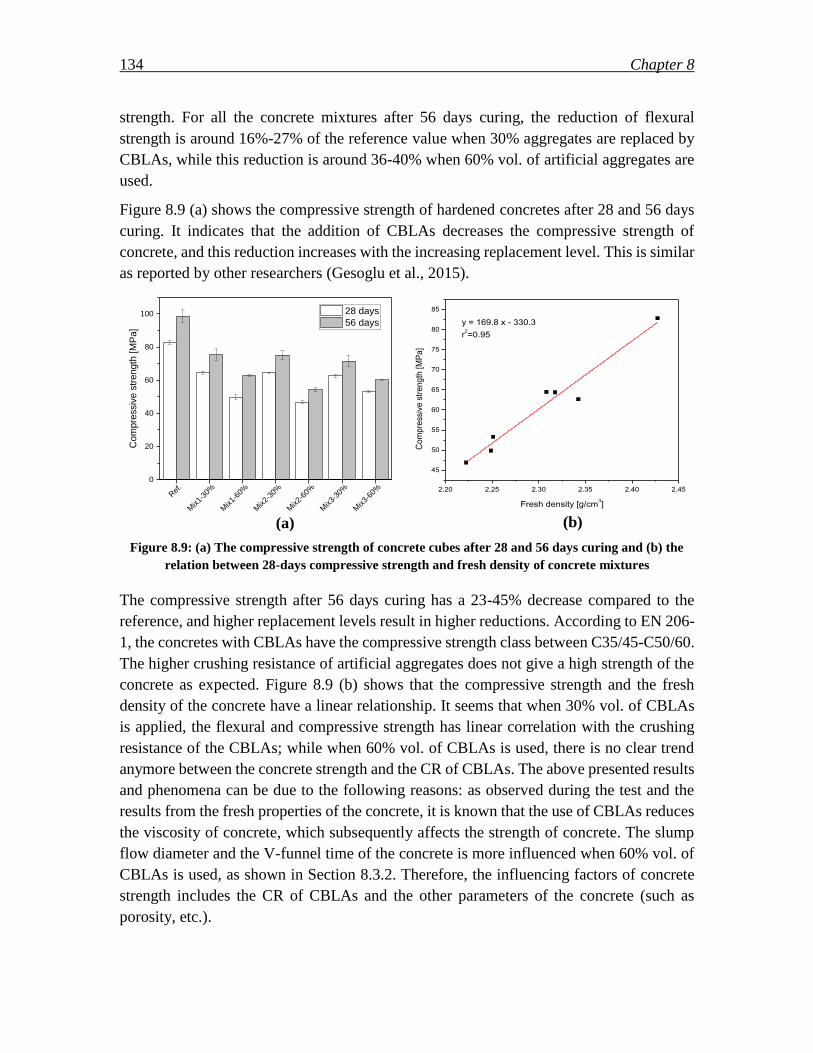
134 Chapter 8
strength. For all the concrete mixtures after 56 days curing, the reduction of flexural
strength is around 16%-27% of the reference value when 30% aggregates are replaced by
CBLAs, while this reduction is around 36-40% when 60% vol. of artificial aggregates are
used.
Figure 8.9 (a) shows the compressive strength of hardened concretes after 28 and 56 days
curing. It indicates that the addition of CBLAs decreases the compressive strength of
concrete, and this reduction increases with the increasing replacement level. This is similar
as reported by other researchers (Gesoglu et al., 2015).
Ref
.
Mix1-
30%
Mix1-
60%
Mix2-
30%
Mix2-
60%
Mix3-
30%
Mix3-
60%
0
20
40
60
80
100
Com
pre
ssiv
e s
trength
[M
Pa]
28 days
56 days
(a)
2.20 2.25 2.30 2.35 2.40 2.45
45
50
55
60
65
70
75
80
85
Co
mp
ress
ive
str
en
gth
[M
Pa
]
Fresh density [g/cm3]
y = 169.8 x - 330.3
r2=0.95
(b)
Figure 8.9: (a) The compressive strength of concrete cubes after 28 and 56 days curing and (b) the
relation between 28-days compressive strength and fresh density of concrete mixtures
The compressive strength after 56 days curing has a 23-45% decrease compared to the
reference, and higher replacement levels result in higher reductions. According to EN 206-
1, the concretes with CBLAs have the compressive strength class between C35/45-C50/60.
The higher crushing resistance of artificial aggregates does not give a high strength of the
concrete as expected. Figure 8.9 (b) shows that the compressive strength and the fresh
density of the concrete have a linear relationship. It seems that when 30% vol. of CBLAs
is applied, the flexural and compressive strength has linear correlation with the crushing
resistance of the CBLAs; while when 60% vol. of CBLAs is used, there is no clear trend
anymore between the concrete strength and the CR of CBLAs. The above presented results
and phenomena can be due to the following reasons: as observed during the test and the
results from the fresh properties of the concrete, it is known that the use of CBLAs reduces
the viscosity of concrete, which subsequently affects the strength of concrete. The slump
flow diameter and the V-funnel time of the concrete is more influenced when 60% vol. of
CBLAs is used, as shown in Section 8.3.2. Therefore, the influencing factors of concrete
strength includes the CR of CBLAs and the other parameters of the concrete (such as
porosity, etc.).

Chapter 8 135
8.3.3 Durability properties of hardened concrete
• Water penetration
Figure 8.10 indicates the water depth measured after the water penetration test on the
hardened concrete cubes.
The measured water depths of all the concrete mixtures with artificial aggregates are higher
than that of the reference, and a higher level of aggregates used causes a higher water
penetration depth. It is also noticed that the water depths of concrete with aggregates S3
are much higher than those of Mix 1 and Mix 2. It is reported that the use of artificial
aggregate causes the increase of gas permeability (Güneyisi et al., 2015a). Figure 8.11
shows the cross section of the concrete cube with 60% vol. of S2. The distribution of the
artificial aggregates is much denser near the edge of the concrete sample; a similar situation
was observed during the moulding of the concrete. Moreover, it can be seen that the
artificial aggregates are very porous, and some particles have voids inside. The water
penetration depth in concrete with CBLAs consists of the penetration in the cementitious
matrix in concrete, and the penetration in the CBLAs, while in normal concrete, it only
includes the former. Therefore, the water penetration depth with CBLAs is higher than that
of the reference concrete.
Ref
.
Mix1-
30%
Mix1-
60%
Mix2-
30%
Mix2-
60%
Mix3-
30%
Mix3-
60%
0
5
10
15
20
25
30
35
40
45
Depth
[m
m]
Figure 8.10: The water penetration depth in hardened concretes after 56 days’ curing
The water penetration depth reflects the porosity of concrete, and the results obtained
demonstrate that concrete Mix 3 is more porous than the other two with CBLAs. This is
due to the following reasons: (1) CBLA S3 is more porous than S1 and S2, which can be
seen from its higher water absorption and lower crushing resistance in Section 8.3.1; (2)
the use of S3 reduces the viscosity of concrete significantly, as shown by the t500 and tv,
which subsequently influences the concrete microstructure.

136 Chapter 8
Figure 8.11: The cross section of the concrete cube with 60% Vol. (S2) aggregate replacement
• Freeze-thaw test
Figure 8.12 shows the cumulative mass loss (CML) of concrete slab samples under freeze-
thaw cycles with the presence of a de-icing agent according to standard.
0 10 20 30 40 50 60
0
2
4
6
8
0 10 20 30 40 50 60
0
2
4
6
8
0 10 20 30 40 50 60
0
2
4
6
8
0 10 20 30 40 50 60
0
2
4
6
8
Cum
ula
tive m
ass loss [
kg/m
2]
Ref.
Cum
ula
tive m
ass loss [
kg/m
2]
Mix 1-30%
Mix 1-60%
(d)(c)
(b)CyclesCycles
Cum
ula
tive m
ass loss [
kg/m
2]
Cycles
Mix 2-30%
Mix 2-60%
(a)
Cum
ula
tive m
ass loss [
kg/m
2]
Cycles
Mix 3-30%
Mix 3-60%
Figure 8.12: The cumulative mass loss of hardened concrete samples after freeze thaw cycles
The CML of reference concrete increases slowly in the first 28 cycles, after which there is
a sharp increase. The CML of Mix 1 with 30% vol. of S1 is increasing linearly, and it is

Chapter 8 137
27% higher than that of the reference after 56 cycles. When 60% vol. of S1 is used, the
CML of concrete increases during the first 28 cycles and is higher than that of the reference;
after this, it is almost steady and it is nearly the same as the reference after 56 cycles. The
CML of Mix 2 shows a linearly increasing trend during the test cycles, which is higher than
the reference. Moreover, the increasing amount of artificial aggregates S2 does not lead to
a significant difference in the CML profile. The CML of Mix 3 with 30% vol. of S3 is
almost stable after 14 cycles, and it is 35% lower than of the reference after 56 cycles.
When 60% S3 is used, its CML is the highest among all the tested samples in this study,
and it is stable after 28 cycles. According to EN 206-1, the recommended mixing
proportions for concretes exposed to freeze-thaw attack at a defined level of XF1 are:
maximum water to cement ratio of 0.55, minimum strength class of C30/37, minimum and
cement content of 300 kg/m3; the designed self-compacting concrete with CBLAs has a
water to cement ratio of 0.45, cement content of 310 kg/m3 and strength class of C35/45-
C50/60. Hence, the self-compacting concretes complies the freeze-thaw exposure class of
XF1, which means moderate water saturation without de-icing agent, such as vertical
concrete surface exposed to rain and freezing.
For normal concrete, the CML under freeze-thaw condition is due to: (1) the loss of
cementitious matrix; (2) the loss of natural aggregates due to less binding by the matrix
(Medina et al., 2013b). For the concrete with artificial aggregates, which have a higher
porosity compared with natural aggregates, the CML of concrete also includes the mass
loss of artificial aggregates due to expansion of water inside the saturated aggregates. This
is one of the main reasons for the higher CML of Mix 1, Mix 2 and Mix 3 at early freeze-
thaw cycles (Medina et al., 2013b). The higher CML of concretes with higher artificial
aggregates confirms this finding. The addition of PPF in aggregates S2 results in a slightly
lower CML of concretes, which was also reported in (Roustaei et al., 2015) during soil
treatment. This may be attributed to the gradual mass loss of concrete during the freeze-
thaw test. For concrete with aggregates S3, the fast stability of CML could be resulting
from the addition of nano-silica. Researchers have figured out that the use of a certain
amount of silica in concrete could increase the freeze-thaw resistance of concrete (Alkaysi
et al., 2016). Hence, the addition of silica in aggregates production results in the higher
freezing-thaw resistance of concrete with S3. Another possible reason is the higher porosity
of Mix 3 with 30% vol. of S3, which is reflected in the water penetration depth. The
porosity of concrete leaves space for the expansion of water, which results in less damage
during freeze-thaw tests. However, Mix 3 with 60% vol. of S3 achieves the highest mass
loss; this may result from the lower bonding strength of the highly porous cementitious
matrix; hence, the detaching of the mortar matrix is much easier during the freeze-thaw
test.
The above results indicate the different influences of artificial aggregates on the freeze-
thaw resistance of concretes. It seems that, in the present study, the cumulative mass loss

138 Chapter 8
of concretes with artificial aggregates has two types of profiles: linearly increasing and a
two-stage type (firstly increase and then reaching a stable level). The correlation between
the artificial aggregates properties (porosity, strength, etc.) and the freeze-thaw resistance
profile needs to be investigated in a future study.
8.3.4 Leaching behaviour evaluation of hardened concrete
• Column leaching on the crushed hardened concrete
Figure 8.13 (a) shows the total amount of heavy metals (Sb, Cu and Mo) and salts (chloride
and sulphate) in the crushed concrete samples with and without artificial aggregates by
mass. The amount of these elements in concrete increases when the artificial aggregates
are used and a higher replacement level leads to a higher concentration of these elements
compared to the reference. Figure 8.13 (b) shows the leaching concentrations of the
investigated elements from the crushed concretes. It demonstrates that the leaching
concentrations of these elements are all under the limit value according to the Dutch
legislation and their leaching concentration increase with the increasing amount of artificial
aggregates (SQD, 2013). The leaching of Sb is lower than 0.004 mg/kg d.m. and below the
detectable level, therefore they are not shown in the graph. This leaching result means that
these concretes can be recycled and reused as secondary building materials as non-shaped
materials according to SQD (2013), in case recycling of these concretes is required when
they finish their service life.
Ref
.
Mix 1
-30%
Mix 1
-60%
Mix 2
-30%
Mix 2
-60%
Mix 3
-30%
Mix 3
-60%
0
18
100105
690
1380
10000
20000
Tota
l con
ten
t [m
g/k
g d
.m.]
Sb Cu Mo Chloride Sulphate
(a)
Ref
.
Mix 1
-30%
Mix 1
-60%
Mix 2
-30%
Mix 2
-60%
Mix 3
-30%
Mix 3
-60%
0.00
0.27
0.54
34
51
68
460
690
920
Leachin
g c
oncentr
ation [m
g/k
g d
.m.]
Cu Mo Chloride Sulphate
(b)
Figure 8.13: The total concentration (a) and (b) the leaching concentration of Sb, Cu, Mo, chloride
and sulphate in the concrete mixtures
The leaching of Sb for the CBLAs is around 0.1-0.15 mg/kg d.m., which is under the limit
value. The leaching concentration of Cu and Mo of the produced CBLAs is 1-1.4 and 1.5-
2.3 mg/kg d.m., and exceed the limit values, respectively. The leaching of chloride is about
2500-4600 mg/kg d.m. and exceeds the limit value, while the leaching of sulphate (120-

Chapter 8 139
499 mg/kg d.m.) is well under the limit value. Due to the fact that the total amount of the
investigated elements is influenced by the amount of artificial aggregates applied, the
leachability of the concretes is calculated based on their total amount and leached out
amount of elements following Eq. (3.8). Figure 8.14 shows the leachability of Cu, Mo,
chloride and sulphate of CBLAs and the concretes containing CBLAs. It shows that the
sample S3 has a lower leachability of Sb, Cu, Mo and sulphate, while it has higher chloride
leachability compared with sample S1. This demonstrates that the addition of nano-silica
could promote the immobilization of the above-mentioned elements. For chloride, it seems
that the use of PPF and nS have a negative influence on its immobilization, which may be
explained by the higher porosity of S2 and S3, giving the highly soluble chloride more
chance to be washed out.
The Cu leachability of concrete decreases with the increasing amount of artificial
aggregates for all the concrete mixtures and concrete Mix 3 has the lowest Cu leachability
compared with Mix 1 and Mix 2. The leachability of chloride has an increasing trend from
reference to Mix 3, and a higher aggregates replacement level results in a lower leachability
of chloride for each concrete mixture. The sulphate leachability of concrete with artificial
aggregates is lower than that of the reference, and higher levels of aggregates being
replaced contribute to a lower leachability of sulphates.
S1 S2 S3
0.0
0.1
0.2
0.70.80.91.01.11.2
2.3
2.4
2.5
2.6
2.7
Sb
Cu
Sulphate
Chloride
Mo
Lea
cha
bility [
%]
0
10
50
60
70
Lea
cha
bility [
%]
(a)
Ref.
Mix 1-30%
Mix 1-60%
Mix 2-30%
Mix 2-60%
Mix 3-30%
Mix 3-60%
0.0
0.2
0.6
0.8
1.0
1.2
1.4 Cu Sulphate
Mo Chloride
Leachability [%
]
0
10
30
40
50
60
70
Leachability [%
]
(b)
Figure 8.14: The leachability of Cu, Mo, chloride and sulphate from the concretes
It seems that the concretes containing aggregates S3 have a better immobilization of heavy
metals compared with the ones with S1 and S2. This may be due to the addition of nano-
silica in the aggregates production which is reported to decrease the pH of the cementitious
matrix in concrete (Byfors, 1987).
As shown in Figure 8.15, the pH of the tested leachate from the crushed concrete shows
that the addition of artificial aggregates (S1 and S2) results in a higher pH of the leachate,

140 Chapter 8
while the pH of leachate from Mix 3 (with S3) is lower than that of the other samples; this
also proves that the addition of nano-silica to the cementitious matrix leads to a lower pH.
Moreover, the leaching behaviour of heavy metals in MSWI residues is highly related to
the pH (Zhang et al., 2016). The use of nano-silica to produced CBLAs did not increase
the crushing resistance of the aggregates, but it improves the leaching of the aggregates
and the concrete with these aggregates.
The leaching of the concrete with the produced CBLAs in this study complies with the
Dutch legislation, which means the recycling of these concrete as secondary building
materials is environmental friendly after they finish their service life. Considering the
leaching of concrete with CBLAs, the amount of CBLAs can be increased when additives
are applied in concrete, such as fly ash, silica fume, ground granulate blast furnace slag,
etc. which are reported to reduce the pH of the concrete (Byfors, 1987). Moreover, these
additives can also be applied to be used as raw materials for CBLAs production when the
leaching of the aggregates is critical.
Ref
.
Mix 1
-30%
Mix 1
-60%
Mix 2
-30%
Mix 2
-60%
Mix 3
-30%
Mix 3
-60%
12.6
12.8
13.0
13.2
pH
pH
Figure 8.15: The pH of the crushed concrete samples with and without aggregate replacement
• Diffusion test on the hardened concrete
The diffusion tests on the hardened concrete containing 30% and 60% vol. CBLAs were
performed, and the cumulative concentration (ɛ64) of components leached out from the
concrete cube were shown in Table 8.3 and compared with the limit value for shaped
materials according to SQD (2013). It shows that the ɛ64 of all the components is far below
the limit value in SQD, which demonstrate the non-hazardous of these concrete to
environment.
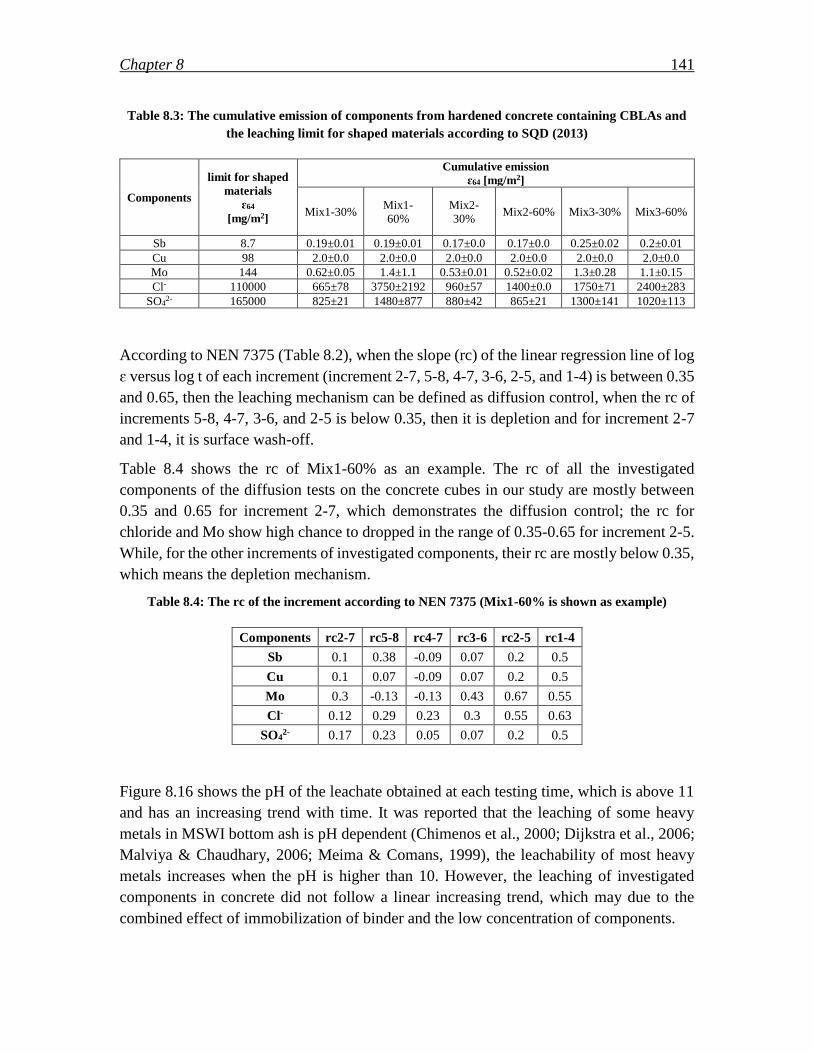
Chapter 8 141
Table 8.3: The cumulative emission of components from hardened concrete containing CBLAs and
the leaching limit for shaped materials according to SQD (2013)
Components
limit for shaped
materials
ɛ64
[mg/m2]
Cumulative emission
ɛ64 [mg/m2]
Mix1-30% Mix1-
60%
Mix2-
30% Mix2-60% Mix3-30% Mix3-60%
Sb 8.7 0.19±0.01 0.19±0.01 0.17±0.0 0.17±0.0 0.25±0.02 0.2±0.01
Cu 98 2.0±0.0 2.0±0.0 2.0±0.0 2.0±0.0 2.0±0.0 2.0±0.0
Mo 144 0.62±0.05 1.4±1.1 0.53±0.01 0.52±0.02 1.3±0.28 1.1±0.15
Cl- 110000 665±78 3750±2192 960±57 1400±0.0 1750±71 2400±283
SO42- 165000 825±21 1480±877 880±42 865±21 1300±141 1020±113
According to NEN 7375 (Table 8.2), when the slope (rc) of the linear regression line of log
ɛ versus log t of each increment (increment 2-7, 5-8, 4-7, 3-6, 2-5, and 1-4) is between 0.35
and 0.65, then the leaching mechanism can be defined as diffusion control, when the rc of
increments 5-8, 4-7, 3-6, and 2-5 is below 0.35, then it is depletion and for increment 2-7
and 1-4, it is surface wash-off.
Table 8.4 shows the rc of Mix1-60% as an example. The rc of all the investigated
components of the diffusion tests on the concrete cubes in our study are mostly between
0.35 and 0.65 for increment 2-7, which demonstrates the diffusion control; the rc for
chloride and Mo show high chance to dropped in the range of 0.35-0.65 for increment 2-5.
While, for the other increments of investigated components, their rc are mostly below 0.35,
which means the depletion mechanism.
Table 8.4: The rc of the increment according to NEN 7375 (Mix1-60% is shown as example)
Components rc2-7 rc5-8 rc4-7 rc3-6 rc2-5 rc1-4
Sb 0.1 0.38 -0.09 0.07 0.2 0.5
Cu 0.1 0.07 -0.09 0.07 0.2 0.5
Mo 0.3 -0.13 -0.13 0.43 0.67 0.55
Cl- 0.12 0.29 0.23 0.3 0.55 0.63
SO42- 0.17 0.23 0.05 0.07 0.2 0.5
Figure 8.16 shows the pH of the leachate obtained at each testing time, which is above 11
and has an increasing trend with time. It was reported that the leaching of some heavy
metals in MSWI bottom ash is pH dependent (Chimenos et al., 2000; Dijkstra et al., 2006;
Malviya & Chaudhary, 2006; Meima & Comans, 1999), the leachability of most heavy
metals increases when the pH is higher than 10. However, the leaching of investigated
components in concrete did not follow a linear increasing trend, which may due to the
combined effect of immobilization of binder and the low concentration of components.

142 Chapter 8
Hence, it can be concluded that there seems to be two stages regarding the leaching
mechanisms of the investigated components in the concrete containing CBLAs: at the first
stage, it is diffusion controlled; afterwards, it seems to be depletion controlled. However,
the leaching of investigated components complies with the leaching limit according to SQD
(2013). Therefore, the use of these concrete containing CBLAs produced from fine MSWI
bottom ash and other industrial solid wastes are environmental non-hazardous.
1 2 3 4 5 6 7 8
11.1
11.4
11.7
12.0
pH
Test
Mix1-30% Mix1-60%
Mix2-30% Mix2-60%
Mix3-30% Mix3-60%
Figure 8.16: The pH of the obtained leachate at each testing moment
The column and tank leaching tests on the crushed and cubic concretes containing the three
types of CBLAs produced from mixtures of industrial solid wastes show that these crushed
and cubic concretes can be classified as non-hazardous materials, even though the CBLAs
cannot comply with the leaching limit completely and then not allowed to be treated as
building materials directly. These concretes containing CBLAs will be the final products
which could be used in construction fields, in which around 13%-27% industrial solid
wastes due to the use of CBLAs are additionally recycled.
To summarize, the use of these concrete containing CBLAs produced from fine MSWI
bottom ash and other industrial solid wastes are environmental non-hazardous according
to legislation and they can be used directly. It can be concluded that, the pelletizing
technique is successfully applied to produce artificial aggregates from integrated industrial
solid wastes, and the concrete produced with these artificial aggregates is non-hazardous
to environment. In this way, the environmental burden related to disposal of industrial solid
wastes and consumption of natural resource in construction field could be reduced.
Moreover, the leaching of the crushed concretes complies the limits in legislation, which
means after service life, they can be recycled and then reused again. Thus, a closed
recycling circulation of several industrial solid wastes can be achieved.

Chapter 8 143
8.4 Conclusions
In this study, the mixed industrial solid wastes are integrally recycled and innovative
methods are used to improve the properties of the produced artificial cold bonded
lightweight aggregates (CBLA). Three types of aggregates are produced and used as
aggregates in self-compacting concretes, and their influence on the concrete properties is
studied. The following conclusions can be drawn:
(1) Three types of CBLAs are produced from combined industrial solid wastes,
including municipal solid waste incineration (MSWI) bottom ash fines (F-BAM, 0-
2 mm), paper sludge ash (PSA), coal fly ash (FA), and washing aggregates sludge
(WAS), with ordinary Portland cement as binder. The F-BAM, polypropylene fibre
(PPF) and nano-silica from olivine dissolution were used to improve the properties
of the artificial aggregates, such as crushing resistance, bulk density, etc.
(2) The produced CBLAs were used as natural aggregate in designed self-compacting
concrete. It was found that the addition of CBLAs produced without (S1) and with
(S3) nano-silica do not have a significant influence on the slump flow diameter,
while the one with aggregates produced with the addition of PPF (S2) had a smaller
slump flow diameter due to the blocking function of PPF. The t500 of concrete
mixtures with S1 and S2 is slightly influenced, while the addition of S3 results in
shorter t500 time. It is observed during the V-funnel test that the round shape of the
artificial aggregates had a ‘ball effect’, which makes the artificial aggregate
particles to be pushed on the top layer of the sample.
(3) The compressive and flexural strength of the concrete is decreased with the
increasing amount of artificial aggregates. The concrete strength has a positive
linear correlation with the crushing resistance of the CBLAs when 30% Vol.
aggregates is replaced, while this relationship is not found for the samples with 60%
vol. aggregates replacement, due to the significant influence of CBLAs on the fresh
properties of concrete (such as viscosity). The compressive strength of the concrete
containing CBLAs has linear relation with its fresh bulk density.
(4) The water penetration depth (WPD) of concretes shows that the use of CBLAs
increases the water WPD, and the concrete with aggregates S3 has a much higher
WPD, which is attributed to the influence of concrete viscosity. Less water or
chemical admixtures for modifying the water requirement is recommended when
CBLAs are used.
(5) There are two cumulative mass loss (CML) profiles of concrete with CBLAs during
freeze-thaw tests obtained in this study: one linearly increases with the test cycles,
another one is a two-stage profile (increasing stage and stable stage). The use of
aggregates S2 which contains PPF results in a linear increase of CML, and there is
a marginal difference when the amount of S2 is increased from 30% to 60% vol.

144 Chapter 8
The concrete with aggregates S3 has a two-stage CML profile, which is assumed to
be influenced by the nano-silica in aggregates and the porosity of the concrete.
(6) The leaching of the investigated metals (Cu, Sb, Mo) and anions (chloride and
sulphate) from the crushed concretes with CBLAs complies with the Dutch
environmental legislation, which demonstrates these concretes are environmental
friendly to be recycled and reused after they finish their service life. The diffusion
tests on the concretes containing CBLAs show that the leaching of components is
diffusion controlled at early age and then depletion controlled. In addition, the
cumulative leaching concentration after 64 days of these investigated components
complies with the leaching limit for shaped materials in SQD.

Chapter 9 145
Chapter 9
9 Leachability study of F-BA and cementitious immobilization
9.1 Introduction
In the previous Chapters (Chapters 4, 5, 6, 7 and 8), the leaching behaviour of the heavy
metals and salts from the fine MSWI bottom ashes (F-BA) in the column leaching tests or
shaking tests was shown. Meanwhile, the corresponding leaching behaviour during the
application of the F-BA in the presence of cementitious materials was also tested.
The aim of this chapter is to study the relationship between the leaching of F-BA and the
leaching of mortar or concrete with F-BA, to assess the immobilization capacity of
cementitious materials on the investigated components existing in F-BA during application
and to distinguish binding effect of cementitious materials on the contaminants from
dilution effect during the application of solid wastes. This, in turn, can be used as an
indicator for the cementitious stabilization of F-BA as a treatment, related to its application
purpose or potential.
In this chapter, the leaching behaviour of heavy metals and salts from F-BA or mortar and
concrete containing F-BA is summarized, and the leachability of these investigated
components in F-BA or in mortar and concrete is calculated and compared. The
cementitious immobilization as a treatment to reduce the leaching of components regarding
application method (as binder substitute, sand application, or as ingredient for aggregate
production) is evaluated. This is divided into several aspects, namely:
(1) The influence of thermal treatment on the leachability of heavy metals and salts,
and the leachability of these components in mortar when the treated F-BA is used
as binder substitutes;
(2) Leachability profile of investigated components during shaking test related to the
particle size of F-BA (milled and not milled), and in the mortar when used as sand
replacement with blended binders;
(3) Influence of binders on the leachability profile of the investigated components
existing in F-BA when being used in the form of artificial cold bonded lightweight
aggregates (CBLAs);
(4) Leachability study of concrete with by-products containing F-BA (CBLAs).
9.2 Leachability related to treatment and application purpose
9.2.1 Thermal treatment and binder substitute
The leaching data used in this analysis has been presented in detail in Chapter 4. The
leachability of Sb, Cu, Mo, chloride and sulphate in the treated MF-BAW is calculated
according to Eq. (3.8). The total contents of heavy metals and salts in mortars containing
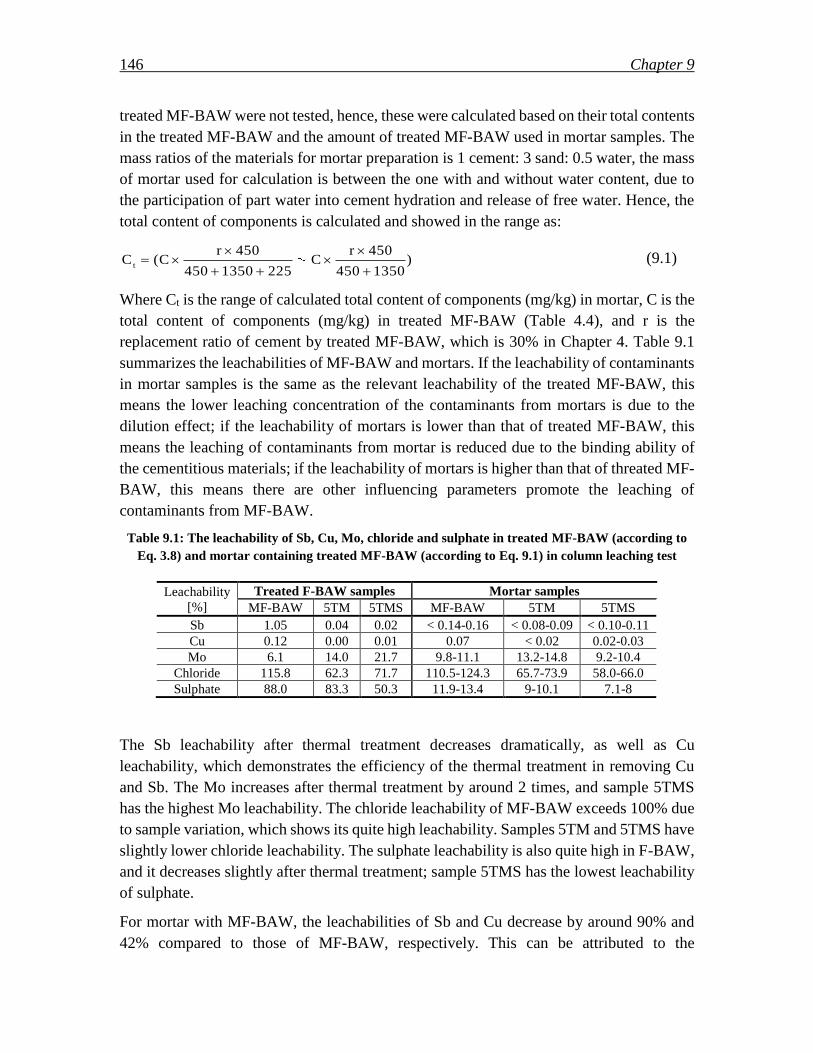
146 Chapter 9
treated MF-BAW were not tested, hence, these were calculated based on their total contents
in the treated MF-BAW and the amount of treated MF-BAW used in mortar samples. The
mass ratios of the materials for mortar preparation is 1 cement: 3 sand: 0.5 water, the mass
of mortar used for calculation is between the one with and without water content, due to
the participation of part water into cement hydration and release of free water. Hence, the
total content of components is calculated and showed in the range as:
t
r 450 r 450C (C C )
450 1350 225 450 1350
(9.1)
Where Ct is the range of calculated total content of components (mg/kg) in mortar, C is the
total content of components (mg/kg) in treated MF-BAW (Table 4.4), and r is the
replacement ratio of cement by treated MF-BAW, which is 30% in Chapter 4. Table 9.1
summarizes the leachabilities of MF-BAW and mortars. If the leachability of contaminants
in mortar samples is the same as the relevant leachability of the treated MF-BAW, this
means the lower leaching concentration of the contaminants from mortars is due to the
dilution effect; if the leachability of mortars is lower than that of treated MF-BAW, this
means the leaching of contaminants from mortar is reduced due to the binding ability of
the cementitious materials; if the leachability of mortars is higher than that of threated MF-
BAW, this means there are other influencing parameters promote the leaching of
contaminants from MF-BAW.
Table 9.1: The leachability of Sb, Cu, Mo, chloride and sulphate in treated MF-BAW (according to
Eq. 3.8) and mortar containing treated MF-BAW (according to Eq. 9.1) in column leaching test
Leachability
[%]
Treated F-BAW samples Mortar samples
MF-BAW 5TM 5TMS MF-BAW 5TM 5TMS
Sb 1.05 0.04 0.02 < 0.14-0.16 < 0.08-0.09 < 0.10-0.11
Cu 0.12 0.00 0.01 0.07 < 0.02 0.02-0.03
Mo 6.1 14.0 21.7 9.8-11.1 13.2-14.8 9.2-10.4
Chloride 115.8 62.3 71.7 110.5-124.3 65.7-73.9 58.0-66.0
Sulphate 88.0 83.3 50.3 11.9-13.4 9-10.1 7.1-8
The Sb leachability after thermal treatment decreases dramatically, as well as Cu
leachability, which demonstrates the efficiency of the thermal treatment in removing Cu
and Sb. The Mo increases after thermal treatment by around 2 times, and sample 5TMS
has the highest Mo leachability. The chloride leachability of MF-BAW exceeds 100% due
to sample variation, which shows its quite high leachability. Samples 5TM and 5TMS have
slightly lower chloride leachability. The sulphate leachability is also quite high in F-BAW,
and it decreases slightly after thermal treatment; sample 5TMS has the lowest leachability
of sulphate.
For mortar with MF-BAW, the leachabilities of Sb and Cu decrease by around 90% and
42% compared to those of MF-BAW, respectively. This can be attributed to the

Chapter 9 147
immobilization ability of cement in the mortar instead of dilution effect. The leachability
of Mo has a slight increase, and there is no significant change for chloride leachability; the
sulphate leachability is reduced by more than 80%. Similar changes of these leachabilities
are observed for mortar samples containing 5TM. For mortar containing 5TMS, compared
to 5TMS, the Mo and sulphate leachabilities decreased by more than 50% and 80%,
respectively. The leachability of chloride has a marginal reduction, by around 18%.
It seems that the leachability of components in mortar with 5TMS is reduced more than
that of samples with MF-BAW and 5TM. This is consistent with the hydration study in
Section 4.3.2, and demonstrates that a better binder hydration results in a higher
immobilization of investigated components, such as chloride and sulphate. However, there
is no clear trend for the immobilization of Sb, Cu and Mo. It seems that their
immobilization in mortar with treated MF-BAW used as binder substitute is related to their
total amount, their initial properties in the treated MF-BAW and the binder hydration.
9.2.2 Washing treatment and sand replacement with blended binders
• Washing treatment
The leachability of F-BAM is calculated using the Eq. (3.8), and the data used is the same
as shown in (Table 5.2). Table 9.2 shows that the leachability of F-BAM of chloride and
sulphate is more than 40% during the column leaching test, which is lower than that of F-
BAW in shaking test at L/S 10. The leachability of Mo, Sb and Cu of F-BAM is also lower
than that of F-BAW in shaking test by around 40-70%.
Table 9.2:The total amount of investigated salts and heavy metals in F-BAM and their leaching
concentrations during the column test and their leachability
Parameters Sb Cu Mo Chloride Sulphate
Total amount [mg/kg d.m.] 83 3100 19 2100 22900
Column leaching [mg/kg d.m.] 0.47 1.1 0.68 950 11000
Leachability [%] 0.57 0.035 3.6 45 48
As shown in Figure 9.1, the leachability of chloride of F-BAM in shaking is around 55%
when L/S is 10, and it is around 50% for MF-BAM, it seems independent to the L/S ratio.
The sulphate leachability is around 50% for F-BAM and MF-BAM, which is lightly higher
than the column leaching result, and increases with the L/S ratio. For both chloride and
sulphate, the leachability decreases slightly after milling of the sample. The Cu leachability
of F-BAM in the shaking test is much higher (by 1.4 times) than that of the column leaching
test at L/S 10, while it is lower after the milling of F-BAM. The Cu leachability of F-BAM
is strongly L/S ratio dependent, while for the MF-BAM, it is much less dependent. The Sb

148 Chapter 9
leachability for both F-BAM and MF-BAM is L/S ratio dependent and the milling
treatment increases Sb leachability.
2 4 6 8 10
10
20
30
40
50
60
Le
ach
ab
ility
[%
]
L/S
Chloride-F-BAM
Chloride-MF-BAM
Sulphate-F-BAM
Sulphate-MF-BAM
(a)
2 4 6 8 10
0.00
0.02
0.04
0.06
0.08
0.10
L/S
Cu-F-BAM
Cu-MF-BAM
Sb-F-BAM
Sb-MF-BAM
Lea
cha
bili
ty [
%]
0.0
0.2
0.4
0.6
0.8
1.0
Lea
cha
bili
ty [
%]
(b)
Figure 9.1: The leachability of chloride, sulphate, Cu and Sb of F-BAM and MF-BAM (Figure 5.2)
• Mortar with NaCl addition
Figure 9.2 shows the chloride leaching profile in the shaking test from mortars with blended
binders with the addition of NaCl and the immobilization efficiency of chloride in all
mortar samples; the leaching data used is the same as Figure 5.8.
The amount of chloride immobilized in the mortar samples after shaking test increases with
curing age, and samples M1' and M3' have a very similar amount of chloride immobilized.
Sample M2' has the highest immobilized chloride, which is around 50% after 28 days.
According to Luo et al. (2003), around 80% chloride can be bound by OPC mortar, and
91% bound by mortar with 70% GGBS to replace OPC when 1% wt. of binder NaCl was
added; the test on plain binder without sand showed similar chloride binding capability. It
was also reported that the chemical bound chloride in OPC paste and mortar after 28-days
curing was around 62% and 33% of the total bound chloride, respectively; for OPC and
GGBS blended paste and mortar, it was 78% and 51%, respectively. The reason for the
higher chloride binding in OPC and GGBS blended samples were mainly attributed to
chemical chloride binding capability, which was demonstrated by the higher amount of
Friedel’s salt found in blended samples. The chloride amount left in the washed sample is
lower compared with the reported results (Luo et al., 2003). Kayali et al. (2012) reported
that the magnesia in GGBS resulted in the formation of hydrotalcite, and this product
contributes significantly to the excellent chloride binding capacity of GGBS blended
binders. In this study, the MgO content in GGBS is around 9% (Table 5.1), and hydrotalcite
was detected in the hydrated samples with GGBS and OPC blended (Figure 5.5). Therefore,
the founding in this study is consistent with the other studies.

Chapter 9 149
1 10 100
0.0
0.2
0.4
0.6
0.8
1.0
1.2
M1'
M2'
M3'
Ch
lorid
e c
once
ntr
atio
n [
%w
t.m
ort
ar]
1 10 100
0
20
40
60
80
100
M1'
M2'
M3'
Imm
obili
za
tio
n [
%]
Curing days [day]
Figure 9.2: The chloride leached out from crushed mortars after various curing ages and the
immobilized chloride in mortar with NaCl (Figure 5.8)
The shaking test is performed on the crushed mortar; therefore, it could be possible that
some free chloride or physically bounded chloride is trapped in the mortar particles, which
does not come in contact with water. However, it is also possible that the free and physical
bound chloride is washed out, and maybe part of the chemical bound chloride. Additionally,
the total chloride in the mortar samples decreases with the curing ages, which may attribute
to the diffusion of chloride into the water during the early hydration age due to the water
curing. This is consistent with the high amount of chloride leached out after shaking during
the first day curing (Figure 5.8). The current results demonstrate that OPC blended with
GGBS can immobilize high amounts of chloride, and OPC blended with FA has similar
immobilization efficiency compared with plain OPC.
Hence, the obtained results in this chapter can be used to demonstrate the chloride binding
of mortar with blended binders in shaking tests only, and are suitable for estimating the
leaching of chloride under cementitious solidification/stability treatment of wastes.
• Mortar with F-BAM as 100% sand replacement
Figures 9.3 and 9.4 show the leachability of chloride, sulphate, Sb and Cu from blended
mortars during shaking test when F-BAM is used as sand replacement. The total amount is
calculated based on their content in F-BAM and the proportion of this F-BAM in mortar
(the leaching data used is the same as in Figures 5.11 and 5.12). It can be seen that the
chloride leachability has a similar trend as the mortar with addition of NaCl, and calculated
chloride leachability at early ages is over 100%, which is due to the fact that binders also
contain a certain amount of chloride, which is not included into the total chloride content.
After around 14 days curing, the chloride leachability is already stable, which is around
17%, 19% and 13% for mortar with OPC, OPC blended with GGBS and OPC blended with

150 Chapter 9
FA, respectively; after 91 days, the corresponding chloride leachability is around 11%, 13%
and 10%, respectively. Hence, about 80-90% of chloride is bound in the mortar after 14
days. For mortars with additions of NaCl, the chloride leachability is stable after 7 days
curing, and the bound chloride is around 12%, 30% and 18%, respectively.
1 10 100
0
50
100
150
200
250
Chlo
ride leachabili
ty [%
]
Curing time [days]
M1-F-BAM
M2-F-BAM
M3-F-BAM
F-BAM
(a)
1 10 100
0.2
0.4
0.6
0.8
54.0
54.2
Sulp
hate
leachabili
ty [%
]
Curing time [days]
M1-F-BAM
M2-F-BAM
M3-F-BAM
F-BAM
(b)
Figure 9.3:The leachability of (a) chloride and (b) sulphate from mortars with F-BAM their
leachability of F-BAM in shaking test with L/S 10 (Figure 5.11)
It seems that the chloride binding in mortar with F-BAM has a slower rate and is higher
than that of mortar with addition of NaCl, and the difference between blended binder is
marginal. Several reasons could be responsible for this phenomenon: (1) the total chloride
content is different with the same amount of binders. In mortars with NaCl, the chloride
content is around 5% by mass of binder; while in mortar with F-BAM, it is around 1%. As
reported in (Tang & Nilsson, 1993), higher free chloride content resulted in higher bound
chloride; (2) The calorimetry study shows that the addition of bottom ash or the waste water
from washing bottom ash has a retardation effect on the binder hydration, subsequently
influencing the binding capacity of chloride in mortar with F-BAM; (3) different from
NaCl addition, the chloride in mortar F-BAM will firstly dissolve or be released from F-
BAM into the pore solution and then bound by the binder hydrates; even though the
chloride in F-BAM is highly soluble, this will slow down the chloride binding. This delay
of available free chloride for participating in the binder hydration may influence the amount
of chemically bound chloride, which then reduces the chloride immobilization during the
shaking test.
Hence, it is of interest to investigate the chloride binding capacity of blended binders when
the chloride source is provided from the wastes during their application life.
The leachability of sulphate has a slight increasing trend with the curing age, and mortar
with blended OPC and GGBS has higher sulphate leachability. The sulphate leachability
is very low, around 99% of sulphate is stable, similar to the founding in (Lampris et al.,

Chapter 9 151
2011). Müllauer et al. (2015) reported that the concrete with GGBS as cement replacement
showed higher sulphate leaching than OPC or OPC blended with FA, which is due to the
dissolution of AFt and AFm.
1 10 100
0.2
0.3
0.4
0.64
0.66
0.68
0.70
Sb
le
ach
ab
ility
[%
]
Curing time [days]
M1-F-BAM
M2-F-BAM
M3-F-BAM
F-BAM
(a)
1 10 100
0.00
0.02
0.04
0.06
0.08
0.10
0.12
0.14
0.16
Cu
le
ach
ab
ility [
%]
Curing time [days]
M1-F-BAM
M2-F-BAM
M3-F-BAM
F-BAM
(b)
Figure 9.4: The leachability of (a) antimony and (b) copper from mortars with F-BAM and their
leachability of F-BAM in shaking test with L/S 10 (Figure 5.12)
The leachability of Sb from mortars containing F-BAM as sand is around 0.27%-0.4%,
which is lower than that of F-BAM (around 0.65% at L/S 10 in shaking test). The Cu
leachability is between 0.02%-0.11%, it increases with the curing time, and is higher than
that of F-BAM (around 0.09% at L/S 10 in shaking test) after around 21 days curing. The
relation of Sb and Cu leachability with the blended binders cannot be clearly distinguished.
The leachability of the mortars with blended binders containing F-BAM as sand
replacement shows that with the use of binders, the leachability of chloride, sulphate and
Sb decreases compared with that of F-BAM. This demonstrates the contribution of binders
on the immobilization of these components. However, the Cu leachability shows an
increasing trend along with mortar curing time, and tends to exceed the leachability of F-
BAM.
Regarding cementitious stabilization as a treatment on MSWI bottom ash during its
application, it was reported that this was a promising method to immobilize the heavy
metals and salts. However, during the application there are several factors that need to be
considered:
(1) The leaching behavior of the components in MSWI bottom ash various under
different conditions, such as pH, leaching methods, etc. (Arickx et al., 2008;
Chimenos et al., 2003; Cornelis et al., 2012; Lampris et al., 2011; Olsson et al.,
2009). The high pH in mortar due to binder hydration may result in the dissolution
of some stable metal-bearing phases, consequently, leading to the high leaching of
these metals. For instance, it was reported that Sb is low pH stable, hence, the

152 Chapter 9
mortar with high pH may result in higher Sb leaching during application (Cornelis
et al., 2012). The leaching of Cu in MSWI bottom ash was reported as pH depended
(Meima et al., 1999; Solpuker et al., 2014), also as shown in this study. Hence,
when the pH of the mortar increases with curing age, the leaching of Cu also
increases.
(2) The hydration of the binders can immobilize the leached components chemically
and physically. For instance, it was reported the Cu may replace the Ca to form
CSH and then being immobilized (Hashem et al., 2011). However, it is also learned
in this study by calorimeter results that the waste materials can retard the binder
hydration due to the organic matters or heavy metals. This obstruction directly
reduces the immobilization capacity of the binders, which may partially explain
why there is no clear relation between the leachability of components and the
blended binders.
(3) In mortars with F-BAM, the immobilization and dissolution of components happen
simultaneously. The binder hydration immobilizes the leached components,
meanwhile, providing alkaline surroundings which leads to the dissolution of more
corresponding components. Once the dissolution speed and amount is higher that
the immobilization rate and capacity, the leaching of components increases with
curing age. Especially in the long term, the binder hydration gradually decreases
and is almost fully finished, while the dissolution of the components is continuing.
9.2.3 Aggregate production with blended binders/cementitious materials
Figure 9.5 shows the leachability of components from artificial lightweight aggregates
using F-BAM under column test, and compared with that of F-BAM.
It can be seen that the leachability of Sb and sulphate is lower than that of F-BAM, which
confirms that the cementitious stabilization benefits Sb and sulphate immobilization
effectively. Sb leachability shows an increasing trend with curing time, while Cu and Mo
has a slight decrease after longer curing, which is attributed to the stability of metal-bearing
phases with the pH increase. Compared to mortar containing F-BAM, the leachability
obtained during the column leaching on CBLAs is higher than that of mortar obtained from
the shaking test. Several reasons may contribute to this result: (1) as showed from column
and shaking leaching test on F-BAM, the leachability of components in shaking leaching
is higher than that from column leaching; (2) the CBLAs contains higher amount of F-
BAM while lower amount of binders compared with mortar, (5-10% of binders in CBLAs
while 33% of binders in mortars), higher binders result in high immobilized components.

Chapter 9 153
M1
5C 10C
15C 6C
No
PSA
No
WAS
0.5%
PPF
1.0%
PPF
2.5%
PPF
4.5%
PPF
0.4
nS
0.8
nS
0.1
0.2
0.3
0.4
0.5
0.6
Le
ach
ab
ility
[%
]
Sb-28d
Sb-91d
Sb-F-BAMDecrease
(a)
M1
5C 10C
15C 6C
No
PSA
No
WAS
0.5%
PPF
1.0%
PPF
2.5%
PPF
4.5%
PPF
0.4
nS
0.8
nS
0.02
0.03
0.04
0.05
0.06
0.07
0.08
0.09
0.10
0.11
0.12
0.13
0.14
0.15
Le
ach
ab
ility
[%
]
Cu-28d
Cu-91d
Cu-F-BAM
Increase
(b)
M1
5C 10C
15C 6C
No
PSA
No
WAS
0.5%
PPF
1.0%
PPF
2.5%
PPF
4.5%
PPF
0.4
nS
0.8
nS
5
10
15
20
25
30
35
Le
ach
ab
ility
[%
]
Mo-28d
Mo-91d
Mo-F-BAM
Increase
(c)
M1
5C 10C
15C 6C
No
PSA
No
WAS
0.5%
PPF
1.0%
PPF
2.5%
PPF
4.5%
PPF
0.4
nS
0.8
nS
40
45
50
55
60
65
70
75
80
85
90
95
100
Le
ach
ab
ility
[%
]
Chloride-28d
Chloride-91d
Choride-F-BAM
Increase
(d)
M1
5C 10C
15C 6C
No
PSA
No
WAS
0.5%
PPF
1.0%
PPF
2.5%
PPF
4.5%
PPF
0.4
nS
0.8
nS
0
10
50
Le
ach
ab
ility
[%
]
Sulphate-28d
Sulphate-91d
Sulpate-F-BAM
Decrease
(e)
Figure 9.5: The leachability of Sb, Cu, Mo, chloride and sulphate from F-BAM and CBLAs
containing F-BAM after 28 and 91-days curing, respectively (Figures 7.6-7.10)
9.2.4 Application in concrete in the form of CBLAs
Figure 9.6 depicts the leachability of components in CBLAs and that of concrete containing
CBLAs. It can be seen that the CBLAs produced with PPF and nano-silica have lower Sb,
Cu, Mo, and sulphate leachabilities, while higher chloride leachability. The concrete
containing 30% and 60% vol. of CBLAs has a decreased leachability of Sb, Mo, chloride

154 Chapter 9
and sulphate, while increased Cu leachability. In the concrete, the cement accounts for 18%
of the total solids and the binder amount including cement and FA accounts for 28% of the
total solids; 8% more cement is used in concrete compared to the amount used to produced
CBLAs. The trend of the leachability in concrete is very similar to that of the CBLAs,
which demonstrates that the properties of the CBLAs are corresponding to the leaching of
the concrete, when they are used in concrete.
Ref
.
Mix 1
-30%
Mix 1
-60%
Mix 2
-30%
Mix 2
-60%
Mix 3
-30%
Mix 3
-60%
-0.1
0.0
0.1
0.2
0.3
0.4
0.5
Le
ach
ab
ility
[%
]
Sb-concrete
Sb-CBLAs
Decreased
(a)
Ref
.
Mix 1
-30%
Mix 1
-60%
Mix 2
-30%
Mix 2
-60%
Mix 3
-30%
Mix 3
-60%
0.00
0.02
0.04
0.06
0.08
0.10
0.12
0.14
Le
ach
ab
ility
[%
]
Cu-concrete
Cu-CBLAs
29% 18% 16% 16% 36% 32%
Incresed by:
(b)
Ref
.
Mix 1
-30%
Mix 1
-60%
Mix 2
-30%
Mix 2
-60%
Mix 3
-30%
Mix 3
-60%
0
2
4
6
8
10
12
14
16
18
Le
ach
ab
ility
[%
]
Mo-concrete
Mo-CBLAs
48% 49% 36% 43% 28% 21%
Decreased by:
(c)
Ref
.
Mix 1
-30%
Mix 1
-60%
Mix 2
-30%
Mix 2
-60%
Mix 3
-30%
Mix 3
-60%
35
40
45
50
55
60
65
70
Le
ach
ab
ility
[%
]
Chloride-concrete
Chloride-CBLAs
11% 13% 25% 26% 19% 21%
Decreased by:
(d)
Ref
.
Mix 1
-30%
Mix 1
-60%
Mix 2
-30%
Mix 2
-60%
Mix 3
-30%
Mix 3
-60%
0.5
1.0
1.5
2.0
2.5
3.0
Le
ach
ab
ility
[%
]
Sulphate-concrete
Sulphate-CBLAs
73% 77% 20% 24% 23% 14%
Decreased by:
(e)
Figure 9.6: The leachability of Cu, Mo, chloride and sulphate from the CBLAs and concretes
containing CBLAs after 28-days hardening (Figure 8.14)
The Sb leaching of concretes is below detection level, which demonstrates that the Sb
immobilization is enhanced when CBLAs are used in concrete. The Cu leachability of
concrete is higher than that of CBLAs and the increment for each concrete is shown in
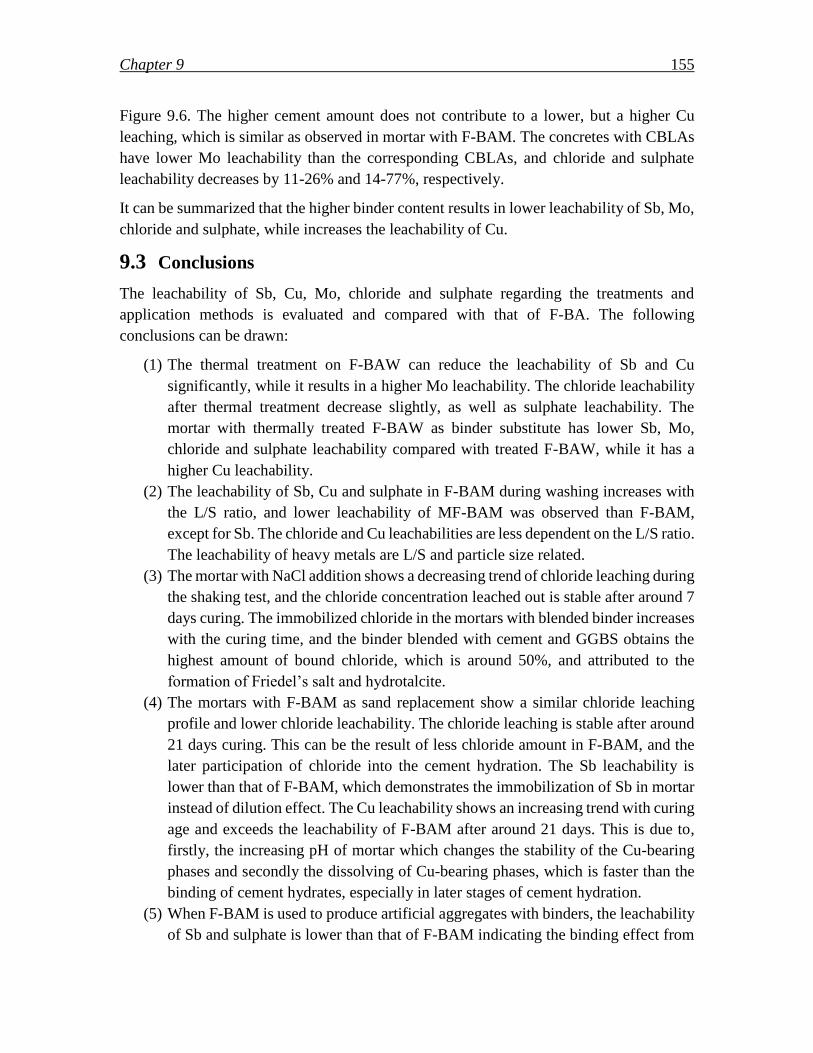
Chapter 9 155
Figure 9.6. The higher cement amount does not contribute to a lower, but a higher Cu
leaching, which is similar as observed in mortar with F-BAM. The concretes with CBLAs
have lower Mo leachability than the corresponding CBLAs, and chloride and sulphate
leachability decreases by 11-26% and 14-77%, respectively.
It can be summarized that the higher binder content results in lower leachability of Sb, Mo,
chloride and sulphate, while increases the leachability of Cu.
9.3 Conclusions
The leachability of Sb, Cu, Mo, chloride and sulphate regarding the treatments and
application methods is evaluated and compared with that of F-BA. The following
conclusions can be drawn:
(1) The thermal treatment on F-BAW can reduce the leachability of Sb and Cu
significantly, while it results in a higher Mo leachability. The chloride leachability
after thermal treatment decrease slightly, as well as sulphate leachability. The
mortar with thermally treated F-BAW as binder substitute has lower Sb, Mo,
chloride and sulphate leachability compared with treated F-BAW, while it has a
higher Cu leachability.
(2) The leachability of Sb, Cu and sulphate in F-BAM during washing increases with
the L/S ratio, and lower leachability of MF-BAM was observed than F-BAM,
except for Sb. The chloride and Cu leachabilities are less dependent on the L/S ratio.
The leachability of heavy metals are L/S and particle size related.
(3) The mortar with NaCl addition shows a decreasing trend of chloride leaching during
the shaking test, and the chloride concentration leached out is stable after around 7
days curing. The immobilized chloride in the mortars with blended binder increases
with the curing time, and the binder blended with cement and GGBS obtains the
highest amount of bound chloride, which is around 50%, and attributed to the
formation of Friedel’s salt and hydrotalcite.
(4) The mortars with F-BAM as sand replacement show a similar chloride leaching
profile and lower chloride leachability. The chloride leaching is stable after around
21 days curing. This can be the result of less chloride amount in F-BAM, and the
later participation of chloride into the cement hydration. The Sb leachability is
lower than that of F-BAM, which demonstrates the immobilization of Sb in mortar
instead of dilution effect. The Cu leachability shows an increasing trend with curing
age and exceeds the leachability of F-BAM after around 21 days. This is due to,
firstly, the increasing pH of mortar which changes the stability of the Cu-bearing
phases and secondly the dissolving of Cu-bearing phases, which is faster than the
binding of cement hydrates, especially in later stages of cement hydration.
(5) When F-BAM is used to produce artificial aggregates with binders, the leachability
of Sb and sulphate is lower than that of F-BAM indicating the binding effect from

156 Chapter 9
cementitious materials than the dilution effect, while the ones of Cu, Mo and
chloride are higher. The concretes containing artificial aggregates have lower Sb,
Mo, chloride and sulphate leachability compared to the relevant artificial
aggregates used which results from the immobilization of binders in concrete, while
they have higher Cu leachability than the artificial aggregates.
(6) Regarding the cementitious immobilization of contaminants in MSWI fine bottom
ash, the leachability of Sb, Mo and sulphate can be significantly decreased with 5-
10% of binder content, while Cu leachability will increase with binder content or
increasing pH. The chloride leachability can be slightly decreased by increasing
binder amount. During the application life of MSWI fine bottom ash with
cementitious binders, the hydration of binders with the ability to immobilize
contaminants and the dissolving of metal-bearing phases in alkaline environment
proceed simultaneously. Hence, the quantification of immobilization capacity of
binders in the application process of MSWI bottom ash should consider both
processes.

Chapter 10 157
Chapter 10
10 Conclusions and recommendations
10.1 Conclusions
The Waste-to-Energy (WtE) technique is a relatively efficient way to manage the municipal
solid waste, coupled with the generation of energy in the form of heat or electricity.
However, there are combustion by-products generated at different points of the WtE
procedure, which need to be further handled.
In the Netherlands, the WtE technique is well developed nowadays. The way to manage
the combustion by-products is dominantly landfilling and application as road base.
However, due to the potential risk of lack of land space and resource, as well as the
sustainable circular economy development, the Dutch government is encouraging the
alternative management of these solid by-products-maximizing their recycling and reuse
and avoiding landfill. Therefore, a systematic investigation on the MSWI residues is in
demand in the Netherlands.
As a combustion solid waste, the MSWI bottom ash is quite heterogenous and its properties
varies depending on its source, combustion procedure, etc. Hence, this study starts with the
evaluation of the stability of the MSWI bottom ashes from two WtE plants in the
Netherlands. The analysis is based on the historical experimental data on the MSWI bottom
ash properties over 7 years. Subsequently, the application potential of the MSWI bottom
ash is evaluated based on its characteristics by using it in mortar and concrete and then
comparing with normal ingredients of building materials.
The treatments on fine MSWI bottom ash are conducted with the purpose of improving its
properties for better application in the construction field.
Finally, the integral recycling of MSWI bottom ash are proposed, combining the treatment
and application purposes. Moreover, the final products containing MSWI bottom ash are
assessed regarding their mechanical and environmental properties.
The main conclusions are further summarized in detail and shown below.
10.1.1 Stability of MSWI bottom ash properties
The properties of the MSWI bottom ashes provided by Attero in the Netherlands from two
WtE plants (located in Moerdijk and Wijster) are evaluated by summarizing the historical
experimental data.
The MSWI bottom ashes have a particle size under 31.5 mm, and the particle size
distributions of these two bottom ashes are very similar to each other and relatively stable
over time. Their water content varies between 12-23%, depending on the quenching

158 Chapter 10
process and open-air storage. They have a rather high water absorption than recycled
aggregates, and bottom ash from one of the WtE plants has a higher water absorption than
the other. The losses on ignition (LOI) of the bottom ashes are stable over time as well, in
the range of 2-5% wt. The metal content in bottom ash is quite stable over time and the
bottom ash from Moerdijk plant contains higher ferrous metals and loose metallic iron than
that from Wijster.
The leaching characteristics of the MSWI bottom ashes show that the leaching behaviour
of the two bottom ashes are quite stable over time and the investigated bottom ashes can
be classified as IMC materials according to the Dutch legislation, which means they can
be used when an isolation layer and monitoring of the leaching behaviour during their
service life will be performed. To be used as non-shaped materials (such as aggregates,
etc.), the main leaching issue is the exceeding leaching concentration of antimony (Sb),
copper (Cu), chloride and sulphate for both bottom ashes, even though they are produced
in different plants and procedures.
10.1.2 Application potential of F-BA
The application potential of fine MSWI bottom ash fraction (F-BA, 0-2 mm) which
contains higher amounts of contaminants and is more difficult to be cleaned or recycled
using general industrial methodology and techniques, is investigated experimentally in this
study.
The dominant chemical components in the whole bottom ash and their fractions are SiO2,
CaO, Al2O3, Fe2O3, etc. and the main crystalline phases are SiO2, CaCO3, Fe2O3, etc.
Moreover, the finer bottom ash fraction has a higher amount of CaO and a lower content
of SiO2 than the coarser fractions. The fine MSWI bottom ash fraction (0-2 mm) has a
similar particle size distribution as standard sand.
The chemical components of F-BA suggest the possibility for its re-use as raw material for
cement clinker production. Three parameters used to evaluate the properties for clinker
production, namely hydraulic ratio, silica ratio, alumina ratio and lime saturation factor are
calculated based on the oxide compositions of F-BAs. The results show that the F-BAs are
not preferable to be used for clinker production, but can be applied as correction materials
in the raw mix design for clinker.
The use of F-BA in mortar as sand replacement results in the decrease of the flexural and
compressive strengths, and the more F-BA is added in mortar, the lower the strengths will
be. This can be due to the inclusion of metallic aluminum, which reacts with the alkalis
provided by the binder hydration and then generates hydrogen.
The milled F-BAMs have a retarding influence on the cement hydration, and a much lower
hydraulic reactivity. The sulphate content in the milled F-BAs may participate in the binder

Chapter 10 159
hydration and leads to more ettringite generation. Hence, improvement of milled F-BAM
properties is necessary to increase its contribution to the binder hydration.
10.1.3 Treatments on F-BA
Based on the characterization of MSWI bottom ash and the investigation of its application
potential as F-BA, it is noticed that treatments to improve the reactivity and leaching
properties of bottom ash are necessary.
In this study, a thermal treatment at different temperatures is applied on F-BAW or milled
F-BAW (MF-BAW), accompanied by the reduction of particle size. The MF-BAW treated
under 550 ˚C can decomposed the organic matter, subsequently reducing the retarding
effect on binder hydration when the treated F-BAW is milled and then used as cement
replacement. The comparison of thermal treatment before and after milling of F-BAW
shows that the thermal treatment on the initial F-BAW is more effective than on the milled
F-BAW. The thermally treated MF-BAW contributes to extra formation of AFt or AFm
due to the participation of sulphate content in MF-BAW into cement hydration. The slow
speed milling on the thermally treated F-BAW combined with sieving can separate the dust
agglomerated on the surface of F-BAW particles. This dust is found to contain a relatively
higher amount of heavy metals and salts than the cleaned particles. Moreover, after sieving,
the fine dust contains a lower amount of metallic aluminium than the coarse cleaned
particles. The dust removed from the thermally treated MF-BAW can be utilized as binder
substitute in mortar and contributes to 15% of the compressive strength.
The thermal treatment reduces the leaching of Sb and Cu of MF-BAW, due to the
decomposition of organic matter, while the chloride leaching is not significantly influenced.
The leaching of the crushed mortars containing MF-BAW with and without thermal
treatment can well comply with the limit value according to the Dutch legislation - Soil
Quality Decree (SQD).
Washing treatment and size reduction of the F-BAM are also studied. The size reduction
can reduce the leaching of most metals during the washing test with various liquid to solid
(L/S) ratios, except Sb. For most investigated elements, the increase of L/S ratio results in
an increasing leaching concentration, while the chloride leaching is not influenced due to
the high solubility of chloride.
To investigate the immobilization capacity of chloride and heavy metals, blended binders
are used. The study on the hydration of the blended binders with NaCl through isothermal
calorimetric experiments shows that the hydration of binders is accelerated, especially for
binders blended by Ordinary Portland cement and 40% ground granulated blast furnace
slag (GGBS). The generation of Friedel’s salts and hydrotalcite is detected in the hydrated
samples with NaCl.

160 Chapter 10
10.1.4 Integral recycling of F-BA
The fine MSWI bottom ash is integrally recycled as a raw material together with the other
industrial solid wastes to produce artificial aggregates applying the cold bonded pelletizing
technique. This is a way to combine the treatment and application of the F-BAM instead
of only focusing on the treatment of the F-BAM without considering its final application
purpose.
The compatibility of the chosen industrial solid wastes and F-BAM in pelletization is
experimentally studied, and a type of lightweight aggregates is obtained with a bulk density
of around 980 g/cm3, and a crushing resistance of around 7.5 MPa, which has comparable
properties to artificial aggregates produced using similar methods.
To improve the properties of the artificial aggregates using F-BAM through pelletization,
several methods are applied, namely increasing the binder content, using the F-BAM
contribution and by reinforcement of polypropylene fibres (PPF).
The curing duration of the artificial aggregate did not influence its properties. It was found
that the strength of the aggregates is mainly developed at early age (it can reach 70-85% of
its 28-day strength). Increasing the binder content results in the increase of crushing
strength of the aggregates, and the PPF can behave as reinforcement to benefit the
aggregate strength. Meanwhile, the used of industrial wastes which have pozzolanic
properties can be beneficial for the properties of the aggregates.
The environmental impact of the artificial aggregates evaluated using the column leaching
tests shows that the Sb and sulphate leaching are well under the limit value of SQD, and
the Cu, Mo and chloride leaching can be reduced by modifying the content of F-BAM used.
The study of concrete with three types of artificial aggregates shows that the use of the
produced aggregates decreases the concrete strength due to their lower strength and the
density of concrete decreases with the addition of artificial aggregates, and the compressive
strength of the concrete has linear relation with its fresh density.
10.1.5 Contaminant leachability of F-BA regarding treatments and application
The leachability of Sb, Mo, Cu, chloride and sulphate, which are the contaminants in F-
BA in this study according to Dutch legislation, is evaluated regarding the treatments (such
as thermal and washing treatments) and the application methods (such as binder and sand
replacement, for artificial aggregate production and use of artificial aggregates in concrete).
The thermal treatment on F-BA results in significant decrease of Sb and Cu leachability,
while the Mo leachability is increased around 2 times. The application of treated F-BA in
mortars as binder replacement shows that the Sb and sulphate leachability is decreased by
more than 80%, and the Mo and chloride leachability is related to the binder hydration
significantly. After application of treated F-BA in mortar, the Sb, Cu and sulphate leaching
was reduced due to the binding effect of binders instead of dilution effect.
Chapter 10 161
Dynamic washing by shaking on F-BA and milled F-BA shows that the leachability of the
investigated components during column leaching is lower than shaking leaching. The
leachability of investigated contaminants, except chloride, is directly related to the L/S
ratio used during the shaking test. After milling, the MF-BA shows lower leachability than
that of F-BA, except for Sb.
The addition of NaCl in mortars with blended binders shows a decreasing amount of
chloride leaching, while the immobilized chloride in mortar increases with the curing age.
The mortars with blended cement and GGBS achieve the highest bound chloride, while the
mortars with cement and cement blended with FA have similar amounts of bound chloride.
The higher amount of bound chloride can be attributed to the formation of Friedel’s salt
and hydrotalcite.
The mortar with F-BA as sand replacement shows a lower leachability of chloride, sulphate
and Sb compared with F-BA indicating the immobilization effect of binders rather than
dilution effect. However, the Cu leachability increases with the curing time and then
exceeds that of F-BA after around 21 days curing.
The leachability of investigated components in artificial aggregates produced from F-BA
is higher than that of F-BA, except Sb and sulphate; while when the artificial aggregates
are used in concrete, the leachability of contaminants in concretes is lower than the artificial
aggregates, except for Cu. This demonstrates the excellent binding effect of cementitious
materials on Sb and sulphate, while for Cu, Mo and chloride, higher amount of binders
may be necessary. The diffusion test on concrete incorporating artificial aggregates shows
that the chloride leaching is diffusion controlled while the leaching of Cu, Sb, Mo and
sulphate are more depletion influenced. However, their leaching concentrations are all
under the limit value for shaped materials specified in the SQD.
To be summarized, the leachability of Sb, Mo, and sulphate can be reduced significantly
with the use of cementitious binders, while Cu shows an increasing leachability with the
use of binder. The immobilization of contaminants in F-BA during its application by
cementitious binder is accompanied by the dissolving of metal-bearing phases in the
alkaline environment provided by the binder hydration.
10.2 Recommendations for future research
This thesis addresses the systematic study on the municipal solid waste incineration (MSWI)
bottom ashes from two Dutch Waste-to-Energy (WtE) plants, including characterization,
treatments, integral recycling and application as building materials. The obtained results
can provide information and guidance for the management of MSWI residues, however,
further research is still in demand for the remaining issues, which are listed as follows:
(1) In this study, the thermal treatment combined with low speed milling can reduce
the negative influence of bottom ash on cement hydration and remove the metallic

162 Chapter 10
aluminium. The removal of metallic aluminium from fine bottom ash by changing
the shape of metals due to their good ductility is supposed to be realized by impact
milling methods. However, the efficiency of metal recycling on fine MSWI bottom
ash and the application of the treated fine bottom ash by impact milling need to be
further studied. Furthermore, to reduce the leaching of the fine MSWI bottom ash,
avoiding the fine dust layer accumulated on the surface of bottom ash particles can
be a promising way, and methods to realize it need to be further investigated, such
as dry cooling of fresh MSWI bottom ash.
(2) The leaching behaviour study on MSWI fine bottom ash related to the reduction of
particle size by milling shows the different leaching profiles before and after milling;
the relations between the particle size and the leaching parameters need to be
observed, and can be used as indicating information for the milled fine bottom ash
by impact milling methods as mentioned above. The immobilization of heavy
metals and salts in fine MSWI bottom ash by blended binders, before and after its
reduction of particle size, regarding different application methods also needs further
research to figure out the optimized immobilizing mixtures for the fine MSWI
bottom ash when it is used in powder or particle shape.
(3) The integral recycling of industrial solid wastes based on their inherent properties
and the final products can be extended to more formats, such as pavement blocks,
partition wall, isolation element, etc.
(4) The production of artificial lightweight aggregates using the cold bonded
pelletizing technique can be further improved, including the combination of other
new solid wastes, such as incinerated sewage sludge ash, etc., further improving
the artificial aggregate properties according to their application requirements.
Additionally, the comparison of artificial aggregates with commercial lightweight
aggregates produced mostly under high temperature available at the market should
be performed to assess their economic and environmental profit.
(5) The artificial aggregates produced in this study were applied in concrete as normal
aggregates replacement, it is recommended to apply CBLA in lightweight concretes.
Therefore, it is necessary to study the application behaviour of these artificial
aggregates in lightweight aggregate (LWA) concrete and evaluate their influence
on the properties of the LWA concrete. Meanwhile, the correlation between the
LWA concrete properties and the artificial aggregates characteristics should be
figured out to provide guidance for further application in practice.
(6) The leachability of contaminants in MSWI bottom ash during its application life
with the use of cementitious binders should be investigated regarding the dissolving
of metal-bearing phases. A study on the immobilization of contaminants can be
performed to evaluate the binder immobilization capacity during the application of
solid wastes.
Chapter 10 163
(7) In this study, treatments and applications of fine MSWI bottom ash are presented.
However, the possibility to realize them with acceptable profit in practice or
industrial scale need to be analysed. The life cycle analysis (LCA) is essential for
the evaluation of the systematic treatment and application of fine bottom ash based
on its final utilization purpose. Furthermore, the LCA can be used to optimize the
management of fine MSWI bottom ash, which can maximize its recycling.
(8) The study presented in this thesis is conducted on lab scale and the obtained results
are not transferred and checked in real scale application. Hence, large scale tests of
the treatments, production of lightweight aggregates, etc. can be executed, which
can be applied to further develop the sustainable management of MSWI bottom ash.


Bibliography 165
Bibliography
Abd Kadir, S.A.S., Yin, C.-Y., Rosli Sulaiman, M., Chen, X., & El-Harbawi, M. (2013).
Incineration of municipal solid waste in Malaysia: Salient issues, policies and
waste-to-energy initiatives. Renew. Sustain. Energy Rev. 24, 181–186.
Al-Rawas, A.A., Wahid Hago, A., Taha, R., & Al-Kharousi, K. (2005). Use of incinerator
ash as a replacement for cement and sand in cement mortars. Build. Environ. 40,
1261–1266.
Alam, Q., Florea, M.V.A., Schollbach, K., & Brouwers, H.J.H. (2017). A two-stage
treatment for Municipal Solid Waste Incineration ( MSWI ) bottom ash to remove
agglomerated fine particles and leachable contaminants. Waste Manag. 67, 181-
192.
Alkaysi, M., El-Tawil, S., Liu, Z., & Hansen, W. (2016). Effects of silica powder and
cement type on durability of ultra high performance concrete (UHPC). Cem. Concr.
Compos. 66, 47–56.
Allegrini, E., Maresca, A., Olsson, M.E., Holtze, M.S., Boldrin, A., & Astrup, T.F. (2014).
Quantification of the resource recovery potential of municipal solid waste
incineration bottom ashes. Waste Manag. 34, 1627–1636.
Alonso, M.C., Luco, L.F., García, J.L., Hidalgo, A., & Huertas, F. (2007). Low-pH
Cementitious Materials Design and Characterisation. 12th Int. Congr. Chem. Cem.
Canada.
Amutha Rani, D., Boccaccini, A.R., Deegan, D., & Cheeseman, C.R. (2008). Air pollution
control residues from waste incineration: Current UK situation and assessment of
alternative technologies. Waste Manag. 28, 2279–2292.
Anastasiou, E., Georgiadis Filikas, K., & Stefanidou, M. (2014). Utilization of fine
recycled aggregates in concrete with fly ash and steel slag. Constr. Build. Mater.
50, 154–161.
Antoni, M., Rossen, J., Martirena, F., & Scrivener, K. (2012). Cement substitution by a
combination of metakaolin and limestone. Cem. Concr. Res. 42, 1579–1589.
Arickx, S., Van Gerven, T., & Vandecasteele, C. (2006). Accelerated carbonation for
treatment of MSWI bottom ash. J. Hazard. Mater. 137, 235–243.
Arickx, S., Van Gerven, T., Knaepkens, T., Hindrix, K., Evens, R., & Vandecasteele, C.
(2007). Influence of treatment techniques on Cu leaching and different organic
fractions in MSWI bottom ash leachate. Waste Manag. 27, 1422–1427.
Arickx, S., Van Gerven, T., Boydens, E., L’hoëst, P., Blanpain, B., & Vandecasteele, C.
(2008). Speciation of Cu in MSWI bottom ash and its relation to Cu leaching. Appl.
Geochemistry 23, 3642–3650.
Arickx, S., De Borger, V., Van Gerven, T., & Vandecasteele, C. (2010). Effect of
carbonation on the leaching of organic carbon and of copper from MSWI bottom
ash. Waste Manag. 30, 1296–1302.

166 Bibliography
Attero, b.v., (2015). Private communication from Attero b.v.
Baciocchi, R., Costa, G., Lategano, E., Marini, C., Polettini, A., Pomi, R., Postorino, P., &
Rocca, S. (2010). Accelerated carbonation of different size fractions of bottom ash
from RDF incineration. Waste Manag. 30, 1310–1317.
Batchelor, B. (2006). Overview of waste stabilization with cement. Waste Manag. 26, 689–
698.
Baur, I., Keller, P., Mavrocordatos, D., Wehrli, B., & Johnson, C.A. (2004). Dissolution-
precipitation behaviour of ettringite, monosulfate, and calcium silicate hydrate.
Cem. Concr. Res. 34, 341–348.
Baykal, G., & Döven, A.G (2000). Utilization of fly ash by pelletization process ; theory,
application areas and research results. Resour. Conserv. Recycl. 30, 59–77.
Bayuseno, A.P., & Schmahl, W.W. (2010). Understanding the chemical and mineralogical
properties of the inorganic portion of MSWI bottom ash. Waste Manag. 30, 1509–
1520.
Bentz, D.P., Hansen, A.S., & Guynn, J.M. (2011). Optimization of cement and fly ash
particle sizes to produce sustainable concretes. Cem. Concr. Compos. 33, 824–831.
Bernhardt, M., Tellesbø, H., Justnes, H., & Wiik, K. (2013). Mechanical properties of
lightweight aggregates. J. Eur. Ceram. Soc. 33, 2731–2743.
Bernhardt, M., Tellesbø, H., Justnes, H., & Wiik, K. (2014). Fibre reinforced lightweight
aggregates. J. Eur. Ceram. Soc. 34, 1341–1351.
Berryman, C., Zhu, J., Jensen, W., & Tadros, M. (2005). High-percentage replacement of
cement with fly ash for reinforced concrete pipe. Cem. Concr. Res. 35, 1088–1091.
Biganzoli, L., & Grosso, M. (2013). Alumninium recovery from waste incineration bottom
ash and its oxidation level. Waste Manag. Res. 31, 954-959.
Biganzoli, L., Gorla, L., Nessi, S., & Grosso, M. (2012). Volatilisation and oxidation of
aluminium scraps fed into incineration furnaces. Waste Manag. 32, 2266–2272.
Biganzoli, L., Ilyas, A., Praagh, M.V., Persson, K.M., & Grosso, M. (2013). Aluminium
recovery vs. hydrogen production as resource recovery options for fine MSWI
bottom ash fraction. Waste Manag. 33, 1174–1181.
Biganzoli, L., Grosso, M., & Forte, F. (2014). Aluminium Mass Balance in Waste
Incineration and Recovery Potential From the Bottom Ash: A Case Study. Waste
and Biomass Valor. 5, 139-145.
Bin Mohd Sani, M.S.H., Bt Muftah, F., & Ab Rahman, M. (2011). Properties of Waste
Paper Sludge Ash (WPSA) as cement replacement in mortar to support green
technology material. 3rd ISESEE -Int. Symp. Exhib. Sustain. Energy Environ., 94-
99.
Bonakdar, A., Babbitt, F., & Mobasher, B. (2013). Physical and mechanical
characterization of Fiber-Reinforced Aerated Concrete (FRAC). Cem. Concr.
Compos. 38, 82–91.
Bibliography 167
Born, J.G.P., & Veelenturf, R.A.L. (1997). MSWI residues in the Netherlands putting
policy into practice. Studies in Environment Science 71, 841-850.
Bosmans, A., Vanderreydt, I., Geysen, D., & Helsen, L. (2013). The crucial role of Waste-
to-Energy technologies in enhanced landfill mining: a technology review. J. Clean.
Prod. 55, 10–23.
Brunner, P.H., & Rechberger, H. (2015). Waste to energy - key element for sustainable
waste management. Waste Manag. 37, 3–12.
Bui, L.A., Hwang, C., Chen, C., Lin, K., & Hsieh, M. (2012). Manufacture and
performance of cold bonded lightweight aggregate using alkaline activators for
high performance concrete. Constr. Build. Mater. 35, 1056–1062.
Bullard, J.W., Jennings, H.M., Livingston, R.A., Nonat, A., Scherer, G.W., Schweitzer,
J.S., Scrivener, K.L., & Thomas, J.J. (2011). Mechanisms of cement hydration.
Cem. Concr. Res. 41, 1208–1223.
Byfors, K. (1987). Influence of silica fume and flyash on chloride diffusion and pH values
in cement paste. Cem. Concr. Res. 17, 115–130.
Calder, G.V., & Stark, T.D. (2010). Aluminum Reactions and Problems in Municipal Solid
Waste Landfills. Practice Periodical of Harzardous, Toxic, and Ratioactive Waste
Manag. 14, 258-265.
Chen, C.H., & Chiou, I.J. (2007). Distribution of chloride ion in MSWI bottom ash and de-
chlorination performance. J. Hazard. Mater. 148, 346–352.
Chen, H., & Wang, Q. (2006). The behaviour of organic matter in the process of soft soil
stabilization using cement. Bull. Eng. Geol. Env. 65, 445–448.
Chen, M.Z., Lin, J.T., Wu, S.P., & Liu, C.H. (2011). Utilization of recycled brick powder
as alternative filler in asphalt mixture. Constr. Build. Mater. 25, 1532–1536.
Chen, Q.Y., Hills, C.D., Tyrer, M., Slipper, I., Shen, H.G., & Brough, A. (2007).
Characterisation of products of tricalcium silicate hydration in the presence of
heavy metals. J. Hazard. Mater. 147, 817–825.
Cheng, A. (2012). Effect of incinerator bottom ash properties on mechanical and pore size
of blended cement mortars. Mater. Des. 36, 859–864.
Chimenos, J.M., Segarra, M., Fernández, M.A., & Espiell, F. (1999). Characterization of
the bottom ash in municipal solid waste incinerator. J. Hazard. Mater. 64, 211–222.
Chimenos, J.M., Fernández, A.I., Nadal, R., & Espiell, F. (2000). Short-term natural
weathering of MSWI bottom ash. J. Hazard. Mater. 79, 287–299.
Chimenos, J.M., Fernández, A.I., Miralles, L., Segarra, M., & Espiell, F. (2003). Short-
term natural weathering of MSWI bottom ash as a function of particle size. Waste
Manag. 23, 887–895.
Cimpan, C., & Wenzel, H. (2013). Energy implications of mechanical and mechanical-
biological treatment compared to direct waste-to-energy. Waste Manag. 33, 1648–
1658.

168 Bibliography
Cioffi, R., Colangelo, F., Montagnaro, F., & Santoro, L. (2011). Manufacture of artificial
aggregate using MSWI bottom ash. Waste Manag. 31, 281–288.
Colangelo, F., Messina, F., & Cioffi, R. (2015). Recycling of MSWI fly ash by means of
cementitious double step cold bonding pelletization: Technological assessment for
the production of lightweight artificial aggregates. J. Hazard. Mater. 299, 181–191.
Cornelis, G., Van Gerven, T., & Vandecasteele, C. (2006). Antimony leaching from
uncarbonated and carbonated MSWI bottom ash. J. Hazard. Mater. 137, 1284–1292.
Cornelis, G., Van Gerven, T., & Vandecasteele, C. (2012). Antimony leaching from MSWI
bottom ash: modelling of the effect of pH and carbonation. Waste Manag. 32, 278–
286.
Cossu, R., Lai, T., & Pivnenko, K. (2012). Waste washing pre-treatment of municipal and
special waste. J. Hazard. Mater. 207–208, 65–72.
Crannell, B.S., Eighmy, T.T., Krzanowski, J.E., Eusden, J.D., Shaw, E.L., & Francis, C.A.
(2000). Heavy metal stabilization in municipal solid waste combustion bottom ash
using soluble phosphate. Waste Manag. 20, 135–148.
Dabo, D., Badreddine, R., De Windt, L., & Drouadaine, I. (2009). Ten-year chemical
evolution of leachate and municipal solid waste incineration bottom ash used in a
test road site. J. Hazard. Mater. 172, 904–913.
Del Valle-Zermeño, R., Formosa, J., Chimenos, J.M., Martínez, M., & Fernández, A.I.
(2013). Aggregate material formulated with MSWI bottom ash and APC fly ash for
use as secondary building material. Waste Manag. 33, 621–627.
De Vries, W., Rem, P., & Berkhout, P. (2009). ADR : A New Method For Dry
Classification. Preoceeding of the ISWA Internation Conference. 12, 103-113.
De Weerdt, K., Ben Haha, M., Le Saout, G., Kjellsen, K.O., Justnes, H., & Lothenbach, B.
(2011). Hydration mechanisms of ternary Portland cements containing limestone
powder and fly ash. Cem. Concr. Res. 41, 279–291.
Deschner, F., Lothenbach, B., Winnefeld, F., & Neubauer, J. (2013). Effect of temperature
on the hydration of Portland cement blended with siliceous fly ash. Cem. Concr.
Res. 52, 169–181.
Dijkstra, J.J., Van Der Sloot, H.A., & Comans, R.N.J. (2006). The leaching of major and
trace elements from MSWI bottom ash as a function of pH and time. Appl.
Geochemistry 21, 335–351.
Dutta, D.K., Bordoloi, D., Gupta, S., Borthakur, P.C., Srinivasan, T.M., & J.B. Patil (1992).
Investigation on cold bonded pelletization of iron ore fines using Indian slag-
cement. Int. J. Miner. Process. 34, 149–159.
Dutta, D.K., Bordoloi, D., & Borthakur, P.C. (1997). Investigation on reduction of cement
binder in cold bonded pelletization of iron ore fines. Int. J. Miner. Process. 49, 97–
105.
EBA (2017). European Biogas Association. http://european-biogas.eu/

Bibliography 169
Ecke, H., Sakanakura, H., Matsuto, T., Tanaka, N., & Lagerkvist, A. (2000). State-of-the-
art treatment processes for municipal solid waste incineration residues in Japan.
Waste Manag. Res. 18, 41–51.
EPA (2017). United States Environmental Protection Agency-Environmental Topics.
EEA (2013). European Environment Agency-Managing municipal solid waste - a review
of achievements in 32 European counties.
EN 196-1, (2005). Methods of testing cement - Part 1: Determination of strength.
EN 206-1, (2000). Concrete - Part 1: Specification, performance, production and
conformity.
EN 206-9, (2007). Concrete Part 9: Additional rules for self-compacting concrete (SCC).
EN 933-1, (1997). Tests for geometrical properties of aggregates - Part 1: Determination
of particle size distribution- Sieving method.
EN 1015-3, (2007). Methods of test for mortar for masonry - Part 3: Determination of
consistence of fresh mortar (by flow table).
EN 1097-3, (1998). Test for mechanical and physical properties of aggregates - Part 3:
Determination of loose bulk density and voids.
EN 1097-5, (1999). Tests for mechanical and physcial properties of aggregates - Part 5:
Determination of the water content by drying in a ventilated oven.
EN 1097-6, (2013). Tests for mechanical and physical properties of aggregates - Part 6:
Determination of particle density and water absorption.
EN 12390-4, (2000). Testing hardened concrete - Part 4: Compressive strength-
Specification for testing machines.
EN 12390-5, (2009). Testing hardened concrete - Part 5: Flexural strength of test specimens.
EN 12350-6, (2009). Testing fresh concrete - Part 6: Density.
EN 12350-8, (2010). Testing fresh concrete - Part 8: Self-compacting concrete-Slump-flow
test.
EN 12350-9, (2010). Testing fresh concrete - Part 9: Self-compacting concrete – V-funnel
test.
EN 12390-8, (2009). Testing hardened concrete - Part 8: Depth of penetration of water
under pressure.
EN 12620, (2002). Aggregates for concrete.
EN 13055-1, (2002). Lightweight aggregates - Part 1: Lightweight aggregates for concrete,
mortar and grout.
Eurostat, (2017). Statistical office of the European Union Situated in Luxembourg (statistic
on Municipal waste statistics in Europe checked in 2017)
Ferone, C., Colangelo, F., Messina, F., Iucolano, F., Liguori, B., & Cioffi, R. (2013). Coal
combustion wastes reuse in low energy artificial aggregates manufacturing.

170 Bibliography
Materials. 6, 5000–5015.
Ferrándiz-Mas, V., Bond, T., García-Alcocel, E., & Cheeseman, C.R. (2014). Lightweight
mortars containing expanded polystyrene and paper sludge ash. Constr. Build.
Mater. 61, 285–292.
Ferraris, M., Salvo, M., Ventrella, A., Buzzi, L., & Veglia, M. (2009). Use of vitrified
MSWI bottom ashes for concrete production. Waste Manag. 29, 1041–1047.
Filipponi, P., Polettini, A., Pomi, R., & Sirini, P. (2003). Physical and mechanical
properties of cement-based products containing incineration bottom ash. Waste
Manag. 23, 145–156.
Fléhoc, C., Girard, J.-P., Piantone, P., & Bodénan, F. (2006). Stable isotope evidence for
the atmospheric origin of CO2 involved in carbonation of MSWI bottom ash. Appl.
Geochemistry 21, 2037–2048.
Florea, M.V.A., Ning, Z., & Brouwers, H.J.H. (2014). Activation of liberated concrete
fines and their application in mortars. Constr. Build. Mater. 50, 1–12.
Forteza, R., Far, M., Seguí, C., & Cerdá, V. (2004). Characterization of bottom ash in
municipal solid waste incinerators for its use in road base. Waste Manag. 24, 899–
909.
Freyssinet, P., Piantone, P., Azaroual, M., Itard, Y., Clozel-Leloup, B., Guyonnet, D., &
Baubron, J.C. (2002). Chemical changes and leachate mass balance of municipal
solid waste bottom ash submitted to weathering. Waste Manag. 22, 159–172.
Gabrovšek, R., Vuk, T., & Kaučič, V. (2006). Evaluation of the hydration of Portland
cement containing various carbonates by means of thermal analysis. Acta Chim.
Slov. 53, 159–165.
Gao, X., Yu, Q.L., & Brouwers, H.J.H. (2015). Properties of alkali activated slag–fly ash
blends with limestone addition. Cem. Concr. Compos. 59, 119–128.
García, D., Vegas, I., & Cacho, I. (2014). Mechanical recycling of GFRP waste as short-
fiber reinforcements in microconcrete. Constr. Build. Mater. 64, 293–300.
Garcia-Lodeiro, I., Carcelen-Taboada, V., Fernández-Jiménez, A., & Palomo, A. (2016).
Manufacture of hybrid cements with fly ash and bottom ash from a municipal solid
waste incinerator. Constr. Build. Mater. 105, 218–226.
Geetha, S., & Ramamurthy, K. (2010a). Environmental friendly technology of cold-bonded
bottom ash aggregate manufacture through chemical activation. J. Clean. Prod. 18,
1563–1569.
Geetha, S., & Ramamurthy, K. (2010b). Reuse potential of low-calcium bottom ash as
aggregate through pelletization. Waste Manag. 30, 1528–1535.
Geetha, S., & Ramamurthy, K. (2013). Properties of geopolymerised low-calcium bottom
ash aggregate cured at ambient temperature. Cem. Concr. Compos. 43, 20–30.
Gesoglu, M., Güneyisi, E., Ozturan, T., Oz, H.O., & Asaad, D.S. (2015). Shear thickening
intensity of self-compacting concretes containing rounded lightweight aggregates.
Bibliography 171
Constr. Build. Mater. 79, 40–47.
Gesoğlu, M., Özturan, T., & Güneyisi, E. (2004). Shrinkage cracking of lightweight
concrete made with cold-bonded fly ash aggregates. Cem. Concr. Res. 34, 1121–
1130.
Gesoğlu, M., Özturan, T., & Güneyisi, E. (2006). Effects of cold-bonded fly ash aggregate
properties on the shrinkage cracking of lightweight concretes. Cem. Concr. Compos.
28, 598–605.
Gesoğlu, M., Özturan, T., & Güneyisi, E. (2007). Effects of fly ash properties on
characteristics of cold-bonded fly ash lightweight aggregates. Constr. Build. Mater.
21, 1869–1878.
Gesoğlu, M., Güneyisi, E., Mahmood, S.F., Öz, H.Ö., & Mermerdaş, K. (2012). Recycling
ground granulated blast furnace slag as cold bonded artificial aggregate partially
used in self-compacting concrete. J. Hazard. Mater. 235–236, 352–358.
Gesoğlu, M., Güneyisi, E., Alzeebaree, R., & Mermerdaş, K. (2013). Effect of silica fume
and steel fiber on the mechanical properties of the concretes produced with cold
bonded fly ash aggregates. Constr. Build. Mater. 40, 982–990.
Gesoğlu, M., Güneyisi, E., Özturan, T., Öz, H.Ö., & Asaad, D.S. (2014). Self-consolidating
characteristics of concrete composites including rounded fine and coarse fly ash
lightweight aggregates. Compos. Part B Eng. 60, 757–763.
Gesoĝlu, M., Güneyisi, E., Mahmood, S.F., öz, H. öznur, & Mermerdaş, K. (2012).
Recycling ground granulated blast furnace slag as cold bonded artificial aggregate
partially used in self-compacting concrete. J. Hazard. Mater. 235–236, 352–358.
Gesoǧlu, M., Güneyisi, E., Ali, B., & Mermerdaş, K. (2013). Strength and transport
properties of steam cured and water cured lightweight aggregate concretes. Constr.
Build. Mater. 49, 417–424.
Ginés, O., Chimenos, J.M., Vizcarro, A., Formosa, J., & Rosell, J.R. (2009). Combined use
of MSWI bottom ash and fly ash as aggregate in concrete formulation:
Environmental and mechanical considerations. J. Hazard. Mater. 169, 643–650.
Gineys, N., Aouad, G., & Damidot, D. (2010). Managing trace elements in Portland cement
– Part I: Interactions between cement paste and heavy metals added during mixing
as soluble salts. Cem. Concr. Compos. 32, 563–570.
Gomathi, P., & Sivakumar, A. (2015). Accelerated curing effects on the mechanical
performance of cold bonded and sintered fly ash aggregate concrete. Constr. Build.
Mater. 77, 276–287.
González-Corrochano, B., Alonso-Azcárate, J., & Rodas, M. (2009). Characterization of
lightweight aggregates manufactured from washing aggregate sludge and fly ash.
Resour. Conserv. Recycl. 53, 571–581.
GovHK (2015). The Government of the Hong Kong Special Administative Region-Waste
& Recycling - Municipal Solid Waste.
Greendeals GD 076, (2010). Sustainable useful application of WtE bottom ash, Dutch
172 Bibliography
ministry of Infrastructure and Environment.
Grosso, M., Biganzoli, L., & Rigamonti, L. (2011). A quantitative estimate of potential
aluminium recovery from incineration bottom ashes. Resour. Conserv. Recycl. 55,
1178–1184.
Guimaraes, A.L., Okuda, T., Nishijima, W., & Okada, M. (2005). Chemical extraction of
organic carbon to reduce the leaching potential risk from MSWI bottom ash. J.
Hazard. Mater. 125, 141–146.
Guimaraes, A.L., Okuda, T., Nishijima, W., & Okada, M. (2006). Organic carbon leaching
behavior from incinerator bottom ash. J. Hazard. Mater. 137, 1096–1101.
Gundupalli, S.P., Hait, S., & Thakur, A. (2017). A review on automated sorting of source-
separated municipal solid waste for recycling. Waste Manag. 60, 56–74.
Güneyisi, E., Gesoğlu, M., & İpek, S. (2013a). Effect of steel fiber addition and aspect ratio
on bond strength of cold-bonded fly ash lightweight aggregate concretes. Constr.
Build. Mater. 47, 358–365.
Güneyisi, E., Gesoğlu, M., Pürsünlü, Ö., & Mermerdaş, K. (2013b). Durability aspect of
concretes composed of cold bonded and sintered fly ash lightweight aggregates.
Compos. Part B Eng. 53, 258–266.
Güneyisi, E., Gesoğlu, M., Altan, İ., & Öz, H.Ö. (2015a). Utilization of cold bonded fly
ash lightweight fine aggregates as a partial substitution of natural fine aggregate in
self-compacting mortars. Constr. Build. Mater. 74, 9–16.
Güneyisi, E., Gesoğlu, M., & Booya, E. (2015b). Strength and permeability properties of
self-compacting concrete with cold bonded fly ash lightweight aggregate. Constr.
Build. Mater. 74, 17–24.
Harikrishnan, K.I., & Ramamurthy, K. (2006). Influence of pelletization process on the
properties of fly ash aggregates. Waste Manag. 26, 846–852.
Hashem, F.S., Amin, M.S., & Hekal, E.E. (2011). Stabilization of Cu (II) wastes by C3S
hydrated matrix. Constr. Build. Mater. 25, 3278–3282.
He, R., Wei, X.-M., Tian, B.-H., Su, Y., & Lu, Y.-L. (2015). Characterization of a joint
recirculation of concentrated leachate and leachate to landfills with a microaerobic
bioreactor for leachate treatment. Waste Manag. 46, 380–388.
Hendrik G. van Oss (2015). Cement - Mineral Commodity Summaries. U.S. Geol. Surv.
703, 648-7712.
Hjelmar, O., Holm, J., & Crillesen, K. (2007). Utilisation of MSWI bottom ash as sub-base
in road construction: first results from a large-scale test site. J. Hazard. Mater. 139,
471–480.
Holm, O., & Simon, F.G. (2016). Innovative treatment trains of bottom ash (BA) from
municipal solid waste incineration (MSWI) in Germany. Waste Manag. 59, 229–
236.
Hu, Y., Bakker, M.C.M., & De Heij, P.G. (2011). Recovery and distribution of incinerated

Bibliography 173
aluminum packaging waste. Waste Manag. 31, 2422–2430.
Hüsken, G. (2010). A multifunctional design approach for sustainable concrete: with
application to concrete mass products, PhD Thesis. Eindhoven University of
Technology, Eindhoven, The Netherlands.
Hyks, J., Nesterov, I., Mogensen, E., Jensen, P.A., & Astrup, T. (2011). Leaching from
waste incineration bottom ashes treated in a rotary kiln. Waste Manag. Res. 29,
995–1007.
Izquierdo, M., Querol, X., Josa, A., Vazquez, E., & López-Soler, A. (2008). Comparison
between laboratory and field leachability of MSWI bottom ash as a road material.
Sci. Total Environ. 389, 10–19.
Jamkar, S.S., & Rao, C.B.K. (2004). Index of Aggregate Particle Shape and Texture of
coarse aggregate as a parameter for concrete mix proportioning. Cem. Concr. Res.
34, 2021–2027.
Jansen, D., Goetz-Neunhoeffer, F., Lothenbach, B., & Neubauer, J. (2012). The early
hydration of Ordinary Portland Cement (OPC): An approach comparing measured
heat flow with calculated heat flow from QXRD. Cem. Concr. Res. 42, 134–138.
Juric, B., Hanzic, L., Ilić, R., & Samec, N. (2006). Utilization of municipal solid waste
bottom ash and recycled aggregate in concrete. Waste Manag. 26, 1436–1442.
Justnes, H. (1998). A review of chloride binding in cementitious systems. Nord. Concr.
Res. 21, 48-63
Karanjekar, R.V., Bhatt, A., Altouqui, S., Jangikhatoonabad, N., Durai, V., Sattler, M.L.,
Hossain, M.D.S., & Chen, V. (2015). Estimating methane emissions from landfills
based on rainfall, ambient temperature, and waste composition: The CLEEN model.
Waste Manag. 46, 389–398.
Kaya, M. (2016). Recovery of metals and nonmetals from electronic waste by physical and
chemical recycling processes. Waste Manag. 57, 64–90.
Kayali, O., Khan, M.S.H., & Sharfuddin Ahmed, M. (2012). The role of hydrotalcite in
chloride binding and corrosion protection in concretes with ground granulated blast
furnace slag. Cem. Concr. Compos. 34, 936–945.
Keulen, A., Van Zomeren, A., Harpe, P., Aarnink, W., Simons, H.A.E., & Brouwers, H.J.H.
(2015). High performance of treated and washed MSWI bottom ash granulates as
natural aggregate replacement within earth-moist concrete. Waste Manag. 49, 83–
95.
Kim, H.K., Ha, K.A., & Lee, H.K. (2016). Internal-curing efficiency of cold-bonded coal
bottom ash aggregate for high-strength mortar. Constr. Build. Mater. 126, 1–8.
Klein, R., Baumann, T., Kahapka, E., & Niessner, R. (2001). Temperature development in
a modern municipal solid waste incineration (MSWI) bottom ash landfill with
regard to sustainable waste management. J. Hazard. Mater. 83, 265–280.
Kou, S.C., & Poon, C.S. (2012). Enhancing the durability properties of concrete prepared
with coarse recycled aggregate. Constr. Build. Mater. 35, 69–76.
174 Bibliography
Kou, S.C., Poon, C.-S., & Etxeberria, M. (2011). Influence of recycled aggregates on long
term mechanical properties and pore size distribution of concrete. Cem. Concr.
Compos. 33, 286–291.
Kowalski, P.R., Kasina, M., & Michalik, M. (2016). Metallic Elements Fractionation in
Municipal Solid Waste Incineration Residues. Energy Procedia 97, 31–36.
Kuo, N.-W., Ma, H.-W., Yang, Y.-M., Hsiao, T.-Y., & Huang, C.-M. (2007). An
investigation on the potential of metal recovery from the municipal waste
incinerator in Taiwan. Waste Manag. 27, 1673–1679.
Kuo, W.-T., Liu, C.-C., & Su, D.-S. (2013). Use of washed municipal solid waste
incinerator bottom ash in pervious concrete. Cem. Concr. Compos. 37, 328–335.
Laforest, G., & Duchesne, J. (2005). Immobilization of chromium (VI) evaluated by
binding isotherms for ground granulated blast furnace slag and ordinary Portland
cement. Cem. Concr. Res. 35, 2322–2332.
Lam, C.H.K., Ip, A.W.M., Barford, J.P., & McKay, G. (2010). Use of incineration MSW
ash: A review. Sustainability 2, 1943–1968.
Lampris, C., Stegemann, J.A., Pellizon-Birelli, M., Fowler, G.D., & Cheeseman, C.R.
(2011). Metal leaching from monolithic stabilised/solidified air pollution control
residues. J. Hazard. Mater. 185, 1115–1123.
Lázaro García, A. (2014). Nano-silica production at low temperatures from the dissolution
of olivine, PhD Thesis. Eindhoven University of Technology, Eindhoven, the
Netherlands.
Leckner, B. (2015). Process aspects in combustion and gasification Waste-to-Energy (WtE)
units. Waste Manag. 37, 13-25
Lee, H.K., Kim, H.K., & Hwang, E.A (2010). Utilization of power plant bottom ash as
aggregates in fiber-reinforced cellular concrete. Waste Manag. 30, 274–284.
Lee, T.-C., Chang, C.-J., Rao, M.-K., & Su, X.-W. (2011). Modified MSWI ash-mix slag
for use in cement concrete. Constr. Build. Mater. 25, 1513–1520.
Li, M., Xiang, J., Hu, S., Sun, L.-S., Su, S., Li, P.-S., & Sun, X.-X. (2004). Characterization
of solid residues from municipal solid waste incinerator. Fuel 83, 1397–1405.
Li, X., Chen, Q., Zhou, Y., Tyrer, M., & Yu, Y. (2014). Stabilization of heavy metals in
MSWI fly ash using silica fume. Waste Manag. 34, 2494–2504.
Li, X.-G., Lv, Y., Ma, B.-G., Chen, Q.-B., Yin, X.-B., & Jian, S.-W. (2012). Utilization of
municipal solid waste incineration bottom ash in blended cement. J. Clean. Prod.
32, 96–100.
Li, X.D., Poon, C.S., Sun, H., Lo, I.M.C., & Kirk, D.W. (2001). Heavy metal speciation
and leaching behaviors in cement based solidified/stabilized waste materials. J.
Hazard. Mater. 82, 215–230.
Li, Y., Zhao, X., Li, Y., & Li, X. (2015). Waste incineration industry and development
policies in China. Waste Manag. 46, 234–241.
Bibliography 175
Lin, K.L., & Lin, D.F. (2006). Hydration characteristics of municipal solid waste
incinerator bottom ash slag as a pozzolanic material for use in cement. Cem. Concr.
Compos. 28, 817–823.
Lin, W.Y., Heng, K.S., Sun, X., & Wang, J.-Y. (2015). Influence of moisture content and
temperature on degree of carbonation and the effect on Cu and Cr leaching from
incineration bottom ash. Waste Manag. 43, 264–272.
Lin, Y.-C., Panchangam, S.C., Wu, C.-H., Hong, P.-K.A., & Lin, C.-F. (2011). Effects of
water washing on removing organic residues in bottom ashes of municipal solid
waste incinerators. Chemosphere 82, 502–506.
Liu, A., Ren, F., Lin, W.Y., & Wang, J.-Y. (2015). A review of municipal solid waste
environmental standards with a focus on incinerator residues. Int. J. Sustain. Built
Environ. 4, 165–188.
Liu, Y., Li, Y., Li, X., & Jiang, Y. (2008). Leaching behavior of heavy metals and PAHs
from MSWI bottom ash in a long-term static immersing experiment. Waste Manag.
28, 1126–1136.
Luo, R., Cai, Y., Wang, C., & Huang, X. (2003). Study of chloride binding and diffusion
in GGBS concrete. Cem. Concr. Res. 33, 1–7.
Malviya, R., & Chaudhary, R. (2006). Leaching behavior and immobilization of heavy
metals in solidified/stabilized products. J. Hazard. Mater. 137, 207–217.
Manikandan, R., & Ramamurthy, K. (2007). Influence of fineness of fly ash on the
aggregate pelletization process. Cem. Concr. Compos. 29, 456–464.
Manikandan, R., & Ramamurthy, K. (2008). Effect of curing method on characteristics of
cold bonded fly ash aggregates. Cem. Concr. Compos. 30, 848–853.
Matschei, T., Lothenbach, B., & Glasser, F.P. (2007). The AFm phase in Portland cement.
Cem. Concr. Res. 37, 118–130.
Medina, C., Banfill, P.F.G., Sánchez de Rojas, M.I., & Frías, M. (2013a). Rheological and
calorimetric behaviour of cements blended with containing ceramic sanitary ware
and construction/demolition waste. Constr. Build. Mater. 40, 822–831.
Medina, C., Sánchez de Rojas, M.I., & Frías, M. (2013b). Freeze-thaw durability of
recycled concrete containing ceramic aggregate. J. Clean. Prod. 40, 151–160.
Meima, J.A., & Comans, R.N.J. (1999a). The leaching of trace elements from municipal
solid waste incinerator bottom ash at different stages of weathering. Appl.
Geochemistry 14, 159–171.
Meima, J.A., Van Zomeren, A., & Comans, R.N.J. (1999b). Complexation of Cu with
Dissolved Organic Carbon in Municipal Solid Waste Incinerator Bottom Ash
Leachates. Environ. Sci. Technol. 33, 1424–1429.
Meima, J.A., Van der Weijden, R.D., Eighmy, T.T., & Comans, R.N.J. (2002). Carbonation
processes in municipal solid waste incinerator bottom ash and their effect on the
leaching of copper and molybdenum. Appl. Geochemistry 17, 1503–1513.

176 Bibliography
Müllauer, W., Beddoe, R.E., & Heinz, D. (2015). Leaching behaviour of major and trace
elements from concrete: Effect of fly ash and GGBS. Cem. Concr. Compos. 58,
129–139.
Müller, U., & Rübner, K. (2006). The microstructure of concrete made with municipal
waste incinerator bottom ash as an aggregate component. Cem. Concr. Res. 36,
1434–1443.
Munuswamy, T. (2016). Internal chloride binding capacity of blended binders in mortar,
Master Thesis. Eindhoven University of Technology, Eindhoven, the Netherlands.
NBS, (2015). National Bureau of Statistics of the People’s republic of China.
NEN 6961, (2005). Environment – Digestion with nitric acid and hydrochloric acid (aqua
regia) for the determination of selected elements in water, sediment, sludge, water
contaning sludge, air dust, soil and building materials.
NEN 6966, (2005). Environment - Analysis of selected elements in water, eluates and
destruates - atomic emission spectrometry with inductively coupled plasma.
NEN 7375, (2004). Leaching characteristics - Determination of the leaching of inorganic
compoments from moulded or monolitic materials with a diffusion test - Soil earthy
and stony materials.
NEN 7383, (2004). Leaching characteristics - Determination of the cumulative leaching of
inorganic components from granular materials with a simiplified procedure of the
column test - Solid earthy and stony materials.
NEN-EN-ISO 10304-2, (1996). Water quality - Determination of dissolved anions by
liquid chromatography of ions - Part 2: Determination of bromide, chloride, nitrate,
nitrite, orthophosphate and sulfate in waste water.
NEN-EN 1744-7, (2010). Determination of loss of ignition of Municipal Incinerator
Bottom Ash Aggregate (MIBA Aggregate).
NPR-CEN/TS 12390-9, (2006). Testing hardened concrete - Part 9: Freeze- thaw resistance
- Scaling.
NT BUILD 492, (1999). Concrete , Mortar and Cement-Based Repair Materials : chloride
migration coefficient from non-steady-state migration experiments
Olsson, S., Kärrman, E., & Gustafsson, J.P. (2006). Environmental systems analysis of the
use of bottom ash from incineration of municipal waste for road construction.
Resour. Conserv. Recycl. 48, 26–40.
Olsson, S., Gustafsson, J.P., Kleja, D.B., Bendz, D., & Persson, I. (2009). Metal leaching
from MSWI bottom ash as affected by salt or dissolved organic matter. Waste
Manag. 29, 506–512.
Oner, A., & Akyuz, S. (2007). An experimental study on optimum usage of GGBS for the
compressive strength of concrete. Cem. Concr. Compos. 29, 505–514.
Onori, R., Polettini, A., & Pomi, R. (2011). Mechanical properties and leaching modeling
of activated incinerator bottom ash in Portland cement blends. Waste Manag. 31,

Bibliography 177
298–310.
Pan, J.R., Huang, C., Kuo, J.-J., & Lin, S.-H. (2008). Recycling MSWI bottom and fly ash
as raw materials for Portland cement. Waste Manag. 28, 1113–1118.
Pera, J., Coutaz, L., Ambroise, J. & Chababbet, M., (1997). Use of incineratior bottom ash
in concrete. Cem. Concr. Res. 27, 1–5.
Preda, C. (2007). Management of municipal solid waste in Europe. Report to Enviroment,
Agriculture and Local and Reginal Affaris.
Pivnenko, K., Eriksson, E., & Astrup, T.F. (2015). Waste paper for recycling: Overview
and identification of potentially critical substances. Waste Manag. 45, 134–142.
Pivnenko, K., Eriksen, M.K., Martín-Fernández, J.A., Eriksson, E., & Astrup, T.F. (2016).
Recycling of plastic waste: Presence of phthalates in plastics from households and
industry. Waste Manag. 54, 44–52.
Polettini, A., & Pomi, R. (2004). The leaching behavior of incinerator bottom ash as
affected by accelerated ageing. J. Hazard. Mater. 113, 209–215.
Polettini, A., Pomi, R., & Fortuna, E. (2009). Chemical activation in view of MSWI bottom
ash recycling in cement-based systems. J. Hazard. Mater. 162, 1292–1299.
Porciúncula, C.B., Marcilio, N.R., Tessaro, I.C., & Gerchmann, M. (2012). Production of
hydrogen in the reaction between aluminum and water in the presence of NaOH
and KOH. Braz. J. Chem. Eng. 29, 337–348.
Qiao, X.C., Tyrer, M., Poon, C.S., & Cheeseman, C.R. (2008a). Characterization of alkali-
activated thermally treated incinerator bottom ash. Waste Manag. 28, 1955–1962.
Qiao, X.C., Tyrer, M., Poon, C.S., & Cheeseman, C.R. (2008b). Novel cementitious
materials produced from incinerator bottom ash. Resour. Conserv. Recycl. 52, 496–
510.
Qiao, X.C., Ng, B.R., Tyrer, M., Poon, C.S., & Cheeseman, C.R. (2008c). Production of
lightweight concrete using incinerator bottom ash. Constr. Build. Mater. 22, 473–
480.
Qiao, X.C., Cheeseman, C.R., & Poon, C.S. (2009). Influences of chemical activators on
incinerator bottom ash. Waste Manag. 29, 544–549.
Quercia Bianchi, G. (2014). Application of nano-silica in concrete, PhD Thesis,.
Eindhoven University of Technology, Einhoven, the Netherlands.
Rahman, M.A., & Bakker, M.C.M. (2013). Sensor-based control in eddy current separation
of incinerator bottom ash. Waste Manag. 33, 1418–1424.
Rémond, S., Pimienta, P., & Bentz, D.P. (2002). Effects of the incorporation of Municipal
Solid Waste Incineration fly ash in cement pastes and mortars I. Experimental study.
Cem. Concr. Res. 32, 303–311.
Rendek, E., Ducom, G., & Germain, P. (2006). Carbon dioxide sequestration in municipal
solid waste incinerator (MSWI) bottom ash. J. Hazard. Mater. 128, 73–79.

178 Bibliography
Roessler, J.G., Townsend, T.G., & Ferraro, C.C. (2015). Use of leaching tests to quantify
trace element release from waste to energy bottom ash amended pavements. J.
Hazard. Mater. 300, 830–837.
Roustaei, M., Eslami, A., & Ghazavi, M. (2015). Effects of freeze-thaw cycles on a fiber
reinforced fine grained soil in relation to geotechnical parameters. Cold Reg. Sci.
Technol. 120, 127–137.
Saffarzadeh, A., Shimaoka, T., Wei, Y., Gardner, K.H., & Musselman, C.N. (2011).
Impacts of natural weathering on the transformation/neoformation processes in
landfilled MSWI bottom ash: a geoenvironmental perspective. Waste Manag. 31,
2440–2454.
Saffarzadeh, A., Arumugam, N., & Shimaoka, T. (2016). Aluminum and aluminum alloys
in municipal solid waste incineration (MSWI) bottom ash: A potential source for
the production of hydrogen gas. Int. J. Hydrogen Energy 41, 820–831.
Saikia, N., Cornelis, G., Mertens, G., Elsen, J., Van Balen, K., Van Gerven, T., &
Vandecasteele, C. (2008). Assessment of Pb-slag, MSWI bottom ash and boiler and
fly ash for using as a fine aggregate in cement mortar. J. Hazard. Mater. 154, 766–
777.
Sandor Popovics (1992). Concrete Materials: Properties, Specification, and Testing. (2nd
Edition)
Saner, D., Blumer, Y.B., Lang, D.J., & Koehler, A. (2011). Scenarios for the
implementation of EU waste legislation at national level and their consequences for
emissions from municipal waste incineration. Resour. Conserv. Recycl. 57, 67–77.
Santos, R.M., Mertens, G., Salman, M., Cizer, O., & Van Gerven, T. (2013). Comparative
study of ageing, heat treatment and accelerated carbonation for stabilization of
municipal solid waste incineration bottom ash in view of reducing regulated heavy
metal/metalloid leaching. J. Environ. Manage. 128, 807–821.
Schneider, M., Romer, M., Tschudin, M., & Bolio, H. (2011). Sustainable cement
production—present and future. Cem. Concr. Res. 41, 642–650.
Settimo, F., Bevilacqua, P., & Rem, P. (2004). Eddy Current Separation of Fine Non-
Ferrous Particles from Bulk Streams. Phys. Sep. Sci. Eng. 13, 15–23.
Sheen, Y.-N., Wang, H.-Y., Juang, Y.-P., & Le, D.-H. (2013). Assessment on the
engineering properties of ready-mixed concrete using recycled aggregates. Constr.
Build. Mater. 45, 298–305.
Shekdar, A. V. (2009). Sustainable solid waste management: An integrated approach for
Asian countries. Waste Manag. 29, 1438–1448.
Shen, Y., Qian, J., & Zhang, Z. (2013). Investigations of anhydrite in CFBC fly ash as
cement retarders. Constr. Build. Mater. 40, 672–678.
Shi, H.-S., & Kan, L.-L. (2009a). Leaching behavior of heavy metals from municipal solid
wastes incineration (MSWI) fly ash used in concrete. J. Hazard. Mater. 164, 750–
754.
Bibliography 179
Shi, H., & Kan, L. (2009b). Characteristics of municipal solid wastes incineration (MSWI)
fly ash–cement matrices and effect of mineral admixtures on composite system.
Constr. Build. Mater. 23, 2160–2166.
Siddique, R., & Bennacer, R. (2012). Use of iron and steel industry by-product (GGBS) in
cement paste and mortar. Resour. Conserv. Recycl. 69, 29–34.
Singh, M., & Siddique, R. (2013). Effect of coal bottom ash as partial replacement of sand
on properties of concrete. Resour. Conserv. Recycl. 72, 20–32.
Soares, M.A.R., Quina, M.J., Reis, M.S., & Quinta-Ferreira, R. (2016). Assessment of co-
composting process with high load of an inorganic industrial waste. Waste Manag.
59, 80–89.
Soil Quality Decree, (2013). Regeling Bodemkwaliteit, VROM, Den Haag: Ruimte en
Milieu, Ministerie van Volkshuisvesting, Ruimtelijke Ordeling en Milieubeheer.
Solpuker, U., Sheets, J., Kim, Y., & Schwartz, F.W. (2014). Leaching potential of pervious
concrete and immobilization of Cu, Pb and Zn using pervious concrete. J. Contam.
Hydrol. 161, 35–48.
Song, G.-J., Kim, K.-H., Seo, Y.-C., & Kim, S.-C. (2004). Characteristics of ashes from
different locations at the MSW incinerator equipped with various air pollution
control devices. Waste Manag. 24, 99–106.
Song, H.W., Lee, C.H., Jung, M.S., & Ann, K.Y. (2008). Development of chloride binding
capacity in cement pastes and influence of the pH of hydration products. Can. J.
Civ. Eng. 35, 1427–1434.
Sorlini, S., Abbà, A., & Collivignarelli, C. (2011). Recovery of MSWI and soil washing
residues as concrete aggregates. Waste Manag. 31, 289–297.
Stehlík, P. (2009). Contribution to advances in waste-to-energy technologies. J. Clean.
Prod. 17, 919–931.
Tam, V.W.Y., Gao, X.F., Tam, C.M., & Ng, K.M. (2009). Physio-chemical reactions in
recycle aggregate concrete. J. Hazard. Mater. 163, 823–828.
Tang, L., & Nilsson, L.O. (1993). Chloride binding capacity and binding isotherms of OPC
pastes and mortars. Cem. Concr. Res. 23, 247–253.
Tang, P., Florea, M.V.A., Spiesz, P., & Brouwers, H.J.H. (2015). Characteristics and
application potential of municipal solid waste incineration (MSWI) bottom ashes
from two waste-to-energy plants. Constr. Build. Mater. 83, 77–94.
Tang, P., Florea, M.V.., Spiesz, P., & Brouwers, H.J.H. (2016). Application of thermally
activated municipal solid waste incineration (MSWI) bottom ash fines as binder
substitute. Cem. Concr. Compos. 70, 194–205.
Tang, P., Munuswamy, T., Florea, M.V.A., & Brouwers, H.J.H. (2015). Internal chloride
binding and leaching behaviour in mortars regarding to blended binders. In H.B.
Fischer, K.A. Bode & C. Beutan (Eds.), The 19th International Conference on
Building Materials (IBAUSIL), 2, pp. 493-498, Weimar, Germany: Bauhaus-
University.

180 Bibliography
Tang, P., Florea, M.V.A., & Brouwers, H.J.H. (2017) Employing cold bonded pelletization
to produce lightweight aggregates from incineration fine bottom ash, J. Clean. Prod.
165, 1371–1384.
Tang, P., & Brouwers, H.J.H. (2017) Integral recycling of municipal solid waste
incineration (MSWI) bottom ash fines (0–2 mm) and industrial powder wastes by
cold-bonding pelletization, Waste Manag. 62, 125–138.
Taylor, H.F.W. (1997). Cement chemistry (Thomas Telford Publishing).
Thomas, J., & Harilal, B. (2015). Properties of cold bonded quarry dust coarse aggregates
and its use in concrete. Cem. Concr. Compos. 62, 67–75.
Tishmack, J., Olek, J., & Diamond, S. (1999). Characterization of High-Calcium Fly Ashes
and Their Potential Influence on Ettringite Formation in Cementitious Systems.
Cem. Concr. Aggregates 21, 82-92.
Tkaczewska, E., Mróz, R., & Łój, G. (2012). Coal-biomass fly ashes for cement production
of CEM II/A-V 42.5R. Constr. Build. Mater. 28, 633–639.
Uwasu, M., Hara, K., & Yabar, H. (2014). World cement production and environmental
implications. Environ. Dev. 10, 36–47.
Van der Sloot, H.A., Kosson, D.S., & Hjelmar, O. (2001). Characteristics, treatment and
utilization of residues from municipal waste incineration. Waste Manag. 21, 753–
765.
Vasugi, V., & Ramamurthy, K. (2014). Identification of design parameters influencing
manufacture and properties of cold-bonded pond ash aggregate. Mater. Des. 54,
264–278.
Van Caneghem, J., Verbinnen, B., Cornelis, G., De Wijs, J., Mulder, R., Billen, P., &
Vandecasteele, C. (2016). Immobilization of antimony in waste-to-energy bottom
ash by addition of calcium and iron containing additives. Waste Manag. 54, 162–
168.
Van Dr Wegen, G., Hofstra, U., & Speerstra, J. (2013). Upgraded MSWI bottom ash as
aggregate in concrete. Waste and Biomass Valor 4, 737–743.
Van Gerven, T., Geysen, D., Stoffels, L., Jaspers, M., Wauters, G., & Vandecasteele, C.
(2005). Management of incinerator residues in Flanders (Belgium) and in
neighbouring countries. A comparison. Waste Manag. 25, 75–87.
Van Gerven, T., Cooreman, H., Imbrechts, K., Hindrix, K., & Vandecasteele, C. (2007).
Extraction of heavy metals from municipal solid waste incinerator (MSWI) bottom
ash with organic solutions. J. Hazard. Mater. 140, 376–381.
Van Zomeren, A., & Comans, R.N.J. (2004). Contribution of natural organic matter to
copper leaching from municipal solid waste incinerator bottom ash. Environ. Sci.
Technol. 38, 3927–3932.
Van Zomeren, A., & Comans, R.N.J. (2009). Carbon speciation in municipal solid waste
incinerator (MSWI) bottom ash in relation to facilitated metal leaching. Waste
Manag. 29, 2059–2064.

Bibliography 181
Vazquez, Y. V., & Barbosa, S.E. (2016). Recycling of mixed plastic waste from electrical
and electronic equipment. Added value by compatibilization. Waste Manag. 53,
196–203.
Volland, S., & Brötz, J. (2015). Lightweight aggregates produced from sand sludge and
zeolitic rocks. Constr. Build. Mater. 85, 22–29.
Wang, H., & Wang, C. (2013). Municipal solid waste management in Beijing:
characteristics and challenges. Waste Manag. Res. 31, 67–72.
Weeks, C., Hand, R.J., & Sharp, J.H. (2008). Retardation of cement hydration caused by
heavy metals present in ISF slag used as aggregate. Cem. Concr. Compos. 30, 970–
978.
Wei, Y., Shimaoka, T., Saffarzadeh, A., & Takahashi, F. (2011). Mineralogical
characterization of municipal solid waste incineration bottom ash with an emphasis
on heavy metal-bearing phases. J. Hazard. Mater. 187, 534–543.
Wiles, C.C. (1996). Municipal solid waste combustion ash : State-of-the-knowledge. J.
Hazard. Mater. 47, 325–344.
Wilson, A. (1993). Cement and Concrete : Environmental Considerations. Environ. Build.
News. 2, 1-11
Wong, H.S., Barakat, R., Alhilali, A., Saleh, M., & Cheeseman, C.R. (2015). Hydrophobic
concrete using waste paper sludge ash. Cem. Concr. Res. 70, 9–20.
Woon, K.S., & Lo, I.M.C. (2016). A proposed framework of food waste collection and
recycling for renewable biogas fuel production in Hong Kong. Waste Manag. 47,
3–10.
Xia, Y., He, P., Shao, L., & Zhang, H. (2017). Metal distribution characteristic of MSWI
bottom ash in view of metal recovery. J. Environ. Sci. 52, 178–189.
Xu, T., Galama, T., & Sathaye, J. (2013). Reducing carbon footprint in cement material
making: Characterizing costs of conserved energy and reduced carbon emissions.
Sustain. Cities Soc. 9, 54–61.
Yang, J., Du, Q., & Bao, Y. (2011). Concrete with recycled concrete aggregate and crushed
clay bricks. Constr. Build. Mater. 25, 1935–1945.
Yang, R., Liao, W.-P., & Wu, P.-H. (2012). Basic characteristics of leachate produced by
various washing processes for MSWI ashes in Taiwan. J. Environ. Manage. 104,
67–76.
Yang, S., Saffarzadeh, A., Shimaoka, T., & Kawano, T. (2013). Existence of Cl in
municipal solid waste incineration bottom ash and dechlorination effect of thermal
treatment. J. Hazard. Mater. 267, 214–220.
Yao, J., Li, W.-B., Kong, Q.-N., Wu, Y.-Y., He, R., & Shen, D.-S. (2010a). Content,
mobility and transfer behavior of heavy metals in MSWI bottom ash in Zhejiang
province, China. Fuel 89, 616–622.
Yao, J., Li, W.-B., Tang, M., Fang, C.-R., Feng, H.-J., & Shen, D.-S. (2010b). Effect of

182 Bibliography
weathering treatment on the fractionation and leaching behavior of copper in
municipal solid waste incinerator bottom ash. Chemosphere 81, 571–576.
Yao, J., Kong, Q., Zhu, H., Long, Y., & Shen, D. (2013). Content and fractionation of Cu,
Zn and Cd in size fractionated municipal solid waste incineration bottom ash.
Ecotoxicol. Environ. Saf. 94, 131–137.
Yao, Q., Samad, N.B., Keller, B., Seah, X.S., Huang, L., & Lau, R. (2014). Mobility of
heavy Metals and rare earth Elements in incineration bottom ash through particle
size reduction. Chem. Eng. Sci. 118, 214-220
Yen, C.-L., Tseng, D.-H., & Lin, T.-T. (2011). Characterization of eco-cement paste
produced from waste sludges. Chemosphere 84, 220–226.
Yu, R., Tang, P., Spiesz, P., & Brouwers, H.J.H. (2014). A study of multiple effects of
nano-silica and hybrid fibres on the properties of Ultra-High Performance Fibre
Reinforced Concrete (UHPFRC) incorporating waste b GovHK ottom ash (WBA).
Constr. Build. Mater. 60, 98–110.
Yudovich, Y.E., & Ketris, M.P. (2006). Chlorine in coal: A review. Int. J. Coal Geol. 67,
127–144.
Zajac, M., Rossberg, A., Le Saout, G., & Lothenbach, B. (2014). Influence of limestone
and anhydrite on the hydration of Portland cements. Cem. Concr. Compos. 46, 99–
108.
Zhang, H., Schuchardt, F., Li, G., Yang, J., & Yang, Q. (2013). Emission of volatile sulfur
compounds during composting of municipal solid waste (MSW). Waste Manag. 33,
957–963.
Zhang, Y., Cetin, B., Likos, W.J., & Edil, T.B. (2016). Impacts of pH on leaching potential
of elements from MSW incineration fly ash. Fuel 184, 815–825.
Zhao, Z., Wang, S., Lu, L., & Gong, C. (2013). Evaluation of pre-coated recycled aggregate
for concrete and mortar. Constr. Build. Mater. 43, 191–196.
List of abbreviations and symbols 183
List of abbreviations and symbols
Abbreviations
ADR Advanced dry recovery
APC Air pollution control
AR Alumina ratio
ASR Alkali-silica reaction
BA Bottom ash
BD Bulk density
BAM Incineration bottom ash from Moerdijk
BAW Incineration bottom ash from Wijster
CBLA Cold bonded lightweight aggregate
CDW Construction and demolition waste
CML Cumulative mass loss
CR Crushing resistance
DOC Dissolved organic carbon
FA Coal fly ash
F-BA Fine incineration bottom ash below 2 mm
F-BAM Fine incineration bottom ash (0-2 mm) from Moerdijk
F-BAW Fine incineration bottom ash (0-2 mm) from Wijster
GGBS Ground granulated blast furnace slag
HA Humic acid
Hc Hydrotalcite
HCFA High calcium fly ash from coal combustion power plant
HPLC High performance liquid chromatography
HR Hydraulic ratio
IBA Incineration bottom ash
IBC Isoleren-Beheersen-Controleren
IC Ion chromatography
ICP-AES Inductively coupled plasma-atomic emission spectrometry
IFA Incineration fly ash
IMC Insulation, Management, Control
L Liter
LCA Life cycle analysis
LWA Lightweight aggregate
LOI Loss on ignition
LSF Lime saturation factor
L/S Liquid to solid ratio
184 List of abbreviations and symbols
MF-BA Milled MSWI fine bottom ash
MF-BAW Milled fine incineration bottom ash from Wijster
MF-BAM Milled fine incineration bottom ash from Moerdijk
MHR Maximum heat release rate
MSW Municipal solid waste
MSWI Municipal solid waste incineration
NA Natural aggregate
nS Nano-silica
OPC Ordinary Portland cement
PFA Pulverized fly ash
PPF Polypropylene fiber
PSA Paper sludge ash
PSD Particle size distribution
RCA Recycled concrete aggregate
RHA Rice husk ash
SCC Self-compacting concrete
SCMs Supplementary cementing materials
SEM Scanning electron microscope
SF Sand fraction
S-F Slump-flow
SMHR Second maximum heat release rate
SP Superplasticizer
SQD Soil Quality Decree
SR Silica ratio
TH Total heat after 168 hours
3R Reduce, Reuse and Recycle
WA Water absorption
WAS Washing aggregate sludge
WBA Natural weathered incineration bottom ash
WPD Water penetration depth
w/p Water to powder ratio
WtE Waste to Energy
XRD X-ray diffraction
XRF X-ray fluorescence
List of abbreviations and symbols 185
Symbols
Ct The range of calculated total content of components in mortar [mg/kg]
d.m. Dry mass
ɛ Leaching concentration of components in the changed leachate during
diffusion test [mg/m2]
ɛ64 The cumulative leaching concentration of a component after 64 days
diffusion test [mg/m2]
m1 Initial mass of the sample before drying [g]
m2 Mass of sample after drying [g]
md Mass of sample after drying [g]
mwet Mass of original tested sample after water absorption procedure [g]
rc The slop of the linear regression line between the log (ɛ) and log (hour)
t500 Slump flow time to reach diameter of 500 mm [s]
tv V-funnel time [s]
ω Water content [%]
W24 Water absorption [%]
Chemical abbreviation
AFm Alumina, ferric oxide, mono-sulphate
AFt Alumina, ferric oxide, tri-sulphate
B Brownmillite
C Calcite
C3A Tricalcium aluminate
C4AF Tetracalcium aluminoferrite
CH Portlandite
Cl-LDH Chloride layered double hydroxide
C-S-H Calcium silicate hydrate
C2S Belite
C3S Alite
Fs Friedel’s salt
Ms Monosulphate
Qz Quartz
186 List of abbreviations and symbols
Chemical components
Al2O3 Aluminum oxide
CaCl2 Calcium chloride
CaO Calcium oxide
CO2 Carbon dioxide
CaSO4 Calcium sulphate
Fe2O3 Iron oxide
H2 Hydrogen
KOH Potassium hydroxide
NaCl Sodium chloride
NaOH Sodium hydroxide
SiO2 Silica oxide
Minerals terminology
Ca2Al2SiO7 Gehlenite
CaCO3 Calcite
Ca3Si3O9 Wollastonite
CaSO4 Anhydrite
Fe3O4 Magnetite
Fe2O3 Hematite
SiO2 Quartz
Zn2P2O7 Zinc pyrophosphate

Appendix A 187
Appendix A
The amount of CaO, Al2O3, Fe2O3, CuO, SO3, Cl in BAW and BAM fractions
(a)
(b)
0
5
10
15
20
25
30
0
10
20
30
40
50
60
70
80
90
100
0-0
.15
0.1
5-0
.25
0.2
5-0
.5
0.5
-1
1-2
2-4
4-5
.66
5.6
6-8
8-1
1.2
11
.2-1
6
16
-23
23
-40
>4
0
Ca
O [
% b
y m
ass
]
Cu
mm
ula
tive C
aO
[%
]
Particle size [mm]
Cumulative CaO in BAW
Cumulative CaO in BAM
CaO in BAW fractions
CaO in BAM fractions
0
2
4
6
8
10
12
14
16
0
10
20
30
40
50
60
70
80
90
100
0-0
.15
0.1
5-0
.25
0.2
5-0
.5
0.5
-1
1-2
2-4
4-5
.66
5.6
6-8
8-1
1.2
11
.2-1
6
16
-23
23
-40
>4
0
Al 2
O3
[% b
y m
ass
]
Cu
mm
ula
tive A
l 2O
3[%
]
Particle size [mm]
Cumulative Al2O3 in BAW
Cumulative Al2O3 in BAM
Al2O3 in BAW fractions
Al2O3 in BAM fractions
Al2O3
Al2O3
Al2O3
Al2O3
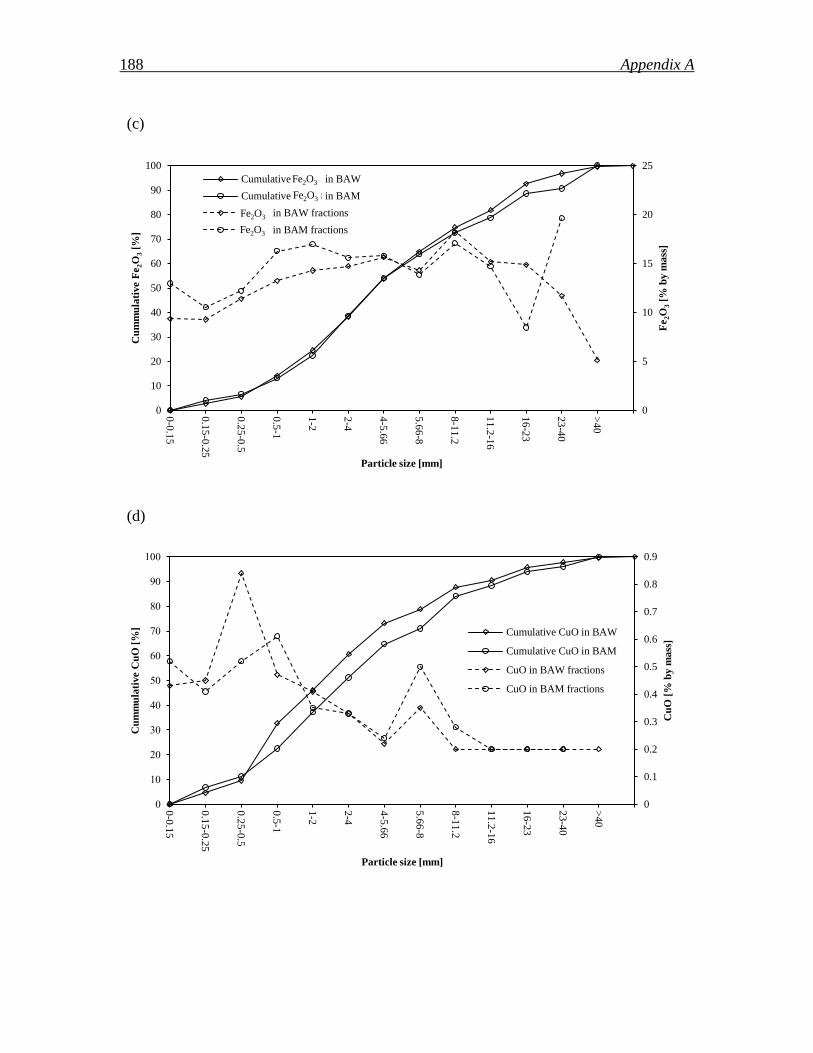
188 Appendix A
(c)
(d)
0
5
10
15
20
25
0
10
20
30
40
50
60
70
80
90
100
0-0
.15
0.1
5-0
.25
0.2
5-0
.5
0.5
-1
1-2
2-4
4-5
.66
5.6
6-8
8-1
1.2
11
.2-1
6
16
-23
23
-40
>4
0
Fe
2O
3[%
by
ma
ss]
Cu
mm
ula
tive F
e2O
3[%
]
Particle size [mm]
Cumulative Fe2O3 in BAW
Cumulative Fe2O3 in BAM
Fe2O3 in BAW fractions
Fe2O3 in BAM fractions
Fe2O3
Fe2O3
Fe2O3
Fe2O3
0
0.1
0.2
0.3
0.4
0.5
0.6
0.7
0.8
0.9
0-0
.15
0.1
5-0
.25
0.2
5-0
.5
0.5
-1
1-2
2-4
4-5
.66
5.6
6-8
8-1
1.2
11
.2-1
6
16
-23
23
-40
>4
0
Cu
O [
% b
y m
ass
]
Cu
mm
ula
tive C
uO
[%
]
Particle size [mm]
Cumulative CuO in BAW
Cumulative CuO in BAM
CuO in BAW fractions
CuO in BAM fractions
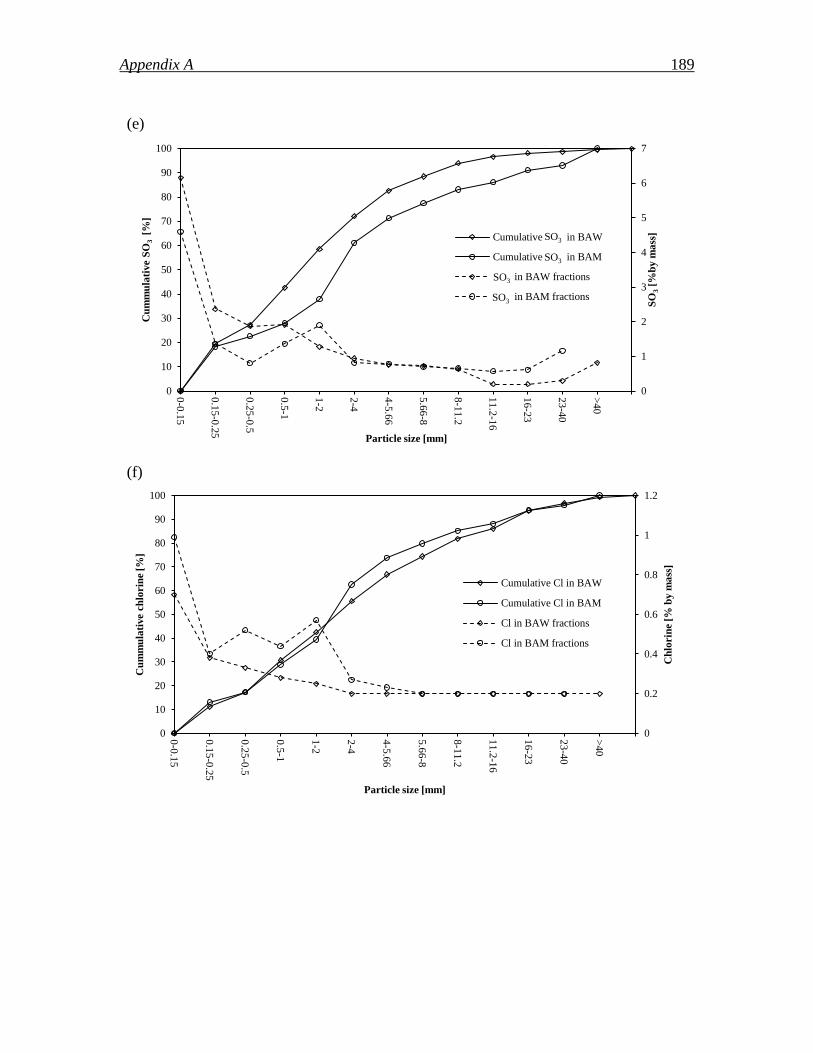
Appendix A 189
(e)
(f)
0
1
2
3
4
5
6
7
0
10
20
30
40
50
60
70
80
90
100
0-0
.15
0.1
5-0
.25
0.2
5-0
.5
0.5
-1
1-2
2-4
4-5
.66
5.6
6-8
8-1
1.2
11
.2-1
6
16
-23
23
-40
>4
0
SO
3[%
by
ma
ss]
Cu
mm
ula
tive S
O3
[%
]
Particle size [mm]
Cumulative SO3 in BAW
Cumulative SO3 in BAM
SO3 in BAW fractions
SO3 in BAM fractions
SO3
SO3
SO3
SO3
0
0.2
0.4
0.6
0.8
1
1.2
0
10
20
30
40
50
60
70
80
90
100
0-0
.15
0.1
5-0
.25
0.2
5-0
.5
0.5
-1
1-2
2-4
4-5
.66
5.6
6-8
8-1
1.2
11
.2-1
6
16
-23
23
-40
>4
0
Ch
lorin
e [
% b
y m
ass
]
Cu
mm
ula
tive c
hlo
rin
e [
%]
Particle size [mm]
Cumulative Cl in BAW
Cumulative Cl in BAM
Cl in BAW fractions
Cl in BAM fractions


Appendix B 191
Appendix B
H2 volume calculation
2 3 22Al 6H O 2Al(OH) 3H
Molar ratio 2 32 3
Molar mass 26.98 2.01Molar mass 26.98 2.01
2 3 22Al 6H O 2Al(OH) 3H
Molar ratio 2 3
Molar mass 26.98 2.01
Mass 1 g
Ideal gas law: PV = nRT
n Amount of substance of the gas [moles]
P Pressure of the gas [atm]
V Volume of the gas [dm3]
T The absolute temperature of the gas [K]
R Gas constant [atm dm3/mol/K]
Therefore:
V = nRT÷ P
V (H2) = [(1 ÷ 26.98)÷ 2× 3]×0.082×293÷1.0=1.336 dm3
Moles 1÷ 26.98 (1÷ 26.98)÷2×3
n (H2) = (1÷ 26.98)÷2×3 mol


Summary 193
Summary
Municipal solid waste incineration (MSWI) bottom ash - from waste to value:
Characterization, treatments and application
The waste-to-energy technique as a sufficient method to manage the municipal solid wastes
in the way of incineration has been widely applied. However, the increasing amount of
solid by-products (such as incineration bottom ash, fly ash and air pollution control residues)
generated in the incineration becomes an issue, which need to be solved in consideration
of the sustainable development of environment and economy. This thesis aims at
investigating the potential applications of municipal solid waste incineration (MSWI)
bottom ash as building materials, such as binder substitutes, sand and aggregate
replacement.
The stability of the physical and chemical properties of the MSWI bottom ashes was
assessed by analyzing the historic experimental data and shown in Chapter 3. It was figured
out that the MSWI bottom ashes from two different incinerations in the Netherlands had
very similar properties, and their properties were quite stable over time. Their
environmental property was evaluated through column leaching test, and the leaching
contaminants in both bottom ashes according to the Dutch legislation (Soil Quality Decree,
SQD) were copper, antimony, molybdenum, chloride and sulphate. The use of fine bottom
ashes (0-2 mm) as sand replacement or as cement replacement after milling showed that
the metallic aluminum in the bottom ash cased crack in mortar and the milled fine bottom
ash had low reactivity.
To improve the properties of the fine bottom ash, and make it suitable to be used as building
materials, several treatments were investigated in Chapter 4 and Chapter 5. Thermal
treatment plus slow speed milling process could reduce the antimony and copper leaching
significantly, and the retardation effect of milled bottom ash on the cement hydration was
reduced. The washing treatment on fine bottom ash can remove the chloride content by
more than 50%. The use of fine bottom ash in mortar with blended binders showed that the
Sb, chloride and sulphate in fine bottom ash could be well bound by the binders, while the
Cu leaching showed an increasing treated with curing time.
To combine the treatment and application of the fine bottom ashes, integral recycle through
cold bonded pelletization was introduced (Chapters 6, 7 and 8). Several industrial solid
wastes, such as paper sludge ash, coal fly ash, washing aggregate sludge, fine bottom ash,
etc. were chosen as raw materials and mixed with cementitious binders to produced
artificial cold bonded lightweight aggregates (CBLAs). The properties of the CBLAs could
be modified by changing the proportions of the raw materials, adding of polypropylene
194 Summary
fibers, etc. The leaching of antimony and sulphate of the produced CBLAs was well under
the limit value according to SQD, while the leaching of copper, molybdenum and chloride
can be decreased by reducing the use of fine bottom ash or increasing the binder content.
The used of CBLAs in self-compacting concrete showed decrease of the concrete strength
due to lower aggregate strength compared with natural aggregate, while the use of water
can be decreased due to the rounded particle shape of the CBLAs. Moreover, the leaching
concentration of contaminants from the concrete with CBLAs complied with the leaching
limits due to the binding of the cementitious binders in concrete.

List of publications 195
List of publications
Publication written within this PhD project are listed below:
Journals
[1] P. Tang, H.J.H. Brouwers, The durability and environmental properties of self-
compacting concrete incorporating cold bonded lightweight aggregates produced
from combined industrial solid wastes (under review)
[2] P. Tang, M.V.A. Florea, H.J.H. Brouwers, Employing cold bonded pelletization to
produce lightweight aggregates from incineration fine bottom ash, J. Clean. Prod.
165 (2017) 1371–1384.
[3] P. Tang, H.J.H. Brouwers, Integral recycling of municipal solid waste incineration
(MSWI) bottom ash fines (0–2 mm) and industrial powder wastes by cold-bonding
pelletization, Waste Manag. 62 (2017) 125–138.
[4] P. Tang, M.V.A. Florea, P. Spiesz, H.J.H. Brouwers, Application of thermally
activated municipal solid waste incineration (MSWI) bottom ash fines as binder
substitute, Cem. Concr. Compos. 70 (2016) 194–205.
[5] P. Tang, M.V.A. Florea, P. Spiesz, H.J.H. Brouwers, Characteristics and
application potential of municipal solid waste incineration (MSWI) bottom ashes
from two waste-to-energy plants, Constr. Build. Mater. 83 (2015) 77–94.
[6] R. Yu, P. Tang, P. Spiesz, H.J.H. Brouwers, A study of multiple effects of nano-
silica and hybrid fibres on the properties of Ultra-High Performance Fibre
Reinforced Concrete (UHPFRC) incorporating waste bottom ash (WBA), Constr.
Build. Mater. 60 (2014) 98–110.
Conference proceedings
[1] P. Tang, M.V.A. Florea, H.J.H. Brouwers, (2016) Production of Artificial
Aggregate Using MSWI Bottom Ash Fines (0-2 mm) Applying The Cold Bonding
Pelletizing Technique. In 4th International Conference on Sustainable Solid Waste
Management, 23–25 June, Limassol, Cyprus.
196 List of publications
[2] P. Tang, M.V.A. Florea, H.J.H. Brouwers, (2016) Recycling of waste materials as
lightweight aggregate by cold bonding pelletizing technique. In 38th International
Cement Microscopy Association (ICMA) conference, April 17-21, Lyon, France.
[3] P. Tang, T. Munuswamy, M.V.A. Florea, H.J.H. Brouwers, (2015). Internal
chloride binding and leaching behaviour in mortars regarding to blended binders.
In H.B. Fischer, K.A. Bode & C. Beutan (Eds.), Conference paper published at the
19th International Conference on Building Materials (IBAUSIL 2015), 16. bis 18.
September, Weimar, Germany, (2, pp. 493-498). Weimar, Germany: Bauhaus-
University.
[4] P. Tang, M.V.A. Florea, P. Spiesz, H.J.H. Brouwers, (2014). Thermal treatment on
MSWI bottom ash fines. In V. Bilek & Z. Kersner (Eds.), Conference Paper:
Proceedings of the International Conference of Non-Traditional Cement and
Concrete (NTCC2014), June 16-19, 2014, Brno, Czech Republic, (pp. 305-306).
Brno: NOVPRESS s.r.o.
[5] P. Tang, Q.L. Yu, R. Yu, H.J.H. Brouwers, (2013). The application of MSWI
bottom ash fines in high performance concrete. 1st International Conference on the
Chemistry of Construction Materials, 7-9 October 2013, Berlin, (pp. 435-438).
Berlin.
[6] P. Tang, M.V.A. Florea, H.J.H. Brouwers, (2012). The characterization of MSWI
bottom ash. In H.B. Fischer, K.A. Bode & C. Beutan (Eds.), 18th International
Conference on Building Materials (IBAUSIL 2012), 12. bis 15. September,
Weimar, Germany, (2, pp. 1192-1199). Weimar, Germany: Bauhaus-University.

Curriculum vitae 197
Curriculum vitae
Personal data
Name: Pei Tang
Date of birth: 22nd December 1987
Place of birth: Henan, China
PhD research/work
2017-present The Hong Kong Polytechnic University (PolyU), Hong Kong, China
Department of Civil and Environmental Engineering
Associate researcher
2011–2016 Eindhoven University of Technology (Tu/e), Eindhoven, the Netherlands
Department of Built Environment
PhD student and researcher
Education
2009 – 2011 Master of Structural Engineering
Wuhan University of Technology (WUT), Wuhan, P. R. China
Thesis title:
Experimental Research on Mechanical Property of Reinforced Inorganic
Polymer Concrete Beam
Participated project:
Application of geopolymer concrete in rapid repairing and construction in
airport (supported by China Military)
2005 – 2009 Bachelor of Civil Engineering
Xuchang University, Xuchang, P. R. China
Graduation project:
Design of T-beam pre-stressed concrete bridge