municipal freshwater scarcity - gao
TRANSCRIPT

Na+a++NNNNN +++++++++++
NaNaNaaNN ++
Mg2+
Na+
Ca++ Ca++Mg2+ Cl- Cl-
Cl-
Mg2+
NO31-
Cl -
Cl-
--NOONNNON3331--
NONONONONONOONOOOOOOOOOOONONONONONONOONONNNOO3333333333333333
1-1-1111
NONONOOOOOO33333
111-1-
TECHNOLOGY ASSESSMENTApril 2016
GAO-16-474
United States Government Accountability OfficeCenter for Science, Technology, and Engineering
Report to Congressional Requesters
Municipal freshwater scarcity Using technology to improve distribution system efficiency and tap nontraditional water sources

Cover image is GAO’s rendition of the reverse osmosis process. The top half represents the source water (e.g., brackish water). Water molecules (H2O) consist of an oxygen atom bonded with two hydrogen atoms. In addition to water molecules, the source water contains ions such as magnesium (Mg2+), calcium (Ca2+), sodium (Na+), chloride (Cl1-), and nitrate (NO3
1-) as well as other contaminants. The bottom half of the image represents the cleaner water that has been driven through the reverse osmosis membrane by the applied pressure, while the horizontal band between the upper and lower water streams represents the membrane.

Highlights of GAO-16-474, a report to congressional requesters
April 2016
TECHNOLOGY ASSESSMENT
Municipal freshwater scarcity Using technology to improve distribution system efficiency and tap nontraditional water sources
Why GAO did this study
Of all municipal services, providing a safe and adequate supply of water is perhaps the most essential. Reports about lead-contaminated drinking water in Flint, Michigan and ongoing drought in several regions of the United States highlight some of the challenges water utilities are facing. In times of shortage, conflicts over limited freshwater resources—including for irrigation, power production, and municipal water use—increase. Further, freshwater shortages are expected to continue into the future.
GAO was asked to conduct an assessment of technologies that could help municipal water utilities address water scarcity. This report examines (1) technologies that could reduce demand on freshwater supplies by improving distribution system efficiency; (2) technologies that could increase water supplies by using nontraditional water sources; and (3) locations and types of water utilities where these technologies are most commonly adopted.
GAO reviewed scientific literature and key reports; interviewed experts; visited water utilities, national laboratories and research facilities; convened an expert meeting with the assistance of the National Academies; and conducted a representative survey of municipal water utilities. Five federal agencies and 13 experts reviewed the draft report and some provided technical comments, which were incorporated as appropriate.
View GAO-16-474. To view the e-supplement online, click on GAO-16-588SP. For more information, contact Timothy M. Persons at (202) 512-6412 or [email protected].
What GAO found
Water scarcity occurs when the demand for water in a given area approaches or exceeds available water supplies. A water utility facing scarcity may attempt to address it by reducing its demand on existing water supplies, increasing its water supplies, or both. Many mature technologies are available to address both of these areas. For example, a utility could try to improve the efficiency of its distribution system in order to reduce its demand on existing water supplies. Utilities can choose from wide variety of mature technologies to detect leaks, manage pressure, meter water flow, and assess the condition of pipes. Similarly, a utility may be able to increase supplies through choosing from many mature technologies that are available to treat nontraditional water sources such as seawater, brackish water, treated municipal wastewater, or storm water captured from developed surfaces.
Based on GAO’s nationwide survey of municipal water utilities, the percentage of utilities that treat nontraditional water sources for municipal use varies significantly across the United States. According to GAO’s statistical analysis, much of this regional variation can be explained by differences in underlying utility and watershed characteristics. In particular, very large utilities, utilities serving water-stressed areas, and utilities that manage additional services such as wastewater or storm water services are most likely to treat nontraditional water sources for municipal use. GAO also analyzed survey data regarding the challenges that municipal water utilities face in treating nontraditional water. The results of that analysis suggest that utilities that have experience treating nontraditional water sources find it easier to address financial, regulatory, and other challenges than utilities that have only studied the feasibility of doing so.
Source: GAO analysis of Water Supply Stress Index (W aSSI) data developed by the U.S. Forest Service. | GAO-16-474
Average 30-year water stress levels in the contiguous United States (1981-2010).

Technology Assessment GAO-16-474 i
Table of Contents
Letter ................................................................................................................................................ 1
1 Background .................................................................................................................................... 5
1.1 The hydrologic cycle ............................................................................................................. 5
1.2 Water withdrawals and groundwater overdraft ................................................................. 6
1.3 Municipal water utilities ...................................................................................................... 7
1.4 Legal framework governing municipal water services ........................................................ 9
1.5 Supply, demand, and economics ......................................................................................... 9
1.6 Reducing demand on water supplies through improving distribution system efficiency . 10
1.6.1 Leak detection and pipe condition assessment ....................................................... 10
1.6.2 Pressure management ............................................................................................. 12
1.6.3 Metering ................................................................................................................... 13
1.7 Increasing water supplies through the use of nontraditional water sources .................... 13
1.7.1 Seawater and brackish water ................................................................................... 13
1.7.2 Treated municipal wastewater ................................................................................. 15
1.7.3 Storm water captured from developed areas .......................................................... 18
2 Technologies that improve efficiency in water distribution systems ......................................... 19
2.1 Leak detection technologies .............................................................................................. 19
2.2 Pipe condition assessment technologies ........................................................................... 23
2.3 Pressure management technologies ................................................................................. 30
2.4 Metering technologies ....................................................................................................... 32
3 Technologies to tap nontraditional water sources ..................................................................... 38
3.1 Physical separation technologies ....................................................................................... 40
3.1.1 Membrane-based physical separation technologies ............................................... 40
3.1.2 Non-membrane physical separation technologies .................................................. 44
3.2 Chemical transformation technologies .............................................................................. 48
3.3 Biological transformation technologies ............................................................................. 51
4 Larger utilities, utilities serving water-stressed areas, and utilities that also manage wastewater or storm water are more likely to treat nontraditional sources of water ................. 56

Technology Assessment GAO-16-474 ii
4.1 Treatment of nontraditional water sources varies by region, utility size, water stress, and whether the utility manages wastewater or storm water services .................................. 56
4.1.1 Larger utilities are more likely to treat nontraditional water sources ..................... 58
4.1.2 Utilities serving water-stressed areas are more likely to treat nontraditional water sources ................................................................................................................. 59
4.1.3 Utilities that also manage wastewater or storm water services are more likely to treat nontraditional water sources ...................................................................... 61
4.2 Financial, regulatory, and other challenges may influence the treatment of nontraditional water sources for municipal use ............................................................... 63
5 Concluding observations ............................................................................................................. 68
6 Agency and expert comments ..................................................................................................... 70
Appendix I – Objectives, scope, and methodology ........................................................................ 71
Appendix II: Expert participation .................................................................................................... 83
Appendix III: GAO contact and staff acknowledgments ................................................................. 85
Related GAO products .................................................................................................................... 86

Technology Assessment GAO-16-474 iii
Abbreviations
AMI advanced metering infrastructure
AMR automated meter reading
AOP advanced oxidation process
BEST Biohydrochemical Enhancement for Streamwater Treatment
CCTV closed-circuit television
DMA district metered area
ED electrodialysis
EDR electrodialysis reversal
EPA U.S. Environmental Protection Agency
GIS geographic information system
LLNL Lawrence Livermore National Laboratory
MF microfiltration
NAS National Academy of Sciences
NDMA N-nitrosodimethylamine
NF nanofiltration
NRC National Research Council of the National Academies
O&M operation and maintenance
ReNUWIt Re-inventing the Nation’s Urban Water Infrastructure
RO reverse osmosis
SCADA supervisory control and data acquisition
SDWIS Safe Drinking Water Information System
TDS total dissolved solids
TRL technology readiness level
UF ultrafiltration
USGS U.S. Geological Survey
UV ultraviolet
WaSSI Water Supply Stress Index

Technology Assessment GAO-16-474 1
441 G St. N.W. Washington, DC 20548
1 Letter
April 29, 2016
The Honorable Raul Grijalva Ranking Member Committee on Natural Resources House of Representatives
The Honorable Alan Lowenthal Ranking Member Subcommittee on Energy and Mineral Resources Committee on Natural Resources House of Representatives
The Honorable Edward J. Markey United States Senate The Honorable Peter DeFazio House of Representatives
Of all municipal services, providing a safe and adequate supply of water is perhaps the most essential. Recent reports about lead-contaminated drinking water in Flint, Michigan and ongoing drought in several regions of the United States highlight some of the challenges water utilities are facing. While water covers about 70 percent of Earth’s surface, accessible freshwater makes up less than 1 percent of the planet’s total water. This vital resource is not always available when and where it is needed, in the amount or quality desired, or at a reasonable cost. For example, in 2014, precipitation averaged over 30 inches throughout the 48 contiguous states, or about 14 times the U.S. Geological Survey’s (USGS) most recent estimate of daily consumptive use—the amount of freshwater withdrawn from, but not immediately returned to, a usable water source.1 However, that precipitation was not equitably distributed and while much of the nation received near-average precipitation in 2014, several locations had either their driest or wettest calendar year. In fact, by October 27, 2015, the U.S. Drought Monitor was reporting that over 30 percent of the nation was experiencing some degree of drought, which affected approximately 32 percent of the nation’s population.2 While drought conditions across the nation have improved, the U.S. Drought Monitor still reported that as of February 9, 2016, 1USGS fully defines consumptive use as water that has evaporated, transpired (e.g., from vegetation), incorporated into products or
crops, consumed by humans or livestock, or otherwise removed from the immediate water environment. These data are from 2010.
2Nationwide drought data are reported weekly by the U.S. Drought Monitor, which is produced in partnership between the National Drought Mitigation Center at the University of Nebraska-Lincoln, the U.S. Department of Agriculture, and the National Oceanic and Atmospheric Administration. In addition, the U.S. Drought Monitor uses the National Aeronautics and Space Administration’s remote sensing data to develop these weekly reports.

Technology Assessment GAO-16-474 2
approximately 15 percent of the contiguous United States was experiencing some degree of drought. Moreover, drought still covers the majority of some states, such as California, where almost all of the state was under some level of drought and 38 percent of the state was under the highest level of “exceptional drought.”3
In times of shortage, competing demands for freshwater—for purposes including irrigation, power production, municipal water supplies, and supporting aquatic life—increase, heightening conflicts over limited resources. As we reported in May 2014, freshwater shortages are expected to continue into the future.4 In particular, 40 of 50 state water managers we surveyed expected shortages in some portion of their states under average conditions in the next 10 years, setting the stage for continued competition among users in the future.
In view of current and potential future freshwater scarcity in the United States, you asked us to conduct a technology assessment of current and developing technologies that could reduce water use and address water scarcity in the energy sector, municipal water sector, and agricultural sector.5 In partial response to that request,6 this report focuses on the municipal water sector and discusses (1) technologies that could reduce demand on freshwater supplies by improving distribution system efficiency; (2) technologies that could increase water supplies by using nontraditional water sources; and (3) locations and types of water utilities where these technologies are most commonly adopted.
To address these objectives, we reviewed key reports and scientific literature describing current and developing technologies and interviewed agency officials, water utility operators, industry organizations, researchers, and other experts. We used recommendations from drinking water experts to select four large municipal water utilities facing different water-related challenges and using technology in innovative ways, and then conducted site visits to discuss their experiences with researching, testing, and deploying relevant technologies. We also visited two national laboratories and a national desalination research facility to discuss technologies in these areas, including challenges in developing and commercializing such technologies. Based on information we obtained, we assessed the maturity of each technology on a scale of 1 to 9 using technology readiness levels (TRL)—a standard metric for assigning technological maturity.
3The U.S. Drought Monitor uses five categories to classify drought severity. The categories, ranging from least to most severe, are
“abnormally dry,” “moderate drought,” “severe drought,” “extreme drought,” and “exceptional drought.”
4GAO, Freshwater: Supply Concerns Continue, and Uncertainties Complicate Planning, GAO-14-430 (Washington, D.C.: May 20, 2014).
5For the purposes of this report, the municipal water sector is comprised of municipal water utilities, their source waters, and their treatment and distribution infrastructure. A municipal water utility is an entity that distributes potable water to domestic, commercial, and industrial customers in their service area. These entities also provide water for public uses such as firefighting, street washing, and maintaining public parks and swimming pools. USGS refers to this sector as the public supply.
6In August 2015, we issued another technology assessment in partial response to this request: GAO, Water in the Energy Sector: Reducing freshwater use in hydraulic fracturing and thermoelectric power plant cooling, GAO-15-145 (Washington, D.C.: Aug. 7, 2015).

Technology Assessment GAO-16-474 3
In addition, we collaborated with the National Academies to convene a two-day meeting with 19 experts on current and developing water technologies. These experts were selected from state and federal government agencies, academia, water utilities, and industry consultants, with expertise covering all significant areas of our review. We continued to draw on the expertise of these individuals throughout our study and, consistent with our quality assurance framework, we provided them with a draft of our report and solicited their feedback, which we incorporated as appropriate. Other experts, including agency officials and representatives of water utilities, also reviewed our draft and provided input.
We also conducted a nationally representative survey of 1,303 water utilities. We used the Environmental Protection Agency (EPA) Safe Drinking Water Information System (SDWIS) database as of May 2015 to draw a stratified sample based on the population served by the utility and its water stress level.7 Water stress for each utility was determined using the U.S. Forest Service’s Water Supply Stress Index (WaSSI).8 We collected data on technologies used to improve water distribution efficiency, technologies used to treat nontraditional water sources, challenges they may have faced when considering the use of nontraditional water sources, and basic characteristics of their infrastructure, operations, and service area. We also analyzed the survey results against utility characteristics such as utility size, water stress, and household income to identify patterns in technology adoption. See appendix I for additional details on our survey scope and methodology. This report does not contain all the results from the survey. The survey and a more complete tabulation of results can be viewed at GAO-16-588SP.
We limited the scope of our review to technologies that can be deployed at the utility scale for specific aspects of distribution system efficiency9 (i.e., leak detection, pressure management, metering, and pipe condition assessment) or for the treatment of seawater, brackish water, treated municipal wastewater, or storm water captured from developed areas. We did not assess all available or developing technologies. For example, we did not include decentralized technologies such as building-scale water reuse systems, household appliances and fixtures, individual building service lines, or interior plumbing. We also did not include typical pre- and post-treatment steps or modifications to existing technologies such as new or modified membranes for use in reverse osmosis (RO). In addition, we did not include the many nontechnology approaches a utility may consider to address water scarcity, such as rate
7EPA categorizes the utilities we sampled as ‘community water systems,’ defined as public water systems that supply water to the
same population year-round.
8The WaSSI is calculated as the ratio of the total water demand—or withdrawals—in a given watershed to the total water supply from surface and groundwater sources. No interbasin transfers or water storage reservoirs are included in the model. We believe this makes the WaSSI an excellent measure of water stress for arid regions because the resulting high WaSSI value accurately indicates that such regions are naturally water-stressed, rather than masking the natural water stress level by including imported or stored water. In addition, the model assumes that the water supply from groundwater sources is equal to the total groundwater withdrawals and that withdrawals can be made perpetually at the same levels. Note that the WaSSI value we used for the purposes of stratification differs slightly from the value used in our final analysis; please see appendix I for more information.
9For purposes of this report, the distribution system includes utility-owned pipes, valves, and other equipment downstream of the treatment facility but upstream of customers.

Technology Assessment GAO-16-474 4
structures and pricing strategies, customer rebates or incentives, or water purchases from another entity. Appendix I provides additional details on our scope and methodology.
We conducted our work from July 2014 to April 2016 in accordance with all sections of GAO’s quality assurance framework that are relevant to technology assessments. The framework requires that we plan and perform the engagement to obtain sufficient and appropriate evidence to meet our stated objectives and to discuss any limitations to our work. We believe that the information and data obtained, and the analysis conducted, provide a reasonable basis for the findings and conclusions in this product.

Technology Assessment GAO-16-474 5
1 Background1.1 The hydrologic cycle
Water is a renewable resource—the water that was here long ago is still here today, continuously moving back and forth between the earth’s surface and atmosphere through the hydrologic cycle, as figure 1 shows. In this cycle, evaporation occurs when the sun heats water in rivers, lakes, or the oceans, turning it into vapor that enters the atmosphere and forms clouds.
When the water returns to earth as rain, it runs into streams, rivers, lakes, and finally the ocean. Some of the rain soaks below the earth’s surface into aquifers composed of water-saturated permeable material such as sand, gravel, and soil, where it is stored as groundwater. The replenishment rates for these sources vary considerably—water in rivers is completely renewed every 16 days on average, but the renewal periods for groundwater and the largest lakes can extend to hundreds or thousands of years.
Figure 1 The Hydrologic Cycle

Technology Assessment GAO-16-474 6
1.2 Water withdrawals and groundwater overdraft
According to USGS, in 2010 (the most recent data available) the municipal sector accounted for about 12 percent of water withdrawals in the United States; thermoelectric power (45 percent) and agricultural irrigation (33 percent) withdrew much more water.10 The percentages vary dramatically from state to state. For example, irrigation accounted for more than half of the water withdrawn in 16 mostly western and Midwestern states, including California. Surface water sources such as lakes, rivers, and streams provided about 63 percent of the water withdrawn to meet municipal needs and groundwater provided the remaining 37 percent.
When surface water supplies have been over-allocated—that is, more water has been promised to competing users than the source can supply—or are reduced by drought conditions, many users rely on additional groundwater withdrawals to make up the difference. Groundwater has historically been viewed as a limitless supply of freshwater. However, groundwater is a finite resource that can be—and often is—drawn down at an unsustainable rate, a condition known as groundwater overdraft.11 In addition to 10U.S. Geological Survey, Estimated Use of Water in the United
States in 2010, Circular 1405 (Reston, VA: 2014).
11The 2013 California State Water Plan defines overdraft as the condition in which the amount of water withdrawn from a groundwater basin by pumping exceeds the amount of water that recharges the basin over a period of years under average water supply conditions. Overdraft can be characterized by groundwater levels that decline over a period of years and never fully recover, even in wet years. See California Department of Water Resources, California Water Plan Update 2013: Investing in Innovation and Infrastructure, Bulletin 160-13 (Sacramento, CA: Oct. 2014).
producing long-term declines in aquifer levels, groundwater overdraft can lead to other serious consequences such as saltwater intrusion into formerly freshwater sources and land subsidence—that is, sinking or settling of land. For example, the National Academy of Sciences has reported that more than 80 percent of the identified land subsidence in the United States is a consequence of our use of groundwater.12 A recent study funded by the California Department of Water Resources noted that parts of the San Joaquin Valley subsided more than 13 inches in just 8 months, from May 2014 to January 2015.13 Land subsidence can damage infrastructure such as roads, pipelines, and aqueducts, and is sometimes irreversible, causing a permanent loss of groundwater storage capacity.
Groundwater pumping has also been identified as the primary cause of saltwater intrusion into groundwater in coastal regions of North America, which has affected ground water supplies in areas such as Cape May County, New Jersey; southeastern Florida; and Monterey, Ventura, Orange, and Los Angeles Counties in California.14 In Cape May County, saltwater intrusion has forced the closure of at least 20 public- and industrial-supply wells and more than 100 domestic-supply wells since the 1940s. While California state water officials noted that the state has
12National Academy of Sciences, Prospects for Managed
Underground Storage of Recoverable Water (Washington, D.C.: 2008).
13California Department of Water Resources, Progress Report: Subsidence in the Central Valley, California. The study was carried out in part under contract with the National Aeronautics and Space Administration.
14See P.M. Barlow and E.G. Reichard, “Saltwater Intrusion in Coastal Regions of North America,” Hydrogeology Journal, vol. 18 (2010).

Technology Assessment GAO-16-474 7
reaped many economic benefits from extensive groundwater overdraft, they acknowledged that water managers are being forced to critically evaluate the long-term costs and risks of unsustainable groundwater pumping versus the short-term value it provides.15
Groundwater overdraft also accelerates the long-term conversion of fresh groundwater to seawater, further exacerbating freshwater scarcity and contributing to sea level rise. In communities relying on groundwater, the typical water cycle begins when groundwater is pumped from wells, treated, and distributed to customers. After customers use the water for household purposes, much of that water is returned to a wastewater treatment facility where it is treated and then discharged to a surface water body such as the ocean or a river that eventually flows to the ocean, completing the conversion of fresh groundwater to seawater. While the exact amount of the groundwater contribution to sea level rise is unknown, some researchers have used modeling to estimate that groundwater pumping is responsible for 30 to 60 percent of the observed rise in sea level over the second half of the 20th century.16
15California Department of Water Resources, California Water
Plan Update 2013, 3-47.
16For additional details on the models and underlying assumptions, see Y. N. Pokhrel, N. Hanasaki, P. J-F. Yeh, T. J. Yamada, S. Kanae, and T. Oki, “Model Estimates of Sea-Level Change Due to Anthropogenic Impacts on Terrestrial Water Storage,” Nature Geoscience, Vol.5 (2012) and Y. Wada, L. P. H. van Beek, F. C. S. Weiland, B. F. Chao, Y.-H. Wu, and M. F. P. Bierkens, “Past and Future Contribution of Global Groundwater Depletion to Sea-Level Rise,” Geophysical Research Letters, Vol. 39 (2012).
1.3 Municipal water utilities According to EPA, nearly 53,000 municipal water utilities provide drinking water—and, in some cases, wastewater and storm water services—to residential, commercial, and industrial customers.17 Compared to the electric utility industry, which operates on an inter-connected grid system with approximately 3,300 providers, the municipal water sector is more dispersed and subject to localized control, ownership, and additional regulation and requirements. Municipal water utilities may be owned by local government, private nonprofit, or private for-profit entities.
Water utilities that rely on surface water generally draw water from a source, treat it at a centralized facility, and then send it through a distribution system to customers in their service area, although some utilities distribute water that they purchase from a wholesaler or other supplier. Utilities that rely on groundwater may not need to do any treatment, depending on the quality of their source water. After the water is used by customers, the resulting wastewater is collected and delivered to a centralized facility for treatment. While a small percentage of the treated wastewater is recycled for additional use, most of the treated wastewater is then discharged to the environment.18 See figure 2 for an overview of this cycle.
17EPA categorizes these utilities as ‘community water systems,’
defined as public water systems that supply water to the same population year-round.
18Some of the water that was distributed to customers is used for purposes such as landscape irrigation and thus is not later collected as wastewater. In addition, in 2012 EPA reported that 7 to 8 percent of treated municipal wastewater was recycled. See Environmental Protection Agency, 2012 Guidelines for Water Reuse, EPA/600/R-12/618 (Washington, D.C.: Sept. 2012) for additional details.

Technology Assessment GAO-16-474 8
Figure 2 The municipal water cycle
Drinking water treatment processes vary significantly from one utility to another and sometimes seasonally, depending on the quality and type of source water, water temperature, size of the utility, state regulations, and customer preferences. Utilities may choose different approaches based on cost, available space, public perception, technical familiarity, and other factors. The series of treatment steps used by a given utility is often called a ‘treatment train.’ A utility may need to design its treatment train to remove many contaminants including debris; dirt and other suspended particles; viruses, bacteria, and other pathogens; lead and other metals that could affect public health; radionuclides; and substances such as sulfur and iron that can affect the taste, odor, or color of the water.
Utilities and regulators are also starting to consider how to address certain organic compounds such as pharmaceuticals and personal care products (sometimes referred to as “contaminants of developing concern”) that can end up in the water supply.
Wastewater may go through as many as three treatment stages—primary, secondary, and advanced treatment, also called tertiary treatment—before water is discharged. After preliminary screening and settling, primary treatment removes solids from the wastewater through sedimentation. Most wastewater also goes through secondary treatment to remove organic matter and suspended solids through physical and biological treatment processes, and in about 30 percent of wastewater treatment facilities,

Technology Assessment GAO-16-474 9
an advanced treatment stage is used to remove additional contaminants. An additional disinfection stage is generally used to ensure destruction of pathogens such as bacteria and viruses before the water is discharged.
1.4 Legal framework governing municipal water services
Federal Statutes. EPA establishes primary drinking water standards (i.e., maximum contaminant limits) for specified contaminants under the Safe Drinking Water Act19 and governs the treatment and discharge of wastewater through the Clean Water Act.20 EPA generally allows each water utility to choose among available technologies as long as the utility is able to achieve the specified water quality standards. Additionally, state and local requirements can be added to these if not in conflict with federal statute.
Water Rights. Water rights can have a significant impact on the availability and use of municipal water supplies, particularly during a drought. State laws relating to the allocation and use of water can generally be traced to two basic doctrines: the riparian doctrine (generally used in the eastern United States) and the prior appropriation doctrine (dominant in the western United States).21
19Pub. L. No. 93-523, 88 Stat. 1660 (Dec. 14, 1974), codified as
amended at 42 U.S.C. §§300f-300j-26.
20The Federal Water Pollution Control Act Amendments of 1972, Pub. L. No. 92-500, § 2, 86 Stat. 816 (Oct. 18, 1972), codified as amended at 33 U.S.C. §§ 1251-1388.
21While these two doctrines are the most common, some states use combinations of these or other approaches. For more details, see GAO-14-430.
Under the riparian doctrine, water rights are linked to land ownership—owners of land bordering a waterway have a right to use the water that flows past the land for any reasonable purpose; all landowners have an equal right to use the water and no one gains a greater right through prior use. In contrast, under the prior appropriation doctrine, parties who obtain water rights first generally have seniority for the use of water over those who obtained rights later. When there is a water shortage, under the prior appropriation doctrine shortages fall predominantly on those who last obtained a legal right to use the water. In much of the western United States, agricultural users hold the most senior water rights; as a result, municipal supplies are often the first to be cut during a drought.
1.5 Supply, demand, and economics
Water scarcity occurs when the demand for water in a given area approaches or exceeds available water supplies. A water utility facing scarcity may attempt to address it by reducing its demand on existing water supplies, increasing its water supplies, or both. In either case, a utility can choose from a variety of technologies or non-technology approaches. For example, a utility could try to reduce demand on its existing water supplies through non-technology approaches such as educating customers about ways to conserve water, instituting water rationing measures, or implementing pricing tools. Reductions could also be achieved through technologies, such as installing acoustic sensors to detect hidden leaks that could be wasting water. Similarly, a utility may be able to increase supplies through non-technology approaches such as purchasing additional rights to a

Technology Assessment GAO-16-474 10
water source or by using advanced technologies to treat nontraditional water sources such as seawater or brackish water. Various empirical studies have found that the economic value of water varies widely across different uses, offering the potential for water transfers between users (i.e., cross-sectoral transfers) in a way that shifts the water to higher value uses. For example, given the technological advancements in irrigation, farmers have been able to maintain productivity while reducing water use, allowing utilities to purchase water from farmers to address their supply need.22
Utilities generally assess the options available to them based on cost, availability, and other factors, and select one or more that will meet their needs.23 In comparing the costs of alternatives, utilities must consider not only
22An example of the utilization of efficient irrigation technology
in a cross-sectoral arrangement is the agreement between the Metropolitan Water District of Southern California and the Imperial Irrigation District. According to the arrangement, the Metropolitan Water District paid the Imperial Irrigation District to implement various water saving technologies, resulting in annual average savings of more than 34 billion gallons of irrigation water that was transferred to the Metropolitan Water District. The agreement also included payment for indirect program costs and mitigation of direct and indirect impacts caused by the loss of farmland.
23The Los Angeles Department of Water and Power water management plan of 2010 provides an example of the way a water utility may consider various options for reducing demand and increasing supplies. In the plan, the department considered options that included customer conservation, importing water from other locations using the California Aqueduct, developing groundwater resources, various methods of storm water capture, purchases of water rights (water transfers), and desalination of seawater. The department estimated the cost of conservation at $200 to nearly $2,800 per million gallons of water saved. In comparison, the cost of additional supplies varied widely. Estimated costs for storm water capture ranged from nearly $200 to more than $900 per million gallons, while the cost of seawater desalination was estimated from about $3,900 to more than $6,000 per million gallons. See City of Los Angeles Department of Water and Power, 2010 Urban Water Management Plan (Los Angeles, CA: May 2011).
up-front costs, such as capital costs for constructing a treatment facility, but also other lifecycle costs including operation and maintenance (O&M) costs. The costs, availability, and trade-offs between these options can vary considerably from one utility to another and there may be no clear-cut answer to which options a utility should pursue to address water scarcity.
1.6 Reducing demand on water supplies through improving distribution system efficiency
There are many technologies water utilities can use to reduce demand on water supplies by increasing the efficiency of their distribution system. Some technologies have been used for decades, others are now being widely adopted, and some that can be merged together to form the backbone of a smart water system are just developing. Because newer technologies are designed to help a utility reduce the amount of water lost in the distribution system and the pressure at which water is pumped, the reduction in energy spent treating and pumping the water and the reduction in treatment chemicals can offer significant cost savings. For the purposes of this report, we grouped water distribution efficiency technologies into four main categories: leak detection, pipe condition assessment, pressure management, and metering.
1.6.1 Leak detection and pipe condition assessment
Leak detection and pipe condition assessment technologies help a water utility determine where water is escaping, or where it might be in the near future. An estimated 2.5 trillion

Technology Assessment GAO-16-474 11
gallons—16 percent—of water withdrawn for municipal use is lost each year to distribution system leaks before reaching the customer, a significant amount in an era of freshwater scarcity.24 The cost to produce and pump this water is wasted if the water does not reach the end user. Although large water main breaks capture public attention, most leaks in utility distribution systems—including low flow background leaks such as from fittings, air valves, or hydrants, as well as higher flow breaks—go undetected because the pipes are located underground. Such leaks will continue to persist until they are discovered during a leak detection survey or when they become large enough to surface.
A district metered area (DMA) is one approach to check for signs of leakage by monitoring water flow through a distribution network. A DMA is created by installing flow meters at strategic points throughout the distribution system, with each meter recording the water flowing into a discrete district which has a defined boundary. Normally a DMA is established for a small section of a water distribution system (e.g., between 500 and 3000 connections) that can be isolated by closing valves so that it is fed by only a single or just a few mains outfitted with flow meters. The metered water flowing into the DMA is compared with metered customer use, and the difference is the water loss for the DMA. A night flow analysis (corresponding to minimum consumption) can be used to distinguish district leakage
24Calculation is based on Thornton et al. estimate that 16
percent of treated water is lost to distribution system leaks and USGS estimates of the amount of water withdrawn for municipal use. See J. Thornton, R. Sturm, and G. Kunkel, “Water Loss Control Manual (2nd Edition),” McGraw-Hill, (2008); and U.S. Geological Survey, Estimated Use of Water in the United States in 2010.
from customer consumption.25 This can be an effective way to reduce the duration of unreported leaks. Continuous monitoring of night flows also provides information that can be used to direct leak location and repair or replacement activities to low performing parts of the network. Constantly monitored DMAs also provide information on background leakage volumes which in turn can be used as a pipe condition assessment tool as opposed to doing field surveys.26
Pipeline condition also influences distribution system efficiency. Corrosion buildup and blockage within pipes cause friction, which increases the pressure and energy needed to pump water through the pipes. Weakening and corrosion of pipeline materials as pipes age and stress on pipes from excessive or transient water pressure can also lead to costly pipe failures. EPA estimates that the United States would need to spend $384 billion dollars over the next 20 years to replace all failing water infrastructure.27 For example, according to EPA, 240,000 water main breaks occur every year in the United States.28 The impact of these breaks is high
25Because leakage is most accurately determined when the
customer consumption is a minimum, which normally occurs at night, this principle of minimum night flow has been recommended and practiced.
26One expert told us that this technique does not account for customer side leaks or intentional nighttime customer water use. The accuracy of the DMA analysis is greatly improved with the incorporation of reading customer meters at the same time as the distribution flow meters. This is usually accomplished with an automatic meter reading system.
27Environmental Protection Agency, Drinking Water Infrastructure Needs Survey and Assessment: Fifth Report to Congress, EPA 816-R-13-006 (Washington, D.C.: April 2013).
28According to EPA, assuming every broken pipe needs replacing, the cost over the coming decades could exceed $1 trillion. Environmental Protection Agency, Promoting Technology Innovation for Clean and Safe Water: Water

Technology Assessment GAO-16-474 12
due to direct costs associated with repair, water loss, property damage, and liability; indirect costs associated with supply interruption, increased deterioration of surrounding infrastructure and property, and decreased fire-fighting capacity; and social costs associated with water quality degradation due to contaminant intrusion, disruption of traffic and business, and decreases in public trust.
There is no one-size-fits-all solution for detecting leaks and monitoring pipeline condition. The pipes in a typical distribution system are composed of a variety of materials (e.g., steel, concrete, asbestos cement, cast iron, ductile iron, or polyvinyl chloride).29 In addition, they are typically connected at different times using different installation practices, and have different surrounding soil conditions. Therefore, the monitoring technology that may be optimal for one particular section of the system might not be effective in another locale.
Utilities often use a process known as asset management to prioritize and schedule infrastructure inspection, repair, and replacement activities. EPA defines asset management as a framework for maintaining a desired level of service at the lowest lifecycle cost. GAO recently reviewed rural water utilities’ use of asset management.30
Technology Innovation Blueprint—Version 2, EPA 820-R-14-006 (Washington, D.C.: Apr. 2014).
29Although lead pipes have received considerable media attention as a result of the recent situation in Flint, Michigan, lead is generally found in the service lines that run from water mains to individual houses or in the interior plumbing of houses rather than in the larger distribution pipes that are the focus of our work.
30GAO, Water Infrastructure: EPA and USDA are Helping Small Water Utilities with Asset Management; Opportunities Exist to
Additional details on this management approach are beyond the scope of this report.
1.6.2 Pressure management
Some utilities monitor pressure in real-time, use software programs to detect anomalies, and receive alerts that allow rapid adjustments in pressure. Indeed, pressure management has been recognized as a key tool for increasing distribution system efficiency. Every system has residual background leakage—tiny leaks at pipe joints and service connections that cannot be detected acoustically. These tiny leaks can be numerous and widespread. Water loss through these leaks generally increases as water pressure within the system increases, so maintaining the pressure at optimal levels can help a utility reduce water loss. In addition, sudden variations in pressure or routinely high pressures can also stress pipes and cause them to break. Pressure management can help reduce the frequency and severity of pipe breaks, which increases infrastructure lifetime. Furthermore, fire departments are concerned about delivering water with sufficient pressure during fires. Thus, municipal water delivery systems are designed to maintain a certain minimum pressure level (e.g., 20 pounds per square inch (psi) or greater) during fire flow.31 However, as a result, during the off-peak periods (which are much longer than the peak periods) the system pressure builds to levels that are much higher than this minimum
Better Track Results, GAO-16-237 (Washington, D.C.: Jan. 27, 2016).
31The American Water Works Association defines the required fire flow as “the rate of water flow, at a residual pressure of 20 psi and for a specified duration that is necessary to control a major fire in a specific structure.”

Technology Assessment GAO-16-474 13
level. Various pressure management technologies are used to mitigate this issue such as the use of pressure-reducing valves that automatically reduce pressure to a designated lower level and hold it constant. In addition, one expert told us that hydraulic modeling can generally be used to evaluate the effectiveness of the various pressure management strategies, predict locations of leaks in a water distribution system, and select the best alternative.32 The hardware used to measure and control pressure is well developed.
1.6.3 Metering
Metering the amount of water drawn, treated, distributed, and consumed is now widely recognized as a best management practice for water utilities. Water meters can be an effective tool for utilities to charge customers for the actual amount of water used, detect breaks and leaks in the distribution system, and generate data to inform future needs. Water metering technology has evolved over the past 100 years from mechanical meters to meters with solid state components, such as LED displays and electromagnetic and acoustic measuring elements. Meter reading technology has also evolved considerably in the last three decades, transitioning from labor intensive manual reading to handheld readers, then to automated meter reading (AMR), and most recently to two-way network communication technologies known as advanced metering infrastructure (AMI) that use networked devices working in a sensor network environment to transmit usage data to a
32Additional details about hydraulic modeling are beyond the
scope of our report.
central receiving station. Some utilities are now adopting AMI to monitor acoustic leak detection devices, system pressure, and water quality; better determine timing of water use and demand; and improve operational cost, among other benefits. One expert told us that the AMI customer interfaces offer significant water conservation and customer service benefits, which are often a main driver for AMI adoption in water-stressed areas. Additional details on this use of AMI are beyond the scope of our report.
1.7 Increasing water supplies through the use of nontraditional water sources
In addition to various options for reducing demand on water supplies, utilities could address freshwater scarcity by increasing their water supplies through treating nontraditional sources such as seawater, brackish water, recycled municipal wastewater, or storm water captured from developed areas. Treating such water for potable use—that is, suitable for drinking and cooking—or for nonpotable use is becoming more economically feasible as technology improves and traditional freshwater supplies grow increasingly scarce.
1.7.1 Seawater and brackish water
Seawater is an essentially unlimited water supply when viewed within the context of the global water cycle, and brackish water is abundant in many areas of the United States. For example, a 2003 study estimated that Texas has an estimated 880 trillion gallons of

Technology Assessment GAO-16-474 14
brackish groundwater,33 an amount that—if fully accessible—could provide municipal water in Texas at the current rate for about six centuries.34 However, both seawater and brackish water contain levels of dissolved salts and other substances that make them too saline for drinking and must be treated to reduce the levels of these substances—a process known as desalination.35 Salinity is expressed as the concentration of total dissolved solids (TDS) in the water as measured in milligrams per liter (mg/L). According to EPA, water is considered acceptable for drinking if it has less than 500 mg/L TDS. The salinity of seawater ranges from 33,000–37,000 mg/L. Brackish water, which occurs naturally in many groundwater aquifers and in surface sources such as estuaries and some lakes, generally contains 1,000–10,000 mg/L TDS.
The high cost and energy requirements of desalination have historically limited its use to locations where inexpensive energy was readily available or freshwater was scarce. However, recent advances in technology, in combination with the increasing cost and reduced availability of other water sources, have made desalination competitive with other alternatives in some locations.
33LBG-Guyton Associates, Brackish Groundwater Manual for
Texas Regional Water Planning Groups, prepared for the Texas Water Development Board (Austin, TX: February 2003).
34Calculation based on data from U.S. Geological Survey, Estimated Use of Water in the United States in 2010, 19.
35The term ‘salt’ is commonly used to refer to sodium chloride (NaCl), also known as table salt. However, a salt is any chemical compound made up of oppositely charged ions such as sodium (Na+), calcium (Ca2+), magnesium (Mg2+), chloride (Cl-), nitrate (NO3
1-), phosphate (PO43-), and sulfate (SO4
2-) ions.
The most common desalination technologies fall into two categories: membrane-based processes and thermal processes.36 Membrane-based processes concentrate dissolved salts and other undesirable contaminants on one side of a membrane while water is collected on the other side. Thermal methods heat saline water to convert the water to steam while leaving the dissolved salts behind, and then collect and condense the steam as freshwater. Because thermal processes are energy-intensive, they are most commonly used in areas where energy is plentiful or in industrial settings where waste heat from other processes can be harnessed to drive the desalination. In practice, desalination in the United States is notably different from worldwide desalination practices, as shown in table 1. Specifically, U.S. desalination facilities are much more likely to use membrane-based methods and to treat brackish water rather than seawater.
36A small amount of additional desalination capacity is provided
by ion exchange and hybrid methods.

Technology Assessment GAO-16-474 15
United States Worldwide
Percentage of total desalination capacity treated using: Membrane-based methods 96 68 Thermal methods 3 30 Other (e.g., ion exchange and hybrid methods) 1 2
Percentage of total desalination capacity used to treat:
Seawater 8 59 Brackish water 77 22 Other (e.g., rivers, wastewater, pure water) 15 19
Percentage of capacity intended for municipal use 67 61 Source: GAO analysis of data from the National Research Council (NRC) of the National Academies (see NRC, Desalination: A National Perspective (Washington, D.C.: 2008) and Global Water Intelligence (see Tom Pankratz, IDA Desalination Yearbook 2013-2014, for Global Water Intelligence (Oxford, U.K.). | GAO-16-474
Table 1 Comparison of desalination practices in the United States and worldwide
In some cases, opposition to desalination coupled with the high cost and energy requirements of this approach can complicate or delay its adoption by municipalities. For example, in some parts of the country, there is significant resistance to seawater desalination due to environmental concerns including (a) the potential for ocean intakes to kill aquatic organisms, (b) issues with concentrate management (i.e., how to dispose of the concentrate or “brine” that is a byproduct of desalination), and (c) the energy intensity of common membrane and thermal technologies. Such opposition has often delayed the permitting process and can significantly increase the capital costs for a seawater desalination project. O&M costs for desalination are also often higher than other water treatment alternatives, largely due to the amount of energy needed to drive the process.
Because O&M costs are generally correlated with the salinity of the source water, it is generally more expensive to treat seawater than brackish water. However, utilities considering the use of brackish water can still face considerable hurdles despite its generally
lower costs of treatment. For example, given that most desalination occurs in inland areas, concentrate management can be a significant challenge. In fact, concentrate management expenses in some locations can increase O&M costs to the point that they exceed those of seawater desalination. In addition, high demand for brackish groundwater can create many of the same challenges facing regions that draw heavily from fresh groundwater aquifers, including long-term aquifer depletion, land subsidence, and declining water quality.
1.7.2 Treated municipal wastewater
The use of highly treated municipal wastewater for beneficial purposes is known by various names including water reuse, reclamation, or recycling. Water reuse could offer significant untapped water supplies, particularly in coastal areas facing water shortages. For example, in a 2012 report on municipal wastewater reuse, the National Research Council of the National Academies (NRC) estimated that U.S. municipalities discharged approximately 12 billion gallons of treated municipal wastewater each day into

Technology Assessment GAO-16-474 16
coastal waters.37 They estimated that reuse of these coastal discharges could directly augment available water sources by providing the equivalent of 27 percent of the municipal supply. Another 20 billion gallons are discharged to inland locations. While reuse of inland discharges has the potential to affect the water supply of downstream users and ecosystems, reuse of at least some of this volume could also be beneficial.
Despite the potential significance of this water supply, EPA reported in 2012 that only 7 to 8 percent of municipal wastewater was being intentionally reused in the United States.38 As shown in figure 3, several other countries had much higher reuse rates, including Saudi Arabia, Singapore, and Israel.
Figure 3 Comparison of municipal wastewater reuse percentages
Although negative public perception has often hampered intentional water reuse in the United States, many communities already practice de facto reuse because their drinking water intake is located downstream from 37National Research Council of the National Academies, Water
Reuse: Potential for Expanding the Nation’s Water Supply Through Reuse of Municipal Wastewater (Washington, D.C.: 2012).
38Environmental Protection Agency, 2012 Guidelines for Water Reuse, 3-1.
another community’s wastewater discharge point. For some communities, a large fraction of their drinking water originated as treated wastewater from upstream communities, especially under low-flow conditions.39 Municipalities are increasingly recognizing the value of reusing this highly treated water for beneficial purposes rather than disposing of it after a single use. EPA has reported that at least 32 states have regulations in place to allow some forms of reuse, with Florida, California, Texas, and Arizona as the largest users.40 Several additional states may allow reuse on a case-by-case basis.
Utilities have three main options for intentional reuse of treated municipal wastewater: nonpotable reuse, indirect potable reuse, and direct potable reuse. Nonpotable reuse—that is, reuse for purposes other than drinking or cooking—is by far the most common. In its 2012 report on municipal wastewater reuse, NRC reported that nonpotable uses accounted for at least 79 percent of water reuse in Florida and at least 67 percent in California.41 Nonpotable water can be used for many purposes including landscape and agricultural irrigation, habitat restoration, car washing, street cleaning, toilet flushing in nonresidential settings such as office buildings or parks, and industrial uses such as in cooling towers and as boiler feedwater. Use of nonpotable water
39For example, see Jacelyn Rice, Amber Wutich, and Paul
Westerhoff, “Assessment of De Facto Wastewater Reuse between 1980 and 2008,” Environmental Science & Technology, vol. 47 (2013) and Jacelyn Rice, Steve H. Via, and Paul Westerhoff, “Extent and Impacts of Unplanned Wastewater Reuse in US Rivers,” Journal: American Water Works Association, vol. 107, issue 11 (2015).
40Environmental Protection Agency, 2012 Guidelines for Water Reuse, 87.
41National Research Council, Water Reuse, 50.

Technology Assessment GAO-16-474 17
for such purposes can reduce the demand on potable water supplies. Further, a separate distribution network of pumps, valves, and easily identifiable ‘purple pipes’ can be used to deliver nonpotable water while minimizing the potential for harm to public health. However, building separate distribution systems can be costly and demand for nonpotable water (e.g., for purposes such as irrigation) can have significant seasonal variation in some areas.
Indirect potable reuse is the intentional addition of treated municipal wastewater to a drinking water source such as a lake or reservoir (i.e., surface water augmentation) or a groundwater aquifer (i.e., groundwater recharge). In some communities, treated wastewater is injected into the ground to create a barrier that prevents seawater intrusion into a freshwater aquifer. For example, several utilities in southern California use treated wastewater for this purpose. Some of the injected water may end up augmenting the groundwater, making such systems a form of indirect potable reuse. Typically, though, groundwater recharge is accomplished through spreading basins that allow the water to naturally percolate through the soil to the aquifer or by means of injection wells that deliver the water directly to a specified location in the aquifer.
The receiving water body in an indirect potable reuse project, whether it is a surface source or underground aquifer, is often referred to as an ‘environmental buffer.’ One reason for such a buffer has been to provide the public with a psychological barrier between the source of the water (municipal wastewater) and its use for drinking water, making reuse more acceptable to the public. An environmental buffer also dilutes the
reuse water through mixing with the buffer and in some cases can provide additional contaminant removal. However, NRC has concluded that an environmental buffer can be replaced by engineered processes such as advanced treatment without any loss of water quality.42 In addition, sometimes the treated municipal wastewater has a higher purity than the natural water supply to which it is added or the treated water may pick up contaminants as it passes through soil to an aquifer. In such cases, adding the highly purified water to a natural water source may be an inefficient use of energy and other resources that were used to treat and transport the water.
Direct potable reuse generally eliminates this environmental buffer from the process and instead routes the highly treated municipal wastewater into a drinking water treatment facility for final treatment or into a potable water distribution system downstream of such a facility.43 This approach is gaining acceptance as communities grapple with water scarcity. The first direct potable reuse facility in the nation began producing 2 million gallons per day (MGD) of potable water for Big Spring, Texas in May 2013, and Wichita Falls, Texas operated a 5 MGD facility as an emergency project from July 2014 to July 2015. An additional 10 MGD facility is being pilot-tested in El Paso, Texas. California has historically limited the use of treated municipal wastewater to nonpotable and indirect potable approaches. However, the
42National Research Council of the National Academies,
Understanding Water Reuse: Potential for Expanding the National’s Water Supply Through Reuse of Municipal Wastewater (Washington, D.C.: 2012).
43For example, see the definition of direct potable reuse under the California Water Code, subsection 13561(b).

Technology Assessment GAO-16-474 18
California Water Code was amended in 2010 and 2013 to require the California Department of Public Health, in coordination with the State Water Resources Control Board, to investigate the feasibility of developing criteria for direct potable reuse in the state.44
1.7.3 Storm water captured from developed areas
Storm water that has been intentionally captured from parking lots, streets, and rooftops could be used for such purposes as landscape irrigation and groundwater recharge, reducing demand for potable water. While large scale applications of storm water capture often require further treatment to address potential contaminants such as bacteria, sediments, metals, nitrogen, phosphorus, pesticides, and hydrocarbons (e.g., oil and gasoline residues), the extent of treatment required is dependent on the end use of the water and the requirements of the local jurisdiction. Another challenge is matching the demand for water with the availability of storm water. This issue is particularly challenging in areas where storm water is primarily available during limited seasonal periods.
Capturing storm water for beneficial use is becoming more common in decentralized water systems such as those designed for office buildings, hotels, or individual homes. However, experts told us it has not received much attention on a utility-wide scale, particularly as a source for municipal supplies. 44A report on the feasibility of developing uniform water
recycling criteria for direct potable reuse must be presented to the state legislature by December 31, 2016. Cal. Wat. Code 13563.
Storm water infrastructure in most municipalities is designed to collect the water into ditches, channels, or pipes and transport it as quickly as possible to a river or the ocean. This approach reduces the amount of freshwater available for aquifer recharge and other beneficial uses and can also create pollution issues in the receiving waters. A recent report from the Pacific Institute and the National Resources Defense Council estimated that capturing storm water from paved surfaces and rooftops in urbanized southern California and the San Francisco Bay area could increase average annual water supplies by at least 140 – 210 billion gallons each year while also reducing flooding and surface water pollution.45 Based on USGS estimates of California’s annual water use, this amount represents about 6 – 9 percent of California’s annual municipal supply.46 The National Academies also recently reported that capturing and storing the average storm water runoff from medium density residential developments in Los Angeles would meet indoor residential water needs in those areas.47
45Pacific Institute and National Resources Defense Council, The
Untapped Potential of California’s Water Supply: Efficiency, Reuse, and Stormwater, Issue Brief 14-05-C (New York, NY and Oakland, CA: June 2014).
46GAO calculation based on data from U.S. Geological Survey, Estimated Use of Water in the United States in 2010.
47National Academies of Sciences, Engineering, and Medicine, Using Graywater and Stormwater to Enhance Local Water Supplies: An Assessment of Risks, Costs, and Benefits (Washington, D.C.: Dec. 2015). Data on Los Angeles storm water runoff are from 1995-1999.

Technology Assessment GAO-16-474 19
2 Technologies that improve efficiency in water distribution systemsThe EPA describes water efficiency as the “long term ethic of saving water resources through the use of water-saving technologies and practices.” There are many well-established technologies, methods, and approaches that can increase the efficiency of municipal water distribution systems.48 These technologies and approaches can be implemented generally along four broad categories—leak detection, pipe condition assessment, pressure management, and metering technologies. In the following sections we summarize our assessment of these technologies.
2.1 Leak detection technologies
Leak detection has become one of the most cost-effective ways to save water, especially with aging infrastructure and water resource depletion. Several different types of leak detection technologies using different operating principles are available, including acoustic or pressure related, electromagnetic, and thermal technologies. Some techniques employed by these technologies can be considered intrusive—meaning their use can be disruptive to operations—while others are non-intrusive. Many require certain levels of skill and experience to operate with accuracy.49 For example, acoustic equipment 48For purposes of this report, the distribution system includes
utility-owned pipes, valves, and other equipment downstream of the treatment facility but upstream of customers.
49Non-intrusive leak detection refers to “through the wall” or non-contact techniques that do not require access to the inside of a pipe.
detects a leak through noise made by water as it leaks from the pipe. Electromagnetic field detection is used on pre-stressed concrete pipe to locate defects in a pipe that can be an indicator of potential leaks. Thermal detection equipment relies on temperature differences in the surrounding ground caused by saturation due to leaked water. Capital costs for typical leak detection equipment range from less than one hundred to several thousand dollars depending on its complexity. Based on our survey results, we estimate that 79 percent of utilities serving more than 3,300 people have used one or more of the leak detection technologies we assessed and 47 percent conduct regularly scheduled leak surveys.50
Table 2 summarizes the leak detection technologies we assessed, their technological maturities as measured by TRLs, advantages and disadvantages, and the percentage of utilities using the technology for leak detection as reported by our survey of U.S. municipal water utilities.
50Estimates based on our survey that are provided in Chapter 2
apply to all utilities in our target population and have margins of error of 5.6 percent or less at the 95 percent confidence level.

Technology Assessment GAO-16-474 20
Technology Advantages Disadvantages Estimated adoption percentagea
Geophone (TRL 9)
Inexpensive. Lightweight and easy to transport. Non-intrusive.
Not all leaks produce noise audible to human ear. Cannot be used on non-metallic or large diameter pipes, or for detecting large leaks.
72 percent
Acoustic noise logger (TRL 9)
More effective than listening devices. Non-intrusive.
More expensive than geophone. Cannot pinpoint leak location. Cannot be used on non-metallic or large diameter pipes or for detecting large leaks.
36 percent
Acoustic noise correlator (TRL 9)
Faster and most effective at pinpointing leak location. Can be used on metallic, non-metallic, and large diameter pipes, and can find large leaks. Non-intrusive.
Expensive. 40 percent
In-line hydrophone (TRL 9)
Can be used in all types of pipe 8 inches diameter or larger.
Expensive. Intrusive. Requires specialized access connections.
7 percent
Hydraulic transient detectionb (TRL 9)
Non-intrusive. Can be used to locate leaks in all types of pipe.
Potential for false alarms because pressure transients can also be initiated due to normal operational events such as pump shut down, and sudden increase in demand.
Pressure transient: 11 percent Acoustic transient: 15 percent
Ground penetrating radar (TRL 9)
Non-intrusive. Can be used to locate leaks in all types of pipes 1 inch diameter or larger.
Requires unimpeded access to the ground over the pipe. Effectiveness strongly determined by soil characteristics. Data difficult to interpret. Equipment is bulky and expensive.
13 percent
Infrared thermography (TRL 9)
Non-intrusive. Data difficult to interpret. Cannot pinpoint leak location. Expensive.
—c
Source: GAO analysis of literature and survey data. | GAO-16-474
Table 2 Assessment of leak detection technologies
Notes: Technology readiness levels (TRL) are a standard metric that some federal agencies use to report the maturity of developing technologies. Details of our methodology for assessing the maturity of a technology using the TRL scale are described in appendix I. A TRL 9 rating indicates that the technology is in use at the municipal utility scale, but does not preclude the possibility of further improvements or advances. aEstimated adoption percentages are based on our survey of U.S. municipal water utilities and apply only to the use of these technologies to detect leaks in a distribution system. Estimates in this table have margins of error of 5.6 percent or less at the 95 percent confidence level. bHydraulic transient detection refers to the pressure transient detection and acoustic transient detection categories in our survey. cInfrared thermography was not included on our survey of municipal water utilities.

Technology Assessment GAO-16-474 21
Acoustic or pressure technologies
When water under pressure leaks from pipes, it is often accompanied by noise and vibration. Different types of leaks, and leaks in different types of pipe, produce different sounds and vibrations. This noise differs from background noise and other sounds in normal water flow, and the vibration can be detected in the pipe walls and within the water itself. Acoustic leak detection equipment is available in a wide range of technologies, prices, and capabilities. Non-intrusive acoustic monitoring is the most common method used by utilities for leak detection. Non-intrusive acoustic devices include listening sticks, geophones (ground microphones), acoustic emission noise loggers, and leak noise correlators. Resources, priorities, distribution system characteristics, and operating conditions influence which device utilities employ. If listening sticks, geophones, or leak correlators are used, leak surveys must be carried out manually, which can be inefficient, especially for large systems. For the latter, surveys are best done using noise loggers. Listening sticks, geophones, and acoustic emission noise loggers can detect leaks in small-diameter metallic pipes, but are less effective on non-metallic (e.g., asbestos cement, pre-stressed concrete, or polyvinyl chloride) or large-diameter pipes. Further, while these tools effectively detect smaller leaks, they usually cannot detect large leaks in both metallic and non-metallic pipes.
Geophone: A geophone is a mechanical listening device that works like a stethoscope. It consists of a set of listening tubes that extend from the ears down to listening-heads that are placed on the ground directly above a pipe. The stereo-effect lets the operator accurately identify the leak. However, the
effectiveness of geophones relies on user expertise in detecting the smallest noises audible to the human ear. Nevertheless, many utilities use them because they are inexpensive. We rated geophones as a fully mature technology (TRL 9).
Acoustic noise logger: Acoustic noise loggers are vibration sensors that have electronic data loggers connected to them.51 The noise loggers are attached to pipes (or fittings) every few hundred meters, and are programmed to collect signals during a period of low water use, generally between 2 and 4 a.m. The collected data is statistically analyzed using a frequency analysis of noise levels to determine whether a leak is present. The type of leak can be identified by comparing the measured signals to those in an acoustic signature library. We rated acoustic noise logger as a fully mature technology (TRL 9).
Acoustic noise correlator: While acoustic noise loggers can detect a leak, determination of the leak’s location requires a listening device or an acoustic noise correlator. Acoustic noise correlators use vibration sensors temporarily attached at two contact points (typically fire hydrants) on either side of a pipe that has a leak. The signals from the sensors are transmitted to a correlator, which calculates the leak location using the difference in the signal arrival times. While acoustic noise correlators are more accurate at pinpointing the source of the leak, they require extensive training to use and are expensive. They can be used on nonmetallic and large-diameter pipes. However, at times
51Data logging is the measuring and recording of physical or
electrical parameters over a period of time.

Technology Assessment GAO-16-474 22
they fail to detect large leaks due to background noise. We rated acoustic noise correlator as a fully mature technology (TRL 9).
In-line hydrophone: In-line hydrophone or in-line acoustic noise detection involves inserting a vibration sensor into the water flow and using a locater sonar beacon on the ground surface to monitor the noise level and frequency as a function of the position of the sensor in the pipe. The noise sensor can be tethered for real-time monitoring and data analysis, or untethered, where data is collected and downloaded for analysis after the sensor has traversed the pipe. The advantage of this technology is that it is capable of locating leaks to within a meter and can be used on all types of pipes 8 inches diameter or greater. However, this technology is intrusive and requires specialized access connections. We rated in-line hydrophone technology as fully mature (TRL 9).
Hydraulic transient detection: Hydraulic transient-based detection techniques are used to detect and locate existing leaks in a pipe by extracting information about the presence and location of a leak from a measured pressure transient. Various computational approaches have been proposed, and while some have been validated in laboratory studies, field demonstrations are limited. Analytical approaches that have been studied include the leak reflection method, inverse transient analysis, impulse response analysis, transient damping method, frequency domain response analysis, and negative pressure wave method.
A negative pressure drop is generated when a sudden break develops in a pipe. This
negative pressure drop initiates two pressure transient waves that propagate in opposite directions from the burst location, and reflect back when they reach the ends of the pipe. The travel times of the transient waves can be determined by high frequency sampling of the pressure at one point along the pipe and the leak location can be determined from these values. We rated hydraulic transient detection technology as fully mature (TRL 9).
Electromagnetic technology
Ground penetrating radar: Ground penetrating radar transmits ultrahigh frequency radio wave pulses (125–370 megahertz typically, and up to 2.4 gigahertz) into the ground via an antenna and detects the waves that are partially reflected back from underground anomalies such as voids, rocks, water-saturated soil, or pipes. By measuring the time lag between transmitted and reflected radar waves, it is possible to determine the depth of the reflecting object. Scanning the ground surface and processing the returned signal from radar traces provides an image of the size and shape of the object for identifying and evaluating subsurface leaks. Radar traces can potentially identify leaks in buried pipes by detecting underground voids created by the leaking water or by detecting anomalies in the depth of the pipe as the radar propagation velocity changes due to soil saturation with leaking water.
Ground penetrating radar is a non-intrusive technology and the advantage of using it over acoustic sensing is that it can detect leaks in any type of pipe over 1 inch in diameter that is buried as deep as 13 feet. The disadvantages of this technology are that it requires access to a route directly above a

Technology Assessment GAO-16-474 23
pipe; it takes 1 to 3 hours to do a measurement, depending on the length of the pipeline being inspected; and it requires an experienced operator because considerable interpretation of the data is needed to identify leak signatures. Ground penetrating radar detectors cost about as much as acoustic correlator systems. We rated ground penetrating radar as a fully mature technology (TRL 9).
Thermal technology
Infrared thermography: Infrared thermography is a method to detect thermal anomalies, such as temperature differences, that can be an indicator of water leaks. The operating principle is based on the assumption that water leaking from a pipe will affect the thermal characteristics of the surrounding soil. The ground along a leaking water main will frequently be saturated. For example, in temperate climates, these areas are warmer than their surroundings in the winter and cooler in the summer. The level of heat radiating from the ground (infrared radiation) is measured using an infrared detector, which is simply a hand-held infrared meter with digital temperature gauges. A survey of the area using this hand-held device can detect temperature differences and help locate the general area of a leak. Other methods can then be used to pinpoint the leak location.
Whole-site thermography, or infrared imaging used on a larger scale, has been used to locate leaks below slabs, pavement, and buildings. While hand-held infrared meters are fairly inexpensive, whole-site thermography can be expensive. The results need to be analyzed by an expert because several factors affect the performance of the
technique including surface conditions of the test area, solar radiation, cloud cover, ambient temperatures, wind speed, and ground moisture. We rated infrared thermography as a fully mature technology (TRL 9).
2.2 Pipe condition assessment technologies
The EPA defines pipe condition assessment as “the collection of data and information through direct and/or indirect methods, followed by analysis of the data and information, to make a determination of the current and/or future structural, water quality, and hydraulic status of the pipeline.” One expert told us that assessing the condition of buried pipes is one of the most difficult challenges water utilities face. Knowing when to replace a pipe or what repair options may be appropriate is particularly significant for utilities with aging infrastructure. Pipe condition assessment technologies help a water utility assess the condition of pipes for potential future problems.
Two types of indicators, inferential and distress, are used for pipe condition assessment. Inferential indicators, which include pipe type, vintage and joint type, water quality and pressure history, pipe location and surrounding soil properties, and indirect determination of corrosion rate via coupon analysis, can be combined with break rate history to empirically assess pipe condition.52 This is a cost-effective strategy 52A method of estimating internal corrosion rates is by using
corrosion coupons, which are uniform-sized, pre-weighed strips of metal. Corrosion coupons, representative of system metals, are inserted into the system to be checked. System

Technology Assessment GAO-16-474 24
that utilities have used for assessing the condition of small diameter water mains that have low consequence of failure. Distress indicators, which can include tears in external pipe liners, scratches, cracks and pits, graphitization, pipe wall thinning, tuberculation, and joint displacement or misalignment, are detected by direct observation or through the application of a technology.53 This type of information can be costly to obtain, either because it requires excavation of the soil surrounding a pipe or requires dewatering (removal of water from pipe) so that a device can be inserted in a pipe. As a result, field studies are usually done only on major transmission water mains that have a high consequence of failure.
Our report assessed technologies that utilities use to assess pipe condition based on distress and inferential indicators. These technologies include visual inspection, electromagnetic
water is allowed to circulate over the corrosion coupons for a reasonable time interval (e.g., 30 - 90 days). The coupons are then removed and returned to a lab where they are cleaned of all corrosion products and re-weighed. From this weight loss and the dimensions of the coupon, a corrosion rate is determined that gives an indication of the type and extent of corrosion.
53Graphitization is the formation of graphite (free carbon) in iron or low-alloy steel. Tuberculation is the development of small mounds of corrosion products on the inside of iron pipes. These mounds are reddish brown and of various sizes.
technologies, ultrasonic technologies, acoustic technologies, and electrochemical technology. Based on our survey results, we estimate that 20 percent of utilities serving more than 3,300 people have used one or more of the pipe condition assessment technologies we assessed and 31 percent conduct regularly scheduled pipe condition assessments.
Table 3 summarizes the pipe condition assessment technologies we evaluated, their technological maturities as measured by TRLs, advantages and disadvantages, and the percentage of utilities using the technology for pipe condition assessment as reported by our survey of U.S. municipal water utilities.

Technology Assessment GAO-16-474 25
Technology Advantages Disadvantages Estimated adoption percentagea
Closed-circuit television (CCTV) (TRL 9)
Visual inspection without man-entry. Simple, inexpensive. Suitable for all types of small and large diameter pipes.
Pipe must be de-watered and tuberculation removed prior to inspection. Provides information only on the condition of the pipe inner surface. Inspection results are qualitative.
15 percent
Magnetic flux leakage (TRL 9)
High degree of accuracy for wall thickness measurement. Can distinguish metal from graphitization. Can be used for internal or external inspection.
Can only be used on large diameter unlined metallic pipes. Direct contact with pipe wall required so surfaces need be cleaned prior to inspection. Internal inspection requires dewatering.
1 percent
Remote field eddy current (TRL 9)
Can be used to detect broken wire in pre-stressed concrete cylinder pipes or corrosion pits in metallic pipes. Lined pipes can be inspected because direct contact with pipe wall is not required. Operates in wet or dry conditions so pipe can remain in service. Systems are available for different pipe sizes.
For in-line inspection, some tools require the pipe to be de-watered and cleaned before inspection, requiring interruption of service. Data interpretation can be difficult.
3 percent
Broadband electromagnetic (TRL 9)
Same advantages as remote field eddy current method but has better penetration depth and is able to distinguish metal from graphitization.
Inspection process can be time consuming because the scanning process is not continuous—the tool must be stationary while scanning, which limits the rate of progress. For in-line inspection, pipe needs to be de-watered prior to inspection, i.e. interruption of service.
1 percent
Ultrasonicsb (TRL 9)
Discrete: Sensitive to both surface and subsurface discontinuities. Provides instantaneous results. Probes of different sizes and frequencies are available for different applications. Pipe does not have to be de-watered.
Surface of the object to be inspected must be accessible. Requires pipe cleaning prior to inspection. Coupling medium is required for external pipe wall inspections. Not effective with concrete/cement pipes.
7 percent
Phased array: Scanning is faster than single probe. Scanning can be done from different angles to get a better understanding of the geometry of defects and distinguish complex defect types.
Cost may be higher than single-channel systems. Setups for three-dimensional applications are complex. While used in other industries, dedicated products for water main inspection have not been reported.

Technology Assessment GAO-16-474 26
Technology Advantages Disadvantages Estimated adoption percentagea
Guided wave: Only a small section of buried pipe needs to be exposed to attach the probe. It is also possible to inspect hidden structures under coatings, insulations, and concrete.
The range of inspection is 100 feet for above ground pipe, but much shorter in buried pipes due to attenuation. Cannot be used on heavily coated pipes due to signal attenuation. Cannot distinguish between internal and external corrosion.
Acoustic fiber optic monitoring (TRL 9)
The fiber optic cable acts as the sensor, meaning that long lengths of pipeline (up to 12 miles) can be monitored with one data acquisition system. Data are acquired continuously and wire breaks are identified and reported in near real time.
For pre-stressed concrete cylinder pipe only. The monitoring system does not provide information on wire breaks that occurred prior to the installation of the cable..
1 percent
Acoustic velocity measurementc (TRL 9)
Can be used on all types of pipes to estimate pipe wall thickness. Non-invasive and non-destructive, does not require dewatering.
Theoretical equation uses assumed values for constants.
Propagation velocity to measure pipe wall thickness: 2 percent Acoustic emission to measure pipe wall thickness: 5 percent
Soil linear polarization resistance (TRL 9)
A large quantity of soil linear polarization data along a pipeline would allow more accurate predictions of corrosion rate, better predictions of corrosion penetration of the pipeline, and a quick evaluation of the quantitative changes in pipes as a result of the corrosion process.
Inferential indicator. Relevant only to metallic pipes.
1 percent
Source: GAO analysis of literature and survey data. | GAO-16-474
Table 3 Assessment of pipe condition assessment technologies
Notes: Technology readiness levels (TRL) are a standard metric that some federal agencies use to report the maturity of developing technologies. Details of our methodology for assessing the maturity of a technology using the TRL scale are described in appendix I. A TRL 9 rating indicates that the technology is in use at the municipal utility scale, but does not preclude the possibility of further improvements or advances. aEstimated adoption percentages are based on our survey of U.S. municipal water utilities and apply only to the use of these technologies to assess the condition of a utility’s distribution pipes. Estimates in this table have margins of error of 5.6 percent or less at the 95 percent confidence level. bOur survey of municipal water utilities listed this technology as “ultrasonic” rather than separating it into specific ultrasonic types such as discrete, phased array, or guided wave. cThis category includes the ‘propagation velocity to measure pipe wall thickness’ and ‘acoustic emission to measure pipe wall thickness’ categories in our survey. Both of these technologies work by inducing a sound wave and measuring its velocity to estimate pipe-wall thickness.

Technology Assessment GAO-16-474 27
Visual inspection technology
Visual inspection is the standard, widely adopted technology for the nondestructive evaluation of the internal condition of sewers and storm water pipes. It may be done with a variety of vision aids such as closed-circuit television (CCTV) or a videoscope (commonly called snake cameras), but the pipe must be dewatered prior to inspection.
CCTV inspection: CCTV inspection conducts and records a close-up observation of the pipe surface using a robot-mounted forward-looking pan/tilt and zoom camera and lighting system mounted on a wheeled carriage. CCTV can identify defects such as longitudinal/circumferential cracks, fractures, deformation, collapse, breaks, open or displaced joints, surface abrasion or corrosion, tree root penetration, encrustation, and lateral connections. We rated CCTV inspection technology as fully mature (TRL 9).
Electromagnetic technologies
Magnetic flux leakage: Magnetic flux leakage is a non-destructive technology that uses strong magnets to magnetize a pipe and a magnetometer (magnetic sensor) to detect the field that leaks from areas of pipe that are corroded or pitted.54 This works only if there is direct contact with the pipe wall, meaning that lined pipes cannot be inspected, and if the surface has been cleaned—which requires expensive excavation and removing/replacing the coating to allow for an outer pipe wall inspection, or dewatering and scrubbing to
54Magnetometers are instruments that measure magnetic
fields.
remove tuberculation for an inner wall inspection. The large size of the equipment restricts inner wall inspections mainly to large diameter pipes.55 We rated magnetic flux leakage technology as fully mature (TRL 9).
Remote field eddy current: Remote field eddy current, another electromagnetic technology, detects changes in signal magnitude and phase that result when an alternating current electromagnetic field interacts with defects in a metallic pipe wall. This technology has several advantages over the magnetic flux leakage method in that it does not require the sensors to be in direct contact with the pipe wall, meaning that lined pipes can be inspected; it can be operated in wet or dry conditions, meaning that a pipe does not need to be dewatered; and the technology is compact enough to allow small diameter metallic pipes to be evaluated.56 We rated remote field eddy current technology as fully mature (TRL 9).
Broadband electromagnetic: Broadband electromagnetic is a variant of remote field eddy current technology. This technology transmits a signal that covers a broad frequency spectrum ranging from 50 hertz to 50 kilohertz, as opposed to the single alternating current frequency used by the remote field eddy current method. The advantages of this technology are that the recorded signal from the broadband transmission contains more information on
55Large diameter pipe refers to pipes with diameter ranging
from 12 to 30 inches. For example, in a metropolitan area like New York City, large transmission mains could be pipes of at least 30 inches in diameter, while for a small town a 12 inch diameter pipe might be considered large.
56Small diameter pipe refers to pipes with diameter generally smaller than 12 inches.

Technology Assessment GAO-16-474 28
pipe condition, enabling detection and quantification of various wall thicknesses as well as determination of the effective conductivity of the pipe wall, which can be indicative of changes in a pipe’s material properties. In addition, the broadband electromagnetic technique does not require contact with the metallic pipe wall, is not sensitive to corrosion products, and can scan through coatings, linings, and insulation. The disadvantages of this technology are that a pipe needs to be emptied and clean for in-line inspection; it cannot detect pin-hole failures or isolated pits; and the inspection process is time consuming. We rated broadband electromagnetic technology as fully mature (TRL 9).
Ultrasonic (discrete, guided wave, or phased array) technologies: Various types of ultrasonic technologies are available, including discrete, guided wave, and phased array. Discrete ultrasonic testing involves transmitting a high-frequency short wave into the material being tested and measuring and analyzing the arrival times and intensities of signals that are reflected back from surfaces or anomalies in the sample. The reflected wave is transformed into an electrical signal, from which the reflector’s location, size, orientation, and other features can be inferred. The technology can be implemented in several ways using different types of ultrasonic transducers, which are simply a set of transmitters and receivers of the acoustic wave used for the measurement.57 This technology has been used to measure quantitative wall thickness and detect
57An acoustic transducer is a device that converts sound energy
into an electrical signal and vice versa. Ultrasonic transducers are usually piezoelectric, magnetostrictive, or electromagnetic-acoustic devices.
anomalies such as corrosion or gouging in metal pipe walls. An added benefit is the ability to detect and identify mid-wall flaws, such as material separations, voids, or cracks. Ultrasonic testing of pipes can be done internally or externally. A conventional inspection device consists of a head with a set of transmitters that direct ultrasonic waves circumferentially into a pipe wall at angles that generate 45° shear-waves within the pipe, and a sensor carrier mounted on the rear, which houses a set of receivers to ensure full circumferential coverage. With large numbers of transducers generating pulses and receiving reflections, as many as ten simultaneous readings can be taken from each flaw or pipeline feature.
In guided wave ultrasonic, a ring of transducers clamped around the pipe sends ultrasonic waves down both directions of the pipe, exciting its entire cross-section. When the guided waves meet an anomaly or pipe feature, waves reflect back to the transducer’s original location. The time-of-flight for each signature is calculated to determine its distance from the transducer. The amplitude of the signature determines the size of the change in pipe wall thickness. This technique is suitable for pipes above 2 inches diameter and wall thicknesses up to 1.5 inches. While inspection from a single probe position is possible, the range of inspection is limited to 98 feet for above ground pipes and even a shorter range for buried pipes due to the rapid attenuation of signals. This technology is usually used on metallic pipes.
Recently, phased array ultrasonic technology has been used to improve the ultrasonic testing technique. In conventional ultrasonic testing, the sound beams emitted by each

Technology Assessment GAO-16-474 29
transmitter contained in the head have a fixed aperture, shape, and direction. In contrast, phased array technology uses an array of composite ultrasonic sensor elements that are individually controlled and programmed by their own electronics. A set of neighboring composite sensor elements are programmed to trigger simultaneously to produce a sound beam whose aperture, shape, and direction can be controlled. Phased array ultrasonic technology can detect wall thickness, corrosion, and cracks with a single multi-element transducer, where conventional ultrasonic testing may have significant limitations. However, this technology, initially developed for medical imaging applications and currently being used in the nuclear and aerospace industries, has yet to see significant acceptance in the water utility sector. We rated ultrasonics technology as fully mature (TRL 9).
Acoustic technologies
Acoustic fiber optic monitoring: Acoustic fiber optic monitoring is a sensor technology that uses a fiber optic cable and optical time domain reflectometry for pipeline condition monitoring. This technology is used exclusively to detect wire failures or breaks in 24 inch diameter or larger pre-stressed concrete cylinder pipes.58 Fiber optic cable is installed inside a water main and connected to a laser and signal acquisition system. Light from the laser is launched through the cable and the reflected light intensity is measured.
58Pre-stressed concrete cylinder pipes have a steel cylinder and
steel pre-stressing wire that is wrapped tightly around the core concrete to provide it with resistance to tensile stresses. Wire breaks are one of the distress indicators that influence pipe conditions for this type of pipe. As the number of wire breaks increases, the factor of safety decreases and eventually leads to pipe failure.
When there is only ambient noise in the pipe, the reflected light intensity is relatively constant. When a wire break occurs in the pipe, the strain energy that is released generates pressure waves that hit the fiber optic cable and cause instabilities in the reflected light intensity. A dynamic pattern of light is obtained and can be used to evaluate the acoustic properties of the event. Frequency, acoustic magnitude, attenuation characteristics, and other acoustic variables are then analyzed to determine when and where a wire break has occurred. According to one expert, an accumulation of wire breaks in a pipe segment can be indicative of a failure in the near future. We rated acoustic fiber optic monitoring technology as fully mature (TRL 9).
Acoustic velocity measurement: This technology uses sound propagation velocity measurements to estimate remaining pipe wall thickness and can be done with the hardware associated with acoustic noise correlators. Acoustic sensors (accelerometers or hydrophones) are positioned at two points along a pipeline. A low frequency sound wave is induced at a third point, and then the time it takes for the sound wave to travel between the two sensors is measured. The average pipe wall thickness along the section being measured is then determined using a theoretical relationship between propagation velocity and pipe wall thickness. This technology has an advantage over electromagnetic and ultrasonic inspection technologies in that it can be used on all types of pipes and is non-invasive and non-destructive. We rated acoustic velocity measurement technology as fully mature (TRL 9).

Technology Assessment GAO-16-474 30
Electrochemical technology
Soil linear polarization resistance: Soil linear polarization resistance is an electrochemical method to monitor and estimate the corrosion rate of a material in a given environment. It is an inferential indicator of the corrosion rate because surrogate electrodes are used in the testing apparatus. This technology measures the electrical resistance (polarization resistance) between two metal electrodes inserted into the soil next to a pipe. A weak electrical potential (10–20 millivolt) is applied between the two electrodes and a small current is produced. The ratio between the applied electrical potential and the resulting current is a measure of the polarization resistance. Lower measured polarization resistance indicates higher general corrosion rates. The current imbalance between the electrodes can also be measured. When the current imbalance is high there is a greater tendency for localized corrosion (called pitting) to occur.
A large quantity of soil linear polarization data along a pipeline would allow more accurate predictions of corrosion rate, better predictions of corrosion penetration of the pipeline, and a quick evaluation of the quantitative changes in pipes as a result of the corrosion process. We rated soil linear polarization resistance technology as fully mature (TRL 9).
2.3 Pressure management technologies
Pressure management is considered one of the most efficient and cost effective water demand management practices that a utility can implement to reduce water leakage—
including hidden background leakage—and burst pipes. Leakage is driven by pressure. If the pressure increases, leakage will also increase. Conversely, if the water pressure can be reduced, leakage will also decrease, although it is often difficult to predict the amount of reduction in leakage due to a decrease in pressure in a given water distribution system.
According to a 2014 report by the Water Research Foundation, many states require water utilities to monitor and maintain their distribution system pressures at certain levels to prevent contamination by intrusion, which is a public health threat.59 Considering that excessive pressure may also increase energy costs, utilities generally practice some form of pressure management.60 Technologies to help with pressure management include devices such as pressure-reducing valves and in-line pressure sensors, as well as more complex supervisory control and data acquisition (SCADA) systems to monitor pressure and remotely control the operation of pumps, valves, and other system infrastructure. Based on our survey results, we estimate that 98 percent of utilities serving more than 3,300 people measure water pressure at one or more points in their distribution system.
59Mark W. LeChevallier, Jian Yang, Minhua Xu, David Hughes,
and George Kunkel, Pressure management: Industry practices and monitoring procedures (Denver, CO: Water Research Foundation, 2014).
60A survey of utilities conducted by the Water Research Foundation in 2014 showed that utilities generally strive to maintain adequate pressure at all locations in the distribution system and minimize any fluctuations in pressures that may lead to low/negative pressures or high pressures in specific areas, though the extent of such practices varies from utility to utility depending upon unique conditions contributing to the pressure variability.

Technology Assessment GAO-16-474 31
Table 4 summarizes the pressure management technologies we assessed, their technological maturities as measured by TRLs, advantages and disadvantages, and the
percentage of utilities using the technology for pressure management as reported by our survey of U.S. municipal water utilities.
Technology Advantages Disadvantages Estimated
adoption percentagea
Pressure-reducing valves (TRL 9)
Effective in reducing excessive pressures in certain sections of the water distribution grid. Provides consistent outlet pressures for improved pressure management and potential for cost savings resulting from reduced leakage.
Fixed outlet pressure control system may not provide the flexibility to adjust water pressures at different times of the day, which may prevent maximum savings from being realized. Alternatively, time-modulated pressure management option does not react to the demand for water which can be a problem in case of fire.
61 percent
In-line pressure sensors (TRL 9)
Anticipated benefits or cost savings from energy savings, reduced main break frequencies, and reduced system leakage can outweigh the implementation cost.
Requires power source to operate. 43 percent
Supervisory control and data acquisition (SCADA) system (TRL 9)
Better tracking and record keeping. Better control and monitoring of tank level can lead to improved water quality. Continuous monitoring of flow and pressure changes can indicate a leak or break. Improvements in water quality. Increased efficiency in resource usage. Optimization of pumping costs related to energy rates for peak use.
Potential for cybersecurity intrusion. 74 percent
Source: GAO analysis of literature and survey data. | GAO-16-474
Table 4 Assessment of pressure management technologies
Notes: Technology readiness levels (TRL) are a standard metric that some federal agencies use to report the maturity of developing technologies. Details of our methodology for assessing the maturity of a technology using the TRL scale are described in appendix I. A TRL 9 rating indicates that the technology is in use at the municipal utility scale, but does not preclude the possibility of further improvements or advances. aEstimated adoption percentages are based on our survey of U.S. municipal water utilities and apply only to the use of these technologies to measure or control water pressure in a distribution system. Estimates in this table have margins of error of 5.6 percent or less at the 95 percent confidence level.

Technology Assessment GAO-16-474 32
Pressure-reducing valves: Pressure-reducing valves are utilized by utilities as part of their pressure management practice to protect plumbing fixtures from high pressure, among other things. Generally, municipal water delivery systems are designed so that the pressure will always be at a certain minimum level (e.g., 20 psi or greater) during fire flow.61 However, during the off-peak periods (which are much longer than the peak periods), the system pressures build to values much greater than this minimum level. A pressure-reducing valve automatically reduces an inlet pressure to a designated lower outlet pressure and helps maintain constant pressure despite varying flows. Separate electronic controllers can be connected to the pressure reducing valves to provide a range of control capabilities. For example, a time-modulated controller can be installed on a pressure-reducing valve and programmed to reduce the pressure during off-peak periods, resulting in greater water savings. We rated pressure-reducing valves as a fully mature technology (TRL 9).
In-line pressure sensors: More recently, the availability of in-line pressure sensors and continuous pressure monitoring capability have enabled the capture of short-term pressure fluctuations during water distribution system events for effective management of pressure. Pressure sensors are generally permanently installed at critical locations in a water distribution system to provide data which can be analyzed continuously by operators and computer systems in order to maintain system
61The American Water Works Association defines the required
fire flow as “the rate of water flow, at a residual pressure of 20 psi and for a specified duration that is necessary to control a major fire in a specific structure.”
pressures at optimum levels. We rated in-line pressure sensors as a fully mature technology (TRL 9).
Supervisory control and data acquisition technologies: A supervisory control and data acquisition (SCADA) system is an industrial automation and control system that uses multiple software and hardware elements to monitor, gather, and process data; record events into a log file; and interact with and control external machines and devices such as valves, pumps, and motors. In water utility operations, a SCADA system allows for dynamic pressure management, where pressure sensors permanently installed at high and low points within each pressure zone in the distribution system collect and forward real time pressure data to control systems. Data are continuously analyzed, and when conditions fall outside normal operating parameters, operators are alerted and pressure-reducing valves or pumping rates, for example, are remotely adjusted to normalize the pressure.62
One motivation for a utility to consider doing dynamic pressure management is that the anticipated benefits (reduced leak and pipe break rates) and associated energy cost savings significantly outweigh the implementation cost. We rated SCADA systems as a fully mature technology (TRL 9).
2.4 Metering technologies
Accurate metering is important to enable water utilities to control water loss. It
62Through its dynamic pressure control capability, a SCADA
system offers the advantage of optimizing pumping costs related to energy rates for peak use.

Technology Assessment GAO-16-474 33
establishes production and customer use volumes, and provides historic demand and consumption data that can be used for auditing and planning purposes. Because there is no single type of meter that can accurately measure flow for all applications, a utility typically has a variety of meters, each selected according to intended use, flow rate, and installation environment. For example, large meters are used to measure production flows from the supply source or water treatment facility, small meters are used to measure customer consumption, and intermediate-sized meters are often used to measure water flow in different pressure zones or DMAs.63 Meter types common to U.S. water utilities work by either measuring the volumetric displacement or the velocity of flowing water, or both.
The traditional mechanical meters were read manually, but after meter data were available in electronic form, a communications capability was added to the meter, allowing the meter to use automated meter reading (AMR) to access data remotely via a communication link. Meter manufacturers have developed various system architectures for remote reading; these are broadly classified as walk-by, drive-by, or networked systems. Besides reducing labor costs, AMR allows utility companies to provide higher order benefits and services, such as real-time pricing to promote better energy efficiency,
63A DMA is a specific area of a water distribution system that
can be isolated by closing valves so that water inputs and outputs can be monitored.
instant reporting of fault detection, and more accurate data for profiling usage within the network. AMR utilizes one-way communications to collect meter data and gradually evolved to include two-way data communication over a network using technologies ranging from satellites to low-cost radios. The combination of the electronic meters with two-way communications technology for information, monitoring, and control is commonly referred to as advanced metering infrastructure (AMI). It typically refers to the full measurement and collection system that includes meters at customer sites; communication networks between customers and a service provider, such as a water utility; and data reception and management systems that make the information available to the service provider. Based on our survey results, we estimate that 98 percent of water utilities serving more than 3,300 people have used one or more of the metering technologies we assessed to meter water flow at customer connections.
Table 5 summarizes the metering technologies we assessed, their technological maturities as measured by TRLs, advantages and disadvantages, and the percentage of utilities using the technology for metering as reported by our survey of U.S. municipal water utilities.

Technology Assessment GAO-16-474 34
Technology Advantages Disadvantages Estimated adoption percentagea
Manually-read meters (TRL 9)
Lower initial meter cost. Billing system simplicity. Meter readers can spot problems or unauthorized use.
Labor Intensive. Prone to human error. Meter readers can be exposed to unsafe conditions.
73 percent
Automated meter reading (TRL 9)
Lower labor costs. Faster data acquisition and processing. Potential to detect leaks.
Old analog meters have to be upgraded. Meters require power. Personnel need to be trained to use and install the new technology.
75 percent
Advanced metering infrastructure (TRL 9)
Provides a number of tools for improving distribution system efficiency, such as real-time leak detection, remote pressure management, and demand volume, among others.
Cost of the meter—it can be difficult to justify the installation expense given the low cost of water. The cost of training field personnel to use and install the new technology. Regulatory challenges. Lack of communications standards for smart metering, billing, and data exchange. Customer privacy concerns.
16 percent
Source: GAO analysis of literature and survey data. | GAO-16-474
Table 5 Assessment of metering technologies
Notes: Technology readiness levels (TRL) are a standard metric that some federal agencies use to report the maturity of developing technologies. Details of our methodology for assessing the maturity of a technology using the TRL scale are described in appendix I. A TRL 9 rating indicates that the technology is in use at the municipal utility scale, but does not preclude the possibility of further improvements or advances. aEstimated adoption percentages are based on our survey of U.S. municipal water utilities and apply only to the use of these technologies to meter water flow at customer connections. Estimates in this table have margins of error of 5.6 percent or less at the 95 percent confidence level.
Manually-read meters: Most residential meters have a mechanical or digital display for monitoring and recording the volume. This display can be read manually. Manually-read meters—often used by smaller utilities—are less costly to purchase, simplify billing, and allow the meter reader to spot potential problems or unauthorized use. However, manual reading is labor intensive, prone to human error, and may expose meter readers to unsafe conditions. We rated manually-read meters as a fully mature technology (TRL 9).
Automated meter reading: Automated meter reading (AMR) is a technology that
automatically collects data stored in the meter and transfers it to a database for analysis and billing. AMR systems consist of two main components: AMR meters that collect and transmit consumption data using a low-power radio transmitter, and AMR readers that receive and forward the consumption data sent by meters to a central collection point for billing, diagnosis, and analysis.64
64AMR utilizes wireless communication for remotely collecting
usage data from electricity, gas, and water meters.

Technology Assessment GAO-16-474 35
There are several ways to read data from a meter and transfer it to a central host or facility, including handheld or walk-by meter reading, drive-by meter reading using a sensitive mobile collector, a network AMR consisting of a network of installed collectors and repeaters for reporting AMR meter readings in real time, and meters equipped with cellular technology that directly transmit data to a central host using existing cellular networks.
Both handheld devices and mobile collectors require personnel to walk or drive by locations where the meters are installed. In the case of data collection by a handheld meter, the meter or a device mounted on an exterior wall of the building is touched or swiped with the handheld reader to download the information to a portable unit. The data are later downloaded to the utility. Mobile data collection is similar to the handheld version but requires the reader to drive by the general location of the meter to automatically upload its stored information to the mobile unit. A data logger in the vehicle collects the information via a short-range radio signal.65 Many more meter readings can be collected in a day using mobile data collection compared to handheld data collection. However, the utility consumption can only be updated as frequently as the walk-by or drive-by events occur.
In contrast, a network AMR system requires higher infrastructure investment but does not need delegated drivers or walkers for data collecting and can provide continuous consumption updates to the utility. Network 65Data loggers are data acquisition devices that take readings at
a pre-set interval and store them away in the internal memory for download later.
AMR systems use fixed, one-way network technologies to transmit the data from the meter to the central data collection point. Data transmissions occur between one and four times per day, according to one expert. More recently, cellular-enabled smart water meter technology has emerged in which each meter is connected to a device that works like a pager—a cellular endpoint—that is housed adjacent to the meter. The endpoint sends information on water usage directly to a central facility once a day. A key element of this technology is the ability to send customers email and text alerts if customer-side leaks are detected. One of the advantages of such a cellular endpoint system is that it utilizes the secure, existing cellular network infrastructure, thus eliminating the need for utility-owned fixed network infrastructure. Cellular-enabled smart meters can be especially useful in areas with challenging terrain, which often makes communication difficult.
Advantages of AMR include lower labor costs; faster data acquisition and processing; and the potential to detect leaks in homes, DMAs, or pressure zones using consumption profiling.66 Disadvantages are that old analog meters have to be upgraded, AMR meters require power, and personnel need to be trained to install and use the new technology. Experts GAO consulted also noted that lack of AMR interoperability standards is a barrier to technology adoption because utility operators
66Because data logging and AMR can be done more
frequently—as often as every 15 minutes—meter consumption data can be used for leak detection in homes or in systems with DMAs or metered pressure zones, and for water conservation efforts. For example one company’s AMR offers a consumption profiling feature that allows six months of hourly usage to be stored and analyzed at the meter and sends alarms to the reader when an anomaly is detected.

Technology Assessment GAO-16-474 36
are essentially locked into lifetime relationships with the AMR vendor they initially choose.67
Many larger utilities are starting to adopt AMR. According to a recent report by Rouf et al., as of 2010, more than 47 million AMR systems were installed across electricity, gas, and water utilities, representing more than one-third of the 144 million total U.S. residential, commercial, and industrial meters.68 We rated AMR as a fully mature technology (TRL 9).
Advanced metering infrastructure: In order to improve their distribution system efficiency and develop intelligent water delivery systems, some water utilities in the United States are considering adopting the approach energy utilities used to develop the smart electric grid. Part of the transition to smart water delivery involves building advanced metering infrastructure (AMI), which is an integrated system of smart meters and sensors, two-way communication networks, and data acquisition and analysis centers. Many water utilities also have a web interface that customers can access to view their consumption data as part of their infrastructure.
67Standards do not exist in the water industry for the radio
transmission of meter readings and the use of valuable data that are generated. Utilities are aware that one vendor’s system is not compatible with another. The result is an inefficient marketplace where competition is discouraged and utility choices constrained. Once a utility selects a vendor, it is difficult and costly to make a change.
68Ishtiaq Rouf, Hossen Mustafa, Miao Xu, Wenyuan Xu, Rob Miller, and Marco Gruteser, “Neighborhood Watch: Security and Privacy Analysis of Automatic Meter Reading Systems” (paper presented at CCS’12, Raleigh, NC, Oct. 2012). The report included all types of AMR systems including electricity, gas, and water meters.
Newer smart meters now transmit not only metering data but also leak, backflow, and tamper alarms. Some also have an electronic on/off valve with two-way wireless communication capability that the utility can use for remote connection or disconnection of water services. Smart meters with integrated pressure and temperature sensors have emerged, allowing a utility to detect anomalies and do pressure point analysis. AMI and smart sensors are also being used for distribution system leak detection and location via radio frequency-enabled acoustic sensors that are attached to locations such as valves and fire hydrants. The sensors collect and analyze acoustic data from distribution water mains and send an alert to a central location when an anomaly is detected. Two-way AMI is used to coordinate the simultaneous monitoring of leak noise from multiple units so that remote acoustic correlation can be done to pinpoint the leak.
AMI and smart meters/sensors provide utilities a number of tools and new alternatives for improving the efficiency of their distribution systems. For example, real-time consumer water use data collected by smart meters and analyzed by a central system have allowed utilities to detect background leaks and unintentional water use events (i.e., burst pipes) in customers’ homes, and also helped determine temporal patterns of water consumption to optimize system pressure, among other things. In addition, AMI systems have made it easier to monitor pressure either at the meter or through separate monitoring points. One expert told us that AMI systems are likely to significantly enhance the ability to do pressure management in the future through the use of additional low cost instrumentation and controls such as pressure sensors on water

Technology Assessment GAO-16-474 37
meters, and remote pressure control through SCADA systems and AMI networks.
GAO’s survey of utilities shows that adoption of AMI has been low. Only 16 percent of the utilities GAO surveyed report using AMI. Experts told us that the barriers to AMI and smart meter/sensor technology adoption include the cost of the meter and its
installation—it can be difficult to justify the expense given the low cost of water; the cost of training field personnel to use and install the new technology; regulatory challenges;69 lack of communications standards for smart metering, billing, and data exchange; and customer privacy concerns. We rated AMI as a fully mature technology (TRL 9).
69One expert told us that these regulatory challenges include
siting considerations, public utilities commission justification, Federal Communications Commission licenses, and environmental assessment.

Technology Assessment GAO-16-474 38
3 Technologies to tap nontraditional water sourcesNontraditional water sources—sources other than freshwater—that may be available to a municipality to augment their freshwater supplies include seawater, brackish water, treated municipal wastewater, or storm water captured from developed areas. Based on the results of our survey of municipal water utilities, we estimate that 16 percent of utilities serving more than 3,300 people treat at least one of these types of nontraditional water for potable or nonpotable use.70 Specifically, we estimate that fewer than 1 percent of utilities treat seawater for potable use while 7 percent treat brackish water. In addition, 10 percent of utilities use treated municipal wastewater, with 97 percent of those treating it for nonpotable use, 10 percent for indirect potable use, and 1 percent for direct potable use.71 Finally, 2 percent use captured storm water; 95 percent of those reported that they treat it for nonpotable use and none reported treating it for direct potable use.72 Some technologies
70These estimates, based on our survey results, apply to all
utilities in our target population and have margins of error of 5.6 percent or less at the 95 percent confidence level. The remaining survey-based estimates in Chapter 3 apply only to utilities treating at least one type of nontraditional water and have margins of error of 11.2 percent or less at the 95 percent confidence level.
71Percentages add up to more than 100 because utilities were able to choose more than one answer to whether they use treated municipal wastewater for nonpotable, indirect potable, or direct potable reuse.
72Utilities were able to choose more than one answer to whether they treat storm water captured from developed surfaces for nonpotable, indirect potable, or direct potable reuse. The percentage of utilities reporting that they treat captured storm water for indirect potable use was unreliable, with a 95 percent confidence range of 7 – 74 percent.
suitable for treating these water types have been used for decades while others are still in development. Technologies in development may eventually offer some advantages in areas such as energy consumption, capital costs, and operating costs. We limited our assessment to selected technologies used to treat nontraditional water sources for potable or nonpotable use.73
Water treatment technologies can be categorized in different ways. For purposes of this report we grouped these technologies into three main categories:
• physical separation technologies, which remove contaminants through physical methods such as filtration or phase changes (e.g., liquid to solid) without changing their chemical nature;
• chemical transformation technologies, which remove contaminants by either chemically converting compounds into different substances that are less harmful or more easily removed from water or by inactivating pathogens such as bacteria, protozoa, and viruses; and
• biological transformation technologies, which use microbial systems—particularly bacteria—to degrade or destroy contaminants.
73We did not assess all available or developing technologies.
For example, we did not assess technologies such as sedimentation, aeration, or typical pre- and post-treatment steps. We also excluded modifications to existing technologies, such as new or modified membranes for use in reverse osmosis.

Technology Assessment GAO-16-474 39
Many of the technologies we assessed can be used to treat more than one type of nontraditional water. In addition, multiple technologies are generally used in series to form a ‘treatment train’ customized to the source water quality, as well as regulatory requirements and the desired end use of the finished water. Two utilities treating the same type of water for the same purpose may use different treatment trains to accomplish their goals.
In a 2014 report on the cost of over-treating wastewater for reuse, researchers used a life-cycle assessment and cost-benefit analysis to compare the financial, environmental, and social costs of various treatment trains for wastewater reuse.74 For example, they compared the non-membrane treatment train shown in figure 4(a) to the membrane-based treatment train shown in figure 4(b). These trains are used by different utilities to treat wastewater for indirect potable reuse. The report concluded that non-membrane
74See Larry Schimmoller and Mary Jo Kealy, Fit for Purpose
Water: The Cost of Overtreating Reclaimed Water (Alexandria, VA: 2014). This report was sponsored by the WateReuse Research Foundation and co-sponsored by the U.S. Bureau of Reclamation. Specifically, researchers examined the direct financial costs such as construction, engineering, and annual operating costs; upstream environmental and social factors such as greenhouse gases and other air emissions resulting from the facility’s electricity use and the production and transport of chemicals required for water treatment; and the downstream environmental and social factors such as air emissions and land requirements for transporting and disposing of the waste streams produced at the facility.
treatment trains, such as the one shown in figure 4(a), had the lowest overall estimated costs—especially for larger facilities—while still providing appropriate water quality. The report further noted that in some situations, decision makers may select a higher level of treatment —such as the RO-based approach that is widely considered the “gold-standard” for potable reuse—even if it is not actually necessary to achieve the desired water quality, because stakeholders sometimes hold the perception that more advanced treatment is better for wastewater reuse applications even though a different treatment train may provide a similar and use-appropriate level of water quality at substantially lower cost and with fewer environmental and social effects.
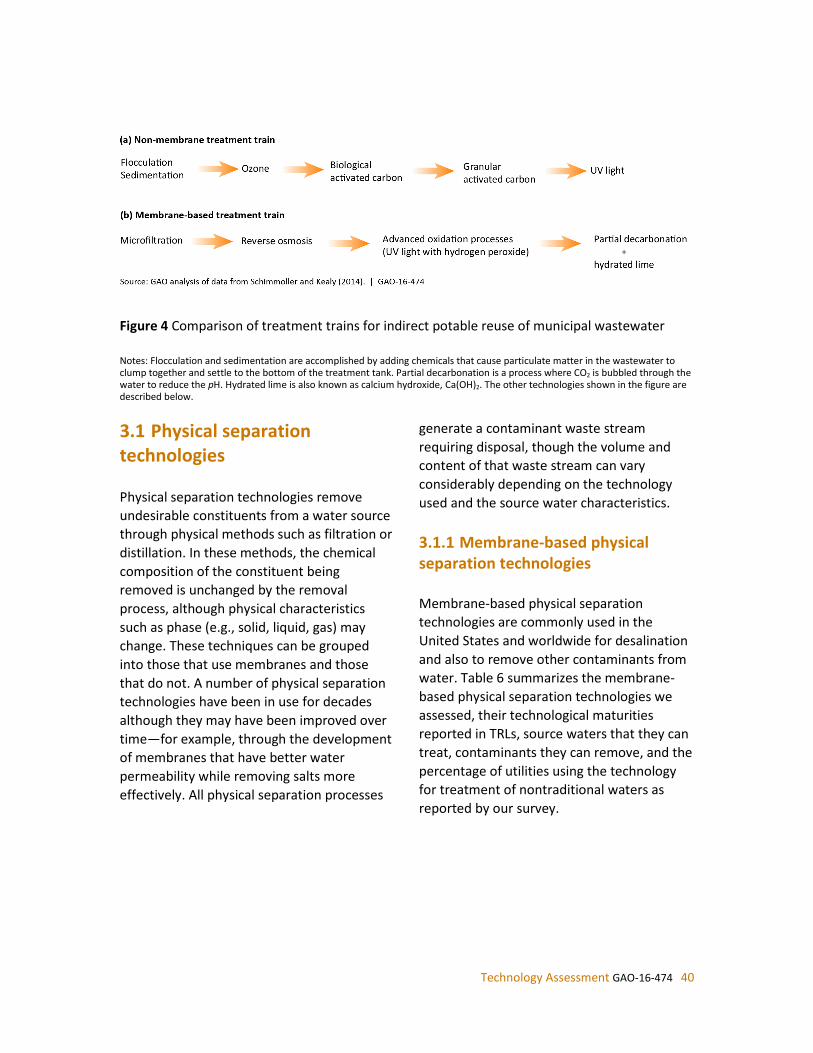
Technology Assessment GAO-16-474 40
Figure 4 Comparison of treatment trains for indirect potable reuse of municipal wastewater
Notes: Flocculation and sedimentation are accomplished by adding chemicals that cause particulate matter in the wastewater to clump together and settle to the bottom of the treatment tank. Partial decarbonation is a process where CO2 is bubbled through the water to reduce the pH. Hydrated lime is also known as calcium hydroxide, Ca(OH)2. The other technologies shown in the figure are described below.
3.1 Physical separation technologies
Physical separation technologies remove undesirable constituents from a water source through physical methods such as filtration or distillation. In these methods, the chemical composition of the constituent being removed is unchanged by the removal process, although physical characteristics such as phase (e.g., solid, liquid, gas) may change. These techniques can be grouped into those that use membranes and those that do not. A number of physical separation technologies have been in use for decades although they may have been improved over time—for example, through the development of membranes that have better water permeability while removing salts more effectively. All physical separation processes
generate a contaminant waste stream requiring disposal, though the volume and content of that waste stream can vary considerably depending on the technology used and the source water characteristics.
3.1.1 Membrane-based physical separation technologies
Membrane-based physical separation technologies are commonly used in the United States and worldwide for desalination and also to remove other contaminants from water. Table 6 summarizes the membrane-based physical separation technologies we assessed, their technological maturities reported in TRLs, source waters that they can treat, contaminants they can remove, and the percentage of utilities using the technology for treatment of nontraditional waters as reported by our survey.

Technology Assessment GAO-16-474 41
Technology Reported source water applicability
Contaminants removed Estimated adoption percentagea
Microfiltration (MF) or ultrafiltration (UF) (TRL 9)
Wastewater Storm water Pretreatment for seawater and brackish water
Suspended matter and colloidal particles Some bacteria, protozoa, and viruses Large organic molecules
6 percent
Nanofiltration (NF) (TRL 9)
Brackish water Wastewater Seawater
Particulate and dissolved organic matter Bacteria, protozoa, and viruses Total dissolved solids (TDS), especially
divalent ions such as Ca2+, Mg2+, and SO42-;
less effective for removal of monovalent ions such as Na+ and Cl-
Organic contaminants
5 percent
Reverse osmosis (RO) (TRL 9)
Seawater Brackish water Storm water Wastewater
Dissolved organic matter Bacteria, protozoa, and viruses Nitrogen and phosphorus compounds TDS including monovalent ions Metals, radium, uranium Organic contaminants
17 percent
Electrodialysis (ED) and electrodialysis reversal (EDR) (TRL 9)
Brackish water Wastewater
All charged species including: Nitrate, ammonium, and phosphate ions TDS Metal ions Colloidal particles
< 1 percent
Membrane distillation (TRL 9)
Seawater Brackish water
Primarily TDS but also other constituents that are not easily vaporized under distillation conditions
< 1 percent
Source: GAO analysis of literature and survey data. | GAO-16-474
Table 6 Assessment of membrane-based physical separation technologies for treatment of nontraditional water sources
Notes: Technology readiness levels (TRL) are a standard metric that some federal agencies use to report the maturity of technologies. Details of our methodology for assessing the maturity of a technology using the TRL scale are described in appendix I. A TRL 9 rating indicates that the technology is in use at the municipal utility scale, but does not preclude the possibility of further improvements or advances. aEstimated adoption percentages are based on our survey of U.S. municipal water utilities, were calculated as the percentage of those using the technology among those treating at least one form of nontraditional water, and apply only to the use of these technologies to treat nontraditional water sources (i.e., seawater, brackish water, wastewater, or storm water). Additional utilities may use some or all of these technologies to treat freshwater sources. Estimates in this table have margins of error of 11.2 percent or less at the 95 percent confidence level.
Microfiltration (MF) and ultrafiltration (UF): MF and UF are filtration processes that use semipermeable membranes with pore sizes ranging from about 0.08 to 2 micrometers (µm) for MF or 0.005 to 0.2 µm for UF to remove particles that are larger than the pore size. They can be operated by either applying pressure to force the feedwater through the
membrane or by using a vacuum to draw the permeate—the water that passes through the membrane. Contaminants that can be removed include suspended matter; algae; large colloidal particles; large organic molecules; and microorganisms such as

Technology Assessment GAO-16-474 42
bacteria, protozoa, and, to a lesser degree, viruses.75 MF and UF can be used to treat recycled municipal wastewater or as a pretreatment step for saline waters prior to salt removal.
Advantages of MF and UF for wastewater reuse include effective pathogen removal (especially for bacteria and protozoa) and a reduced need for chemical treatment. However, drawbacks compared to non-membrane treatment include potentially higher capital costs, increased maintenance, limited membrane lifespan, and complexity of operation. As a pretreatment for saline waters, MF and UF can provide high quality feedwater for the primary desalination process (often RO) by reducing fouling—the buildup of undesirable material—on the RO membranes, thus extending membrane life. Using MF or UF for pretreatment can also reduce the need for chemical pretreatments such as chlorination or ozonation that can be problematic for RO membranes. However, costs can be higher than conventional pretreatments and managing or disposing of the resulting concentrate can be a challenge. MF and UF are fully mature technologies (TRL 9).
Nanofiltration (NF): NF is a pressure-driven desalination technology that uses a driving force of about 50-250 psi and a semipermeable membrane to remove salts and other contaminants from water.
75A colloid is a suspended particle with a diameter less than 1
µm that cannot be removed by sedimentation (i.e., gravity settling) alone. Microorganisms that may be removed using MF and UF include noroviruses; adenoviruses; bacteria such as E. coli, Shigella, and Salmonella; and protozoa such as Cryptosporidium and Giardia. MF and UF can generally achieve high removal of protozoa, moderate removal of bacteria, and limited removal of viruses.
Contaminant removal occurs through a combination of size-based filtration and diffusion as membrane pores are generally smaller than 0.001 µm. Certain contaminants remain on the feedwater side of the membrane to form the concentrate stream, while fresher water passes through the membrane. NF removes organic chemicals and up to 98 percent of divalent ions (i.e., those having a 2+ or 2- charge such as Ca2+, Mg2+, and SO4
2-), but is less effective at retaining monovalent (i.e., singly charged) ions such as Na1+ and Cl1-. For example, NF can be employed as a pretreatment step to remove calcium ions in order to prevent scaling—precipitation of minerals such as calcium sulfate from the feedwater—further down the treatment train. Recovery—the percentage of the intake water volume that passes through the membrane and is collected as higher quality water—generally ranges from 50-90 percent for NF treatment of brackish water.
NF can be an energy efficient and cost effective choice for wastewater reuse because NF is generally operated at lower pressures than RO, thus saving energy, and can achieve similar water quality with respect to organic compounds. However, because NF is less effective than RO at removing monovalent ions such as Na1+ or Cl1-, it is not as efficient as RO for desalination of seawater or highly brackish water. As with other membrane processes, fouling of the membranes—a reduction in performance due to scale buildup, biological growth, or deposition of colloidal material—is a major challenge that can impact membrane life and energy use, thus driving up O&M costs. Similarly, management or disposal of the resulting concentrate stream, especially in

Technology Assessment GAO-16-474 43
inland locations, can be difficult or costly. NF is a fully mature technology (TRL 9).
Reverse osmosis (RO): RO uses high pressure (150-1200 psi) to force water through a nonporous membrane by diffusion, leaving most salts and other dissolved substances trapped on one side of the membrane while fresher water passes through to the other side. This process is called “reverse” osmosis because water is forced to pass through the membrane in the opposite direction to that which would occur naturally by osmosis. Recoveries for a single pass through an RO system generally range from 35-60 percent for seawater and from 50-90 percent for brackish water.
Although RO generally uses more energy than NF due to the higher pressures required, NRC has reported that current energy use for RO is within a factor of 2 of the theoretical minimum energy of seawater desalination, due in part to highly efficient energy recovery devices that capture energy from the concentrate stream.76 RO membranes have also improved significantly over the past few decades with corresponding improvements in membrane cost, water permeability, salt rejection capability, and membrane life. However, NRC has estimated that future reductions in energy use due to membrane improvements are likely limited to about 15 percent.77 RO membranes are prone to fouling and are sensitive to oxidants such as chlorine and ozone, thus requiring extensive pretreatment of the feedwater. As with NF,
76National Research Council, Desalination: A National
Perspective, 88.
77National Research Council, Desalination: A National Perspective, 72.
concentrate management can be a significant issue, especially in inland areas that cannot use oceans for disposal. In addition, some contaminants in the feedwater can pass through the membrane into the permeate water, particularly in single-pass RO configurations. These can include low-molecular weight organic compounds, some pesticides, disinfection byproducts, and inorganic constituents of seawater such as boron and bromide. RO is a fully mature technology (TRL 9).
Electrodialysis (ED) and electrodialysis reversal (EDR): The ED and EDR processes use two oppositely charged electrodes and ion-selective membranes to remove ionic constituents from water. The electrical potential drives ions through cation- and anion-specific membranes while the cleaner water passes between the membranes. EDR is a modification that periodically reverses the polarity by switching the positive and negative electrodes. This drives contaminants off the membranes to reduce scaling and fouling, allowing the process to continue operating efficiently. According to the results of a 2012 survey, 21 municipal desalination facilities in the United States were using EDR.78
ED and EDR are only capable of removing charged species, so additional treatment steps are needed to remove uncharged inorganic and organic contaminants from feedwater. However, this limitation also makes ED and EDR more resistant than RO to membrane fouling by uncharged species such
78Mike Mickley, “U.S. Municipal Desalination Plants: Number,
Types, Locations, Sizes, and Concentrate Management Practices,” IDA Journal of Desalination & Water Reuse, First Quarter (2012).

Technology Assessment GAO-16-474 44
as silica. In addition, current ED membranes are resistant to chlorine. ED and EDR are typically cost-competitive with RO for water with TDS up to about 3,000 mg/L; because energy use and overall cost increase significantly with higher TDS, these processes are not typically used to treat seawater. As with other membrane processes, ED and EDR produce a concentrate stream that must be managed. ED and EDR are fully mature technologies (TRL 9).
Membrane distillation: In this process, which combines thermal distillation with the use of membranes, saline water is warmed to enhance vapor production and the vapor is exposed to a membrane that allows water vapor to pass but not liquid water. Rejection of dissolved substances is high and can be comparable to other thermal distillation techniques. As with nonmembrane thermal distillation techniques, membrane distillation can clean very high TDS feedwater while operating at much lower energy intensities and offering a smaller footprint, lower capital
costs, and the ability to use low-grade heat sources. Disadvantages include the potential for fouling and membrane degradation, significant energy use for the phase change of water when low-grade heat is not available, and poor rejection of volatile contaminants. Membrane distillation is a fully mature technology (TRL 9).79
3.1.2 Non-membrane physical separation technologies
Non-membrane physical separation technologies can also be used for treating nontraditional waters and may offer some advantages over membrane technologies. Table 7 summarizes the non-membrane physical separation technologies we assessed, their technological maturities reported as TRL levels, source waters they can treat, contaminants they can remove, and the percentage of utilities using the technology for treatment of nontraditional waters as reported by our survey.
79We did not identify any large-scale municipal applications of
membrane distillation. However, a small municipal system on the island of Gulhi in the Maldives has been operating since 2014, providing water for 1,200 inhabitants and tourists. Because TRLs for this report were assigned based on whether the technology is available for use at the municipal scale without regard for the size of the municipality, we assessed this technology as TRL 9.

Technology Assessment GAO-16-474 45
Technology Reported source water applicability
Contaminants removed Estimated adoption percentagea
Thermal distillation (TRL 9)
Seawater Brackish water Storm water
Primarily total dissolved solids (TDS) but also other constituents that are not easily vaporized under distillation conditions
< 1 percent
Granular activated carbon (TRL 9)
Wastewater Storm water
Nitrogen Metals Trace organic contaminants including
disinfection byproducts, pesticides, and solvents
4 percentb
Ion exchange (TRL 9)
Brackish water Storm water Wastewater
Charged species including Nitrogen (e.g., nitrate) TDS Metal ions, radium, uranium
4 percent
Flow-through electrode capacitive desalination (TRL 3)
Brackish water Charged species including: Nitrate, ammonium, and phosphate ions TDS Metal ions
—c
Source: GAO analysis of literature, presentations from experts, and survey data. | GAO-16-474
Table 7 Assessment of non-membrane physical separation technologies for treatment of nontraditional water sources
Notes: Technology readiness levels (TRL) are a standard metric that some federal agencies use to report the maturity of technologies. Details of our methodology for assessing the maturity of a technology using the TRL scale are described in appendix I. A TRL 9 rating indicates that the technology is in use at the municipal utility scale, but does not preclude the possibility of further improvements or advances. aEstimated adoption percentages are based on our survey of U.S. municipal water utilities, were calculated as the percentage of those using the technology among those treating at least one form of nontraditional water, and apply only to the use of these technologies to treat nontraditional water sources (i.e., seawater, brackish water, wastewater, or storm water). Additional utilities may use some or all of these technologies to treat freshwater sources. Estimates in this table have margins of error of 11.2 percent or less at the 95 percent confidence level. bOur survey of municipal water utilities listed this technology as “activated carbon” rather than separating it into specific types such as granular or biological. cThis technology is in development and therefore not available for utility use. As a result, it was not included in our survey.
Thermal distillation: Thermal distillation is a physical separation technology that operates via phase changes (e.g., evaporation of liquid to gas followed by condensation of gas to liquid). Thermal distillation processes heat saline water to generate water vapor, leaving behind the majority of the dissolved solids such as salts that will not change phase under such conditions. The water vapor can then be condensed to produce liquid water that contains very little of the original salt. Distillation can be accomplished at normal atmospheric pressure or in a series of vessels
operating at successively lower temperatures and pressures.80
Because thermal distillation processes are generally energy intensive, they are 80Because thermal distillation is not widely used at the
municipal level in the United States, this report does not include a detailed discussion of the individual approaches. For additional details on these technologies, see National Research Council of the National Academies, Desalination: A National Perspective (Washington, D.C.: 2008) and Department of the Interior, Bureau of Reclamation, Barriers to Thermal Desalination in the United States (Denver, CO: March 2008).

Technology Assessment GAO-16-474 46
commonly coupled to a heat-producing process—for example, a thermoelectric power plant—so the waste heat can be used as a source of energy to drive the distillation process. A U.S. Bureau of Reclamation report notes that combining a waste heat source with thermal distillation can be more energy efficient than any other desalination technology, including reverse osmosis (RO), the most common municipal desalination technology used in the United States.81 This coupling can occur within a single industrial facility or through cogeneration facilities that combine electricity generation with water treatment. On a municipal scale, successful thermal distillation facilities in other regions such as the Middle East and Caribbean often cogenerate electricity and water, using the waste heat from electricity generation to drive distillation rather than discharging that heat to the environment via cooling towers or heat exchangers. However, this type of cogeneration has generally not been practiced in the United States, in part because of the lack of integration between electricity generation and water treatment. In addition, industries that generate significant quantities of waste heat but have little internal demand for water currently have little or no incentive to utilize their waste heat to produce water for nearby communities—even when the industry is in an arid region that could use the water—because they lack a way to market the water that could be produced.82
Advantages of thermal distillation include the ability to produce very high purity water (i.e., TDS of <10 mg/L), an ability to handle highly saline or contaminated water with minimal
81Bureau of Reclamation, Barriers to Thermal Desalination, 3-7.
82Bureau of Reclamation, Barriers to Thermal Desalination, 23.
pretreatment, low sensitivity to variations in intake water temperature and salinity compared to RO, an ability to adjust the efficiency of the process depending on the available heat sources and desired end water quality, and high energy efficiency if waste heat is used to drive the process. Disadvantages include significant energy use when fossil fuels drive the process and an inability to achieve cost savings when using lower salinity intake water, making thermal distillation less likely to be found cost effective for desalination of brackish water than for desalination of seawater. Thermal distillation technologies are fully mature (TRL 9) and account for about 30 percent of worldwide desalination capacity but only 3 percent of U.S. capacity.
Granular activated carbon: Adsorption via granular activated carbon is a technology that has been used for many decades.83 Granular activated carbon is formed by decomposing organic matter—often wood, coal, coconut husks, or walnut shells—under high heat, then activating it by exposing it to steam and carbon dioxide (CO2) at high temperatures. The result is a form of carbon with a particle diameter generally greater than 100 µm—larger than a grain of sand—and a porous structure that provides a large internal surface area (i.e., 700-1300 square meters per gram (m2/g) of material). As water is passed through a bed of this material via pressure or gravity filtration, dissolved substances—such as solvents, pesticides, metals, and odor compounds—can adsorb to the porous surfaces.84 The efficiency of granular
83We did not assess other media filtration technologies such as
sand filters and anthracite filters.
84Adsorption is a reversible process in which chemicals are attracted to and retained by the external or internal surfaces
Technology Assessment GAO-16-474 47
activated carbon depends on factors such as the identities and concentrations of the contaminants to be removed, water temperature, pH, the amount and characteristics of the activated carbon material used, and the flow rate of water in the system. The carbon may be regenerated and reactivated after its adsorptive capacity has been reached or it may be replaced.
Advantages of granular activated carbon compared to membrane-based treatment approaches include lower capital and operating costs, low energy use with a corresponding reduction in greenhouse gas production and other air emissions, and the ability to regenerate the medium in some cases. Disadvantages include the significant space required for large-scale applications; high media replacement costs if the adsorbent cannot be regenerated; sensitivity to variations in pH, temperature, and flowrate that can affect performance; and the potential that media may need to be disposed of as hazardous waste due to the presence of toxic constituents. Granular activated carbon is a fully mature technology (TRL 9).
Ion exchange: Ion exchange uses materials such as minerals or synthetic polymer resins to remove toxic or otherwise undesirable ions from water by exchanging them with ions that are less problematic, known as ‘counter ions.’ The ion exchange resin uses an electrostatic charge to loosely hold counter ions at its surfaces; different resin chemistries and counter ions can be used depending on the contaminants targeted for removal. As the water flows through a bed or column packed
of a solid—such as granular activated carbon—that is exposed to the solution.
with the resin, the target ions are attracted to the resin surface and counter ions are released to balance the charge. This ion exchange process is used on a small scale in home water softeners where the calcium (Ca2+) and magnesium (Mg2+) ions that contribute to water hardness are exchanged for sodium (Na1+) ions, softening the water. In utility-scale applications, ion exchange can be designed to remove charged constituents including TDS, organic matter, Ca2+, Mg2+, ammonium (NH4
1+), nitrate (NO31-), sulfate
(SO42-), and metal ions such as chromium,
nickel, cadmium, and zinc. Feedwater can be passed through two successive columns: an anion exchange column to remove negatively charged ions and a cation exchange column to remove positively charged ions.
Advantages of ion exchange include the ability to design the process to selectively remove certain contaminants and the ability to regenerate the resin. However, ion exchange performance is severely impacted by particulate matter, solvents, and organic polymers in the feedwater, thus requiring pretreatment in order to maintain optimal performance. Ion exchange makes economic sense for desalination only as a final “polishing” step after another desalination process removes the majority of salts, or for removal of specific contaminants such as nitrate, arsenic, or uranium from slightly brackish water. An additional disadvantage is the need to dispose of the brine formed during regeneration of the resin, which may be difficult if TDS levels are high. Ion exchange is a fully mature technology (TRL 9).
Flow-through electrode capacitive desalination: Capacitive desalination, also known as capacitive deionization, uses an electric field gradient to remove ions from

Technology Assessment GAO-16-474 48
saline water. A small voltage applied to the electrodes of a capacitor attracts positive and negative ions in the water to the oppositely charged electrodes while the resulting relatively pure water flows through. When the electrodes reach their capacity of ions, the current is removed or reversed to release (desorb) the ions, allowing the concentrated brine to be flushed from the system. The approach presented here, flow-through electrode capacitive desalination, is a specialized form of this technology that is currently under development by researchers at Lawrence Livermore National Laboratory (LLNL). As with all technologies at this early stage, it is not yet clear whether it will eventually be useful at the scale necessary for municipal utility use. It is presented here as an example of current research.
LLNL researchers pioneered carbon aerogel electrodes for capacitive desalination in the 1990s, but because those early aerogels had only micropores the water flowed in a single stream between the electrodes, reducing the ion-removal capacity. More recent LLNL research uses carbon aerogel with novel pore structure as the electrode material. Specifically, the aerogel has macropores and micropores. The macropores are 1–5 µm in diameter, or less than 1/10th the width of a human hair. They allow water to flow easily through the aerogel electrodes at low pressure and enable rapid desalination. In addition, the walls of these macropores contain micropores just 0.001-0.002 µm in diameter, or about 1000 times smaller than the macropores. Together these pores provide an ion-capturing surface area of about 1,500 m2—an area equal to about five tennis courts—per gram of aerogel.
Advantages of flow-through electrode capacitive desalination, as with all capacitive deionization approaches, include relatively low capital costs, less energy use than RO for brackish water, and the possibility for energy recovery in the desorption phase. The ion removal efficiency is not dependent on the size of the ions as it is for some membrane technologies. The technology is also scalable and can be used individually or in stages. In addition, researchers at LLNL have reported that this flow-through electrode approach removes three times as much salt per charge and desalinates water 10 to 20 times faster than other capacitive devices.85 However, a 2014 report by the U.S. Department of Energy noted that capacitive desalination is currently limited to brackish waters with less than 5,000 mg/L TDS.86 In addition, LLNL researchers anticipate that the technology will initially be best suited for smaller scale applications, such as portable units for remote use, providing drinking water in disaster areas, and industrial or research labs that need limited amounts of purified water. Based on data provided by LLNL researchers, we estimate that flow-through electrode capacitive desalination has a maturity of TRL 3.
3.2 Chemical transformation technologies
Chemical transformation technologies remove undesirable constituents by chemically converting them into different
85Karen Rath, “A Better Method for Desalinating Saltwater,”
Science & Technology Review, January/February edition (2013).
86U.S. Department of Energy, The Water-Energy Nexus: Challenges and Opportunities (Washington, D.C.: June 2014).

Technology Assessment GAO-16-474 49
substances that are less harmful or more easily removed from the water. A key advantage of these technologies is that they do not produce a residual waste stream that requires further processing or disposal. Chemical transformations are generally achieved via (a) photolysis using ultraviolet (UV) light; (b) conventional chemical oxidation using such oxidizing agents as hydrogen peroxide, ozone, or chlorine to directly react with the constituents to be removed; or (c) advanced oxidation processes
(AOP) using oxidizing agents in combination with each other or with UV light to produce hydroxyl radicals (HO●) which then react with the constituents in water. Table 8 summarizes the chemical transformation technologies we assessed, their technological maturities reported as TRLs, source waters they can treat, contaminants they can remove, and the percentage of utilities using the technology for treatment of nontraditional waters as reported by our survey.
Technology Reported
source water applicability
Contaminants removed or inactivated Estimated adoption percentagea
Ultraviolet (UV) light (TRL 9)
Wastewater Storm water
Microorganisms including bacteria, protozoa, and viruses Some pharmaceuticals and the disinfection
byproduct n-nitrosodimethylamine (NDMA)
22 percent
Oxidation processes (e.g., chlorination, ozonation) (TRL 9)
Wastewater Storm water
Trace organic contaminants Microorganisms Soluble metals and metal complexes
—b
Advanced oxidation processes (AOP) (TRL 9)
Wastewater Trace organic contaminants including NDMA, pharmaceuticals, personal care products, and endocrine disrupting compounds
Microorganisms
2 percent
Source: GAO analysis of literature and survey data. | GAO-16-474
Table 8 Assessment of chemical transformation technologies for treatment of nontraditional water sources
Notes: Technology readiness levels (TRL) are a standard metric that some federal agencies use to report the maturity of technologies. Details of our methodology for assessing the maturity of a technology using the TRL scale are described in appendix I. A TRL 9 rating indicates that the technology is in use at the municipal utility scale, but does not preclude the possibility of further improvements or advances. aEstimated adoption percentages are based on our survey of U.S. municipal water utilities, were calculated as the percentage of those using the technology among those treating at least one form of nontraditional water, and apply only to the use of these technologies to treat nontraditional water sources (i.e., seawater, brackish water, wastewater, or storm water). Additional utilities may use some or all of these technologies to treat freshwater sources. Estimates in this table have margins of error of 11.2 percent or less at the 95 percent confidence level. bOxidation processes (e.g., chlorination, ozonation) were not included on our survey of municipal water utilities.
Ultraviolet (UV) light: The use of a light source to break down contaminants, such as trace organic compounds, is known as photolysis. In natural systems, sunlight can provide the light for photolysis; in engineered systems, UV
lamps provide the light energy. UV light is very effective for the inactivation of microorganisms such as bacteria, protozoa, and viruses. In addition, it is the most common method for removing the carcinogenic disinfection byproduct N-

Technology Assessment GAO-16-474 50
nitrosodimethylamine (NDMA)—which is not effectively removed by RO—and also effectively removes several other organic compounds.87 Because organic matter and other constituents in feedwater can interfere with the efficiency of removing the target organic compounds, UV light is often used as a treatment step after RO and other processes have removed most of the interfering constituents. In addition, the photolytic damage to some microorganisms (primarily to their DNA) can be reversed by cell-initiated repair when exposed to visible light such as sunlight. Therefore, somewhat higher UV doses should be applied to water that will be stored in open basins. UV light can also be used in combination with oxidizing chemicals in the class of technologies known as advanced oxidation processes, which are discussed below. This is a mature technology (TRL 9).
Oxidation: Oxidation involves the addition of chemicals such as ozone (O3) and chlorine to water to chemically transform or destroy contaminants through direct interaction. Oxidation is often used to remove microorganisms such as bacteria, viruses, and protozoa; soluble metals and metal complexes; and trace organic contaminants. The mechanism of oxidants such as chlorine and O3 on microorganisms is through disruption of the cell membrane and damage to DNA. The efficiency of oxidation processes depends to varying degrees on water quality, contact time, and other factors.
87These compounds include the pharmaceuticals
acetaminophen, diclofenac, and sulfamethoxazole as well as an antimicrobial compound (triclosan) that is commonly found in consumer care products such as soaps.
Ozone leaves no appreciable residue and is often the least expensive option. However, ozonation of bromide-containing wastewater has the potential to form bromate, a contaminant regulated by EPA. A similar disadvantage exists for chlorine, which can react with organic matter in wastewater to generate harmful disinfection by-products, including trihalomethanes, haloacetic acids, and NDMA. Oxidation is a mature technology (TRL 9).
Advanced oxidation processes (AOP): AOPs are a class of technologies that combine two chemical transformation technologies (e.g., the combination of ozone and UV light) to produce highly reactive radicals such as the hydroxyl radical (HO●). AOPs can inactivate a variety of microorganisms and can address trace organic contaminants such as NDMA, pharmaceuticals, personal care products, and endocrine disrupting compounds by transforming these toxins into less toxic compounds. Although UV-based AOPs are sensitive to water quality and require pretreatment, they do not form bromate, a toxic byproduct that can result from direct ozonation of bromide-containing feedwater. In addition, UV-based AOPs can achieve high removal rates for a variety of contaminants that cannot be removed by UV alone, including endocrine disrupting compounds. However, EPA has reported that while AOPs may offer a small increase in removal efficiency for some compounds compared to ozonation alone, they are less efficient than ozonation for others.88 AOPs are a mature technology (TRL 9).
88Environmental Protection Agency, 2012 Guidelines for Water
Reuse, 6-16.

Technology Assessment GAO-16-474 51
3.3 Biological transformation technologies
Biological transformation technologies use microbial systems—particularly bacteria—to degrade or destroy undesirable constituents. Table 9 summarizes the biological
transformation technologies we assessed, their technological maturities as measured by TRLs, source waters they can be used to treat, contaminants they can remove, and the percentage of utilities using the technology for treatment of nontraditional waters as reported by our survey.
Technology Source water
applicability Contaminants removed Estimated adoption
percentagea
Biological activated carbon (TRL 9)
Wastewater Organic matter Disinfection byproducts Trace organic contaminants
4 percentb
Membrane biofilm reactor (TRL 9)
Wastewater Nitrate, bromate Chromate, selenate Uranium Chlorinated solvents
—c
Soil infiltration (TRL 9)
Wastewater Storm water
Suspended solids Metals Nitrogen and phosphorus Organic compounds including some pesticides Microorganisms including bacteria, protozoa, and viruses
16 percent
Natural or engineered wetlands (TRL 9)
Wastewater Storm water
Suspended solids Oil and grease Metals Nitrogen and phosphorus Organic compounds Microorganisms including bacteria, protozoa, and viruses
12 percent
Biohydrochemical Enhancement for Streamwater Treatment (BEST) (TRL 4)
Wastewater Storm water
Metals Nitrogen and phosphorus Trace organic contaminants Bacteria
—c
Source: GAO analysis of literature, presentations from experts, and survey data. | GAO-16-474
Table 9 Assessment of biological transformation technologies for treatment of nontraditional water sources
Notes: Technology readiness levels (TRL) are a standard metric that some federal agencies use to report the maturity of technologies. Details of our methodology for assessing the maturity of a technology using the TRL scale are described in appendix I. A TRL 9 rating indicates that the technology is in use at the municipal utility scale, but does not preclude the possibility of further improvements or advances. aEstimated adoption percentages are based on our survey of U.S. municipal water utilities, were calculated as the percentage of those using the technology among those treating at least one form of nontraditional water, and apply only to the use of these technologies to treat nontraditional water sources (i.e., seawater, brackish water, wastewater, or storm water). Estimates in this table have margins of error of 11.2 percent or less at the 95 percent confidence level. bOur survey of municipal water utilities listed this technology as “activated carbon” rather than separating it into specific types such as granular or biological.

Technology Assessment GAO-16-474 52
cThis technology is in development and therefore not available for utility use. As a result, it was not included in our survey.
Biological activated carbon: Biological activated carbon is formed by encouraging microbial biofilm growth in a bed of granular activated carbon.89 The microorganisms are able to break down naturally occurring organic matter in the water and have also been found effective in the removal of disinfection byproducts. A pretreatment step such as ozonation or AOPs may be used to enhance performance by breaking down some larger organic molecules into simpler compounds before they reach the microorganisms. In addition to the biological treatment, adsorption via the activated carbon base material also contributes to the treatment process.
The organisms that grow on the carbon are sensitive to water quality parameters (including nutrient availability) and temperature. As with other activated carbon applications, the carbon bed may need to be replaced periodically. To avoid the possibility of bacteria ending up in the finished water, a disinfection step such as chlorination or photolysis is generally used downstream of the biological activated carbon step. Biological activated carbon is a mature technology (TRL 9).
Membrane biofilm reactor: A membrane biofilm reactor is formed by encouraging beneficial microbial growth as a biofilm on the surface of a hollow-fiber membrane. The hollow fiber can then be used to deliver a component such as oxygen or hydrogen gas that the bacteria need in order to complete the contaminant removal process. In most 89We did not assess other media—such as sand or anthracite—
that can be used as a base for biofiltration.
cases for production of potable water, hydrogen gas is supplied to the bacteria to allow them to remove contaminants such as nitrate, perchlorate, chromate, selenate, uranium, chlorinated solvents, and bromate.
Managing the amount of biofilm is important to achieving reliable performance with a membrane biofilm reactor. Too little biofilm can lead to insufficient contaminant removal, while too much blocks the flow of water through the reactor and can impede transfer of the supplied component (e.g., hydrogen gas) through the membrane. Properly controlling the pH is also essential. Full-scale systems typically include automated strategies to remove excess biofilm and control pH. The membrane biofilm reactor is a mature technology (TRL 9).
Soil infiltration: Soil infiltration, sometimes called soil aquifer treatment, is the process of allowing water, such as storm water or treated municipal wastewater, to percolate through the soil where it can undergo physical, chemical, and biological treatment. This approach can be used to augment municipal water supplies via groundwater recharge if the infiltration process delivers the water to a potable water aquifer. One way this is often accomplished is via regional-scale infiltration basins (often called spreading basins). Such systems are common in the arid southwestern United States, particularly in California. Soil infiltration can also be accomplished through riverbank filtration, a process that uses a hydraulic gradient to draw water from a river through adjacent soils to water supply wells.

Technology Assessment GAO-16-474 53
The effectiveness of soil infiltration at removing contaminants from water before it enters the groundwater depends on a number of factors, including the infiltration rate, permeability and character of the soil, biological activity in the soil, depth to the water table, and the properties of the contaminants. Contaminants that are most likely to be removed include suspended solids, metals, nutrients such as nitrogen and phosphorus, and organic compounds including some pesticides. Pathogens—which are often associated with larger particles—may be removed by physical straining through the soil during infiltration; this is especially likely for protozoa and larger bacteria. Contaminants that are least likely to be removed include substances—such as road deicing salts that may be present in storm water runoff—that are nonvolatile, hydrophilic, and not likely to be adsorbed to the soil during infiltration. Maintenance of spreading basins can include occasionally removing or breaking up soil and sediment layers. In addition, facility operators must manage ponding duration to control infiltration rates. Soil infiltration can be a low-energy process unless significant energy is needed to transport the water to the infiltration site. Disadvantages include a large land footprint and the potential for unsuitable geology in an area where soil infiltration is desired. Soil infiltration is a mature technology (TRL 9).
Natural or engineered wetlands: Wetlands, whether natural or engineered, have been used for decades to treat municipal wastewater effluent or storm water. For example, since the late 1990s the Orange County Water District, located just south of Los Angeles, California, has been using the Prado wetlands to treat water from the Santa
Ana River. The flows from the Santa Ana River primarily consist of highly treated wastewater from upstream communities, with the addition of storm water on a seasonal basis. Wetlands are low-energy treatment systems that require little to no chemical input and generate little to no residual waste. They can remove many contaminants and provide water flow control while also enhancing biodiversity and providing recreational features or other community amenities. Wetlands are effective for removing suspended solids, nitrate, phosphate, pathogens, metals, sulfates, and organic compounds. The vegetation and microbes that are supported by the wetland are critical to pollutant removal. In addition to biological transformation, physical processes such as sedimentation can also contribute to contaminant removal as the water flow rate slows in the wetland. Nitrate is primarily removed by microbial processes and released as nitrogen gas and thus can continue indefinitely. In contrast, phosphate removal occurs through soil adsorption and long-term storage within the system—for example, via plant uptake—and thus is finite.
One downside is the potential for wetlands receiving urban storm water runoff to accumulate contaminants such as zinc from the source water.90 Unless sedimentation rates are controlled and sediments are periodically dredged, this can lead to the dominance of pollution-tolerant species. In addition, while wetlands in certain circumstances can accomplish similar levels of treatment in a smaller footprint than soil
90National Academies of Sciences, Engineering, and Medicine,
Using Graywater and Stormwater, 50.

Technology Assessment GAO-16-474 54
infiltration,91 the space requirements for a regional-scale system are still significant. This technology is fully mature (TRL 9).
Biohydrochemical Enhancement for Streamwater Treatment (BEST): BEST is a technology under development by the National Science Foundation’s ReNUWIt Engineering Research Center.92 As with all technologies at this early stage, it is not yet clear whether it will eventually be useful at the scale necessary for municipal utility use. It is presented here as an example of current research.
This technology is designed to treat municipal wastewater or storm water runoff from developed surfaces via engineered streambeds that mimic and improve upon the natural hyporheic zone—the region where water in a stream mixes and exchanges with ground water in the stream bed. As shown in figure 5, this mixing zone can significantly
91For example, in 1982 the Clayton County Water Authority,
located near Atlanta, Georgia, installed a soil infiltration system that used sprinklers to apply treated wastewater to forestland adjacent to a water supply reservoir. As the utility’s water needs expanded, they replaced the land application system with a series of constructed wetlands that did not require as much land. See National Research Council, Water Reuse, 42-43.
92ReNUWIt is an acronym for Re-inventing the Nation’s Urban Water Infrastructure. For additional details on BEST, see Justin E. Lawrence, Magnus E. Skold, Fatima A. Hussain, David R. Silverman, Vincent H. Resh, David L. Sedlak, Richard G. Luthy, and John E. McCray, “Hyporheic Zone in Urban Streams: A Review and Opportunities for Enhancing Water Quality and Improving Aquatic Habitat by Active Management,” Environmental Engineering Science, vol. 30, no. 8 (2013) and S.P. Herzog, C.P. Higgins, and J.E. McCray, “Engineered Streambeds for Induced Hyporheic Flow: Enhanced Removal of Nutrients, Pathogens, and Metals from Urban Streams,” Journal of Environmental Engineering, vol. 142, no. 1 (2016).
influence the fate and concentrations of major ions (including nutrients) and metals in stream systems. In addition, research has shown that the size of the subsurface zone and the rate of water exchange between the surface and subsurface flows have a substantial influence on contaminant removal. For example, natural streambeds often contain an aerobic zone—a region that contains oxygen—near the surface and a deeper anaerobic zone where oxygen is unavailable. According to the developers of this technology, biodegradation of trace organic contaminants can occur in the aerobic zone but removal of some contaminants—such as microbial conversion of nitrate to nitrogen gas—occurs in the deeper anaerobic zone. Therefore, for optimal contaminant removal, the water must penetrate deeply enough into the subsurface to reach the anaerobic zone and spend sufficient time there.

Technology Assessment GAO-16-474 55
Figure 5 Simplified conceptual overview of microbially mediated pathways for contaminant removal in the hyporheic zone
Notes: This figure does not cover all possible reactions in the hyporheic zone. TrOCs = trace organic contaminants and DON = dissolved organic nitrogen.
BEST uses an engineered streambed containing natural sediments or engineered reactive geomedia and embedded barriers to enhance deep mixing of surface and subsurface water. The barriers can be made of low or high permeability materials depending on the desired water flow dynamics; modeling results indicate that higher permeability barriers produced a higher percentage removal of many tested contaminants. Examples of geomedia for removal of urban water contaminants, as documented in the literature, include woodchips, biochar, metal oxide sands, zeolites, and zero-valent iron. Because BEST functions optimally at flows that are lower than typical peak storm water flows, detention ponds can be used in conjunction with BEST to optimize treatment conditions. The detention ponds provide an additional
advantage in allowing time for sediments and particle-bound contaminants to settle. One tradeoff is the significantly larger footprint that is required for these ponds. BEST is a low-energy, passive treatment system; the main costs are initial materials and construction along with occasional clearing of debris. Researchers project that these costs could be considerably less per unit of contaminants removed than the comparable costs for wetlands construction, and further indicate that BEST could also be used for agricultural drainages and polishing of treated wastewater during conveyance. Based on data provided by ReNUWIt researchers, we estimate the maturity of this technology as TRL 4.

Technology Assessment GAO-16-474 56
4 Larger utilities, utilities serving water-stressed areas, and utilities that also manage wastewater or storm water are more likely to treat nontraditional sources of waterAs part of this technology assessment we conducted a nationwide survey of medium, large, and very large municipal water utilities in the contiguous United States. (For additional details on our survey and associated analysis, see appendix I.) The results described in this chapter are based on survey questions asking about the treatment of nontraditional water sources—specifically, seawater, brackish water, treated municipal wastewater, or storm water captured from developed areas.
Based on the results of our survey, the percentage of municipal water utilities that treat nontraditional water sources for municipal use varies significantly across the United States, with utilities in Pacific coast and southeastern states having the highest rates of nontraditional water use. Much of this regional variation may be explained by differences in underlying utility characteristics, according to our statistical analysis. In particular, we found that very large utilities, utilities serving water-stressed areas, and utilities that also manage wastewater or storm water services are most likely to treat nontraditional water sources for municipal use. We also analyzed data from our survey regarding the challenges that municipal water utilities face in treating nontraditional water sources. The results of that analysis suggest that the ease or difficulty of addressing financial, regulatory, and other challenges may further explain utilities’ decisions to treat nontraditional water sources.
4.1 Treatment of nontraditional water sources varies by region, utility size, water stress, and whether the utility manages wastewater or storm water services The percentage of utilities that treat nontraditional water sources varies significantly by region of the country, and underlying differences between utilities may explain some of this regional variation. As one way of approximating geographic variation in the use of nontraditional water sources, we used EPA regions to identify areas of the country where utilities are more likely to treat nontraditional water sources for municipal use. Figure 6 illustrates our findings that treatment of nontraditional water sources varies significantly across the United States. Utilities located in Regions 9 and 10, which include the Pacific coast states, and utilities located in Region 4, which includes the southeastern states, are most likely to treat such sources for municipal use. Specifically, we estimate that 30 percent, 28 percent, and 25 percent, respectively, of utilities in these regions treat nontraditional water sources for municipal use.93 By contrast, utilities located
93Unless otherwise noted, the estimates provided in chapter 4
based on our survey apply to all utilities in our target population and have margins of error of 5.6 percent or less at the 95 percent confidence level.

Technology Assessment GAO-16-474 57
in Regions 1 and 2, which include New England, New Jersey, and New York, are least likely to do so. Specifically, we estimate that 4
percent of utilities in these regions treat nontraditional water sources for municipal use.
Figure 6 Estimated percentage of utilities treating nontraditional water sources for municipal use, by EPA region
Notes: This map is limited to the contiguous United States because all utilities in our sample were located within that area. However, some EPA regions include areas outside the contiguous United States, such as Alaska (Region 10), Hawaii (Region 9), and Puerto Rico (Region 2). Estimated adoption percentages are based on our survey of U.S. municipal water utilities and have margins of error of 5.2 percent or less at the 95 percent confidence level except for region 3 (9 percent) and region 10 (15.4 percent). Utilities are classified as using nontraditional water sources for municipal use if they reported treating seawater, brackish water, treated municipal wastewater, or storm water captured from developed areas for municipal use.
To identify underlying factors that might explain utilities’ decisions to treat nontraditional water sources, we conducted additional statistical analysis. During an expert meeting we convened with the assistance of the National Academies and during interviews we conducted with industry trade organizations and others, experts identified key factors that might influence utilities to adopt technology to treat nontraditional water sources. These factors
include the size of the utility, water stress in the utility’s service area, whether the utility treats wastewater or storm water in addition to producing drinking water, utility ownership, community income, and population growth. Through statistical analysis of data from our survey of municipal water utilities and data from additional sources, we found that many of these factors are significantly associated with utilities’

Technology Assessment GAO-16-474 58
decisions to treat nontraditional water sources.
4.1.1 Larger utilities are more likely to treat nontraditional water sources
Utilities that serve larger populations are more likely to treat nontraditional water sources for municipal use than those that serve smaller populations. Experts told us that larger utilities have a greater capacity to adopt technology because they have more technical staff and more financial resources. A site visit we made to El Paso Water Utilities in El Paso, TX—a very large utility that serves over 600,000 people—supported that view. They told us they have technical staff who provide expertise to support decision making about technology adoption. In particular, the utility has a hydrologist who modeled current aquifer levels against anticipated withdrawal rates and determined that they would not able to meet peak demand without additional investment in technology. The utility is going forward with plans for an advanced purified water treatment facility using treated municipal wastewater for direct potable reuse. Based on such information, we hypothesized that larger utilities would be more likely than smaller utilities to treat nontraditional water sources for municipal use. The results of our statistical tests supported this hypothesis. Specifically, as figure 7 shows, among very large utilities—those serving more than 100,000 people—we estimate that 35 percent treat nontraditional water sources for municipal use.94 In contrast, among large utilities—those serving between 10,001 and 100,000 people—we estimate
94We used the size categories specified by EPA to classify
utilities as medium, large, and very large.
that 19 percent treat nontraditional water sources for municipal use and among medium-sized utilities—those serving between 3,301 and 10,000 people—13 percent do so.
Figure 7 Estimated percentage of utilities treating nontraditional water sources for municipal use, by size
Notes: Estimated adoption percentages are based on our survey of U.S. municipal water utilities. Utilities are classified as using nontraditional water sources for municipal use if they reported treating seawater, brackish water, treated municipal wastewater, or storm water captured from developed areas for municipal use. Size categories are based on U.S. Environmental Protection Agency definitions.
These results suggest that the additional technical expertise and financial resources available to large systems may enable them to treat nontraditional water sources for municipal use. Figure 8 shows the locations of the medium, large, and very large utilities in our survey sample.

Technology Assessment GAO-16-474 59
Figure 8 Medium, large, and very large utilities included in our sample of municipal water utilities
Notes: Municipal water utilities represented are those that we selected for our stratified random survey sample. Because different types of utilities had different probabilities of being selected, the geographic distribution of utilities on the map does not necessarily reflect the geographic distribution of all utilities. Size categories are based on U.S. Environmental Protection Agency definitions.
4.1.2 Utilities serving water-stressed areas are more likely to treat nontraditional water sources
In addition to utility size, utilities serving water-stressed areas are more likely to treat nontraditional water sources for municipal use than utilities serving non-water stressed areas.95 Experts told us that utilities that face frequent droughts and utilities that have vulnerable water supplies might be influenced to tap nontraditional water sources. This view was corroborated by an official from Orange 95To measure water stress, we used the Water Supply Stress
Index (WaSSI) developed by the U.S. Forest Service. The WaSSI is calculated as the ratio of the total water demand—or withdrawals—in a given watershed to the total water supply from surface and groundwater sources.
County Water District in Orange County, California, which manages a groundwater basin that provides water for 2.4 million people. Because of reduced flows from their traditional water source—the Santa Ana River—they have implemented an advanced water purification system to treat municipal wastewater for replenishment of the basin’s groundwater. Based on such information, we hypothesized that utilities serving water-stressed areas would be more likely to treat nontraditional water sources for municipal use than utilities serving non-water stressed areas. The results of our statistical tests supported this hypothesis. Our bivariate tests show that utilities serving more water-stressed areas were significantly more likely to treat nontraditional water sources than utilities in less water-stressed areas. For

Technology Assessment GAO-16-474 60
example, as figure 9 shows, we estimate that 25 percent of utilities serving the most water-stressed areas – those where the demand for water is greater than the amount of water that is naturally available within the watershed – treat nontraditional sources of water for municipal use. By contrast, we estimate that 13 percent of utilities in the least water-stressed areas, those in which the demand for water is 5 percent or less of the amount that is naturally available watershed, do so.
Figure 9 Estimated percentage of utilities treating nontraditional water sources for municipal use, by water stress Notes: Estimated adoption percentages are based on our survey of U.S. municipal water utilities. Utilities are classified as using nontraditional water sources for municipal use if they reported treating seawater, brackish water, treated municipal wastewater, or storm water captured from developed areas for municipal use.
These results suggest that utilities in areas with constrained water supplies may be influenced to take nontraditional approaches to ensure a steady supply of water for their customers. Figure 10 shows the areas of the country classified as water stressed, according to the index we used.
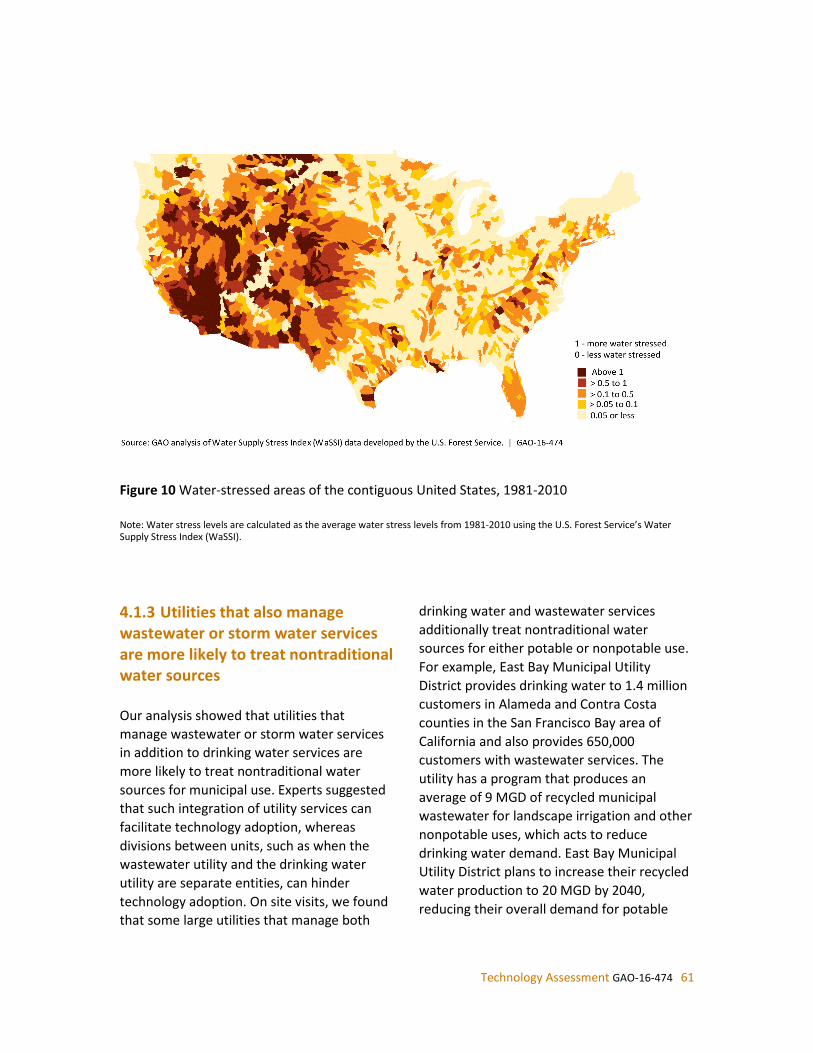
Technology Assessment GAO-16-474 61
Figure 10 Water-stressed areas of the contiguous United States, 1981-2010
Note: Water stress levels are calculated as the average water stress levels from 1981-2010 using the U.S. Forest Service’s Water Supply Stress Index (WaSSI).
4.1.3 Utilities that also manage wastewater or storm water services are more likely to treat nontraditional water sources
Our analysis showed that utilities that manage wastewater or storm water services in addition to drinking water services are more likely to treat nontraditional water sources for municipal use. Experts suggested that such integration of utility services can facilitate technology adoption, whereas divisions between units, such as when the wastewater utility and the drinking water utility are separate entities, can hinder technology adoption. On site visits, we found that some large utilities that manage both
drinking water and wastewater services additionally treat nontraditional water sources for either potable or nonpotable use. For example, East Bay Municipal Utility District provides drinking water to 1.4 million customers in Alameda and Contra Costa counties in the San Francisco Bay area of California and also provides 650,000 customers with wastewater services. The utility has a program that produces an average of 9 MGD of recycled municipal wastewater for landscape irrigation and other nonpotable uses, which acts to reduce drinking water demand. East Bay Municipal Utility District plans to increase their recycled water production to 20 MGD by 2040, reducing their overall demand for potable

Technology Assessment GAO-16-474 62
water by about 6 percent. Based on such information, we hypothesized that utilities that manage wastewater or storm water services in addition to drinking water services are more likely to treat nontraditional water sources for municipal use. Our statistical analysis supported this hypothesis. As figure 11 shows, among utilities that manage only drinking water services, we estimate that 8 percent treat nontraditional water sources for municipal use. By contrast, we estimate that 18 percent of utilities that also manage wastewater services and 24 percent of those that manage both wastewater and storm water services treat nontraditional water sources for municipal use. These results suggest that the integration of multiple water services may facilitate the treatment of nontraditional water sources for municipal use.
Figure 11 Estimated percentage of utilities treating nontraditional water sources for municipal use, by water services managed
Notes: Estimated adoption percentages are based on our survey of U.S. municipal water utilities. Utilities are classified as using nontraditional water sources for municipal use if they
reported treating seawater, brackish water, treated municipal wastewater, or storm water captured from developed areas for municipal use.
In addition to conducting the bivariate statistical tests, we also tested multivariate statistical models to determine whether the above relationships were significant even after controlling for multiple variables. The results of these models indicate that EPA region, utility size, local water stress, and utility services remain significantly associated with utilities’ decisions to treat nontraditional water sources after adjusting for multiple factors. Because we were unable to account for the complex array of factors that might influence technology adoption decisions, these results are not sufficient to indicate a causal relationship. However, these results are consistent with the rationale provided by experts and suggest that utilities’ decisions to treat nontraditional water sources may be influenced by these key underlying factors.
Experts identified other factors that might influence utilities to use technology, including utility ownership, community income, and population growth. Experts suggested that privately-owned utilities and utilities that serve higher income customers might have greater flexibility in raising rates, and therefore, greater ability to finance new technology. One expert suggested that utilities that serve rapidly growing populations may need to be more agile in water resources planning. However, we did not find that utility ownership, community income, or population growth were consistently associated with utilities’ decisions to treat nontraditional water sources. This does not mean that these factors are unimportant to utilities’ decisions, but rather, that these factors may interact with other factors in complex ways that could

Technology Assessment GAO-16-474 63
not be captured in our analysis. See appendix I for more details on our statistical analysis.
4.2 Financial, regulatory, and other challenges may influence the treatment of nontraditional water sources for municipal use
Other factors that were difficult to quantify, including financial, regulatory, and other challenges, might also influence utilities’ decisions to treat nontraditional water sources. Because we were unable to account for these factors in our statistical analysis, we surveyed municipal water utilities about the challenges they faced in treating nontraditional water sources. We asked utilities that currently treat nontraditional water sources about the ease or difficulty of addressing various financial, regulatory, and other potential challenges such as obtaining public support. We also asked utilities that have studied the feasibility of treating nontraditional water sources but that do not currently treat such sources how easy or difficult it would be for them to address these potential challenges.96 To identify salient challenges, we compared the responses for the two groups. Because of the small number of utilities that met the criteria for answering these survey questions, the data we obtained are not generalizable and therefore we report the results as counts rather than percentages. Furthermore, our data represent utility managers’ perceptions of the ease or difficulty of addressing challenges and the two groups of utilities may differ in ways
96As with any opinion-based survey questions, these responses
represent the perceptions of those who answered the relevant survey questions.
other than whether or not they treat nontraditional sources of water. Therefore, the results of this analysis are not sufficient to demonstrate a causal connection between the challenges that utilities face and their decisions about whether to treat nontraditional sources of water. However, the results corroborate the statements we heard from experts about the potential influence of financial, regulatory, and other challenges on utilities’ technology adoption decisions.
Based on our analysis, difficulty in addressing financial challenges may hinder utilities from treating nontraditional water sources. According to experts, the ability of utilities to pay for water treatment technology influences utilities’ decisions to adopt technology. Our analysis of challenges that utilities reported in our survey corroborate the importance of finances in their decisions to treat nontraditional water sources. Among the possible financial challenges, systems that have only studied the feasibility of treating nontraditional water sources more frequently cited paying for O&M costs and acquiring sufficient capital as challenges that were difficult to address as compared to utilities that actually treat nontraditional water sources. For example, as table 10 shows, among utilities that treat brackish water or seawater for municipal use, approximately the same number said that paying for O&M costs was somewhat or very difficult (27) as opposed to somewhat or very easy (30). By contrast, among utilities that have studied the feasibility of treating brackish water or seawater but have not actually treated it, more than six times as many said paying for O&M costs would be somewhat or very difficult (43) as opposed to somewhat or very easy (7).
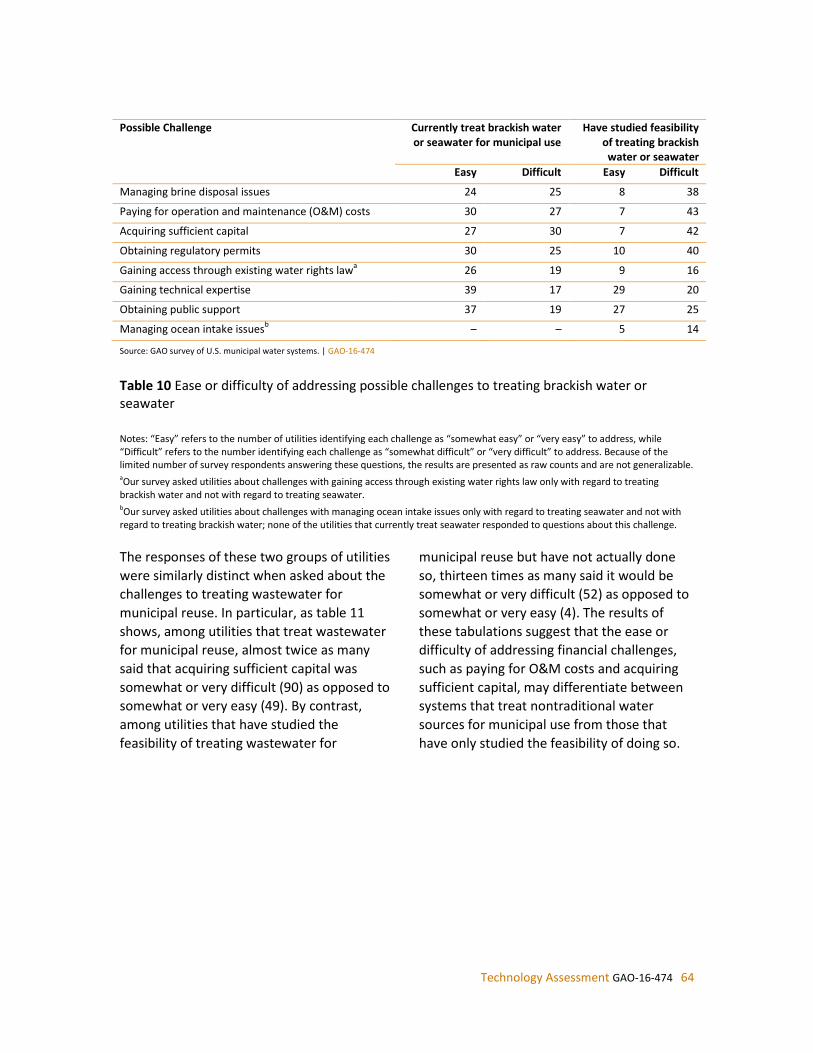
Technology Assessment GAO-16-474 64
Possible Challenge Currently treat brackish water or seawater for municipal use
Have studied feasibility of treating brackish water or seawater
Easy Difficult Easy Difficult
Managing brine disposal issues 24 25 8 38
Paying for operation and maintenance (O&M) costs 30 27 7 43
Acquiring sufficient capital 27 30 7 42
Obtaining regulatory permits 30 25 10 40
Gaining access through existing water rights lawa 26 19 9 16
Gaining technical expertise 39 17 29 20
Obtaining public support 37 19 27 25
Managing ocean intake issuesb – – 5 14
Source: GAO survey of U.S. municipal water systems. | GAO-16-474
Table 10 Ease or difficulty of addressing possible challenges to treating brackish water or seawater
Notes: “Easy” refers to the number of utilities identifying each challenge as “somewhat easy” or “very easy” to address, while “Difficult” refers to the number identifying each challenge as “somewhat difficult” or “very difficult” to address. Because of the limited number of survey respondents answering these questions, the results are presented as raw counts and are not generalizable. aOur survey asked utilities about challenges with gaining access through existing water rights law only with regard to treating brackish water and not with regard to treating seawater.
bOur survey asked utilities about challenges with managing ocean intake issues only with regard to treating seawater and not with regard to treating brackish water; none of the utilities that currently treat seawater responded to questions about this challenge.
The responses of these two groups of utilities were similarly distinct when asked about the challenges to treating wastewater for municipal reuse. In particular, as table 11 shows, among utilities that treat wastewater for municipal reuse, almost twice as many said that acquiring sufficient capital was somewhat or very difficult (90) as opposed to somewhat or very easy (49). By contrast, among utilities that have studied the feasibility of treating wastewater for
municipal reuse but have not actually done so, thirteen times as many said it would be somewhat or very difficult (52) as opposed to somewhat or very easy (4). The results of these tabulations suggest that the ease or difficulty of addressing financial challenges, such as paying for O&M costs and acquiring sufficient capital, may differentiate between systems that treat nontraditional water sources for municipal use from those that have only studied the feasibility of doing so.

Technology Assessment GAO-16-474 65
Possible Challenge Currently reuse municipal wastewater
Have studied feasibility of reusing
wastewater Easy Difficult Easy Difficult
Acquiring sufficient capital 49 90 4 52
Gaining access through existing water rights law 63 40 25 21
Gaining technical expertise 114 28 36 19
Managing brine disposal issues 16 23 10 22
Obtaining public support 81 56 19 37
Obtaining regulatory permits 72 72 17 36
Paying for operation and maintenance (O&M) costs 67 77 12 43
Reaching agreement with regulators on standards for treatment
70 65 17 34
Source: GAO survey of U.S. municipal water systems. | GAO-16-474
Table 11 Ease or difficulty of addressing possible challenges to reusing treated municipal wastewater
Notes: “Easy” refers to the number of utilities identifying each challenge as “somewhat easy” or “very easy” to address, while “Difficult” refers to the number identifying each challenge as “somewhat difficult” or “very difficult” to address. Because of the limited number of survey respondents answering these questions, the results are presented as raw counts and are not generalizable.
Another factor that may hinder utilities from treating nontraditional water sources is difficulty in addressing regulatory challenges. Experts told us that the lack of consistent regulatory standards and difficulty in obtaining regulatory approval often hinder utilities from being able to treat nontraditional water sources. Similarly, they said that it might be difficult for certain utilities to reuse storm water or wastewater, particularly utilities governed by prior appropriations water law, because downstream users may have a legal right to the effluent. Our analysis of challenges that utilities reported in our survey corroborate the importance of regulatory issues in utilities’ decisions to treat nontraditional water sources. Among the possible regulatory challenges, obtaining regulatory permits, reaching agreement with regulators on standards for treatment, and gaining access through existing water rights law were more frequently cited by systems that have only
studied the feasibility of treating nontraditional water sources as compared to those that actually treat nontraditional water sources.
One regulatory challenge distinguishing utilities that treat nontraditional water sources from those that have only studied the feasibility of treating such water sources is obtaining regulatory permits. For example, among utilities that treat brackish water or seawater for municipal use, approximately the same number said that obtaining regulatory permits was somewhat or very difficult (25) as opposed to somewhat or very easy (30) (see table 10). By contrast, among utilities that have studied the feasibility of treating brackish water or seawater but have not actually treated it, four times as many said obtaining regulatory permits would be somewhat or very difficult (40) as opposed to somewhat or very easy (10).

Technology Assessment GAO-16-474 66
Reaching agreement with regulators on standards for treatment of nontraditional water sources is a second regulatory challenge that distinguishes utilities that use nontraditional water sources from those that have only studied the feasibility of doing so. For example, among utilities that reuse wastewater, approximately the same number said that reaching agreement with regulators on standards for treatment was somewhat or very difficult (65) as opposed to somewhat or very easy (70) (see table 11). By contrast, among utilities that have studied the feasibility of treating wastewater for municipal reuse but aren’t actually doing so, twice as many said that reaching agreement with regulators would be somewhat or very difficult (34) as opposed to somewhat or very easy (17).
A third regulatory challenge distinguishing utilities that treat nontraditional water sources from those that have only studied the feasibility of doing so is gaining access to nontraditional water sources through existing water rights law. For example, as table 12 illustrates, among utilities that treat storm water for municipal use, about one-third as many reported that gaining access to the water through existing water rights law was somewhat or very difficult (4) as opposed to somewhat or very easy (11). By contrast, more than three times as many utilities that have studied treating storm water but aren’t doing so reported that gaining access to the water through existing water rights law would be somewhat or very difficult (13) as opposed to somewhat or very easy (4).
Possible Challenge Currently treat storm water for municipal use
Have studied feasibility of treating
storm water Easy Difficult Easy Difficult
Acquiring sufficient capital 5 12 1 16
Gaining access through existing water rights law 11 4 4 13
Gaining technical expertise 14 4 10 8
Managing brine disposal issues 2 4 3 7
Obtaining public support 12 4 12 6
Obtaining regulatory permits 9 7 2 16
Paying for operation and maintenance (O&M) costs 7 10 3 14
Reaching agreement with regulators on standards for treatment
9 8 2 16
Source: GAO survey of U.S. municipal water systems. | GAO-16-474
Table 12 Ease or difficulty of addressing possible challenges to treating storm water
Notes: “Easy” refers to the number of utilities identifying each challenge as “somewhat easy or very easy” to address, while “Difficult” refers to the number identifying each challenge as “somewhat difficult or very difficult” to address. Because of the limited number of survey respondents answering these questions, the results are presented as raw counts and are not generalizable.
The results of these tabulations suggest that the ease or difficulty of addressing regulatory challenges, such as obtaining regulatory permits, reaching agreement with regulators
on standards for treatment, or obtaining access through existing water rights law may differentiate between systems that treat nontraditional water sources for municipal

Technology Assessment GAO-16-474 67
use and those that have only studied the feasibility of doing so.
In addition to financial and regulatory challenges, other challenges may hinder some utilities from treating nontraditional water sources for municipal use. These may include cross-cutting challenges—such as managing brine disposal issues—which may involve a mixture of financial challenges, technical challenges, and regulatory or permitting challenges. For example, among utilities that treat brackish water or seawater for municipal use, approximately the same number said that managing brine disposal issues was somewhat or very difficult (25) as opposed to somewhat or very easy (24) (see table 10). By contrast, among utilities that have studied the feasibility of treating brackish water or seawater but have not actually treated it, more than four times as many said obtaining regulatory permits would be somewhat or very difficult (38) as opposed to somewhat or very easy (8).
Obtaining public support may also distinguish utilities that treat nontraditional water sources from those that have only studied the feasibility of doing so. For example, among utilities that reuse municipal wastewater, more utilities said that obtaining public support was somewhat or very easy (81) than said it was somewhat or very difficult (56) (see table 11). By contrast, among utilities that have only studied the feasibility of reusing wastewater, nearly twice as many said that obtaining public support would be somewhat or very difficult (37) as opposed somewhat or very easy (19). The results of these tabulations suggest that the ease or difficulty of addressing such challenges may differentiate between systems that treat nontraditional water sources for municipal use and those that have only studied the feasibility of doing so.

Technology Assessment GAO-16-474 68
5 Concluding observationsDrinkable water has traditionally been assumed to be reliable, cheap, and abundant. But with parts of the nation—especially the West—facing recurring drought and persistent water stress, that view has been shaken. While generally abundant in some form, water is not always available when and where it is needed, in the amount or quality desired, or in a cost-effective manner. Thus, utilities are increasingly aware of the need to be more efficient in their operations and diversified in their sources of water. Coupled with this is the risk-conservative nature of water utilities themselves who are mindful of the critical service they provide, held accountable by the public, typically highly regulated, often operating under constrained budgets, and necessarily forced to take a long view when considering changes to their essential operations.
Many mature technologies exist to aid utilities in reducing demand on their water sources by improving distribution system efficiency and increasing their supply of water through treatment to enable the use of nontraditional sources. However, utilities often face financial and regulatory challenges when considering the use of such technologies. As experts noted, the decision-making approaches that dominated in the past may no longer be appropriate under today’s water constraints. For example, is it necessary to always use a “gold standard” treatment if less expensive options can yield fit-for-purpose quality and allow more utilities to tap nontraditional water sources? Similarly, is the once-through approach—that is, drawing groundwater, using it once, and discharging the wastewater to surface waters—sustainable given the
issues associated with groundwater overdraft and the long timeframes required for natural recharge? If regulatory standards require wastewater to be treated to levels approaching or reaching drinking water standards, does it make sense to discard it rather than reusing it? Given the many proven treatment technologies that are available, should wastewater reuse be largely confined to nonpotable purposes as it currently is, hindering expansion due to the seasonality of nonpotable demand in some areas and the costly need for separate distribution systems?
These and other questions concerning how technology and its uses can aid utilities in the service of their communities are being debated. Adoption of technology requires commitment and resources, including financial and technical, both for initial implementation and for continuing support over the technology’s useful lifetime. In addition, new technology can be disruptive when integrating into established operational and business procedures, and always includes an element of risk. It is not surprising then that use of technology for distribution system efficiency and for treatment purposes varies significantly from one utility to another, depending on a wide variety of factors including size of the utility, state and local regulations, and customer preferences. Different utilities may make different decisions based on available space, public perception, technical familiarity, and many other factors. Most importantly, weaving its way through all of these variables is the critical factor of cost. Given the highly localized nature of the water business, pricing

Technology Assessment GAO-16-474 69
of water varies so widely from location to location and project-to-project that—as we were told by many of the utilities we interviewed—precise details of cost are typically unknown unless a utility commissions a full feasibility study in preparation for a particular project.
But some trends can be observed. Consistent with experts’ views, we found that utilities are most likely to treat nontraditional water for municipal use if they have sufficient need to do so and sufficient capacity to adopt new
technology. Similarly, we found that utilities that manage wastewater or storm water services in addition to drinking water services are also more likely to use nontraditional water sources. This makes sense as municipal wastewater and storm water, properly treated, can provide new sources of potable water. Finally, but not surprisingly, the ability to address regulatory, financial, or other challenges utilities face may also influence technology adoption.

Technology Assessment GAO-16-474 70
6 Agency and expert commentsWe provided a draft of this report to subject matter experts at the Department of Defense, Department of Energy, Department of the Interior, Environmental Protection Agency, and Department of Agriculture with a request for technical comments. We incorporated the comments received into this report as appropriate.
We provided a draft of this report to 13 members of our expert group who volunteered to review it with respect to scientific and technical quality, factual accuracy, and errors of omission. Of these, 12 provided technical comments that we incorporated as appropriate.
______________________________________________________________________________
We are sending copies of this report to the appropriate congressional committees, relevant federal agencies, and other interested parties. In addition, the report is available at no charge on the GAO website at http://www.gao.gov.
If you or your staff members have any questions about this report, please contact Timothy M. Persons at (202) 512-6412 or [email protected]. Contact points for our Offices of Congressional Relations and Public Affairs may be found on the last page of this report. GAO staff who made key contributions to this report are listed in appendix III.
Timothy M. Persons, Ph.D. Chief Scientist

Technology Assessment GAO-16-474 71
Appendix I – Objectives, scope, and methodologyWe describe our objectives, scope, and methodology for addressing the three objectives outlined below, related to technologies for use in the municipal water sector.
Objectives
Assess current and developing technologies that could make more efficient use of our current municipal freshwater resources.
Assess current and developing technologies that could augment our current freshwater resources with nontraditional water sources.
Identify locations and types of water utilities where these technologies are most commonly adopted.
Scope and methodology for assessment of technologies
We assessed available and developing technologies that utilities could use to make more efficient use of our current municipal freshwater resources or to augment our current freshwater resources with nontraditional water sources. To do so, we reviewed key reports and scientific literature describing current and developing technologies; attended relevant technical conferences and workshops; interviewed agency officials, water utility operators, industry organizations, researchers, nongovernmental organizations, and other experts; conducted site visits to water
utilities, two national laboratories, and a federal desalination research facility; and convened a panel of experts with the assistance of the National Academies.
Expert meeting
Specifically, early in our study we collaborated with the National Academies to convene a two-day meeting of 19 experts on current and developing water technologies. We collaborated with NAS staff to select experts from state and federal government agencies, academia, water utilities, and industry consultants, with expertise covering all significant areas of our review, specifically those with research or operational expertise in using technology to improve the efficiency of drinking water distribution systems or to treat nontraditional water sources for municipal use. A conflict of interest was considered to be any current financial or other interest that might conflict with the service of an individual because it (1) could impair objectivity or (2) could create an unfair competitive advantage for any person or organization. The 19 experts were determined to be free of conflicts of interest, and the group as a whole was judged to have no inappropriate biases. (See appendix II for a list of these experts and their affiliations.)
During this meeting we solicited input from the experts on the design for our work. In particular, we moderated discussion sessions on three primary topics: (1) technologies to increase the efficiency of drinking water distribution systems; (2) technologies for

Technology Assessment GAO-16-474 72
treating nontraditional water sources for municipal use; and (3) factors that could influence utilities’ decisions to adopt these technologies. The meeting was recorded and transcribed to ensure that we accurately captured the experts’ statements. After the meeting, we analyzed the transcripts to characterize their responses and to structure the design of our study. Following the meeting, we continued to seek the experts’ advice to clarify and expand on what we had heard. Consistent with our quality assurance framework, we provided the experts with a draft of our report and solicited their feedback, which we incorporated as appropriate.
Additional interviews
We also interviewed:
• Federal agency officials from the Department of Defense, including researchers and the Army Corps of Engineers; Department of Energy, including some of its national laboratories; Department of the Interior, including the U.S. Geological Survey (USGS) and Bureau of Reclamation; Environmental Protection Agency (EPA); and U.S. Department of Agriculture.
• Representatives of industry organizations including the Association of Metropolitan Water Agencies, American Water Works Association, National Association of Water Companies, and National Rural Water Association.
• Representatives and researchers from nongovernmental organizations including the National Science Foundation’s
ReNUWIt Engineering Research Center,97 Water Research Foundation, and WateReuse Research Foundation.
• Managers and operators from American Water and individual water utilities in Cave City, Kentucky; Centreville, Virginia; the District of Columbia; El Paso, Texas; Kingston, Rhode Island; Louisa, Virginia; Lovettsville, Virginia; Middleburg, Virginia; Nashville, Illinois; Oakland, California; Orange County, California; Oshkosh, Wisconsin; Purcellville, Virginia; Talbott, Tennessee; West Rutland, Vermont; and Woodstock, Virginia.
Site visits
In addition, we used recommendations from drinking water experts to select four large municipal water utilities facing different water-related challenges and using technology in innovative ways to increase distribution system efficiency, to treat nontraditional water sources, or both. The selected utilities were DC Water in Washington, D.C.; East Bay Municipal Utility District in Oakland, California; El Paso Water Utilities in El Paso, Texas; and Upper Occoquan Service Authority in Centreville, Virginia. We then conducted site visits to these utilities to discuss their experiences with researching, testing, and deploying relevant technologies and to view these technologies in use. We also visited two national laboratories—Lawrence Livermore National Laboratory (LLNL) in Livermore, California and Sandia National Laboratories in Albuquerque, New Mexico—as well as the Bureau of Reclamation’s Brackish 97ReNUWIt is an acronym for Re-inventing the Nation’s Urban
Water Infrastructure.

Technology Assessment GAO-16-474 73
Groundwater National Desalination Research Facility in Alamogordo, New Mexico to discuss technologies that are in development, including challenges to developing and commercializing such technologies.
Technology assessment methodology
In this report, we rated each technology’s maturity in terms of its readiness for application in a system designed to improve the efficiency of a municipal water distribution system (Chapter 2 technologies) or to treat nontraditional water sources (Chapter 3 technologies). We assessed the maturity of each technology on a scale of 1 to 9 using technology readiness levels (TRL)—a standard metric that some federal agencies use for assigning technological maturity. Technologies with scores lower than TRL 6 are immature while a score of TRL 9 indicates a fully mature technology ready for deployment on a commercial scale. The TRL rating describes the maturity level of the whole
integrated system for its intended use for a specific application, rather than individual components of a particular technology. Agencies in the United States including the Department of Defense and the National Aeronautics and Space Administration use TRLs, as does the European Space Agency.
We used the Air Force Research Laboratory’s Technology Readiness Level Calculator to determine technology readiness levels of various technologies used by municipal water utilities. Table 13 outlines TRL levels and other key features defined by the Air Force Research Laboratory. We adapted these definitions to technologies designed for use by municipal water utilities. The first column in the table presents definitions of TRL levels. We reviewed and analyzed published data from scientific literature and the results from a GAO survey of municipal water utilities to determine the highest TRL level for which each technology could qualify and assigned that TRL rating to the referenced technology.
Level Description Example 1. Basic principles have been observed and reported.
The lowest level of technology readiness. Scientific research begins translation into applied research and development.
Paper studies of the technology’s basic properties
2. Technology concept or application has been formulated.
Invention begins. Once basic principles are observed, practical applications can be invented. The application is speculative and no proof or detailed analysis supports the assumption.
Limited to paper studies
3. Analytical and experimental critical function or characteristic proof of concept has been defined.
Active research and development begins. Includes analytical studies and laboratory studies to physically validate analytical predictions of separate elements of the technology.
Components that are not yet integrated or representative
4. Component or breadboard validation has been made in laboratory environment.
Basic technological components are integrated to establish that the pieces will work together. This is relatively “low fidelity” compared to the eventual system.
Ad hoc hardware integrated in a laboratory
5. Component or breadboard validation has been made in relevant environment.
Fidelity of breadboard technology increases significantly. The basic technological components are integrated with reasonably realistic supporting elements so the technology can be tested in a simulated environment.
“High fidelity” laboratory integration of components

Technology Assessment GAO-16-474 74
Level Description Example 6. System and subsystem model or prototype has been demonstrated in a relevant environment.
Representative model or prototype system is well beyond level 5 testing in a relevant environment. Represents a major step up in the technology’s demonstrated readiness.
Prototype tested in a high- fidelity laboratory or simulated operational environment
7. System prototype has been demonstrated in an operational environment.
A prototype is operational or nearly operational. Represents a major step up from level 6, requiring the demonstration of an actual system prototype in an operational environment, such as in an aircraft, vehicle, or space.
Prototype tested in a test bed aircraft
8. Actual system is complete and has been “flight qualified” in testing and demonstration.
Technology has been proven to work in its final form and under expected conditions. In almost all cases, this level represents the end of true system development.
Developmental test and evaluation of the system to determine if it meets design specifications
9. Actual system has been “flightproven” in successful mission operations.
The technology is applied in its final form and under mission conditions, such as those encountered in operational test and evaluation. In almost all cases, this is the end of the last “bug fixing” aspects of true system development.
The system is used in operational mission conditions
Source: GAO based on Nolte (2004). | GAO-16-474
Table 13 Description of nine technology readiness levels
Note: A breadboard is a representation of a system which can be used to determine concept feasibility and to develop technical data. It is typically configured for laboratory use (only). It may resemble the system in function only.
Limitations to scope for assessment of technologies
We limited the scope of our review to technologies that can be deployed at the utility scale for specific aspects of distribution system efficiency (i.e., leak detection, pressure management, pipe condition assessment, and metering) or for the treatment of seawater, brackish water, treated municipal wastewater, or storm water captured from developed areas. We did not assess all available or developing technologies. For example, we did not include decentralized technologies such as building-scale water reuse systems, household appliances and fixtures, or individual building service lines or interior plumbing. We also did not include typical pre- and post-treatment steps or modifications to existing technologies such as new or modified
membranes for use in reverse osmosis. In addition, we did not assess the many nontechnology and economic approaches a utility may consider for managing demand and supply in order to address water scarcity, such as rate structures and pricing strategies, customer rebates or incentives, or water purchases from another entity.
Scope and methodology for identifying where technologies are commonly adopted
In order to determine the locations and types of utilities where the technologies we assessed are commonly adopted, we conducted a nationwide survey of municipal water utilities and developed statistical models of technology adoption. Our analysis estimates nationwide technology adoption rates and identifies the locations and types of

Technology Assessment GAO-16-474 75
utilities that are most likely to adopt the technologies we assessed. Details of our survey and our statistical model are described below.
Survey of municipal water utilities
To determine the prevalence of the technologies we assessed, we surveyed a nationally representative sample of medium, large, and very large municipal water utilities about their use of technologies to increase the efficiency of their distribution system, such as leak detection technology, and to use nontraditional water sources, such as brackish water and treated municipal wastewater. The details of our survey, including the questionnaire design, the sample design, and the steps in survey administration, are described below.
Questionnaire design
We designed a questionnaire to survey municipal water utilities about four primary topics: (1) the technologies they use to improve distribution system efficiency; (2) the technologies they use to treat nontraditional water sources; (3) the challenges they face in using such technologies; and (4) the basic characteristics of their infrastructure, operations, and service area. To draft survey questions for each of these topics, we analyzed comments raised during the expert meeting we convened with water technology experts, as described in the previous section; we interviewed national associations representing municipal water utilities; and we reviewed published studies and government reports. Based on this process, for technologies used to promote distribution system efficiency, we identified those that
meter water flow, measure water pressure, detect leaks, and assess pipe condition. For nontraditional water sources, we identified seawater, brackish water, treated municipal wastewater, and municipal storm water runoff. For challenges utilities face in using these technologies, we identified several broad categories, including regulatory, financial, and technical.
After drafting the questionnaire, we pretested it during four rounds of interviews with officials from 14 municipal drinking water utilities in 8 states, including California, Illinois, Kentucky, Rhode Island, Tennessee, Vermont, Virginia, and Wisconsin. We selected these utilities based on recommendations from the National Rural Water Association and from utility-related members of our expert panel. Because technology adoption might vary by the scale of a water utility or by the water stress of a region, we sought to conduct pretests with utilities of various sizes in both water-stressed and non-water stressed regions. Of these pretests, 5 were conducted in person and 9 were conducted by telephone. During these pretests, we focused on making sure that (1) the questions were clear and unambiguous, (2) utilities had sufficient information to answer them, (3) the list of questions was comprehensive, and (4) the questionnaire could be completed without undue burden on utility officials. After each round of pretests we made revisions to clarify the questions, to decrease the likelihood of inaccurate responses, and to minimize response burden on utility officials. The questionnaire was independently peer-reviewed by a GAO survey specialist. This report does not contain all the results from the survey. The survey and a more complete tabulation of results can be viewed in the e-supplement to this report,

Technology Assessment GAO-16-474 76
Municipal Freshwater Scarcity: Survey of Technology Adoption by Municipal Water Utilities (GAO-16-588SP, April 2016), an E-supplement to GAO-16-474.
Sample design We selected a stratified random sample of 1,303 medium, large, and very large municipal water utilities located in the 48 contiguous states. To define the study population, we used EPA’s Safe Drinking Water Information System (SDWIS), which contained active municipal water utilities as of May 2015.98 We interviewed EPA database administrators and reviewed an EPA 2006 data quality audit and determined that the SDWIS data were sufficiently reliable for sampling. Our sample was drawn from among the study population of 8,005 utilities that met our selection criteria.99 We limited our study population to residential and municipal utilities that EPA classified as active and utilities reported to serve more than 3,300 people, which is EPA’s threshold for medium-sized utilities. We focused on medium and larger utilities because experts advised us that such a scale is compatible with many of the technologies we assessed in that these systems would likely be more technologically sophisticated and might have more staff to respond to our survey. We removed utilities serving institutional or transient populations and focused instead on community water systems that the EPA defines as serving the same population year-round. We removed utilities
98EPA categorizes these utilities as ‘community water systems,’
defined as public water systems that supply water to the same population year-round.
99Our original sample frame comprised 8,007 systems, but we later discovered that two pairs of systems in our sample had merged, changing the total to 8,005 systems.
serving Hawaii, Alaska, and the territories because of limitations on water stress data for those regions, which we used in selecting the sample and for subsequent analyses. We removed wholesalers because these utilities do not directly serve residential customers. Because EPA classifies the majority of community water systems as small or very small, our study population of 8,005 utilities comprises just 15 percent of the nearly 53,000 community water systems in the United States but serves nearly 225 million people, or about 75 percent of the 300.2 million people served by community water systems.
Through discussions with water technology experts, we determined that larger utilities and utilities located in water-stressed regions might be more likely to adopt technologies than smaller utilities or utilities located in non-water stressed regions. To account for this possibility, we sought to ensure that we received an adequate number of survey responses from these major types of utilities that would be likely to use nontraditional treatment technology. In particular, we classified utilities into seven strata defined by the population served, the estimated water stress in their watershed, and prior information about utilities with existing use of the technologies we assessed. Using data on water stress (see next section), we defined water-stressed regions for the purposes of our sample as those in which the demand for water is greater than 40 percent of the water supply.100 We obtained the names of utilities
100For the purposes of stratification, we defined our measure of
water stress based on the average WaSSI value for zip codes for utility service areas reported in EPA’s Unregulated Contaminants Monitoring Rule (UCMR) dataset, or, when unavailable, on the mailing address of the system in SDWIS. As discussed below, this measure differs slightly from that used in our final analysis, which is an area-weighted measure

Technology Assessment GAO-16-474 77
in California, Florida, and Texas that state officials had identified as either desalinating brackish or seawater or recycling treated wastewater. We created a certainty stratum of these utilities in order to have a sufficient number of utilities that have adopted technologies for treating nontraditional water sources. The division of utilities into these strata and the response rates for each stratum appear in table 14.
based on utilities’ self-reported service area in response to our survey.

Technology Assessment GAO-16-474 78
Stratum Description Total utilities in study
population
Total utilities in sample
Unweighted survey
response rate 1 Medium utilitiesa in water-stressed regionsb 475 200 61.0% 2 Large utilities in water-stressed regions 401 200 64.0% 3 Very large utilities in water-stressed regions 65 65 64.0% 4 Medium utilities in non-water stressed regions 3,858 200 66.5% 5 Large utilities in non-water stressed regions 2,768 200 67.7% 6 Very large utilities in non-water stressed regions 223 223 61.4% 7 Utilities with known use of the technologies we
assessedc 215 215 65.6%
Total 8,005 1,303 63.9%
Source: GAO. | GAO-16-474
Table 14 Strata for sample of municipal water utilities
aWe followed the size classifications developed by EPA, which defines medium utilities as those serving 3,301-10,000 people; large utilities as those serving 10,001-100,000 people; and very large utilities as those serving more than 100,000 people. bWe used the Water Supply Stress Index (WaSSI), developed by the U.S. Forest Service, to calculate water stress. For sampling purposes, we classified utilities as water-stressed if they were located in watershed in which the demand for water was greater than 40 percent of the water supply, on average, between 1981 and 2010. cWe identified utilities with known use of technologies through our outreach to California, Florida, and Texas officials who maintained such records.
Overall, our survey had an unweighted response rate of 63.9 percent and a weighted response rate of 64.6 percent. To assess the potential for nonresponse bias, we modeled the propensity to respond as a function of variables related to stratification and select other variables on the frame. We did not detect systematic evidence of differences in the propensity to respond among systems with different characteristics and do not have reason to believe that estimates based on our data would be subject to significant non-response bias. Accordingly, we did not make any post-stratification adjustments and consider our sample to be sufficiently generalizable to the population overall.
Because we selected a random sample, our sample is only one of a large number of samples that could have been selected from our study population. Because each of these
alternative samples could have provided different estimates of technology adoption rates, we express our confidence in the precision of our estimates as a 95 percent confidence interval. This is the interval that would contain the exact technology adoption rates of the study population for 95 percent of the samples that could have been drawn. All survey estimates we report are presented along with their margins of error at the 95 percent confidence level. Unless otherwise noted, percentage estimates that apply to the full population of utilities have a margin of error of 5.6 percentage points or less at the 95 percent confidence level. Estimates that apply to the subpopulation of utilities with treatment facilities, such as the percentage of utilities adopting a particular nontraditional treatment technology, have margins of error of plus or minus 11.2 percentage points or less at the 95 percent confidence level.

Technology Assessment GAO-16-474 79
Survey administration
We administered the survey to our sample of municipal water utilities over the World Wide Web between October 5, 2015, and December 17, 2015. We obtained email addresses for most of these utilities from EPA’s SDWIS database and EPA’s Unregulated Contaminants Monitoring Rule (UCMR) database. Of the remaining 217 systems in our sample, we obtained email addresses for 65 utilities from a request to the National Rural Water Association and for 109 utilities through telephone calls to the primary contact listed in the SDWIS database or searching online by the organization name, and we excluded 43 utilities from the administration because we were unable to obtain valid email addresses. Through the calling process we learned that two pairs of utilities had merged which decreased the number of utilities in the sample by two. For approximately 700 of the utilities, the SDWIS and the UCMR databases contained email addresses for multiple individuals. We reviewed the job titles of these individuals and selected a primary contact.
Because of difficulties obtaining email addresses for all utilities in a timely manner, we administered the survey in three cohorts. Cohort 1 consisted of 1,132 utilities and launched on October 5, 2015. Cohort 2, which included utilities whose email addresses required further investigation, consisted of 102 utilities and launched on October 30, 2015. Cohort 3, which included email addresses that were assigned to multiple systems, consisted of 28 utilities and launched on November 5, 2015. We sent multiple reminder emails to non-responding utilities encouraging them to respond and providing the information necessary to access the
survey. Five reminders were sent for cohort 1, three for cohort 2, and two for cohort 3. Three weeks after the launch of cohort 1, we mailed paper letters with information about accessing the survey via the Internet to the utilities that had not yet responded. Another paper letter with the same information was mailed to utilities who had not yet responded in cohort 1 and cohort 2 on November 23, 2015. From December 10 through December 14, 2015, we made phone calls to 41 utilities that had almost completed the survey but not yet finalized their answers to encourage them to finish and again give them information necessary to access the survey. We closed the survey on December 18, 2015.
Statistical analysis of technology adoption
To determine the types of utilities and locations where municipal water utilities are most likely to adopt the technologies we assessed, we matched the data from our survey with data on system, community, and watershed characteristics. We used these data to develop statistical models to test whether these characteristics—such as utility size, water stress, and household income—were correlated with utilities’ decisions to treat nontraditional water sources for municipal use. The details of our conceptual framework, data analysis, and statistical models are described below.
Measures of technology adoption
To categorize systems as having adopted technology to treat nontraditional water sources for municipal use, we developed a composite measure based on multiple survey questions about utilities’ water sources. In

Technology Assessment GAO-16-474 80
particular, we classified utilities as using nontraditional water sources for municipal use if they reported taking any of the following actions: (1) treating seawater for potable use; (2) treating brackish water for potable use; (3) recycling or reusing wastewater for direct potable use, indirect potable use, or nonpotable use; or (4) treating stormwater runoff captured from developed areas for direct potable use, indirect potable use, or nonpotable use.
Utility characteristics
We took several steps to identify key characteristics associated with utilities’ decisions to treat nontraditional water for municipal use. First, during the expert meeting that we convened at the National Academy of Sciences, we asked water technology experts to brainstorm factors that could influence technology adoption by drinking water utilities. We reviewed the transcript of that discussion to identify key factors and we identified specific data sources that could measure these factors in a statistical analysis. In particular, we calculated the following variables for our analysis:
• Utility size. Drinking water experts suggested that larger utilities would have greater capacity to adopt technology because they tend to have greater financial resources and more technical expertise than smaller utilities. Therefore, we hypothesized that larger utilities would be more likely to treat nontraditional water sources for municipal use. To capture utility size, we used the service population size field from the SDWIS database and EPA utility definitions, which categorize medium utilities as those serving 3,301-10,000
people; large utilities as those serving 10,001-100,000 people; and very large utilities as those serving more than 100,000 people.
• Utility ownership. Drinking water experts suggested that private utilities would have greater autonomy to raise service rates, greater capacity for research and development, and greater flexibility to adopt new technology as compared to public utilities. Therefore, we hypothesized that private utilities would be more likely than public utilities to treat nontraditional water sources for municipal use. We measured utility ownership using data from our survey indicating whether each utility was government owned or privately owned.
• Utility services. Drinking water experts told us that utilities responsible for managing either wastewater or storm water services, in addition to providing drinking water, would be better positioned to treat these nontraditional water sources for municipal use. Therefore, we hypothesized that such utilities would be more likely to do so. We measured utility services with a question on our survey that asked whether each utility managed either wastewater or storm water in addition to drinking water.
• Population growth. One expert suggested that utilities serving growing communities would need to be agile in water resources planning. We hypothesized that utilities serving a growing population would have a greater need for drinking water, and therefore, would be more likely to treat nontraditional water for municipal use. We used the SDWIS database to calculate the percentage change in service

Technology Assessment GAO-16-474 81
population for each utility between 2005 and 2015.
We calculated two geographic characteristics associated with each utility using geographic information system (GIS) software. In our survey, we asked drinking water utilities to list the zip codes that their utility serves. We used the geographic boundaries of these zip codes to approximate the boundary of the service area for each utility. We then matched each utility to economic data for the corresponding community and water stress data for the corresponding watershed using these approximate service area boundaries. In particular, we used this method to calculate the following characteristics.
• Community income. Drinking water experts told us that utilities serving higher income communities would have a greater ability to finance new technology. Therefore, we hypothesized that utilities serving higher income communities would be more likely to treat nontraditional water for municipal use. To measure community income, we calculated the per capita income and the overall poverty rate from the 2009-14 American Community Survey (ACS) for Zip Code Tabulation Areas (ZCTAs) as defined by the U.S. Census.
• Water stress. Experts suggested that utilities in water-stressed regions may need to be innovative to obtain sufficient supplies of water, and therefore, may be more likely to treat nontraditional water sources for municipal use. To estimate the water stress facing each drinking water utility in our sample, we used the Water Supply Stress Index (WaSSI) developed by the U.S. Forest Service. The WaSSI estimates the ratio of water
demand in a watershed to the water supply. As a measure of typical water stress in a region, we calculated the mean annual WaSSI score between 1981 and 2010 for each watershed in our sample, and as a measure of extreme water stress, we calculated the maximum annual WaSSI score during this period. We used GIS software to intersect watershed boundaries at the Hydrologic Unit Code (HUC) 8-digit level with the boundaries of service area and computed an area-weighted average for each system. We based our calculation of service area on the zip codes utilities reported as their service area in response to question 31 of our survey; this measure differs slightly from that used to stratify our sample and is expected to be somewhat more accurate.
• EPA region. In addition to the measured characteristics described above, which may vary by region of the country, it is possible that unmeasured characteristics which vary by region could influence technology adoption decisions. Therefore, we also examined the EPA region of each utility in our sample.
In addition to the factors mentioned above, drinking water experts also mentioned other factors that might be related to utilities’ technology adoption decisions but for which we were unable to obtain comprehensive data specific to each utility’s situation. In particular, experts mentioned that a key determinant of technology adoption decisions is the incremental cost of water. If a utility’s incremental cost is high, the utility might be more likely to treat a nontraditional source of water for municipal use. Because of difficulty in capturing a valid cost measure in light of local circumstances and different alternatives
Technology Assessment GAO-16-474 82
available to each utility, we could not control for cost in our model. Additionally, we could not directly control for other potentially important factors such as management capacity or local or state water rights laws.
Statistical analysis
We computed a series of bivariate statistical tests to examine the relationship between the measures of technology adoption and certain utility characteristics described above. In particular, we computed bivariate cross-tabulations between each measure of technology adoption and each characteristic. We used a Cochran–Mantel–Haenszel chi-squared test to determine whether each characteristic was statistically associated with each measure of technology adoption.101 Statistical significance does not imply a causal relationship between a given characteristic and a utility’s decision to adopt technology, but can help to identify which factors most strong relate to technology adoption.
101In cases with sparse cells, we used a Wald Chi-squared test
to assess statistical significance.
Having identified multiple utility characteristics that showed statistically significant relationships with technology adoption, we explored logistic regression analysis to assess the potential effect of each factor on treatment of nontraditional water sources, controlling for multiple utility characteristics. We explored a variety of characteristics and specifications and found generally consistent results in terms of which factors appeared to be significantly related to the adoption of nontraditional treatment technology. However, we also found some model instability in coefficient magnitude when different predictors were included, and we were unable to control for some variables likely to relate to adoption of nontraditional treatment technology, such as cost and local or state water rights laws. Despite these limitations, we believe our bivariate results and logistic regression models help to illustrate some critical factors that relate to a utility’s likelihood of adopting nontraditional treatment technologies, and provide insights for future research on the topic of water supply treatment technologies.

Technology Assessment GAO-16-474 83
Appendix II: Expert participation We collaborated with the National Academies to convene a two-day meeting of experts to inform our work on municipal water technologies; the meeting was held on January 29-30, 2015. The experts who participated in our study are listed below. Many of these experts gave us additional assistance throughout our work, including several who provided additional technical expertise and answered questions, 2 who pretested our survey, and 13 who reviewed our draft report for technical accuracy.
Bob Angelotti Director - Technical Services Division Upper Occoquan Service Authority Centreville, VA
Jerad Bales Chief Scientist for Water U.S. Geological Survey Reston, VA
John Boland Professor Emeritus John Hopkins University Baltimore, MD
Paul Boulos President Innovyze Broomfield, CO
Paul Brown President Paul Redvers Brown Inc. Carlsbad, CA
Cathy Chang Water Quality Program Manager Water Replenishment District of Southern California Lakewood, CA
John Crittenden Director, Brook Byers Institute for Sustainable Systems Georgia Institute of Technology Atlanta, GA
Menachem Elimelech Roberto Goizueta Professor Yale University New Haven, CT
Jerome Gilbert Former General Manager and Chief Engineer East Bay Municipal Utility District Oakland, CA
Katie Guerra Water Treatment Group U.S. Bureau of Reclamation Denver, CO
George Hawkins CEO and General Manager DC Water Washington, DC
Peter MacLaggan Senior Vice President of California Poseidon Water Carlsbad, CA

Technology Assessment GAO-16-474 84
Erika Mancha Team Lead - Innovative Water Technologies Texas Water Development Board Austin, TX
Howard Neukrug CEO and Commissioner Philadelphia Water Department Philadelphia, PA
Tom Pankratz Consultant/editor Global Water Intelligence Houston, TX
Mehul Patel Director of Water Production, GWRS Orange County Water District Fountain Valley, CA
Bruce Rittmann Director, Swette Center for Environmental Biotechnology Arizona State University Tempe, AZ
David Sedlak Malozemoff Professor Co-director of Berkeley Water Center University of California at Berkeley Berkeley, CA
R. Rhodes Trussell Founder & Chairman Trussell Technologies Pasadena, CA
David Wallenstein Associate Engineer East Bay Municipal Utility District Oakland, CA

Appendix III: GAO contact and staff acknowledgments GAO contact
Timothy M. Persons, Chief Scientist, at (202) 512-6412 or [email protected]
Staff acknowledgements
In addition to the contact named above, William Carrigg (Assistant Director), Karen Howard (Analyst-In-Charge), Pamela Aker, Mark Braza, Nirmal Chaudhary, Philip Farah, Farrah Graham, Jon Melhus, Anna Maria Ortiz, Walter Vance, and Lisa Vojta made key contributions to this report.
Pille Anvelt, Amy Bowser, Bruce Cain, Tim Carr, Dani Greene, Gloria Hernandez-Saunders, Cathy Hurley, and John Mingus also made important contributions.
In addition, Bradley Stokes contributed as a student intern.

Related GAO products Water Infrastructure: EPA and USDA Are Helping Small Water Utilities with Asset Management; Opportunities Exist to Better Track Results. GAO-16-237. Washington, D.C.: January 27, 2016.
Freshwater: Supply Concerns Continue, and Uncertainties Complicate Planning. GAO-14-430. Washington, D.C.: May 20, 2014.
Energy-Water Nexus: Amount of Energy Needed to Supply, Use, and Treat Water Is Location-Specific and Can Be Reduced by Certain Technologies and Approaches. GAO-11-225. Washington, D.C.: March 23, 2011.
Water Infrastructure: Comprehensive Asset Management Has Potential to Help Utilities Better Identify Needs and Plan Future Investments. GAO-04-461. Washington, D.C.: March 19, 2004.
Freshwater Supply: States’ Views of How Federal Agencies Could Help Them Meet the Challenges of Expected Shortages. GAO-03-514. Washington, D.C.: July 9, 2003.
Other GAO technology assessments
TECHNOLOGY ASSESSMENT: Water in the Energy Sector: Reducing freshwater use in hydraulic fracturing and thermoelectric power plant cooling. GAO-15-545. Washington, D.C.: August 7, 2015.
TECHNOLOGY ASSESSMENT: Nuclear Reactors: Status and challenges in development and deployment of new commercial concepts. GAO-15-652. Washington, D.C.: July 28, 2015.
TECHNOLOGY ASSESSMENT: Neutron Detectors: Alternatives to using helium-3. GAO-11-753. Washington, D.C.: September 29, 2011.
TECHNOLOGY ASSESSMENT: Climate Engineering: Technical status, future directions, and potential responses. GAO-11-71. Washington, D.C.: July 28, 2011.
TECHNOLOGY ASSESSMENT: Explosives Detection Technologies to Protect Passenger Rail. GAO-10-898. Washington, D.C.: July 28, 2010.
TECHNOLOGY ASSESSMENT: Protecting Structures and Improving Communications during Wildland Fires. GAO-05-380. Washington, D.C.: April 26, 2005.
TECHNOLOGY ASSESSMENT: Cybersecurity for Critical Infrastructure Protection. GAO-04-321. Washington, D.C.: May 28, 2004.
TECHNOLOGY ASSESSMENT: Using Biometrics for Border Security. GAO-03-174. Washington, D.C.: November 15, 2002.

GAO’s Mission
The Government Accountability Office, the audit, evaluation, and investigative arm of Congress, exists to support Congress in meeting its constitutional responsibilities and to help improve the performance and accountability of the federal government for the American people. GAO examines the use of public funds; evaluates federal programs and policies; and provides analyses, recommendations, and other assistance to help Congress make informed oversight, policy, and funding decisions. GAO’s commitment to good government is reflected in its core values of accountability, integrity, and reliability.
Obtaining Copies of GAO Reports and Testimony
The fastest and easiest way to obtain copies of GAO documents at no cost is through GAO’s website (http://www.gao.gov). Each weekday afternoon, GAO posts on its website newly released reports, testimony, and correspondence. To have GAO e-mail you a list of newly posted products, go to http://www.gao.gov and select “E-mail Updates.”
Order by Phone
The price of each GAO publication reflects GAO’s actual cost of production and distribution and depends on the number of pages in the publication and whether the publication is printed in color or black and white. Pricing and ordering information is posted on GAO’s website, http://www.gao.gov/ordering.htm.
Place orders by calling (202) 512-6000, toll free (866) 801-7077, or TDD (202) 512-2537.
Orders may be paid for using American Express, Discover Card, MasterCard, Visa, check, or money order. Call for additional information.
Connect with GAO
Connect with GAO on Facebook, Flickr, Twitter, and YouTube. Subscribe to our RSS Feeds or E-mail Updates. Listen to our Podcasts and read The Watchblog. Visit GAO on the web at www.gao.gov.
To Report Fraud, Waste, and Abuse in Federal Programs
Contact: Website: http://www.gao.gov/fraudnet/fraudnet.htm E-mail: [email protected] Automated answering system: (800) 424-5454 or (202) 512-7470
Congressional Relations
Katherine Siggerud, Managing Director, [email protected], (202) 512-4400, U.S. Government Accountability Office, 441 G Street NW, Room 7125, Washington, DC 20548
Public Affairs
Chuck Young, Managing Director, [email protected], (202) 512-4800 U.S. Government Accountability Office, 441 G Street NW, Room 7149 Washington, DC 20548
Please Print on Recycled Paper.