multivariate methods distinguishing mangrove community structure
TRANSCRIPT

Multivariate methods distinguishing mangrove communitystructure of Coringa in the Godavari Delta, East coast
of IndiaB. Satyanarayana,1,2∗ A.V. Raman,3 H. Mohd-Lokman,1 F. Dehairs,4
V. S. Sharma,3 and Dahdouh-Guebas Farid2,51Institute of Oceanography (INOS), University Malaysia Terengganu (UMT), Malaysia
2Complexite et Dynamique des Systemes Tropicaux, Departement de Biologie des Organismes,Faculte des Sciences, Universite libre de Bruxelles, ULB – Campus du Solbosch, CP 169,
Avenue Franklin D. Roosevelt 50, B-1050 Bruxelles, Belgium3Marine Biological Laboratory, Department of Zoology, Andhra University, Waltair, India
4Vrije Universiteit Brussel, ANCH, Pleinlaan 2, B-1050 Brussels, Belgium5Laboratory of General Botany and Nature Management, Mangrove Management Group,
Vrije Universiteit Brussel, Pleinlaan 2, B-1050 Brussels, Belgium∗Corresponding author: [email protected]
Multivariate analysis (PRIMER) based on mangrove tree density and basal area measurements inCoringa, a Bay-Mangrove ecosystem in the Indian sub-continent, revealed 6 different floristic groups. WhileGroup-1 and Group 2 characterized by a combination of Sonneratia apetala and S. caseolari-Avicenniaalba, reflected conditions typical of low-lying swamps, Group-3, consisting of Xylocarpus mekongensis,Rhizophora mucronata, R. apiculata and Bruguiera gymnorrhiza, was found close to the sea where highsaline conditions prevailed. Group-4 species, Avicennia marina, A. officinalis and Excoecaria agallocha,represented widespread distribution and were found almost everywhere within Coringa. Group-5 consistedof Lumnitzera racemosa, Ceriops decandra and Aegiceras corniculatum which occurred at sites not veryfar from the influence of Gautami-Godavari estuary, suggestive of their preference to low salinity regimes.Finally, Group-6 typically represented by Bruguiera cylindrica was seen interiorally at sites under thedirect influence of Bay waters. Delineation of sample sites and species records based on extensive fielddata will be invaluable for appropriate management (e.g. plantation) and conservation measures forCoringa.
Keywords: basal area and density, PRIMER, management and conservation, mangrove species’ associ-ation, vegetation structure
Introduction
Mangroves constitute a taxonomically diverseassemblage of several unrelated angiosperm fam-ilies with special adaptations (Tomlinson, 1986;
Abeysinghe et al., 2000), providing benefits rangingfrom protection against coastal erosion to the multi-ple forest products used by local population (Zhanget al., 2006; Gilman et al., 2008; Walters et al.,2008). They have been observed to mitigate the
401
Aquatic Ecosystem Health & Management, 12(4):401–408, 2009. Copyright C© 2009 AEHMS. ISSN: 1463-4988 print / 1539-4077 onlineDOI: 10.1080/14634980903334074
402 Satyanarayana et al. / Aquatic Ecosystem Health and Management 12 (2009) 401–408
effects of natural disasters like tsunamis (Kathire-san and Rajendran, 2005; Dahdouh-Guebas et al.,2005; Alongi, 2008; Bahuguna et al., 2008). Rain-fall and temperature are the basic climatic factorsgoverning the composition and geographical dis-tribution of mangrove species (Chapman, 1976;Tomlinson, 1986; Palihawadene and Pinto, 1989;Duke, 1992; Singh, 1996; Ellison and Farnsworth,2001). Within a site however, individual mangrovespecies may occupy distinct and discrete zonesalong a tidal gradient (i.e. seaward fringes or uplandreaches) attributable to inter-specific differences intolerance to variation in degree of tidal inundation,salinity or other measurable edaphic gradients thatco-vary with tidal elevation (reviewed by Snedaker,1982; Smith, 1992). In many parts of the world, aconspicuous zonation of tree species into almostmonospecific bands parallel to the coastline hasbeen reported (Snedaker, 1982).
Lugo et al. (1975), in a study of the role of photo-synthesis, respiration and transpiration on mangroveformations in south Florida, concluded that the gra-dient of metabolic efficiency could be a basis for theobserved (mangrove) zonation where gross photo-synthesis and transpiration are highest in the outerzone than decreased towards land. Wells (1982)conducted extensive fieldwork in the mangroves ofnorthern Australia and noticed seedlings of sev-eral species could grow in soils with salinity over65 psu (e.g. Avicennia marina, A. officinalis andRhizophora stylosa). Bunt et al. (1982) noted thatsome species common at the seaward mouth of anestuary are not present near the fresh, more riverineheadwater regions of the estuary. Duke (1992) pre-sented 4 categories of mangroves (plants preferringlow-tide level; low to mid-tide level; mid-tide leveland mid to high-tide level), based on their habitatselection i.e. estuary location and intertidal position.In river dominated swamps where episodic inflowscould drive drastic changes in salinity, the extent ofinundation or inundation frequency (with respect tolandward, mid-forest or seaward sites) could play animportant role in structuring mangrove distributions(Satyanarayana et al., 2002; Satyanarayana, 2005).
Mapping mangroves is a prerequisite to under-standing vegetation structure for conservation andmanagement objectives (e.g. establishment, protec-tion and management of afforestation). This paperdiscusses results of an extensive survey of man-grove density (stems 0.1 ha−1) and basal area (m2
0.1 ha−1) data used for clustering and ordination ofspecies in the Coringa Reserve Forest. The specific
objective (besides taxonomic listing of mangrovespecies) was to examining mangrove (species) asso-ciation patterns and their distribution in terms of di-versity and richness (tree density and wood volume)looking at mangrove rejuvenation work currentlyunderway for this important but highly vulnerablehabitat.
Material and Methods
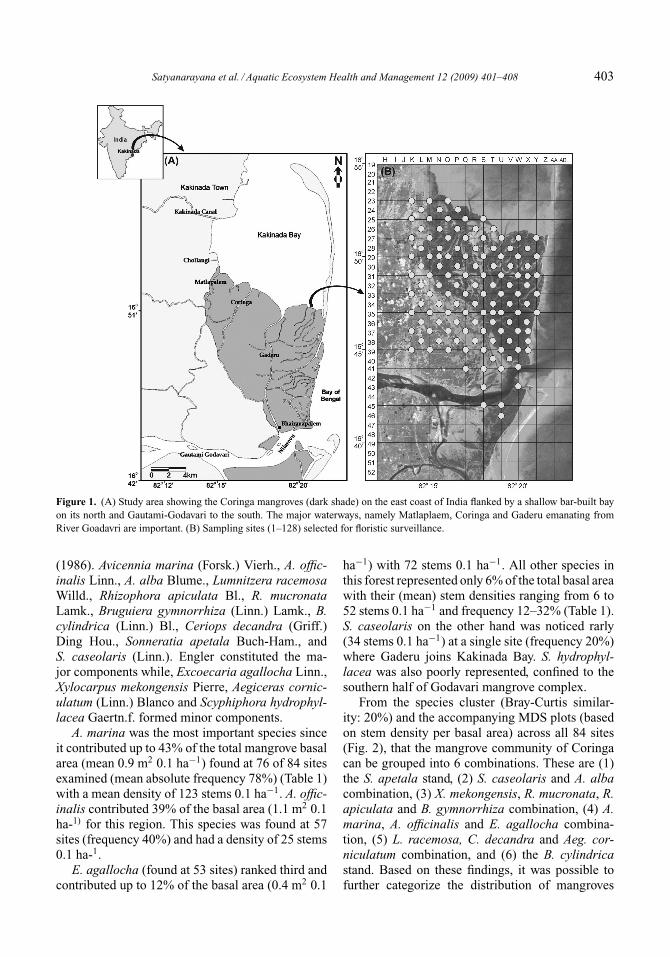
The Coringa mangrove forest (N: 16◦32′-16◦55′and E: 82◦11′-82◦21′) is located in the GodavariDelta south of Kakinada Bay in the State of AndhraPradesh (Fig. 1). Altogether, 128 sites (based ona pre-determined grid at 0.9–1.8 km intervals)were investigated of which 84 represented man-groves proper. All field sites were reached withthe help of a Global Positioning System (Model45, Garmin Electronics, USA). A Point-Centered-Quarter Method (PCQM) (Cintron and Novelli,1984) was used to estimate different tree structuralvariables such as density (stems 0.1 ha−1), basal area(m2 0.1 ha−1), relative density (%), relative domi-nance (%), absolute frequency (%), and species in-dividual rankings at each mangrove sampling point.
Multivariate methods used during this study takeinto account comparison of two (or more) samplesi.e. the extent to which they share particular speciesat comparable levels of abundance. The analysis cancluster records of sampling sites and species intoseveral groups in relation with their closely resem-bling characteristics (Evans et al., 2002). The pro-cedure is based on similarity coefficients (distancematrix) calculated between every pair of sampleswhich in turn facilitates either a classification orclustering of samples into groups or an ordinationplot in which the samples are “mapped” (in 2 or 3 di-mensions) in such a way that the distances betweenpairs of samples reflect their relative dissimilarity ofspecies composition. During this study, stem densityand basal area were used to distinguish mangrovecommunity structure on the basis of hierarchicalclustering (Bray-Curtis similarity, clustering mode:group average) and ordination through Non-metricMulti-dimensional Scaling (MDS) implemented inPRIMER v.5 (Clarke and Warwick, 1994; Clarkeand Gorley, 2001).
Results
The mangroves at Coringa were comprised of15 species – classified according to Tomlinson
Satyanarayana et al. / Aquatic Ecosystem Health and Management 12 (2009) 401–408 403
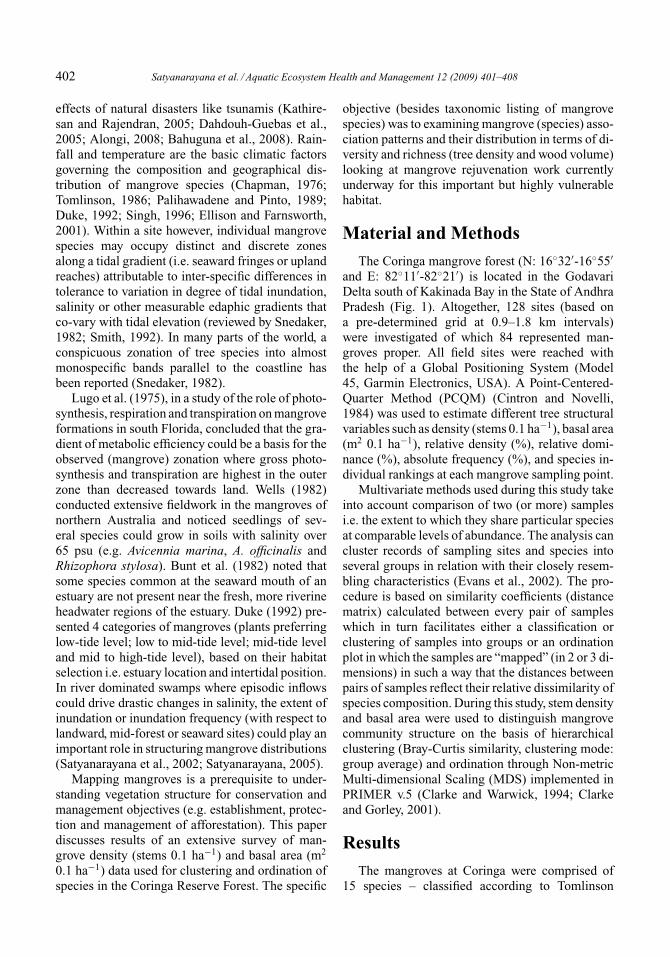
Figure 1. (A) Study area showing the Coringa mangroves (dark shade) on the east coast of India flanked by a shallow bar-built bayon its north and Gautami-Godavari to the south. The major waterways, namely Matlaplaem, Coringa and Gaderu emanating fromRiver Goadavri are important. (B) Sampling sites (1–128) selected for floristic surveillance.
(1986). Avicennia marina (Forsk.) Vierh., A. offic-inalis Linn., A. alba Blume., Lumnitzera racemosaWilld., Rhizophora apiculata Bl., R. mucronataLamk., Bruguiera gymnorrhiza (Linn.) Lamk., B.cylindrica (Linn.) Bl., Ceriops decandra (Griff.)Ding Hou., Sonneratia apetala Buch-Ham., andS. caseolaris (Linn.). Engler constituted the ma-jor components while, Excoecaria agallocha Linn.,Xylocarpus mekongensis Pierre, Aegiceras cornic-ulatum (Linn.) Blanco and Scyphiphora hydrophyl-lacea Gaertn.f. formed minor components.
A. marina was the most important species sinceit contributed up to 43% of the total mangrove basalarea (mean 0.9 m2 0.1 ha−1) found at 76 of 84 sitesexamined (mean absolute frequency 78%) (Table 1)with a mean density of 123 stems 0.1 ha−1. A. offic-inalis contributed 39% of the basal area (1.1 m2 0.1ha-1) for this region. This species was found at 57sites (frequency 40%) and had a density of 25 stems0.1 ha-1.
E. agallocha (found at 53 sites) ranked third andcontributed up to 12% of the basal area (0.4 m2 0.1
ha−1) with 72 stems 0.1 ha−1. All other species inthis forest represented only 6% of the total basal areawith their (mean) stem densities ranging from 6 to52 stems 0.1 ha−1 and frequency 12–32% (Table 1).S. caseolaris on the other hand was noticed rarly(34 stems 0.1 ha−1) at a single site (frequency 20%)where Gaderu joins Kakinada Bay. S. hydrophyl-lacea was also poorly represented, confined to thesouthern half of Godavari mangrove complex.
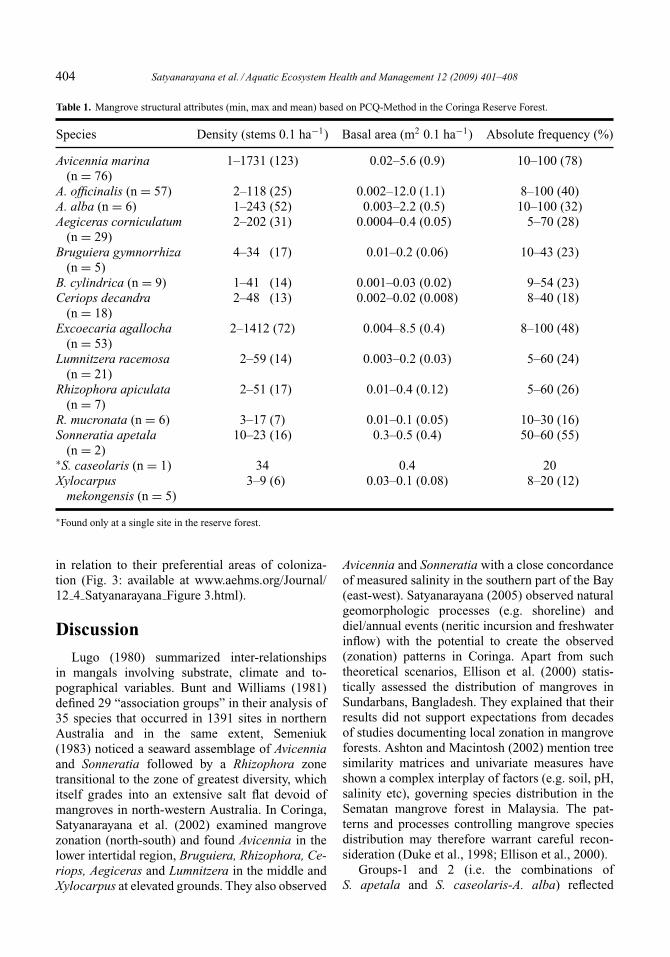
From the species cluster (Bray-Curtis similar-ity: 20%) and the accompanying MDS plots (basedon stem density per basal area) across all 84 sites(Fig. 2), that the mangrove community of Coringacan be grouped into 6 combinations. These are (1)the S. apetala stand, (2) S. caseolaris and A. albacombination, (3) X. mekongensis, R. mucronata, R.apiculata and B. gymnorrhiza combination, (4) A.marina, A. officinalis and E. agallocha combina-tion, (5) L. racemosa, C. decandra and Aeg. cor-niculatum combination, and (6) the B. cylindricastand. Based on these findings, it was possible tofurther categorize the distribution of mangroves
404 Satyanarayana et al. / Aquatic Ecosystem Health and Management 12 (2009) 401–408
Table 1. Mangrove structural attributes (min, max and mean) based on PCQ-Method in the Coringa Reserve Forest.
Species Density (stems 0.1 ha−1) Basal area (m2 0.1 ha−1) Absolute frequency (%)
Avicennia marina(n = 76)
1–1731 (123) 0.02–5.6 (0.9) 10–100 (78)
A. officinalis (n = 57) 2–118 (25) 0.002–12.0 (1.1) 8–100 (40)A. alba (n = 6) 1–243 (52) 0.003–2.2 (0.5) 10–100 (32)Aegiceras corniculatum
(n = 29)2–202 (31) 0.0004–0.4 (0.05) 5–70 (28)
Bruguiera gymnorrhiza(n = 5)
4–34 (17) 0.01–0.2 (0.06) 10–43 (23)
B. cylindrica (n = 9) 1–41 (14) 0.001–0.03 (0.02) 9–54 (23)Ceriops decandra
(n = 18)2–48 (13) 0.002–0.02 (0.008) 8–40 (18)
Excoecaria agallocha(n = 53)
2–1412 (72) 0.004–8.5 (0.4) 8–100 (48)
Lumnitzera racemosa(n = 21)
2–59 (14) 0.003–0.2 (0.03) 5–60 (24)
Rhizophora apiculata(n = 7)
2–51 (17) 0.01–0.4 (0.12) 5–60 (26)
R. mucronata (n = 6) 3–17 (7) 0.01–0.1 (0.05) 10–30 (16)Sonneratia apetala
(n = 2)10–23 (16) 0.3–0.5 (0.4) 50–60 (55)
∗S. caseolaris (n = 1) 34 0.4 20Xylocarpus
mekongensis (n = 5)3–9 (6) 0.03–0.1 (0.08) 8–20 (12)
∗Found only at a single site in the reserve forest.
in relation to their preferential areas of coloniza-tion (Fig. 3: available at www.aehms.org/Journal/12 4 Satyanarayana Figure 3.html).
Discussion
Lugo (1980) summarized inter-relationshipsin mangals involving substrate, climate and to-pographical variables. Bunt and Williams (1981)defined 29 “association groups” in their analysis of35 species that occurred in 1391 sites in northernAustralia and in the same extent, Semeniuk(1983) noticed a seaward assemblage of Avicenniaand Sonneratia followed by a Rhizophora zonetransitional to the zone of greatest diversity, whichitself grades into an extensive salt flat devoid ofmangroves in north-western Australia. In Coringa,Satyanarayana et al. (2002) examined mangrovezonation (north-south) and found Avicennia in thelower intertidal region, Bruguiera, Rhizophora, Ce-riops, Aegiceras and Lumnitzera in the middle andXylocarpus at elevated grounds. They also observed
Avicennia and Sonneratia with a close concordanceof measured salinity in the southern part of the Bay(east-west). Satyanarayana (2005) observed naturalgeomorphologic processes (e.g. shoreline) anddiel/annual events (neritic incursion and freshwaterinflow) with the potential to create the observed(zonation) patterns in Coringa. Apart from suchtheoretical scenarios, Ellison et al. (2000) statis-tically assessed the distribution of mangroves inSundarbans, Bangladesh. They explained that theirresults did not support expectations from decadesof studies documenting local zonation in mangroveforests. Ashton and Macintosh (2002) mention treesimilarity matrices and univariate measures haveshown a complex interplay of factors (e.g. soil, pH,salinity etc), governing species distribution in theSematan mangrove forest in Malaysia. The pat-terns and processes controlling mangrove speciesdistribution may therefore warrant careful recon-sideration (Duke et al., 1998; Ellison et al., 2000).
Groups-1 and 2 (i.e. the combinations ofS. apetala and S. caseolaris-A. alba) reflected
Satyanarayana et al. / Aquatic Ecosystem Health and Management 12 (2009) 401–408 405
Figure 2. Mangrove species similarity at 84 sites: (A) Species cluster and MDS ordination based on stem density (stems 0.1 ha−1).(B) Species cluster and MDS ordination based on basal area (m2 0.1 ha−1).
conditions (with high inundation) typical of thelow-lying marginal swamps at the bay-mangroveinterface (Fig. 3A-B available at www.aehms.org/Journal/12 4 Satyanarayana Figure 3A-B.html).These species are known to occur as important pio-neers along the open coasts on silty and silty-sandysubstrates (Chapman, 1976; Tomlinson, 1986;Gallin et al., 1989; Satyanarayana et al., 2002; FAO,2007). Group-3 (X. mekongensis, R. apiculata, R.mucronata and B. gymnorrhiza) occur close to thesea indicating tolerance to a wide range of salinity(Wells, 1982; Tomlinson, 1986). Group-4 speciesincluded A. marina, A. officinalis and E. agallocha,with widespread distributions found almost every-where in Coringa (Fig. 3C-D available at www.aehms.org/Journal/12 4 Satyanarayana Figure 3C-D.html).
Between A. marina and A. officinalis, A.marina was prevalent due to its physiological(aerenchyma) superiority through efficient root ven-tilation (Naidoo et al., 1997). While A. marina typ-ically displayed a bimodal frequency distributionoccurring from Bay side towards interior areas andup to estuary (Satyanarayana et al., 2002), A. of-ficinalis was predominant at mid-tide level, possi-bly due to a lower tolerance to floods. Despite itsequally widespread occurrence, E. agallocha, how-ever, seemed to prefer landward (elevated) locationswhere the species exhibited high stem density (1412stems 0.1 ha−1) and basal area (8.5 m2 0.1 ha−1)
evidently due to its adaptability to such grounds(Tomlinson, 1986; Dahdouh-Guebas et al., 2000).Group-5 consisted of L. racemosa, C. decandraand Aeg. corniculatum occurring along the Coringamain channel and at sites east of Gaderu, not veryfar from the influence of Gautami-Godavari estuarysuggestive of their preference to low salinity regimes(Fig. 3A-B available at www.aehms.org/Journal/12 4 Satyanarayana Figure 3A-B.html).
In the Coringa channel, surface salinity is low(mean, 14.37 ± 1.53 psu) mostly owing to drainagefrom the neighboring agriculture fields (EC FinalReport, 2003). Similarly, the east Gaderu creeks ex-perience salinity of the order of 12.81–21.23 psucaused by rather persistent flow from Gautami-Godavari. The occurrence of C. decandra withits highest abundance at salinity between 8–13psu was reported by Ellison et al. (2000). Group-6 represented by B. cylindrica was characteristi-cally present at interior sites under the direct influ-ence of Bay waters. Absence of B. cylindrica withsuch dominance at other sites (see Fig. 3 availableat www.aehms.org/Journal/12 4 SatyanarayanaFigure 3.html). indicated the species’ preference forthese locations.
These local patterns of species distributionsin mangroves are qualitative and site-specificrather than quantitative (Watson, 1928). More-over, the mangrove formations are particularly sus-ceptible to natural geomorphological and climatic

406 Satyanarayana et al. / Aquatic Ecosystem Health and Management 12 (2009) 401–408
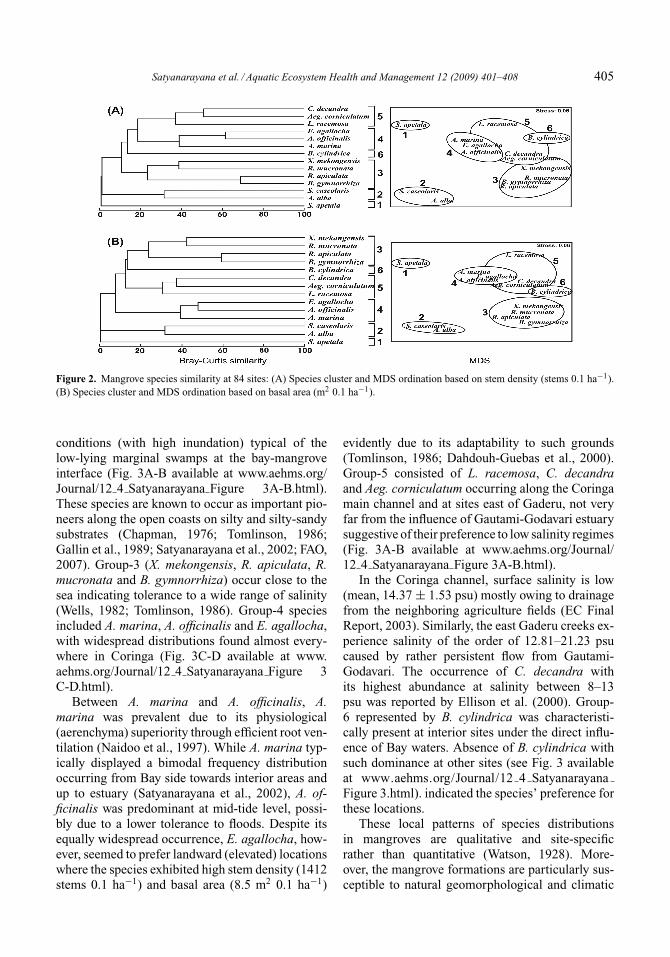
Figure 3. Distribution of mangrove species groupings in Coringa: (A) Groups – 1&2 (S. apetala, S. caseolaris and A. alba), Group-3(X. mekongensis, R. mucronata, R. apiculata and B. gymnorrhiza), Group-5 (L. racemosa, C. decandra and Aeg. corniculatum), andGroup-6 (B. cylindrical), based on stem density (stems 0.1 ha−1) and, (B) Basal area (m2 0.1 ha−1). Group-4 (A. marina, A. officinalisand E. agallocha) distribution based on stem density (C) and basal area (D) (scale: small and big circles in each panel representminimum and maximum values of the corresponding groups).
perturbations (Smith et al., 1994), which can reg-ulate the extent and structure of mangrove forestsand may mask the local importance of spatial ortemporal variation in salinity by limiting distribu-tion or abundance of individual species (Ball andPidsley, 1995; Ellison et al., 2000; Teh et al., 2008).Recent work suggests that establishment/growth ofmangroves (particularly seedlings) could be influ-enced by several abiotic and biotic factors such as
light availability, soil condition, tidal current, salin-ity, animal predation, propagule size and dispersal,intra- and interspecies competition etc. (Berger andHildenbrandt, 2000; Zhang et al., 2006; Green et al.,2006; Cannicci et al., 2008). In this context, theaccount on species groupings and distribution inCoringa, and its applicability to other mangrove re-gions is rather tentative unless similar attempts aremade and compared.
Satyanarayana et al. / Aquatic Ecosystem Health and Management 12 (2009) 401–408 407
Conclusions
In summary, our findings in the Coringa re-gion have shown the presence of discrete man-grove associations (groupings) largely determinedby geographic location (sea or landward), freshwa-ter runoff and the extent of inundation. Delineationof sampling sites and species through procedures ofthe kind employed during this study would be advan-tageous for monitoring and management purposesconsidering that mangrove rejuvenation efforts witha preference given to species’ association/locationcan avoid interspecies competition. In this context, itwould be appropriate to take into account the sparsepopulations of S. caseolaris and S. hydrophyllaceain the Coringa forest that require immediate conser-vation efforts.
Acknowledgements
The present study was undertaken as a part ofINCO DC (CII*-CT 93-0320 & ERB IC 18-CT 98-0295) and MoES-funded projects (DOD/1/CZM/1/97/AUR/19.3.’98) between 1995 and 2002.
Mr. Satyanarayana is supported by the BelgianNational Science Foundation (FNRS). Authors aregrateful to financial and administrative authoritiesat the European Commission, MoES – New Delhi,Andhra University and FNRS. Special thanks aredue to Nico and Steven at VUB (Brussels), and Prof.Noor Azhar at INOS (Malaysia) for the courtesiesextended. Our earnest thanks to everyone who as-sisted in our field surveys. Finally, our sincere grati-tude to the two unknown referees for their objectivecriticism and invaluable suggestions.
ReferencesAbeysinghe, P. D., Triest, L., Greef, B. D., Koedam, N.,
Hettiarachi, S., 2000. Genetic and geographic variation ofthe mangrove tree Bruguiera in Sri Lanka. Aquat. Bot. 67,131–141.
Alongi, D. M., 2008. Mangrove forests: Resilience, protectionfrom tsunamis, and responses to global climate change. Es-tuar. Coast. Shelf S. 76, 1–13.
Ashton, E. C., Macintosh, D. J., 2002. Preliminary assessment ofthe plant diversity and community ecology of the Sematanmangrove forest, Sarawak, Malaysia. For. Ecol. Manage. 166,111–129.
Bahuguna, A., Nayak, S., Roy, D., 2008. Impact of the tsunamiand earthquake of 26th December 2004 on the vital coastalecosystems of the Andaman and Nicobar Islands assessedusing RESOURCESAT AWiFS data. Int. J. Appl. Earth Obs.10, 229–237.
Ball, M. C., Pidsley, S. M., 1995. Growth responses to salinity inrelation to distribution of two mangrove species, Sonneratiaalba and S. lanceolata, in Northern Australia. Funct. Ecol. 9,77–85.
Berger, U., Hildenbrandt, H., 2000. A new approach to spatiallyexplicit modelling of forest dynamics: spacing, ageing andneighbourhood competition of mangrove trees. Ecol. Model.132, 287–302.
Bunt, J. S., Williams, W. T., 1981. Vegetation relationships inthe mangroves of tropical Australia. Mar. Ecol. Prog. Ser. 4,349–359.
Bunt, J. S., Williams, W. T., Clay, H. J., 1982. River wa-ter salinity and the distribution of mangrove species alongseveral rivers in north Queensland. Aust. J. Bot. 30, 401–412.
Cannicci, S., Burrows, D., Fratini, S., Smith, T. J. III, Offenberg,J., Dahdouh-Guebas, F., 2008. Faunal impact on vegetationstructure and ecosystem function in mangrove forests: A re-view. Aquat. Bot. 89, 186–200.
Chapman, V. J., 1976. Mangrove vegetation. J Cramer, FL-9490Vaduz, Germany.
Cintron, G., Novelli, Y. S., 1984. Methods for studying mangrovestructure. In: C.S. Samuel, G.S. Jane (Eds.), The Mangroveecosystem: Research Methods, pp. 91–113. UNESCO Publi-cation, Paris.
Clarke, K. R., Gorley, R. N., 2001. PRIMER v5: User Man-ual/Tutorial. Plymouth Marine Laboratory, U.K.
Clarke, K. R., Warwick, R. M., 1994. Change in Marine Commu-nities: An approach to Statistical Analysis and Interpretation.Plymouth Marine Laboratory, U.K.
Dahdouh-Guebas, F., Verheyden, A., De Genst, W., Het-tiarachchi, S., Koedam, N., 2000. Four decade vegetationdynamics in Sri Lankan mangroves as detected from sequen-tial aerial photography: a case study in Galle. Bull. Mar. Sci.67, 741–759.
Dahdouh-Guebas, F., Jayatissa, L. P., Di Nitto, D., Bosire, J. O., LoSeen, D., Koedam, N., 2005. How effective were mangrovesas a defence against the recent tsunami? Curr. Biol. 15, R443–447.
Duke, N. C., 1992. Mangrove floristics and biogeography. In:A. I. Robertson, D. M. Alongi (Eds.), Coastal and Estuar-ine studies: 41, Tropical Mangrove Ecosystems, pp. 63–100.American Geological Union, Washington, DC.
Duke, N. C., Ball, M. C., Ellison, J. C., 1998. Factors influenc-ing biodiversity and distributional gradients in mangroves.Global Ecol. Biogeogr. 7, 27–47.
EC Final Report, 2003. Climatic settings of the study sites. In:Assessment of mangrove degradation and resilience in the In-dian subcontinent: the cases of Godavari estuary and South-west Sri Lanka, pp. 30–36. Final report of EU DC INCOcontract ERB IC18-CT98–0295, Belgium.
Ellison, A. M., Farnsworth, E. J., 2001. Mangrove communities.In: M. D. Bertness, S. Gaines, M. E. Hay (Eds.), MarineCommunity Ecology, pp. 423–442. Sinauer Press, Sunder-land, Massachusetts, USA.
Ellison, A. M., Mukherjee, B. B., Karim, A., 2000. Testing pat-terns of zonation in mangroves: scale dependence and en-vironmental correlates in the Sundarbans of Bangladesh. J.Ecol. 88, 813–824.
408 Satyanarayana et al. / Aquatic Ecosystem Health and Management 12 (2009) 401–408
Evans, S., Harborne, A., Afzal, D., Andrews, M., Raines, P., 2002.Summary of Coral Cay conservation’s habitat mapping datafrom Utila, Honduras. Centre for Advanced Spatial Analysis(CASA), University College London, Working paper series,Paper # 46.
FAO, 2007. Mangrove guidebook for Southeast Asia(RAP/2006/07). Dharmasarn Co., Ltd., Bangkok, Thailand.
Gallin, E., Coppejans, E., Beeckman, H., 1989. The mangrovevegetation of Gazi Bay (Kenya). Belg. J. Bot. 122, 197–207.
Gilman, E., Ellison, J., Duke, N. C., Field, C., 2008. Threats tomangroves from climate change and adaptation options: areview. Aquat. Bot. 89, 237–250.
Green, D. G., Klomp, N., Rimmington, G., Sadedin, S., 2006.Complexity in landscape ecology. In: H. Decamps, B. Tress,G. Tress (Eds.), Populations in landscapes (Chapter-6), pp.85–98. Springer publication, The Netherlands.
Kathiresan, K., Rajendran, N., 2005. Coastal mangrove forestsmitigated tsunami. Estuar. Coast. Shelf S. 65, 601–606.
Lugo, A. E., 1980. Mangrove ecosystem: successional or steadystate. Biotropica 12, 65–72.
Lugo, A. E., Evink, G., Brinson, M. M., Broce, A., Snedaker, S.C., 1975. In: Diurnal rates of photosynthesis, respiration andtranspiration in mangrove forests of south Florida (Chapter-22), pp. 335–350. Springer-Verlag, New York Inc., USA.
Naidoo, G., Rogalla, H., von Willert, D. J., 1997. Gas exchangeresponses of a mangrove species, Avicennia marina to water-logged and drained conditions. Hydrobiologia 352, 39–47.
Palihawadene, N. S., Pinto, L., 1989. Survival of seedlings of Rhi-zophora mucronata Lam. and Ceriops tagal (Perr.) C.B.Rob.under different environmental conditions. The Sri LankaForester 19, 31–39.
Satyanarayana, B., 2005. Ecobiology and remote sensing basedstudy of Coringa mangroves in the Godavari delta, East coastof India. Ph.D. thesis, Andhra University, Waltair, India.
Satyanarayana, B., Raman, A. V., Dehairs, F., Kalavati, C.,Chandramohan, P., 2002. Mangrove floristic and zonationpatterns of Coringa, Kakinada Bay, East coast of India. Wet-lands Ecology and Management 10, 25–39.
Semeniuk, V., 1983. Mangrove distribution in northwesternAustralia in relationship to regional and local fresh waterseepage. Vegetatio 53, 11–31.
Singh, H. S., 1996. Successional stages of mangroves in the Gulfof Kutch. The Indian Forester 122, 212–219.
Smith, T. J. III., 1992. Forest structure. In: A. I. Robertson, D. M.Alongi (Eds.), Coastal and Estuarine studies: 41, TropicalMangrove Ecosystems, pp. 101–136. American GeophysicalUnion, Washington, DC.
Smith, T. J. III., Robblee, M. B., Wanless, H. R., Doyle, T. W.,1994. Mangroves, hurricanes, and lightening strikes. Bio-Science 44, 265–262.
Snedaker, S. C., 1982. Mangrove species zonation: Why? In: D.N. Sen, K.S. Rajpurohit (Eds.), Tasks for vegetation Science2, pp. 111–125. Dr. W. Junk Publishers, The Hague, TheNetherlands.
Teh, S. Y., DeAngelis, D. L., Sternberg, L. S. L., Miralles-Wilhelm, F. R., Smith, T. J. III, Koh, H-L., 2008. A simulationmodel for projecting changes in salinity concentrations andspecies dominance in the coastal margin habitats of the Ev-erglades. Ecol. Model. 213, 245–256.
Tomlinson, P. B., 1986. The Botany of Mangroves. CambridgeUniversity Press, New York.
Walters, B. B., Ronnback, P., Kovacs, J., Crona, B., Hussain, S.,Badola, R., Primavera, J. H., Barbier, E. B., Dahdouh-Guebas,F., 2008. Ethnobiology, socio-economics and adaptive man-agement of mangroves: a review. Aquat. Bot. 89, 220–236.
Watson, J. G., 1928. Mangrove forests of the Malay Peninsula.Malayan Forest Records 6, 1–275.
Wells, A. G., 1982. Mangrove vegetation of Northern Australia.In: B. F. Clough (Ed.), Mangrove Ecosystems in Australia:Function and Management, pp. 57–78. Australian NaturalUniversity Press, Canberra, Australia.
Zhang, Y., Wang, W., Wu, Q., Fang, B., Lin, P., 2006. The growthof Kandelia candel seedlings in mangrove habitats of theZhangjiang estuary in Fujian, China. Acta Ecologica Sinica26, 1648–1656.