multivariate classification of automobiles by use of...
TRANSCRIPT

29
Multivariate Classification of Automobiles
by Use of an Automobile Characteristics Data Base Robin Dubin, Department of Geography and Environmental Engineering,
Johns Hopkins University, Baltimore David L. Greene and Connie Begovich, Oak Ridge National Laboratory,
Oak Ridge, Tennessee
Interest in forecasting the fuel efficiency of the automobile population has led to the development of automobile market·shares demand models. The validity of these models depends on the automobile classification used, yet little rigorous attention has been given to the problem of classi· tying automobiles for demand analysis. All existing models use classifications that are heavily subjective and rely on only one or two vehicle characteristics for classification. A cluster analysis of 125 models of 1975 automobiles was conducted in order to aggregate the vehicles into homogeneous groups suitable for modeling the demand for automobiles by vehicle type. Eight variables extracted from an automobile characteristics data base developed by the U.S. Department of Transportation were employed: curb weight, wheelbase, engine displacement, roominess, passenger capacity, fuel economy, list price, and power-to-weight ratio. Several weighting schemes, two-distance metrics, and hierarchical as well as nonhierarchical clustering techniques were used. The analysis strongly indicated that two- and six-group configurations were important. Within the six-group clustering, the three groups that had the highest average seat kilometers per liter and seats per initial cost comprised more than 80 percent of sales in 1975. A comparison of the cluster-analysis grouping with another classification used in a recent econometric automobiledemand model showed that the multivariate clustering did a consistently better job of accounting for the variability of vehicle characteristics.
Perhaps the most significant recent advance in the state of the art of long-run automobile-demand modeling has been the development of market-shares models (1-5). Models that divide new automobile sales among vehicle classes have enabled the forecasting of changes in the composition of automobile populations in response to changing energy prices and other factors. This capability has greatly enhanced the utility of automobile- and gasoline-demand models as policy-evaluation tools. Equally important to the development of meaningful models as the shares methodology itself is the classification of vehicles into meaningful groups. Although classification is a necessary first step to the creation of a shares model, the subject has been given surprisingly little rigorous attention by researchers. This paper presents an investigation of the structure of the population of automobile types via cluster analysis. A data set that contains selected characteristics of 1975 model year automobiles sold in the United States was explored via techniques of cluster analysis to derive a vehicle typology useful for automobile- and gasolinedemand modeling.
PREVIOUS CLASSIFICATIONS AND THE AGGREGATION ISSUE
The first question that must be addressed in determining a typology for demand modeling is, What in economic theory allows commodities such as automobiles of various types to be aggregated and treated as a single commodity and what criteria are provided by which to judge the goodness of a classification? On an intuitive level it is apparent that one would like to aggregate automobiles that are as much alike as possible. One
would like to ignore the superfluous distinctions among automobiles and group them into a few homogeneous classes. Economic theory enables us to place a more precise interpretation on these intuitive ideas.
According to the theory of the consumer, a group of commodities may be aggregated and represented as a single argument in a utility or demand function if and only if the marginal rate of substitution between any two variables in the group is independent of any variable in the utility function not in the group. This property, termed weak separability (6, Chapter 3), implies that trade-offs (purchase decisfOns) between group members are not influenced by variables outside of the group. To give a concrete example, expenditures on gasoline should not affect the consumer's choice between, for example, a Pinto ·and a Vega (assuming that these two automobiles are in the same group), but it may affect the choice between a Pinto (or Vega) and a Plymouth Fury. Therefore, the latter do not belong in the same group. The number of household members should also not affect the choice between smaller automobiles but, if it enters the household-utility function, it may influence the choice between a smaller or a larger automobile. Choices among automobiles within groups may be made purely on the basis of such factors as aesthetics {e.g., styling or response to advertising) that are, presumably, unaffected by other arguments in the consumer's utility function.
Clearly, then, it should be sufficient to divide automobiles into groups that are as homogeneous as possible with respect to those characteristics that might create dependencies between marginal rates of substitution for automobiles within a group and variables outside of the group. Unfortunately, this task is not entirely straightforward, since theory does not say precisely what characteristics are relevant. We have used our judgment in this and, as would be expected, the choice of variables greatly influences the aggregation.
The literature contains at least a dozen typologies. At least six classification schemes not developed for demand models have currency. The U.S. Environmental Protection Agency (EPA) classifies automobiles for the purposes of fuel-economy labeling and listing in the fuel-economy guide published jointly with the U.S. Department of Energy (DOE). The EPA system groups automobiles on the basis of interior volume. For model year 1977 automobiles, interior volumes ranged from under 21.3 m3 (70 ft3) for the smallest four-passenger vehicles to over 48. 8 m3 (160 ft3) for the largest station wagons. Based on judgment and experimentation, the EPA distinguished fow· types of sedans and three station wagons plus a special class for two-seaters CT).
The other major nonmodeling classification schemes have been reviewed in detail elsewhere (8) and will only be mentioned briefly here. These classifications were developed for the purposes of domestic automobile manu-

30
facturers, largely to enable them to keep track of t.he production and sales of automobiles in competing size categories. As previous researchers have noted ~),
While at least five distinctive industrial market classes existed, no formal industrial definition of classes has ever been created. Instead, criteria for classification developed through informal agreements based on a combination of vehicle size, price, and marketing intent.
The schemes have from five to eight automobile categories and vary considerably in the emphasis given to price and vehicle size (usually wheelbase). Given the manufacturers' intentions in developing classes consisting of competing vehicles, these classifications might be expected to approach the desired homogeneous grouping of vehicles. However ~),
Unfortunately, marketing intent is difficult to define obj~ctively ~nd the criteria used to create market class specifications have vaned considerably, depending on the purpose and user of the classification system.
At least six classifications developed for econometricdemand models are described in the literature (Table 1). At least two other models that use apparently different classifications have been published without descriptions of the criteria for classification (5, 11 ). Of the six classifications, three are variants Of industrial classification schemes that consist of subdivision of wheelbase categories according to price. In general, the classification criteria for these schemes are not explicitly stated, though Schink and Loxley {_±) come very ~lose. The Wharton-model classification is apparently mtended to be similar to the industrial-market classification. It is based on wheelbase, with all automobiles that cost more than a somewhat arbitrarily chosen cutoff price being grouped into a single luxury category, regardless of size. A good classification should be multidimensional; however, the Wharton study asserts (without substantiation) that "wheelbase plus any one of the other ch.a1·acteristics will very likely yield the correct classification" (4, Vol. 1, pp. 3-8 to 3-10).
The other three classifications consist of only three classes each. Two are unidimensional, one based on curb weight and the other on a roominess index, which is a simple sum of seven interior dimensions. In both, the class boundaries are arbitrarily defined by judgment and intuition. The third is an interesting approach that classifies according to a hedonic price index (RPI) {_!). The RPI is appealing in that it allows more than one factor to contribute to the classification. However, it is a particularly inappropriate method for aggregating commodities from the point of view of demand theory. The hedonic technique is constructed so as to allow comparisons between apples and oranges based on the amount of quality embodied in them. Rather than ensuring that automobiles in a given group are homogeneous with respect to their characteristics, the hedonic approach allows very dissimilar automobiles to be grouped together, provided only that their quality indices are similar.
Recently, multidimensional classifications for demand modeling have been attempted by Resek and Kouo (12) and Springer (13) by use of principal-components analysis. Springerdoes not discuss his classification scheme in any detail, although it is apparently very similar in construction to that of Resek and Kouo. Data on wheelbase, length, engine displacement, weight, and list price were obtained by Resek and Kouo for about 1600 domestic automobiles. The researchers first tried multiple-discriminant analysis as a classification tool, starting with the industry-market classification but found that usable discriminant functions
could not be obtained. They next turned to principalcomponents analysis and found interpretable patterns in the factor weights of the first two components (12).
Characteristic
Latent root Trace(%) Variable (factor weights)
Wheelbase Length Weight Displacement Price
Component
First Second
3.94 78.83
+0.22 +0.23 +0.24 +0.22 +0.21
0.51 10.14
+0.78 +0.61 -0.06 -0.66 -0.72
"Clearly, the first factor represents size while the second is power or luxury" (12, p. 2). Given the structure they observed in the data, the authors elected to designate the top 10 percent of models in price as luxury. The remaining automobiles were classified into four groups based on their scores on the first component. Cut points were determined by judgment to achieve a final five-group classification similar to the industry-market classification. Oblimax rotation results of the first component scores are given below (12 ).
Factor
Variable Size Price
Wheelbase +1.09 -0.18 Length +0.98 -0.01 Weight +0.46 +0.56 Displacement -0.09 +0.99 Price -0.15 +1.02
A closer examination of the Resek-Kouo classification scheme reveals several fundamental deficiencies. First, the selection of variables omits any direct measure of vehicle capacity. Intuitively, this would seem to be a critical vehicle characteristic for most consumers and one very likely to cause aggregation problems unless specifically taken into account. Fuel efficiency is also not considered. Less important is the omission of a direct measure of vehicle performance. Both engine displacement and power are very closely related to vehicle weight and, therefore, a relatively poor measure of performance. A second problem arises from the fact that the classification implemented discards the second component and substitutes price in its stead. Not only does this result in the loss of information but causes difficulty in interpreting a classification based on one component score and one raw variable. Finally the determination of cut points (both along the price and first component dimension) relies entirely on judgment-the only apparent objective of which was the replication of the industry-market classification. As a result, this classification should be considered as groundbreaking in the field of multivariate vehicle classifications but still exploratory.
For the purposes of constructing an econometric model of automobile demand, all of the existing classifications leave something to be desired. Schuessler and Smith (14, p. 4) have pointed out one reason: "It should be noted that an automobile is a multiattribute good, and any unidimensional classification scheme will be unsatisfactory for some models when viewed along an alternative dimension. "
Most existing typologies are essentially unidimensional. Another major drawback of all existing classifications is that they rely on subjective judgment and

Table 1. Automobile classifications for econometric demand models. Model
Transportation Systems Center (~)
Chase Econometrics• ~)
Energy and Environmental Analysis, Inc: (10)
Int.orngency Task Force on Motor Vehicle Goal s beyond 1980 ~)
Cato, Sweeney, and Rodekohr {_!)
Wharton EFA• (i)
Note: 1 kg= 2.20 lb; 1 cm= 0.39 in.
Criteria
Weight .
Wheelbase, price
Wheelbase, price
Roominess index (sum of seven interior measurements)
Hedonlc index of weight and wattage
Wheelbase, price
Class
Compact (< 1134 kg) Intermediate-standard
(1134 < 1814 kg) Luxury (> 1814 kg) Subcompact Compact Intermediate Standard Luxury Subcompact Compact Intermediate Standard Small luxury Large luxury Small (< 671 cm) Medium (671-696 cm) Large (>696 cm) Small (<1610 kg) Medium 1610 <HPI <2381 kg r,arge HPl (>2382 kg) Subcompact (~2M cm) Compact (254 <wheelbase
<282cm) Domestic mid-size (282 <
wheelbase < 300 cm) Domestic full-size (>300 cm) Luirury (price of specific
models selected by judgment is used as lower bound, includes automobiles in all size categories)
31
• Variant of industrial classification according to wheelbase and market intent ,
intuition to establish the number of groups and dividing lines between groups. This is even true of the EPA classification, which is certainly the most rigorous in terms of statistica lly evaluating the consequences of different cut points for clas ses (8). What is clearly r equired is a method of classificatiOn that conside r s multiple attributes simultaneously and seeks out natural groupings of automobiles . Cluste r analysis provides such a method.
AUTOMOBILE CHARACTERISTICS DATA BASES
A data set that contained extensive information on automobile characteristics and permitted the retrieval of this information by model names (e.g., Pinto, Chevette, or Da rt ) was required for the cluster analysis. Two data sets were considered as possible candidates: Fels (15) and The Automobile Characteristics Data Base ITT, 17) [herea fter referred to as the ChiltonNational Highway Traffic Safety Administra tion (NHTSA) data].
The F els data set was compiled primarily for fueleconomy inform ation, although it contains 11 additional descr iptive variables. Automobiles included in the data set a.re identified by model name a nd number or cylinde r s or body style. For example, the data set contains three entr ie s for the Cutlass model: Cutlas s six cylinde r, Cutlass eight cylinder , and Cutlas s s tation wagon. Infor mation on model yea.rs 1973- 1978 i s included.
T he Chiltou-NHTSA data we r e compiled by two diffe r ent agencies under three· diffe rent contracts . As a r esult, the Chilton- NHTSA data are a:etually composed of th ree smaller data sets. Ea ch of these s malle r sets contains its own set of descriptive variables as well as a unique identification system. For example, the 1955-1974 data identify automobiles by manufacturers and size [e .g., General Motor s (GM ) inter mediate], but the 1975 data use manufacturer and model name (e .g ., Ford Pinto) as the identifier. The three data sets com-
bined cover the years 1955, 1960, 1965, 1968, and 1970-1977.
For the purposes of this paper, the primary differences between the Fels and the Chilton-NRTSA data are that the latter contain more extensive information' on the interior volume of an automobile and a longer time series of data. For these reasons, we chose the Chilton-NHTSA data for input into the clustering procedure. This choice left two problems to be resolvedidentification of the automobile and the size of the data set. As the desired output of the clustering procedure was an automobile-classification scheme in terms of model names, we decided to restrict our attention to data in which the automobiles were already identified by model. The only part of the Chilton-NHTSA data to meet this criterion were the 1975 data. The automobiles in the 1975 data were further classified by engine s ize, number of cylinde r s, and t r ans mission. This is a gr eate r level of dis aggregation than that i·equired for automobile- demand modeling, s ince data on new registrations a re not available at such a fine level o.f detail. The data were aggregated to the le vel of detail available in the R. L. Polk new-vehicle registrations data (i.e., model year, make, series, sedan versus wagon }. T he r esulting variable scores are sales-weighted a verages of the disaggregated variable scor e s . The aggregated 1975 data set contained 125 observations.
In any classification scheme, the choice of variables included in the analysis influences the final categorie s obtained. It was thus important to select from the 50-odd attributes included in the data base those characteristics that capture the important ways in which one automobile differs from another. In particular, it was important that the automobile be accurately described in terms of its size, price, perfo1·mance, and fuel economy. The variables that were chosen to reflect these aspects of automobiles ar e as follows:
1. Wheelbase-Wheelbase is defined as the distance between the centers of the front and rear wheels of an

32
automobile and is a measure of exterior size. 2. Curb weight-Curb weight is another indicator of
size. It is defined as the operational weight of the automobile, i.e., the weight of the automobile with all tanks filled, spare tire, and optional equipment (if produced on 35 percent or more of automobiles in that model line).
3. Displacement-Displacement is a measure of the size of the engine and is defined as the number of cubic centimeters displaced by the pistons in an upward stroke.
4. Number of passengers-This is a measure of the passenger-carrying capacity of the automobile.
5. Roominess factor-The roominess factor is computed as the sum of the following seven measurements: legroom (front and rear), shoulder room (front and rear), headroom (front and rear), and front- seat height. These measurements are Standard Motor Vehicle Manufacturers Association measurements L34, L51, W3, W4, H61, H63, and H30, respectively. Both the roominess factor and number of passengers are indicators of interior size; however, the two measurements differ in that (a) the roominess factor is a continuous variable and (b) the roominess factor cannot distinguish between station wagons and sedans, as only the first two seats are counted. If a third seat is available in a station wagon, the number of passengers variable is incremented to reflect this.
6. Power-Power by itself is very closely associated with the size of an automobile . However, if size is accounted for by dividing motive power by curb weight, then a meansure of performance is obtained. Motive power divided by weight is the variable that is used in the analysis.
7. Fuel economy-The fuel-economy measurement used is a weighted average (55 percent urban, 45 percent highway) of the EPA city and highway fuel-economy tests.
8. Acceleration time from 0 to 96.5 km / h (0 to 60 mph)-Acceleration time is an additional measure of performance. Unfortunately, for the 1975 data, too many values were missing for this variable to be included in the analysis.
9. Price-Manufacturer's list price is the only measure of the cost of the automobile (other than fuel economy) contained in the data set. It is a less than perfect indicator of the true cost of an automobile, however. The primary problem is that very few new automobile buyers actually pay the manufacturer's list price for the automobile. Furthermore; the amo1mt of discount is not constant but varies with price and other factors. Additionally, this price does not include the cost of options.
Three of the variables included in the analysis measure exterior size (wheelbase, curb weight, and displacement). Two of the variables measure interior size (roominess factor and number of passengers). Of the three remaining variables, one measures fuel economy, one measures price, and one measures per-
Table 2. Correlation matrix of Curb
formance (power per curb weight). The matrix of product-moment correlations (Table 2) between variables reveals that all of the size variables are closely correlated. Fuel economy is also strongly, though negatively, related to size. Price shows a somewhat weaker correlation, and the performance measure correlates poorly with all measures except price.
CLUSTERING METHODS
The term cluster analysis refers to a collection of statistical procedures designed to identify groupings or typologies of items based on their characteristics. Given a set of (usually measurable) characteristics for a population, cluster analysis attempts to divide individuals into groups that have similar characteristics. Similarity is measured by the distance between individuals in a multidimensional characteristics space. Many distance measures (or metrics) can be used, including Euclidean distance, which measures distance along a straight line that joins two points. Algorithms for determining clusters may be divided into two categories: hierarchical and nonhierarchical. Hierarchical algorithms begin by regarding each of n observations as a group. The two closest observations are then combined into a single group that is assigned the mean value of the characteristics of the two points. In the next step the closest of the n-1 remaining groups are combined, and so on, until all observations have been combined into one single group. Thus a hierarchy of n groupings is generated of sizes n to 1. A key feature of hierarchical algorithms is that, once two groups are joined, they may not be divided at a later step. Nonhierarchical algorithms, in contrast, are designed to find a prespecified number of groups by iteratively assigning and reassigning individuals to groups in order to maximize a chosen measure of group homogeneity.
Both hierarchical and nonhierarchical clustering methods were used. The hierarchical clustering program (DENDRO) (18) uses an algorithm based on Ward's method (19), which at each step combines clusters to achieve the minimum increase in error sum of squares. The Euclidean distance metric was used (a rank-score procedure was also tested and gave similar results) (20). The nonhierarchical method, MIKCA, uses a variation on an iterative K-means procedure (21). Unlike the hierarchical approaches, MIKCA finds aprespecified number of clusters. Starting with k randomly chosen seed points, the algorithm assigns each data point to the closest seed point, computes cluster centroids, and reallocates data points iteratively. This is done from start several times and the clustering that has the minimum within-group sum of squares is chosen. Once again, the Euclidean distance metric was used. Both clustering approaches use the same distance metric and optimization criteria. Differences in final cluster configurations are largely attributable to the fact that hierarchical algorithms are irreversible -that is, once two clusters have been combined no
Displace- Power to Fuel Number of automobile characteristics, 1975. Variable Roominess Weight ment Weight Economy Price Passengers
Wheelbase 0.93 0.95 0.93 0.24 -0.87 0.64 Roominess 0.89 0,86 0.26 -0.81 0.59 Curb weight 0.96 0.26 -0.90 0.69 Displacement 0.30 -0.88 0.64 Power to weight -0.28 0.49 Fuel economy - 0.60 Price
Note: Pearson product-moment correlation coefficients . All correlations are significant at the 0.01 level , except as noted. •significant at 0.1 level.
0.86 0.84 0.86 0.81 0.17
-0.78 0.49

members of either cluster may be reassigned later. Several methods were tried for preprocessing the
data by standardization and weighting. Simply standardizing the raw data enforces equal variation on the variables that may reduce intergroup differences. It also disregards correlations between variables. Use of the first few principal-component scores helps to reduce the number of variables and provides an implicit weighting scheme that should reduce the importance of highly correlated variables. If the data are not well structured, however, the clustering on component scores will differ from that using the raw data (19, p. 49 ). This turned out to be the case for the automobile data.
When either standardized raw data or the first three component scor es were used, the results from the hierarchical and nonhierarchical methods differed greatly (this was true whether the Euclidean or rankscore metric was used). An examinati on of the normalized between-cluster to total-sum-of-squares ratio for each variable indicated that variables that measure vehicle size dominated the classification. It appeared that the six highly correlated variables that measure size, wheelbase, roominess, curb weight, engine displacement, power, and number of passengers were so heavily weighted that the clustering algorithms were having difficulty discriminating among vehicle types.
The preprocessing approach finally adopted is based on the idea that there are five major, quantifiable dimensions that consumers use in making decisions about vehicle purchases:
1. Overall size-wheelbase, curb weight, and displacement;
2. Capacity-roominess and number of passengers; 3. Price-manufacturer's list price; 4. Variable costs of operation-composite fuel
economy; and 5. Performance-power divided by weight.
Each of these dimensions or factors was given a total weight of one-fifth. This weighting scheme produced greater equality in the normalized sum of squares explained by the classification as well as good consistency between the results of the two clustering algorithms. Therefore, this preprocessing method was selected.
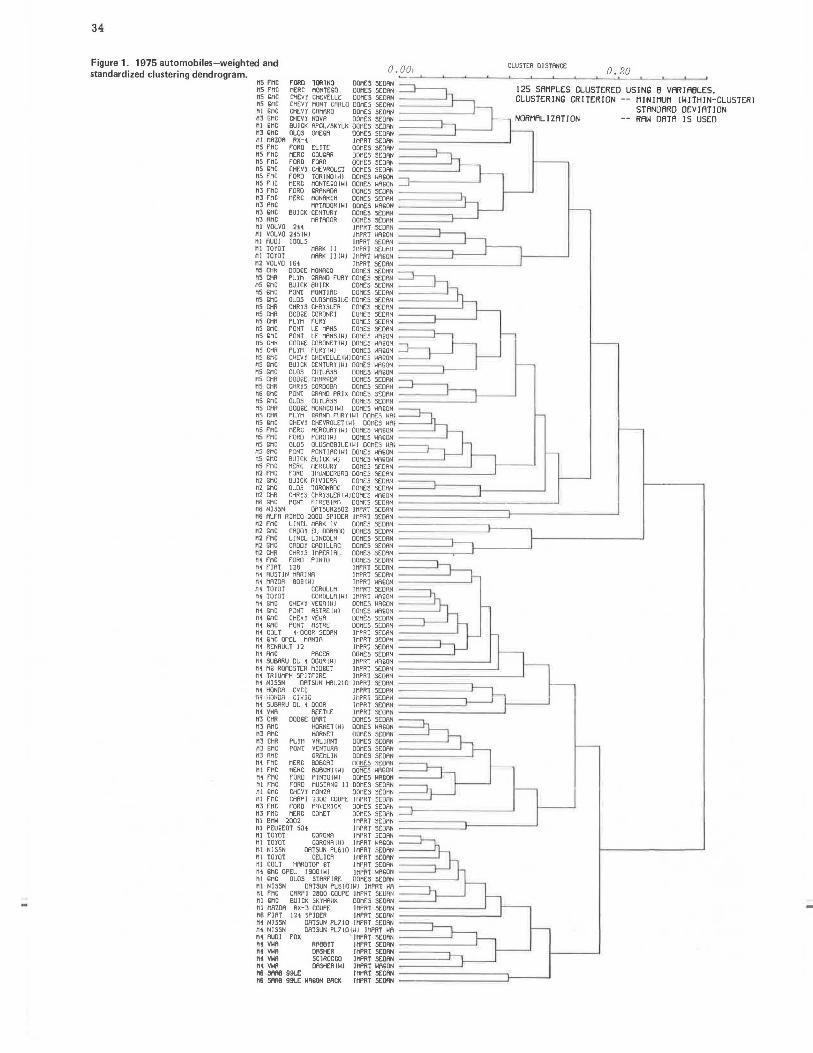
The dendrogram in Figure 1 displays the results of the five-factor weighting . To compare the results of the dendrogram with the MIKCA results, each sample has an identifier Mn, n = 1, . . . 6, which indicates its MIKCA group.
NUMBER OF CLUSTERS
The dendrogram indicates the separation between clusters by the length of the vertical lines that join clusters. Subjectively, it appears that divisions can be made at the two-, four-, and seven-group levels. Statistics described by Everitt (19) were tabulated for the MIKCA groupings (Table 3). -The two-cluster grouping appears as the best overall, and six also appears to be a meaningful grouping if more than two groups are desired. A Monte carlo clustering technique, which uses estimates of error in the raw variables, was also employed by using a probabilistic method for grouping data (22). The error estimates proved to be so large that only the two-group clustering was consistently found. These results suggested that the most significant distinction between automobiles is between two broad categories that may be described as
33
large and small. Beyond that, a six-group classification appears to be best.
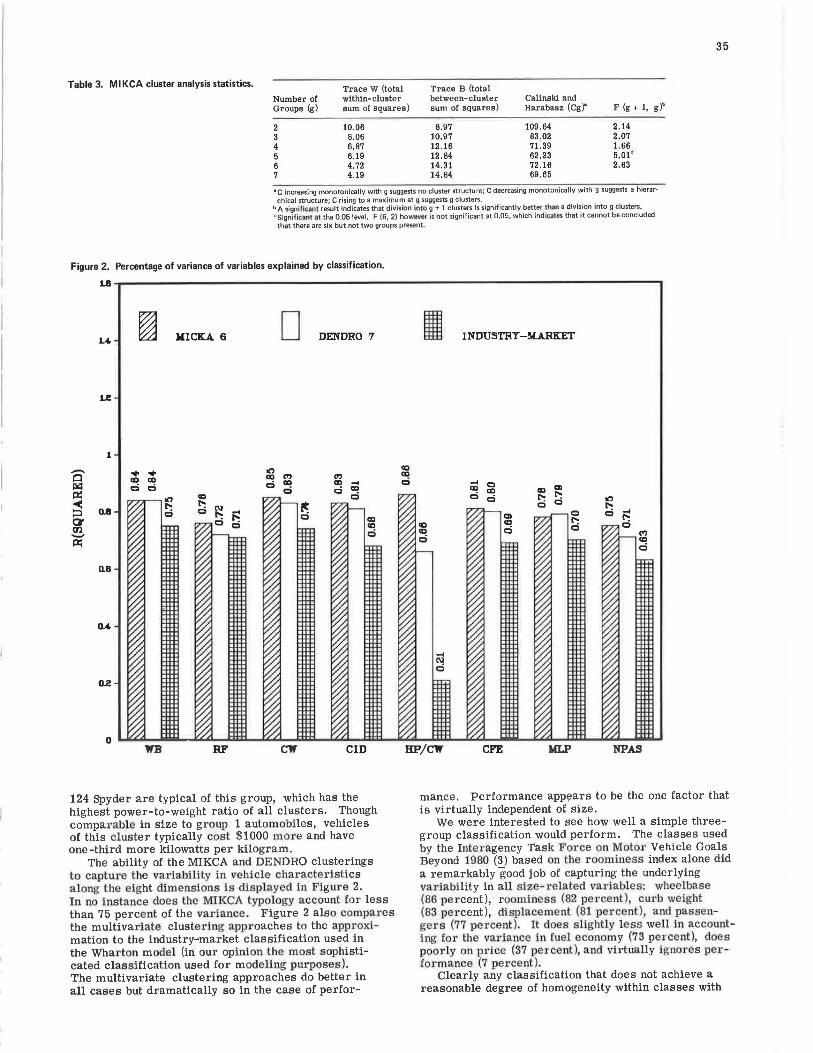
Although both the DENDRO and MIKCA algorithms produce acceptable classifications, the MIKCA typology seems preferable on grounds of efficiency. The sixgroup MIKCA and seven-group DENDRO classifications are compared in Figure 2 in terms of the normalized sum of squares explained by the classification for each variable. With one negligible exception, the MIKCA groups do a better job of capturing the underlying variability with fewer groups. Since, other things being equal, the percentage of variance of variables explained will increase with the number of groups, the MIKCA groups are clearly better by this criterion. In discussing the results of the cluster analysis below, we shall refer to the MIKCA six-group typology. The group numbers have no particular significance.
Group 1 contains 24 makes that have a combined market share (based on production and import figures) of 10.2 percent in 1975 (Table 4). Included in the group are the Ford Mustang, Buick Skyhawk, Toyota Corona, Mercury Capri, and Audi 100 LS. The values for the group centroid indicate that the typical member is a relatively small, four-passenger sedan or wagon with moderate performance and price and good fuel economy . The heaviest automobile in the group is the Chevrolet Camaro [1645 kg (3627 lb)]; the lightest is the Dodge Colt GT [1070.5 kg (2360 lb)]. The most expensive is the Volvo 245 ($6275, 1975 dollars) and the cheapest is the Mercury Bobcat Wagon ($3672). The Mercury Capr.i 2800 is most typical of the group, as measured by weighted distance from the group centroid.
The second group is comprised almost entirely of large domestic luxury automobiles. This group has only 10 members but captures 5.9 percent of the market. Cadillacs, Chryslers, and Lincolns dominate this cluster of the largest, heaviest, least efficient, and most expensive automobiles.
The next three groups might be thought of as the basic transportation group. Together they comprise more than four-fifths of the market (80.8 percent) . These are the automobiles most Americans drive. Perhaps this is because automobiles in these groups give both the largest passenger-carrying capacity per dollar of purchase price and the greatest number of seat kilometers per liter of gasoline. Group 3 consists largely of domestic compact automobiles, such as the Plymouth Valiant, Chevrolet Nova, and American Motors Hornet. This has the lowest average value for power to weight but carries the greatest number of passengers per dollar of all the groups. Group 4 might be termed economy subcompacts. Automobiles such as the Volkswagon Beetle, Ford Pinto, Chevrolet Vega, and Datsun 210 make it the lightest, smallest, cheapest ($3573), and most fuel-efficient cluster of all [10.6 km/Land 41.25 seat-km/L (25 miles/gal and 97 seat miles/gal)]. The fifth group is the only one that consists entirely of domestic automobiles. Although not the heaviest group, it does have the greatest passenger capacity due to the large number of station wagons in this group. These large automobiles are the largest 1975 market share by far of all groups (42 percent). Though the vehicles themselves are relatively fuel consumptive [5.5 km / L (13 miles/gal)] they deliver the second highest level of seat kilometers per liter [39.1 seat-km/L (92 seat miles/gal)].
Group six, the smallest in terms of both members (7) and market share (3.2 percent), consists predominantly of high-performance, expensive small automobiles. The Datsun 280Z, Pontiac Firebird, and Fiat
34
Figure 1. 1975 automobiles - weighted and standardized clustering dendrogram.
0 • 00i CLUSTER OISTANC£ O • 20 ~~----~-~__. _ _.__...._~.___.__~-~---'--'--~
g~ ~~~ ~~ ;r:~~~o =~ ~::: -t---~ 125 SAMPLf:S CLUSTf:Rf:O USING 8 Vffi!Alllf:S. MS l:llC C'lCVY CHEVELLE ODnES SEDAN ___ __, CLUSTf:RING CR!Tf:RION MIN!Mut1 {l;JTHIN-CLUST[RJ
g~ ~g~ ~:1.i~: ~~~~ARLO gggg ~g~ ::::::::::'. _ __. STANDARD Of:VIATION
g~ ~g~ g~i~~ ~~/SKYLK ggg~~ ~~ ====}----, RAW DATA IS USED MJ GMC OLDS DnEoA DOM!:S SEDAN -----...J Ml MAWA RX-t IMPRT SEDAN ------------J ~~ ~~~ ~~~~ ~~G~~R ggg~~ ~~:: ----,._.., MS fMC fORD fORO DOMES SEDAN -------' MS oMC CHEVY CHEVROLET DOMES SEDAN ---------' MS fMC fORO TORINO IHI DOMES HAGON MS fl IC MERC MONTEoO IMI DOMES MASON !--------' MJ fMC fORD GRANADA DOMES SEDAN ------MJ fMC MERC MONARCH DOMES SEOAN ------Jl MJ AMC MATADOR IMI DOMES HAGON ------...J MJ oMC BUICK Ct:NTURI DOMES SEDAN =====:::::J-_J MJ AMC MATADOR DOMES SEDAN
~: ~~~g 2mw1 :gm ~~~ ====r--..., Ml AUDI IDOLS JMPAT SEDAN ------....1 n1 TOYOT nRRK JI JMPRT SE(Jfill -------, Ml TOTOT MffiK 11 IMJ IMPRT HAGON ------M2 VOLVO 16{ IMPRT S!:OAN -------------' ns CHf( 000l;f: MONflCO OOH£ 5 5(0~ MS CHfl PL!M GRANO fURY DOMES SEDAN MS GMC BUICK BUICK DOMES SEDAN MS GMC PONT PONTIAC DOMES SEDAN -----' MS GMC OLDS OLDSMOBILE DOMES SEDAN ------MS CHA CHAYS CHRYSLER DOMES SEDAN -----.......J ~~ ~~~ ~~~~E ~~~~NET ggg~~ ~~g~~ ----,. ___ __] MS GMC PONT LE MANS DOMES SEDAN MS •MC PONT Lf MANS IMI DOMES HAoON MS CHH DOOSE CORONET IHI DOMES HAoON MS CHA PL!M fURYIHI DOMES HAoON ns SMC CHEV! CHEVELLEIHIDOMES WAGON ns SMC BUI CK CENTURT IHI OOtii:S WAGON ns GMC OLDS CUTLASS Ollt1ES HAGON ns CHA DODGE CHARGER DONES SEDAN MS CHA CHRIS COROOB/l DONES SEDAN ns GMC PONl GRAM) PR J x OONE:S S~OAN MS SMC OLDS CUTLASS DOMES S!:OAN "S CHA DOOSE MONACO IHI DOMES WAGON ns f.HR Pl YM i::RANn fllRY IUI nn11r.s i.IAC MS SMC CHEVY CHEVROLET IWI DOMES HAI MS fMC MERC MERCURY IHI DOMES HAGON MS fMC fDRD fORO IHI DOMES HAGON MS GMC OLDS OLDSMOBILE IHI DOMES HAI ---.. MS SMC PONT PONT JAC IHI DOMES WAoON MS SMC BU I CK BU I CK IHI DOMES HAGON MS fMC MERC MERCURY DOMES SfOAN M2 fMC fDRD THUNDERBRD DOMES SEDAN M2 GMC BUICK RIVIERA DOMES S(DAN M2 GMC OLDS TORONADO DOMES S£0AN M2 ChR CHRYS CHRYSLER IHIOOMES HAGON MS GMC PONT F'IRE:BJRD DOMf.S SEDAN -----------------'
M6 Nl5SN OATSUN2B02 IMPRT SCOAN ===========)----------_J M6 ALfA RJMEO 2000 SP IDEA J NPRT SEDAN
M2 fMC LINCL MARK IV Ollt1ES SEDAN =========]-----, M2 GMC CADOI EL DORADO DOMES SEDAN
g~ ~g~ ~~t'xi~ ~~~et~c g~g~; ;~~~ =::::::::::~:=:-i.r-----___,1--------------' M2 CliR CHRYS JMP£RJAL DOMES SEQ.'\N
g: ~7~T ;~;o PINTO ~~~~ ;~gii~ ===:::::J--, Mt AUSTIN MARINA IMPRl SEDAN -----Mt MA1DA BOBIHI IMPRT MASON ------~ Mt TOJOT COROLLA IMPRT S!:OAN Mt TOJOT COROLLA IWI IMPRT WAGON Ml GMC CHEV! VEGA IHI DOMES WAGCJ-1 Mt GMC PJNT ASTRE IHI DOMES HAGON ----Mt GMC CHEV l VEGA DONES SEDAN Mt SMC PONT A5TR£ DOMES SEDAN Mt COLT <-ODOR SEDAN IMPRT SEDAN ------
~! ~~~A~riL12MnNTA ~~~~i ~~~~~ ====]--, Ml AMC PACER DOMES SEDAN Mt SUB/lRU OL t ODOR IHI IMPRT WAGON Mt MG ROADST£A MIDo£T JMPRT SEDAN IH TRJUMPH 5Pl1'f'lRE: JMPRT SEDAN
g: ~~ cvg~TSUN HBL210 l~~i ~~g:: =======}--, rH HONDO CJYJC ii'IPl't 3EDfii~ Mt SUBARU OL t DOOR IMPRT S!:OAN n; VHA BEETLE lMPRT SEDAN MJ Clfl DODGE DART DONES SEDAN MJ f'llC tfJRNET IHI DOMES HA60t< MJ AMC tfJRNET OOM£S SEDAN MJ CHR PL!M VALIANT DOMES S!:OAN ------' MJ SMC PONT VENTURA DOMES SEDAN -------' MJ AMC GRf.MLIN DOMES SEDAN -------'
~~ ~g~ g~~~ :~~i IHI ~gg ~~g~ ---,........., Mt FMC fORO PINTO IMI DOMES HAGON ___ ........ Ml FMC fORD MUSTANG l I DOMES SEDAN Ml SMC CHCVI MON2A DOMES SEDAN Ml fMC CARPI 2300 COUPE IMPRT SEDAN
g~ ~g~ ~~~g ~~~glCK ~gg~~ ~~~~~ -,_ ________ __J
~~ ~~~-E~~0~ot :g~~i ~g~~ ======J-------_J Ml TOJOT CORONA IMPRT SEDAN Ml TO?Ol CORONA li.ll INPRT ~A£0N Ml NISSN DAlSUN PL610 IMPRT SEDAN Ml TOJOT CELICA IMPRT SEDAN ------'
g; ~~TOPErARng:;,~; ~~~~i ~~~ ====r__J Ml GMC DLOS STARflRE DOMES SEDAN -----~ Ml NISSN DATSUN PL6101HI IMPRT MA Ml FMC CARPI 2BOO COUPE JllPHT St:UAN Ml SMC 8UIC1< SKTt'tlHK DOMES S!:OAN Ml MA1DA RX-J COUPE IMPRT SEDAN --------__J M6 flAT l2l SPIOCR IMPRT SEDAN ------------'
g: ~:;~ ~i;~~ ~t~:g1~r~~~iD:::: ---,._......., Ml AUDI FOX ' JMPRT SEDAN -------' Mt VMR RABBl1 JMPRT S!:OAN ----------J n; VMR ORSHER IMPRT S!:OAN =====}--, n; VMR 5CJROCCO IMPRT SEDAN n; VMR DASl£R IHJ IMPRT HAGON -----.......J 116 !IRA!! 991.E JMPRT S!:OAN ===========}----J 116 5RflB 991..E MASON BAC1< IMPRT 5£DAN
35
Table 3. Ml KCA cluster analysis statistics. Trace W (total Trace B (total Number of within- cluster between- cluster Calinsld and Groups (g) sum of squares) sum of squares) Harabasz (Cg)• F (g + 1, g)'
2 10.06 8.97 109.64 2.14 3 8.06 10.97 83.02 2.07 4 6.87 12.16 71.39 1.66 5 6.19 12.84 62.23 5.01° 6 4.72 14.31 72.16 2.63 7 4.19 14.84 69.65
•c increasing monotonically with g suggests no cluster structure; C decreasing monotonically with g suggests a hierar· chical structure; C rising to a maximum at g suggests g clusters.
b A signltrctmt result indicates that division into g + 1 clusters is significantly better than a division into g clusters. ~signifiC4lln t At the 0.05 level. F (6, 2) how1.tVer is not significant at 0.05, which ind1calos that it cannot be concluded that there are six but not two groups present.
Figure 2. Percentage of variance of variables explained by classification.
LB.,-~~~~~~~~~~~~~~~~~~~~~~~~~~~~~~~~~~~~~~~ .....
1
........ mm Q c
KICKA 6 D DENDRO 7
124 Spyder are typical of this group, which has the highest power-to-weight ratio of all clasters. Though compa1·able in size to group 1 automobiles, vehicles of this cluster typically cost $1000 more and have one-third more kilowatts per kilogram.
The ability of the MIKCA and DENDRO clusterings to capture the variability in vehicle characte ristics along the eight dimensions is displayed in Figure 2. In no instance does the MIKCA typology account for less than 75 percent of the variance . Figure 2 also compares the multivariate clustering approaches to the approximation to the industry-market classification used in the Wha1·ton model (in our opinion the most sophisticated classification used for modeling purposes). The multivariate clustering approaches do better in all cases but dramatically so in the case of perfor-
I INDUSTRY-MARKET
mance. Performance appears to be the one factor that is virtually independent of size.
We were interested to see how well a simple threegroup classification would perform. The classes used by the Interagency Task Force on Motor Vehicle Goals Beyond 1980 (3) based on the roominess index alone did a remarkably good job of capturing the underlying variability in all size-related variables: wheelbase (86 percent), roominess (82 percent), curb weight (83 percent), displaceme nt (81 percent), and passengers (77 percent). It does slightly less well in accounting for the variance in fuel economy (73 percent), does poorly on price (37 percent), and virtually ignores performance (7 percent).
Clearly any classification that does not achieve a reasonable degree of homogeneity within classes with

36
Table 4. Centroid values for MIKCA six-group classification.
Variable Variable Weight Group 1 Group 2 Group 3 Group 4 Group 5 Group 6
Membership 24 10 15 32 37 7 Market share (~) 10.2 5.9 22.7 16.1 42.0 3.2 Wheelbase (cm) 0.33 253 .2 310.4 279. 6 238.2 303.8 248.7 Curb weight (kg) 0.33 1 288.6 2 221. 5 1 597 .6 1 036.5 2 043.1 1 294.3 Displacement (L) 0.33 2.6 7.1 4.5 1.8 6.2 3.3 Roominess factor (cm) 0.50 658.6 725.9 695.7 646.2 725.7 670.8 Number of passengers 0.50 4.25 6.10 5.33 3.88 6.92 4.43 P ower to weight
(kW/ kg) 1.0 0.021 59 0.024 33 0.018 31 0.019 46 0.022 50 0.029 07 Composite fuel economy
(km /L) 1.0 8. 5 5.4 7.2 10.6 5.6 8.5 Manufacturers list price
(1975 dollars) 1.0 4748 8455 4160 3573 5465 5792 Seat- kll.omcters per liter
{seaHun/L) 36.4 33.3 38.2 41.2 39.0 37 .6 Passenge rs per $1000 0.90 0.72 1.28 1.09 1.27 0.76 Model automobile Mercury Cadillac Pontiac Toyota Pontiac Saab
Capri Ventura Corolla Le Mana 99 Le 2800 Wagon Wagon Wagon
Note: 1 kg = 2.20 lb; 1 cm= 0.39 in; 1 L = 61.03 in'; 1 km = 0.62 mile; 1 km/L = 2.35 mile/gal; 1 kW= 1.34 hp.
respect to price cannot satisfy the condition for aggregation of commodities since income may strongly influence substitutions between commodities within a group. Whether or not performance is critical for aggregation is not clear. Many consumers consider performance important, but styling and color are also important to many vehicle purchasers. To the extent that performance is a luxury characteristic, it would seem necessary to consider it in the aggregation process. The same applies to exterior size, although all the classifications do a reasonable job of capturing variation in the size variables.
CONCLUSIONS
This exploration of the structure of the 1975 automobile population has produced a classification into six groups that succeeds substantially in dividing the vehicles into homogeneous groups. It is not the only classification that can be obtained from cluster analysis. Considerable experimentation with other weighting schemes and distance metrics has shown that the clustering obtained is, not surprisingly, dependent on the variables included and the weights given to them. The classification scheme finally selected is based on an equal weighting of five factors measured by eight variables. The factors are interior capacity, exterior size, performance, fuel economy, and price. A simple one-dimensional, three-way classification based on either interior capacity or weight should create reasonably homogeneous groups with respect to interior capacity, size, and fuel economy. The Wharton-model five-group classification based on wheelbase and price gives a respectable performance on all but the performance variable. The nonhierarchical six-group clustering does better than the Wharton scheme on all variables and does considerably better on performance.
The cluster-analysis methodology employed here holds considerable promise for developing aggregations of automobiles for the purpose of market-share demand modeling. Additional research will be required, however, in order to develop a classification scheme that covers a time series of data. In particular, if the clustering is to be of use in forecasting work, it must include the scaled-down models of recent years. The work reported here takes the first step toward developing such a multivariate classification.
ACKNOWLEDGMENT
We wish to thank William Basham of the U.S. Department of Transportation for his kind cooperation and foresight in creating the data base used in this analysis . '.J./e also thank our colleague Axel Rose for numerous valuable suggestions. This research was sponsored by the Demand Analysis Division of the U.S. Department of Energy.
REFERENCES
1. D. Cato, M. Rodekohr, and J. Sweeney. The Capital Stock Adjustment Process and the Demand for Gasoline: A Market Share Approach. In Econometric Dimensions of Energy Supply and Demand (A. B. Askin and J. Kraft, eds.), Lexington Books, Lexington, MA, 1976.
2. C. Chamberlain. A Preliminary Model of Auto Choice by Class of Car: Aggregate State Data. Transportation Systems Center, U.S. Department of Transportation, Cambridge, MA, Discussion Paper, 1973.
3 . C. Difiglio and D. Kulash. Marketing and Mobility: Report of a Panel of the Interagency Task Force on Motor Vehicle Goals Beyond 1980. Office of the Secretary of Transportation, U.S. Department of Transportation, TAD-443.1, 1976.
4. G. R. Schink and G. J. Loxley. An Analysis of the Automobile Market: Modeling the Long- Run Determinants of the Demand for Automobiles. Transportation Systems Center, U.S. Department of Transportation, Cambridge, MA, 3 Vols., 1977.
5. R. P. Wharf. Policy-Oriented Modeling of New Automobile Sales and Fuel Consumption. In Strategies for Reducing Gasoline Consumption Through Improved Motor Vehicle Efficiency, TRB, Special Rept. 169, 1975, pp. 5-11.
6. L. Philips. Applied Consumption Analysis. American Elsevier Publishing Company, Inc., New York, 1974.
7. B. D. McNutt, D. Pirkey, R. Dulla, and C. Miller. A Comparison of Fuel Economy Results from EPA Tests and Actual In-Use Experience, 1974-1977 Model Year Cars. Office of Conservation and Advanced Energy Systems Policy, U.S. Department of Energy, Unpublished Rept., 1978.

8. B. D. McNutt, D. Pirkey, and R. Dulla. Development of a System of Comparable Car Classes for Fuel Economy Labeling. Society of Automotive Engineers, Warrendale, PA, 1976.
9. The Effect of Tax and Regulatory Alternatives on Car Sales and Gasoline Consumption. Chase Econometric Associates, New York, 1974.
10. Energy and Environmental Analysis, Inc. Gasoline Consumption Model. Federal Energy Administration, 1975.
11. C. Difiglio. Analysis of Fuel Economy Excise Taxes and Rebates. In Strategies for Reducing Gasoline ConsumptionThrough Improved Motor Vehicle Efficiency, TRB, Special Rept. 169, 1975, pp. 40-46.
12. R. W. Resek and C.H. Kouo. Demand for New Automobiles by Size of Cars and its Relation to Gasoline Price, Auto Price, and Income. Paper presented at the Meetings of the American Statistical Association, San Diego, Aug. 1978.
13. R. K. Springer. A Structural Model for Automobile Demand and Gasoline Usage. Paper presented at the Meetings of the American Statistical Association, San Diego, Aug. 1978.
14. R. Schuessler and R. Smith. Working Models of Fuel Consumption, Emissions, and Safety Related to Auto Usage and Purchasing Behavior. Transportation Systems Center, U.S. Department of Transportation, Cambridge, MA, Working Paper WP-230- U2-52, 1974.
15. M. Fels. Historical Automobile Fuel Economy Data
37
Base. Princeton Univ., Princeton, NJ, 1978. 16. J. A. Milne, C. Cantwell, and H. Eissler. Auto
mobile Characteristics Historical Data Base. Transportation Systems Center, U.S. Department of Transportation, Cambridge, MA, Rept. DOTTSC-OST-77-12, 1977.
17. M. Rouse and W. Basham. 1975 Automotive Characteristics Data Base. Transportation Systems Center, U.S. Department of Transportation, Cambridge, MA, Rept. DOT-TSC-OST-76-27, 1976.
18. N. M. Larson, C. L. Begovich, and V. C. Nall. A User's Manual for the Hierarchical Cluster Analysis Code DENDRO. Oak Ridge National Laboratory, Oak Ridge, TN, ORNL/CSD/TM-20, 1977.
19. B. Everitt. Cluster Analysis. Heinemann Educational Books, London, 1974.
20. C. K. Bayne, J. Beauchamp, C. Begovich, and V. Kane. Monte Carlo Comparisons of Selected Clustering Procedures. Fall Meeting and Symposium, Society for Industrial and Applied Mathematics, Knoxville, TN, Oct. 30-Nov. 3, 1978.
21. D. J. McRae. MIKCA: A FORTRAN IV Iterative K-Means Cluster Analysis Program. Behavioral Science, Vol. 16, No. 4, 1971, pp. 423-424.
22. C. Begovich and V. Kane. A Probabilistic Method for Grouping Data. Oak Ridge National Laboratory, Oak Ridge, TN, ORNL/CSD/TM-65, 1978.
Publication of this paper sponsored by Committee on Transportation Information Systems and Data Requirements.