multisource data for seasonal variability analysis of ... · cyanobacteria in a tropical inland...
TRANSCRIPT

Multisource data for seasonal variability analysis ofcyanobacteria in a tropical inland aquatic environment
Rejane Ennes CicerelliA,B,C, Maria de Lourdes B. Trindade GaloA
and Henrique Llacer RoigB
AUniversidade Estadual Paulista, Departamento de Cartografia, Rua Roberto Sımonsen,
305 – Centro Educacional, 19060-900, Presidente Prudente, Sao Paulo, Brazil.BUniversidade de Brasılia, Instituto de Geociencias, Campus Universitario Darcy Ribeiro
ICC – Ala Central, 71910-900, Brasılia, Distrito Federal, BrazilCCorresponding author. Email address: [email protected]
Abstract. Cyanobacterial blooms are related to eutrophic conditions that compromise themany uses of reservoirs. Thus,quick and effective methods for detecting the abundance of cyanobacteria in waterbodies are needed to complement
conventional laboratory methods. In addition, inadequate control techniques that are applied at times of highcyanobacterial concentrations can cause the cells to lyse and release toxins into thewater. In the present studywe investigatedthe behaviour of cyanobacteria by determining phycocyanin and chlorophyll concentrations, using spectroradiometric and
fluorometric techniques, in three field campaigns performed at the Nova Avanhandava Reservoir, Brazil. The sampling rateand favourable season for data collected had been determined previously by remote sensing analysis. Seasonal estimates ofcyanobacteria weremade because fluorometric sensors were able to record low concentrations, whereas the spectral analyses
only detected phycocyanin at higher concentrations.Results of spectral analyses highlighted the subtle spectral characteristicsindicating the presence of phycocyanin, even without a clear definition of the diagnostic features in the reflectance curve.Therefore, multiscale remote sensing complemented by fluorometric analysis and relevant environmental variables is aneffective approach for monitoring cyanobacteria in Brazilian inland waters.
Additional keywords: fluorescence, phycocyanin, reflectance, tropical freshwater, water quality monitoring.
Received 20 July 2016, accepted 11 May 2017, published online 28 July 2017
Introduction
Detection and quantification of the biomass of cyanobacteria iscritical to provide an early warning of bloom development(Tundisi et al. 2010; Li et al. 2015; Shi et al. 2015). Cyano-
bacteria can produce and release microcystins, a group ofhepatotoxins.Microcystins produced by cyanobacterial cells areonly released into the water if the cell wall is disrupted. Somealgicides used to control cyanobacteria can promote cell lysis,
and thus the release of toxins into the water (Sivonen and Jones1999). To avoid this scenario prevention and control strategiesshould be performed. This only can be achieved with an inte-
grated monitoring approach able to detect both increases in thedensity of cyanobacteria and the conditions of the aquaticenvironment is needed.
Cyanobacteria are present in many waterbodies worldwide,mostly at low concentrations. Under appropriate conditions (e.g. alarge amount of nutrients, particularly nitrogen and phosphorus,temperatures above 258C and adequate luminosity), the cyano-
bacteria can multiply rapidly and develop blooms (Coles andJones 2000).
In Brazil, the importance of controlling the growth of
cyanobacteria has led to the creation of a specific law by the
Ministry of Health (ordinance number 518/2004, which defines
the minimum standards for drinking water) and the Ministry ofEnvironment (resolution number 357/2005, which establisheswater quality categories in Brazilian aquatic systems). However,
this laws does not establish mechanisms to prevent cyanobac-terial blooms. Therefore, in many cases actions to control theblooms are enacted after the environment is completely infested.To avoid this, the Ministry of Health published another law
(ordinance number 2914/2011) that established new rules tocontrol water quality for human consumption in cases of highcyanobacterial density. However, the costs associated with the
sampling design are relatively high and the implementationprocess is complex.
In Brazil, Sao Paulo state has the highest economic growth
and the largest metropolitan, industrial and agricultural areas,and is experiencing advanced eutrophication of water resourcesin some regions. Thus, the Environmental Company of the Stateof Sao Paulo (Companhia Ambiental do Estado de Sao Paulo)
conducts quarterly sampling andmanual counts of phytoplanktongroups in 60 locations within the state of Sao Paulo. Despite theaccuracy of the collection and analytical methods, the spatial and
temporal coverage is not sufficient to provide a picture of the real
CSIRO PUBLISHING
Marine and Freshwater Research, 2017, 68, 2344–2354
https://doi.org/10.1071/MF16259
Journal compilation � CSIRO 2017 www.publish.csiro.au/journals/mfr
conditions of the different waterbodies (Companhia Ambientaldo Estado de Sao Paulo 2016).
Novo et al. (2006, 2013) have argued that remote sensing is aneffective alternative for studies of Brazilian inlandwater systems.The possibility of acquisition of remote sensing data at different
times of the year could provide information allowing inferencesto be made about the status of aquatic environments based on theoptical properties of their constituents.
Photosynthetic pigments can be detected in waterbodies onthe basis of the specific optical properties of these pigments. Thepresence of the specific optically active pigment phycocyanin incyanobacteria has allowed studies to be conducted using remote
sensors, either by analysing the spectral signatures of phycocy-anin associated with its spatial occurrence (Schalles et al. 1998;Seppala et al. 2005; Li et al. 2015; Shi et al. 2015) or by using
in vivo fluorescence data based on the specific absorption andemission spectra of phycocyanin pigments (Seppala et al. 2005).Information about phycocyanin (and therefore cyanobacteria)
based on its optical properties can be obtained by identifyingdiagnostic features in spectral reflectance curves using methodssuch as those reported by Goodin et al. (1993) and Chen (1992).
The aim of the present study was to investigate the seasonal
behaviour of cyanobacteria in a run-off river reservoir experi-mental area using multisource data and multiscale remotesensing techniques. The methods included evaluation of the
spectral and fluorometric responses of the phycocyanin pigmentand its relationship with chlorophyll-a (Chl-a) and other physicalvariables in the aquatic environment. The study area was located
along the Tiete River, Sao Paulo state, Brazil, in a section of theNova Avanhandava Reservoir.
Material and methods
Experimental area and sampling design
The present study was performed in an experimental area located
in the Nova Avanhandava Reservoir, in the middle course of theTiete River (Sao Paulo, Brazil; Fig. 1a, b). The reservoir floodingarea is 210 km2, with a mean depth of 13 m and a mean annual
flow rate of 688 m3 s�1 (AES Tiete – Power Generation Com-pany, see http://www.aestiete.com.br/geracao/Paginas/nossas-usinas.aspx, accessed 6 June 2017). The Nova Avanhandava
Reservoir is the fifth reservoir in the Tiete River Cascade, whichconsists of six dams built between 1960 and 1990 for maximumexploitation of the hydropower potential as well as to providewater for many different uses by the population.
The first reservoir of the cascade (furthermost upstream)receives high nutrient loading from urban centres around the cityof Sao Paulo and, despite the biodegradation and self-purification
capacities of the river from the series of reservoirs, the system hassuffered eutrophication effects in recent years (Dongpo et al.
2008). In addition, there is intensive agricultural use in the basin,
in addition to the effects of urban waste and an industrial organicload. The industrial load results primarily from the sugarcanealcohol industry, which has increased the transport of nitrogen
and phosphorus from the terrestrial to aquatic environment andresults in a series of environmental effects (Rede Paulista deEducacao Ambiental 2005).
A preliminary exploratory survey in the Nova Avanhandava
Reservoir was conducted in February 2011. Phytoplankton
activity was detected in the waterbody. In December 2011, thisregion was confirmed as the study area after a new exploratory
survey. Biological analysis of the water aliquots collected inFebruary 2011 byUtsumi et al. (2015) confirmed the dominanceof cyanobacteria among the phytoplankton groups, primarily in
the southern part of the reservoir.The sampling design in the present study was based on
temporal, spectral and spatial reflectance variability evaluated
in multispectral images from the moderate-resolution imagingspectroradiometer (MODIS) and RapidEye spaceborne sensors.The temporal profile of the phytoplankton was evaluated todetermine the most appropriate time of the year to obtain in situ
measurements. This temporal profile was obtained by generatingtemporal signatures from MODIS images (MOD09A1) with aspatial resolution of 500 m. Spectral Bands 3 (459–479 nm),
4 (545–565 nm) and 1 (620–670 nm) were used in the presentanalysis study they are considered appropriate for water studies(Novo et al. 2006). The temporal profile (Fig. 2) was generated
from images acquired bimonthly fromFebruary 2009 toOctober2011, considering the average value of reflectance extractedfrom a square matrix of 9 pixels at the central point of the studyarea.
A RapidEye multispectral image acquired in February 2011was used as a preliminary definition of the spatial samplingdesign. Spectral bands of green light (520–590 nm) and the red
edge (690–730 nm) were used to generate a ratio image (rededge divided by green). The RapidEye red edge band is consid-ered an effective data source for providing data of phytoplank-
ton distribution with high spatial resolution (Wen et al. 2014).The positions of the sampling stations were defined as thoseregions with greater radiometric variability and were deter-
mined by dividing the sampling area into a 45-cell grid. Foreach cell, the ratio image average and s.d. were calculated. Cellsthat had similar statistical parameters were merged until therewere 30 complete points (Fig. 1c). After merging similar cells,
a single random point was positioned in each merged groupof cells.
The sampling design followed the pattern of temporal,
spectral and spatial reflectance variability, but the originalsample size of each field campaign was different due to weatherconditions (e.g. rain or the presence of clouds) or instrumental
and logistical issues, primarily in September 2012. At everygeoreferenced sampling site, spectroradiometric and fluoromet-ric data were acquired to estimate the concentrations of Chl-aand phycocyanin, in addition to measurements of certain lim-
nological and environmental variables to characterise the col-lection points. Furthermore, water samples were collected in10-mL chambers as part of the February 2012 field campaign
and preserved in Lugol’s solution at a ratio of 1 : 100 forsubsequent identification of phytoplankton groups and totaldensity counts. To quantify the density of phytoplankton, the
Utermohl method of counting individuals was used, with resultsexpressed as the number of individuals per millilitre. An‘individual’ was considered as being a filament, a tricome, a
colony, a coenobium or a cell (for unicellular individuals;Uhelinger 1964). There is no consensus about the best quantifi-cationmethod for the calculation of phytoplankton diversity, butthe number of individuals has been used for a long time,
including in recent literature (Figueredo and Giani 2001).
Seasonal analysis of cyanobacteria in fresh water Marine and Freshwater Research 2345

Limnological values (water temperature, dissolved oxygen,turbidity (Alfakit Company,model AT, see https://alfakit.ind.br/,
accessed 6 June 2017) and water transparency (Secchi depth))were obtained during each field campaign using instruments inthe field.Weather data (minimumandmaximumair temperature,wind speed and direction, monthly accumulated rainfall, number
of rainy days andmoisture) were also obtained, from the InstitutoNacional de Meteorologia (INMET) weather station (A735;�2180508.4300S, �49855013,400W), located 40 km from the
reservoir.
In vivo fluorescence: data collection and processing
Fluorometric sensors were used to obtain the concentration ofphytoplankton pigments, measured at a depth of 30 cm. Thephycocyanin concentration was measured using a UniLux
Submersible Fluorometer device (Chelsea Technologies Group,
Feb
201
1
Apr
201
1
Jun
2011
Aug
201
1
Oct
201
1
Feb
200
9
Apr
200
9
Jun
2009
Aug
200
9
Oct
200
9
Dec
200
9
Feb
201
0
Apr
201
0
Jun
2010
Aug
201
0
Oct
201
0
Dec
201
0
0
1
2
3
4
5
6
7
Sur
face
ref
lect
ance
ban
ds (
ρ%)
B3 B4 B1
Fig. 2. Reflectance profile in MODIS) Spectral Bands 3 (459–479 nm),
4 (545–565 nm) and 1 (620–670 nm) generated for the period February
2009–October 2011.
50�20�0�W 50�10�0�W
21�1
0�0�
S21
�0�0
�S
Brazil
Nova Avanhandava Reservoir
Legend
Tietê River cascade
Experimental area
Waterbodies
Nova Avanhandava Reservoir
600 km
100 km
5 km
Rapideye Image - February 2011R(Band3)G(Band2)B(Band1) colour composition
WGS84 Datum
××××××
××
×
×
×
××
×
×
×
×
×
×
×
×
×
××
×××
××
×47
46 4544
43 42
41
40
39
38
37
36
35
34
33
31
30 28
27
25
24
221816
15 15 15
40b
1 km
")
21�2
0�0�
S21
�10�
0�S
50�10�0�W 50�0�0�W
(a)
(b) (c)
Fig. 1. (a) Location of theNovaAvanhandavaReservoir in Tiete River cascade (Sao Paulo, Brazil). (b) Colour composition ofRapidEyemultispectral
image showing intensive agricultural use surrounding the reservoir. The study area is highlighted in light blue. (c) Ratio image generated fromRapidEye
bands (red edge divided by green) with the location of sample stations (points labelled with red cross and black numbers) shown in the experimental area.
2346 Marine and Freshwater Research R. E. Cicerelli et al.

see https://www.chelsea.co.uk/, accessed 6 June 2017) andcalibrated by the supplier (Chelsea Technologies Ltd 2010). The
UniLux device recorded the in vivo fluorescence of phycocyaninpigment within a dynamic range of 0–100 mg L�1, with adetection limit of 0.01 mg L�1.
Chl-a fluorescence values were obtained using a 10 AUField Fluorometer (Turner Designs, see http://www.turnerde-signs.com/), which provides relative values of in vivo fluores-
cence. Thus, in vivo fluorescence values were calibrated usingChl-a concentrations acquired from laboratory extractionusing the spectrophotometric method of Goterman (1978).Figure 3 shows the calibration curves relating in vivo fluores-
cence values to absolute concentrations of Chl-a for each fieldsurvey.
To analyse the seasonal aspect of spatial dispersion of
phytoplankton pigments in the study area, as well as therepresentativeness of the sampling design used in each fieldsurvey, concentrations of phycocyanin and Chl-a were used to
produce thematic maps describing the spatial distribution ofChl-a and phycocyanin concentrations through Thiessen poly-gons. In these maps, the size and shape of the polygons dependon the density and spatial distribution of the sample elements.
Colours are related to the concentrations of Chl-a and phycocy-anin acquired in each field survey.
In situ hyperspectral data
Hemispherical–conical reflectance factor (HCRF) values wereobtained in field measurements using a ASD FieldSpec Hand-Held model, UV/VNIR spectroradiometer (for wavelengths
325–1075 nm; Panalytical Company, see https://www.asdi.com/products-and-services/fieldspec-spectroradiometers) operatingin the spectral range 375–1075 nmwith 512 channels and a 1.6-nm
nominal spectral resolution. HCRF is the ratio of the radiance ofthe sample (La; l) and the radiance of a Lambertian referencesurface (Lr; l), measured under the same conditions of illumina-tion and observation. This reflectance factor accounts for large
instantaneous fields of view (IFOV). IFOV values were acquiredusing sensor measurements performed under ambient sky illu-mination. In this case, the assumption of a zero interval of the solid
angle for the measured reflected radiance beam does not hold true(Schaepman-Strub et al. 2006).
Spectral analytical methods (e.g. derivative analysis and
continuum removal technique) were used to extract spectralinformation associated with scattering and absorption featuresrelated to the phycocyanin pigment and to consequently evalu-
ate the occurrence of cyanobacteria in the study area.In hyperspectral remote sensing, derivative analysis was
used to discriminate the effects and quantify the concentrationof sediments and chlorophyll in the water (Chen 1992; Goodin
et al. 1993). Themathematical basis for the spectral derivative isestablished by the change of reflectance related to the wave-length (l; Chen 1992). Graphically, it is represented by the slopeof the tangent at each point of the curve; thus, the derivativeshows the points where there are sudden changes in spectralresponse. The derivatives can be estimated by finite approxima-
tion, as shown by Tsai and Philpot (1998).Continuum removal allows normalisation of the spectral
reflectance to compare individual absorption features from a
common baseline. The continuum spectrum is describedmathematically by the line equation: the linear and angularcoefficients set the upper and lower limits for each absorption
feature (Clark and Roush 1984; Mutanga et al. 2004). Anabsorption feature resulting from continuum removal containsassociated parameters, such as depth, area and width. The
spectral interval used to detect the phycocyanin pigment inwater was between 610 and 645 nm, with a central wavelengthof 627 nm.
The spectral parameters obtained were correlated with phy-cocyanin concentration. For the definition of significant Pearsoncorrelation coefficients as a function of the number of sampleelements, Fisher’s exact test of independence was used with the
level of significance set at P, 0.01 and an acceptance thresholdof 99% (Armitage et al. 2002). Thus, significant correlations(r) for the first, second and third field surveys should be greater
than 0.42, 0.44 and 0.56 respectively.
0
(a)
(b)
(c)
0
7
4
6
8
10
12
14
16
18
9
11
13
15
17
20
40
60
80
100
120
140
160
1 2
y � 69.01x � 29.904R2 � 0.9645
y � 12.63x � 4.14R2 � 0.84
3
0.3 0.4 0.5 0.6
0.300.10 0.70 0.90 1.100.50
y � 28.11x � 0.2269R2 � 0.901
Chl
-a (
μg L
�1 )
In vivo fluorescence
Fig. 3. Linear regression equations used to estimate chlorophyll (Chl)-a
concentrations by fluorometry in (a) February 2012 (nine points), (b) March
2012 (eight points) and (c) September 2012 (eight points).
Seasonal analysis of cyanobacteria in fresh water Marine and Freshwater Research 2347

Results and discussion
Phytoplankton activity in the study area
Figure 2 shows temporal profiles of phytoplankton behaviourobtained from Spectral Bands 3 (459–479 nm), 4 (545–565 nm)
and 1 (620–670 nm) of the MODIS image (MOD09A1). In thethree spectral bands evaluated, the reflectance values werehigher in February and lower in October. Therefore, on the basis
of this distinct phytoplankton behaviour, available resourcesand logistics, field campaigns were conducted in February,March and September 2012.
February was the month of greater photosynthetic activity(Fig. 2), as indicated by MODIS temporal analyses, so the ratio
image generated from red edge and green RapidEye spectralbands of February 2011 was used to distribute the sampleelements in the experiment. Other sampling stations were set
in the areas that showed greater radiometric variability, such asthe region near the south shoreline (Fig. 1c).
Analysis of phytoplankton activity in the experimental area
was based on Chl-a and phycocyanin concentrations determinedusing fluorescence methods. Brazilian legislation (resolutionnumber 357/2005) establishes a concentration limit up to30 mg L�1 Chl-a in multiple-use reservoirs. For phycocyanin,
the maximum value was based on the results reported by Brientet al. (2008), who showed that cyanobacteria become dominantin an environment with phycocyanin concentrations
.10 mg L�1.These Chl-a and phycocyanin thresholds were used as
reference values for statistical analyses of phytoplankton occur-
rence in the experimental area. In February 2012, the Chl-a andphycocyanin concentrations were close to values registered inaquatic environments dominated by cyanobacteria, as reportedby the field survey. The concentrations obtained in surveys
conducted in other seasons of the year were below the referencevalues, indicating that the waterbodies were only slightlyaffected (Table 1).
During the February 2012 field survey, the phycocyanin andChl-a concentrations had the highest s.d. values, demonstratinggreater variability in terms of their spatial distribution.
The density of phytoplankton individuals (separated bygroups) was estimated in water samples collected in February2012 (Table 2) as individuals per millilitre and as percentages,
only to verify whether there were cyanobacteria in the reservoir.The ratio of occurrence shows the dominance of the specificcyanobacteria group Cyanophyceae, with a proportion.70% interms of individuals. Moreover, among the cyanobacteria
genera identified in the samples, the dominance of Microcystis
is disturbing because these cyanobacteria are able to releasetoxins into the aquatic environment.
The effect of weather conditions (Table 3) on the occurrenceof cyanobacteria, as determined on the basis of phycocyaninconcentrations, is consistent with findings reported in the
Table 1. Statistical indicators of the chlorophyll (Chl)-a and phycocy-
anin concentrations obtained from in situ collection of water samples
February 2012 March 2012 September 2012
Phycocyanin (mgL�1)
Maximum 50.24 4.71 2.32
Minimum 1.47 0.46 0.23
Mean� s.d. 7.12� 10.05 2.58� 0.99 1.39� 0.71
Chl-a (mgL�1)
Maximum 150.96 16.04 24.35
Minimum 8.93 8.59 5.32
Mean� s.d. 47.54� 34.21 12.31� 2.26 11.86� 4.32
Number of samples 29 30 18
Table 2. Phytoplankton groups identified in the February 2012
field survey
Phytoplankton group Individuals mL�1 (%)
Bacillariophyceae 115 (6)
Chlorophyceae –
Cryptophyceae 229 (16)
Crysophyceae –
Cyanophyceae 1418 (76)
Dinophyceae 23 (1)
Euglenophyceae –
Zygnemaphyceae 23 (1)
Total 1871 (100)
Table 3. Data on environmental and limnological variables collected during each field campaign
NTU, Nephelometric turbidity unit
February 2012 March 2012 September 2012
Air temperature (8C)
Minimum 22 23 19
Maximum 24 24 24
Wind speed (m s�1) 2.5 2.5 4.0
Wind direction North-westerly South-westerly North-easterly
Accumulated monthly rainfall (mm) 80 80 70
Number of months in which rain fell 8 8 5
Humidity (%) 70 62 40
Water temperature (8C) 29 29.8 26.8
Water transparency (m) 2.6 3.5 2.7
Dissolved oxygen (mgL�1) 5.9 7.1 9.8
Turbidity (NTU) 23.7 9.0 2.6
2348 Marine and Freshwater Research R. E. Cicerelli et al.

literature for freshwater ecosystems at tropical and subtropicallatitudes (Tundisi et al. 2010). The results of the present study
suggest, as do the results of Tundisi et al. (2010), that inFebruary relatively high air and water temperatures, wet days,light wind speed and several rainfall events introduced nutrients
into the environment, creating a favourable environment for theproliferation of cyanobacteria. March was characterised by thehighest precipitation to the start the autumn period and lowconcentrations of Chl-a and phycocyanin (Tables 1, 3). Tundisi
et al. (2010) explained this period as alternating betweenstability andmixing that creates the so-called ‘moderate verticalmixing associated with a previous cold front’. In September, a
cold front just before the field survey (associated with mediumwinds and low temperatures) may have caused mixing events,
significantly reducing the population of cyanobacteria, as evi-denced by the phycocyanin and Chl-a concentrations in Table 1.
Values of other limnological variables (Table 3) indicate that
turbidity increased with Chl-a and phycocyanin concentrations,and with decreasing water transparency. Turbidity had aninverse and exponential relationship with water transparency,and a hyperbolic relationship with Chl-a (Schalles et al. 1998).
Thematic maps (Fig. 4) were created to illustrate seasonaland spatial variations in Chl-a and phycocyanin concentrationstogether with wind direction. In February 2012, many samples,
Wind direction Wind direction
××××××××
×
×
×
××
×
×
×
×
×
×
×
×
×
××
××
×××
×47
46 4544
43 42
41
40
39
38
37
36
35
34
33
31
30 28
27
25
24
22181615
40b
49�59�0�W50�0�0�W50�1�0�W
21�1
3�0�
S21
�14�
0�S
21�1
3�0�
S21
�14�
0�S
21�1
3�0�
S21
�14�
0�S
21�1
3�0�
S21
�14�
0�S
21�1
3�0�
S21
�14�
0�S
21�1
3�0�
S21
�14�
0�S
××××××××
×
×
×
××
×
×
×
×
×
×
×
×
×
××
××
×××
×47
46 4544
43 42
41
40
39
38
37
36
35
34
33
31
30 28
27
25
24
22181615
40b
50�1�0�W 50�0�0�W 49�59�0�W
××××××××
×
×
×
××
×
×
×
×
×
×
×
×
×
×
×
××
×××
×47
46 4544
43 42
41
40
39
38
37
36
35
34
33
31
30 28
27
25
24
22181615
40b
××××××××
×
×
×
××
×
×
×
×
×
×
×
×
×
××
××
×××
×47
46 4544
43 42
41
40
39
38
37
36
35
34
33
31
30 28
27
25
2422 18
1615
40b
E×××××××
×
×
×
××
×
×
×
×
×
×
×
×
×
××
××
×××
×47
46 4544
43 42
41
40
39
38
37
36
35
34
33
31
30 28
27
25
2422 18
1615
40b
50�1�0�W 50�0�0�W
××××××××
×
×
×
××
×
×
×
×
×
×
×
×
×
××
××
×××
×47
46 4544
43 42
41
40
39
38
37
36
35
34
33
31
30 28
27
25
2422 18
1615
40b
×××
××
××
×46
212018171615
0–2.4No sample
2.4–3.03.0–3.53.5–4.04.0–4.94.9–5.95.9–8.78.7–11.711.7–50.2
Field survey (Feb. 2012)
×××
××
××
×46
212018171615
×××
××
××
×46
212018171615 ××
×××
××
×46
212018171615
×××
××
××
×46
212018171615 ××
×××
××
×46
212018171615
Wind direction Wind direction
Wind direction Wind direction
49�59�0�W 50�1�0�W 50�0�0�W 49�59�0�W
Field survey (Mar. 2012)
Field survey (Sep. 2012)
Chl-aPhycocyanin (μg L�1)
Phycocyanin (μg L�1)
Phycocyanin (μg L�1)
No sample8–2020–2626–3131–3434–3636–4242–4848–7979–151
No sample0.4–1.21.2–1.91.9–2.42.4–2.62.6–2.72.7–3.03.0–3.23.2–3.73.7–4.7
No sample8.5–8.68.6–10.210.2–11.111.1–11.711.7–12.712.7–13.313.3–13.913.9–14.414.4–16.0
No sample0–0.30.3–0.70.7–0.90.9–1.41.4–1.51.5–1.61.6–2.02.0–2.12.1–2.3
No sample0–5.35.3–8.78.7–9.59.5–10.110.1–10.810.8–12.412.4–15.315.3–18.518.5–24.3
Chl-a (μg L�1)
Chl-a (μg L�1)
Chl-a (μg L�1)
Phycocyanin
Fig. 4. Quantitative spatial distribution per area of phycocyanin (left-hand panels) and chlorophyll (Chl)-a (right-hand panels) concentrations based on the
in situ surveys conducted in February, March and September 2012. The arrows indicate the direction of the winds on the dates of the field surveys.
Seasonal analysis of cyanobacteria in fresh water Marine and Freshwater Research 2349

primarily from the southern part of the experimental area, hadthe highest concentrations of phytoplankton pigments, coincidingwith wind direction (top panels, Fig. 4).
Maps containing data collected in March 2012 (middlepanels, Fig. 4) coincided with the effect of winds in definingthe highest concentrations of these pigments, found at this timein the northern part of the experimental area, even though the
wind velocity was low. This field survey was characterised bystrong rain events near the field survey. We suggest that theeffects of mixing were greater in the southern (shallower) than
northern (deeper) part of the reservoir.In the field survey of September 2012, the highest concen-
trations of phycocyanin and Chl-a (bottom panels, Fig. 4) were
again seen in the southern part of the experimental area, despitethe lower number of data points. During this period, windswere of medium intensity (4.0 m s�1), and ranged from north-
east to south-west (Table 3). Despite the similarity in phycocy-anin and Chl-a spatial variability for each field survey, there is
low correlation between these variables when the concentrationis low (March 2012 and September 2012; Fig. 5). A fundamental
problem of fluorescencemeasurements of algae is that molecularevents are responsible for the different types of fluorescencequenching, and this can lead to artefacts and misinterpretations
(Buchel and Wilhelm 1993).
Feasibility of hyperspectral analysis in detectingphycocyanin
Smoothing filters were used to reduce the effect of random noisein the reflectance factor curves. In spectra obtained during theFebruary 2012 field campaign, a five-point mean smoothing
filter was adopted (Tsai and Philpot 1998), whereas for Marchand September 2012 a Fourier transformation filtering methodwas used to remove the high-frequency components (Bracewell
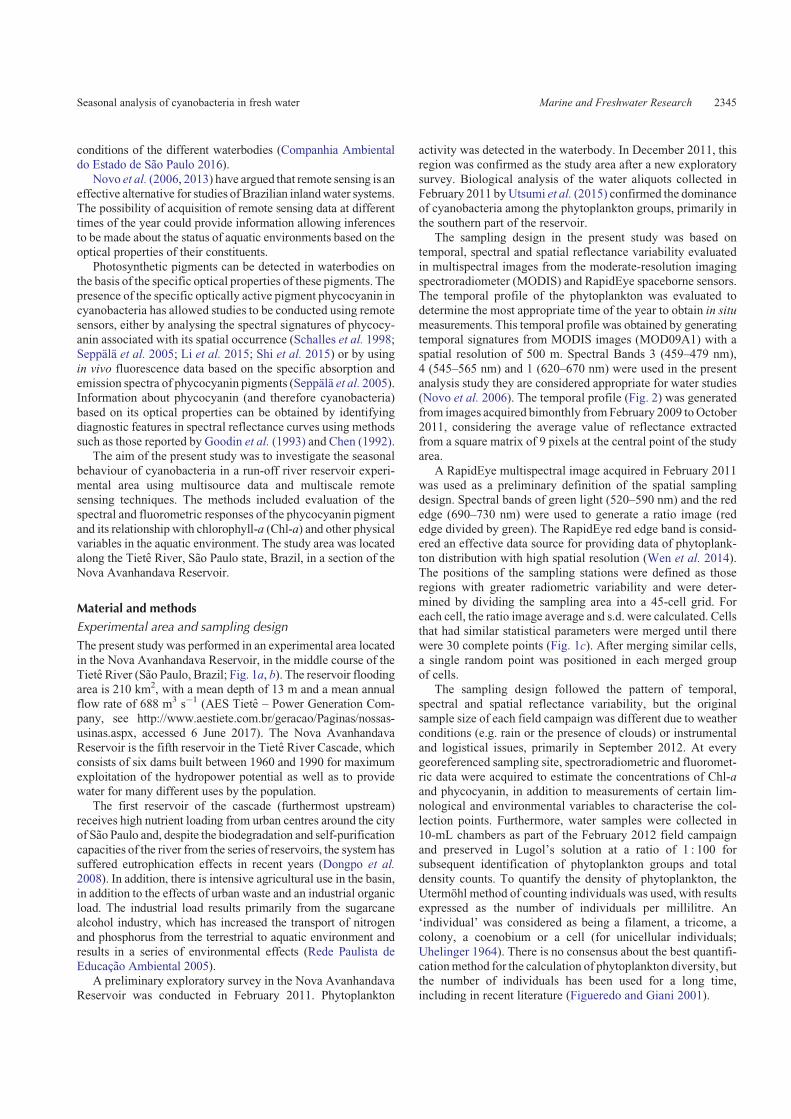
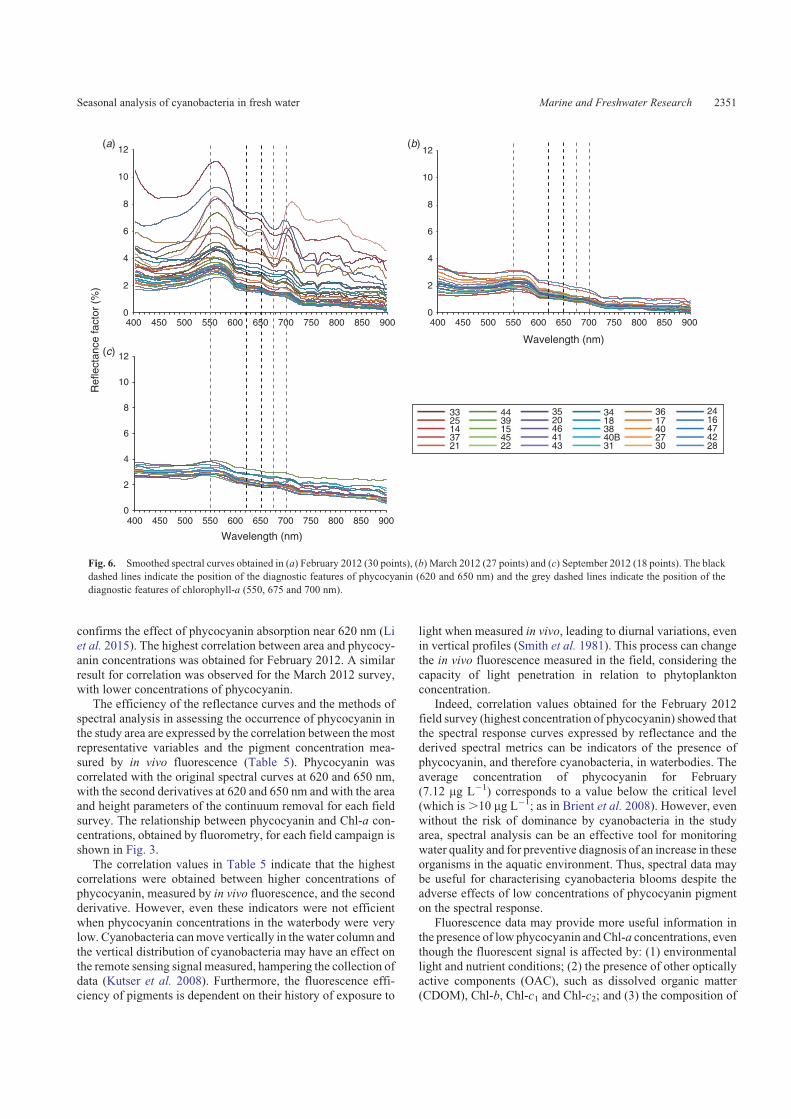
1989).The smoothed spectral curves defined in the wavelength
range from 400 to 900 nm are shown in Fig. 6, with vertical
dashed lines representing the spectral locations of the diagnosticfeatures of absorption and scattering of phycocyanin and Chl-a,as in Richardson (1996) and Kirk (1994), among others.
The highest reflectance factor values were obtained in
February 2012 (Fig. 6a) and the spectral features are clearlyassociated with phycocyanin and Chl-a pigments. In the Marchand September 2012 field surveys, the behaviour of the curves
indicates reduced variability due to low concentrations ofphytoplankton pigments.
Maximum reflectance values in the green region (between
550 and 570 nm) caused by the presence of Chl-a are visible inthe reflectance curves, as well as in the absorption features in thered region (i.e. absorption maximum near 671 nm) and the peak
reflectance in the near-infrared region (i.e. absorption minimumnear 700 nm; Fig. 6a). Furthermore, a representative peak isobserved at 750 nm, which can be attributed to scattering causedby assembly of phytoplankton cells or by total suspended solids
(Dekker 1993; Kirk 1994).Some phycocyanin spectral curves show a subtle absorption
feature near 620 nm and a scattering peak near 650 nm, as
reported in the literature for aquatic environments containingcyanobacteria (Dekker 1993; Le et al. 2011). In the February2012 field survey, these features were more pronounced
(Fig. 6a).Figure 7 shows curves resulting from the application of the
second derivative for each field survey. The subtle phycocyaninfeatures of the absorption and scattering wavelengths (620 and
650 nm respectively) become more obvious in the secondderivatives because these features have positive values forabsorption and negative values for scattering (dashed lines).
All field surveys featured curves exhibiting this behaviour, butthe magnitude of the second derivative was higher and thedispersion was lower for the February 2012 survey, when the
highest concentrations of phycocyanin were obtained.For continuum removal, the range containing the main
phycocyanin absorption feature (between 610 and 645 nm)
was adopted. Table 4 gives correlation levels among the in vivofluorescence phycocyanin concentrations and the continuumremoval parameters (height, width, asymmetry and area) foreach survey campaign. Area and height values had the highest
correlation with phycocyanin concentration. This result
y � 0.18x � 1.63R2 � 0.89
0
10
20
30
40
50
60
0 50 100 150 200
Chl-a (μg L�1)
y � 0.07x � 0.47R2 � 0.22
0
0.5
1.0
1.5
2.0
2.5
4 7 10 13 16 19 22 25 28
Phy
cocy
anin
(μg
L�
1 )
y � 0.17x � 0.51R2 � 0.19
0
1
2
3
4
5
7 9 11 13 15 17
(a)
(b)
(c)
Fig. 5. Correlation between phycocyanin and chlorophyll (Chl)-a concen-
trations based on in situ measurements conducted in (a) February 2012,
(b) March 2012 and (c) September 2012.
2350 Marine and Freshwater Research R. E. Cicerelli et al.
confirms the effect of phycocyanin absorption near 620 nm (Liet al. 2015). The highest correlation between area and phycocy-anin concentrations was obtained for February 2012. A similar
result for correlation was observed for the March 2012 survey,with lower concentrations of phycocyanin.
The efficiency of the reflectance curves and the methods of
spectral analysis in assessing the occurrence of phycocyanin inthe study area are expressed by the correlation between the mostrepresentative variables and the pigment concentration mea-sured by in vivo fluorescence (Table 5). Phycocyanin was
correlated with the original spectral curves at 620 and 650 nm,with the second derivatives at 620 and 650 nm and with the areaand height parameters of the continuum removal for each field
survey. The relationship between phycocyanin and Chl-a con-centrations, obtained by fluorometry, for each field campaign isshown in Fig. 3.
The correlation values in Table 5 indicate that the highestcorrelations were obtained between higher concentrations ofphycocyanin, measured by in vivo fluorescence, and the secondderivative. However, even these indicators were not efficient
when phycocyanin concentrations in the waterbody were verylow. Cyanobacteria canmove vertically in the water column andthe vertical distribution of cyanobacteria may have an effect on
the remote sensing signal measured, hampering the collection ofdata (Kutser et al. 2008). Furthermore, the fluorescence effi-ciency of pigments is dependent on their history of exposure to
light when measured in vivo, leading to diurnal variations, evenin vertical profiles (Smith et al. 1981). This process can changethe in vivo fluorescence measured in the field, considering the
capacity of light penetration in relation to phytoplanktonconcentration.
Indeed, correlation values obtained for the February 2012
field survey (highest concentration of phycocyanin) showed thatthe spectral response curves expressed by reflectance and thederived spectral metrics can be indicators of the presence ofphycocyanin, and therefore cyanobacteria, in waterbodies. The
average concentration of phycocyanin for February(7.12 mg L�1) corresponds to a value below the critical level(which is.10 mg L�1; as in Brient et al. 2008). However, even
without the risk of dominance by cyanobacteria in the studyarea, spectral analysis can be an effective tool for monitoringwater quality and for preventive diagnosis of an increase in these
organisms in the aquatic environment. Thus, spectral data maybe useful for characterising cyanobacteria blooms despite theadverse effects of low concentrations of phycocyanin pigmenton the spectral response.
Fluorescence data may provide more useful information inthe presence of low phycocyanin andChl-a concentrations, eventhough the fluorescent signal is affected by: (1) environmental
light and nutrient conditions; (2) the presence of other opticallyactive components (OAC), such as dissolved organic matter(CDOM), Chl-b, Chl-c1 and Chl-c2; and (3) the composition of
0
2
4
6
8
10
12
400 450 500 550 600 650 700 750 800 850 9000
2
4
6
8
10
12
400 450 500 550 600 650 700 750 800 850 900
0
2
4
6
8
10
12
400 450 500 550 600 650 700 750 800 850 900
Ref
lect
ance
fact
or (
%)
Wavelength (nm)
Wavelength (nm)
(a) (b)
(c)
3325143721
4439154522
3520464143
34183840B31
3617402730
2416474228
Fig. 6. Smoothed spectral curves obtained in (a) February 2012 (30 points), (b) March 2012 (27 points) and (c) September 2012 (18 points). The black
dashed lines indicate the position of the diagnostic features of phycocyanin (620 and 650 nm) and the grey dashed lines indicate the position of the
diagnostic features of chlorophyll-a (550, 675 and 700 nm).
Seasonal analysis of cyanobacteria in fresh water Marine and Freshwater Research 2351

the phytoplankton species (Le et al. 2011; Belzile et al. 2004,
Kiefer 1973).In short, an approach that incorporates multiple data sources
and various analytical tools for the effective monitoring of
multipurpose reservoirs at potential risk of cyanobacterialblooms is needed.
Initially, a sampling network should be properly designed inspace and time using, for example, orbital multispectral images
with strategic spectral bands for discrimination of phytoplank-tonic pigments in fast revisit time (high temporal resolution).These series of images may be integrated with environmental
data (e.g. temperature), and finally indicate areas favourable forbloom development (according to wind direction and speed).Moreover, remote sensing is a promising tool for the diagnosis
of features associated with the occurrence of phycocyanin inreflectance curves, either by indirect analysis, by monitoringconcentrations of Chl-a or by inversion of analytical models.
Conclusions
The feasibility of assessing the spatial and temporal behaviourof cyanobacteria in tropical fresh water based on the spectraland fluorescent properties of the phycocyanin pigment was
confirmed in the present study. This study presents an alter-native to the monitoring of water quality given the difficulty ofacquiring a significant number of samples in large waterbodiesto detect cyanobacteria blooms using traditional limnology
sampling.Phycocyanin and Chl-a concentrations, as well as factors
defining conditions for both cyanobacterial proliferation and
dispersal in aquatic environments, were evaluated in three fieldcampaigns. The analysis of the spatial dispersion of the phyco-cyanin pigment showed that the largest concentration of this
pigment coincided with wind direction. Similar results werefound for Chl-a, indicating that the dispersion of phytoplanktonis generally influenced by wind direction.
During the tropical summer, phycocyanin and Chl-a con-centrations exhibited significant spatial variation, with some ofthe sampling points reaching alarming levels in February, whenthe aquatic environment exhibited eutrophic behaviour.
Wavelength (nm)
�0.00005
�0.00004
�0.00003
�0.00002
�0.00001
0
0.00001
0.00002
0.00003
0.00004
0.00005
400 450 500 550 600 650 700 750 800 850 900�0.000017
�0.000012
�0.000007
�0.000002
0.000003
0.000008
0.000013
0.000018
400 450 500 550 600 650 700 750 800 850 900
�0.000015
�0.000010
�0.000005
0
0.000005
0.000010
0.000015
400 450 500 550 600 650 700 750 800 850 900
Sec
ond
deriv
ativ
e cu
rves
(D
pλ)
Wavelength (nm)
3325143721
4439154522
3520464143
34183840B31
3617402730
2416474228
(a) (b)
(c)
Fig. 7. Second derivative of the reflectance curves related to field surveys performed in (a) February 2012, (b) March 2012 and (c) September 2012.
The dashed lines indicate the position of the diagnostic features of phycocyanin (620 and 650 nm) and chlorophyll-a (550, 675 and 700 nm).
Dpl, second derivative curves.
Table 4. Correlation coefficients between in vivo fluorescence concen-
trations of phycocyanin and continuum removal parameters for the
absorption feature for the interval 610–645 nm
Parameter February 2012 March 2012 September 2012
Height 0.57 0.39 0.02
Width 0.25 0.29 0.10
Asymmetry �0.26 �0.26 0.19
Area 0.64 0.43 0.08
2352 Marine and Freshwater Research R. E. Cicerelli et al.

Irregular spatial distribution and seasonal concentrations of
phytoplankton and cyanobacteria were confirmed, regardless oftheir concentration. These variations support the requirement ofa higher number of sample elements and a better spatial
distribution of programs to monitor water quality of Brazilianinland waters.
The use ofmultisensor data with regard to the fluorescent and
spectral properties of phycocyanin was adequate to analyse theseasonal behaviour and spatial distribution of cyanobacteria.The fluorometric sensors recorded low signal levels, enablingestimates of even low concentrations of pigments, whereas the
spectral response for detecting phycocyanin is constrained by itslow strength at low concentrations. However, hyperspectralremote sensing is an effective approach for monitoring phyto-
plankton, and the results of the present study showed that evenwithout defining clear diagnostic features in the reflectancecurve (as with Chl-a), the use of techniques to analyse spectral
curves can highlight the specific subtle spectral characteristicsof phycocyanin.
Regarding the methods of extracting information from spec-
tral curves, the values of the second derivative at wavelengths of620 and 650 nm resulted in high correlation coefficients withphycocyanin concentrations (0.8 and 0.96 respectively) for dataacquired in February 2012.
Monitoring the growth and dispersion of cyanobacteria inaquatic environments is fundamental to preventing the occur-rence of blooms and the emergency control measures related to
them. These measures may cause cell lysis and release micro-cystin into the water. From this perspective, the present studydemonstrated the use of a monitoring approach based on the
spectral and fluorescent behaviour of the phycocyanin pigment,integrating multiscale and multisensory remote sensing data.The collection of consistent data at different times of the yearshowed the spatial and seasonal variability in cyanobacteria and
the possibility for the development of rapid and reliablemethodsof monitoring cyanobacteria blooms.
Conflicts of interest
The authors declare that they have no conflicts of interest.
Acknowledgements
The authors thank Coordenadoria de Aperfeicoamento de Pessoal de Nıvel
Superior (CAPES), Universidade Estadual Paulista (UNESP), Fundacao de
Estudos e Pesquisas Agrıcolas e Florestais (FEPAF) and Fundacao para o
Desenvolvimento da UNESP (FUNDUNESP) for financial and technical
support with the field surveys. The authors also thank Programa de Pos-
Graduacao em Ciencias Cartograficas (PPGCC) for training support.
References
Armitage, P., Berry, P. J., andMatthews, J. N. S. (2002). ‘StatisticalMethods
in Medical Research’, 4th edn. (Blackwell Publishing: Oxford, UK.)
Belzile, C., Vicent, W. F., Williams, C. H., Hawes, I., James, M. R.,
Kumagai, M., and Roesler, C. S. (2004). Relationships between spectral
optical properties and optically active substances in a clear oligotrophic
lake. Water Resources Research 40, WR003090. doi:10.1029/
2004WR003090
Bracewell, R. N. (1989). The Fourier transform. Scientific American 260,
86–95. doi:10.1038/SCIENTIFICAMERICAN0689-86
Brient, L., Lengronne,M., Bertrand, E., Rolland,D., Sipel, A., Steinmann,D.,
Baudin, I., Legeas, M., Le Rouzic, B., and Bormans, B. (2008). A
phycocyanin probe as a tool for monitoring cyanobacteria in freshwater
bodies. Journal of Environmental Monitoring 10, 248–255. doi:10.1039/
B714238B
Buchel, C., and Wilhelm, C. (1993). In vivo analysis of slow chlorophyll
fluorescence induction kinetics in algae: progress, problems and per-
spectives. Photochemistry and Photobiology 58, 137–148. doi:10.1111/
J.1751-1097.1993.TB04915.X
Chelsea Technologies Ltd (2010). ‘Trilux Calibration Procedure 2125-080-
CP.’ (Chelsea Technologies: West Molesey, UK.)
Chen, Z. (1992). Derivative reflectance spectroscopy to estimate suspended
sediment concentration. Remote Sensing of Environment 40, 67–77.
doi:10.1016/0034-4257(92)90127-6
Clark, R. N., and Roush, T. L. (1984). Reflectance spectroscopy: quantita-
tive analysis techniques for remote sensing applications. Journal
of Geophysical Research 89, 6329–6340. doi:10.1029/
JB089IB07P06329
Coles, J. F., and Jones, R. C. (2000). Effect of temperature on photosynthe-
sis–light response and growth of four phytoplankton species isolated
from a tidal freshwater river. Journal of Phycology 36, 7–16.
doi:10.1046/J.1529-8817.2000.98219.X
Companhia Ambiental do Estado de Sao Paulo (2016). Relatorio de
qualidade das aguas superficiais do Estado de Sao Paulo, 2015.
(CETESB: Sao Paulo, Brazil.)
Dekker, A. G. (1993). Detection of optical water quality parameters for
eutrophic waters by high resolution remote sensing. Ph.D. Thesis, Vrije
Universiteit, Amsterdam, Netherlands.
Dongpo, S., Ruili, L., Youngjun, S., and Jun, Y. (2008). Impact of
hydroelectric projects on river environment: analysis of water quality
changes in Ningxia Reach of Yellow River. Water Science and Engi-
neering 2, 66–75.
Table 5. Correlation between in vivo fluorescence concentrations of phycocyanin and the information extracted from spectral
reflectance curves for each field campaign
Chl-a, chlorophyll-a
February 2012 March 2012 September 2012
Reflectance factor
At 620 nm 0.50 �0.25 �0.11
At 650 nm 0.56 �0.25 �0.10
Second derivative value
At 620 nm 0.80 0.40 0.55
At 650 nm 0.96 �0.20 �0.50
Area parameter (continuum removal): 610–645 nm 0.64 0.43 0.10
Height parameter (continuum removal): 610–645 nm 0.58 0.39 0.05
Phycocyanin and Chl-a concentrations 0.79 0.44 0.47
Seasonal analysis of cyanobacteria in fresh water Marine and Freshwater Research 2353

Figueredo, C. C., and Giani, A. (2001). Seasonal variation in the diversity
and species richness of phytoplankton in a tropical eutrophic reservoir.
Hydrobiologia 445, 165–174. doi:10.1023/A:1017513731393
Goodin, D. G., Han, L., Fraser, R. N., Rundquist, D. C., Stebbins,W. A., and
Schalles, J. F. (1993). Analysis of suspended solids in water using
remotely sensed high resolution derivate spectra. Photogrammetric
Engineering and Remote Sensing 59, 505–510.
Goterman, H. L. (1978). ‘Methods for Physical and Chemical Analysis of
Fresh Waters.’ (Limnological Institute: Oxford, UK.)
Kiefer, D. A. (1973). Chlorophyll-a fluorescence in marine centric diatoms:
responses of chloroplasts to light and nutrient stress.Marine Biology 23,
39–46. doi:10.1007/BF00394110
Kirk, J. T. O. (1994). ‘Light and Photosynthesis in Aquatic Ecosystems.’
(Cambridge University Press: Cambridge, UK.)
Kutser, T., Metsamaa, L., and Dekker, A. G. (2008). Influence of the vertical
distribution of cyanobacteria in the water column on the remote sensing
signal. Estuarine, Coastal and Shelf Science 78, 649–654. doi:10.1016/
J.ECSS.2008.02.024
Le, C., Li, Y., Zha, Y., Wang, Q., Zhang, H., and Yin, B. (2011). Remote
sensing of phycocyanin pigment in highly turbid inland waters in Lake
Taihu, China. International Journal of Remote Sensing 32, 8253–8269.
doi:10.1080/01431161.2010.533210
Li, L., Lin, L., and Song, K. (2015). Remote sensing of freshwater
cyanobacteria: an extended IOP inversion model of inland waters
(IIMIW) for partitioning absorption coefficient and estimating phyco-
cyanin. Remote Sensing of Environment 157, 9–23. doi:10.1016/J.RSE.
2014.06.009
Mutanga, O., Skidmore, A. K., and Prins, H. H. T. (2004). Predicting in situ
pasture quality in the Kruger National Park, South Africa, using
continuum-removed absorption features. Remote Sensing of Environ-
ment 89, 393–408. doi:10.1016/J.RSE.2003.11.001
Novo, E. M. L. M., Barbosa, C. C. F., Freitas, R. F., Shimabukuro, Y. E.,
Melack, J. M., and Filho, W. O. (2006). Seasonal changes in chlorophyll
distributions in Amazon floodplain lakes derived from MODIS images.
Limnology 7, 153–161. doi:10.1007/S10201-006-0179-8
Novo, E. M. L. M., Londe, L. R., Barbosa, C. C. F., Araujo, C. A. S., and
Renno, C. D. (2013). Proposal for a remote sensing trophic state index
based upon Thematic Mapper/Landsat images. Revista Ambiente &
Agua 8(3), 65–82. doi:10.4136/AMBI-AGUA.1229
Rede Paulista de Educacao Ambiental (2005). Orientacao para educacao
ambiental nas bacias hidrograficas do Estado de Sao Paulo: origem e
caminhos. In ‘Origem e caminhos da REPEA-Rede Paulista de Educa-
cao Ambiental’. (Eds M. P. Borba, P. Otero, and C. H. R. Pinheiro.)
pp. 81–126. (Imprensa Oficial do Estado de Sao Paulo: Sao Paulo,
Brazil.)
Richardson, L. L. (1996). Remote sensing of algal bloom dynamics; new
research fuses remote sensing of aquatic ecosystemswith algal accessory
pigment analysis. Bioscience 46, 492–501. doi:10.2307/1312927
Schaepman-Strub, G., Schaepman, M. E., Painter, T. H., Dangel, S., and
Martonchik, L. V. (2006). Reflectance quantities in optical remote
sensing – definitions and case studies. Remote Sensing of Environment
103, 27–42. doi:10.1016/J.RSE.2006.03.002
Schalles, J. F., Gitelson, A. A., Yacobi, Y. Z., and Kroenke, A. E. (1998).
Estimation of chlorophyll a from time series measurements of high
spectral resolution reflectance in an eutrophic lake. Journal of Phycology
34, 383–390. doi:10.1046/J.1529-8817.1998.340383.X
Seppala, J., Ylostalob, P., and Kuosac, H. (2005). Spectral absorption and
fluorescence characteristics of phytoplankton in different size fractions
across a salinity gradient in the Baltic Sea. International Journal of
Remote Sensing 26, 387–414. doi:10.1080/01431160410001723682
Shi, K., Zhang, Y., Li, Y., Li, L., Lv, H., and Liu, X. (2015). Remote
estimation of cyanobacteria-dominance in inland waters. Water
Research 68, 217–226. doi:10.1016/J.WATRES.2014.10.019
Sivonen, K., and Jones, G. (1999). Cyanobacterial toxins. In ‘Toxic
Cyanobacteria in Water: a Guide to their Public Health Consequences,
Monitoring and Management’. (Eds I. Chorus and J. Bartram.)
pp. 290–307. (E & FN Spon: London, UK.)
Smith, R. C., Baker, K. S., and Dustan, P. (1981). ‘Fluorometric Techniques
for the Measurement of Oceanic Chlorophyll in the Support of Remote
Sensing.’ (Scripps Institution of Oceanography: San Diego, CA, USA.)
Tsai, F., and Philpot, W. (1998). Derivative analyses of hyperspectral data.
Remote Sensing of Environment 66, 41–51. doi:10.1016/S0034-4257
(98)00032-7
Tundisi, J. G.,Matsumura-Tundisi, T., Pereira, K. C., Luzia, A. P., Passerini,
M. D., Chiba,W. A. C.,Morais,M.A., and Sebastien, N. Y. (2010). Cold
fronts and reservoir limnology: an integrated approach towards the
ecological dynamics of freshwater ecosystems. Brazilian Journal of
Biology 70, 815–824. doi:10.1590/S1519-69842010000400012
Uhelinger, V. (1964). Etude statistique des methodes de denobrement
planctonique. Archives des Sciences 17, 121–123.
Utsumi, A. G., Galo,M. L. B. T., and Tachibana, V.M. (2015).Mapeamento
de cianobacterias por meio da fluorescencia da ficocianina e de analise
geoestatıstica. Revista Brasileira de Engenharia Agrıcola e Ambiental
19(3), 273–279. doi:10.1590/1807-1929/AGRIAMBI.V19N3P273-279
Wen, X., Zhou, Z., Chen, B., Li, Z., and Tang, X. (2014). Research on
the features of chlorophyll-a derived from Rapideye and EOS/MODIS
data in Chaohu Lake. IOP Conference Series: Earth and Environmental
Science 17, 1–5. doi:10.1088/1755-1315/17/1/012111
www.publish.csiro.au/journals/mfr
2354 Marine and Freshwater Research R. E. Cicerelli et al.