multiresolution analysis applied to interpretation of ... · campo de la sísmica de reflexión,...
TRANSCRIPT

Multiresolution analysis applied to interpretation of seismicreflection data
D. E. Rivera-Recillas1,2, M. M. Lozada-Zumaeta1,2, G. Ronquillo-Jarillo2 and J. O. Campos-Enríquez3,4
1 Posgrado en Ciencias de la Tierra, UNAM, México, D.F., México2 Instituto Mexicano del Petróleo, México, D.F., México3 Instituto de Geofísica, UNAM, México, D.F., México4 ESIA-Ciencias de la Tierra, Instituto Politécnico Nacional, México, D.F., México
Received: February 4, 2004; accepted: June 6, 2005
RESUMENHemos desarrollado el análisis multiresolutivo basado en la transformada ondicular discreta. En este trabajo ilustramos los
usos potenciales en la exploración petrolera de la aplicación conjunta del análisis multiresolutivo y de los atributos sísmicosmediante un caso de estudio. Tres reflexiones mayores en la base de la ventana sísmica analizada están asociadas a formacionesgeológicas con aceite (de edad Cretácico Inferior). Estas reflexiones mayores parecen continuarse hacia la izquierda por reflexionesmenos claras y de menor amplitud. Basados únicamente en el análisis multiresolutivo de los datos sísmicos o en sus respectivosatributos convencionales (amplitud, fase y frecuencia instantáneas) no fue posible excluir la posible continuación. En efecto unacontinuación estratigráfica es sugerida por estos dos conjuntos de datos. Sin embargo, las resoluciones a diferentes escalasproporcionadas por el análisis multiresolutivo de los atributos sísmicos permitieron un análisis más fino. En efecto la continuidadsugerida en el análisis multiresolutivo de la sección sísmica y de los mismos atributos sísmicos, no fue apoyada completamentepor el análisis de la fase. Es posible con la multiresolución de este atributo distinguir con confianza entre las reflexiones continuasde mayor amplitud y sus supuestas continuaciones. Las continuaciones están caracterizadas por reflexiones de baja amplitud, demedia a alta frecuencia y continuas a tramos. Al estar aislada de las contribuciones de la información sísmica a otras escalas (orangos de frecuencia) una característica sísmica dada es definida con más nitidez. Es este realzado adicional (es decir mayorcalidad de la relación señal-ruido) lo que le permite a uno realizar un análisis discriminatorio más fino de mucha utilidad en ladetección de hidrocarburos. El uso conjunto de la multriresolución y de los atributos sísmicos tiene aplicaciones potenciales en elcampo de la sísmica de reflexión, tanto como indicador de hidrocarburos como en la caracterización de yacimientos carbonatados.El análisis multiresolutivo aquí desarrollado está basado en la transformada ondicular discreta, y representa una alternativa alanálisis multiresolutivo basado en la transformada ondicular continua hoy disponible en la industria petrolera.
PALABRAS CLAVE: Transformada ondicular, análisis multiresolutivo, análisis de datos sísmicos, geofísica aplicada.
ABSTRACTWe have developed a method of seismic multiresolution analysis based on the discrete wavelet transform. We illustrate the
potential use in petroleum exploration of the joint application of multiresolution analysis and seismic attributes for a real casestudy. Three major reflections at the base of the seismic window are associated with oil-bearing Lower Cretaceous geologicformations. These major reflections seem to be continued towards the left by less clear and lower amplitude reflections. On thestrength of multiresolution analysis from the seismic data or from envelope amplitude, instantaneous phase and frequency couldnot be discarded, the possible continuations as a stratigraphic continuation was suggested in both data sets. Improved resolution atdifferent scales provided by multiresolution analysis of the seismic attributes enabled a finer analysis, and continuity was nolonger fully supported. It was possible to distinguish the high amplitude continuous reflections from their continuations. Higherresolution improved discrimination. The joint use of multiresolution and seismic attributes has potential applications in the field ofseismic reflection. We use successfully the discrete wavelet transform as an alternative to the continuous wavelet transform.
KEY WORDS: Wavelet transform, multiresolution analysis, seismic data analysis, applied geophysics.
INTRODUCTION
Seismic attributes represent a mature technology whichis being improved continuously. Seismic attributes are ob-tained from seismic data for geological interpretation andanalysis. For example, the envelope amplitude represents a
measure of the reflection strength. Since seismic data areincredibly rich in information on amplitude, frequency andgeometry, many attributes have been proposed in the lastdecade: e.g., AVO is an attribute which can evaluate the rockelastic parameters (Shuey, 1985; Jin et al., 2000). Even whenphysical links between reservoir properties and attributes are
Geofísica Internacional (2005), Vol. 44, Num. 4, pp. 355-368
355
356
D. E. Rivera-Recillas et al.
not established (Hart, 2002), attributes are being integratedin sophisticated workflows and techniques using meta-at-tributes more directly related to geology or to reservoir prop-erties, and more amenable to well calibration. Some of theseworkflows can help in mapping faults (Rooij and Tingdahl,2002), or in the classification of seismic facies (West et al.,2002). Attributes are used to help predict physical properties(e.g., porosity, lithology, bed thickness) of strata. A classifi-cation of attributes may be based on time, amplitude, fre-quency, and attenuation (Brown, 1996; Chen and Sidney,1997; Brown, 2001).
Instantaneous amplitude A(t), instantaneous phase θ(t),and instantaneous frequency f(t) are given by
A t x t Hx t( ) ( ) ( )( ) ,= +2 2 (1)
θ ( ) tg( )( )
( ),t
Hx t
x t=
⎛
⎝⎜
⎞
⎠⎟
−1 (2)
f td
dtt( ) ( ).=
1
2πθ (3)
The continuous wavelet transform has been recentlyproposed to perform a spectral decomposition from conven-tional attributes (Gao et al., 1999; Castagna et al., 2002).Active research includes the use of the complex wavelet trans-form, originally developed for image processing (Lawton1993; Lina and Mayrand, 1995; Kingsbury, 1999, 2000;Spaendonck et al., 2002). Projection-based (Spaendonck etal., 2001a, 2001b), and local wavelet-based Hilbert trans-form operators (Selesnick, 2001; Spaendonck et al., 2002)have also been proposed.
The diagonalization of standard linear operators in thewavelet domain (Ekstedt and Lindberg, 1997) was success-fully applied to the processing of aeromagnetic data (Ridsdill-Smith and Dentith, 1999), as well as to the diagonalizationof the Hilbert transform operator to obtain seismic attributes(Rivera-Recillas et al., 2001; 2002; 2003a; 2003b; Rivera-Recillas, 2005). The continuous wavelet transform is alsobeing applied to analyze seismic attributes (i.e., Castagna etal., 2002). We have been studying several applications ofthe wavelet transform (Lozada Zumaeta and Ronquillo-Jarillo, 1996; 1997a; 1997b; 1997c; 2002; Ronquillo Jarilloet al., 2003; Lozada-Zumaeta et al., 2003a, 2003b). One ini-tial research topic was the application of multiresolution tothe analysis of seismic attributes (Ronquillo-Jarillo andLozada-Zumaeta, 1997, 1998; Lozada-Zumaeta andRonquillo-Jarillo, 1998; Lozada-Zumaeta et al., 2001;Lozada-Zumaeta, 2002).
Early progress in research on the wavelet transform inseismic reflection may be found in symposiums and con-
gresses (i.e., Lozada-Zumaeta and Ronquillo Jarillo, 1997a,1997b, 1997c; Ronquillo-Jarillo et al., 2003; Lozada-Zumaetaet al., 2003a, 2003b). At present, applications to seismologyand seismic reflection begin to be reported formally (i.e.,Chiao and Kuo, 2001; Chiao and Liang, 2003). Some recentreports are related to filtering (Fedi et al., 2000; Yu andMcMechan, 2002; Pazos et al., 2003), phase detection(Yogomida, 1994; Lou and Rial, 1995; Singh and Dowla,1997; Fedorenko and Husebye, 1999, Gendron et al., 2000;Zhang et al., 2003), earthquake detection, and source de-scription and system characterization (Basu and Guota, 1997;Lui and Najmi, 1997; Ji et al., 2002; Rezai and Ventura, 2002;Botella et al., 2003), analysis of seismic signals (Bartoschand Seidl, 1999; Le Gonidec et al., 2002; Liu and Zhang,2002), tomography (Bergeron et al., 1999, 2000), group ve-locity and slowness determinations (Bear and Pavlis, 1997;Yamada and Yomogida, 1997), and inversion (Li et al., 1996).A few formal papers have been reported on multiresolutionanalysis (Goupillaud et al., 1984; Cohen and Chen, 1993;Faqui et al., 1995; Grubb and Walden, 1997; Torrence andCompo, 1998). However, we know of just one informal ap-plication relating multiresolution to seismic attributes(Castagna et al., 2002), this was based on the continuouswavelet transform. Here we formally present some early re-sults on the use of the discrete wavelet transform inmultiresolution to analyze seismic attributes, and we pro-vide a field application.
MULTIRESOLUTION OF SEISMIC DATA:AN EXAMPLE
Figure 1 shows a window of a seismic section from aLower Cretaceous limestone hosting oil and gas. The pro-duction zone is expected between traces 240 and 300 andbetween 0.55 s and 0.65 s. The seismic data were processedto preserve amplitude and waveform. The processing includedediting, geometry correction, surface-consistent deconvolu-tion, velocity analysis, normal move out and depth move outcorrections, stacking, filtering, and time migration.
The section featured two groups of reflections: Z1 dipstowards the left from about 0.2 s around trace 300 to 0.6 attrace 10. The reflections in this group in general are clear,continuous, and of high frequency.
The group Z2 (Figure1b) contains three high ampli-tude, clear reflections between the traces 200 and 400, andbetween 0.6 s and 1.0 s. At trace 210 approximately thesereflections disappear. Instead, further to the left, we find re-flections of about the same wavelength but slightly displaced.The amplitudes of these reflections are lower and they dip inthe opposite direction. The geologic interpretation is notstraightforward (see Figure 1b): a fold involving a facieschange, or a fault? No coherent, small-amplitude reflections
357
Multiresolution analysis applied to interpretation of seismic reflection data
are observed between Z1 and Z2. The interval of economicinterest for oil corresponds to the top reflection of the sec-ond group (I on Figure 1b). In the following we illustrate thejoint use of multiresolution and seismic attributes.
Multiresolution may be used: (1) to perform the analy-sis of a seismic attribute from a given seismic section (Rivera-Recillas, 2005); or (2) to obtain first the multiresolution analy-sis and then calculate the attributes for each resolution scale(Lozada-Zumaeta and Ronquillo-Jarillo, 1997a, 1997b;Lozada-Zumaeta, 2002).
We first obtained the multiresolution analysis of theseismic data from Figure 1, and we compared the resolution(1) from the conventional attributes themselves (amplitude,instantaneous phase, and instantaneous frequency), and (2)for the multiresolution analysis of the seismic attributes, ob-tained as a second step.
See Appendix A for an introduction to multiresolutionanalysis. Figure 2 shows the multiresolution from the origi-nal seismic data. To see how the original data are decom-posed into its components at different frequencies or scalesconsider that the information contained in panels h) and i)are used to recover the section of panel f), and so on. Theoriginal section in a) is recovered from the sum of the infor-mation in panels b) and c). Panels at the left correspond toaverage or coarse information, while panels at right featurefine-scale information. From top to bottom we have coarserscales. The finest scale information is contained in panels b)and c), while panels h) and i) feature coarse scale informa-tion. The frequency content of resolution W
10 (Figure 2c) lies
between 30 and 70 Hz with peaks at 45 and 60 Hz. For theresolution W
9 (Figure 2e) we have a frequency content be-
tween 20 and 60 Hz with peaks at 30 and 45 Hz. For theresolution W
8 the seismic information has a content between
10 and 35 Hz with a peak at 25 Hz and a minor one at 15 Hz(Figure 2g). For the resolution corresponding to W
7 (Figure
2i), the frequency content corresponds to a narrow bandaround 10 Hz. In resolution V
10 (Figure 2b) the frequency
content ranges between 10 and 50 Hz with a peak at 10 Hzand minor peaks at 20 and 30 Hz. For resolution V
9 (Figure
2d) the frequency content ranges between 10 and 50 Hz, witha peak at 8 Hz, and a minor one at 25 Hz. In the resolution V
8
(Figure 2f) the information is concentrated between 10 and30 Hz, with a peak at 10 Hz, with minor information be-tween 20 and 30 Hz. Finally, for resolution V
7 (Figure 2h)
the information is concentrated around 10 Hz.
This multiresolution treatment was based onDaubechies wavelets of order 6 (see Appendix A). We notethat the first group of reflections Z1 is characterized by highand medium frequencies (see resolutions V
10, V
9, and V
8). The
reflections of the second group Z2 comprise medium and
low frequencies. The projections onto V7 and W
7 suggest con-
tinuity of these reflections. However, they do not present thesame amplitudes and frequencies.
Figure 3 shows the conventional seismic attributes (en-velope amplitude, instantaneous phase, and instantaneous fre-quency) from the seismic window. The envelope amplitudeenhances the presence of the two reflection groups Z1 andZ2 as defined in the original seismic section. The reflectionsfrom the second group and their possible continuations havecontrasting reflection amplitudes. The three reflections fromthe second group stand out for their high amplitude, butcontrastingly, the eventual continuations towards the left fea-ture lower amplitudes (Figure 3c). The instantaneous fre-quency signatures do not imply a major difference betweenreflections and supposed continuations. The main reflectiongroup Z1 is featured by high instantaneous frequency val-ues. The high frequency signature of the second group ofreflections is featured by a shadow (i.e., low values). Theirsupposed continuations present low but uncorrelated values.According to these seismic attributes, we cannot exclude astratigraphic continuity towards the left from the Z2 mainreflections as suggested by the instantaneous phase.
Now let us illustrate how multiresolution analysis ofthe seismic attributes may provide a higher resolution. Theimprovement is due to the fact that at a given scale the reso-lution of the seismic attributes is enhanced, as they are iso-lated from information at other scales. This enhanced reso-lution enables one to trace seismic reflections with more con-fidence.
The multiresolution analysis from the instantaneousphase seems to confirm continuity of the second and thirdreflections in group Z2 (Figure 4). However, now it appearsthat the supposed continuations towards the left are onlypiece-wise continuous. Continuity toward the left is not clearanymore at projections V
7 and W
7 (i.e., at low frequencies).
Thus V7 and W
7 helps to rule out continuity towards the left
of the topmost reflection.
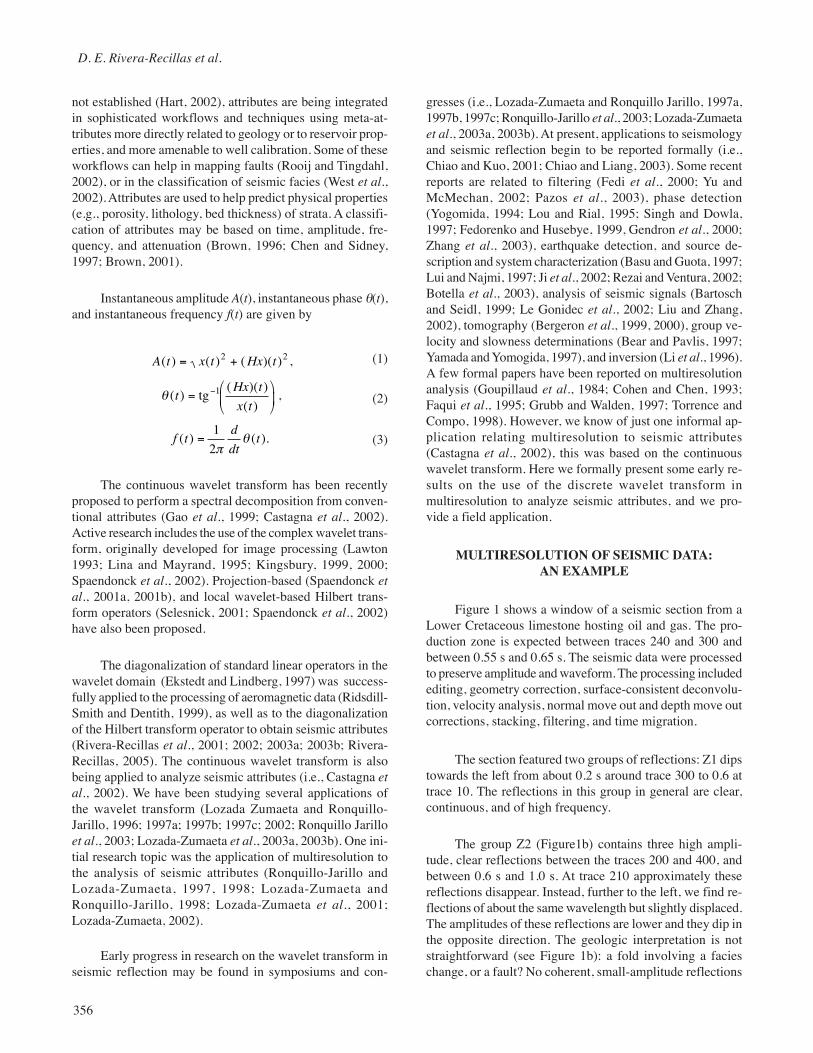
Multiresolution analysis of the envelope amplitude isshown in Figures 5. The importance of the reflections of thesecond group from top to bottom is clear in the resolutionsV
10, V
9, V
8 and V
7 from the envelope amplitude.
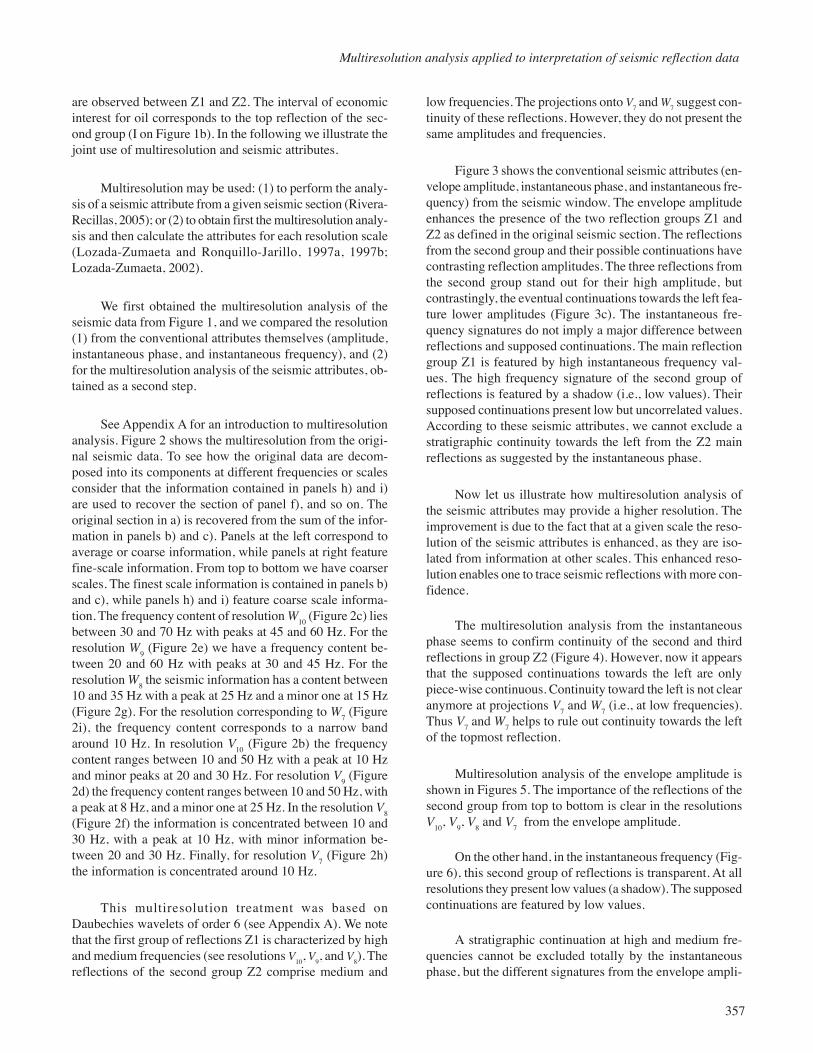
On the other hand, in the instantaneous frequency (Fig-ure 6), this second group of reflections is transparent. At allresolutions they present low values (a shadow). The supposedcontinuations are featured by low values.
A stratigraphic continuation at high and medium fre-quencies cannot be excluded totally by the instantaneousphase, but the different signatures from the envelope ampli-

358
D. E. Rivera-Recillas et al.
Fig. 1. A seismic section: (a) wiggle-trace plot, (b) image plot.
tude (reflection strength), and the instantaneous frequencysuggest that the layers contain oil only in the right hand por-tion. The existence of a fault seems confirmed by 1) the slightdisplacement observed between the main reflections and their
supposed continuations, and 2) the lack of continuity to theleft. This fault might be sealing the layer to the right. In con-clusion, the structure associated to these reflections can beinterpreted as an asymmetrical anticline affected by an in-

359
Multiresolution analysis applied to interpretation of seismic reflection data
Fig. 2. Multiresolution analysis of the seismic section, based on the wavelet Daubechies of order 6 wavelet: (a) the seismic section (consideredas resolution V
11), (b), (d), (f), and (h) are the resolutions V
10, V
9, V
8, and V
7, respectively; (c), (e), (g), and (i) are the resolutions W
10, W
9, W
8,
and W7, respectively.

360
D. E. Rivera-Recillas et al.
Fig. 3. Conventional seismic attributes for the seismic section: (a) the seismic section, (b) envelope amplitude, (c) instantaneous phase, and(d) instantaneous frequency.
verse fault. The behavior of the attributes (amplitude, phase,instantaneous frequency) suggests that the upper left por-tion may be acting as a trap for gas.
CONCLUSIONS
The performance of discrete wavelet-basedmultiresolution analysis was illustrated with a window of areal seismic section. The high amplitude and wavelengthreflections from the second group featuring the seismic win-dow seem to continue towards the left with less clear andlower amplitude reflections. Production of oil and gas is ex-pected in the domain of this second group (between 0.6 and0.8 s, and between traces 240 and 300). Based onmultiresolution analysis from the seismic window, or fromthe seismic attributes themselves, it was not possible to ruleout the continuity of this group of reflections.
However, the resolutions at different scales providedby a multiresolution analysis of the seismic attributes en-abled a finer analysis. The continuity, suggested in themultiresolution analysis of the seismic section and of theseismic attributes themselves, was not fully supported bythe multiresolution analysis of the phase attribute. It waspossible to distinguish with some confidence between thehigh-amplitude continuous reflections and their continua-
tions, characterized by high-to-medium frequency, piece-wise, low-amplitude reflections. This difference, and the factthat the high-amplitude reflections featured low frequencyshadows, suggested the existence of oil in the respective lay-ers. This finding was confirmed by well data.
The frequency range at which a given reflection isdominant is very useful because it enables us to study thefrequency-dependent attenuation, by analysing a given re-flection at different resolutions. For example, the high am-plitude reflections were clear around 10 Hz. Also, low-fre-quency shadows may be associated with hydrocarbon-re-lated bright spots (Castagna et al., 2002). Multiresolutionmay help detect the presence of such low frequency shad-ows at a given frequency range.
ACKNOWLEDGMENTS
Critical reviews and comments by three anonymousreviewers helped to improve the manuscript. The manuscripthas been elaborated during the sabbatical leave of OscarCampos at the Earth Sciences Department of the Engineer-ing and Architecture School of the National Polytechnic In-stitute, Mexico.
361
Multiresolution analysis applied to interpretation of seismic reflection data
Fig. 4. Multiresolution analysis for the envelope amplitude of the section, based on the Daubechies of order 6 wavelet: (a) the envelopeamplitude, (b), (d), (f), and (h) are the resolutions V
10, V
9, V
8 and V
7, respectively; (c), (e), (g), and (i) are the resolutions W
10, W
9, W
8 and W
7,
respectively.
362
D. E. Rivera-Recillas et al.
Fig. 5. Multiresolution analysis for the instantaneous frequency of the section, based on the Daubechies of order 6 wavelet: (a) theinstantaneous frequency, (b), (d), (f), and (h) are the resolutions V
10, V
9, V
8 and V
7, respectively; (c), (e), (g), and (i) are the resolutions W
10,
W9, W
8 and W
7, respectively.

363
Multiresolution analysis applied to interpretation of seismic reflection data
Fig. 6. Multiresolution analysis for the instantaneous phase of the section, based on the Daubechies of order 6 wavelet : (a) the instantaneousphase, (b), (d), (f), and (h) are the resolutions V
10, V
9, V
8 and V
7 respectively; (c), (e), (g), and (i) are the resolutions W
10, W
9, W
8 and W
7,
respectively.

364
D. E. Rivera-Recillas et al.
APPENDIX A: INFORMAL INTRODUCTION TOWAVALET TRANSFORM AND
MULTIRESOLUTION ANALYSIS
The wavelet transform enables, in contrast with theFourier transform, a time frequency analysis of a given func-tion (Daubechies, 1992; Strang and Nguyen, 1996). The con-tinuous wavelet transform of f(t) is the integral transform
Wf t f uu t
du( , ) ( ) ,λλψ
λλ=
−⎛
⎝⎜
⎞
⎠⎟ >
−∞
∞
∫ 1 for 0, A1
The function ψ(t) is a wavelet, t is a time localizationparameter, and λ is a scale parameter.
Wavelets are introduced by the definition of the con-tinuous wavelet transform, eq. A1. In order to obtain local-ization in time, wavelets must have unit energy, compactsupport, or sufficiently fast decay, and zero mean. Somewavelets are defined analytically (Table 1), other are givennumerically (i.e., Daubechies order six wavelet, Table 2).The meaning of the lambda and t parameters is as follows.By varying λ we can compress or dilate the original wavelet,while we can translate it by varying t. In this way low andhigh frequencies can be selectively analyzed by a wavelet(i.e., features at different scales). The wavelets ψ(t), ψ(t-1),ψ(t-2), etc., obtained by varying the time localization pa-rameter (and holding λ = 1) constitute a base for a functionspace W
j. In a general way, by varying λ we obtain addi-
tional function spaces Wj-1
, Wj-2
, Wj-3
, etc., where
w t b t lj lj
l
j( ) ( )= −∑ ψ 2 .
and wj ∈ W
j. At this point, it is useful to consider the normal-
ized wavelet localized in time b and scale λ as follows
ψ λ ψλλ,
/b
t b=
−⎛⎝⎜
⎞⎠⎟
−1 2.
The scaling functions ϕ (t), in a similar way give rise tofunction spaces V
j, V
j-1, V
j-2, etc., orthogonal complements
respectively of Wj, W
j-1, W
j-2, etc. In these spaces we have
v t a t lj lj
l
j( ) ( )= −∑ ϕ 2 ,
where vj ∈ V
j, and V
j ⊂ V
j+1.
Multiresolution analysis enables to represent a func-tion in different grades of resolution based on a scaling func-tion ϕ (t) and a wavelet ψ(t). Suppose we have a functionv
j+1 (t) generated by the scaling function
v t h t lj l
l
j+
+= −∑112( ) ( )ϕ .
It can be considered as a fine resolution representationof v
j(t). In general a function can be represented as a combi-
nation of an average or coarse scale function vj(t) plus a de-
tail function vj(t)
v t v t w tj j j( ) ( ) ( )= +− −1 1 .
In a recursive way we have
v t v t w t w tj j j j( ) ( ) ( ) ( )= + +− − −1 1 2
and so on. The mechanism to practically calculate the coef-ficients is the fast wavelet transform. These relations are basedon the dilation equation
Table A1
Example of wavelets
Name Formula
Haar (defined in time) ψ( )
, / ,
, / ,
,
t
t
t=
≤ <
− ≤ <
⎧
⎨⎪
⎩⎪
1 0 1 2
1 1 2 1
0 otherwise.
Mexican hat (defined in time) ψ π( ) ( )/ /t t e t= −− −23
11 4 2 22
Morlet (defined in frequency) ψ π ϖ ω( ) ( )/ //
t e e ei t i t= −− − − −1 4 20 02 2 2

365
Multiresolution analysis applied to interpretation of seismic reflection data
ϕ ϕ( ) ( )t h t ll
l
= −∑2 2 , A2
and the wavelet equation
ψ ϕ( ) ( )t g t ll
l
= −∑2 2 . A3
Equations A2 and A3 relating the wavelet (scaling func-tion) at two different scales. Multiresolution analysis let usto study a given function at several scales.
Table A2
Coefficients of Daubechies six order lowpass filter
h enin−∑ ω
h0
0.33267055295000825h
10.8068915093110924
h2
0.4598775021184914h
3-0.1350110200102546
h4
-0.0854412738820267h
50.0352262918857095
BIBLIOGRAPHY
BARTOSCH, T. and D. SEIDL, 1999. Spectrogram analysisof selected tremor signals using short-time Fourier trans-form and continuous wavelet transform. Annali diGeofisica, 42, 497-506.
BASU, B. and V. K. GUPTA, 1997. Non-stationary seismicresponse of MDOF systems by wavelet transform. Earth.Engin. Struc. Dyn., 26, 1243-1258.
BEAR, L. K. and G. L. PAVLIS, 1997. Estimation of slow-ness vectors and their uncertainties using multi-waveletseismic array processing. Bull. Seism. Soc. Amer., 87,755-769.
BERGERON, S. Y., A. P. VINCENT, D. A. YUEN, B.TRANCHANT and C. TCHONG, 1999. Viewing seis-mic velocity anomalies with 3-D continuous Gaussianwavelets. Geophys. Res. Lett., 26, 2311-2314.
BERGERON, S. Y., D. A. YUEN and A. P. VINCENT, 2000.Capabilities of 3-D wavelet transforms to detect plume-like structures from seismic tomography. Geophys. Res.Lett., 27, 3433-3436.
BOTELLA, F., J. ROSA-HERRANZ, J. J. GINER, S.MOLINA and J. J. GALIANA-MERINO, 2003. A real-
time earthquake detector with prefiltering by wavelets.Computers and Geosciences 29, 911-919.
BROWN, A. R., 1996. Interpreter’s corner - Seismic at-tributes and their classification. The Leading Edge, 15,10, 1090.
BROWN, A. R., 2001. Understanding seismic attributes.Geophys., 66, 47-48.
CASTAGNA, J. P., S. SHENGJIE and R. W. SIEGFRIED,2002. The use of spectral decomposition as a hydrocar-bon indicator. Gas Tips, 8, 24-27.
CHEN, Q. and S. SIDNEY, 1997. Seismic attribute technol-ogy for reservoir forecasting and monitoring. The Lead-ing Edge, 16, 05, 445,447-448,450,453 456.
CHIAO, L.-Y., C. and B.-Y., KUO, 2001. Multiscale seis-mic tomography. Geophys. J. Int., 145, 517-527.
CHIAO, L.-Y., C. and W.-T. LIANG, 2003, Multiresolutionparameterization for geophysical inverse problems.Geophys., 68, 199-209.
COHEN, J. K. and T. CHEN, 1993. Fundamentals of thewavelet transform for seismic data processing Tech. Rep.CWP-130: Center for Wave Phenomena, ColoradoSchool of Mines.
DAUBECHIES, I., 1992. Ten lectures on wavelets. Soc. forInd. and Appl. Math.
EKSTEDT, F., and M. LINDBERG, 1997. Diagonalizationof homogeneous linear operators in biorthogonal wave-let bases (preprint): ftp://ftp.md.chalmers.se /pub/users/mlind/diag-lettere.ps.gz.
FAQUI, L., M. M. NURUL-KABIR and D. J.VERSCHUUR, 1995. Seismic processing using thewavelet transform and the radon transform. J. SeismicExpl., 4, 375-390.
FEDI, M., L. LENARDUZZI, R. PRIMICERI and T.QUARTA, 2000. Localized denoising filtering using thewavelet transform. Pure Appl. Geophys., 157, 1463-1491.
FEDORENKO, Y. V. and E. S. HUSEBYE, 1999. Firstbreaks - automatic phase pickings of P - and S-onsets inseismic records. Geophys. Res. Lett., 26, 3249-3252.

366
D. E. Rivera-Recillas et al.
GAO, J., X. DONG, W. WANG, Y. LI and C. PAN, 1999.Instantaneous parameters extraction via wavelet trans-form: IEEE Trans. Geosci. Remote Sensing, 37, 2, 867-870.
GENDRON, P., J. EBEL and D. MANOLAKIS, 2000.Rapid joint detection and classification with waveletbases via Bayes theorem. Bull. Seism. Soc. Amer., 90,764-774.
GOUPILLAUD, P., A. GROSSMAN and J. MORLET,1984. Cycle-octave and related transforms in seismicanalysis. Geoexploration, 23, 85-102.
GRUBB, H., and A. WALDEN, 1997. Characterizing seis-mic time series using the discrete wavelet transform.Geophys. Prosp., 45, 2, 183-205.
HART, B. S., 2002. Validating seismic attributes studies:Beyond statistics. The Leading Edge, 21, 10, 1016-1021.
JI, C., D. J. WALD and D. V. HELMBERGER, 2002. Sourcedescription of the 1999 Hector Mine, California, earth-quake, part I: Wavelet domain inversion theory andresolution analysis. Bull. Seism. Soc. Amer., 92, 1192-1207.
JIN, S., G. CAMBOIS and C. VUILLERMOZ, 2000. Shear-wave velocity and density estimation from PS-waveAVO analysis: Application to an OBS dataset from theNorth Sea. Geophysics, 65, 1446-1454.
KINGSBURY, N., 1999. Image processing with complexwavelet, Phil. Trans. R. Soc. Lond. A,
Kingsbury, N.G., 2000. A dual-tree complex wavelet trans-form with improved orthogonality and symmetry prop-erties. In: Proc: IEEE Int. Conf. Image Processing,Vancouver, Canada, September 10-13.
LAWTON, W., 1993. Application of complex valued trans-forms to subband decomposition. IEEE Trans. Sig.Proc., 41, 3566-3568.
LE GONIDEC, Y., D. GIBERT and J.-N. PROUST, 2002.Multiscale analysis of waves reflected by complex in-terfaces: Basic principles and experiments. J. Geophys.Res., B: Solid Earth, 107, ESE-4.
LI, X.-G., M. D. SACCHI and T. J. ULRYCH, 1996. Wavelettransform inversion with prior scale information. Geo-physics, 61, 1379-1385.
LINA, J. M. and M. MAYRAND, 1995. ComplexDaubechies wavelets. Appl. Comp. Harm. Anal., 219-229.
LIU, X. and X.-M, ZHANG, 2002. Wavelet transform andseismic signal analysis. Earthquake, 22, 51-57.
LOU, M. and J. A. RIAL, 1995. Application of the wavelettransform in detecting multiple events of mi-croearthquake seismograms. Geophys. Res. Lett., 22,2199-2202.
LOZADA-ZUMAETA, M. M., 2002. Análisis tiempo-frecuencia aplicado al análisis y procesamiento de datossísmicos de reflexión, Master’s degree thesis, Programade Posgrado en Ciencias de la Tierra, National Univer-sity of Mexico (UNAM), pp. 117.
LOZADA ZUMAETA, M. and G. RONQUILLOJARILLO, 1996. Transformación ondicular aplicada alprocesamiento de datos sísmicos de reflexión:Resúmenes de la Reunión Anual de la Unión GeofísicaMexicana, Puerto Vallarta, Jalisco, México. Geos, 16,No. 4, 249.
LOZADA ZUMAETA, M. and G. RONQUILLOJARILLO, 1997a. Aplicaciones de la transformadaondicular en la determinación de atributos sísmicos ensismología de reflexión: Resúmenes de la ReuniónAnual de la Unión Geofísica Mexicana, Puerto Vallarta,Jalisco, México. Geos, 17, No. 4, 211-212.
LOZADA ZUMAETA, M. and G. RONQUILLOJARILLO, 1997b. Wavelet transform and seismic at-tribute: International Geoscience Conference, Moscow,Expanded Abstracts, A.3.7
LOZADA ZUMAETA, M. and G. RONQUILLOJARILLO, 1997c. Maximización de la relación señal/ruido en el dominio de la trasformada ondicular.Resúmenes de la Reunión Anual de la Unión GeofísicaMexicana, Puerto Vallarta, Jalisco, México, Geos, 17,No. 4, 214-215.
LOZADA ZUMAETA, M. and G. RONQUILLOJARILLO, 1998. Análisis de multiresolución aplicadocomo técnica de filtrado a datos sísmicos de reflexiónpreapilados y apilado, Resúmenes del VIII Simposiumde Geofísica y Exhibición de equipo, AsociaciónMexicana de Geofísicos de Exploración, Veracruz 98,15-20.
LOZADA ZUMAETA, M., G. RONQUILLO JARILLOand J. O. CAMPOS ENRÍQUEZ, 2001. La
367
Multiresolution analysis applied to interpretation of seismic reflection data
transformada ondicular como una herramienta deanálisis de series de tiempo, Resúmenes y Programas,Reunión Anual 2001, Unión Geofísica Mexicana, Geos,21, No. 3, 296.
LOZADA ZUMAETA, M., G. RONQUILLO JARILLO, J.O. CAMPOS ENRÍQUEZ, D. E. RIVERA RECILLASand R. D. ARIZABLO SALAS, 2001. Aplicaciones dela transformada Karhune-Loeve y multiresolución enel dominio tiempo-frecuencia, noviembre, 2001,Resúmenes de la Reunión Anual de la Unión GeofísicaMexicana, Puerto Vallarta, Jalisco, México, Geos, 21,No. 3, 295-296.
LOZADA ZUMAETA, M. and G. RONQUILLO JARILLO,2002, IV International Seminar, Exploration andExplotation of oil and Gas, Lima-Perú, November, 05-08, 2002, pp.13.
LOZADA ZUMAETA, M., R. D. ARIZABALO, G.RONQUILLO JARILLO, J. H. FLORES, J. O. CAM-POS-ENRÍQUEZ and D. E. RIVERA RECILLAS,2003a. Caracterización estática de un medio porosoaplicando la transformada ondicular, noviembre, 2003,Resúmenes de la Reunión Anual de la Unión GeofísicaMexicana, Puerto Vallarta, Jalisco, México, Geos, 23,No. 2, p. 131-132.
LOZADA ZUMAETA, M., G. RONQUILLO JARILLO, J.O. CAMPOS ENRÍQUEZ, D. E. RIVERA RECILLASand R. D. ARIZABALO SALAS, 2003b. Transformadade ondícula discreta ‘a trous’ aplicada a la estimaciónde atributos sísmicos multiescala, noviembre, 2003,Resúmenes de la Reunión Anual de la Unión GeofísicaMexicana, Puerto Vallarta, Jalisco, México, Geos, 23,No. 2, p. 133.
LUI, A. T. Y. and A.-H. NAJMI, 1997. Time-frequency de-composition of signals in a current disruption event.Geophys. Res. Lett., 24, 3157-3160.
PAZOS, A., M. J. GONZÁLEZ and G. ALGUACIL, 2003.Non-linear filter, using the wavelet transform, appliedto seismological records. J. Seismol., 7, 413-429.
REZAI, M. and C. E. VENTURA, 2002. Analysis of strongand weak ground motions recorded at two sites duringLoma Prieta earthquake by wavelet transform. Can. J.Civil Eng., 29, 157-170.
RIDSDILL-SMITH, T. A. and M. C. DENTITH, 1999. Thewavelet transform in aeromagnetic processing.Geophys., 64, 1003-1013.
RIVERA-RECILLAS, D. E., J. O. CAMPOS-ENRÍQUEZ,M. LOZADA-ZUMAETA and G. RONQUILLOJARILLO, 2001. Transformada de Hilbert mediantetransformada ondicular, noviembre, 2001, Resúmenesde la Reunión Anual de la Unión Geofísica Mexicana,Puerto Vallarta, Jalisco, México, Geos, 21, 3, 296.
RIVERA-RECILLAS, D. E., J. O. CAMPOS-ENRÍQUEZ,M. LOZADA-ZUMAETA and G. RONQUILLOJARILLO, 2002. Cálculo de atributos sísmicos mediantela transformada ondicular discreta, noviembre, 2002,Resúmenes de la Reunión Anual de la Unión GeofísicaMexicana, Puerto Vallarta, Jalisco, México, Geos, 22,2., 202.
RIVERA-RECILLAS, D. E., J. O. CAMPOS-ENRÍQUEZ,M. LOZADA-ZUMAETA and G. RONQUILLOJARILLO, 2003a. Aplicaciones del cálculo de atributossísmicos mediante la transformada ondicular discreta,noviembre, 2003, Resúmenes de la Reunión Anual de laUnión Geofísica Mexicana, Puerto Vallarta, Jalisco,México, Geos, 23, 2, 134.
RIVERA-RECILLAS, D. E., M. LOZADA-ZUMAETA, J.O. CAMPOS-ENRÍQUEZ and G. RONQUILLOJARILLO, 2003b. Calculation of seismic attributes withthe discrete wavelet transform, 73th Ann. Inter. Mtg.,Society of Exploration Geophysicists, Expanded Ab-stracts, 2028-2031.
RIVERA-RECILLAS, D., 2005. Atributos sísmicos mediantetransformada ondicular discreta, Ph.D. thesis, NationalUniversity of Mexico, p. 126.
RONQUILLO JARILLO, G. and M. M. LOZADAZUMAETA, 1997. Atributos sísmicos y análisis demultiresolución aplicado a la delimitación de unyacimiento de gas, noviembre, 1997, Resúmenes de laReunión Anual de la Unión Geofísica Mexicana, PuertoVallarta, Jalisco, México, Geos, 17, 4, 209.
RONQUILLO JARILLO, G. and M. LOZADA ZUMAETA,1998. Multiresolución unidimensional y bidimensionalaplicada a un yacimiento de gas, Resúmenes del VIIISimposium de Geofísica y Exhibición de equipo,Asociación Mexicana de Geofísicos de Exploración,Veracruz 98, 5-12.
RONQUILLO JARILLO, G., M. LOZADA ZUMAETA andN. KOUSOUB, 2003. Deteccción directa dehidrocarburos usando nuevos atributos sísmicos en are-nas y carbonatos, noviembre, 2003, Resúmenes de laReunión Anual de la Unión Geofísica Mexicana, PuertoVallarta, Jalisco, México, Geos, 23, 2, 132.
368
D. E. Rivera-Recillas et al.
ROOIJ, M. D. and K. TINGDAHL, 2002. Meta-attributes -the key to multivolume, multiattribute interpretation. TheLeading Edge, 21, 10, 1050-1053.
SELESNICK, I. W., 2001. Hilbert transform pairs of wave-let bases, IEEE Signal Processing Letters, 8, 6, 2001.
SHUEY, R. T., 1985. A simplification of the Zoeppritz-equa-tions. Geophysics, 50, 609-614.
SINGH, A. K. and F. U. DOWLA, 1997. Wavelet transformmethods for phase identification in three-component seis-mograms: Bulletin - Seismological Society of America,Multiresolution analysis applied to interpretation of seis-mic reflection data.
____________
David E. Rivera-Recillas1,2, D.E., Lozada-Zumaeta1,2, M. M., Ronquillo-Jarillo2, G. and J. O.Campos-Enríquez3,4
1 Posgrado en Ciencias de la Tierra, UNAM, Deleg.Coyoacán, 04510 México, D.F., México.Email: [email protected] Instituto Mexicano del Petróleo, Eje Central LázaroCárdenas 152; 07730 México, D. F., México.3 Instituto de Geofísica, UNAM; Deleg. Coyoacán; 04510México, D. F., México.4 ESIA-Ciencias de la Tierra, Instituto Politécnico Nacional,Ticomán 600, San José Ticomán, 07340 México, D. F.,México.