multipurpose testware user information and software reference
TRANSCRIPT

Model 793.10 MultiPurpose TestWare® l
100-068-915 E
User Information and
Software Reference

Copyright information © 2003 MTS Systems Corporation. All rights reserved.
Trademark information MicroConsole, MTS, RPC, Temposonics, and TestWare are registered trademarks of MTS Systems Corporation.
FlexTest, MPT, Station Builder, Station Manager, and TestStar are trademarks of MTS Systems Corporation.
Adobe is a registered trademark of Adobe Systems Inc.
Acrobat is a trademark of Adobe Systems Inc.
Lotus 1-2-3 is a registered trademark of Lotus Development Corporation.
Microsoft, Windows, and Windows NT are registered trademarks of Microsoft Corporation.
Software verificationand validation
MTS software is developed using established quality practices in accordance with the requirements detailed in the ISO 9001 standards. Because MTS authored software is delivered in binary format, it is not user accessible. This software will not change over time. Many releases are written to be backwards compatible, creating another form of verification.
The status and validity of MTS' operating software is also checked during system verification and routine calibration of MTS hardware. These controlled calibration processes compare the final test results after statistical analysis against the predicted response of the calibration standards. With these established methods, MTS assures its customers that MTS products meet MTS' exacting quality standards when initially installed and will continue to perform as intended over time.
Publication information Manual Part Number Publication Date
100-068-915 A November 2001
100-068-915 B October 2002
100-068-915 C November 2002
100-068-915 D February 2003
100-068-915 E June 2003

Contents
Model 793.10 MultiPurpose TestWare
Contents
Contents 3
Contents
Preface 9
Conventions 10
Technical Support 13
Chapter 1 Introduction 17
Chapter 2 Working with Procedures 21
Common Tasks 22
Creating a Sample Procedure 35
Chapter 3 Working with MPT Specimens 67
About MPT Specimens 68
Creating and Linking MPT Specimens 69
MPT Specimen File Descriptions 73
Specimen.dat 74
User-Specified.dat 76
Specimen.log 77
Specimen.mpp 78
Specimen.mps 79
Specimen.prm 80
Loading MPT Specimens 81
About the Load Specimen Window 82
MPT Specimen Loading Examples 85

Model 793.10 MultiPurpose TestWare
ContentsCo
nten
ts
Contents4
Chapter 4 Working with Processes 97
About MPT Processes 98
Adding Processes to the Procedure Table 99
Selecting Processes in Procedure Tables 101
Deleting a Process from the Procedure Window 102
Cutting, Copying, and Pasting Processes 103
Sequencing Processes 104
Sequencing Group Processes 116
Disabling Processes 122

Contents
Model 793.10 MultiPurpose TestWare
Contents
Contents 5
Chapter 5 Windows and Controls 123
Initial MPT Display 125
MPT Control Panel 126
MPT Control Panel Toolbar 127
Test Progress Panel 129
Specimen Panel 130
Power Panel 132
Channel Counters Panel 133
Sequence Counters Panel 134
Process Specific Panels 135
Run/Stop/Hold Panel 136
MPT Procedure Editor 137
MPT Procedure Editor Menu 138
MPT Procedure Editor Toolbar 146
Procedure Table 148
Other Windows and Control Descriptions 150
Open Procedure 151
Save Procedure As 152
Print Procedure to File 153
Process Palette 154
MPT Specimen Log 155
MPT Specimen Editor 159
Unit Assignment Set Editor 162
MPT Options Editor 165
About MPT 193
Model 793.10 MultiPurpose TestWare
ContentsCo
nten
ts
Contents6
Chapter 6 Process Descriptions 195
About MPT Processes 197
Command Processes 198
Segment Command 200
Cyclic Command 205
Dwell Command 216
Profile Command 219
External Command 228
Profile with ALC 236
Cyclic with ALC 242
Time History Output 245
Road Surface Output 257
Data Acquisition Processes 263
Peak/Valley Acquisition 265
Timed Acquisition 277
Max/Min Acquisition 281
Level Crossing Acquisition 286
High Speed Timed Acquisition 290
Cyclic Acquisition 295
Fatigue 303
Time History Input 316
Trend 321
Event Processes 331
Data Limit Detector 332
Digital Input Detector 340
Operator Event 348
Peak/Valley Change Detector 354
Program Event 364
Periodic Time Event 367
Failure Detector 373
External Control Processes 378
Digital Output 379
Temperature Control 384
Other Processes 390
Contents
Model 793.10 MultiPurpose TestWare
Contents
Contents 7
Program Control 391
Group 396
Operator Information 398
Start Application 406
Data Display 411
Working with the Data Display Process 427
Fatigue Monitoring Application 431
Trend Monitoring Application 440
Appendix A Default Templates 449
Customizing a Default Template 450
Using Multiple Default Templates 451
Template Error Messages 452
Appendix B Excel File Converter 455
Appendix C Profiles 459
About Profiles 460
Creating Profiles 462
General Profile Syntax Requirements 463
Block-Arbitrary Profile Example 471
Phase Profile Example 473
About Cycle and Segment Behavior 475
About Transitions 477
Working with Dimensions 480

Model 793.10 MultiPurpose TestWare
ContentsCo
nten
ts
Contents8
Appendix D MPT Shortcuts 483
About the Shortcut Command Line 484
Creating an MPT Shortcut 487
Editing the Shortcut Command Line 488
Index 489
Preface
Preface 9
Preface
Safety first! Before you attempt to use your MTS equipment in your test system, read and understand the Safety manual. Like an automobile, your test system is very useful—but if misused, it is capable of deadly force. You should not be afraid of your test system, but you should always maintain a healthy respect for it.
Improper installation, operation, or maintenance of MTS equipment in your test system can result in hazardous conditions that can cause severe personal injury or death, and damage to your equipment and specimen. Again, read and understand the Safety manual before you continue. It is very important that you remain aware of hazards that apply to your test system.
Other MTS manuals In addition to this manual, you may receive additional MTS manuals in paper or electronic form.
If you have purchased a test system, it may include an MTS System Documentation CD. This CD contains an electronic copy of all of the MTS manuals that pertain to your test system, including controller manuals, hydraulic and mechanical component manuals, assembly drawings and parts lists, and operation and preventive maintenance manuals.
Contents Conventions 10
Technical Support 13
ConventionsPr
efac
e
Preface10
Conventions
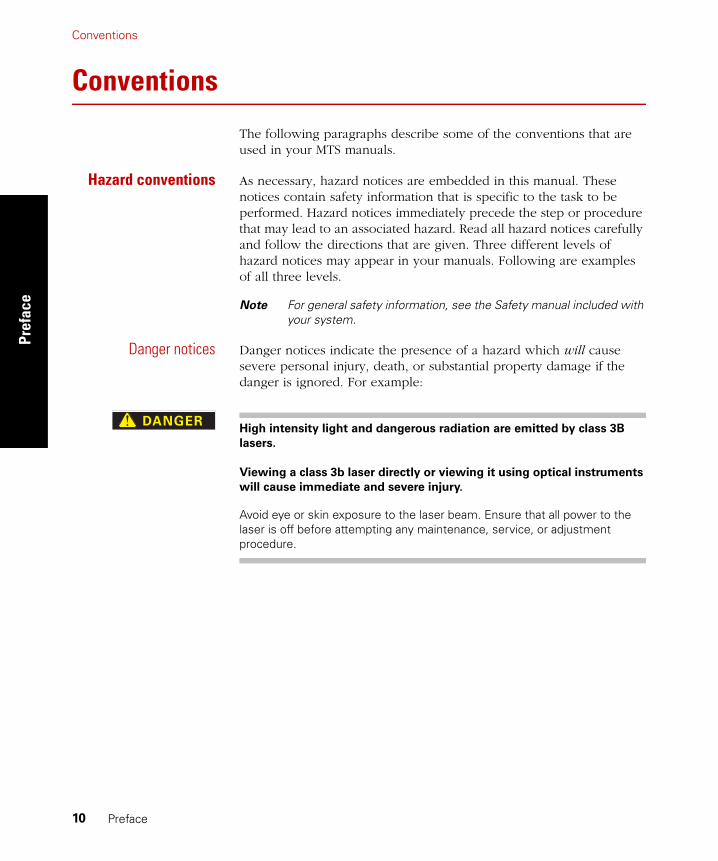
The following paragraphs describe some of the conventions that are used in your MTS manuals.
Hazard conventions As necessary, hazard notices are embedded in this manual. These notices contain safety information that is specific to the task to be performed. Hazard notices immediately precede the step or procedure that may lead to an associated hazard. Read all hazard notices carefully and follow the directions that are given. Three different levels of hazard notices may appear in your manuals. Following are examples of all three levels.
Note For general safety information, see the Safety manual included with your system.
Danger notices Danger notices indicate the presence of a hazard which will cause severe personal injury, death, or substantial property damage if the danger is ignored. For example:
High intensity light and dangerous radiation are emitted by class 3B
lasers.
Viewing a class 3b laser directly or viewing it using optical instruments
will cause immediate and severe injury.
Avoid eye or skin exposure to the laser beam. Ensure that all power to the laser is off before attempting any maintenance, service, or adjustment procedure.
������
ConventionsPreface
Preface 11
Warning notices Warning notices indicate the presence of a hazard which can cause severe personal injury, death, or substantial property damage if the warning is ignored. For example:
Hazardous fumes can accumulate in the test chamber.
Breathing hazardous fumes can cause nausea, fainting, or death.
Ensure the chamber is properly ventilated before you open the chamber door or put your head or hands into the chamber. To do this, ensure the temperature controller is off and allow sufficient time for the ventilation system to completely exchange the atmosphere within the chamber.
Caution notices Caution notices indicate the presence of a hazard which will or can cause minor personal injury, cause minor equipment damage, or endanger test integrity if the caution is ignored. For example:
This specimen can develop sharp edges as a result of testing.
Handling the specimen with unprotected hands can result in cuts and
slivers.
Always wear protective gloves when you handle the specimen.
Other conventions Other conventions used in your manuals are described below:
Notes Notes provide additional information about operating your system or highlight easily overlooked items. For example:
Note Resources that are put back on the hardware lists show up at the end of the list.
Special terms The first occurrence of special terms is shown in italics.
Illustrations Illustrations appear in this manual to clarify text. It is important for you to be aware that these illustrations are examples only and do not necessarily represent your actual system configuration, test application, or software.
�������
�����
ConventionsPr
efac
e
Preface12
Electronic manualconventions
This manual is available as an electronic document in the Portable Document File (PDF) format. It can be viewed on any computer that has Adobe Acrobat Reader installed.
Hypertext links The electronic document has many hypertext links displayed in a blue font. All blue words in the body text, along with all contents entries and index page numbers are hypertext links. When you click a hypertext link, the application jumps to the corresponding topic.
Technical SupportPreface
Preface 13
Technical Support
Start with yourmanuals
The manuals supplied by MTS provide most of the information you will need to use and maintain your equipment. If your equipment includes MTS software, look for README files that contain additional product information.
If you cannot find answers to your technical questions from these sources, you can use the internet, telephone, or fax to contact MTS for assistance. You can also fill out the Problem Submittal Form that is available on the MTS web site and in the back of many MTS manuals that are distributed in paper form.
Technical supportnumbers
MTS provides a full range of support services after your system is installed. If you have any questions about a system or product, contact MTS in one of the following ways.
MTS web sitewww.mts.com
The MTS web site gives you access to our technical support staff by means of a Problem Submittal Form and a Technical Support link.
• Problem Submittal Form: www.mts.com > Contact MTS > Problem Submittal Form
• Technical Support: www.mts.com > Contact MTS > Technical Support
E-mail: [email protected]
Telephone HELPLine 800-328-2255Weekdays 7:00 A.M. to 6:00 P.M.,Central Time
Fax 952-937-4515Please include an MTS contact name if possible.
Before youcontact MTS
MTS can help you more efficiently if you have the following information available when you contact us for support.
Know your site numberand system number
The site number contains your company number and identifies your equipment type (material testing, simulation, and so forth). The number is usually written on a label on your MTS equipment before the system leaves MTS. If you do not have or do not know your MTS site number, contact your MTS sales engineer.
Example site number: 571167
Technical SupportPr
efac
e
Preface14
When you have more than one MTS system, the system number identifies which system you are calling about. You can find your job number in the papers sent to you when you ordered your system.
Example system number: US1.42460
Know information fromprior technical
assistance
If you have contacted MTS about this problem before, we can recall your file. You will need to tell us the:
• MTS notification number
• Name of the person who helped you
Identify the problem Describe the problem you are experiencing and know the answers to the following questions.
• How long has the problem been occurring?
• Can you reproduce the problem?
• Were any hardware or software changes made to the system before the problem started?
• What are the model and serial numbers of the suspect equipment?
Know relevant computerinformation
If you are experiencing a computer problem, have the following information available.
• Manufacturer’s name and model number
• Operating software type and service patch information. Examples:
– Windows XP Service Pack 1 (SP1)
– Windows 2000 Service Pack 3 (SP3)
– Windows NT 4.0 Service Pack 7 (SP7)
• Amount of system memory. Example: 640 MB of RAM.
• Amount of free space on the hard drive in which the application resides. Example: 11.2 GB free space, or 72% free space.
• Current status of hard-drive fragmentation. Example: 3% total fragmentation.
Technical SupportPreface
Preface 15
Know relevant softwareinformation
For MTS software application problems, have the following information available.
• The software application’s name, version number, build number, and if available, software patch number. This information is displayed briefly when you launch the application, and can typically be found in the “About” selection in the “Help” menu.
Example: Station Manager, Version 3.3A, Build 1190, Patch 4
• The same information for other MTS software included with your system
• Names of other non-MTS applications that are running on your computer, such as screen savers, keyboard enhancers, print spoolers, and so forth
If you contact MTSby phone
Your call will be registered by a HELPLine agent if you are calling within the United States or Canada. Before connecting you with a technical support specialist, your agent will ask you for your site number, name, company, company address, and the phone number where you can normally be reached.
Identify system type To assist your HELPLine agent with connecting you to the most qualified technical support specialist available, identify your system as one of the following types:
• Electromechanical materials test system
• Hydromechanical materials test system
• Vehicles test system
• Vehicles component test system
• Aero test system
Be prepared totroubleshoot
Prepare yourself for troubleshooting while on the phone.
• Call from a telephone close to the system so that you can try implementing suggestions made over the phone.
• Have the original operating and application software media available.
• If you are not familiar with all aspects of the equipment operation, have an experienced user nearby to assist you.
Technical SupportPr
efac
e
Preface16
Write down relevantinformation
Prepare yourself in case we need to call you back.
• Remember to ask for the notification number.
• Record the name of the person who helped you.
• Write down any specific instructions to be followed, such as data recording or performance monitoring.
After you call MTS logs and tracks all calls to ensure that you receive assistance and that action is taken regarding your problem or request. If you have questions about the status of your problem or have additional information to report, please contact MTS again.
Problem SubmittalForm in MTS manuals
In addition to the Problem Submittal Form on the MTS web site, there is also a paper version of this form (postage paid) in the back of many MTS manuals. Use this form to communicate problems you are experiencing with your MTS software, hardware, manuals, or service. This form includes check boxes that allow you to indicate the urgency of our problem and your expectation of an acceptable response time. We guarantee a timely response—your feedback is important to us.
Model 793.10 MultiPurpose TestWare
Introduction
Introduction 17
Chapter 1
Introduction
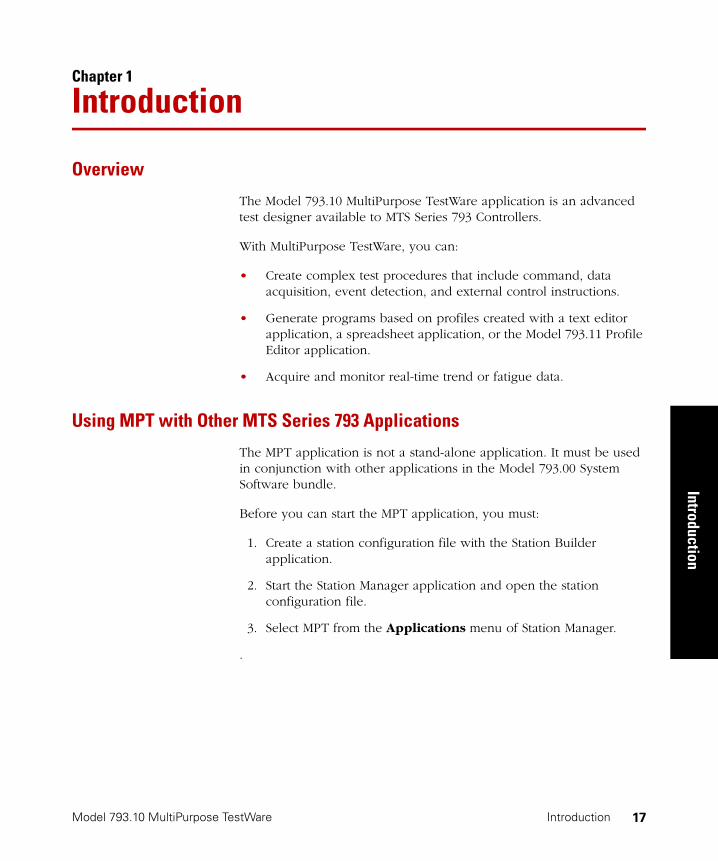
Overview
The Model 793.10 MultiPurpose TestWare application is an advanced test designer available to MTS Series 793 Controllers.
With MultiPurpose TestWare, you can:
• Create complex test procedures that include command, data acquisition, event detection, and external control instructions.
• Generate programs based on profiles created with a text editor application, a spreadsheet application, or the Model 793.11 Profile Editor application.
• Acquire and monitor real-time trend or fatigue data.
Using MPT with Other MTS Series 793 Applications
The MPT application is not a stand-alone application. It must be used in conjunction with other applications in the Model 793.00 System Software bundle.
Before you can start the MPT application, you must:
1. Create a station configuration file with the Station Builder application.
2. Start the Station Manager application and open the station configuration file.
3. Select MPT from the Applications menu of Station Manager.
.

Model 793.10 MultiPurpose TestWare
Intr
oduc
tion
Introduction18
User Interface
MPT control panel The MPT control panel appears in the application area of Station Manager, as shown.
MPT application button
When you’ve launchedMPT this button will ap-pear in the applicationscontrol panel. You canquickly select among
launched applications withthe buttons in this panel.
Channel Counters
Channel Counters displaythe cumulative count of
segments applied tospecific channels.
MPT toolbar
Sequence Counters
Sequence counters displaycurrent and target countsfor processes. Individual
process counters arearranged according to the
process icons on theProcedure Editor. Group
process counters areindented to show nesting.
MPT Procedure Editor button
Displays the Procedure Editor andProcess Palette, as shown on thenext page.
Station Controls
You execute MPT procedureswith the run, stop, and holdcontrols.

Model 793.10 MultiPurpose TestWare
Introduction
Introduction 19
Procedure Editor andProcess Palette
The Procedure Editor contains a table on which you build MPT test procedures by selecting, assigning parameters to, and sequencing individual test processes. Test processes represent individual test activities. The processes available are displayed on the Process Palette.
Status and progress indicators
for processes
A blue arrow pointing toward aprocess (not shown) indicates it
is executing. This lets you watchthe test’s progress.
A red “X” next to a processindicates it has been disabled.
A green arrow pointingdownward next to a process
indicates it will start and thenissue its done signal
immediately, without performingits programmed activity.
Process Palette
Individual processes are arranged onthe palette by type.
You can double-click a process onthe Process Palette to copy an
instance of it to the table on theProcedure Editor, or you can use
the drag-and-drop method.
Procedure Editor
The Procedure Editor contains atable on which you build MPT test
procedures.

Model 793.10 MultiPurpose TestWare
Intr
oduc
tion
Introduction20
MPT Test Procedures
An MPT test procedure, or procedure for short, contains two types of information:
• Process information, which defines your processes (command, data acquisition, signal monitoring, and so forth) and the sequence in which each process executes.
• MPT application information, which includes test unit and dimension assignments, the behavior of hold and resume functions, the data file format, and so on.
Creating procedures You create procedures by linking together processes that represent individual test activities, such as ramping the actuator or acquiring peak/valley data.
For information on how to create a procedure, see “Creating a Sample Procedure” on page 35. For information about the various MPT processes, see “Process Descriptions” on page 195.
Running procedures You run your procedures with the run, stop, and hold controls on the Station Controls panel. For more information about how to run procedures, see “How to Run a Procedure” on page 25.

Model 793.10 MultiPurpose TestWare
Working w
ith ProceduresWorking with Procedures 21
Chapter 2
Working with Procedures
Common Tasks 22
How to Open a Procedure 23
How to Save a Procedure 23
How to Preview a Procedure 24
How to Print a Procedure 24
How to Run a Procedure 25
Working with Counters 27
Displaying Counters and Status Panels 30
Using the Clear Counters on Reset Function 32
Creating a Sample Procedure 35
Plan Your Test 36
Determine Which Processes are Needed 39
Add Processes to the Procedure Table 45
Sequence Your Processes 48
Set Process Parameters in the Procedure Table 53
Set Process Parameters in the Group Table 59
Select Procedure Options 64
Model 793.10 MultiPurpose TestWare
Common TasksW
orki
ng w
ith P
roce
dure
s
Working with Procedures22
Common Tasks
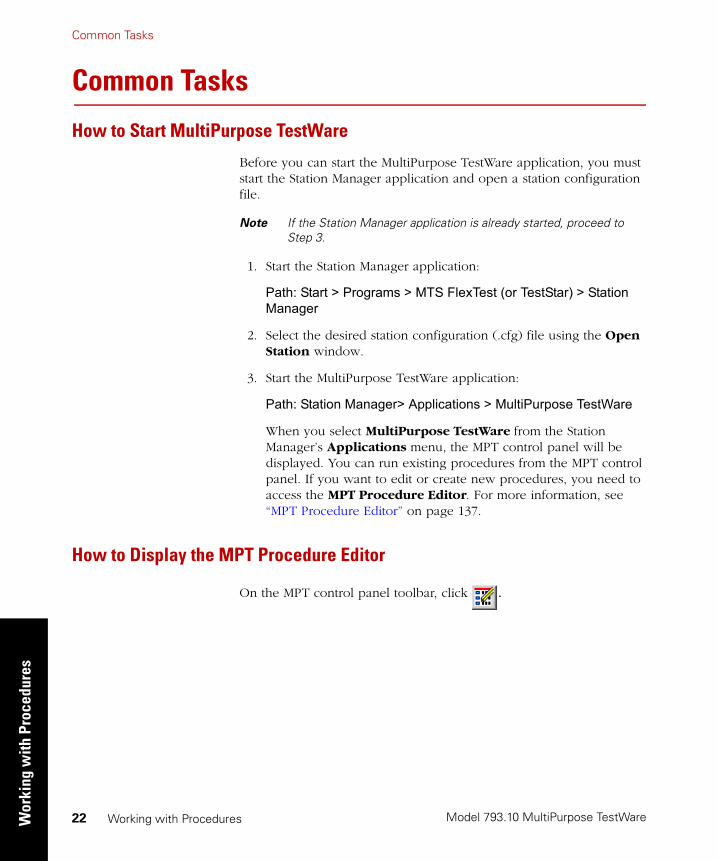
How to Start MultiPurpose TestWare
Before you can start the MultiPurpose TestWare application, you must start the Station Manager application and open a station configuration file.
Note If the Station Manager application is already started, proceed to Step 3.
1. Start the Station Manager application:
Path: Start > Programs > MTS FlexTest (or TestStar) > Station Manager
2. Select the desired station configuration (.cfg) file using the Open Station window.
3. Start the MultiPurpose TestWare application:
Path: Station Manager> Applications > MultiPurpose TestWare
When you select MultiPurpose TestWare from the Station Manager’s Applications menu, the MPT control panel will be displayed. You can run existing procedures from the MPT control panel. If you want to edit or create new procedures, you need to access the MPT Procedure Editor. For more information, see “MPT Procedure Editor” on page 137.
How to Display the MPT Procedure Editor
On the MPT control panel toolbar, click .
Common Tasks
Model 793.10 MultiPurpose TestWare
Working w
ith ProceduresWorking with Procedures 23
How to Create a New Procedure
When you start MPT a new (undefined) procedure is automatically created. To create a new procedure any time MPT is active, from the MPT Procedure Editor, select the File menu, then click New Procedure.
Note If you would like to review a sample test design, see “Creating a Sample Procedure” on page 35.
How to Open a Procedure
1. From the MPT control panel (or from the MPT Procedure Editor), click the Open Procedure icon. Alternately, from the MPT Procedure Editor, click the File menu, then click Open Procedure to display the Open Procedure window.
2. Double-click the desired procedure, or click on the desired procedure once, then click the Open button.
How to Save a Procedure
From the MPT Procedure Editor, click the Save Procedure icon, or click the File menu and select the desired save option.
Alternately, from the MPT control panel, on the toolbar, click the file icon’s pull down menu, then select the desired save option.
Note MultiPurpose TestWare automatically appends “.000” to the file name you enter. If you do not want to include the .000 extension, type a period (.) at the end of your file name.
Model 793.10 MultiPurpose TestWare
Common TasksW
orki
ng w
ith P
roce
dure
s
Working with Procedures24
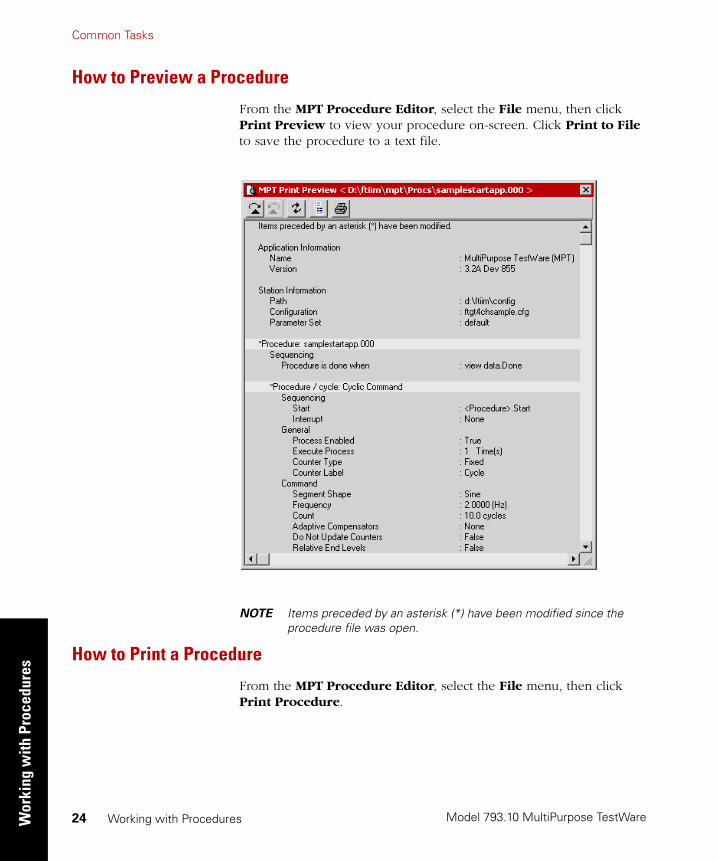
How to Preview a Procedure
From the MPT Procedure Editor, select the File menu, then click Print Preview to view your procedure on-screen. Click Print to File to save the procedure to a text file.
NOTE Items preceded by an asterisk (*) have been modified since the procedure file was open.
How to Print a Procedure
From the MPT Procedure Editor, select the File menu, then click Print Procedure.
Common Tasks
Model 793.10 MultiPurpose TestWare
Working w
ith ProceduresWorking with Procedures 25
How to Run a Procedure
Running a procedure begins with station preparation and physical specimen installation, both tasks that you accomplish with the Station Manager application.
The following steps assume you have already done the following:
• Created a configuration file with Station Builder, and tuned control channels and calibrated sensor/conditioner pairs
• Opened Station Manager and selected the configuration file
• Applied hydraulic pressure to the station
• Installed the physical specimen into the test fixturing
• Set station limits
• Set up readout devices to monitor station signals
• Opened MultiPurpose TestWare
• Selected a procedure
Model 793.10 MultiPurpose TestWare
Common TasksW
orki
ng w
ith P
roce
dure
s
Working with Procedures26
1. Create or select an MPT specimen
Before you can run a procedure, you have to either create a new or select an existing MPT specimen for the test.
The term “MPT specimen” refers to a directory of information associated with a specific execution of a procedure—not the physical specimen being tested.
Your test data, as well as the procedure you ran, messages generated during the test, recovery information, etc., will be located in the MPT specimen you create for this test.
A. To create a new MPT specimen:
On the MPT control panel toolbar, click and a new MPT specimen labeled specXX (“spec01,” “spec02,” etc.) appears in the list box. Rename the new MPT specimen as desired.
B. To select an existing MPT specimen:
On the MPT control panel toolbar, select an existing MPT specimen from the Specimen list box.
2. Start your test.
On the Station Controls panel click the run button to start the test. Look at and listen to your test station after you start the test. If everything seems normal, you can let your test run to completion.
Note After the completion of a test you have to press the reset button or create a new MPT specimen to run subsequent tests.
Common Tasks
Model 793.10 MultiPurpose TestWare
Working w
ith ProceduresWorking with Procedures 27
Working with Counters
When you create a procedure with MPT, you define the parameters of each process in the procedure, including counter parameters.
In procedures, counters are linear tools used to indicate test progress and facilitate recovery. It is important to understand counters and to realize that how you define a counter can affect your test outcome and, as a result, the data that is generated from the test.
Note Counters are not the only tools provided by the MPT application to indicate test progress. The MPT Procedure Editor displays special symbols when individual processes are active. Refer to “Procedure Table” on page 148 for more information about process indicators.
About counters The various types of counters available for procedures are displayed on the MPT control panel, provided the MPT control panel has been configured to display them.
The following paragraphs provide additional information about how you control whether they appear on the MPT control panel, and what effect they have on your test and your test data. Refer to “MPT Control Panel” on page 126 for more information.
Types of counters The most prominent counters on the MPT control panel are the Run Time counter, the Channel Counters, and the Sequence Counters.
There are also specialized counters that display only in association with specific types of processes, such as:
• Profile counters, which display only with the Profile Command and Profile with ALC processes
• Status counters, which display only with the Time History Input, Time History Output, and Road Surface Output processes
Refer to “MPT Control Panel” on page 126 for more information about the Run Time display and the Channel Counters and Sequence Counters panels.
Model 793.10 MultiPurpose TestWare
Common TasksW
orki
ng w
ith P
roce
dure
s
Working with Procedures28
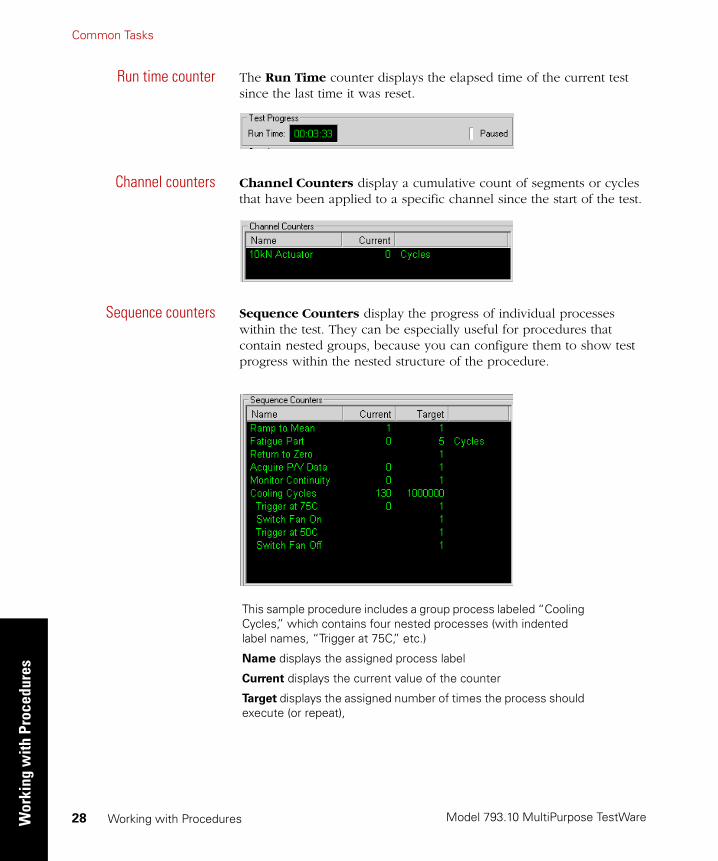
Run time counter The Run Time counter displays the elapsed time of the current test since the last time it was reset.
Channel counters Channel Counters display a cumulative count of segments or cycles that have been applied to a specific channel since the start of the test.
Sequence counters Sequence Counters display the progress of individual processes within the test. They can be especially useful for procedures that contain nested groups, because you can configure them to show test progress within the nested structure of the procedure.
This sample procedure includes a group process labeled “Cooling Cycles,” which contains four nested processes (with indented label names, “Trigger at 75C,” etc.)
Name displays the assigned process label
Current displays the current value of the counter
Target displays the assigned number of times the process should execute (or repeat),

Common Tasks
Model 793.10 MultiPurpose TestWare
Working w
ith ProceduresWorking with Procedures 29
Profile counters (Profileand Profile with ALC
processes only)
Profile Counters display counters that increment according to special markers that profile designers put in profiles.
Status counters (TimeHistory Output, Time
History Input, and RoadSurface processes only)
Status counters display Elapsed Time (or Distance) and Total Time (or Total Distance) counters, and a Percent Completed status bar.
Elapsed Time displays the time since the process started. Distance
displays the distance traveled since the process started, which is calculated from the Vehicle Speed entry on the process’ Status tab.
Total Time displays the anticipated total time required to complete the process (this does not include any other processes that may be part of the test). Total Distance displays the anticipated total distance required to complete the process, calculated from the Vehicle Speed entry on the process’ Status tab.
The Percent Completed status bar displays the percentage relationship of the elapsed time (or distance) versus the total time (or distance) for the process (the status bar updates according to the update rate of the test, typically every 10 seconds or so).
Model 793.10 MultiPurpose TestWare
Common TasksW
orki
ng w
ith P
roce
dure
s
Working with Procedures30
Displaying Counters and Status Panels
You can choose to show or hide the various types of counters and status panels on the MPT control panel when running tests.
Note The Run Time Counter, Channel Counters, and Sequence Counters display by default. For information about changing default settings, see “Default Templates” on page 449.
How to display Channeland Sequence Counters
To display Channel Counters and Sequence Counters, open the MPT Options Editor, select the Control Panel tab, and locate the Counters panel. Check the boxes as desired to show or hide the counters and to choose their display format. By default these counters are displayed.
To display the Run Time counter, open the MPT Options Editor, select the Control Panel tab, and locate the Test Progress panel. Check the box as desired to show or hide the Run Time counter.
How to display Statuspanels
To display Status panels, open the relevant process on the procedure table (Time History Input, Time History Output, and Road Surface Output) and select the Status tab. Check the Show Status Panel at Run Time box as desired. By default status panels are not displayed.
Note If you enable the Show Status Panel at Run Time box, you will have the option of having the status panel display the distance traveled by the vehicle, for which you enter a nominal vehicle speed for the distance calculations.
How to display ProfileCounters
To display profile counters, you must include a Profile Command or Profile with ALC process in your procedure that uses a profile that includes the keyword “Action.” For more information, see “Action and Counter Syntax” on page 465.

Common Tasks
Model 793.10 MultiPurpose TestWare
Working w
ith ProceduresWorking with Procedures 31
How to displayindividual processes onthe Sequence Counters
panel
The Sequence Counters panel displays by default, but each counter that populates the Sequence Counters panel must be enabled for display individually. To do this you must open each process on the procedure table to display its Parameters window, select the General tab, then select the desired Counter Type option.
The Counter Type options are:
None—The counter label and counter are not displayed on the Sequence
Counters panel.
Transient—The counter label and counter are only displayed on the Sequence Counters panel when the process is active. When the process ends, transient counters disappear.
Fixed—The counter label and counter are displayed on the Sequence
Counters panel for the duration of the test.
Model 793.10 MultiPurpose TestWare
Common TasksW
orki
ng w
ith P
roce
dure
s
Working with Procedures32
Using the Clear Counters on Reset Function
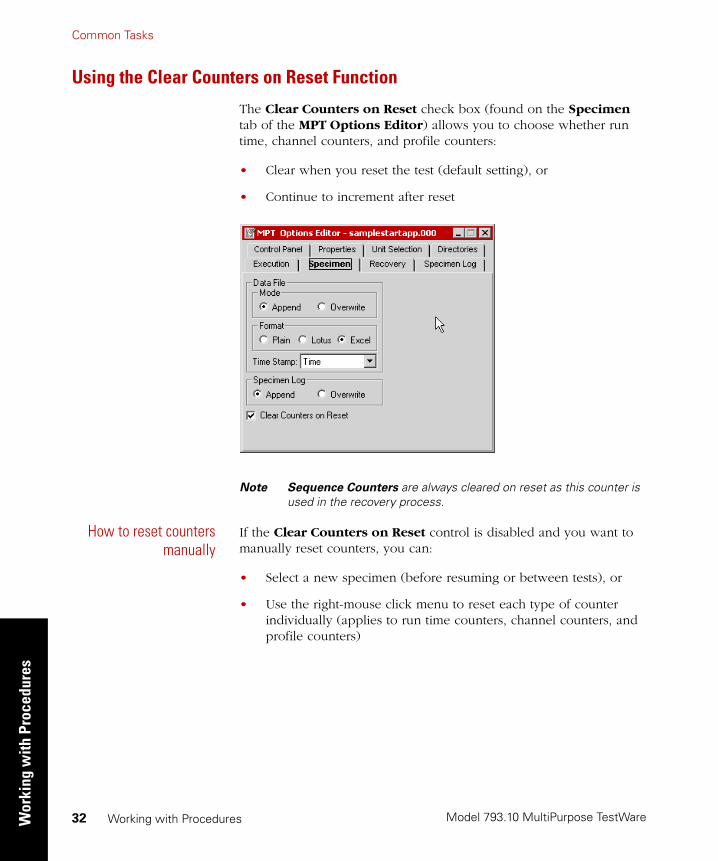
The Clear Counters on Reset check box (found on the Specimen tab of the MPT Options Editor) allows you to choose whether run time, channel counters, and profile counters:
• Clear when you reset the test (default setting), or
• Continue to increment after reset
Note Sequence Counters are always cleared on reset as this counter is used in the recovery process.
How to reset countersmanually
If the Clear Counters on Reset control is disabled and you want to manually reset counters, you can:
• Select a new specimen (before resuming or between tests), or
• Use the right-mouse click menu to reset each type of counter individually (applies to run time counters, channel counters, and profile counters)
Common Tasks
Model 793.10 MultiPurpose TestWare
Working w
ith ProceduresWorking with Procedures 33
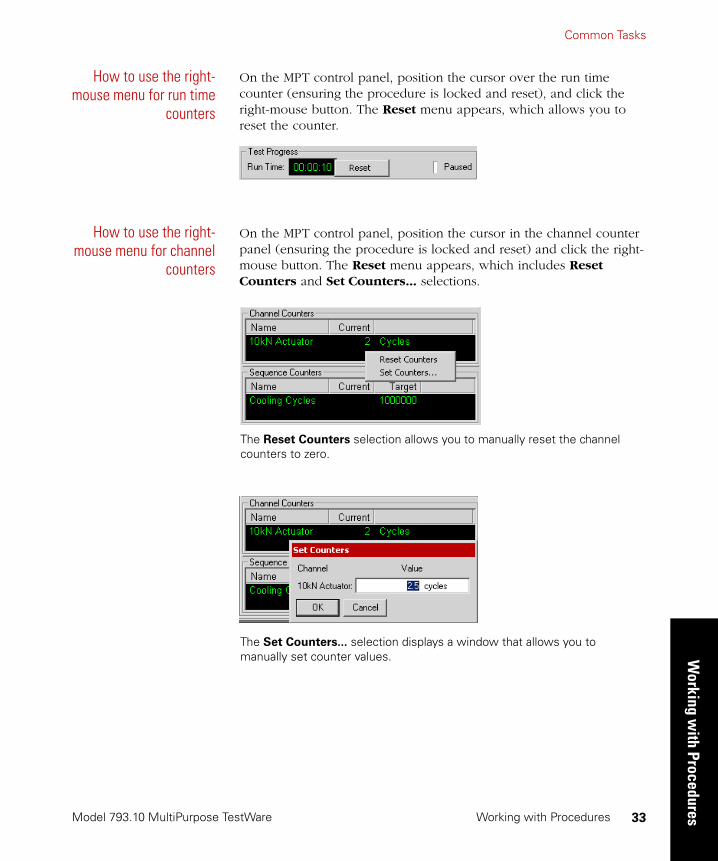
How to use the right-mouse menu for run time
counters
On the MPT control panel, position the cursor over the run time counter (ensuring the procedure is locked and reset), and click the right-mouse button. The Reset menu appears, which allows you to reset the counter.
How to use the right-mouse menu for channel
counters
On the MPT control panel, position the cursor in the channel counter panel (ensuring the procedure is locked and reset) and click the right-mouse button. The Reset menu appears, which includes Reset Counters and Set Counters... selections.
The Reset Counters selection allows you to manually reset the channel counters to zero.
The Set Counters... selection displays a window that allows you to manually set counter values.

Model 793.10 MultiPurpose TestWare
Common TasksW
orki
ng w
ith P
roce
dure
s
Working with Procedures34
How to use the right-mouse menu for profile
counters
On the MPT control panel, position the cursor over the profile counter panel at any time the counters are active and click the right-mouse button. The Reset Counters menu appears, which allows you to manually reset the counters to zero.
Note The procedure does not have to be in the reset state to use the Reset Counters button for profile counters. You can reset profile counters on-the-fly, while the test is running.
Creating a Sample Procedure
Model 793.10 MultiPurpose TestWare
Working w
ith ProceduresWorking with Procedures 35
Creating a Sample ProcedureYou create procedures by selecting the processes required to accomplish your test objectives from the Process Palette and placing them on the procedure table. Next you assign parameters and sequence information to each process. This section describes how to create a sample procedure, and will give you a good sense of how all the elements of a procedure fit together.
If you are new to MultiPurpose TestWare it is good practice to set your control software to the simulation mode (using the Demo System Loader) and follow along, using one of the default configuration files included with your system, or one that you have created yourself.
You may not be able to create the sample procedure precisely as shown because your system may be supplied with different hardware resources than used to create the sample test.
Even so, if you follow along and create a less complex version of the sample procedure, or even if you just review the pages without using your software, you will still benefit by learning the fundamentals of creating procedures.
Note The hardware resources and label names provided in this section are for illustration purposes only. Your hardware resources and label names will vary with the .hwi file and station configuration file you use.
The following tasks are described in this section:
Task 1, “Plan Your Test,” on page 36
Task 2, “Determine Which Processes are Needed,” on page 39
Task 3, “Add Processes to the Procedure Table,” on page 45
Task 4, “Sequence Your Processes,” on page 48
Task 5, “Set Process Parameters in the Procedure Table,” on page 53
Task 6, “Set Process Parameters in the Group Table,” on page 59
Task 7, “Select Procedure Options,” on page 64

Model 793.10 MultiPurpose TestWare
Creating a Sample ProcedureW
orki
ng w
ith P
roce
dure
s
Working with Procedures36
Task 1 Plan Your Test
To plan your test, you should:
• Identify test objectives and significant test information.
• Review the test environment.
The following sample test objectives are used throughout this section to show how they affect the selection, triggering, and definition of individual processes in the sample test.
1. Identify the test objectives.
For this sample test, we want to:
A. Ramp to 3000 N in force control.
B. Apply a sinusoidal force input of ±1000 N at 1 Hz, for 100 cycles to fatigue the physical specimen.
C. Return to 0 N in force control.
During the test, we also want to:
A. Acquire peak/valley data while the physical specimen is being fatigued.
B. Activate and deactivate an external fan to keep the physical specimen’s temperature between 50–75ºC.

Creating a Sample Procedure
Model 793.10 MultiPurpose TestWare
Working w
ith ProceduresWorking with Procedures 37
C. Monitor the physical specimen’s internal breakwire for continuity, and stop the test if it severs, or if the detected error level indicates imminent failure of the specimen.
The sample test design as it may be sketched out.
Model 793.10 MultiPurpose TestWare
Creating a Sample ProcedureW
orki
ng w
ith P
roce
dure
s
Working with Procedures38
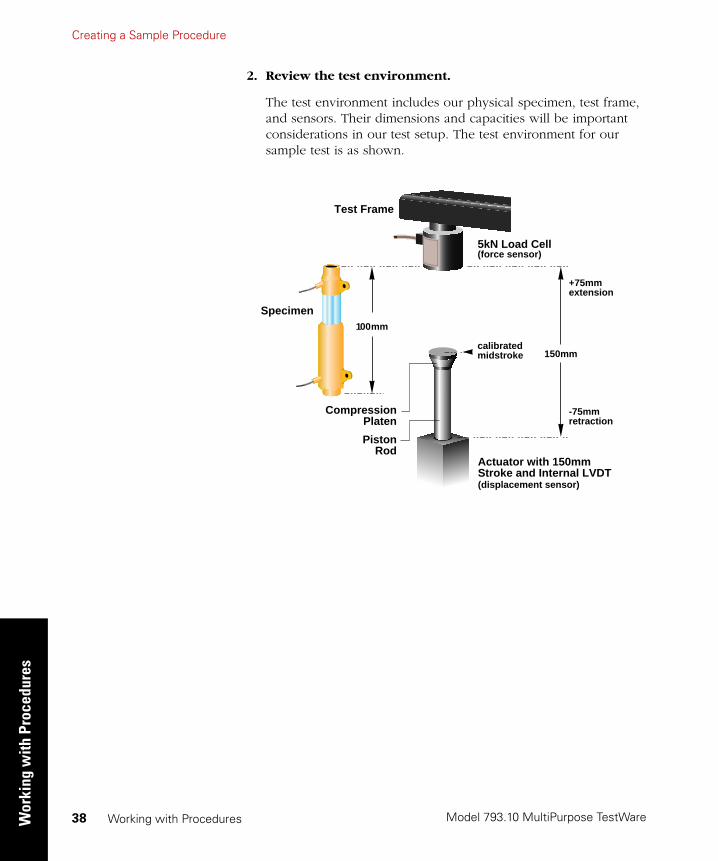
2. Review the test environment.
The test environment includes our physical specimen, test frame, and sensors. Their dimensions and capacities will be important considerations in our test setup. The test environment for our sample test is as shown.
100mm
150mm
+75mmextension
Test Frame
calibrated midstroke
5kN Load Cell(force sensor)
Specimen
-75mmretraction
Actuator with 150mm Stroke and Internal LVDT(displacement sensor)
CompressionPlaten
PistonRod
Creating a Sample Procedure
Model 793.10 MultiPurpose TestWare
Working w
ith ProceduresWorking with Procedures 39
Task 2 Determine Which Processes are Needed
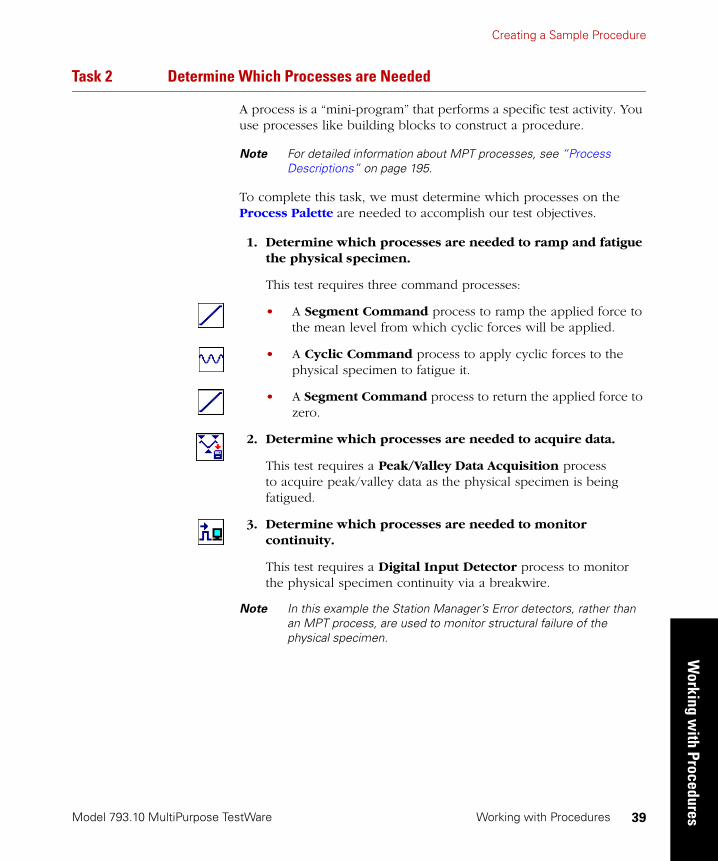
A process is a “mini-program” that performs a specific test activity. You use processes like building blocks to construct a procedure.
Note For detailed information about MPT processes, see “Process Descriptions” on page 195.
To complete this task, we must determine which processes on the Process Palette are needed to accomplish our test objectives.
1. Determine which processes are needed to ramp and fatigue the physical specimen.
This test requires three command processes:
• A Segment Command process to ramp the applied force to the mean level from which cyclic forces will be applied.
• A Cyclic Command process to apply cyclic forces to the physical specimen to fatigue it.
• A Segment Command process to return the applied force to zero.
2. Determine which processes are needed to acquire data.
This test requires a Peak/Valley Data Acquisition process to acquire peak/valley data as the physical specimen is being fatigued.
3. Determine which processes are needed to monitor continuity.
This test requires a Digital Input Detector process to monitor the physical specimen continuity via a breakwire.
Note In this example the Station Manager’s Error detectors, rather than an MPT process, are used to monitor structural failure of the physical specimen.
Model 793.10 MultiPurpose TestWare
Creating a Sample ProcedureW
orki
ng w
ith P
roce
dure
s
Working with Procedures40
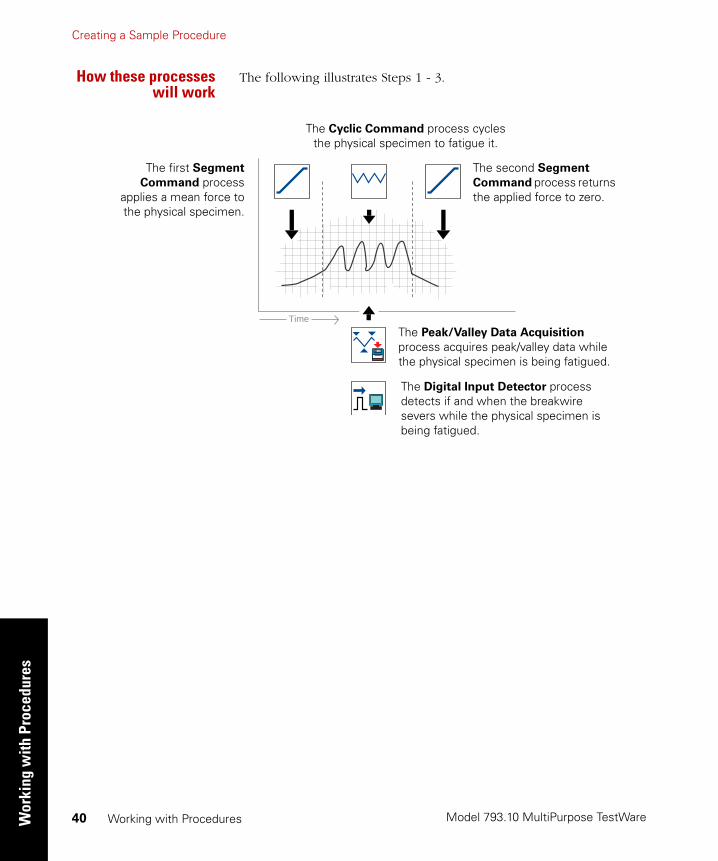
How these processeswill work
The following illustrates Steps 1 - 3.
Time
The first Segment
Command processapplies a mean force tothe physical specimen.
The second Segment Command process returns the applied force to zero.
The Cyclic Command process cycles the physical specimen to fatigue it.
The Peak/Valley Data Acquisition process acquires peak/valley data while the physical specimen is being fatigued.
The Digital Input Detector process detects if and when the breakwire severs while the physical specimen is being fatigued.
Creating a Sample Procedure
Model 793.10 MultiPurpose TestWare
Working w
ith ProceduresWorking with Procedures 41
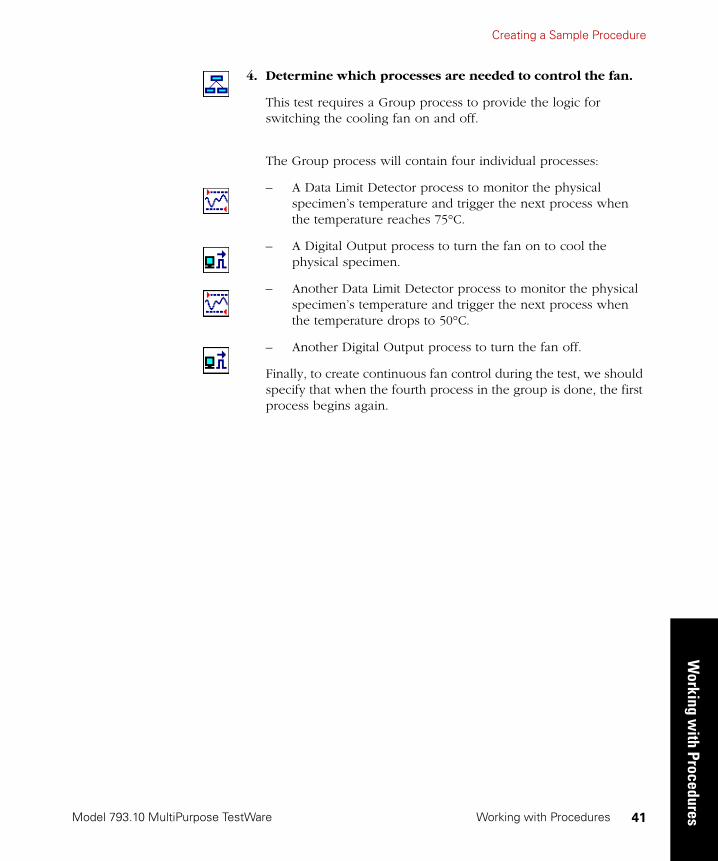
4. Determine which processes are needed to control the fan.
This test requires a Group process to provide the logic for switching the cooling fan on and off.
The Group process will contain four individual processes:
– A Data Limit Detector process to monitor the physical specimen’s temperature and trigger the next process when the temperature reaches 75°C.
– A Digital Output process to turn the fan on to cool the physical specimen.
– Another Data Limit Detector process to monitor the physical specimen’s temperature and trigger the next process when the temperature drops to 50°C.
– Another Digital Output process to turn the fan off.
Finally, to create continuous fan control during the test, we should specify that when the fourth process in the group is done, the first process begins again.
Model 793.10 MultiPurpose TestWare
Creating a Sample ProcedureW
orki
ng w
ith P
roce
dure
s
Working with Procedures42
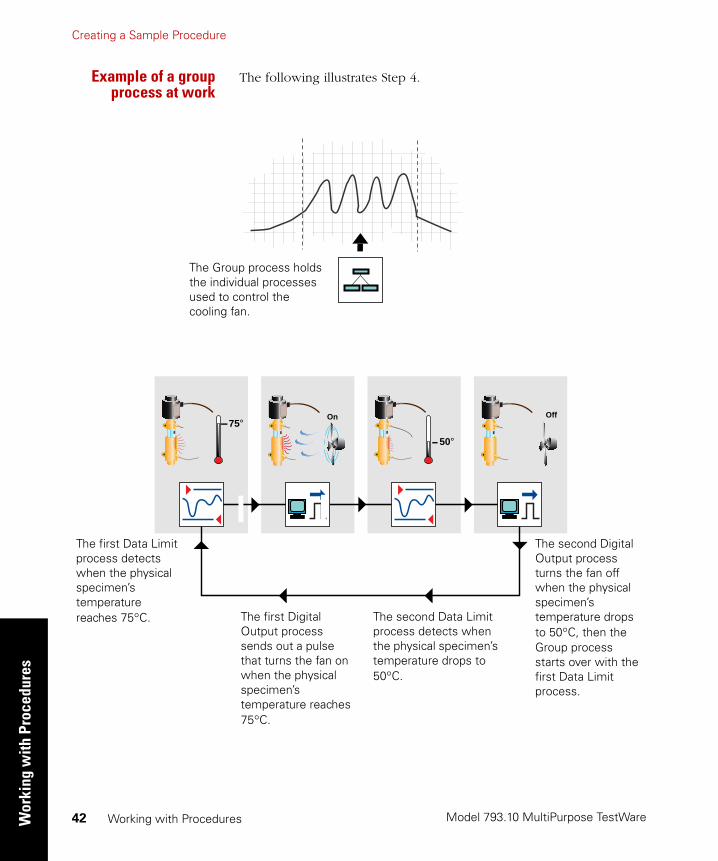
Example of a groupprocess at work
The following illustrates Step 4.
75°
50°
On Off
The first Data Limit process detects when the physical specimen’s temperature reaches 75°C.
The second Digital Output process turns the fan off when the physical specimen’s temperature drops to 50°C, then the Group process starts over with the first Data Limit process.
The Group process holds the individual processes used to control the cooling fan.
The first Digital Output process sends out a pulse that turns the fan on when the physical specimen’s temperature reaches 75°C.
The second Data Limit process detects when the physical specimen’s temperature drops to 50°C.

Creating a Sample Procedure
Model 793.10 MultiPurpose TestWare
Working w
ith ProceduresWorking with Procedures 43
Put it all together All of the processes required to perform the activities in our test sketch are shown below in the process diagram.
Note The process diagram below shows the procedure as a function of time (from left to right), because it is easy to visualize that way. On the MPT Procedure Editor you assign the order in which processes run by assigning start and interrupt triggers to each process. Because of this, the order of the processes on the MPT Procedure
Editor, which are arranged in a single column, may not determine the order in which they run.
=
This diagram illustrates the sample test sketch in terms of MPT processes. This graphic is used in the margins of the following sections to illustrate adding and sequencing processes.
We converted the information in the sample test sketch into the process diagram illustrated to the right.

Model 793.10 MultiPurpose TestWare
Creating a Sample ProcedureW
orki
ng w
ith P
roce
dure
s
Working with Procedures44
Choosing a method tobuild your procedure
Now that you have an understanding of which MPT processes are necessary to accomplish the objectives of the sample test scenario, you need to choose how to build the sample procedure.
Building a procedure involves the following basic activities:
• Adding the necessary processes to the procedure table
• Sequencing the processes with start and interrupt triggers
• Setting the parameters of the individual processes
• Selecting procedure options
MultiPurpose TestWare is versatile—there are many ways to accomplish these basic activities to build the same procedure.
The method used tobuild the sample
procedure
For simplicity, the sample procedure created in the following pages uses this basic activity flow for all of its processes from beginning-to-end before going on to the next activity. For instance, the first basic activity in Task 3 is adding all of the processes required for the test to the procedure table, including all command, data acquisition, detection, and digital output processes.
Next, in Task 4, all processes are sequenced by assigning start and interrupt triggers to them. Then the parameters are set for each process, and finally, options are selected for the procedure.
The end result is a sample procedure that accomplishes the test objectives of the sample test scenario.
An alternate method—building and testing
functional layers
An alternative method for building procedures involves separating the procedure into functional layers, and adding, sequencing, and setting the parameters for all of the processes within each layer before building the next layer.
As an exercise, you could build the sample procedure this way.
For instance, rather than adding all the processes required for the test to the procedure table, at first add only the command processes. This defines the command layer of the procedure. Next, sequence and set the parameters for the command processes, and run the procedure to ensure the command layer is functional.
Creating a Sample Procedure
Model 793.10 MultiPurpose TestWare
Working w
ith ProceduresWorking with Procedures 45
Next, add the data acquisition layer to the command layer. To do this, add, sequence, and set the parameters for the data acquisition process. Then run the procedure to ensure both layers are functional. You can check the data stored in the MPT specimen (created when you run the test) to ensure you are getting the type of data you expect.
Finally, add, sequence, and set the parameters of the processes used to control the cooling fan.
Note The advantage of building procedures in functional layers rise with the complexity of the procedure. Using this method in reverse is also an effective method for debugging procedures.
Task 3 Add Processes to the Procedure Table
To complete this task, we will:
• Add processes to the Procedure table.
• Add processes to the Group table.
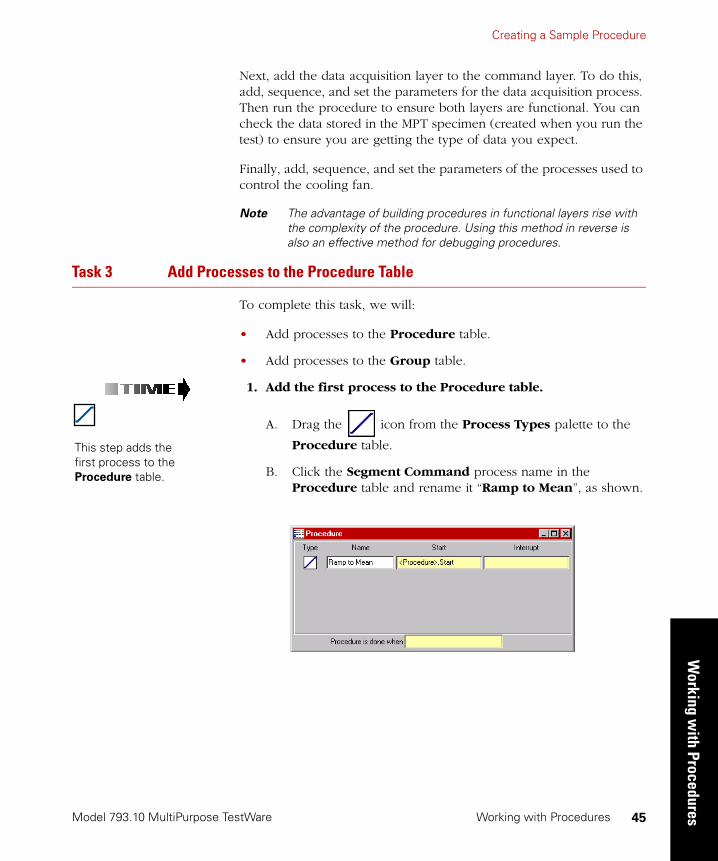
1. Add the first process to the Procedure table.
A. Drag the icon from the Process Types palette to the
Procedure table.
B. Click the Segment Command process name in the Procedure table and rename it “Ramp to Mean”, as shown.
This step adds the first process to the Procedure table.
Model 793.10 MultiPurpose TestWare
Creating a Sample ProcedureW
orki
ng w
ith P
roce
dure
s
Working with Procedures46
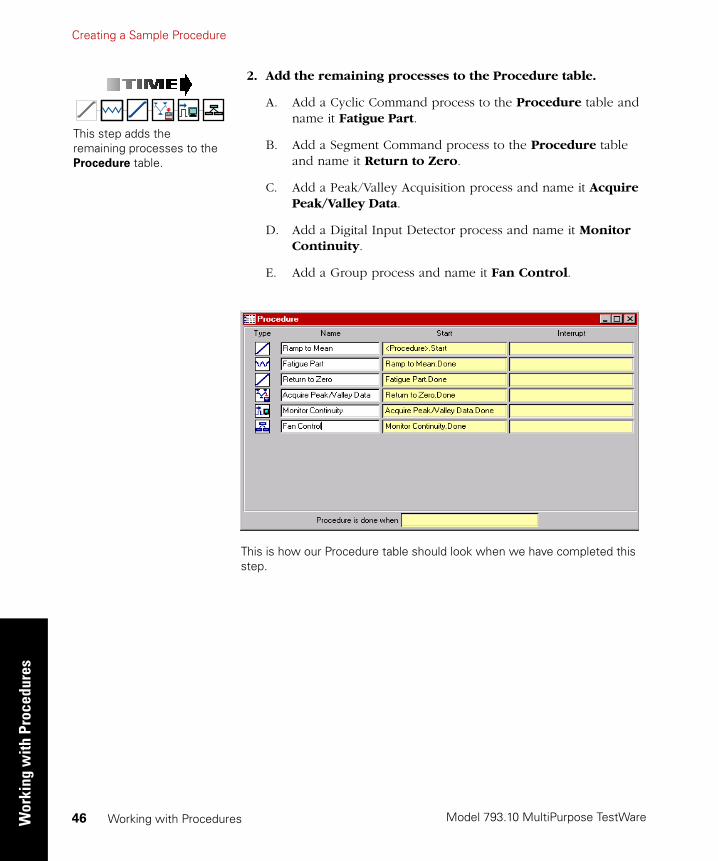
2. Add the remaining processes to the Procedure table.
A. Add a Cyclic Command process to the Procedure table and name it Fatigue Part.
B. Add a Segment Command process to the Procedure table and name it Return to Zero.
C. Add a Peak/Valley Acquisition process and name it Acquire Peak/Valley Data.
D. Add a Digital Input Detector process and name it Monitor Continuity.
E. Add a Group process and name it Fan Control.
This step adds the remaining processes to the Procedure table.
This is how our Procedure table should look when we have completed this step.
Creating a Sample Procedure
Model 793.10 MultiPurpose TestWare
Working w
ith ProceduresWorking with Procedures 47
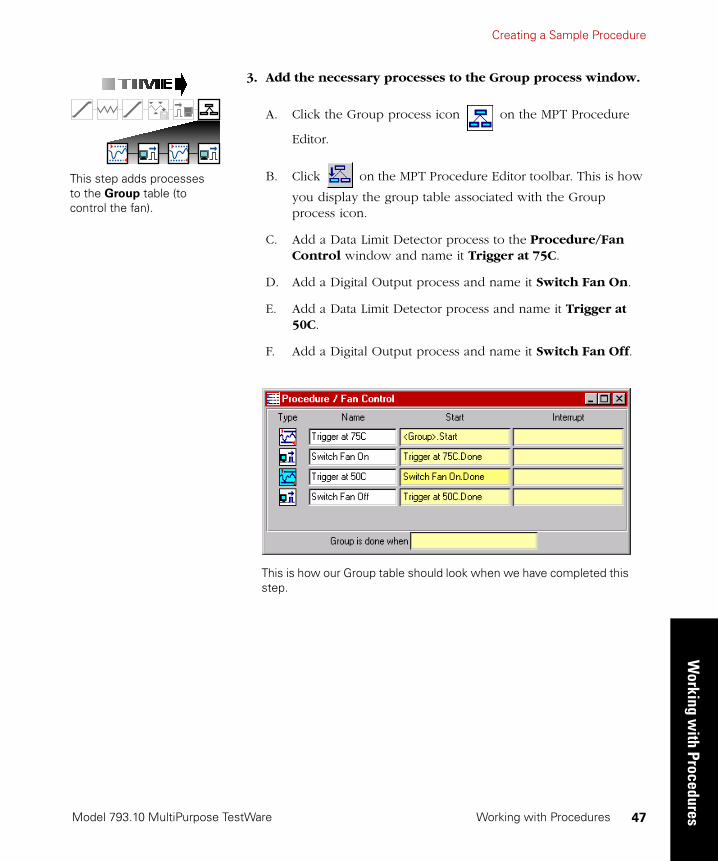
3. Add the necessary processes to the Group process window.
A. Click the Group process icon on the MPT Procedure
Editor.
B. Click on the MPT Procedure Editor toolbar. This is how
you display the group table associated with the Group process icon.
C. Add a Data Limit Detector process to the Procedure/Fan Control window and name it Trigger at 75C.
D. Add a Digital Output process and name it Switch Fan On.
E. Add a Data Limit Detector process and name it Trigger at 50C.
F. Add a Digital Output process and name it Switch Fan Off.
This step adds processes to the Group table (to control the fan).
This is how our Group table should look when we have completed this step.

Model 793.10 MultiPurpose TestWare
Creating a Sample ProcedureW
orki
ng w
ith P
roce
dure
s
Working with Procedures48
Task 4 Sequence Your Processes
To complete this task, we will:
• Select Start and Interrupt triggers for each process on the Procedure and Group table.
• Select a Procedure is done when trigger for the Procedure table.
• Select a Group is done when trigger for the Group table.
This task determines the sequence in which the processes execute. With the exception of the first process in the procedure, the default Start trigger for each process is the done trigger generated by the previous process. The default Interrupt trigger is blank.
Note For information on how to choose specific Start and Interrupt triggers for individual processes, see “Sequencing Processes” on page 104.
Note There is a slight time delay between processes that start with a common trigger signal (for example, two processes using the <Procedure.Start> trigger signal). The process positioned the highest on the Procedure or Group table starts first.
1. Specify Start triggers for each process in the Procedure table.
A. If you are still in the Group table, click on the MPT
toolbar to return to the main Procedure table.
B. Observe that the Start trigger for the Ramp to Mean process is <Procedure>.Start. This is the default start trigger, and will make this process start when the procedure starts.
C. Set the Start trigger for the Fatigue Part process to Ramp to Mean.Done. This is the default.
D. Set the Start trigger for the Return to Zero process to Fatigue Part.Done. This is the default.
E. Change the Start trigger for the Acquire Peak/Valley Data process to Ramp to Mean.Done, which will make this process and the Fatigue Part process start almost simultaneously.
This step changes the default sequence of some of the processes in the procedure.

Creating a Sample Procedure
Model 793.10 MultiPurpose TestWare
Working w
ith ProceduresWorking with Procedures 49
F. Change the Start trigger for the Monitor Continuity process to Ramp to Mean.Done, which will make this process and the Fatigue Part process start almost simultaneously.
G. Change the Start trigger for the Fan Control process to Ramp to Mean.Done, which will make this process and the Fatigue Part process start almost simultaneously.
This is how our Procedure table should look when we have completed this step.
Model 793.10 MultiPurpose TestWare
Creating a Sample ProcedureW
orki
ng w
ith P
roce
dure
s
Working with Procedures50
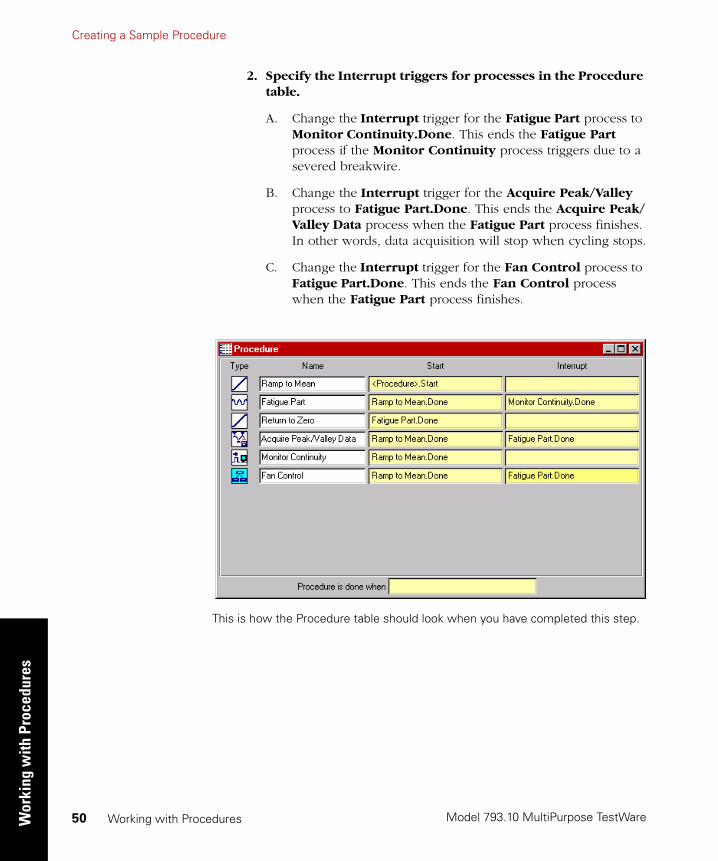
2. Specify the Interrupt triggers for processes in the Procedure table.
A. Change the Interrupt trigger for the Fatigue Part process to Monitor Continuity.Done. This ends the Fatigue Part process if the Monitor Continuity process triggers due to a severed breakwire.
B. Change the Interrupt trigger for the Acquire Peak/Valley process to Fatigue Part.Done. This ends the Acquire Peak/Valley Data process when the Fatigue Part process finishes. In other words, data acquisition will stop when cycling stops.
C. Change the Interrupt trigger for the Fan Control process to Fatigue Part.Done. This ends the Fan Control process when the Fatigue Part process finishes.
This is how the Procedure table should look when you have completed this step.
Creating a Sample Procedure
Model 793.10 MultiPurpose TestWare
Working w
ith ProceduresWorking with Procedures 51
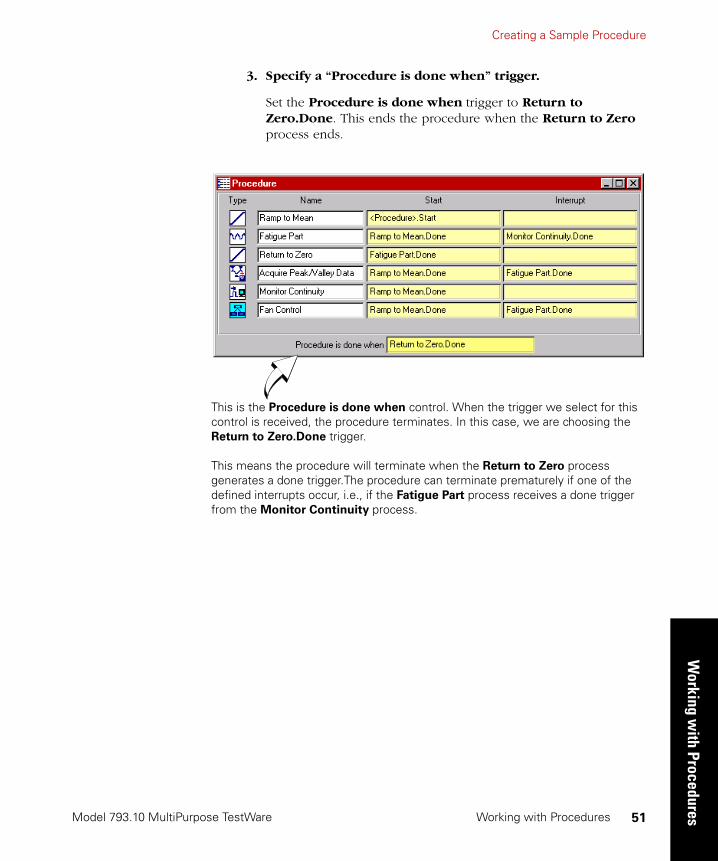
3. Specify a “Procedure is done when” trigger.
Set the Procedure is done when trigger to Return to Zero.Done. This ends the procedure when the Return to Zero process ends.
This is the Procedure is done when control. When the trigger we select for this control is received, the procedure terminates. In this case, we are choosing the Return to Zero.Done trigger.
This means the procedure will terminate when the Return to Zero process generates a done trigger.The procedure can terminate prematurely if one of the defined interrupts occur, i.e., if the Fatigue Part process receives a done trigger from the Monitor Continuity process.
Model 793.10 MultiPurpose TestWare
Creating a Sample ProcedureW
orki
ng w
ith P
roce
dure
s
Working with Procedures52
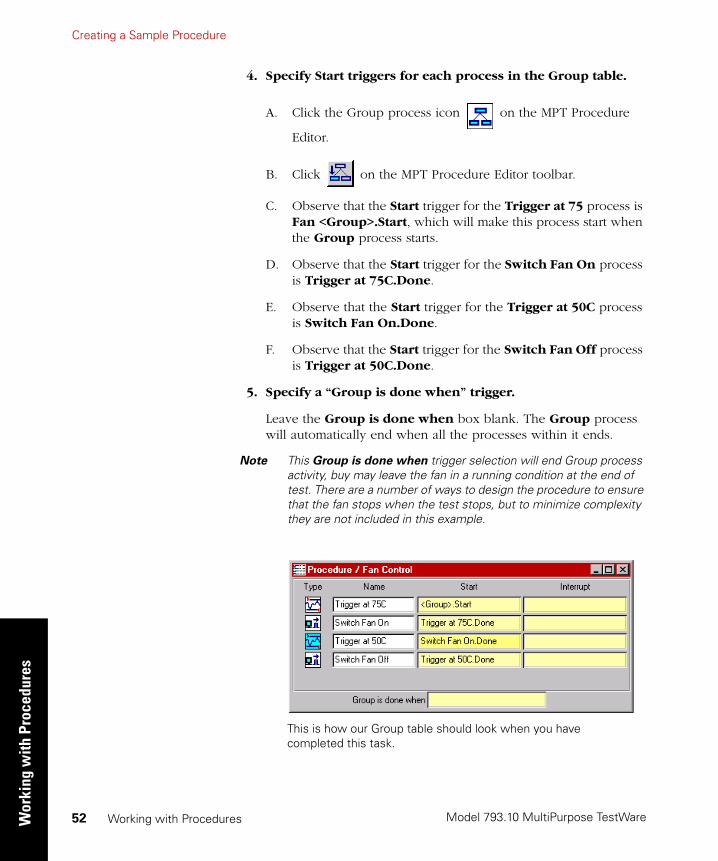
4. Specify Start triggers for each process in the Group table.
A. Click the Group process icon on the MPT Procedure
Editor.
B. Click on the MPT Procedure Editor toolbar.
C. Observe that the Start trigger for the Trigger at 75 process is Fan <Group>.Start, which will make this process start when the Group process starts.
D. Observe that the Start trigger for the Switch Fan On process is Trigger at 75C.Done.
E. Observe that the Start trigger for the Trigger at 50C process is Switch Fan On.Done.
F. Observe that the Start trigger for the Switch Fan Off process is Trigger at 50C.Done.
5. Specify a “Group is done when” trigger.
Leave the Group is done when box blank. The Group process will automatically end when all the processes within it ends.
Note This Group is done when trigger selection will end Group process activity, buy may leave the fan in a running condition at the end of test. There are a number of ways to design the procedure to ensure that the fan stops when the test stops, but to minimize complexity they are not included in this example.
This is how our Group table should look when you have completed this task.

Creating a Sample Procedure
Model 793.10 MultiPurpose TestWare
Working w
ith ProceduresWorking with Procedures 53
Task 5 Set Process Parameters in the Procedure Table
To complete this task, we will fill out the parameters windows for each process in the Procedure and Group tables.
1. Define the Ramp to Mean (Segment Command) process.
Note For information on the parameter window controls, see “Segment Command Parameter Descriptions” on page 200.
A. In the Procedure table, double-click the Segment Command (Ramp to Mean) process icon.
B. In the Segment Command Parameters window, click the Channels tab. Move all the channels you want to generate the command on to the Included list. Move all the others to the Available list.
C. Click the Command tab. Select and enter the parameters needed by the test, as shown:
D. Click the General tab and observe the default selections.
E. When you are finished, close the Segment Command Parameters window.
Segment Command
(Ramp to Mean)
3.0000

Model 793.10 MultiPurpose TestWare
Creating a Sample ProcedureW
orki
ng w
ith P
roce
dure
s
Working with Procedures54
2. Define the Fatigue Part (Cyclic Command) process.
Note For information on the parameter window controls, see “Cyclic Command Parameter Descriptions” on page 212.
A. In the Procedure table, double-click the Cyclic Command (Fatigue Part) process icon.
B. In the Cyclic Command Parameters window, click the Channels tab. Move all the channels you want to generate the command on to the Included list. Move all the others to the Available list.
C. Click the Command tab. Enter and select the parameters needed for the test, as shown:
D. Click the General tab and enter information as desired.
E. When you are finished, close the Cyclic Command Parameters window.
Cyclic Command (Fatigue Part)
4000.0
Creating a Sample Procedure
Model 793.10 MultiPurpose TestWare
Working w
ith ProceduresWorking with Procedures 55
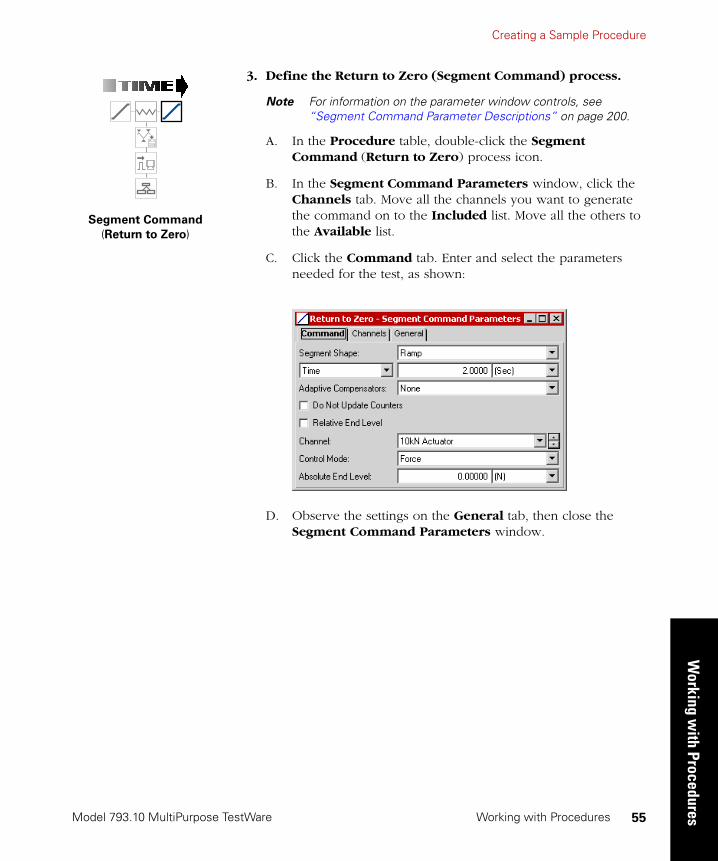
3. Define the Return to Zero (Segment Command) process.
Note For information on the parameter window controls, see “Segment Command Parameter Descriptions” on page 200.
A. In the Procedure table, double-click the Segment Command (Return to Zero) process icon.
B. In the Segment Command Parameters window, click the Channels tab. Move all the channels you want to generate the command on to the Included list. Move all the others to the Available list.
C. Click the Command tab. Enter and select the parameters needed for the test, as shown:
D. Observe the settings on the General tab, then close the Segment Command Parameters window.
Segment Command
(Return to Zero)

Model 793.10 MultiPurpose TestWare
Creating a Sample ProcedureW
orki
ng w
ith P
roce
dure
s
Working with Procedures56
4. Define the Acquire Peak/Valley Data (Peak/Valley Data Acquisition) process.
Note For information on the parameter window controls, see “Peak/Valley Acquisition Parameter Descriptions” on page 269.
A. In the Procedure table, double-click the Peak/Valley Acquisition (Acquire Peak/Valley Data) process icon.
B. In the Peak/Valley Acquisition Parameters window, click the Signals tab. Move all the signals you want to take data on to the Included list. Move all the others to the Available list, as shown:
C. Click the Acquisition tab. Enter and select the parameters needed for the test, as shown:
Peak/Valley Acquisition
(Acquire Peak/Valley)
Creating a Sample Procedure
Model 793.10 MultiPurpose TestWare
Working w
ith ProceduresWorking with Procedures 57
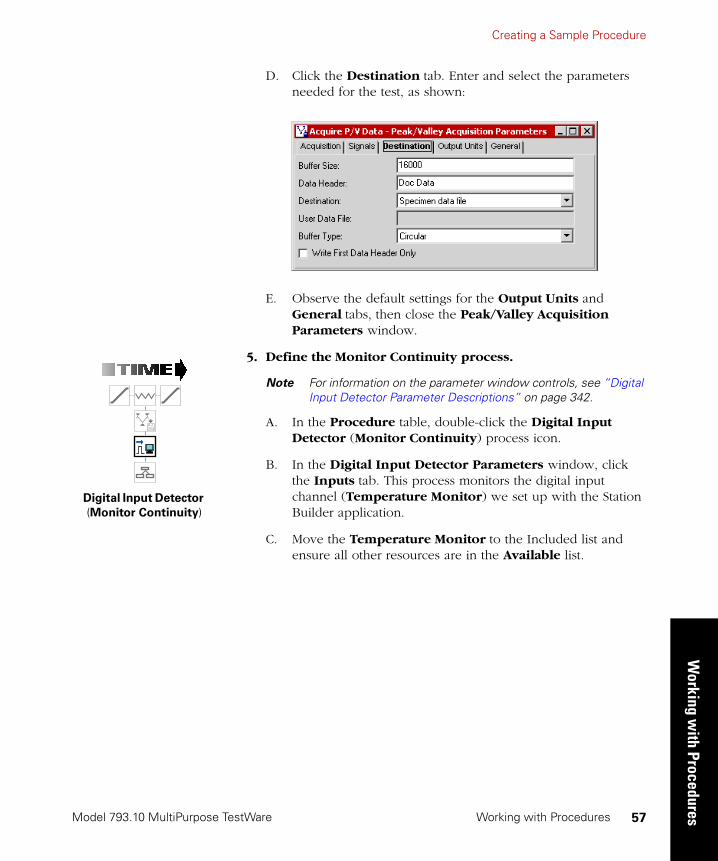
D. Click the Destination tab. Enter and select the parameters needed for the test, as shown:
E. Observe the default settings for the Output Units and General tabs, then close the Peak/Valley Acquisition Parameters window.
5. Define the Monitor Continuity process.
Note For information on the parameter window controls, see “Digital Input Detector Parameter Descriptions” on page 342.
A. In the Procedure table, double-click the Digital Input Detector (Monitor Continuity) process icon.
B. In the Digital Input Detector Parameters window, click the Inputs tab. This process monitors the digital input channel (Temperature Monitor) we set up with the Station Builder application.
C. Move the Temperature Monitor to the Included list and ensure all other resources are in the Available list.
Digital Input Detector (Monitor Continuity)
Model 793.10 MultiPurpose TestWare
Creating a Sample ProcedureW
orki
ng w
ith P
roce
dure
s
Working with Procedures58
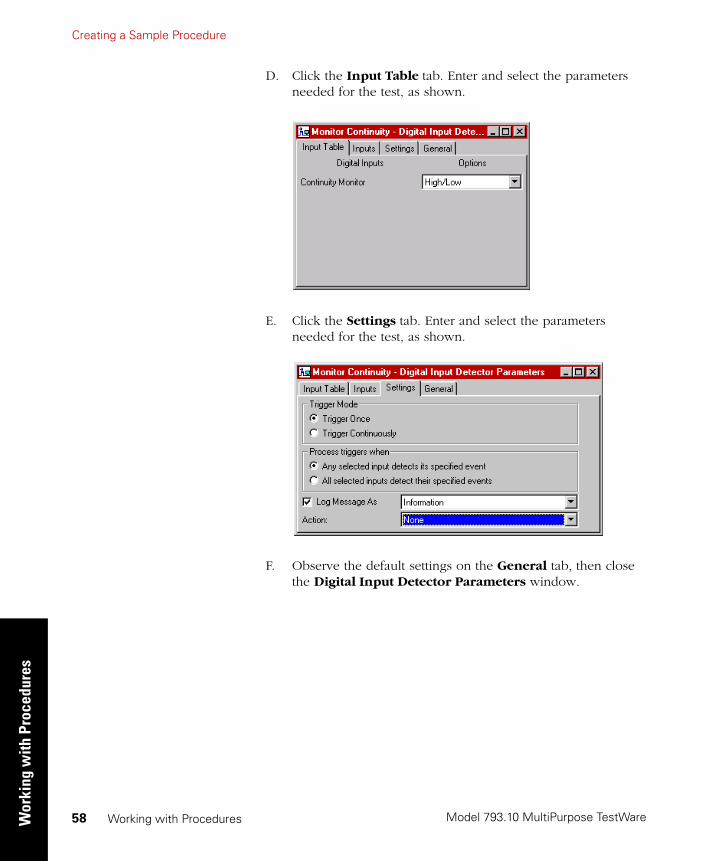
D. Click the Input Table tab. Enter and select the parameters needed for the test, as shown.
E. Click the Settings tab. Enter and select the parameters needed for the test, as shown.
F. Observe the default settings on the General tab, then close the Digital Input Detector Parameters window.
Creating a Sample Procedure
Model 793.10 MultiPurpose TestWare
Working w
ith ProceduresWorking with Procedures 59
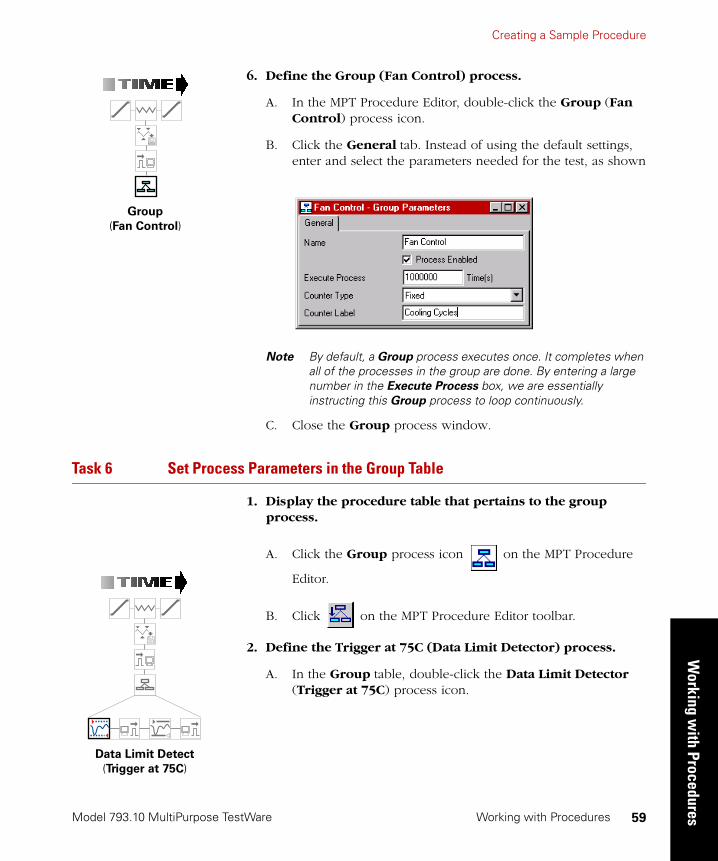
6. Define the Group (Fan Control) process.
A. In the MPT Procedure Editor, double-click the Group (Fan Control) process icon.
B. Click the General tab. Instead of using the default settings, enter and select the parameters needed for the test, as shown
Note By default, a Group process executes once. It completes when all of the processes in the group are done. By entering a large number in the Execute Process box, we are essentially instructing this Group process to loop continuously.
C. Close the Group process window.
Task 6 Set Process Parameters in the Group Table
1. Display the procedure table that pertains to the group process.
A. Click the Group process icon on the MPT Procedure
Editor.
B. Click on the MPT Procedure Editor toolbar.
2. Define the Trigger at 75C (Data Limit Detector) process.
A. In the Group table, double-click the Data Limit Detector (Trigger at 75C) process icon.
Group
(Fan Control)
Data Limit Detect
(Trigger at 75C)
Model 793.10 MultiPurpose TestWare
Creating a Sample ProcedureW
orki
ng w
ith P
roce
dure
s
Working with Procedures60
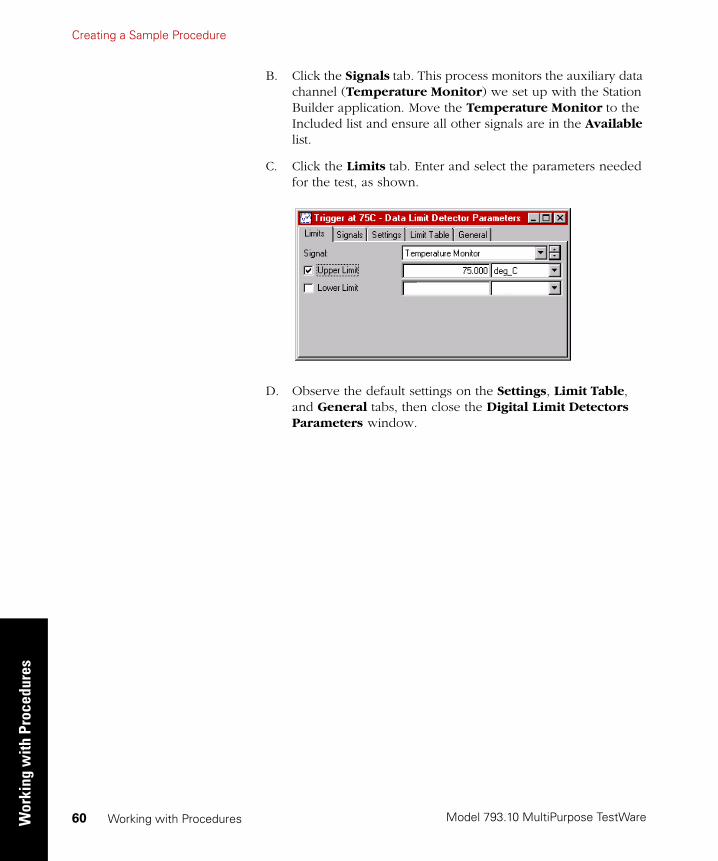
B. Click the Signals tab. This process monitors the auxiliary data channel (Temperature Monitor) we set up with the Station Builder application. Move the Temperature Monitor to the Included list and ensure all other signals are in the Available list.
C. Click the Limits tab. Enter and select the parameters needed for the test, as shown.
D. Observe the default settings on the Settings, Limit Table, and General tabs, then close the Digital Limit Detectors Parameters window.

Creating a Sample Procedure
Model 793.10 MultiPurpose TestWare
Working w
ith ProceduresWorking with Procedures 61
3. Define the Switch Fan On (Digital Output) process.
A. In the Group table, double-click the Digital Output (Switch Fan On) process icon.
B. Click the Outputs tab and move the Fan Switch resource to the Included list, as shown below.
In this case the Fan Switch resource would appear only if you used the Station Builder application to assign a digital output resource to the station configuration file and gave it a label of Fan Switch.
C. Click the Output Table tab. In our sample test scenario, the cooling fan power supply is controlled by a microswitch. This microswitch applies 110 V to the fan when it is set high, and removes 110 V from the fan when it is set low (or cleared). So for this process, the appropriate setting is Set, which means set high. Select the parameters needed for the test, as shown.
D. Use the default settings on the Settings and the General tab, then close the Digital Output Parameters window.
Digital Output
(Switch Fan On)
Model 793.10 MultiPurpose TestWare
Creating a Sample ProcedureW
orki
ng w
ith P
roce
dure
s
Working with Procedures62
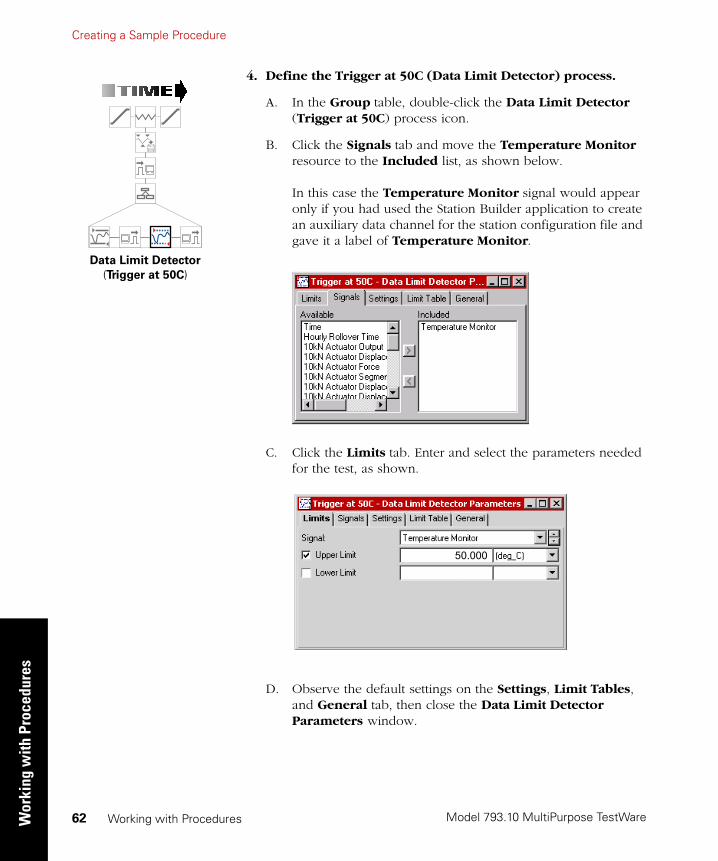
4. Define the Trigger at 50C (Data Limit Detector) process.
A. In the Group table, double-click the Data Limit Detector (Trigger at 50C) process icon.
B. Click the Signals tab and move the Temperature Monitor resource to the Included list, as shown below.
In this case the Temperature Monitor signal would appear only if you had used the Station Builder application to create an auxiliary data channel for the station configuration file and gave it a label of Temperature Monitor.
C. Click the Limits tab. Enter and select the parameters needed for the test, as shown.
D. Observe the default settings on the Settings, Limit Tables, and General tab, then close the Data Limit Detector Parameters window.
Data Limit Detector
(Trigger at 50C)
50.000
Creating a Sample Procedure
Model 793.10 MultiPurpose TestWare
Working w
ith ProceduresWorking with Procedures 63
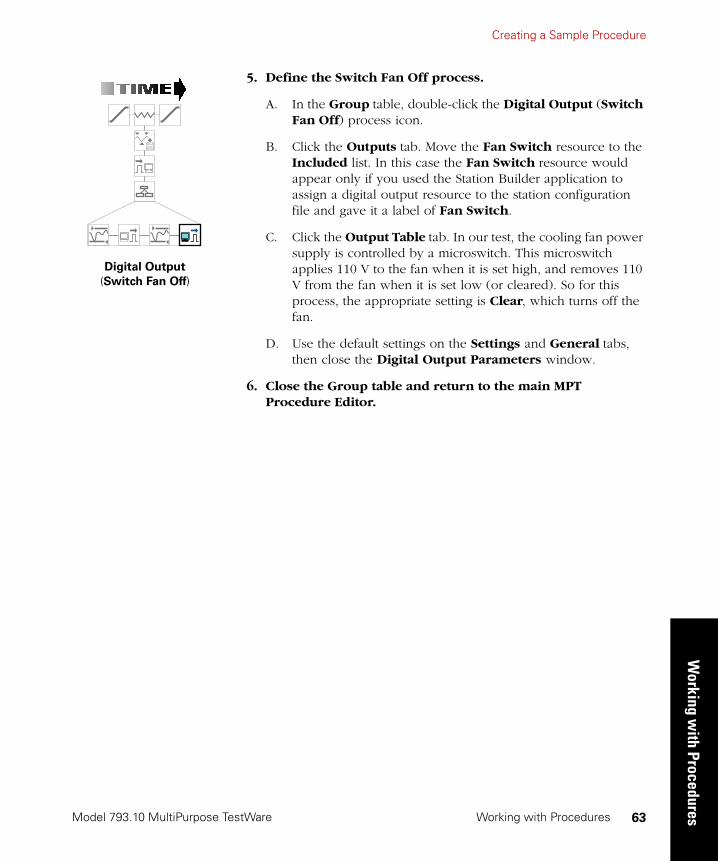
5. Define the Switch Fan Off process.
A. In the Group table, double-click the Digital Output (Switch Fan Off) process icon.
B. Click the Outputs tab. Move the Fan Switch resource to the Included list. In this case the Fan Switch resource would appear only if you used the Station Builder application to assign a digital output resource to the station configuration file and gave it a label of Fan Switch.
C. Click the Output Table tab. In our test, the cooling fan power supply is controlled by a microswitch. This microswitch applies 110 V to the fan when it is set high, and removes 110 V from the fan when it is set low (or cleared). So for this process, the appropriate setting is Clear, which turns off the fan.
D. Use the default settings on the Settings and General tabs, then close the Digital Output Parameters window.
6. Close the Group table and return to the main MPT Procedure Editor.
Digital Output
(Switch Fan Off)
Model 793.10 MultiPurpose TestWare
Creating a Sample ProcedureW
orki
ng w
ith P
roce
dure
s
Working with Procedures64
Task 7 Select Procedure Options
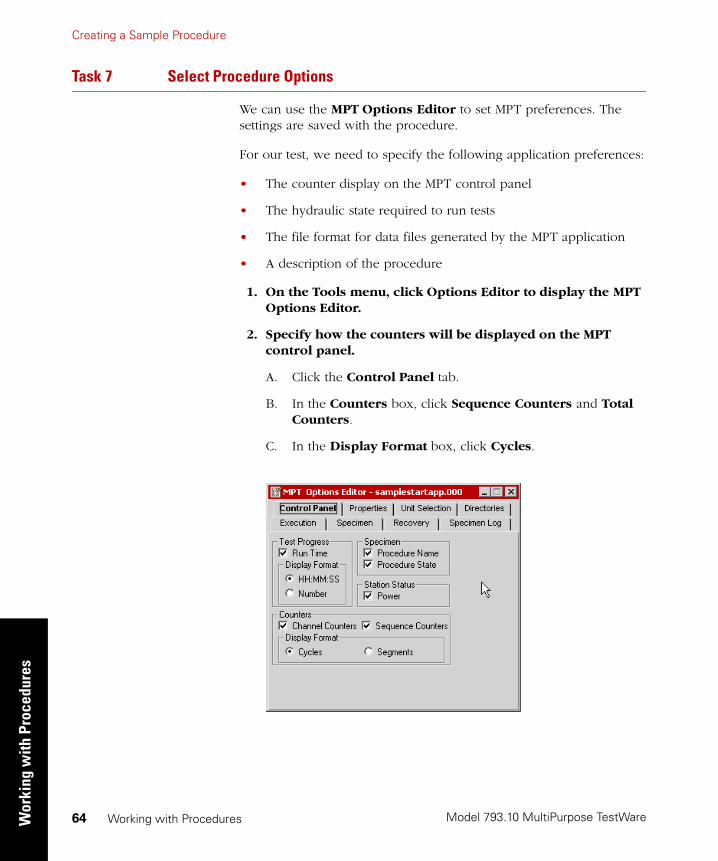
We can use the MPT Options Editor to set MPT preferences. The settings are saved with the procedure.
For our test, we need to specify the following application preferences:
• The counter display on the MPT control panel
• The hydraulic state required to run tests
• The file format for data files generated by the MPT application
• A description of the procedure
1. On the Tools menu, click Options Editor to display the MPT Options Editor.
2. Specify how the counters will be displayed on the MPT control panel.
A. Click the Control Panel tab.
B. In the Counters box, click Sequence Counters and Total Counters.
C. In the Display Format box, click Cycles.

Creating a Sample Procedure
Model 793.10 MultiPurpose TestWare
Working w
ith ProceduresWorking with Procedures 65
3. Specify the Hydraulic State required to run the test.
A. Click the Execution tab.
B. In the Required Power list, select Off.
Note Since this program will only be used for simulated testing, click Off. This way, you can only run the test when hydraulic pressure is disabled.
4. Set the file format for MPT data files.
Click the Specimen tab. Complete the tab as shown.
5. Enter a description of the procedure.
The Data File Format specifies the file format for test data.
Model 793.10 MultiPurpose TestWare
Creating a Sample ProcedureW
orki
ng w
ith P
roce
dure
s
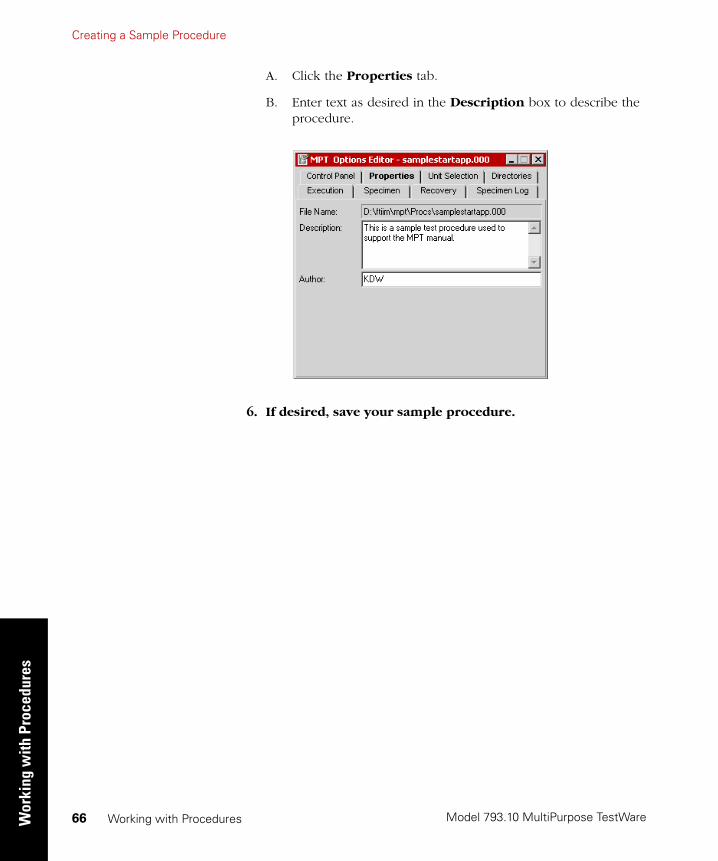
Working with Procedures66
A. Click the Properties tab.
B. Enter text as desired in the Description box to describe the procedure.
6. If desired, save your sample procedure.
Model 793.10 MultiPurpose TestWare
Working w
ith MPT Specim
ens
Working with MPT Specimens 67
Chapter 3
Working with MPT Specimens
About MPT Specimens 68
Creating and Linking MPT Specimens 69
MPT Specimen File Descriptions 73
Specimen.dat 74
User-Specified.dat 76
Specimen.log 77
Specimen.mpp 78
Specimen.mps 79
Specimen.prm 80
Loading MPT Specimens 81
About the Load Specimen Window 82
MPT Specimen Loading Examples 85
Model 793.10 MultiPurpose TestWare
About MPT SpecimensW
orki
ng w
ith M
PT S
peci
men
s
Working with MPT Specimens68
About MPT SpecimensAn MPT specimen contains a number of files associated with the execution of a specific procedure.
The default location for your MPT specimens is:
• c:\ftxxx (or tsxxx)\mpt\specimens, or
• c:\mts793\mpt\specimens
During the test, the MPT application writes test-generated data files to the selected MPT specimen. These files include log files, data acquisition files, test recovery files, and so forth. For detailed information on the files saved in the MPT specimen, see “MPT Specimen File Descriptions” on page 73.
Assigning MPTspecimens
You must link a new or existing MPT specimen to a procedure before you can run it. Once an MPT specimen has been linked to a particular procedure, that procedure is available to the MPT specimen on the MPT control panel. For more information, see “Loading MPT Specimens” on page 81.
You can create new MPT specimens with the MPT control panel and the MPT Specimen Editor. You may want to use a new MPT specimen to collect data for a particular test run in a unique location. For more information on creating and linking MPT specimens, see “Creating and Linking MPT Specimens” on page 69.
Creating and Linking MPT Specimens
Model 793.10 MultiPurpose TestWare
Working w
ith MPT Specim
ens
Working with MPT Specimens 69
Creating and Linking MPT SpecimensYou can use the MPT control panel or the MPT Specimen Editor to create MPT specimens and link procedures to them.
Using the MPT controlpanel
The MPT control panel is designed to create new MPT specimens one at a time, or as needed, in less structured testing environments.
For example, suppose you want to modify a procedure (with an existing MPT Specimen) and run it against a new MPT specimen. On the MPT control panel, you could simply click the New Specimen button, name the MPT specimen, and then click Run on the Station Controls panel. The new data, test log entries, recovery information, and so on, will be stored in the new MPT specimen, instead of the previous MPT specimen.
MPT specimens are automatically linked to the current procedure when you click Run.
For a description of the MPT control panel controls and indicators, see “MPT Control Panel” on page 126.
Using the SpecimenEditor
The MPT Specimen Editor is designed for preparing a batch of MPT specimens and linking them with one or more procedures for future testing. The MPT Specimen Editor is especially useful for test administrators who want to predefine a number of MPT specimens for a test operator so he or she can run a succession of tests.
For example, as a test administrator, you could create a number of new MPT specimens and link them all to your procedure. This way, the test operator could simply select the desired MPT specimen on the MPT control panel (which loads the linked procedure) and run the test. When the test completes, the operator could select the next MPT specimen, and could run the test again. The operator could perform this for each predefined MPT specimen.
For a description of the MPT Specimen Editor controls and indicators, see “MPT Specimen Editor” on page 159.
Model 793.10 MultiPurpose TestWare
Creating and Linking MPT SpecimensW
orki
ng w
ith M
PT S
peci
men
s
Working with MPT Specimens70
How to Create and Link a New MPT Specimen with the Control Panel
To create an MPT specimen with the MPT control panel:
1. Click on the MPT control panel toolbar.
2. In the Specimen box, rename the new MPT specimen as desired.
To link the MPT specimen to a procedure file:
When you click Run on the Station Controls panel, the MPT specimen will automatically be linked to the loaded procedure.
How to Create and Link a New MPT Specimen with the Specimen Editor
To create an MPT specimen with the MPT Specimen Editor:
1. Click New on the MPT Specimen Editor. An MPT specimen will be added to the MPT specimen list.
2. In the box above the MPT specimen list, rename the new MPT specimen as desired and press the Enter key on the keyboard.
To link the MPT specimen to a procedure file:
1. Click Procedure Path/File Name.
2. Click the desired procedure file in the Select procedure file window.
Note If the procedure is new, make sure you save it first; otherwise it will not appear in the list of procedures in the Select procedure
file window.
Creating and Linking MPT Specimens
Model 793.10 MultiPurpose TestWare
Working w
ith MPT Specim
ens
Working with MPT Specimens 71
How to Link a Used MPT Specimen to a Different Procedure
Note This procedure pertains to MPT specimens linked to procedures that have already been run.
With the ControlPanel
1. Open the procedure you want to link your MPT specimen to.
2. In the Specimen list on the MPT control panel, click the MPT specimen you want to link.
3. In the Load Specimen window that appears, click Currently Loaded Procedure.
For more information on loading procedures, see “Loading MPT Specimens” on page 81.
With the SpecimenEditor
1. Open the MPT Specimen Editor.
2. In the MPT specimen list, click the MPT specimen you want to link.
3. Click Procedure Path/File Name.
4. Click the desired procedure file in the Select procedure file window.
Note If the procedure is new, make sure you save it first; otherwise it will not appear in the list of procedures in the Select procedure
file window.
Later, when you select the MPT specimen in the MPT control panel, MPT will display the Load Specimen window.
5. In the Load Specimen window, click Procedure assigned to the Specimen.
Model 793.10 MultiPurpose TestWare
Creating and Linking MPT SpecimensW
orki
ng w
ith M
PT S
peci
men
s
Working with MPT Specimens72
Running Multiple Tests Against the Same MPT Specimen
You may want to run a procedure against an MPT specimen more than once, or you may want to run different tests against the same MPT specimen. In either case, it is important to note how the data files in your MPT specimen are affected when you do this.
By default, if you run another test against your MPT specimen, the MPT application will:
• Append new test information to the existing data file and log file (see “Specimen.dat” on page 74 and “Specimen.log” on page 77).
• Write over the information in the procedure snapshot file (see “Specimen.mpp” on page 78) and dynamic state snapshot file (see “Specimen.mps” on page 79) with the new test information.
Note You can configure whether new data overwrites or appends to the previous data with the MPT Options Editor. For more information, see page 165.
MPT Specimen File Descriptions
Model 793.10 MultiPurpose TestWare
Working w
ith MPT Specim
ens
Working with MPT Specimens 73
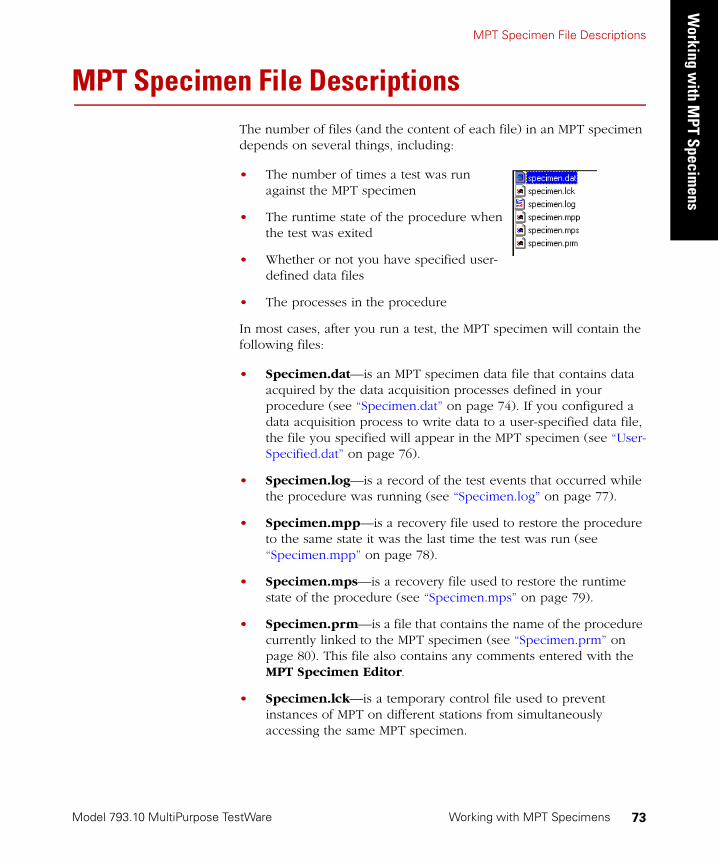
MPT Specimen File DescriptionsThe number of files (and the content of each file) in an MPT specimen depends on several things, including:
• The number of times a test was run against the MPT specimen
• The runtime state of the procedure when the test was exited
• Whether or not you have specified user-defined data files
• The processes in the procedure
In most cases, after you run a test, the MPT specimen will contain the following files:
• Specimen.dat—is an MPT specimen data file that contains data acquired by the data acquisition processes defined in your procedure (see “Specimen.dat” on page 74). If you configured a data acquisition process to write data to a user-specified data file, the file you specified will appear in the MPT specimen (see “User-Specified.dat” on page 76).
• Specimen.log—is a record of the test events that occurred while the procedure was running (see “Specimen.log” on page 77).
• Specimen.mpp—is a recovery file used to restore the procedure to the same state it was the last time the test was run (see “Specimen.mpp” on page 78).
• Specimen.mps—is a recovery file used to restore the runtime state of the procedure (see “Specimen.mps” on page 79).
• Specimen.prm—is a file that contains the name of the procedure currently linked to the MPT specimen (see “Specimen.prm” on page 80). This file also contains any comments entered with the MPT Specimen Editor.
• Specimen.lck—is a temporary control file used to prevent instances of MPT on different stations from simultaneously accessing the same MPT specimen.
Model 793.10 MultiPurpose TestWare
MPT Specimen File DescriptionsW
orki
ng w
ith M
PT S
peci
men
s
Working with MPT Specimens74
Specimen.dat
The Specimen.dat file contains data acquired by the data acquisition processes in your procedure.
Each time you run a procedure against an MPT specimen (that is, each time you press run after pressing reset), newly acquired data overwrites or is appended to the current data in the Specimen.dat file. The specimen data file may contain data from more than one test if more than one test has been run against the same MPT specimen.
Note You can configure whether new data overwrites or appends to the previous data with the MPT Options Editor. For more information, see page 165.
Note If you have configured a data acquisition process to write to a user-specified data file, it will write data to the user-specified file instead of the Specimen.dat file. For more information, see “User-Specified.dat” on page 76.
Sample MPTspecimen data file
The following data file was created by a Peak/Valley Acquisition process that monitored the displacement feedback and acquired data on the time and displacement feedback signals.
This text string specifies the file format. See “Parsing the MPT specimen data file” on page 75.

MPT Specimen File Descriptions
Model 793.10 MultiPurpose TestWare
Working w
ith MPT Specim
ens
Working with MPT Specimens 75
Formatting the data inthe MPT specimen
data file
You can configure the MPT application to format the data written to the Specimen.dat file in one of three ways:
• Plain—test data is space-delimited. This option provides the most useful output when viewing the test data in an application such as Notepad or Microsoft Word.
• Lotus—test data is comma-delimited, with text strings enclosed in quotation marks (this is sometimes referred to as the CSV format). This option formats the data for use with Lotus 1-2-3.
• Excel—test data is tab-delimited. This option formats the data for use with Microsoft Excel.
You specify the data file format on the Specimen tab of the MPT Options Editor. For more information, see “Specimen Panel” on page 130.
If you plan to use the Excel File Converter, the data must be tab-or comma-delimited. For more information, see Appendix B, “Excel File Converter”.
Parsing the MPTspecimen data file
The first line of the data file is a text string that includes information such as the decimal separator, column separator, time formats, date formats, and so forth. This header may be used if you plan to parse the data file with a custom application.
A typical header looks like this:
MTS793|MPT|ENU|1|0|.|/|:|1|0|0|A
The format of this header line is as follows:
MTS793|progName|sLanguage|version|iDelim|sDecimal|sDate|sTime|iCountry|iDate|iTime|sCode
Where:
progName= MPT or BTWsLanguage= Natural language (standard three-character abbreviation)version= Version of this format stringiDelim= Data delimeter: 0 for space (plain), 1 for comma (Lotus), 2 for tab (Excel)sDecimal= International decimal separatorsDate= International date separatorsTime= International time separatoriCountry= International country valueiDate= International date formatiTime= International time formatsCode= Character Set Code: A for ANSI, O for OEM (currently always A)
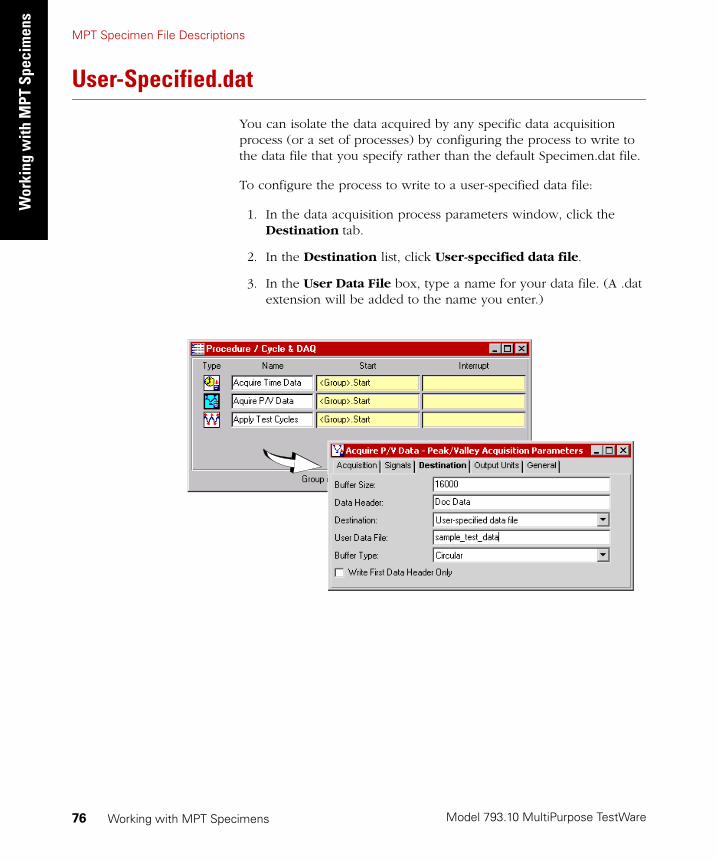
Model 793.10 MultiPurpose TestWare
MPT Specimen File DescriptionsW
orki
ng w
ith M
PT S
peci
men
s
Working with MPT Specimens76
User-Specified.dat
You can isolate the data acquired by any specific data acquisition process (or a set of processes) by configuring the process to write to the data file that you specify rather than the default Specimen.dat file.
To configure the process to write to a user-specified data file:
1. In the data acquisition process parameters window, click the Destination tab.
2. In the Destination list, click User-specified data file.
3. In the User Data File box, type a name for your data file. (A .dat extension will be added to the name you enter.)

MPT Specimen File Descriptions
Model 793.10 MultiPurpose TestWare
Working w
ith MPT Specim
ens
Working with MPT Specimens 77
Specimen.log
The Specimen.log file contains the contents of the MPT Specimen Log. This file is generated during the test, and it includes logged file events, station state changes (Run/Hold/Stop), program state changes (Starting, Running, and so on) and MPT counter values.
By default, this file is cumulative; that is, new information is added when you perform new tests against the same MPT specimen.
Changing the dataacquired in the
specimen.log file
You can change this behavior with the MPT Options Editor as follows:
• Use the Specimen Log Overwrite/Append controls on the Specimen tab
• Use the Minimum Severity and Source controls on the Specimen Log tab

Model 793.10 MultiPurpose TestWare
MPT Specimen File DescriptionsW
orki
ng w
ith M
PT S
peci
men
s
Working with MPT Specimens78
Specimen.mpp
The Specimen.mpp file is a recovery file used to restore the procedure settings used the last time the test was run. Whenever you click Run on the Station Controls panel, the MPT application updates the .mpp file with the current test settings regardless of whether the settings are saved or not.
This way, if you modify and run your test, but you forget to save your changes when you close the test, you can restore the modifications the next time you run the test.
For information on restoring unsaved test settings, see “Loading MPT Specimens” on page 81.
Note This file is created only when test recovery is enabled with the MPT
Options Editor. For more information, see “Recovery Tab” on page 180

MPT Specimen File Descriptions
Model 793.10 MultiPurpose TestWare
Working w
ith MPT Specim
ens
Working with MPT Specimens 79
Specimen.mps
The Specimen.mps file is a recovery file used to restore an interrupted test at (or close to) the point it was at when it was interrupted.
This way, if your test is interrupted before it completes (due to a power outage, interlock, or accidental stop) you can resume the test from where it was interrupted rather than restarting from the beginning of the test.
The MPT application updates this file according to the settings on the MPT Options Editor (see “Recovery Tab” on page 180). Each update includes the test program state, the current counter values, and the status of each active process in the procedure.
Note By default, the MPT application updates the .mps file each time the program state changes, and at 60-second time intervals.
For information on resuming an interrupted test from the point of interruption, see “Loading MPT Specimens” on page 81.
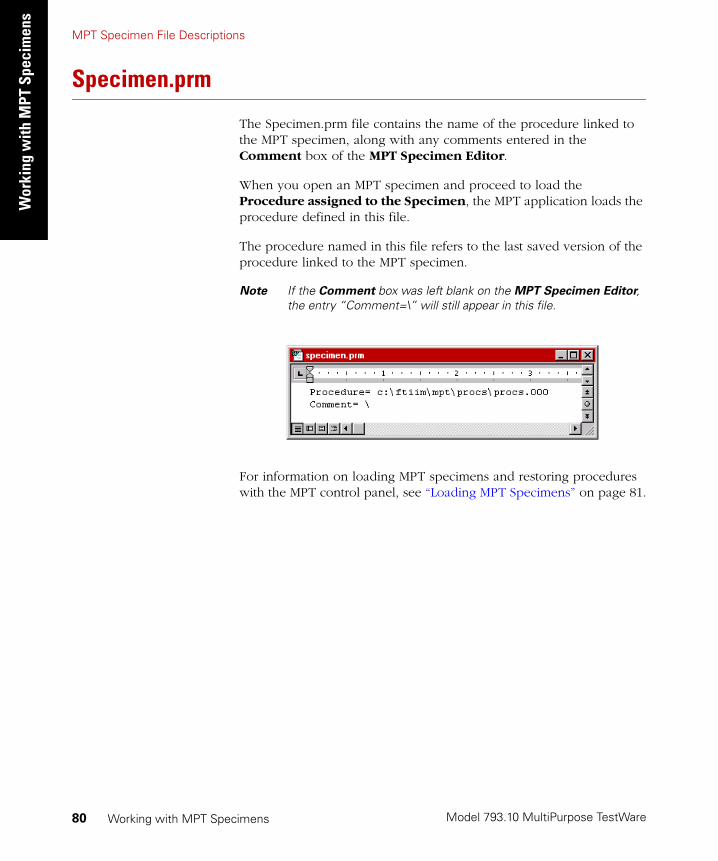
Model 793.10 MultiPurpose TestWare
MPT Specimen File DescriptionsW
orki
ng w
ith M
PT S
peci
men
s
Working with MPT Specimens80
Specimen.prm
The Specimen.prm file contains the name of the procedure linked to the MPT specimen, along with any comments entered in the Comment box of the MPT Specimen Editor.
When you open an MPT specimen and proceed to load the Procedure assigned to the Specimen, the MPT application loads the procedure defined in this file.
The procedure named in this file refers to the last saved version of the procedure linked to the MPT specimen.
Note If the Comment box was left blank on the MPT Specimen Editor, the entry “Comment=\” will still appear in this file.
For information on loading MPT specimens and restoring procedures with the MPT control panel, see “Loading MPT Specimens” on page 81.
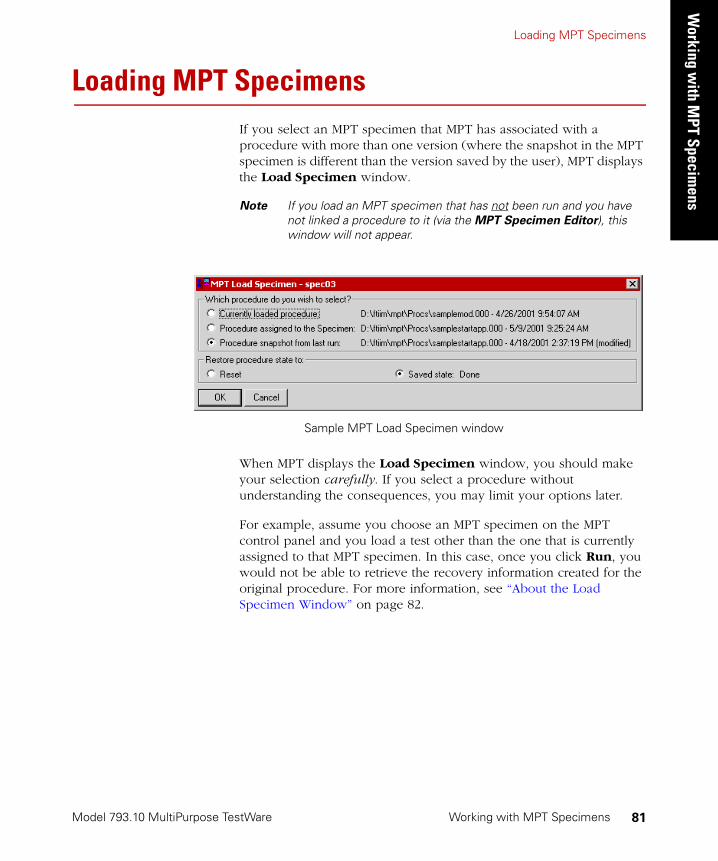
Loading MPT Specimens
Model 793.10 MultiPurpose TestWare
Working w
ith MPT Specim
ens
Working with MPT Specimens 81
Loading MPT SpecimensIf you select an MPT specimen that MPT has associated with a procedure with more than one version (where the snapshot in the MPT specimen is different than the version saved by the user), MPT displays the Load Specimen window.
Note If you load an MPT specimen that has not been run and you have not linked a procedure to it (via the MPT Specimen Editor), this window will not appear.
When MPT displays the Load Specimen window, you should make your selection carefully. If you select a procedure without understanding the consequences, you may limit your options later.
For example, assume you choose an MPT specimen on the MPT control panel and you load a test other than the one that is currently assigned to that MPT specimen. In this case, once you click Run, you would not be able to retrieve the recovery information created for the original procedure. For more information, see “About the Load Specimen Window” on page 82.
Sample MPT Load Specimen window
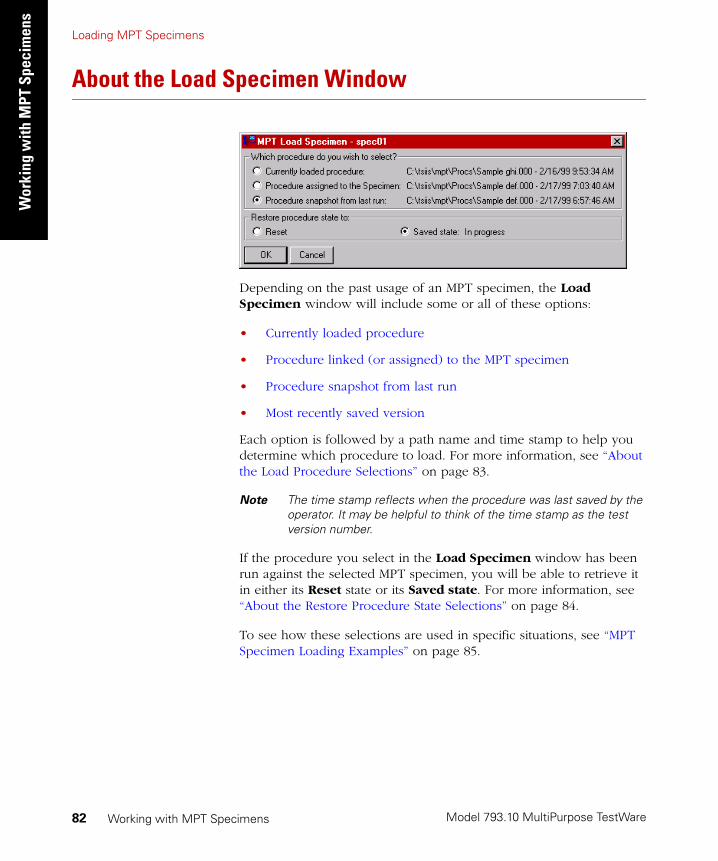
Model 793.10 MultiPurpose TestWare
Loading MPT SpecimensW
orki
ng w
ith M
PT S
peci
men
s
Working with MPT Specimens82
About the Load Specimen Window
Depending on the past usage of an MPT specimen, the Load Specimen window will include some or all of these options:
• Currently loaded procedure
• Procedure linked (or assigned) to the MPT specimen
• Procedure snapshot from last run
• Most recently saved version
Each option is followed by a path name and time stamp to help you determine which procedure to load. For more information, see “About the Load Procedure Selections” on page 83.
Note The time stamp reflects when the procedure was last saved by the operator. It may be helpful to think of the time stamp as the test version number.
If the procedure you select in the Load Specimen window has been run against the selected MPT specimen, you will be able to retrieve it in either its Reset state or its Saved state. For more information, see “About the Restore Procedure State Selections” on page 84.
To see how these selections are used in specific situations, see “MPT Specimen Loading Examples” on page 85.
Loading MPT Specimens
Model 793.10 MultiPurpose TestWare
Working w
ith MPT Specim
ens
Working with MPT Specimens 83
About the Load Procedure Selections
The following sections describe the options available in the Load Specimen window:
Currently loadedprocedure
This option uses the procedure currently open in the MPT Procedure Editor. When you click Run on the Station Controls panel, the selected MPT specimen is linked to the current procedure.
Note If the currently loaded procedure has been modified but has not been saved, “modified” is displayed after the time stamp. If the procedure was never saved, it will not display a time stamp.
Procedure linked (orassigned) to the MPT
specimen
This option loads the procedure that is currently linked to the MPT specimen. This procedure is recorded in the .prm file in the MPT specimen. For more information on the recovery file, see “Specimen.prm” on page 80.
Note If the referenced procedure file has been deleted or moved, this selection will be dimmed, and “not found” is displayed after the file name.
Procedure snapshotfrom last run
This option loads a copy of the last procedure run against the MPT specimen. This procedure is recorded in the .mpp recovery file in the MPT specimen. For more information on the recovery file, see “Specimen.mpp” on page 78.
You should select this option if you want to load the procedure and restore the settings exactly as they were the last time you ran the test. This option can be used in conjunction with the saved state selection to recover an interrupted test (see “About the Restore Procedure State Selections” on page 84).
If the procedure was modified without being saved before it was run, “modified” is displayed after the time stamp. This means the snapshot version of the procedure run against the MPT specimen contains modifications that may not be present in the saved version of the procedure.
Most recently savedversion
This option loads the most recently saved version of the procedure.
This option will appear only if the saved procedure has been modified since it was saved and is different from the linked procedure.
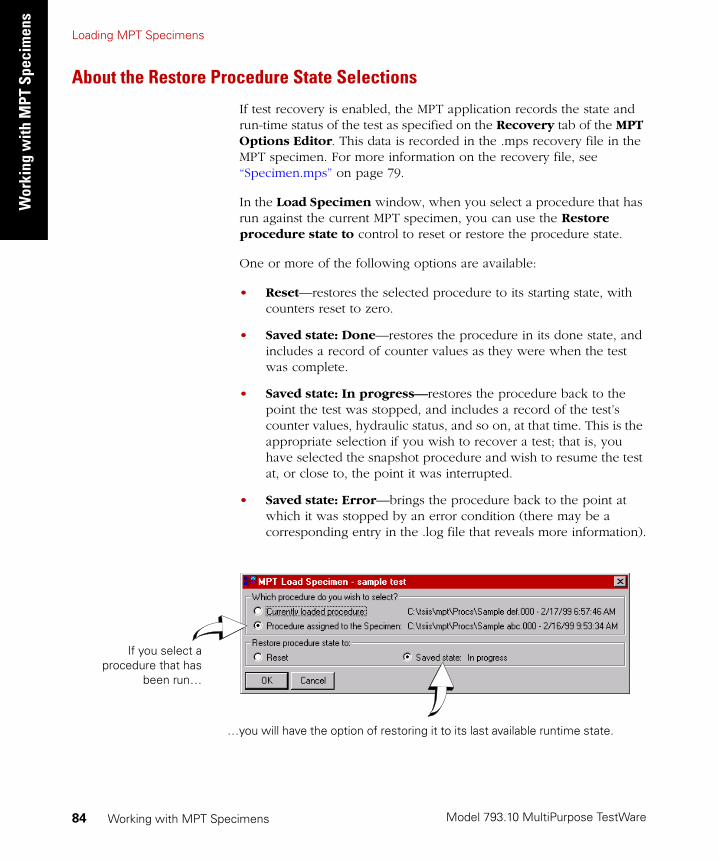
Model 793.10 MultiPurpose TestWare
Loading MPT SpecimensW
orki
ng w
ith M
PT S
peci
men
s
Working with MPT Specimens84
About the Restore Procedure State Selections
If test recovery is enabled, the MPT application records the state and run-time status of the test as specified on the Recovery tab of the MPT Options Editor. This data is recorded in the .mps recovery file in the MPT specimen. For more information on the recovery file, see “Specimen.mps” on page 79.
In the Load Specimen window, when you select a procedure that has run against the current MPT specimen, you can use the Restore procedure state to control to reset or restore the procedure state.
One or more of the following options are available:
• Reset—restores the selected procedure to its starting state, with counters reset to zero.
• Saved state: Done—restores the procedure in its done state, and includes a record of counter values as they were when the test was complete.
• Saved state: In progress—restores the procedure back to the point the test was stopped, and includes a record of the test’s counter values, hydraulic status, and so on, at that time. This is the appropriate selection if you wish to recover a test; that is, you have selected the snapshot procedure and wish to resume the test at, or close to, the point it was interrupted.
• Saved state: Error—brings the procedure back to the point at which it was stopped by an error condition (there may be a corresponding entry in the .log file that reveals more information).
…you will have the option of restoring it to its last available runtime state.
If you select aprocedure that has
been run…

Loading MPT Specimens
Model 793.10 MultiPurpose TestWare
Working w
ith MPT Specim
ens
Working with MPT Specimens 85
MPT Specimen Loading Examples
The following examples are provided to help you choose the right procedure when you load an existing MPT specimen on the MPT control panel.
The following scenarios are shown:
• “Procedure Has Not Been Run Against the MPT Specimen” on page 86
• “Procedure Has Been Run Against the MPT Specimen” on page 87
• “Procedure Has Been Run Against the MPT Specimen, and the MPT Specimen Relinked to Another Procedure” on page 89
• “Procedure Has Been Run Against the MPT Specimen, Modified, and Saved” on page 91
• “Procedure Has Been Modified and Run Against the MPT Specimen Without Being Saved” on page 93
• “Procedure Has Been Modified, Run Against the MPT Specimen, and Saved” on page 95
The windows shown for these scenarios do not show all possible combinations; the windows that MPT displays for you will depend on your situation.
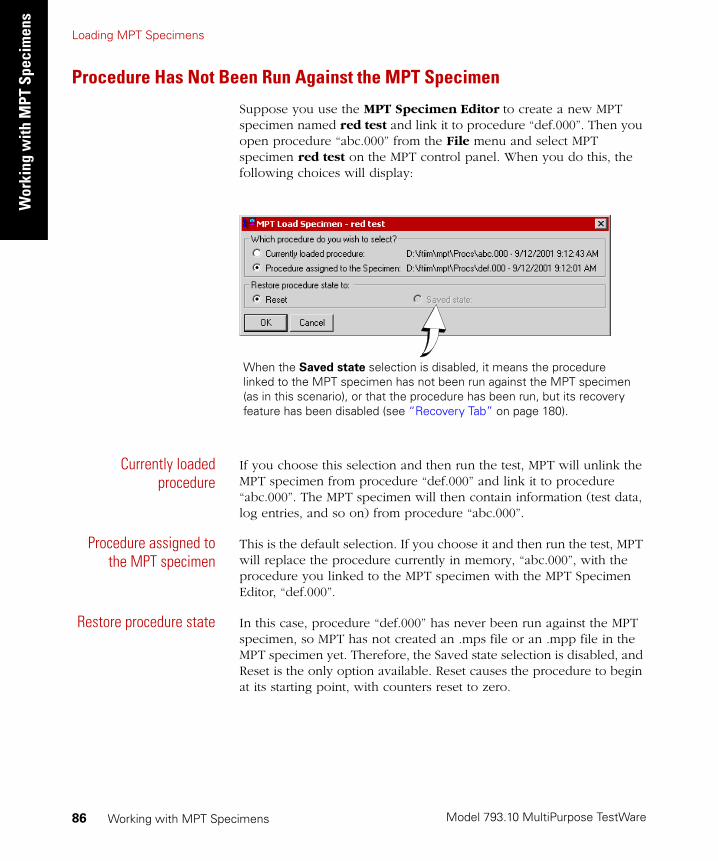
Model 793.10 MultiPurpose TestWare
Loading MPT SpecimensW
orki
ng w
ith M
PT S
peci
men
s
Working with MPT Specimens86
Procedure Has Not Been Run Against the MPT Specimen
Suppose you use the MPT Specimen Editor to create a new MPT specimen named red test and link it to procedure “def.000”. Then you open procedure “abc.000” from the File menu and select MPT specimen red test on the MPT control panel. When you do this, the following choices will display:
Currently loadedprocedure
If you choose this selection and then run the test, MPT will unlink the MPT specimen from procedure “def.000” and link it to procedure “abc.000”. The MPT specimen will then contain information (test data, log entries, and so on) from procedure “abc.000”.
Procedure assigned tothe MPT specimen
This is the default selection. If you choose it and then run the test, MPT will replace the procedure currently in memory, “abc.000”, with the procedure you linked to the MPT specimen with the MPT Specimen Editor, “def.000”.
Restore procedure state In this case, procedure “def.000” has never been run against the MPT specimen, so MPT has not created an .mps file or an .mpp file in the MPT specimen yet. Therefore, the Saved state selection is disabled, and Reset is the only option available. Reset causes the procedure to begin at its starting point, with counters reset to zero.
When the Saved state selection is disabled, it means the procedure linked to the MPT specimen has not been run against the MPT specimen (as in this scenario), or that the procedure has been run, but its recovery feature has been disabled (see “Recovery Tab” on page 180).
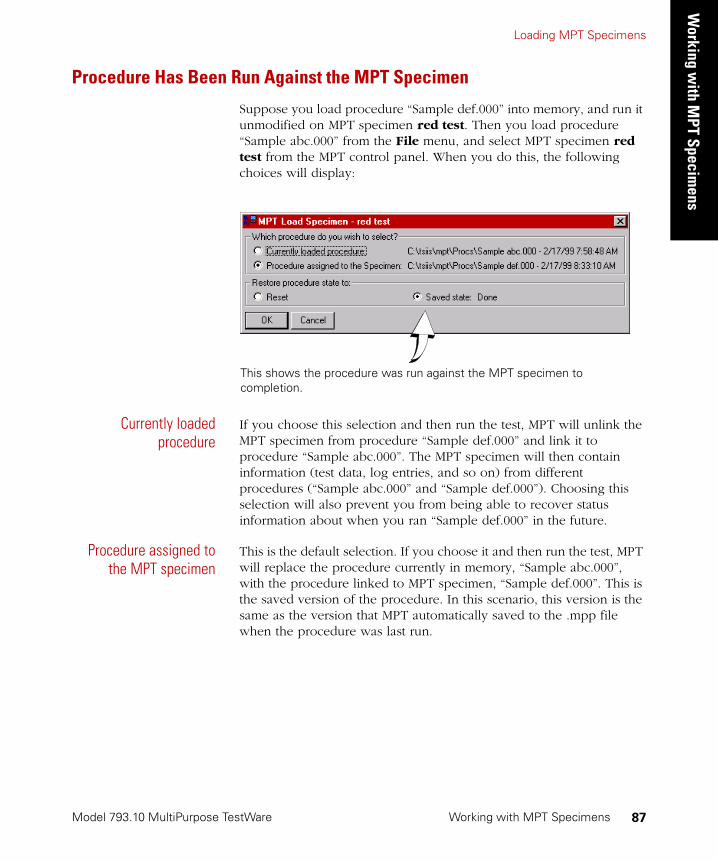
Loading MPT Specimens
Model 793.10 MultiPurpose TestWare
Working w
ith MPT Specim
ens
Working with MPT Specimens 87
Procedure Has Been Run Against the MPT Specimen
Suppose you load procedure “Sample def.000” into memory, and run it unmodified on MPT specimen red test. Then you load procedure “Sample abc.000” from the File menu, and select MPT specimen red test from the MPT control panel. When you do this, the following choices will display:
Currently loadedprocedure
If you choose this selection and then run the test, MPT will unlink the MPT specimen from procedure “Sample def.000” and link it to procedure “Sample abc.000”. The MPT specimen will then contain information (test data, log entries, and so on) from different procedures (“Sample abc.000” and “Sample def.000”). Choosing this selection will also prevent you from being able to recover status information about when you ran “Sample def.000” in the future.
Procedure assigned tothe MPT specimen
This is the default selection. If you choose it and then run the test, MPT will replace the procedure currently in memory, “Sample abc.000”, with the procedure linked to MPT specimen, “Sample def.000”. This is the saved version of the procedure. In this scenario, this version is the same as the version that MPT automatically saved to the .mpp file when the procedure was last run.
This shows the procedure was run against the MPT specimen to completion.

Model 793.10 MultiPurpose TestWare
Loading MPT SpecimensW
orki
ng w
ith M
PT S
peci
men
s
Working with MPT Specimens88
Restore procedurestate to
While the procedure “Sample def.000” was being run, MPT recorded the progress or state of the execution of the test at intervals defined in the Recovery tab of the Options Editor. MPT saves this information in the .mps file, where it is continually updated until the test is complete or in its Done state.
The Saved state selection in the Restore procedure state to box displays the last saved state stored in the .mps file. In this case the test ran to completion, so the last saved state is Done. Done brings the procedure back to its done state, and includes information such as counter values as they were when the test was complete; in contrast, Reset brings the procedure back to its starting point, with counters reset to zero.
Example Suppose that in this scenario the test was interrupted while it was being run. In this case the window shown would appear, which is the same as the previous window shown for this scenario, except the Saved state selection is In progress instead of Done.
The Saved state option lets you bring the test back to the state it was in when it was stopped.
If the test had been inadvertently interrupted and you wished to resume the test at (or close to) the point of interruption, you would choose this Saved state selection.
This shows the procedure was run against the MPT specimen, but was stopped before the test was complete. When a procedure is stopped in progress, MPT saves the state of the procedure when it was stopped in the .mps file (see “Specimen.mps” on page 79).
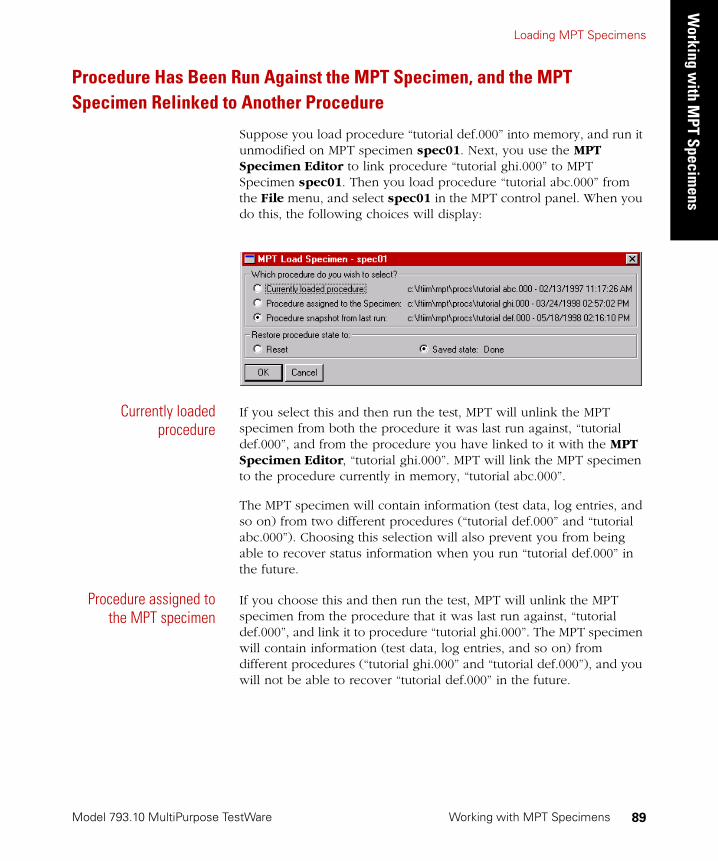
Loading MPT Specimens
Model 793.10 MultiPurpose TestWare
Working w
ith MPT Specim
ens
Working with MPT Specimens 89
Procedure Has Been Run Against the MPT Specimen, and the MPT Specimen Relinked to Another Procedure
Suppose you load procedure “tutorial def.000” into memory, and run it unmodified on MPT specimen spec01. Next, you use the MPT Specimen Editor to link procedure “tutorial ghi.000” to MPT Specimen spec01. Then you load procedure “tutorial abc.000” from the File menu, and select spec01 in the MPT control panel. When you do this, the following choices will display:
Currently loadedprocedure
If you select this and then run the test, MPT will unlink the MPT specimen from both the procedure it was last run against, “tutorial def.000”, and from the procedure you have linked to it with the MPT Specimen Editor, “tutorial ghi.000”. MPT will link the MPT specimen to the procedure currently in memory, “tutorial abc.000”.
The MPT specimen will contain information (test data, log entries, and so on) from two different procedures (“tutorial def.000” and “tutorial abc.000”). Choosing this selection will also prevent you from being able to recover status information when you run “tutorial def.000” in the future.
Procedure assigned tothe MPT specimen
If you choose this and then run the test, MPT will unlink the MPT specimen from the procedure that it was last run against, “tutorial def.000”, and link it to procedure “tutorial ghi.000”. The MPT specimen will contain information (test data, log entries, and so on) from different procedures (“tutorial ghi.000” and “tutorial def.000”), and you will not be able to recover “tutorial def.000” in the future.
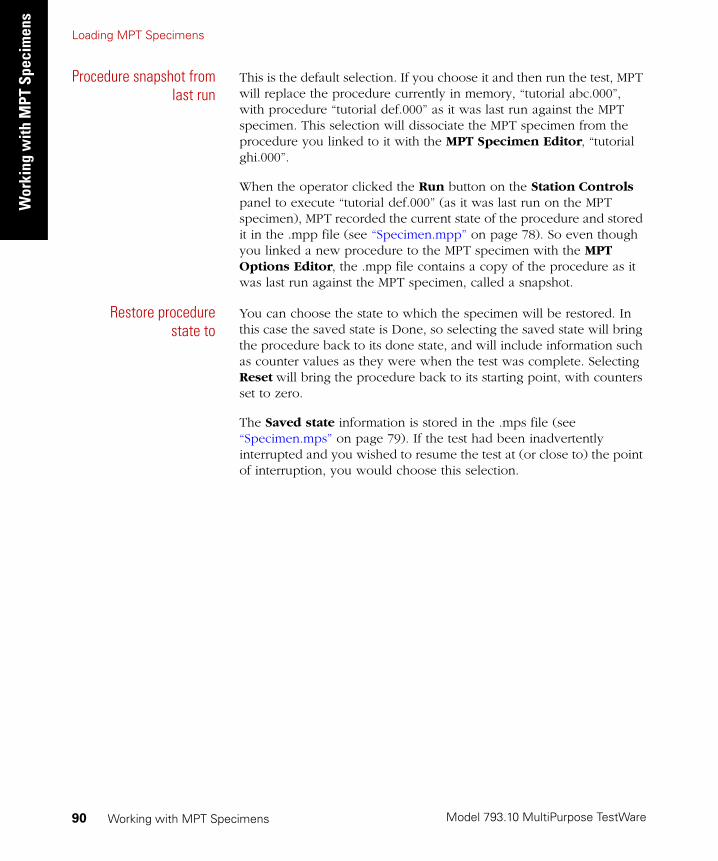
Model 793.10 MultiPurpose TestWare
Loading MPT SpecimensW
orki
ng w
ith M
PT S
peci
men
s
Working with MPT Specimens90
Procedure snapshot fromlast run
This is the default selection. If you choose it and then run the test, MPT will replace the procedure currently in memory, “tutorial abc.000”, with procedure “tutorial def.000” as it was last run against the MPT specimen. This selection will dissociate the MPT specimen from the procedure you linked to it with the MPT Specimen Editor, “tutorial ghi.000”.
When the operator clicked the Run button on the Station Controls panel to execute “tutorial def.000” (as it was last run on the MPT specimen), MPT recorded the current state of the procedure and stored it in the .mpp file (see “Specimen.mpp” on page 78). So even though you linked a new procedure to the MPT specimen with the MPT Options Editor, the .mpp file contains a copy of the procedure as it was last run against the MPT specimen, called a snapshot.
Restore procedurestate to
You can choose the state to which the specimen will be restored. In this case the saved state is Done, so selecting the saved state will bring the procedure back to its done state, and will include information such as counter values as they were when the test was complete. Selecting Reset will bring the procedure back to its starting point, with counters set to zero.
The Saved state information is stored in the .mps file (see “Specimen.mps” on page 79). If the test had been inadvertently interrupted and you wished to resume the test at (or close to) the point of interruption, you would choose this selection.
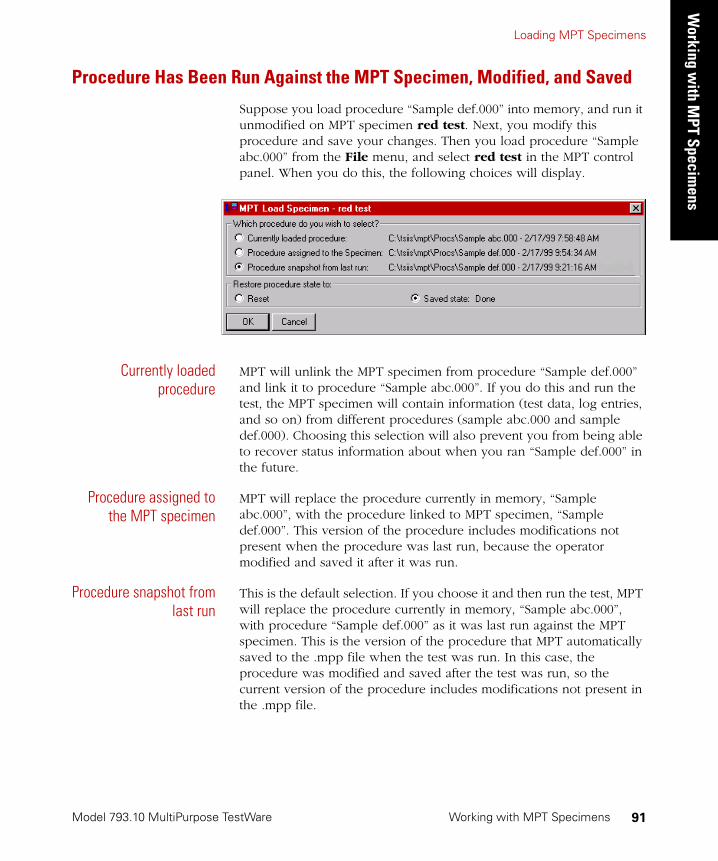
Loading MPT Specimens
Model 793.10 MultiPurpose TestWare
Working w
ith MPT Specim
ens
Working with MPT Specimens 91
Procedure Has Been Run Against the MPT Specimen, Modified, and Saved
Suppose you load procedure “Sample def.000” into memory, and run it unmodified on MPT specimen red test. Next, you modify this procedure and save your changes. Then you load procedure “Sample abc.000” from the File menu, and select red test in the MPT control panel. When you do this, the following choices will display.
Currently loadedprocedure
MPT will unlink the MPT specimen from procedure “Sample def.000” and link it to procedure “Sample abc.000”. If you do this and run the test, the MPT specimen will contain information (test data, log entries, and so on) from different procedures (sample abc.000 and sample def.000). Choosing this selection will also prevent you from being able to recover status information about when you ran “Sample def.000” in the future.
Procedure assigned tothe MPT specimen
MPT will replace the procedure currently in memory, “Sample abc.000”, with the procedure linked to MPT specimen, “Sample def.000”. This version of the procedure includes modifications not present when the procedure was last run, because the operator modified and saved it after it was run.
Procedure snapshot fromlast run
This is the default selection. If you choose it and then run the test, MPT will replace the procedure currently in memory, “Sample abc.000”, with procedure “Sample def.000” as it was last run against the MPT specimen. This is the version of the procedure that MPT automatically saved to the .mpp file when the test was run. In this case, the procedure was modified and saved after the test was run, so the current version of the procedure includes modifications not present in the .mpp file.

Model 793.10 MultiPurpose TestWare
Loading MPT SpecimensW
orki
ng w
ith M
PT S
peci
men
s
Working with MPT Specimens92
Restore procedurestate to
Since the MPT specimen was last run against the modified version of “Sample def.000”, you can choose the state to which it will be restored. In this case the saved state is Done, so selecting the saved state will bring the procedure back to its done state, and will include information such as counter values as they were when the test was complete. Selecting Reset will bring the procedure back to its starting point, with counters set to zero.
The Saved state information is stored in the .mps file (see “Specimen.mps” on page 79). If the test had been inadvertently interrupted and you wished to resume the test at (or close to) the point of interruption, you would choose this selection.
In this scenario, if you select the Procedure assigned to the Specimen and select the Restore procedure state to: Saved State options, then the runtime state will be restored to a different procedure than the one that was running when it was saved.
If changes to the procedure included adding, removing, or renaming processes, however, the runtime state may not restore completely, and a warning message will be displayed.

Loading MPT Specimens
Model 793.10 MultiPurpose TestWare
Working w
ith MPT Specim
ens
Working with MPT Specimens 93
Procedure Has Been Modified and Run Against the MPT Specimen Without Being Saved
Suppose you load procedure “Sample def.000” into memory, modify it without saving your changes, and then run it against MPT specimen red test. Next, you load procedure “Sample abc.000” from the File menu, and select red test in the MPT control panel. When you do this, the following choices will display:
Currently loadedprocedure
MPT will unlink the MPT specimen from procedure sample def.000 and link it to procedure “Sample abc.000”. If you do this and run the test, the MPT specimen will contain information (test data, log entries, and so on) from different procedures (“Sample abc.000” and “Sample def.000”). Choosing this selection will also prevent you from being able to recover status information about when you ran “Sample def.000” in the future.
Procedure assigned tothe MPT specimen
MPT will replace the procedure currently in memory, “Sample abc.000”, with the procedure linked to MPT specimen, “Sample def.000”.This version of procedure “Sample def.000” will not include the modifications present when it was last run against the MPT specimen. It is the version last saved by the operator.
The ”modified” flag means the procedure was modified but not saved by the operator when run against the MPT specimen. MPT automatically saves the modified version in the .mpp file when the operator presses the Run button on the Station Controls panel. This selection lets you retrieve the modified version of the procedure as it was run against the MPT specimen.
Note The time stamp is the same for both “Sample def.000” selections because it reflects the most current version of the procedure saved by the operator. However, if you choose the snapshot version, MPT will retrieve the modified version of the procedure that MPT automatically saved to the .mpp file when the last test was run. This version is different from the version last saved by the operator.
Model 793.10 MultiPurpose TestWare
Loading MPT SpecimensW
orki
ng w
ith M
PT S
peci
men
s
Working with MPT Specimens94
Procedure snapshot fromlast run
This is the default selection. If you choose it and then run the test, MPT will replace the procedure currently in memory, “Sample abc.000”, with the procedure “Sample def.000” as it was last run against the MPT specimen.
This version of procedure “Sample def.000” includes the modifications present when it was last run against the MPT specimen. MPT automatically saved a copy of the modified procedure to the .mpp file (see “Specimen.mpp” on page 78) when the test was last run.
The “modified” flag means MPT noted a difference between the version of the procedure saved by the operator and the version that MPT saved to the .mpp file when the test was run.
Restore procedurestate to
Since the MPT specimen was last run against the modified version of “Sample def.000”, you can choose the state to which it will be restored. In this case the saved state is Done, so selecting the saved state will bring the procedure back to its done state, which will include information such as counter values as they were when the test was complete. Clicking Reset will bring the procedure back to its starting point, with counters set to zero.
The Saved state information is stored in the .mps file (see “Specimen.mps” on page 79). If the test had been inadvertently interrupted and you wanted to resume the test at (or close to) the point of interruption, you would choose this selection.
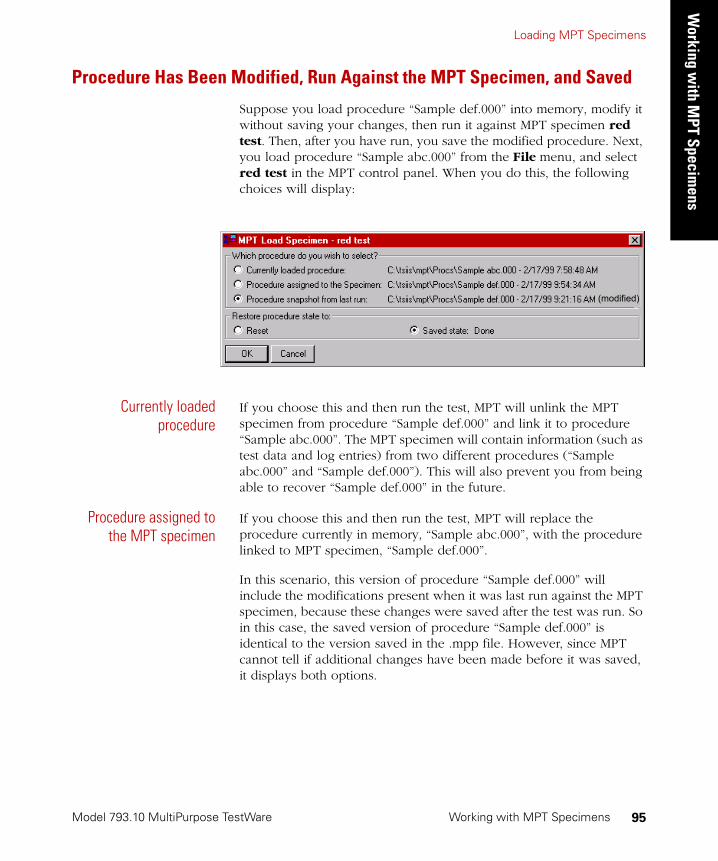
Loading MPT Specimens
Model 793.10 MultiPurpose TestWare
Working w
ith MPT Specim
ens
Working with MPT Specimens 95
Procedure Has Been Modified, Run Against the MPT Specimen, and Saved
Suppose you load procedure “Sample def.000” into memory, modify it without saving your changes, then run it against MPT specimen red test. Then, after you have run, you save the modified procedure. Next, you load procedure “Sample abc.000” from the File menu, and select red test in the MPT control panel. When you do this, the following choices will display:
Currently loadedprocedure
If you choose this and then run the test, MPT will unlink the MPT specimen from procedure “Sample def.000” and link it to procedure “Sample abc.000”. The MPT specimen will contain information (such as test data and log entries) from two different procedures (“Sample abc.000” and “Sample def.000”). This will also prevent you from being able to recover “Sample def.000” in the future.
Procedure assigned tothe MPT specimen
If you choose this and then run the test, MPT will replace the procedure currently in memory, “Sample abc.000”, with the procedure linked to MPT specimen, “Sample def.000”.
In this scenario, this version of procedure “Sample def.000” will include the modifications present when it was last run against the MPT specimen, because these changes were saved after the test was run. So in this case, the saved version of procedure “Sample def.000” is identical to the version saved in the .mpp file. However, since MPT cannot tell if additional changes have been made before it was saved, it displays both options.
(modified)
Model 793.10 MultiPurpose TestWare
Loading MPT SpecimensW
orki
ng w
ith M
PT S
peci
men
s
Working with MPT Specimens96
Procedure snapshot fromlast run
This is the default selection. MPT will replace the procedure currently in memory, “Sample abc.000”, with procedure “Sample def.000” as it was last run against the MPT specimen.
This version of procedure “Sample def.000” includes the modifications present when it was last run against the MPT specimen. A copy of the modified procedure was automatically saved to the .mpp file (see page 78) when the test was last run.
The “modified” flag means MPT noted a difference between the version of the procedure saved by the operator and the version MPT saved to the .mpp file when the test was run. In this case, even though the modified flag is present, both versions are identical because the modified version was saved by the operator after the test was run.
Restore procedurestate to
Since the MPT specimen was last run against the snapshot version of “Sample def.000”, you can choose the state to which it will be restored. In this case the saved state is Done, so selecting the saved state will bring the procedure back to its done state, which will include information such as counter values as they were when the test was complete. Clicking Reset will bring the procedure back to its starting point, with counters set to zero.
The Saved state information is stored in the .mps file (see “Specimen.mps” on page 79). If the test had been inadvertently interrupted and you wished to resume the test at (or close to) the point of interruption, you would choose this selection.
Model 793.10 MultiPurpose TestWare
Working w
ith Processes
Working with Processes 97
Chapter 4
Working with Processes
About MPT Processes
Adding Processes to the Procedure Table 99
Selecting Processes in Procedure Tables 101
Deleting a Process from the Procedure Window 102
Cutting, Copying, and Pasting Processes 103
Sequencing Processes 104
Sequencing Group Processes 116
Disabling Processes 122

Model 793.10 MultiPurpose TestWare
Wor
king
with
Pro
cess
es
Working with Processes98
About MPT Processes
When you create tests with the MPT application, you use MPT processes like building blocks to define test actions such as sending command signals, performing data acquisition, and responding to test events.
A complete MPT test normally consists of a number of MPT processes linked together and saved as an MPT procedure.
Process Palette Your MPT process icons are displayed on the Process Palette.
Process categories Processes are grouped on the palette in the following categories:
• Command Processes send commands to a servovalve or external controller.
• Data Acquisition Processes acquire sensor data from the physical specimen.
• Event Processes monitor test signals and perform actions when specified conditions are met.
• External Control Processes control external controllers or logic devices.
• Other Processes perform miscellaneous functions.

Model 793.10 MultiPurpose TestWare
Working w
ith Processes
Working with Processes 99
Adding Processes to the Procedure Table
The first and most basic step you must perform to create a test procedure is to add processes to your procedure table.
There are two ways to add a process to the procedure table:
1. Click the process icon on the Process Palette, and then click Add Process on the Edit menu of the MPT Procedure Editor.
2. Drag the process icon from the Process Palette to your procedure and group tables.
Empty procedure table
Procedure tablewith processes
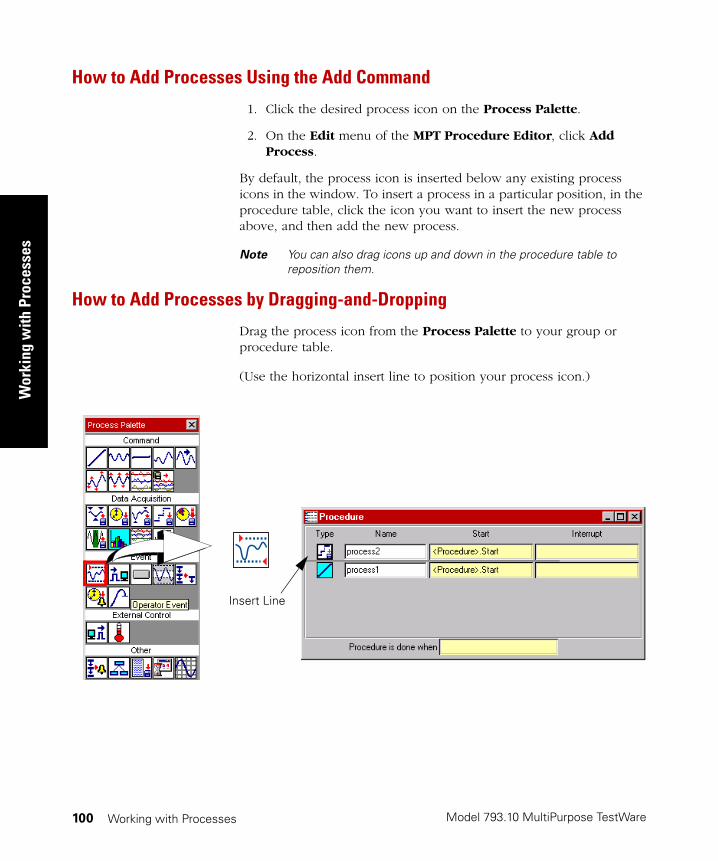
Model 793.10 MultiPurpose TestWare
Wor
king
with
Pro
cess
es
Working with Processes100
How to Add Processes Using the Add Command
1. Click the desired process icon on the Process Palette.
2. On the Edit menu of the MPT Procedure Editor, click Add Process.
By default, the process icon is inserted below any existing process icons in the window. To insert a process in a particular position, in the procedure table, click the icon you want to insert the new process above, and then add the new process.
Note You can also drag icons up and down in the procedure table to reposition them.
How to Add Processes by Dragging-and-Dropping
Drag the process icon from the Process Palette to your group or procedure table.
(Use the horizontal insert line to position your process icon.)
Insert Line
Model 793.10 MultiPurpose TestWare
Working w
ith Processes
Working with Processes 101
Selecting Processes in Procedure Tables
You may want to select process icons in your procedure table to copy or delete them. You can select process icons the same way you would select files in Windows® operating system software.
How to Select Process Icons
To select a process icon in your procedure table, click it.
Note The icon will appear highlighted when selected.
To select a number of individual process icons, hold down the Ctrl key, and then click each icon you want to select.
To select a group of process icons that are next to each other in the procedure table, click the first process icon, hold down the Shift key, then click the last process icon in the desired range.

Model 793.10 MultiPurpose TestWare
Wor
king
with
Pro
cess
es
Working with Processes102
Deleting a Process from the Procedure Window
You can delete processes from your procedure table several ways:
In the procedure table, click the process icon or icons you desire to delete to highlight them, and perform one of the following:
1. Click on the MPT Procedure Editor toolbar.
2. On the Edit menu, click Delete Process.
3. Drag the process icon or icons to the trash can located on the upper right hand corner of the MPT Procedure Editor.
4. Click the right-mouse button and select Delete from the menu.
Important You cannot undo a delete operation.
Model 793.10 MultiPurpose TestWare
Working w
ith Processes
Working with Processes 103
Cutting, Copying, and Pasting Processes
You can cut, copy, and paste processes on the same procedure table, or from one procedure table to another.
Note When you copy a process icon, or a group of process icons, the parameters of the original processes are retained, but the sequencing information may not be. You may have to reassign Start and Interrupt signals.
How to Cut/Copy, and Paste a Process or Group of Processes
1. Select the process or processes you want to copy and paste.
2. On the Edit menu, click Copy Process or Cut Process.
3. Open the procedure table where you want to place the copied processes.
4. Select the process before which you want to paste the processes on the clipboard.
5. On the Edit menu, click Paste Process.
How to Quick Copy and Paste Selected Processes in the Same Window
1. Click the process or processes you want to copy.
2. Press and hold the Ctrl key, and then drag the selected processes. Use the insert line to paste the copied process in the desired position.
Note To copy and paste processes between tables in separate MPT applications, you must use the Copy Process and Paste Process commands on the Edit menu. Dragging and dropping processes does not work in this situation.

Model 793.10 MultiPurpose TestWare
Wor
king
with
Pro
cess
es
Working with Processes104
Sequencing Processes
Processes in your MPT procedure must be linked together so that they start and stop at the proper times.
In your procedure or group table:
• Use the Start control to determine when each process starts.
• Use the Interrupt control if you want to specify a test event that will interrupt the process.
• Use the Procedure (or Group) is done when control to determine when the procedure ends.
Procedure start andinterrupt signals
All signal lists in your main procedure table include the <Procedure>.Start and <Procedure>.Interrupt signals.
If you set the Start or Interrupt control to <Procedure>.Start, the process will start or interrupt when the procedure starts.
Note In group tables, the controls are labeled <Group>.Start and <Group>.Interrupt, and they pertain to the start and interrupt of that particular Group process. See “Sequencing Group Processes” on page 116.
Done signals When an individual process ends, it generates a “done” signal. These done signals are labeled process name.Done in your Start, Interrupt, and Procedure is done when lists.
For example, if you created a segment command process named Ramp Up, the done signal that appears in your signal lists would be labeled Ramp Up.Done.
Each process automatically generates a done signal when the process completes its programmed function, or when it is interrupted by another signal. Process done signals are typically used to specify the start of another process and/or the end of your procedure.
Model 793.10 MultiPurpose TestWare
Working w
ith Processes
Working with Processes 105
Special processsignals
In addition to done signals, some data acquisition processes can also send out a “buffer full” signal (indicating when the data buffer is full), and some event processes can send out a “trigger” signal (indicating when the process is triggered).
A buffer full signal or trigger can also be used to specify the start of another process, the end of the test, or to interrupt other processes.
Fan-in and fan-outprocesses
You can select more than one signal in each Start, Interrupt, and Procedure is done when list to create a “fan-in” process. The process (or procedure) will respond if any of the selected signals is detected.
Conversely, you can use the <Procedure.Start>, or a single done, buffer full, or trigger signal to start, interrupt, or end several other processes. This is referred to as a “fan-out” process.
Note There is a slight time delay between processes that start with a common trigger signal (for example, two processes using the <Procedure.Start> trigger signal). The process positioned the highest on the Procedure or Group table starts first. When using data acquisition and command processes in parallel, position the data acquisition process higher on the table than the associated command process.
Ending a procedure The procedure table has a Procedure is done when control located at the bottom of the window.
If you specify a signal in this list, when the specified signal is received, all active processes in this window will be interrupted and the procedure will end. You can use this control to ensure that your procedure ends properly.
Note For information on ending a Group process, see “Ending a group process” on page 116.
If you leave this control blank, the procedure will stop when all of its child processes are done.

Model 793.10 MultiPurpose TestWare
Wor
king
with
Pro
cess
es
Working with Processes106
More About Buffer Full Signals
Some acquisition processes can generate buffer full signals when the data buffer fills. These buffer full signals are labeled process name.Buffer Full in your Start, Interrupt, and Procedure is done when lists.
For example, if you created a timed acquisition process named Acquire Time Data, the buffer full signal that appears in your signal lists would be labeled Acquire Time Data.Buffer Full.
Note You define the size of the buffer on the Destination tab of the acquisition process’ Parameters window.
Cyclic acquisition processes can generate buffer full signals when data has been acquired for the number of cycles or segments specified on the Data Storage tab in the Cyclic Acquisition Parameters window.
When buffer fullsignals are sent
If you do not specify the number of samples to acquire for the acquisition process, the process will continuously sample and generate a buffer full signal every time the buffer fills, until the process ends.
If you specify the number of samples to acquire, the process will send a buffer full signal every time the buffer fills until the requested number of samples are acquired.
Special uses You can use a data acquisition buffer full signal to start and interrupt other processes in your test.
For example, if you configure your data acquisition process to discard data when the buffer fills (instead of saving it), the acquisition process can continuously send buffer full signals to other processes without using up disk space.

Model 793.10 MultiPurpose TestWare
Working w
ith Processes
Working with Processes 107
More About Trigger Signals
Some processes can generate trigger signals when they detect the specified event. These trigger signals are labeled process name.Trigger in your Start, Interrupt, and Procedure is done when lists.
For example, if you created a digital input process named Input Monitor, the trigger signal that appears in your signal lists would be labeled Input Monitor.Trigger.
When trigger signalsare sent
You can configure these processes to trigger once or to trigger continuously. When a process is set to trigger once, it will generate a trigger when the specified condition is met, and then it will generate a done signal. When a process is set to trigger continuously, it will continue to send triggers each time the specified condition is met, and it will not generate a done signal.
Note If you set up a process to trigger continuously, the process will not generate a done signal until it is interrupted. You should specify an “Interrupt” signal or a “Procedure/Group is done when” signal to end a continuously triggered process.
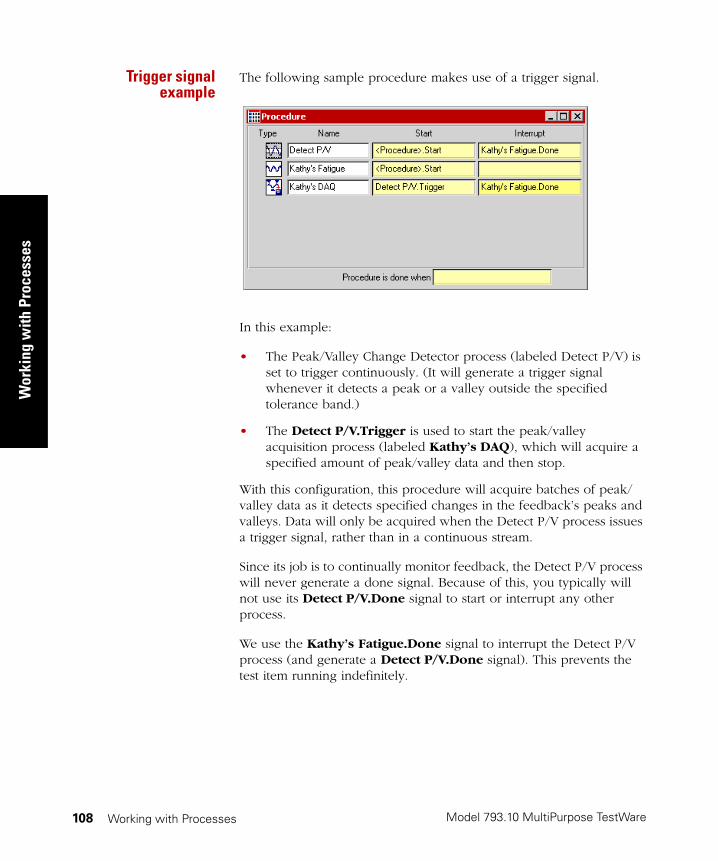
Model 793.10 MultiPurpose TestWare
Wor
king
with
Pro
cess
es
Working with Processes108
Trigger signalexample
The following sample procedure makes use of a trigger signal.
In this example:
• The Peak/Valley Change Detector process (labeled Detect P/V) is set to trigger continuously. (It will generate a trigger signal whenever it detects a peak or a valley outside the specified tolerance band.)
• The Detect P/V.Trigger is used to start the peak/valley acquisition process (labeled Kathy’s DAQ), which will acquire a specified amount of peak/valley data and then stop.
With this configuration, this procedure will acquire batches of peak/valley data as it detects specified changes in the feedback’s peaks and valleys. Data will only be acquired when the Detect P/V process issues a trigger signal, rather than in a continuous stream.
Since its job is to continually monitor feedback, the Detect P/V process will never generate a done signal. Because of this, you typically will not use its Detect P/V.Done signal to start or interrupt any other process.
We use the Kathy’s Fatigue.Done signal to interrupt the Detect P/V process (and generate a Detect P/V.Done signal). This prevents the test item running indefinitely.
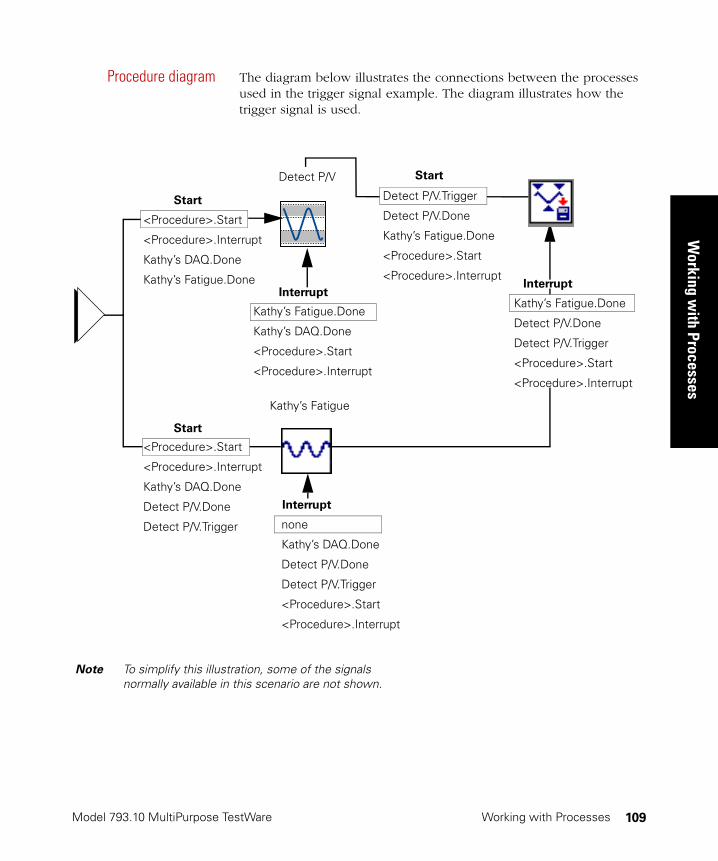
Model 793.10 MultiPurpose TestWare
Working w
ith Processes
Working with Processes 109
Procedure diagram The diagram below illustrates the connections between the processes used in the trigger signal example. The diagram illustrates how the trigger signal is used.
Start
Start
Interrupt
none
Kathy’s DAQ.Done
Detect P/V.Done
Detect P/V.Trigger
<Procedure>.Start
<Procedure>.Interrupt
Interrupt
<Procedure>.Start
<Procedure>.Interrupt
Kathy’s DAQ.Done
Kathy’s Fatigue.Done
Kathy’s Fatigue.Done
Kathy’s DAQ.Done
<Procedure>.Start
<Procedure>.Interrupt
Start
Kathy’s Fatigue
Interrupt
Detect P/V
<Procedure>.Start
<Procedure>.Interrupt
Kathy’s DAQ.Done
Detect P/V.Done
Detect P/V.Trigger
Detect P/V.Trigger
Detect P/V.Done
Kathy’s Fatigue.Done
<Procedure>.Start
<Procedure>.Interrupt
Kathy’s Fatigue.Done
Detect P/V.Done
Detect P/V.Trigger
<Procedure>.Start
<Procedure>.Interrupt
Note To simplify this illustration, some of the signals normally available in this scenario are not shown.
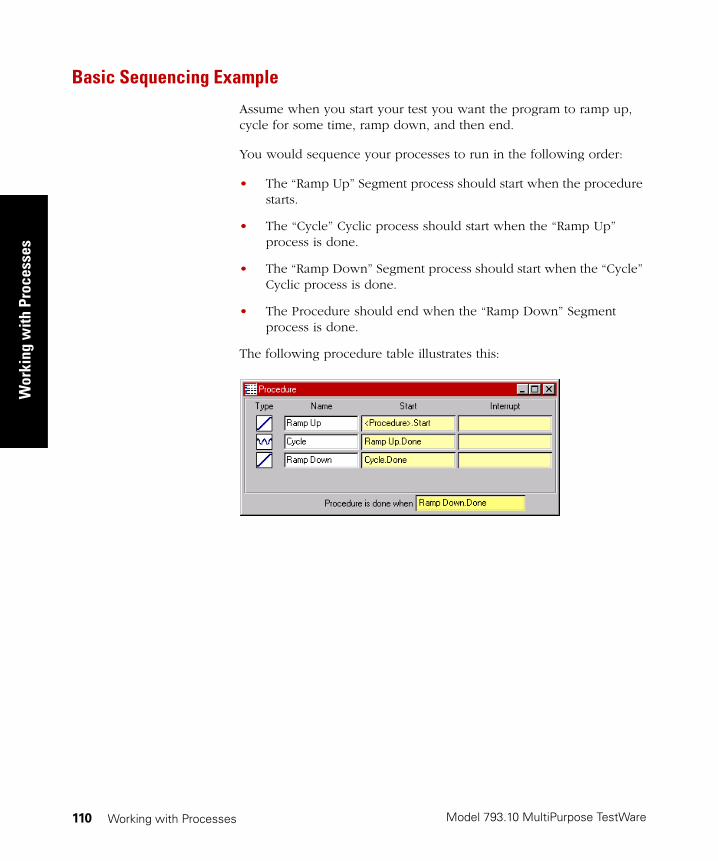
Model 793.10 MultiPurpose TestWare
Wor
king
with
Pro
cess
es
Working with Processes110
Basic Sequencing Example
Assume when you start your test you want the program to ramp up, cycle for some time, ramp down, and then end.
You would sequence your processes to run in the following order:
• The “Ramp Up” Segment process should start when the procedure starts.
• The “Cycle” Cyclic process should start when the “Ramp Up” process is done.
• The “Ramp Down” Segment process should start when the “Cycle” Cyclic process is done.
• The Procedure should end when the “Ramp Down” Segment process is done.
The following procedure table illustrates this:
Model 793.10 MultiPurpose TestWare
Working w
ith Processes
Working with Processes 111
How to Edit Sequencing Trigger Signals
Procedure and group tables that are populated with processes contain three areas where you can edit trigger signals:
• The Start box
• The Interrupt box
• The Procedure (or Group) is done when box.
MPT selects default trigger signals for the Start box. The Interrupt and Procedure (or Group) is done when boxes are blank by default.
To display a triggerlist
Even if it is blank, each box contains a hidden trigger signal list. To display the list, double-click the box.
To select a trigger andhide the list
When the trigger signal list is displayed, you can select any individual trigger signal in the list by double-clicking it. This will replace whatever the box had in it before with the current selection, and then close the list.
Note You can also select a trigger signal (and hide the list) by highlighting the trigger signal in the list and pressing Enter.
To remove a triggerand hide the list
To remove the current trigger signal from a box, double-click the box to display the boxes’ trigger signal list, then double-click the same trigger signal in the list. This will clear the box and hide the list.
To select multipletrigger signals in a
list
To select multiple trigger signals in a list, you can hold down the Shift key to select a range of trigger signals, or hold down the Ctrl key to select a trigger signals arbitrarily. When you select multiple signals, the process will perform the action (start the process, interrupt the process, end the procedure or group) when any of the selected signals is received.
Model 793.10 MultiPurpose TestWare
Wor
king
with
Pro
cess
es
Working with Processes112
How to Set/Edit the Interrupt Signal
1. To specify the interrupt signal(s), double-click the Interrupt list box to display the signal list.
2. In the signal list, hold the Ctrl key and click each signal you want to interrupt the procedure. (If you select multiple signals, the procedure will interrupt when any of the selected signals is received.)
3. Press Enter.
If you want to clear your interrupt signal selections:
1. Double-click the signal name to display the signal list.
2. In the signal list, hold the Ctrl key and click each signal you want to remove from the list.
3. Press Enter.
Note You can deselect all of the signals highlighted and exit the list by double-clicking any of the individual selections highlighted in the list.
Model 793.10 MultiPurpose TestWare
Working w
ith Processes
Working with Processes 113
How to Specify/Change the Procedure Done Signal
1. To specify the procedure done signal(s), double-click the Procedure is done when box to display the signal list.
2. In the signal list, hold the Ctrl key and click each signal you want to end the procedure. (If you select multiple signals, the procedure will end when any of the selected signals are received.)
3. Press Enter.
If you want to clear your procedure done signal selections:
1. Double-click the signal name to display the signal list.
2. In the signal list, hold the Ctrl key and click each signal you want to remove from the list.
3. Press Enter.
Note You can deselect all of the signals highlighted and exit the list by double-clicking any of the individual selections highlighted in the list.
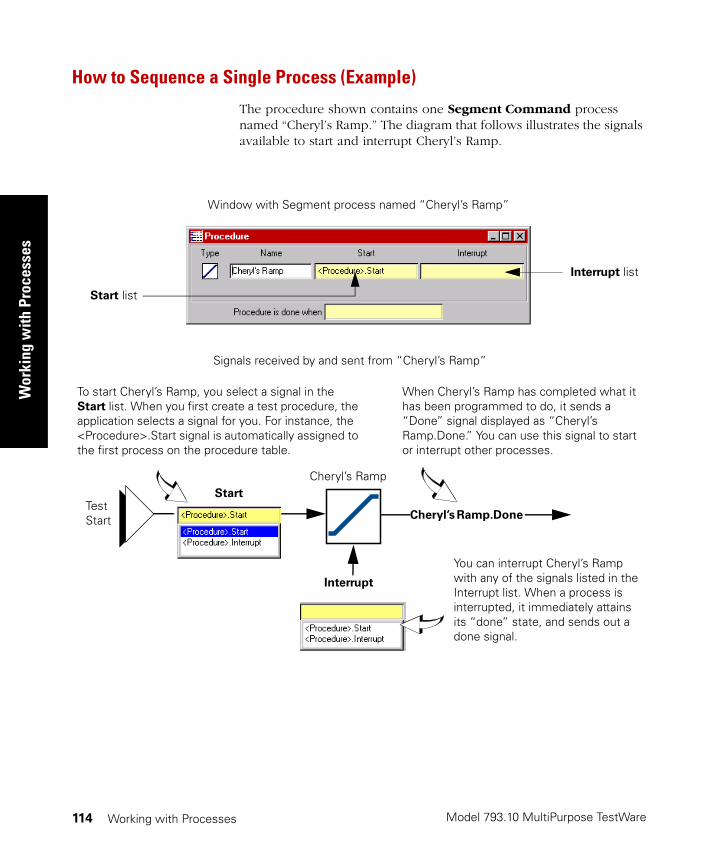
Model 793.10 MultiPurpose TestWare
Wor
king
with
Pro
cess
es
Working with Processes114
How to Sequence a Single Process (Example)
The procedure shown contains one Segment Command process named “Cheryl’s Ramp.” The diagram that follows illustrates the signals available to start and interrupt Cheryl’s Ramp.
To start Cheryl’s Ramp, you select a signal in the Start list. When you first create a test procedure, the application selects a signal for you. For instance, the <Procedure>.Start signal is automatically assigned to the first process on the procedure table.
Start
When Cheryl’s Ramp has completed what it has been programmed to do, it sends a “Done” signal displayed as “Cheryl’s Ramp.Done.” You can use this signal to start or interrupt other processes.
You can interrupt Cheryl’s Ramp with any of the signals listed in the Interrupt list. When a process is interrupted, it immediately attains its “done” state, and sends out a done signal.
Window with Segment process named “Cheryl’s Ramp”
Cheryl’s Ramp
Signals received by and sent from “Cheryl’s Ramp”
Test Start
Start list
Interrupt list
Cheryl’s Ramp.Done
Interrupt
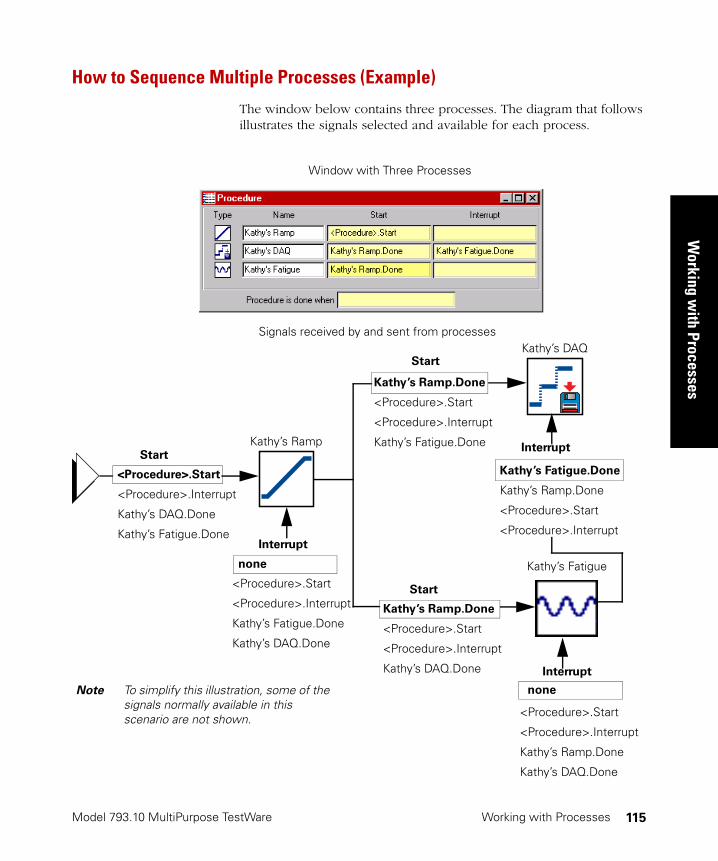
Model 793.10 MultiPurpose TestWare
Working w
ith Processes
Working with Processes 115
How to Sequence Multiple Processes (Example)
The window below contains three processes. The diagram that follows illustrates the signals selected and available for each process.
Interrupt
<Procedure>.Start
<Procedure>.Interrupt
Kathy’s Ramp.Done
Kathy’s DAQ.Done
none
<Procedure>.Start
<Procedure>.Interrupt
Kathy’s Fatigue.Done
Kathy’s DAQ.Done
Start
Interrupt
Kathy’s Ramp
<Procedure>.Start
<Procedure>.Interrupt
Kathy’s DAQ.Done
Kathy’s Fatigue.Done
Start
Kathy’s Fatigue.Done
Kathy’s Ramp.Done
<Procedure>.Start
<Procedure>.Interrupt
Interrupt
Start
Kathy’s Ramp.Done
<Procedure>.Start
<Procedure>.Interrupt
Kathy’s Fatigue.Done
Kathy’s DAQ
Window with Three Processes
Signals received by and sent from processes
Kathy’s Fatiguenone
Kathy’s Ramp.Done
<Procedure>.Start
<Procedure>.Interrupt
Kathy’s DAQ.Done
Note To simplify this illustration, some of the signals normally available in this scenario are not shown.
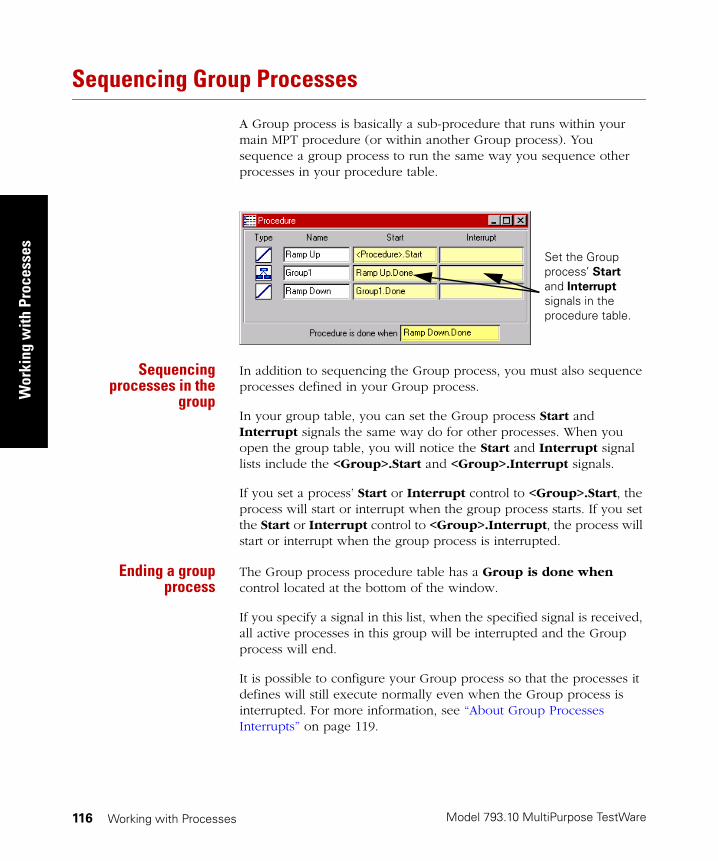
Model 793.10 MultiPurpose TestWare
Wor
king
with
Pro
cess
es
Working with Processes116
Sequencing Group Processes
A Group process is basically a sub-procedure that runs within your main MPT procedure (or within another Group process). You sequence a group process to run the same way you sequence other processes in your procedure table.
Sequencingprocesses in the
group
In addition to sequencing the Group process, you must also sequence processes defined in your Group process.
In your group table, you can set the Group process Start and Interrupt signals the same way do for other processes. When you open the group table, you will notice the Start and Interrupt signal lists include the <Group>.Start and <Group>.Interrupt signals.
If you set a process’ Start or Interrupt control to <Group>.Start, the process will start or interrupt when the group process starts. If you set the Start or Interrupt control to <Group>.Interrupt, the process will start or interrupt when the group process is interrupted.
Ending a groupprocess
The Group process procedure table has a Group is done when control located at the bottom of the window.
If you specify a signal in this list, when the specified signal is received, all active processes in this group will be interrupted and the Group process will end.
It is possible to configure your Group process so that the processes it defines will still execute normally even when the Group process is interrupted. For more information, see “About Group Processes Interrupts” on page 119.
Set the Group process’ Start and Interrupt signals in the procedure table.
Model 793.10 MultiPurpose TestWare
Working w
ith Processes
Working with Processes 117
How to Open the Group Table
Method 1: Click the Group process icon in your procedure table, then
click on the MPT toolbar.
Method 2: Right-click on the Group process icon and select Open Table from the menu.
To return to the previous procedure (or group) table, click
About Group Process Naming Conventions
You can add a Group process to the main procedure table or to another Group processes (making a group within a group).
The title bar of the Group process window displays where the group is relative to the main procedure table.
• For example, if your main procedure contains a group process, the group process title bar would read—Procedure/Group Name.
• If your group contained another group, the title bar for the second group process would read—Procedure/Group Name/Group Name.
This is an example of how the naming conventions work:
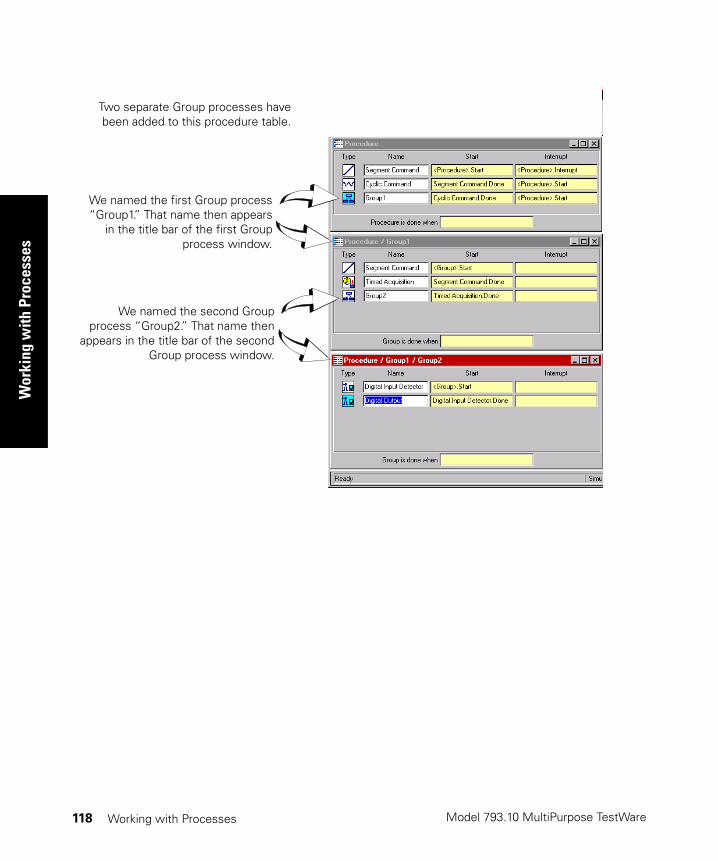
Model 793.10 MultiPurpose TestWare
Wor
king
with
Pro
cess
es
Working with Processes118
We named the first Group process“Group1.” That name then appears
in the title bar of the first Groupprocess window.
We named the second Groupprocess “Group2.” That name then
appears in the title bar of the secondGroup process window.
Two separate Group processes havebeen added to this procedure table.
Model 793.10 MultiPurpose TestWare
Working w
ith Processes
Working with Processes 119
About Group Processes Interrupts
Normal interrupt Group processes have an interrupt terminal. By default, all of the processes inside a Group process are interrupted when the Group process is interrupted, and the Group process generates a done signal immediately. You can change this behavior by creating a user defined interrupt.
User defined interrupt You can connect the interrupt terminal of a Group process to the start or interrupt terminals of any of the processes inside the Group process. When you do this, you are creating a user defined interrupt.
When you create a user defined interrupt, only the active processes inside of the Group process that are connected to the Group process’ interrupt terminal are affected when an interrupt occurs. The other processes in the Group process are not affected, and execute normally.
Repeat counts ininterrupted groups
In all instances of receiving an interrupt, a Group process will not perform a repeat count. When a Group process is interrupted, the processes inside the Group complete their activities according to how they are connected to the Group process’ Interrupt terminal.
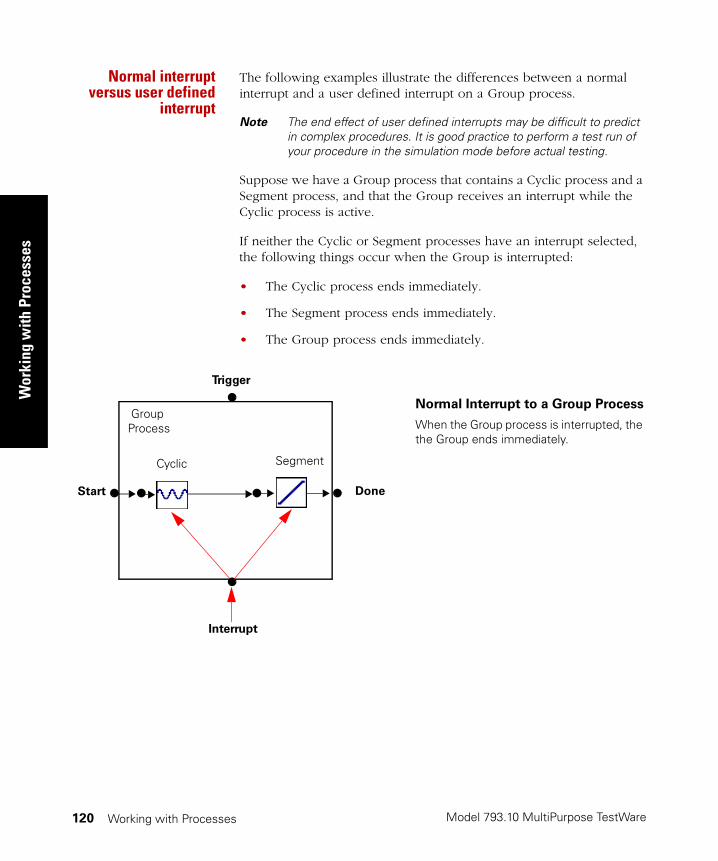
Model 793.10 MultiPurpose TestWare
Wor
king
with
Pro
cess
es
Working with Processes120
Normal interruptversus user defined
interrupt
The following examples illustrate the differences between a normal interrupt and a user defined interrupt on a Group process.
Note The end effect of user defined interrupts may be difficult to predict in complex procedures. It is good practice to perform a test run of your procedure in the simulation mode before actual testing.
Suppose we have a Group process that contains a Cyclic process and a Segment process, and that the Group receives an interrupt while the Cyclic process is active.
If neither the Cyclic or Segment processes have an interrupt selected, the following things occur when the Group is interrupted:
• The Cyclic process ends immediately.
• The Segment process ends immediately.
• The Group process ends immediately.
Segment
Normal Interrupt to a Group Process
When the Group process is interrupted, the the Group ends immediately.
Interrupt
DoneStart
Group Process
Trigger
Cyclic
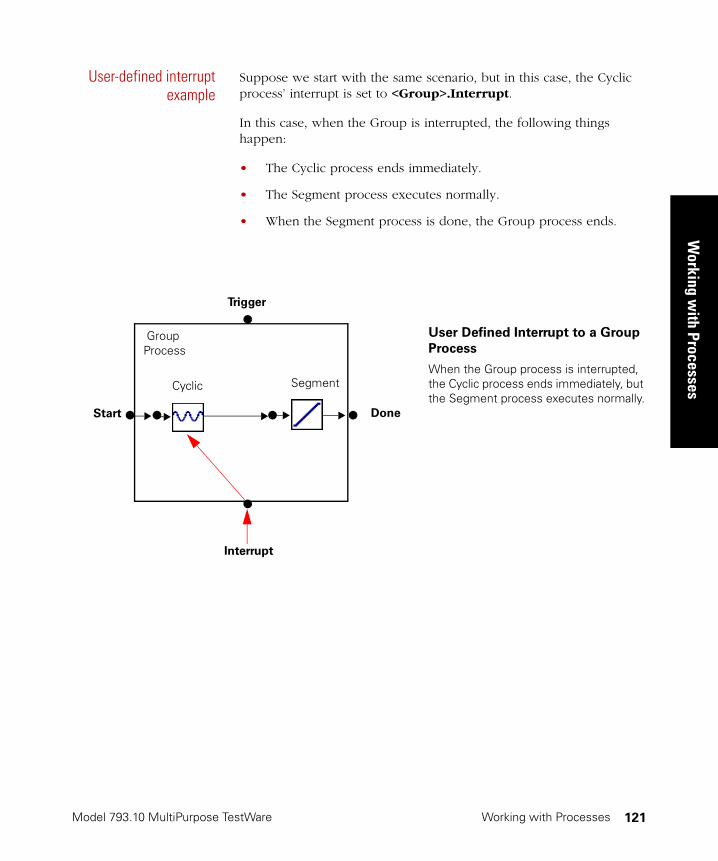
Model 793.10 MultiPurpose TestWare
Working w
ith Processes
Working with Processes 121
User-defined interruptexample
Suppose we start with the same scenario, but in this case, the Cyclic process’ interrupt is set to <Group>.Interrupt.
In this case, when the Group is interrupted, the following things happen:
• The Cyclic process ends immediately.
• The Segment process executes normally.
• When the Segment process is done, the Group process ends.
User Defined Interrupt to a Group
Process
When the Group process is interrupted, the Cyclic process ends immediately, but the Segment process executes normally.
Segment
Interrupt
DoneStart
Group Process
Trigger
Cyclic

Model 793.10 MultiPurpose TestWare
Wor
king
with
Pro
cess
es
Working with Processes122
Disabling Processes
You can disable a process in the following ways:
1. On the General tab in the process Parameters window, clear Process Enabled.
This prevents the process from starting and generating any signals used to start or interrupt another process. If you disable a command process this way, all subsequent command processes will be disabled. When you do this, the process will appear with a red “X” in the left margin of the Procedure (or Group) table.
2. On the General tab of the process’ Parameters window, enter zero.
This method starts the process, but immediately sends out the process “done” signal to other processes. This method works best if you want to disable a command process without disabling all subsequent command processes. When you do this, the process will appear with a downward pointing green arrow in the left margin of the Procedure (or Group) table.
3. On the Procedure table, select the process, right-click the mouse, then click the Enable selection to uncheck it. When you do this, the process will appear with a red “X” in the left margin of the Procedure (or Group) table.

Model 793.10 MultiPurpose TestWare
Window
s and Controls
Windows and Controls 123
Chapter 5
Windows and Controls
Initial MPT Display 125
MPT Control Panel 126
MPT Control Panel Toolbar 127
Test Progress Panel 129
Specimen Panel 130
Power Panel 132
Channel Counters Panel 133
Sequence Counters Panel 134
Process Specific Panels 135
MPT Procedure Editor 137
MPT Procedure Editor Toolbar 146
MPT Procedure Editor Menu 138
File Menu 139
Edit Menu 140
Group Menu 141
Display Menu 142
Tools Menu 143
Window Menu 144
Help Menu 145
Procedure Table 148
Model 793.10 MultiPurpose TestWare
Win
dow
s an
d Co
ntro
ls
Windows and Controls124
Other Windows and Control Descriptions 150
Open Procedure 151
Save Procedure As 152
Print Procedure to File 153
Process Palette 154
MPT Specimen Log 155
MPT Specimen Editor 159
Unit Assignment Set Editor 162
MPT Options Editor 165
About MPT 193
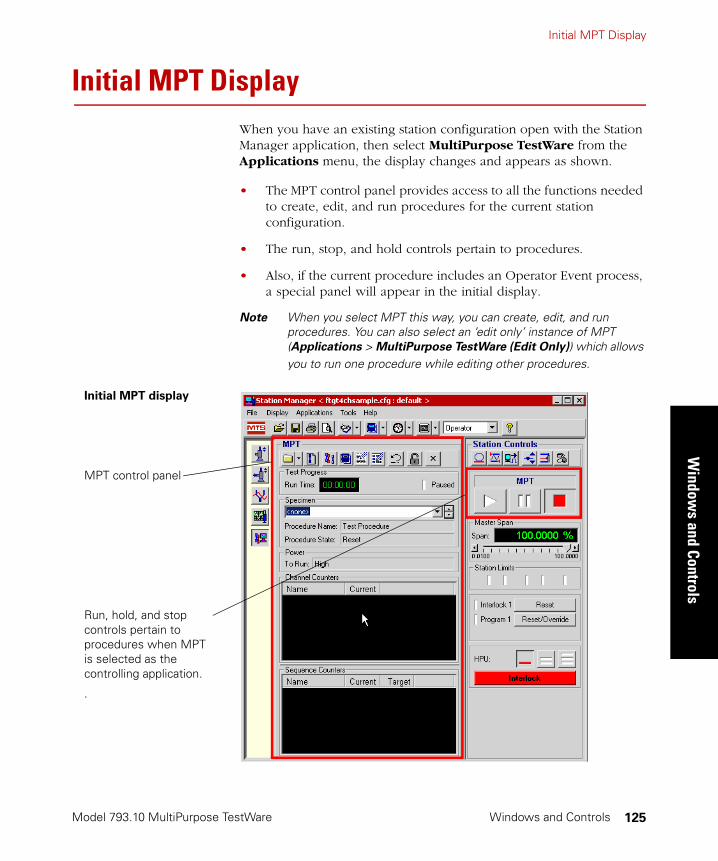
Initial MPT Display
Model 793.10 MultiPurpose TestWare
Window
s and Controls
Windows and Controls 125
Initial MPT DisplayWhen you have an existing station configuration open with the Station Manager application, then select MultiPurpose TestWare from the Applications menu, the display changes and appears as shown.
• The MPT control panel provides access to all the functions needed to create, edit, and run procedures for the current station configuration.
• The run, stop, and hold controls pertain to procedures.
• Also, if the current procedure includes an Operator Event process, a special panel will appear in the initial display.
Note When you select MPT this way, you can create, edit, and run procedures. You can also select an ‘edit only’ instance of MPT (Applications > MultiPurpose TestWare (Edit Only)) which allows you to run one procedure while editing other procedures.
Initial MPT display
MPT control panel
Run, hold, and stop controls pertain to procedures when MPT is selected as the controlling application.
.
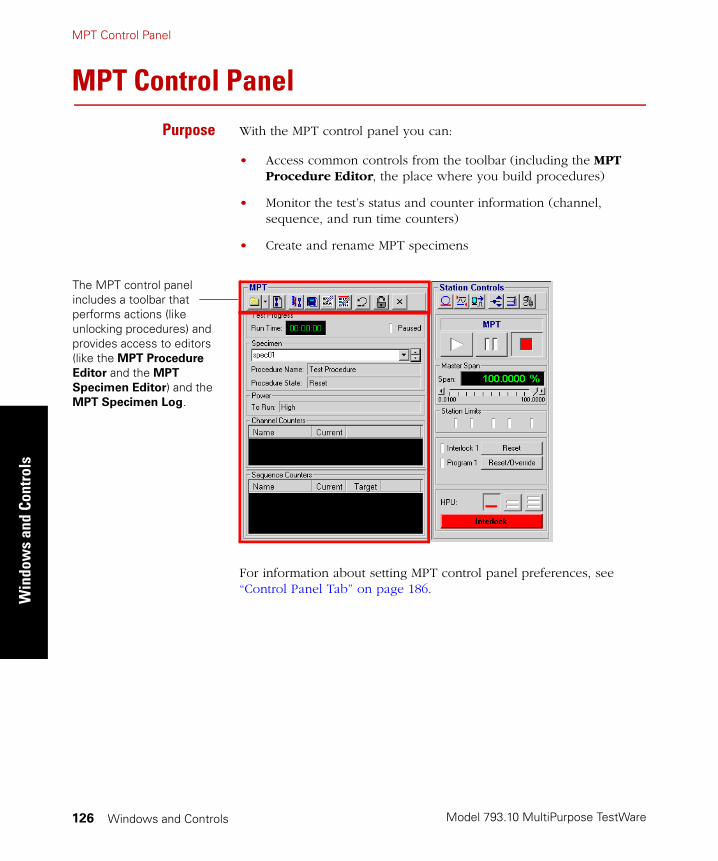
Model 793.10 MultiPurpose TestWare
MPT Control PanelW
indo
ws
and
Cont
rols
Windows and Controls126
MPT Control Panel
Purpose With the MPT control panel you can:
• Access common controls from the toolbar (including the MPT Procedure Editor, the place where you build procedures)
• Monitor the test’s status and counter information (channel, sequence, and run time counters)
• Create and rename MPT specimens
For information about setting MPT control panel preferences, see “Control Panel Tab” on page 186.
The MPT control panel includes a toolbar that performs actions (like unlocking procedures) and provides access to editors (like the MPT Procedure
Editor and the MPT
Specimen Editor) and the MPT Specimen Log.
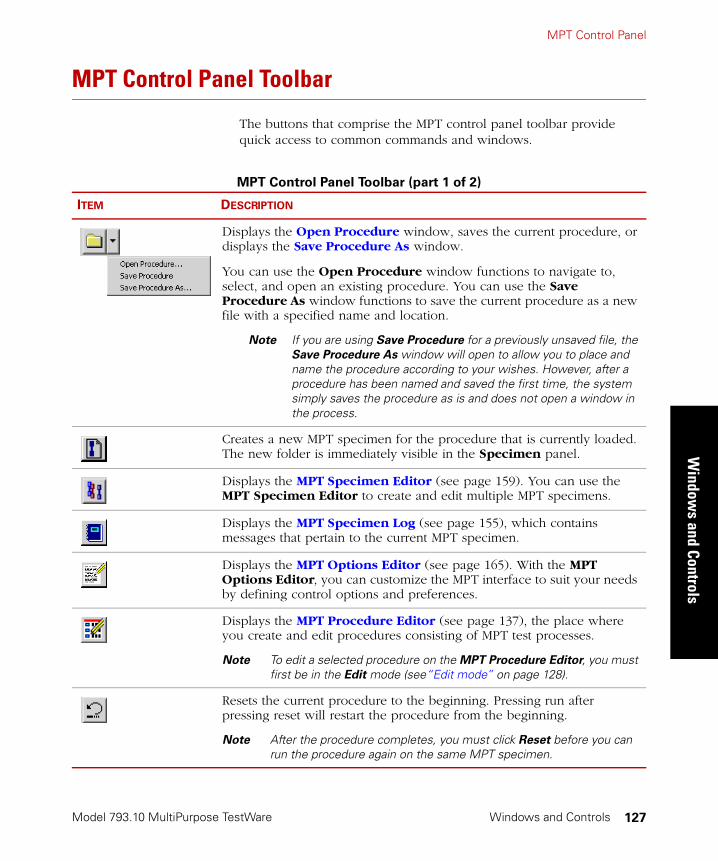
MPT Control Panel
Model 793.10 MultiPurpose TestWare
Window
s and Controls
Windows and Controls 127
MPT Control Panel Toolbar
The buttons that comprise the MPT control panel toolbar provide quick access to common commands and windows.
MPT Control Panel Toolbar (part 1 of 2)
ITEM DESCRIPTION
Displays the Open Procedure window, saves the current procedure, or displays the Save Procedure As window.
You can use the Open Procedure window functions to navigate to, select, and open an existing procedure. You can use the Save Procedure As window functions to save the current procedure as a new file with a specified name and location.
Note If you are using Save Procedure for a previously unsaved file, the Save Procedure As window will open to allow you to place and name the procedure according to your wishes. However, after a procedure has been named and saved the first time, the system simply saves the procedure as is and does not open a window in the process.
Creates a new MPT specimen for the procedure that is currently loaded. The new folder is immediately visible in the Specimen panel.
Displays the MPT Specimen Editor (see page 159). You can use the MPT Specimen Editor to create and edit multiple MPT specimens.
Displays the MPT Specimen Log (see page 155), which contains messages that pertain to the current MPT specimen.
Displays the MPT Options Editor (see page 165). With the MPT Options Editor, you can customize the MPT interface to suit your needs by defining control options and preferences.
Displays the MPT Procedure Editor (see page 137), the place where you create and edit procedures consisting of MPT test processes.
Note To edit a selected procedure on the MPT Procedure Editor, you must first be in the Edit mode (see“Edit mode” on page 128).
Resets the current procedure to the beginning. Pressing run after pressing reset will restart the procedure from the beginning.
Note After the procedure completes, you must click Reset before you can run the procedure again on the same MPT specimen.

Model 793.10 MultiPurpose TestWare
MPT Control PanelW
indo
ws
and
Cont
rols
Windows and Controls128
Edit mode
Execute mode
Changes between edit and execute test modes. To change (toggle between) modes, click the edit /execute mode button.
You must be in edit mode to create or make changes to your procedure.
Note You cannot switch to edit mode if the procedure is running or holding.
You must be in the execute mode to run your test. The procedure automatically switches to execute mode if you click run on the Station Controls panel.
Note When you change to execute mode, the MPT application becomes the controlling application of the control channels used in the procedure. You cannot use the Station Manager manual command controls on the control channels used in the procedure.
Exits the MultiPurpose TestWare application.
MPT Control Panel Toolbar (part 2 of 2)
ITEM DESCRIPTION

MPT Control Panel
Model 793.10 MultiPurpose TestWare
Window
s and Controls
Windows and Controls 129
Test Progress Panel
Purpose The Test Progress panel displays the elapsed run time of the test that is in progress and indicates if the test is currently paused.
MPT Test Progress Panel
ITEM DESCRIPTION
Run Time Displays the elapsed time of the current test (the elapsed run time does not include time spent in hold or stop states).
You can turn the Run Time display on-and-off and select a display format using the Control Panel tab of the MPT Options Editor. See “Control Panel Tab” on page 186.
When the procedure is locked and reset, you can access the Run Time menu by performing a right-mouse click with the cursor positioned over the Run Time counter. When you right-mouse click, the Reset menu item appears. Select the Reset menu item to reset the Run Time counter to zero.
Paused Indicates when the procedure has been paused by a Program Control process.
The paused state is not the same as the hold state.
• When the test is holding, you must click the run button to resume the test.
• When the test is paused, the test must be resumed by another Program Control process (set to Program Resume).
For more information about pausing a test with the Program Control process, see “Program Control” on page 391.
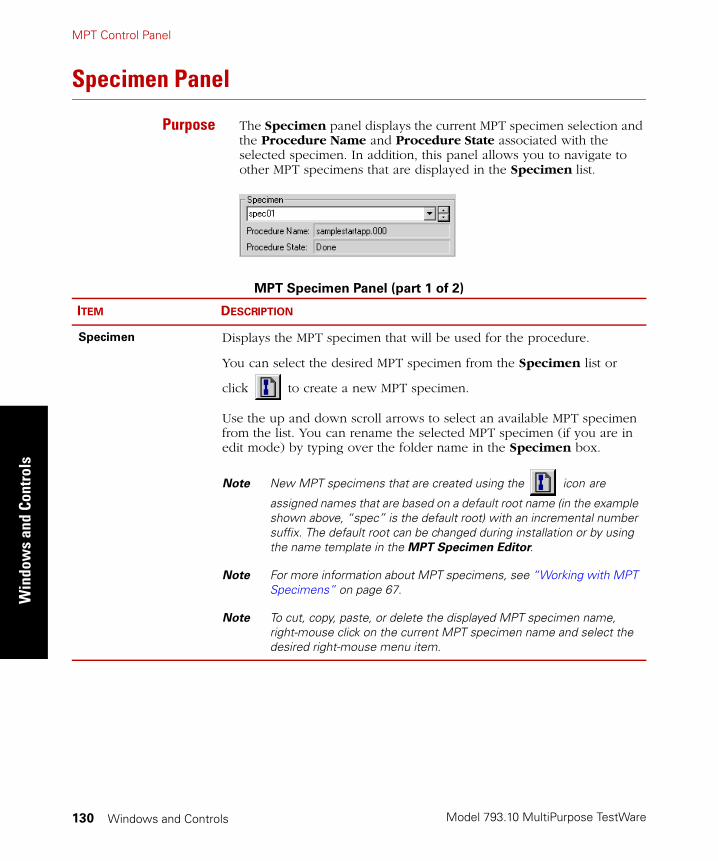
Model 793.10 MultiPurpose TestWare
MPT Control PanelW
indo
ws
and
Cont
rols
Windows and Controls130
Specimen Panel
Purpose The Specimen panel displays the current MPT specimen selection and the Procedure Name and Procedure State associated with the selected specimen. In addition, this panel allows you to navigate to other MPT specimens that are displayed in the Specimen list.
MPT Specimen Panel (part 1 of 2)
ITEM DESCRIPTION
Specimen Displays the MPT specimen that will be used for the procedure.
You can select the desired MPT specimen from the Specimen list or
click to create a new MPT specimen.
Use the up and down scroll arrows to select an available MPT specimen from the list. You can rename the selected MPT specimen (if you are in edit mode) by typing over the folder name in the Specimen box.
Note New MPT specimens that are created using the icon are
assigned names that are based on a default root name (in the example shown above, “spec” is the default root) with an incremental number suffix. The default root can be changed during installation or by using the name template in the MPT Specimen Editor.
Note For more information about MPT specimens, see “Working with MPT Specimens” on page 67.
Note To cut, copy, paste, or delete the displayed MPT specimen name, right-mouse click on the current MPT specimen name and select the desired right-mouse menu item.
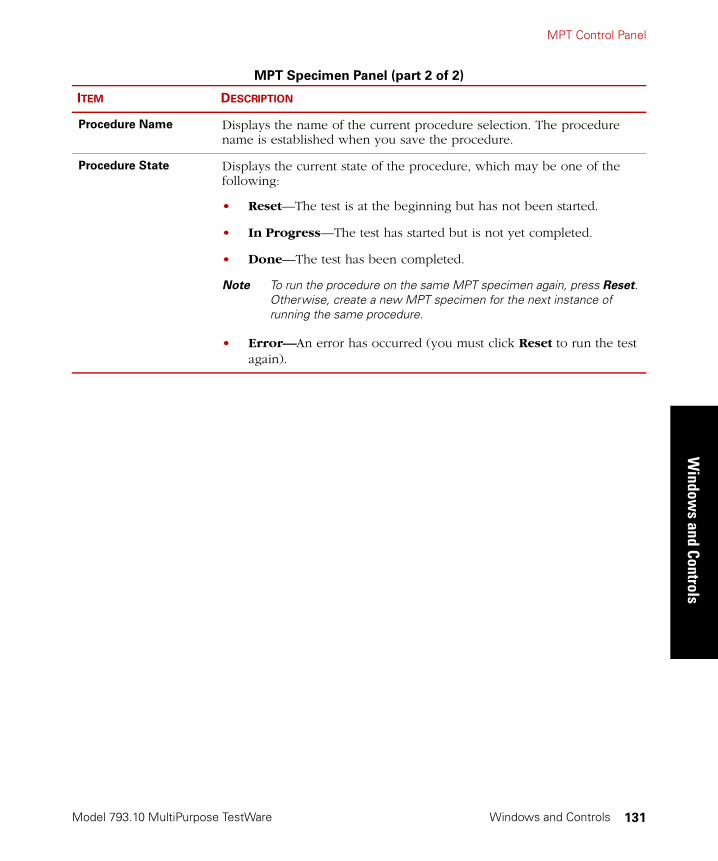
MPT Control Panel
Model 793.10 MultiPurpose TestWare
Window
s and Controls
Windows and Controls 131
Procedure Name Displays the name of the current procedure selection. The procedure name is established when you save the procedure.
Procedure State Displays the current state of the procedure, which may be one of the following:
• Reset—The test is at the beginning but has not been started.
• In Progress—The test has started but is not yet completed.
• Done—The test has been completed.
Note To run the procedure on the same MPT specimen again, press Reset. Otherwise, create a new MPT specimen for the next instance of running the same procedure.
• Error—An error has occurred (you must click Reset to run the test again).
MPT Specimen Panel (part 2 of 2)
ITEM DESCRIPTION
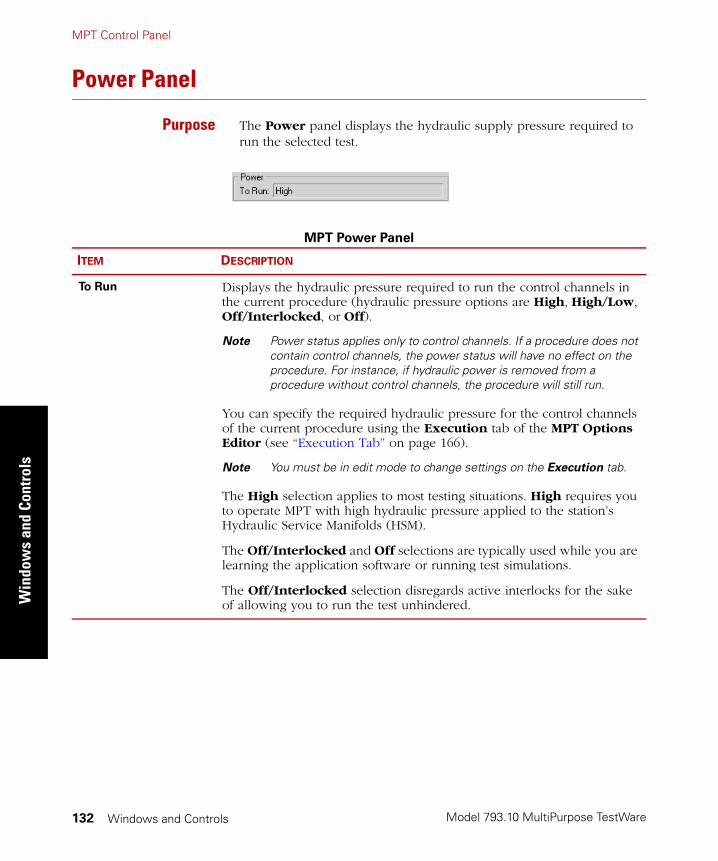
Model 793.10 MultiPurpose TestWare
MPT Control PanelW
indo
ws
and
Cont
rols
Windows and Controls132
Power Panel
Purpose The Power panel displays the hydraulic supply pressure required to run the selected test.
MPT Power Panel
ITEM DESCRIPTION
To Run Displays the hydraulic pressure required to run the control channels in the current procedure (hydraulic pressure options are High, High/Low, Off/Interlocked, or Off).
Note Power status applies only to control channels. If a procedure does not contain control channels, the power status will have no effect on the procedure. For instance, if hydraulic power is removed from a procedure without control channels, the procedure will still run.
You can specify the required hydraulic pressure for the control channels of the current procedure using the Execution tab of the MPT Options Editor (see “Execution Tab” on page 166).
Note You must be in edit mode to change settings on the Execution tab.
The High selection applies to most testing situations. High requires you to operate MPT with high hydraulic pressure applied to the station’s Hydraulic Service Manifolds (HSM).
The Off/Interlocked and Off selections are typically used while you are learning the application software or running test simulations.
The Off/Interlocked selection disregards active interlocks for the sake of allowing you to run the test unhindered.

MPT Control Panel
Model 793.10 MultiPurpose TestWare
Window
s and Controls
Windows and Controls 133
Channel Counters Panel
Purpose The Channel Counters panel displays the running total of completed command channel cycles or segments during test execution.
MPT Channel Counters Panel
ITEM DESCRIPTION
Channel Counters Displays a running total of the cycles or segments that have been executed during the test for each command channel specified in the procedure.
The Channel Counters panel will display all channels that are selected for use during a test. A channel does not have to be used in every process to be displayed.
You can specify the Channel Counters display format using the Control Panel tab of the MPT Options Editor. See “Control Panel Tab” on page 186. You must be in edit mode to change the Control Panel settings.
To access menu items that pertain to Channel Counters position the cursor over the Channel Counters display and perform a right-mouse click. When you do this, the Reset Counters and Set Counters... menu items appear (provided that the procedure is locked and in the reset state). The Reset Counters selection resets all active channel counters to zero. The Set Counters... selection allows you to manually set each channel counter to a user specified value.
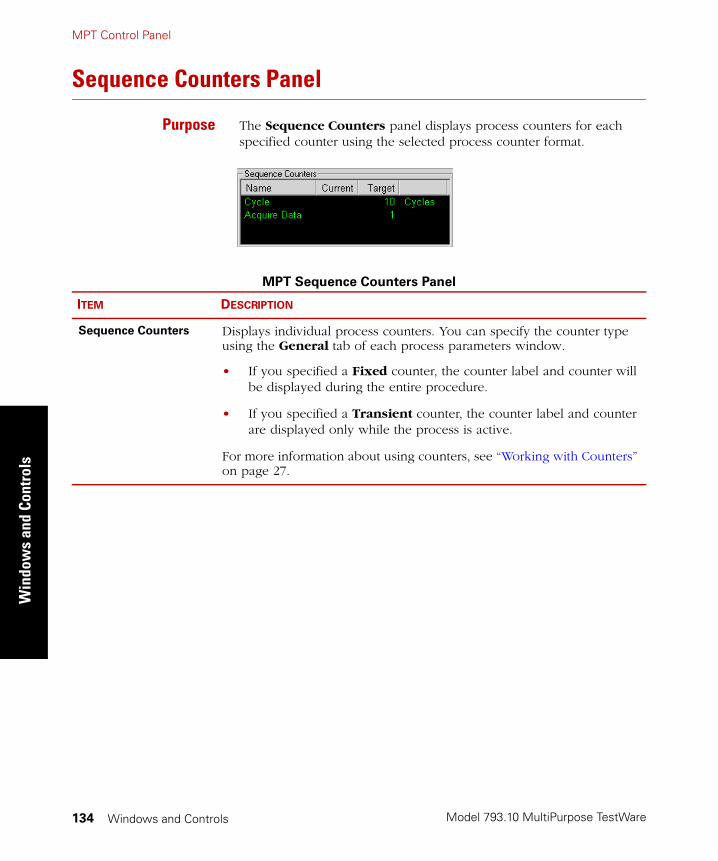
Model 793.10 MultiPurpose TestWare
MPT Control PanelW
indo
ws
and
Cont
rols
Windows and Controls134
Sequence Counters Panel
Purpose The Sequence Counters panel displays process counters for each specified counter using the selected process counter format.
MPT Sequence Counters Panel
ITEM DESCRIPTION
Sequence Counters Displays individual process counters. You can specify the counter type using the General tab of each process parameters window.
• If you specified a Fixed counter, the counter label and counter will be displayed during the entire procedure.
• If you specified a Transient counter, the counter label and counter are displayed only while the process is active.
For more information about using counters, see “Working with Counters” on page 27.
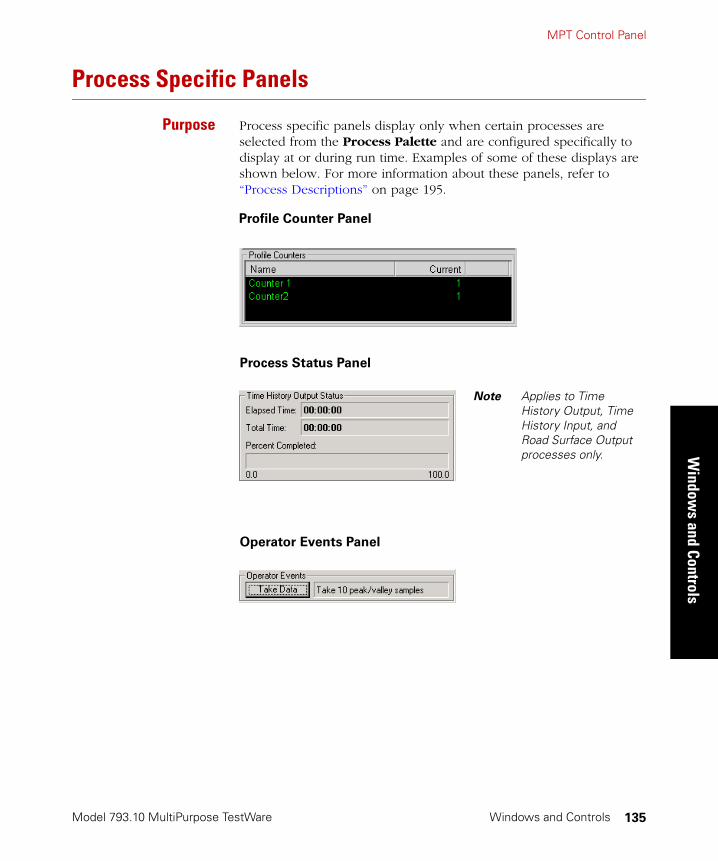
MPT Control Panel
Model 793.10 MultiPurpose TestWare
Window
s and Controls
Windows and Controls 135
Process Specific Panels
Purpose Process specific panels display only when certain processes are selected from the Process Palette and are configured specifically to display at or during run time. Examples of some of these displays are shown below. For more information about these panels, refer to “Process Descriptions” on page 195.
Profile Counter Panel
Process Status Panel
Operator Events Panel
Note Applies to Time History Output, Time History Input, and Road Surface Output processes only.
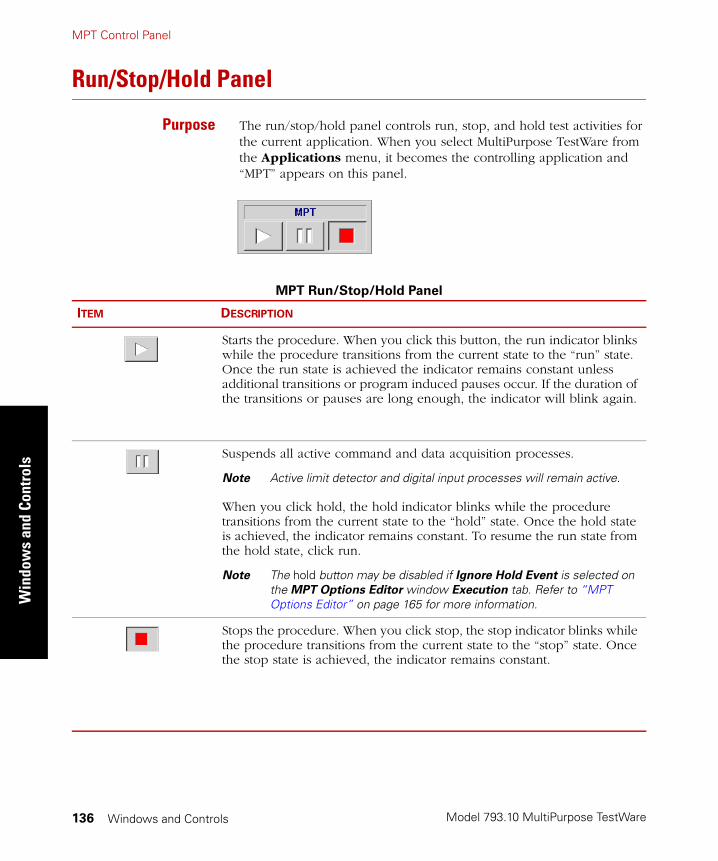
Model 793.10 MultiPurpose TestWare
MPT Control PanelW
indo
ws
and
Cont
rols
Windows and Controls136
Run/Stop/Hold Panel
Purpose The run/stop/hold panel controls run, stop, and hold test activities for the current application. When you select MultiPurpose TestWare from the Applications menu, it becomes the controlling application and “MPT” appears on this panel.
MPT Run/Stop/Hold Panel
ITEM DESCRIPTION
Starts the procedure. When you click this button, the run indicator blinks while the procedure transitions from the current state to the “run” state. Once the run state is achieved the indicator remains constant unless additional transitions or program induced pauses occur. If the duration of the transitions or pauses are long enough, the indicator will blink again.
Suspends all active command and data acquisition processes.
Note Active limit detector and digital input processes will remain active.
When you click hold, the hold indicator blinks while the procedure transitions from the current state to the “hold” state. Once the hold state is achieved, the indicator remains constant. To resume the run state from the hold state, click run.
Note The hold button may be disabled if Ignore Hold Event is selected on the MPT Options Editor window Execution tab. Refer to “MPT Options Editor” on page 165 for more information.
Stops the procedure. When you click stop, the stop indicator blinks while the procedure transitions from the current state to the “stop” state. Once the stop state is achieved, the indicator remains constant.

MPT Procedure Editor
Model 793.10 MultiPurpose TestWare
Window
s and Controls
Windows and Controls 137
MPT Procedure Editor
Purpose The MPT Procedure Editor is where you create procedures by combining and defining the parameters of individual test processes available on the Process Palette.
To display the MPT Procedure Editor, click on this icon .
The MPT Procedure
Editor includes the menu and toolbar, and the Procedure table.
You create procedures by populating the Procedure table with test processes from the Process Palette.
“Simulation” appears in the status bar when you run the “Demo” (demonstration) System Loader program.
Model 793.10 MultiPurpose TestWare
MPT Procedure EditorW
indo
ws
and
Cont
rols
Windows and Controls138
MPT Procedure Editor Menu
The following menus are available on the MPT Procedure Editor window:
• “File Menu” on page 139
• “Edit Menu” on page 140
• “Group Menu” on page 141
• “Display Menu” on page 142
• “Tools Menu” on page 143
• “Window Menu” on page 144
• “Help Menu” on page 145
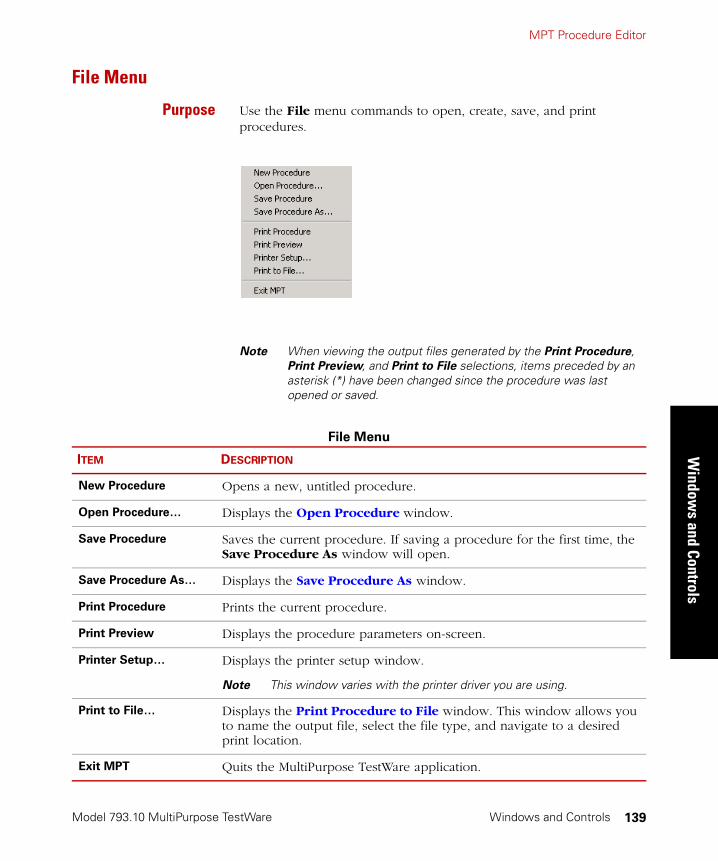
MPT Procedure Editor
Model 793.10 MultiPurpose TestWare
Window
s and Controls
Windows and Controls 139
File Menu
Purpose Use the File menu commands to open, create, save, and print procedures.
Note When viewing the output files generated by the Print Procedure, Print Preview, and Print to File selections, items preceded by an asterisk (*) have been changed since the procedure was last opened or saved.
File Menu
ITEM DESCRIPTION
New Procedure Opens a new, untitled procedure.
Open Procedure… Displays the Open Procedure window.
Save Procedure Saves the current procedure. If saving a procedure for the first time, the Save Procedure As window will open.
Save Procedure As… Displays the Save Procedure As window.
Print Procedure Prints the current procedure.
Print Preview Displays the procedure parameters on-screen.
Printer Setup… Displays the printer setup window.
Note This window varies with the printer driver you are using.
Print to File… Displays the Print Procedure to File window. This window allows you to name the output file, select the file type, and navigate to a desired print location.
Exit MPT Quits the MultiPurpose TestWare application.

Model 793.10 MultiPurpose TestWare
MPT Procedure EditorW
indo
ws
and
Cont
rols
Windows and Controls140
Edit Menu
Purpose Use the Edit menu commands to add, delete, copy, paste, and edit processes that are selected in the Procedure table.
Edit Menu
ITEM DESCRIPTION
Add Process Adds the process selected on the Process Palette to the active Procedure table.
Delete Process Deletes the process (or processes) selected in the active Procedure table.
Cut Process Removes the process (or processes) selected in the active Procedure table and copies it to the clipboard.
Copy Process Copies the process (or processes) selected in the active Procedure table.
Paste Process Pastes the process (or processes) to the active Procedure table.
Edit Process Displays the Parameters window for the process selected in the active Procedure table.

MPT Procedure Editor
Model 793.10 MultiPurpose TestWare
Window
s and Controls
Windows and Controls 141
Group Menu
Purpose Use the Group menu commands to restore, navigate through, and control specific Group table functions.
Group Menu
ITEM DESCRIPTION
Procedure Restores the main Procedure table if it has been minimized or hidden.
Next Opens the Group table for the selected group process.
Note This command is only available when you select a Group process icon.
Previous Displays the parent Procedure table for the current Group table.
Note This command is only available when you are in a Group table.
Options Auto-Open Parameters—Automatically opens the process parameters window for any process you add to the Group table.
Cascade Edit—Displays your procedure and group process windows in a cascading window style. If Cascade Edit is disabled, only one procedure table will be displayed at a time.
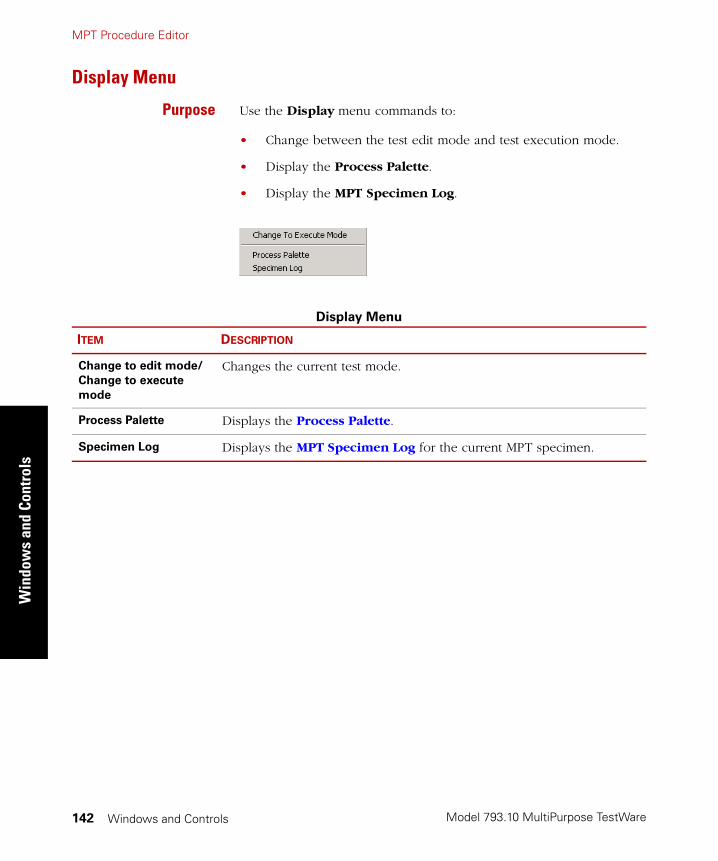
Model 793.10 MultiPurpose TestWare
MPT Procedure EditorW
indo
ws
and
Cont
rols
Windows and Controls142
Display Menu
Purpose Use the Display menu commands to:
• Change between the test edit mode and test execution mode.
• Display the Process Palette.
• Display the MPT Specimen Log.
Display Menu
ITEM DESCRIPTION
Change to edit mode/
Change to execute
mode
Changes the current test mode.
Process Palette Displays the Process Palette.
Specimen Log Displays the MPT Specimen Log for the current MPT specimen.
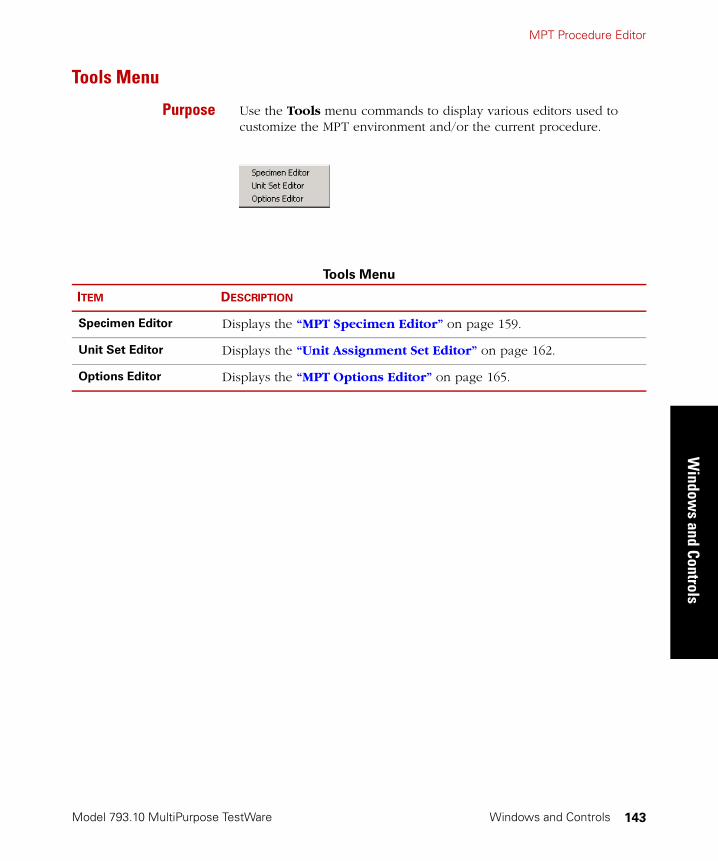
MPT Procedure Editor
Model 793.10 MultiPurpose TestWare
Window
s and Controls
Windows and Controls 143
Tools Menu
Purpose Use the Tools menu commands to display various editors used to customize the MPT environment and/or the current procedure.
Tools Menu
ITEM DESCRIPTION
Specimen Editor Displays the “MPT Specimen Editor” on page 159.
Unit Set Editor Displays the “Unit Assignment Set Editor” on page 162.
Options Editor Displays the “MPT Options Editor” on page 165.
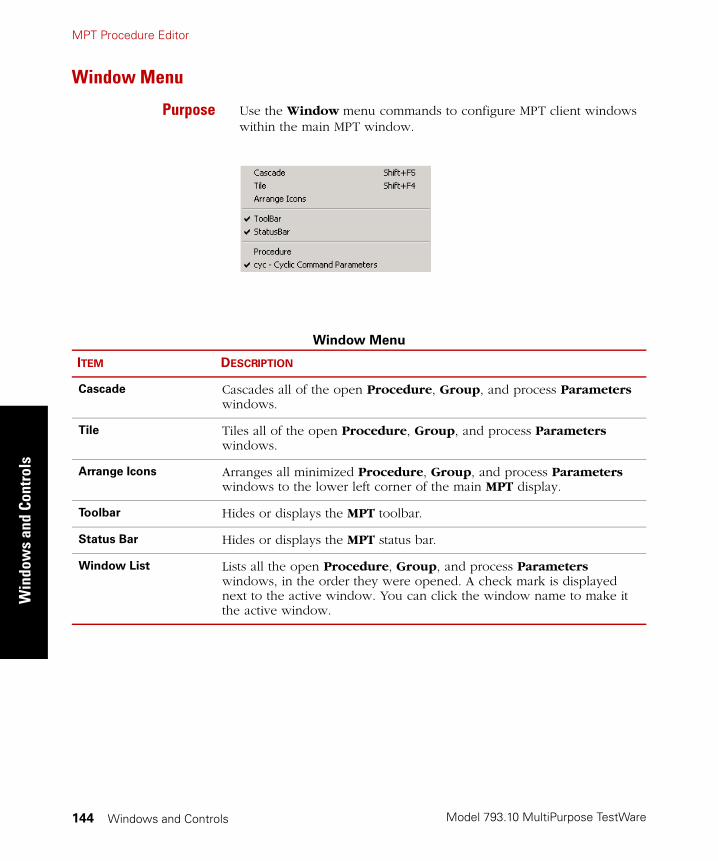
Model 793.10 MultiPurpose TestWare
MPT Procedure EditorW
indo
ws
and
Cont
rols
Windows and Controls144
Window Menu
Purpose Use the Window menu commands to configure MPT client windows within the main MPT window.
Window Menu
ITEM DESCRIPTION
Cascade Cascades all of the open Procedure, Group, and process Parameters windows.
Tile Tiles all of the open Procedure, Group, and process Parameters windows.
Arrange Icons Arranges all minimized Procedure, Group, and process Parameters windows to the lower left corner of the main MPT display.
Toolbar Hides or displays the MPT toolbar.
Status Bar Hides or displays the MPT status bar.
Window List Lists all the open Procedure, Group, and process Parameters windows, in the order they were opened. A check mark is displayed next to the active window. You can click the window name to make it the active window.
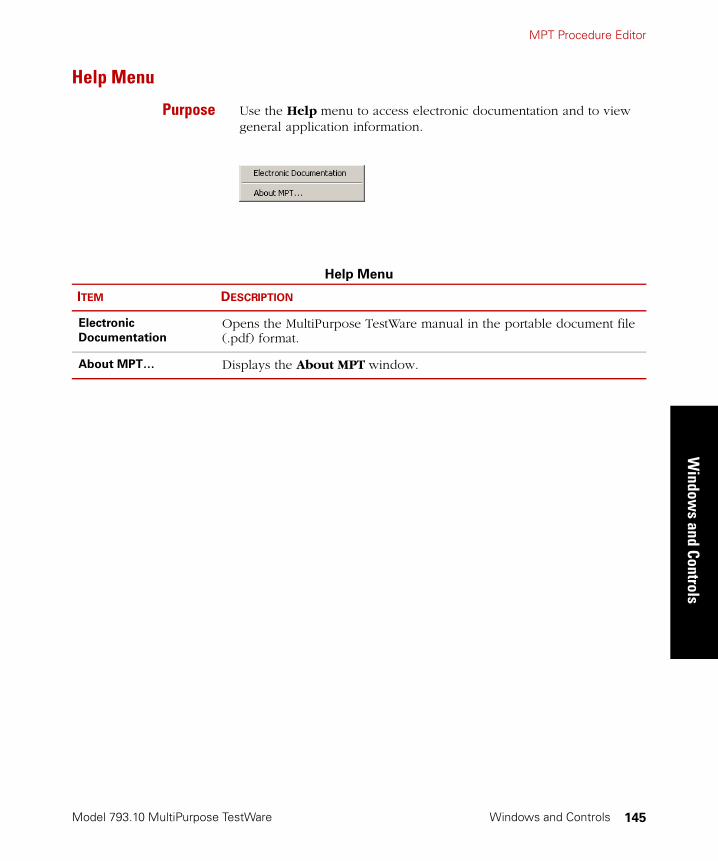
MPT Procedure Editor
Model 793.10 MultiPurpose TestWare
Window
s and Controls
Windows and Controls 145
Help Menu
Purpose Use the Help menu to access electronic documentation and to view general application information.
Help Menu
ITEM DESCRIPTION
Electronic
Documentation
Opens the MultiPurpose TestWare manual in the portable document file (.pdf) format.
About MPT… Displays the About MPT window.

Model 793.10 MultiPurpose TestWare
MPT Procedure EditorW
indo
ws
and
Cont
rols
Windows and Controls146
MPT Procedure Editor Toolbar
The buttons that comprise the MPT Procedure Editor toolbar provide quick access to common commands and windows.
MPT Procedure Editor Toolbar (part 1 of 2)
ITEM DESCRIPTION
Displays the Open Procedure window.
Saves the current procedure.
Deletes the process (or processes) selected in the active Procedure table.
Opens the next group table. This button is only active if there are multiple group tables available.
Opens the previous group table. This button is only active if there are multiple group tables available.
Displays the Process Palette (see page 154). You can select processes from the palette to copy to the MPT Procedure Editor, or you can drag and drop processes from the palette to the MPT Procedure Editor.
Displays the MPT Options Editor (see page 165). With the MPT Options Editor, you can select control options and preferences for the current procedure.
Displays the MPT Specimen Editor (see page 159). You can use the MPT Specimen Editor to create and edit multiple MPT specimens.
Displays the MPT Specimen Log (see page 155) for the current MPT specimen.
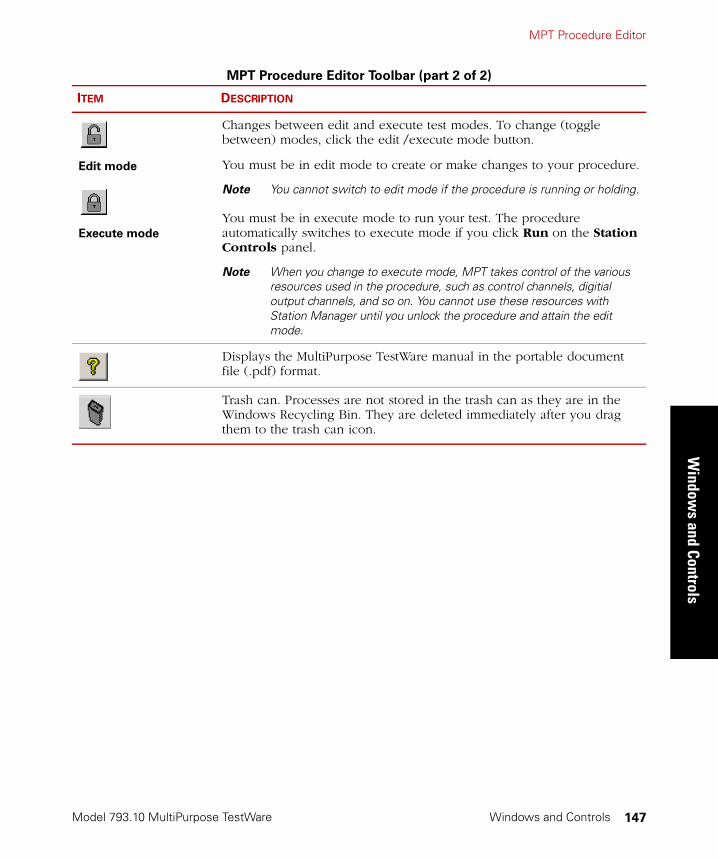
MPT Procedure Editor
Model 793.10 MultiPurpose TestWare
Window
s and Controls
Windows and Controls 147
Edit mode
Execute mode
Changes between edit and execute test modes. To change (toggle between) modes, click the edit /execute mode button.
You must be in edit mode to create or make changes to your procedure.
Note You cannot switch to edit mode if the procedure is running or holding.
You must be in execute mode to run your test. The procedure automatically switches to execute mode if you click Run on the Station Controls panel.
Note When you change to execute mode, MPT takes control of the various resources used in the procedure, such as control channels, digitial output channels, and so on. You cannot use these resources with Station Manager until you unlock the procedure and attain the edit mode.
Displays the MultiPurpose TestWare manual in the portable document file (.pdf) format.
Trash can. Processes are not stored in the trash can as they are in the Windows Recycling Bin. They are deleted immediately after you drag them to the trash can icon.
MPT Procedure Editor Toolbar (part 2 of 2)
ITEM DESCRIPTION
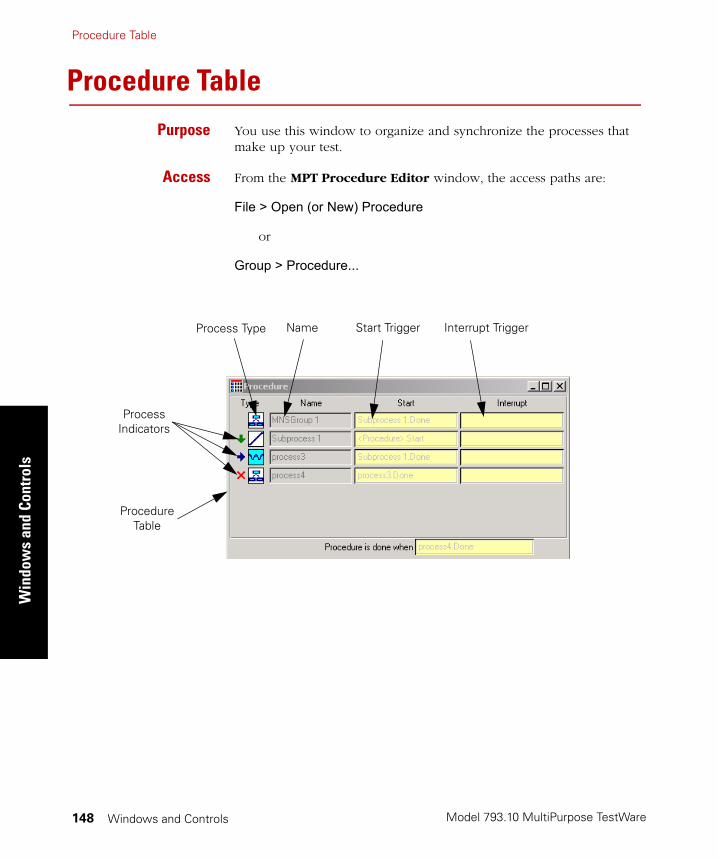
Model 793.10 MultiPurpose TestWare
Procedure TableW
indo
ws
and
Cont
rols
Windows and Controls148
Procedure Table
Purpose You use this window to organize and synchronize the processes that make up your test.
Access From the MPT Procedure Editor window, the access paths are:
File > Open (or New) Procedure
or
Group > Procedure...
Process Type Name Interrupt TriggerStart Trigger
Process Indicators
Procedure Table
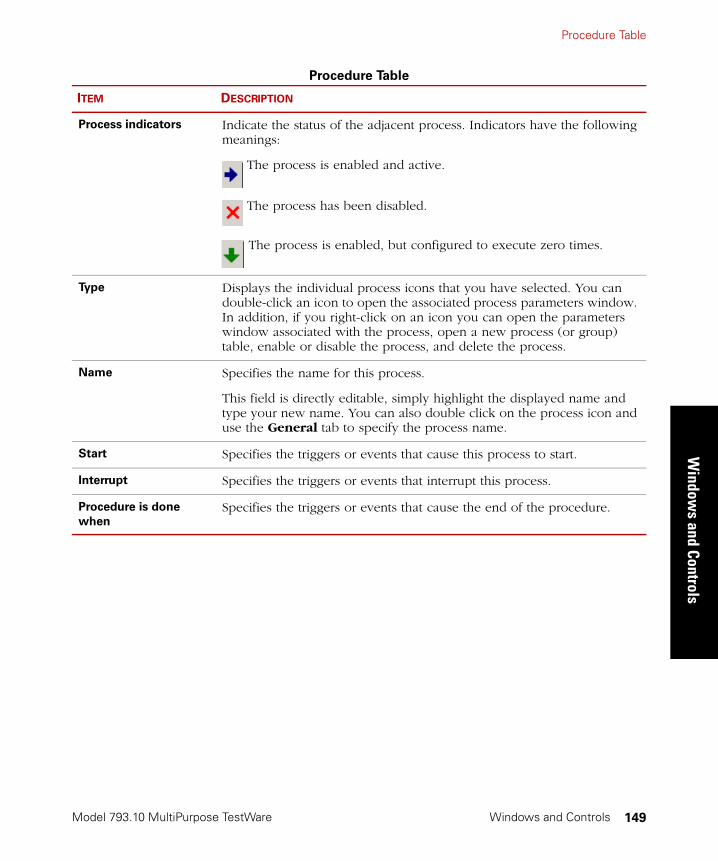
Procedure Table
Model 793.10 MultiPurpose TestWare
Window
s and Controls
Windows and Controls 149
Procedure Table
ITEM DESCRIPTION
Process indicators Indicate the status of the adjacent process. Indicators have the following meanings:
The process is enabled and active.
The process has been disabled.
The process is enabled, but configured to execute zero times.
Type Displays the individual process icons that you have selected. You can double-click an icon to open the associated process parameters window. In addition, if you right-click on an icon you can open the parameters window associated with the process, open a new process (or group) table, enable or disable the process, and delete the process.
Name Specifies the name for this process.
This field is directly editable, simply highlight the displayed name and type your new name. You can also double click on the process icon and use the General tab to specify the process name.
Start Specifies the triggers or events that cause this process to start.
Interrupt Specifies the triggers or events that interrupt this process.
Procedure is done
when
Specifies the triggers or events that cause the end of the procedure.
Model 793.10 MultiPurpose TestWare
Other Windows and Control DescriptionsW
indo
ws
and
Cont
rols
Windows and Controls150
Other Windows and Control DescriptionsFor descriptions of the controls available in a specific window, refer to the following table.
Note For descriptions of the MPT toolbar, see “MPT Procedure Editor Toolbar” on page 146.
MPT Windows
WINDOW MPT PROCEDURE
EDITOR MENU
“Open Procedure” on page 151 File
“Save Procedure As” on page 152 File
“Print Procedure to File” on page 153 File
“Process Palette” on page 154 Display
“MPT Specimen Log” on page 155 Display
“MPT Specimen Editor” on page 159 Tools
“Unit Assignment Set Editor” on page 162 Tools
“MPT Options Editor” on page 165 Tools
“About MPT” on page 193 Help
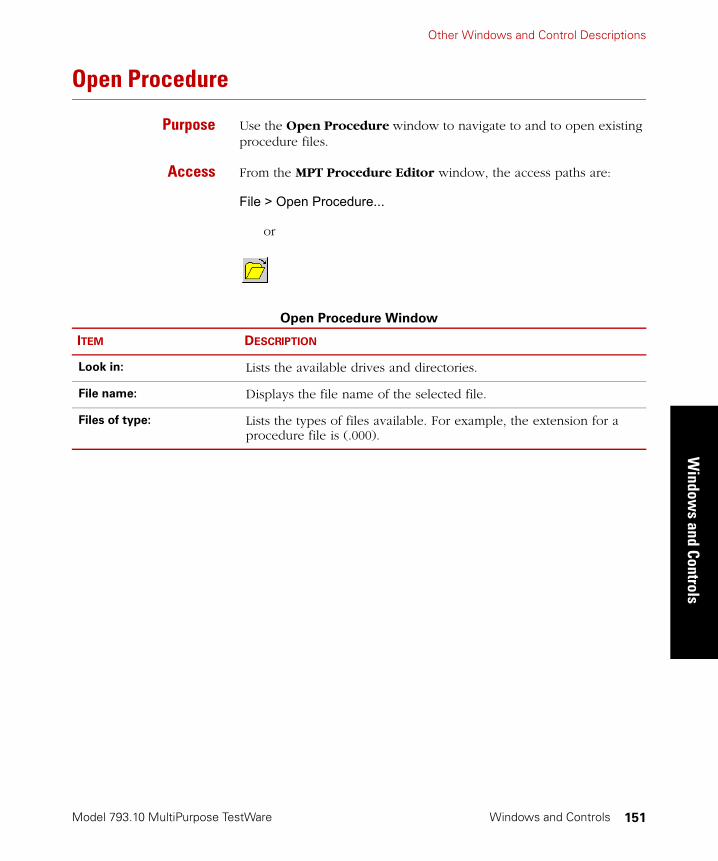
Other Windows and Control Descriptions
Model 793.10 MultiPurpose TestWare
Window
s and Controls
Windows and Controls 151
Open Procedure
Purpose Use the Open Procedure window to navigate to and to open existing procedure files.
Access From the MPT Procedure Editor window, the access paths are:
File > Open Procedure...
or
Open Procedure Window
ITEM DESCRIPTION
Look in: Lists the available drives and directories.
File name: Displays the file name of the selected file.
Files of type: Lists the types of files available. For example, the extension for a procedure file is (.000).
Model 793.10 MultiPurpose TestWare
Other Windows and Control DescriptionsW
indo
ws
and
Cont
rols
Windows and Controls152
Save Procedure As
Purpose Use the Save Procedure or Save Procedure As... command to save your current procedure.
Access From the MPT Procedure Editor window, the access paths are:
File > Save Procedure or Save Procedure As...or
If the current procedure is unnamed, selecting Save Procedure or Save Procedure As... will open the Save Procedure As window. This window prompts you for a procedure name and a folder location. When you click Save on the Save Procedure As window, the application creates a new procedure using the specified file name and closes the original procedure.
If the current procedure is already named, selecting Save Procedure simply initiates the save function without opening any window.
Save Procedure As Window
ITEM DESCRIPTION
Save in: Lists available drives and directories where you can save your procedures.
File name: Sets the name of your procedures.
Save as type: Displays the procedure default file type and automatically appends a .000 extension to the name you enter. If you do not want the .000 extension, put a period (.) at the end of your name.
Other Windows and Control Descriptions
Model 793.10 MultiPurpose TestWare
Window
s and Controls
Windows and Controls 153
Print Procedure to File
Purpose Use the Print Procedure to File window to create a text (.txt) file that contains the current procedure information.
Access From the MPT Procedure Editor window, the access path is:
File > Print to File...
Note We recommend that you use the default directory so your files are stored in a common directory. If desired, use the controls to change the directory.
Print Procedure to File Window
ITEM DESCRIPTION
Save in: Lists the available drives and directories where you can save your text file.
File name: Sets the name of your text file.
Save as type: This selection automatically appends the .txt extension to the file name you enter. If you do not want the .txt extension, put a period (.) at the end of your file name.

Model 793.10 MultiPurpose TestWare
Other Windows and Control DescriptionsW
indo
ws
and
Cont
rols
Windows and Controls154
Process Palette
Purpose Use the Process Palette to select test processes by using their representative icons.
Access From the MPT Procedure Editor window, the access paths are:
Display > Process Palette
or
Note Some processes are optional and will appear on the Process Palette only when purchased separately.
The Process Palette contains the icons of processes that you can add to the procedure table to build a procedure (For more information, see “Adding Processes to the Procedure Table” on page 99).
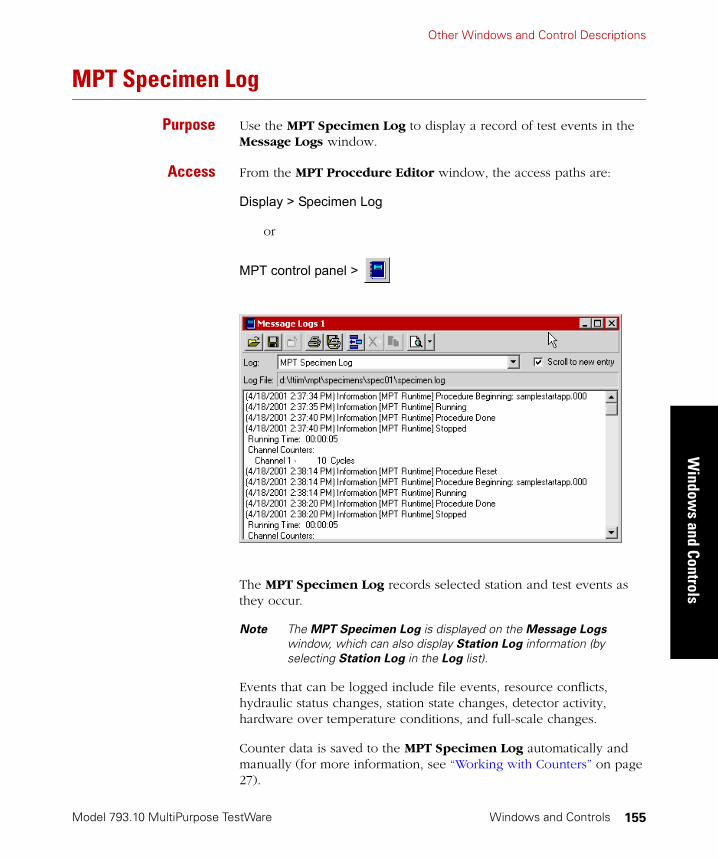
Other Windows and Control Descriptions
Model 793.10 MultiPurpose TestWare
Window
s and Controls
Windows and Controls 155
MPT Specimen Log
Purpose Use the MPT Specimen Log to display a record of test events in the Message Logs window.
Access From the MPT Procedure Editor window, the access paths are:
Display > Specimen Log
or
MPT control panel >
The MPT Specimen Log records selected station and test events as they occur.
Note The MPT Specimen Log is displayed on the Message Logs
window, which can also display Station Log information (by selecting Station Log in the Log list).
Events that can be logged include file events, resource conflicts, hydraulic status changes, station state changes, detector activity, hardware over temperature conditions, and full-scale changes.
Counter data is saved to the MPT Specimen Log automatically and manually (for more information, see “Working with Counters” on page 27).
Model 793.10 MultiPurpose TestWare
Other Windows and Control DescriptionsW
indo
ws
and
Cont
rols
Windows and Controls156
About auto-archiving The MPT application automatically saves your MPT Specimen Log when it accumulates at least 1000 log entries. When log entries are saved to the log file, they are cleared from the MPT Specimen Log display.
Specimen log filenaming
The default name for the current MPT Specimen Log file is specimen .log.
Archived log files are named specimen000.log, specimen001.log, specimen002.log, and so forth, up to specimen500.log.
Note The maximum number of log files that can be saved for a particular test is 500.
Once you reach 500 log files, additional log files overwrite the oldest log files in order (typically archiving restarts at specimen 000.log).
When a log file is saved (either manually or automatically), a log entry is made noting the archival. This entry includes a time/date stamp and information about where the file was saved. This entry becomes the first entry in the current log.
The MPT application can unexpectedly quit if you run out of disk space
when saving log files.
Quitting while a test is in progress can result in a loss of data.
If you think your test may generate an excessive number of MPT Specimen Log entries, you should filter the messages written to the MPT Specimen Log with the MPT Options Editor. For information about filtering MPT Specimen Log entries, see “Specimen Log Tab” on page 183.
If the MPT application shuts down as a result of log files exhausting disk space, you must remove some of the MPT Specimen Log files from your disk before you restart the system software.
�����
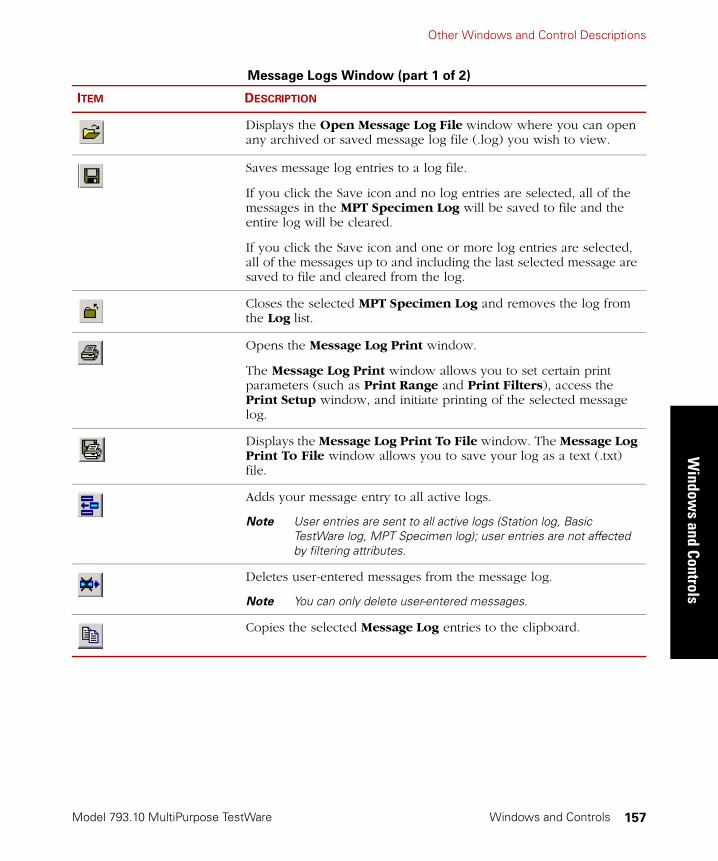
Other Windows and Control Descriptions
Model 793.10 MultiPurpose TestWare
Window
s and Controls
Windows and Controls 157
Message Logs Window (part 1 of 2)
ITEM DESCRIPTION
Displays the Open Message Log File window where you can open any archived or saved message log file (.log) you wish to view.
Saves message log entries to a log file.
If you click the Save icon and no log entries are selected, all of the messages in the MPT Specimen Log will be saved to file and the entire log will be cleared.
If you click the Save icon and one or more log entries are selected, all of the messages up to and including the last selected message are saved to file and cleared from the log.
Closes the selected MPT Specimen Log and removes the log from the Log list.
Opens the Message Log Print window.
The Message Log Print window allows you to set certain print parameters (such as Print Range and Print Filters), access the Print Setup window, and initiate printing of the selected message log.
Displays the Message Log Print To File window. The Message Log Print To File window allows you to save your log as a text (.txt) file.
Adds your message entry to all active logs.
Note User entries are sent to all active logs (Station log, Basic TestWare log, MPT Specimen log); user entries are not affected by filtering attributes.
Deletes user-entered messages from the message log.
Note You can only delete user-entered messages.
Copies the selected Message Log entries to the clipboard.

Model 793.10 MultiPurpose TestWare
Other Windows and Control DescriptionsW
indo
ws
and
Cont
rols
Windows and Controls158
Enables all the display options or allows individual display option enable/disable functions.
If you click on the enable icon, all display functions (Date/Time, Severity, Source) are enabled.
If you click on the down arrow, the individual display functions appear. If you click on a function, the function state changes between enabled and disabled. If a check mark appears next to the function, that function is enabled.
Log Displays the current log file. Use the down arrow to display other log files that are available.
Log File Displays the path to the current log file.
Scroll to new entry Disables or enables the MPT Specimen Log scrolling function. This function allows the message log to automatically shift (scroll) to display new entries as they occur.
Note By default, the Scroll to new entry box is enabled.
If Scroll to new entry is selected, new log entries will appear at the bottom of the log as they occur. The log will scroll down automatically to ensure the latest entry is displayed.
If Scroll to new entry is cleared, new log entries will be added to the bottom of the log as they occur, but the log will not scroll down. New entries may not be visible unless you manually scroll to the bottom of the log. This selection allows you to review the contents of the log without the window ‘jumping’ to the bottom of the display each time a new log entry arrives.
Message Logs Window (part 2 of 2)
ITEM DESCRIPTION
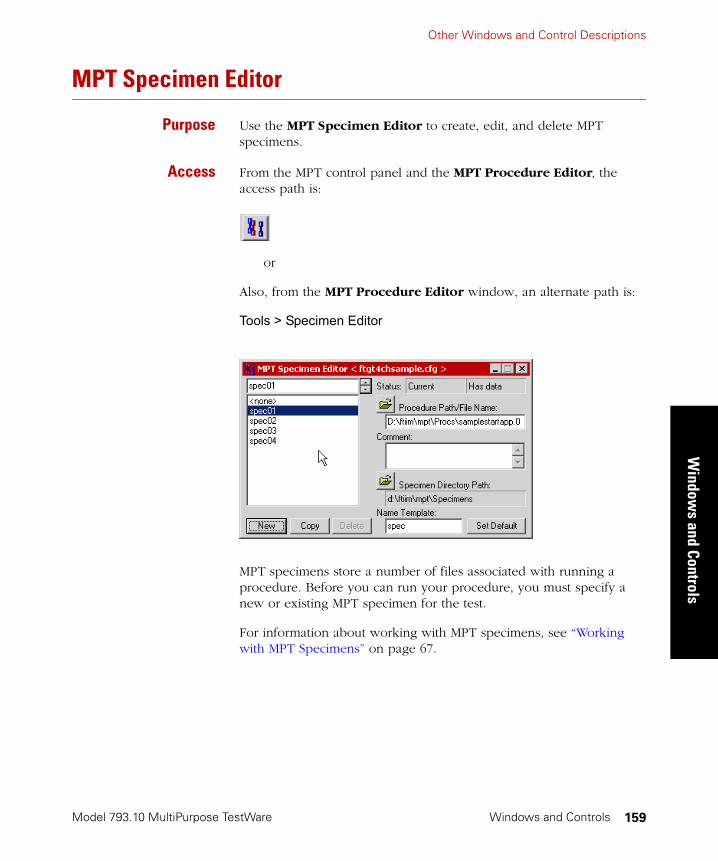
Other Windows and Control Descriptions
Model 793.10 MultiPurpose TestWare
Window
s and Controls
Windows and Controls 159
MPT Specimen Editor
Purpose Use the MPT Specimen Editor to create, edit, and delete MPT specimens.
Access From the MPT control panel and the MPT Procedure Editor, the access path is:
or
Also, from the MPT Procedure Editor window, an alternate path is:
Tools > Specimen Editor
MPT specimens store a number of files associated with running a procedure. Before you can run your procedure, you must specify a new or existing MPT specimen for the test.
For information about working with MPT specimens, see “Working with MPT Specimens” on page 67.
Model 793.10 MultiPurpose TestWare
Other Windows and Control DescriptionsW
indo
ws
and
Cont
rols
Windows and Controls160
MPT Specimen Editor (part 1 of 2)
ITEM DESCRIPTION
MPT specimen list Displays the MPT specimens saved in the selected MPT Specimen Directory.
Note While in the execute mode, if you click an MPT specimen that is currently loaded in the MPT control panel or in another MPT application, the entire list of MPT specimens will be dimmed and the controls will be unavailable. To make the controls available, you must use the up and down arrows to switch to an available MPT specimen.
Status Displays access and data status of the MPT specimen.
In the first box, the MPT specimen access status is displayed:
• Available—You can edit the MPT specimen.
• Unavailable—You cannot edit the MPT specimen because it is currently assigned to another instance of the MPT application.
• Current—The MPT specimen is currently assigned on the MPT control panel. You can edit but not delete this specimen.
In the second box, the MPT specimen data status is displayed:
• Empty—The MPT specimen does not contain test information.
• Has Data—The MPT specimen contains test information.
Procedure Path/
File Name
Displays the procedure associated with the selected MPT specimen.
To choose a new procedure, click the Procedure Path/File Name button, and either enter the desired procedure or use the Select Procedure File window to link a different procedure to your current MPT specimen.
Comment Enters comment information that is saved in the MPT specimen.
New Creates a new MPT specimen.
Note The new MPT specimen is empty and is not linked to a procedure.
Copy Creates a new MPT specimen based on the selected MPT specimen.
The new copy includes all attributes of the original MPT specimen, including procedure association, comments, and MPT specimen directory.
Note Test data and status are not copied.
Delete Deletes the selected MPT specimen.

Other Windows and Control Descriptions
Model 793.10 MultiPurpose TestWare
Window
s and Controls
Windows and Controls 161
Specimen
Directory Path
Specifies the directory where your MPT specimens are saved for the current MPT session.
To choose a new directory, click the Specimen Directory Path button and use the MPT Specimen Directory Path window to select a new directory.
Changes made to the MPT Specimen Directory Path window apply only to the current MPT session. The directory path will revert to the default directory path when MPT is reloaded.
To change the default MPT specimen directory path, use the Directories Tab on the MPT Options Editor.
Name Template Specifies the default label applied to MPT specimens you create.
Note The default MPT specimen name is “spec” (set during installation). When you create new MPT specimens, their default labels are “spec01,” “spec02,” “spec03,” and so forth.
To change the default MPT specimen name, type a name in the Name Template box, and the new name will apply to the current MPT session. If you want to make this new name the new default name, click Set Default. Changes are effective immediately. The name template may also be changed during software installation.
Note It is good practice to add a space after your name entry. This will make additional instances of the name easier to read; for example, “dogbone 01, dogbone 02, dogbone 03,” versus “dogbone01, dogbone02, dogbone03.”
MPT Specimen Editor (part 2 of 2)
ITEM DESCRIPTION

Model 793.10 MultiPurpose TestWare
Other Windows and Control DescriptionsW
indo
ws
and
Cont
rols
Windows and Controls162
Unit Assignment Set Editor
Purpose Use the Unit Assignment Set Editor to create and modify unit assignment sets (UAS). Unit assignment sets define the units of measurement that are available for each dimension used in procedures. For descriptions of the unit assignment sets that are installed with your system software, see “Standard unit sets” on page 164.
Access From the MPT Procedure Editor windows the access path is:
Tools > Unit Set Editor
Note Initially, you specify the default UAS (unit assignment set) when you install the system software. To change the default UAS, use the Unit Selection Tab (see page 189) of the MPT Options Editor.

Other Windows and Control Descriptions
Model 793.10 MultiPurpose TestWare
Window
s and Controls
Windows and Controls 163
Unit Set Editor
ITEM DESCRIPTION
OpenDisplays the Unit Assignment Set Open window. This window allows you to select the appropriate unit assignment set and to complete the open function by selecting the Open button.
SaveSaves any changes to the selected unit assignment set.
Save AsDisplays the Unit Assignment Set Save As window. This window allows you to view and edit the selected UAS Name and to complete the save function by selecting the Save button.
DeleteDeletes the selected unit assignment set.
UAS Name Displays the name of the unit set currently selected.
UAS File Displays the file name of the unit set currently selected.
Comment Displays a comment about the selected UAS. We recommend you describe the characteristics of the unit set you create.
Dimension and Units Displays the dimensions and corresponding units used by the system software.
When you click a dimension name, the units assigned to the current set will be highlighted. To change a setting, click the dimension, and then click the desired units.
Note You can quickly find an item in the Dimensions or Units list boxes with the keyboard by typing the first letter of the desired item until it is displayed. For example: To select the engineering force unit kN, type the letter ‘k’ repeatedly until kN is highlighted in the list box.

Model 793.10 MultiPurpose TestWare
Other Windows and Control DescriptionsW
indo
ws
and
Cont
rols
Windows and Controls164
Standard unit sets CGSSET - Centimeters-Grams-Seconds—Defines a set of units that is based upon centimeters, grams, and seconds.
ENGSET - U.S. Engineering Units—Defines a set of units that contains customary U.S. engineering units. It provides force-related units in “kip,” and length-related units in “in.”
ENGSETSM - U.S. Engineering Units (small)—Defines a set of units that contains customary U.S. engineering units. It provides force-related units, in “lbf,” and length-related units in “in.”
SISET - SI (Systeme International d’Unites)—Defines a set of units that contains customary international (metric) units. It provides force-related units in “kN,” and length-related units in “mm.”
SISETSM - SI (Systeme International d’Unites) - small—Defines a set of units that contains customary international (metric) units. It provides force, and force-related units in “N,” and length-related units in “mm.”
SYSDEF - System Units Definition—Contains a copy of the units that are used in the hardware and software to represent test values of interest.
Other Windows and Control Descriptions
Model 793.10 MultiPurpose TestWare
Window
s and Controls
Windows and Controls 165
MPT Options Editor
Use the MPT Options Editor to set preferences that are saved with the procedure.
The following tabs are available:
• “Execution Tab” on page 166
• “About Transition States” on page 173
• “Recovery Tab” on page 180
• “Specimen Log Tab” on page 183
• “Control Panel Tab” on page 186
• “Properties Tab” on page 188
• “Unit Selection Tab” on page 189
• “Directories Tab” on page 191
Saving optionpreferences
When you create a new procedure, it will contain default settings for all of the controls in the Options Editor, such as preferences for the data file format, command hold behavior, unit assignment set, etc. You can change these default settings by modifying the “default.000” file. For instructions, see “Default Templates” on page 449.

Model 793.10 MultiPurpose TestWare
Other Windows and Control DescriptionsW
indo
ws
and
Cont
rols
Windows and Controls166
Execution Tab
Purpose Use the Execution tab on the MPT Options Editor to specify options related to the execution of your test.
Access From the MPT control panel or MPT Procedure Editor window, the access path is:
> Execution tab
From the MPT Procedure Editor window, an alternate path is:
Tools > Options Editor > Execution tab
Options that are controlled from the Execution tab include:
• How the system responds when Hold is selected on the run, stop, hold panel.
• Whether or not a test can be resumed if it has been stopped, but it has not completed.
• Whether or not the Station Manager Span and Setpoint controls can affect your procedure.

Other Windows and Control Descriptions
Model 793.10 MultiPurpose TestWare
Window
s and Controls
Windows and Controls 167
• What hydraulic state is required for the control channels in the procedure to run.
• What happens to the command when the test is put in hold or stopped.
• Whether the application displays confirmation messages when actions that affect test resumption occur.
Execution Tab (part 1 of 3)
ITEM DESCRIPTION
Hold State Support Specifies how the Hold button on the Run/Stop/Hold panel operates.
Enable Hold—Clicking Hold puts the test in a hold state.
Ignore Hold Event—Hold is disabled and, if selected, has no effect.
Treat Hold As Stop—Hold operates identically to Stop. For more information, refer to “Run/Stop/Hold Panel” on page 136.
Resume Test After Stop Specifies whether or not you can resume a test after it is stopped.
Note This applies whether the test is stopped by an interlock, a program control process, or the Stop button on the Run/Stop/
Hold panel.
If the enable option is not selected and a test is stopped, you will have to click the Reset button or select a new MPT specimen before you can run the procedure again.
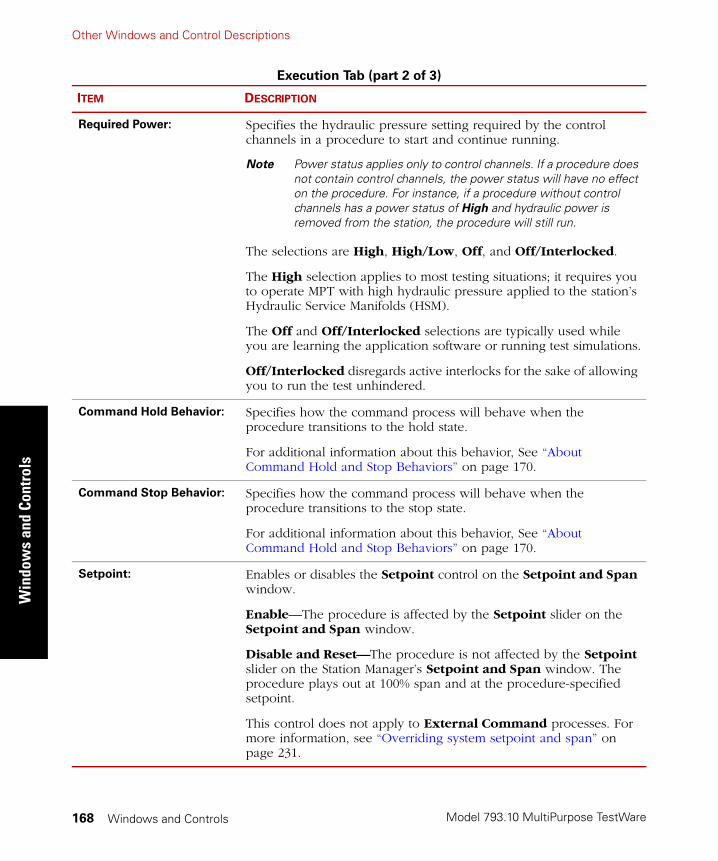
Model 793.10 MultiPurpose TestWare
Other Windows and Control DescriptionsW
indo
ws
and
Cont
rols
Windows and Controls168
Required Power: Specifies the hydraulic pressure setting required by the control channels in a procedure to start and continue running.
Note Power status applies only to control channels. If a procedure does not contain control channels, the power status will have no effect on the procedure. For instance, if a procedure without control channels has a power status of High and hydraulic power is removed from the station, the procedure will still run.
The selections are High, High/Low, Off, and Off/Interlocked.
The High selection applies to most testing situations; it requires you to operate MPT with high hydraulic pressure applied to the station’s Hydraulic Service Manifolds (HSM).
The Off and Off/Interlocked selections are typically used while you are learning the application software or running test simulations.
Off/Interlocked disregards active interlocks for the sake of allowing you to run the test unhindered.
Command Hold Behavior: Specifies how the command process will behave when the procedure transitions to the hold state.
For additional information about this behavior, See “About Command Hold and Stop Behaviors” on page 170.
Command Stop Behavior: Specifies how the command process will behave when the procedure transitions to the stop state.
For additional information about this behavior, See “About Command Hold and Stop Behaviors” on page 170.
Setpoint: Enables or disables the Setpoint control on the Setpoint and Span window.
Enable—The procedure is affected by the Setpoint slider on the Setpoint and Span window.
Disable and Reset—The procedure is not affected by the Setpoint slider on the Station Manager’s Setpoint and Span window. The procedure plays out at 100% span and at the procedure-specified setpoint.
This control does not apply to External Command processes. For more information, see “Overriding system setpoint and span” on page 231.
Execution Tab (part 2 of 3)
ITEM DESCRIPTION

Other Windows and Control Descriptions
Model 793.10 MultiPurpose TestWare
Window
s and Controls
Windows and Controls 169
Span: Enables or disables the Station Manager’s Span slider on the Setpoint and Span window and the Master Span slider on the Station Controls panel.
Enable—The procedure is affected by the Span and Master Span sliders.
Disable and Reset—The procedure is not affected by the Span and Master Span sliders The procedure plays out at 100% span.
These controls do not apply to External Command processes. For more information, see “Overriding system setpoint and span” on page 231.
Confirm actions that may
affect resuming the test
Enables or disables this confirmation function.
When enabled (as indicated by a check mark in the box), this function causes query windows to pop up. The intent of these windows is to point out the potential loss of data and stimulate additional thought about the possible effects of your actions. A query window example is shown below:
Execution Tab (part 3 of 3)
ITEM DESCRIPTION
Model 793.10 MultiPurpose TestWare
Other Windows and Control DescriptionsW
indo
ws
and
Cont
rols
Windows and Controls170
About Command Hold and Stop Behaviors
The Command Hold Behavior and Command Stop Behavior functions allow you to specify how an active MPT command process will behave when a procedure transitions to the hold or stop states.
The following selections are the same for each control:
• Stay at Level—The waveform will hold/stop at the current level.
• Ramp to Mean—The waveform will ramp to mean.
• Ramp to Zero—The waveform will ramp to zero.
• Taper to Mean—The waveform will taper to mean.
• Taper to Zero—The waveform will taper to zero.
The transition times for all ramp and taper functions are specified using the Command Options tab on the Station Manager’s Channel Options window. The default transition time is two seconds. For more information about specifying command options, see the Model 793.00 System Software manual.
Special consideration If the procedure ends normally, and the Command Stop Behavior is set to Ramp to Mean or Taper to Mean, the signal may not respond as you expect. When a procedure ends normally (without being manually held or stopped), all of its processes end normally, and then the Command Stop Behavior is executed. In these situations, Ramp to Mean and Taper to Mean settings behave like a “stay at level” setting, and the Taper to Zero setting behaves like a “ramp to zero” setting. The Ramp to Zero setting works as expected.
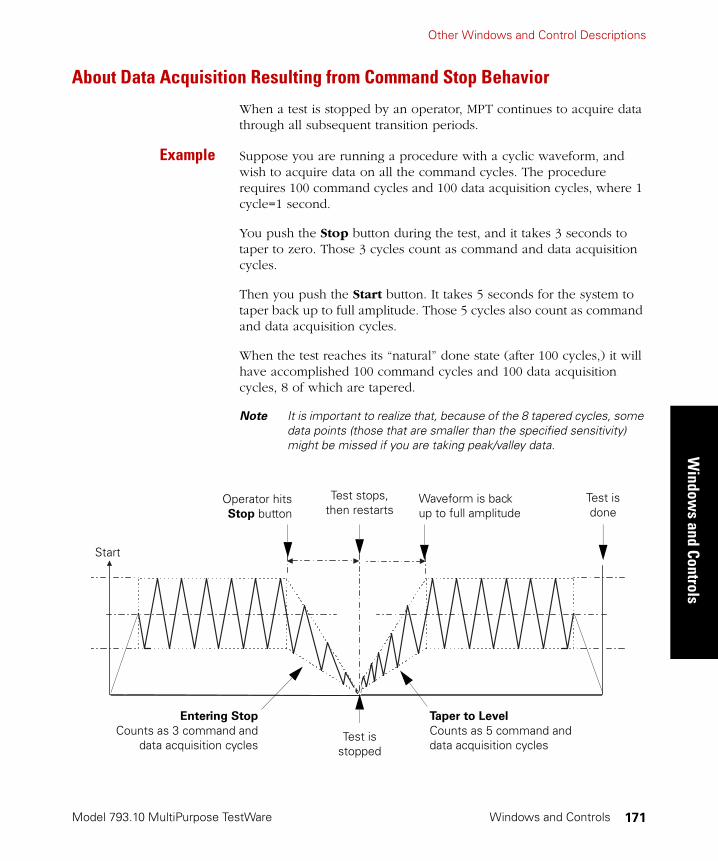
Other Windows and Control Descriptions
Model 793.10 MultiPurpose TestWare
Window
s and Controls
Windows and Controls 171
About Data Acquisition Resulting from Command Stop Behavior
When a test is stopped by an operator, MPT continues to acquire data through all subsequent transition periods.
Example Suppose you are running a procedure with a cyclic waveform, and wish to acquire data on all the command cycles. The procedure requires 100 command cycles and 100 data acquisition cycles, where 1 cycle=1 second.
You push the Stop button during the test, and it takes 3 seconds to taper to zero. Those 3 cycles count as command and data acquisition cycles.
Then you push the Start button. It takes 5 seconds for the system to taper back up to full amplitude. Those 5 cycles also count as command and data acquisition cycles.
When the test reaches its “natural” done state (after 100 cycles,) it will have accomplished 100 command cycles and 100 data acquisition cycles, 8 of which are tapered.
Note It is important to realize that, because of the 8 tapered cycles, some data points (those that are smaller than the specified sensitivity) might be missed if you are taking peak/valley data.
Entering Stop
Counts as 3 command anddata acquisition cycles
Taper to Level
Counts as 5 command and data acquisition cycles
Test is stopped
Operator hitsStop button
Test stops, then restarts
Waveform is back up to full amplitude
Test is done
Start

Model 793.10 MultiPurpose TestWare
Other Windows and Control DescriptionsW
indo
ws
and
Cont
rols
Windows and Controls172
About Command Stop Behaviors and Automatic Setpoint Adjustments
Note When you enable Setpoint, the Return to Zero and Taper to Zero
functions operate relative to the Setpoint, not to absolute zero.
If you enable Setpoint and Span and set Command Stop Behavior to Stay at Level, you may find that Setpoint increases unexpectedly if you stop, unlock, reset, and restart the test. The reason for this is that, using the previously described conditions, Setpoint automatically shifts by the amount of offset present when the procedure was stopped.
Example Suppose you run a procedure in which you execute a ±10 mm cyclic command from a mean level of 20 mm. You enable Span and Setpoint and select a Command Stop Behavior of Stay at Level. You set Span to 100% and Setpoint to 0 mm. When the actuator is at 20 mm, you stop the test. This causes the actuator to stop and hold at 20 mm. Then you unlock the procedure and resume the test. In this situation, the Setpoint value automatically increases to 20 mm, causing the actuator to travel to mean level of 40 mm before resuming the ±10 mm cyclic waveform.
Avoiding automaticSetpoint adjustments
To avoid this behavior and run the test relative to the original Setpoint, select a Command Stop Behavior of Ramp to Zero or Taper to Zero. This way, when you unlock MPT, the commanded level will be equal to the current Setpoint value.
Example Suppose you run a procedure similar to the one in the previous example, except you select a Command Stop Behavior of Ramp to Zero. When the actuator is at 20 mm, you stop the test. This causes the actuator to ramp to 0 mm at the system ramp rate. Next, you unlock the procedure and resume the test. In this situation, the Setpoint value remains 0 mm, and the actuator ramps at the same rate back to 20 mm before executing the ±10 mm cyclic waveform.
Making manualSetpoint adjustments
If the desired combination of Setpoint and Command Stop Behavior for your situation results in a Setpoint shift, you will have to manually adjust the Setpoint to the desired position before you restart a test.
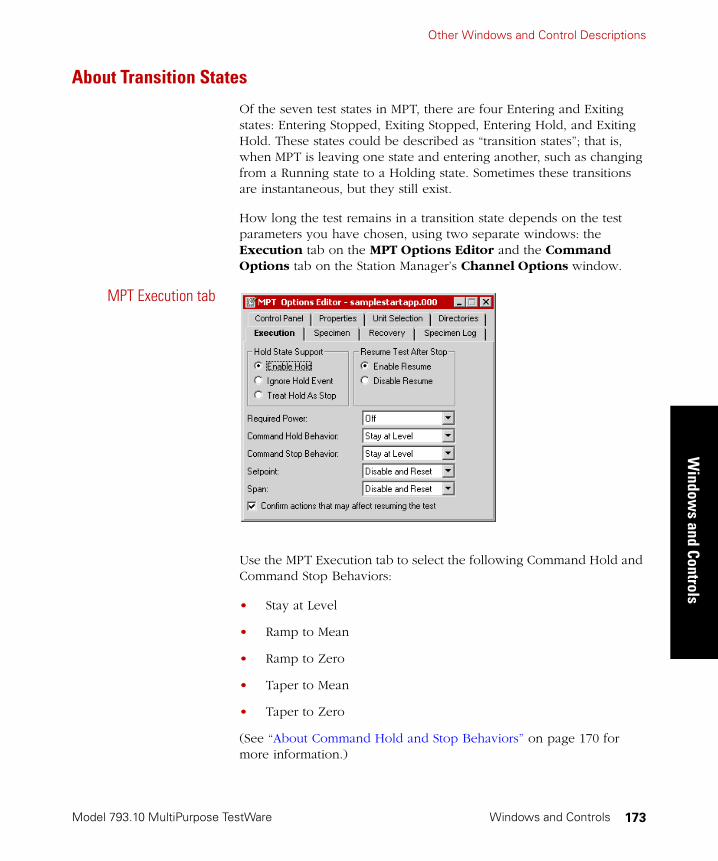
Other Windows and Control Descriptions
Model 793.10 MultiPurpose TestWare
Window
s and Controls
Windows and Controls 173
About Transition States
Of the seven test states in MPT, there are four Entering and Exiting states: Entering Stopped, Exiting Stopped, Entering Hold, and Exiting Hold. These states could be described as “transition states”; that is, when MPT is leaving one state and entering another, such as changing from a Running state to a Holding state. Sometimes these transitions are instantaneous, but they still exist.
How long the test remains in a transition state depends on the test parameters you have chosen, using two separate windows: the Execution tab on the MPT Options Editor and the Command Options tab on the Station Manager’s Channel Options window.
MPT Execution tab
Use the MPT Execution tab to select the following Command Hold and Command Stop Behaviors:
• Stay at Level
• Ramp to Mean
• Ramp to Zero
• Taper to Mean
• Taper to Zero
(See “About Command Hold and Stop Behaviors” on page 170 for more information.)
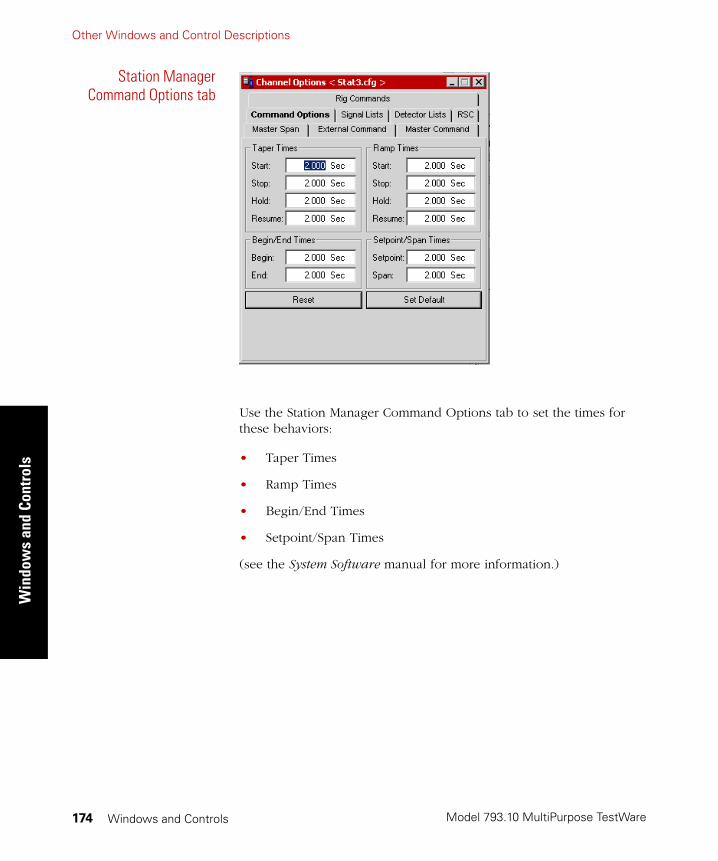
Model 793.10 MultiPurpose TestWare
Other Windows and Control DescriptionsW
indo
ws
and
Cont
rols
Windows and Controls174
Station ManagerCommand Options tab
Use the Station Manager Command Options tab to set the times for these behaviors:
• Taper Times
• Ramp Times
• Begin/End Times
• Setpoint/Span Times
(see the System Software manual for more information.)
Other Windows and Control Descriptions
Model 793.10 MultiPurpose TestWare
Window
s and Controls
Windows and Controls 175
Example The Entering Hold state lasts as long as it takes the system to move from the Running state to the Holding state. If you chose Stay at Level, the Entering Hold state would be instantaneous. If you chose Ramp to Mean or Taper to Mean, then this state would exist for a longer time because time is needed to transition from the current level to the level state.
The amount of time the test remains in a state also results from the time you have specified on the Station Manager Command Options tab:
• If you select a Ramp option for Command Hold Behavior or Command Stop Behavior in MPT, the Ramp Times you specify in Station Manager Command Options will be used. When you click Hold or Stop while a test is running, the test will be in a transition state during the ramp. If you click Run to resume the test, the test will again be in a transition state during the ramp.
• If you select a Taper option for the Command Hold or Stop Behavior, the Taper Times you specify in Station Manager Command Options are used. When you click Hold or Stop while a test is running, the test will be in a transition state during the taper. If you click Run to resume the test, the test will again be in a transition state during the taper.
• If you select a tapered waveform in a Cyclic Command, Profile, or Profile with ALC process in MPT, the Begin/End Times you enter in Station Manager are used. Those tapers will only appear at the very beginning and the very end of the waveform generated by these processes. These tapers do not occur in a transition state because they are considered part of the test (the tapered cycles are counted).

Model 793.10 MultiPurpose TestWare
Other Windows and Control DescriptionsW
indo
ws
and
Cont
rols
Windows and Controls176
This diagram shows a test with a Sine Tapered waveform, Ramp to Mean on hold, and Taper to Zero on stop. It also shows each of the program states within the test:
User Actions
Program States
Click Run
Click Hold
Click Run Click
Stop
Click Run
Click Run

Other Windows and Control Descriptions
Model 793.10 MultiPurpose TestWare
Window
s and Controls
Windows and Controls 177
Specimen Tab
Purpose Use the Specimen tab to determine the storage mode and format of the data that is written to MPT specimens when you run procedures.
Access From the MPT control panel or MPT Procedure Editor window, the access path is:
> Specimen tab
or
From the MPT Procedure Editor window, an alternate path is:
Tools > Options Editor > Specimen tab

Model 793.10 MultiPurpose TestWare
Other Windows and Control DescriptionsW
indo
ws
and
Cont
rols
Windows and Controls178
Specimen Tab (part 1 of 2)
ITEM DESCRIPTION
Data File Data File functions control how data is added to the data file and data format. In addition, it controls the type of time stamp that is used in association with the data.
Mode Append—Causes new data to be added to the end of data files.
Mode Overwrite—Clears the MPS specimen data file (and user-specified files) when you start a new test run (that is, when you click Run after the test has been reset), which causes new data to write over existing data in data files.
Format Plain—Writes space-delimited data. This is the most useful format for direct printouts.
Format Lotus—Writes comma-delimited data with text strings in double quotes (sometimes referred to as the CSV format). Use this format when you plan to import data files into Lotus 1-2-3™.
Format Excel—Writes tab-delimited data. Use this format when you plan to import data files into Microsoft® Excel.
Time Stamp—Selects which signal is used to timestamp data records in the data files. Time is the elapsed time from run to reset. Running Time is the time from run to reset minus the time attributed to the Hold or Stop functions.

Other Windows and Control Descriptions
Model 793.10 MultiPurpose TestWare
Window
s and Controls
Windows and Controls 179
Specimen Log Append—Causes new messages to be added to the end of the MPT Specimen Log file.
Overwrite—Clears the MPT Specimen Log when you start a new test (that is, when you click Run after the test has been reset), which causes new messages to write over existing messages in the MPT Specimen Log file.
Clear Counters on
Reset
Enables and disables the clear function for the Run Time, Channel Counters, and Profile Counters (it does not affect the Sequence Counters).
When enabled, the affected counters are cleared (reset to zero) whenever you click the Reset button.
When disabled, the affected counters are not cleared (reset to zero) when you click the Reset button.
Not resetting the counters can affect various test related functions. For example, it can affect counter related limits (not resetting may cause you to exceed a segment or cycle related limit). Counter resets are sometimes used to indicate the start of a new test in your data file. Without the resets, multiple iterations of a test may be viewed as one long test.
Specimen Tab (part 2 of 2)
ITEM DESCRIPTION

Model 793.10 MultiPurpose TestWare
Other Windows and Control DescriptionsW
indo
ws
and
Cont
rols
Windows and Controls180
Recovery Tab
Purpose Use the Recovery tab to determine how often the application saves a “snapshot” of the test state and status.
Access From the MPT control panel or MPT Procedure Editor windows, the access path is:
> Recovery tab
or
From the MPT Procedure Editor window, an alternate path is:
Tools > Options Editor > Recovery tab
The snapshots of the test state and status can be used to restart a test that was interrupted by an event (for example, a power failure or interlock).

Other Windows and Control Descriptions
Model 793.10 MultiPurpose TestWare
Window
s and Controls
Windows and Controls 181
More About Test Recovery
When you enable the recovery feature, the application updates a recovery file (saved in the MPT specimen) at the intervals you specify.
Snapshot intervals can be set using the program state changes (includes Run to Stop or Stop to Run state changes, including interlocks) and time intervals that you specify.
You can use a recovery file to restart a test even if the test was running during the last snapshot. You cannot restart tests if they have completed or have been reset.
What is saved Information saved to the recovery file includes:
• A copy of the procedure. (It is possible to edit a procedure, then execute it without saving it. In this situation, the test status contains the information used in the execution, not the original procedure.)
• The active group and individual processes. It also identifies how much of each process is complete.
• The current program state (Run, Hold, Stop). When recovering a test, if the program was running or holding, the test is restored in the Stop state.
• The state of the sequence counters and the channel counters.
Recovery Tab
ITEM DESCRIPTION
Recovery Settings Enable saving recovery status—Enables the recovery feature and specifies how the progression of the test state and status is saved.
Note MTS recommends you leave this feature enabled unless you have strong reasons to disable it.
Upon program state change—Saves the test status whenever the run, stop, or hold buttons are clicked on the Station Controls panel (including interlocks).
At least every—Saves the test status at a regular time interval (user specified).
Model 793.10 MultiPurpose TestWare
Other Windows and Control DescriptionsW
indo
ws
and
Cont
rols
Windows and Controls182
What is not saved When you recover a test, the test status is restored to the point where the last snapshot was taken.
• If the test is stopped by an uncontrolled event (such as power failure or application failure), any data not saved to disk at the point of the shutdown is lost.
• If data was being transferred from the data buffer to the computer, data that had not been transferred is lost.
DIO settings are not restored during the MPT recovery process. For information about DIO settings, refer to the Station Manager chapter in your Model 793.00 System Software manual.
Recovery accuracy There are two measures of “accuracy” associated with a saved test status:
• How old is the snapshot? If the snapshot is taken one minute before the test stops, many additional cycles may be applied to the MPT specimen that the test status would not know about.
• How consistent is the snapshot? If the snapshot is taken while the test is running, each active process is checked in sequence. This results in test status data that is taken at slightly different times.
Recoveryconsiderations
Review the following characteristics of the test recovery feature to understand the advantages and disadvantages of recovering a test under different circumstances.
• Recovering a test that was saved periodically provides test status data that is relatively accurate in relation to the point where the test stopped. The shorter the period, the closer the test status is to the point of failure. However, saving a test does require additional processor time. If the autosave rate is too fast, the accuracy of the data acquisition processes (data output and communication between processes) can be adversely affected.
• Each autosave action overwrites the test status. If the system crashes (power fails) while the system is saving the test status, you probably will not be able to recover the test status.
• The test status maintains a copy of the procedure when entering the Execute mode in MPT.

Other Windows and Control Descriptions
Model 793.10 MultiPurpose TestWare
Window
s and Controls
Windows and Controls 183
Specimen Log Tab
Purpose Use the Specimen Log tab on the MPT Options Editor to filter the messages written to the MPT Specimen Log. You can also specify what items are displayed in the Message Logs window.
Access From the MPT control panel or MPT Procedure Editor window, the access path is:
> Specimen Log tab
or
From the MPT Procedure Editor window, an alternate path is:
Tools > Options Editor > Specimen Log tab
If your test generates an excessive number of messages, you should filter what messages are written to the log to avoid exhausting disk space.
For instance, you can change the Source filter from All Applications to This Application Only to keep Station Manager messages out of the MPT Specimen Log.
Model 793.10 MultiPurpose TestWare
Other Windows and Control DescriptionsW
indo
ws
and
Cont
rols
Windows and Controls184
Specimen Log Tab (part 1 of 2)
ITEM DESCRIPTION
Message Capture Controls the severity level and source of the information that is written to the MPT Specimen Log.
Minimum Severity sets the severity level that must be reached before a MultiPurpose TestWare writes a message to the Specimen Log file. There are five levels:
• Diagnostic—Writes Diagnostic, Information, Warning, Error, and Fatal Error messages.
• Information—Writes Information, Warning, Error, and Fatal Error messages; does not write Diagnostic messages.
• Warning—Writes Warning, Error, and Fatal Error messages; does not write Diagnostic and Information messages.
• Error—Writes Error and Fatal Error messages; does not write Diagnostic, Information, and Warning messages.
• Fatal Error—Writes only Fatal Error messages; does not write Diagnostic, Information, Warning, and Error messages.
Source—Selects the information source from which the log is built.
• This Application Only—Records messages from the MPT application only.
• All Applications—Records messages from other sources, such as the Station Manager application.

Other Windows and Control Descriptions
Model 793.10 MultiPurpose TestWare
Window
s and Controls
Windows and Controls 185
Archive Auto Deletion Important Enabling this control may result in the inadvertent deletion of specimen log entries. The Specimen Log is unlikely to exceed the internal limit of 500 Specimen Log files for a given MPT specimen (unless your procedure is generating an excessive number of messages). Therefore, MTS recommends that you disable this control if you routinely use new MPT specimens from test-to-test. Disabling this control will ensure that you will be able to recover relevant log data for your MPT specimens in the future.
This control enables or disables the auto deletion function and sets the deletion interval in days.
The Specimen Log archive has an internal limit of 500 Specimen Log files, with each file containing approximately 1000 messages. Once 500 archived files are accumulated and a new archive file is generated, the oldest archive file is automatically deleted to make room for the newest archive file.
The Archive Auto Deletion control lets you program when archived files are deleted in terms of days (within the internal limit of 500 archived files).
To enable the Archive Auto Deletion function, click in the Delete Older Than checkbox such that a check mark appears in the box. If the check mark appears in the box, the function is enabled.
Set the deletion interval using the scroll arrows to change the number of days displayed. The scroll arrows are only active if the Archive Auto Deletion function is enabled.
Specimen Log Tab (part 2 of 2)
ITEM DESCRIPTION

Model 793.10 MultiPurpose TestWare
Other Windows and Control DescriptionsW
indo
ws
and
Cont
rols
Windows and Controls186
Control Panel Tab
Purpose Use the Control Panel tab to specify what information is displayed on the MPT control panel.
Access From the MPT control panel or MPT Procedure Editor window, the access path is:
> Control Panel tab
or
From the MPT Procedure Editor window, an alternate path is:
Tools > Options Editor > Control Panel tab

Other Windows and Control Descriptions
Model 793.10 MultiPurpose TestWare
Window
s and Controls
Windows and Controls 187
Control Panel Tab
ITEM DESCRIPTION
Test Progress Enables and disables the Run Time portion of the Test Progress panel on the MPT control panel. In addition, it allows you to change the Run Time panel display format.
Run Time—Enables/disables the Run Time display. If Run Time is disabled, the Run Time display does not appear on the Test Progress panel (see “Test Progress Panel” on page 129).
Display Format—Changes the Run Time display format. The format options are HH:MM:SS (hours:minutes:seconds) and cumulative time units.
Specimen Enables and disables the Procedure Name and Procedure State portion of the Specimen panel.
If the Procedure Name or Procedure State is disabled, the respective display does not appear on the Test Progress panel.
Procedure Name—Displays the name of the current procedure.
Procedure State—Displays the current procedure state.
Station Status Enables and disables the Power panel on the MPT control panel.
If Power is disabled, the Power panel does not appear on the MPT control panel.
Counters Enables and disables the Channel Counters and Sequence Counters. In addition, it controls the counter display format.
Channel Counters—Displays the Channel Counters when enabled (see “Channel Counters Panel” on page 133).
Sequence Counters—Displays the Sequence Counters when enabled (see “Sequence Counters Panel” on page 134).
Display Format—Controls the Channel Counters and Sequence Counters display format. The format options are:
• Cycles - Displays the total number of cycles that have been executed.
• Segments - Displays the total number of segments that have been executed.

Model 793.10 MultiPurpose TestWare
Other Windows and Control DescriptionsW
indo
ws
and
Cont
rols
Windows and Controls188
Properties Tab
Purpose Use the Properties tab to enter information that is saved with the procedure.
Access From the MPT control panel or MPT Procedure Editor window, the access path is:
> Properties tab
or
From the MPT Procedure Editor window, an alternate path is:
Tools > Options Editor > Properties tab
You can enter a process summary, identify the procedure, describe the test, or write instructions to the test operator. This information will appear in the Print Preview window.
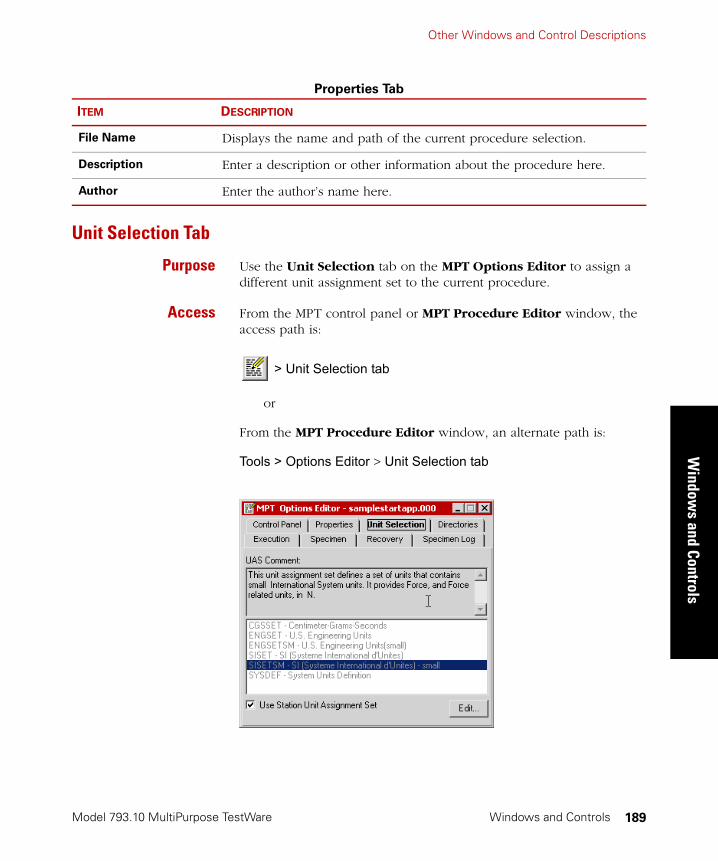
Other Windows and Control Descriptions
Model 793.10 MultiPurpose TestWare
Window
s and Controls
Windows and Controls 189
Unit Selection Tab
Purpose Use the Unit Selection tab on the MPT Options Editor to assign a different unit assignment set to the current procedure.
Access From the MPT control panel or MPT Procedure Editor window, the access path is:
> Unit Selection tab
or
From the MPT Procedure Editor window, an alternate path is:
Tools > Options Editor > Unit Selection tab
Properties Tab
ITEM DESCRIPTION
File Name Displays the name and path of the current procedure selection.
Description Enter a description or other information about the procedure here.
Author Enter the author’s name here.

Model 793.10 MultiPurpose TestWare
Other Windows and Control DescriptionsW
indo
ws
and
Cont
rols
Windows and Controls190
Unit Selection Tab
ITEM DESCRIPTION
UAS Comment Displays a description of the selected unit assignment set.
Selection list Displays a list of the defined unit assignment sets. The currently selected set is shown.
Use Station Unit
Assignment Set
Note By default, this control is enabled in the default template. To disable this control for new procedures, you must disable it in the default template (see “Default Templates” on page 449).
When enabled for existing procedures: Causes the procedure to acquire the current default UAS selection, which is set in the registry during the installation of Station Manager. If this box was disabled when you opened a procedure and you enable it while editing the procedure, you will see the units in your procedure change from the UAS assigned when you opened the procedure to the UAS set in the registry. The new UAS assignment will not be permanent until you save the procedure. If you close without saving, the UAS assignment will revert to the set assigned when you opened the procedure.
When enabled for new procedures: Causes new procedures to open with the UAS selection set in the registry.
When disabled for existing procedures: Allows you to select and edit any UAS and assign it to the current procedure. When you save your procedure, your specific UAS selection will be saved with your procedure. If keeping a specific UAS assignment linked to your procedure is important to you, this is a good choice.
When disabled for new procedures: Causes new procedures to open with the UAS selection set in the registry. If you want all new procedures to open with a specific UAS that is independent of the station configuration UAS, change the UAS selection in the default template.
Edit... Opens the Unit Assignment Set Editor. Using this editor, you can create new or edit existing unit assignment sets.
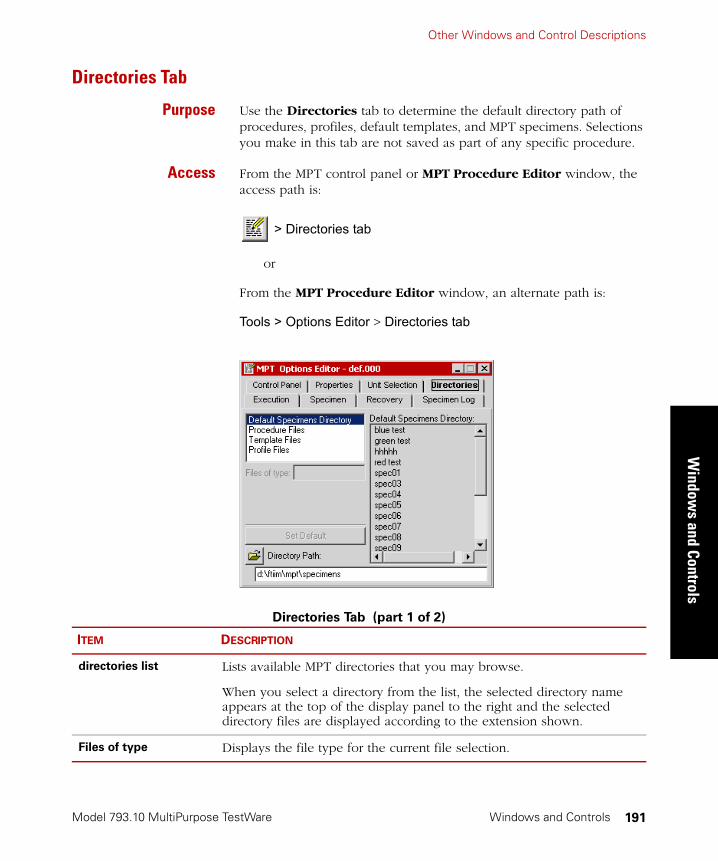
Other Windows and Control Descriptions
Model 793.10 MultiPurpose TestWare
Window
s and Controls
Windows and Controls 191
Directories Tab
Purpose Use the Directories tab to determine the default directory path of procedures, profiles, default templates, and MPT specimens. Selections you make in this tab are not saved as part of any specific procedure.
Access From the MPT control panel or MPT Procedure Editor window, the access path is:
> Directories tab
or
From the MPT Procedure Editor window, an alternate path is:
Tools > Options Editor > Directories tab
Directories Tab (part 1 of 2)
ITEM DESCRIPTION
directories list Lists available MPT directories that you may browse.
When you select a directory from the list, the selected directory name appears at the top of the display panel to the right and the selected directory files are displayed according to the extension shown.
Files of type Displays the file type for the current file selection.

Model 793.10 MultiPurpose TestWare
Other Windows and Control DescriptionsW
indo
ws
and
Cont
rols
Windows and Controls192
Set Default Updates the directory path in the registry file to match the current directory path.
Note If you click Set Default, the registry is changed immediately, regardless of whether or not you save your procedure, and the change will become the default value that will be used by subsequent MPT sessions. If you do not click Set Default, modified directory paths will apply only until you exit MPT.
Directory Path Displays the directory path for the selected file type. If you click on the Directory Path button, the Browse for Folder window opens and allows you to navigate to a new folder.
Directories Tab (part 2 of 2)
ITEM DESCRIPTION
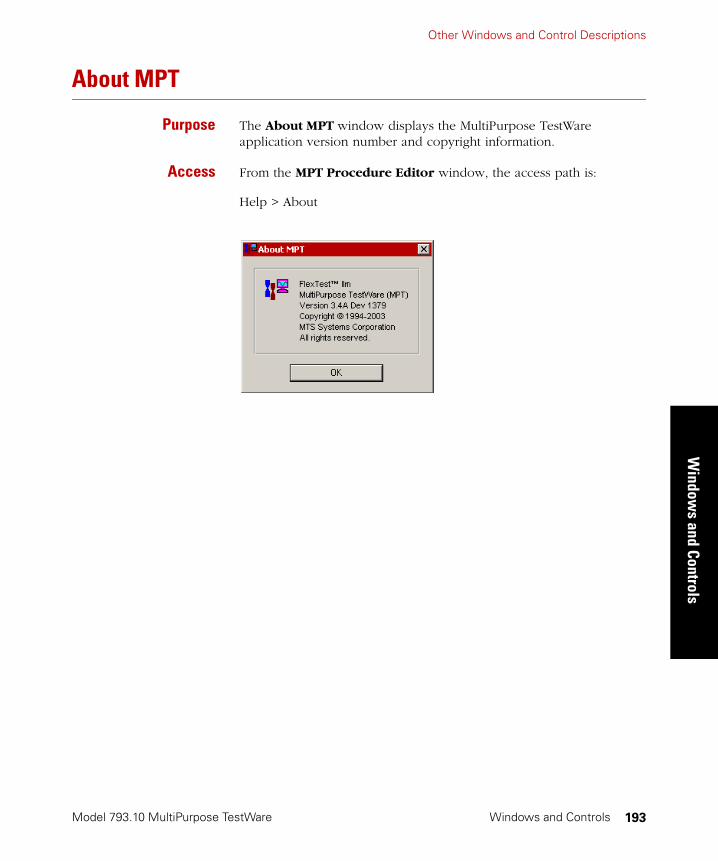
Other Windows and Control Descriptions
Model 793.10 MultiPurpose TestWare
Window
s and Controls
Windows and Controls 193
About MPT
Purpose The About MPT window displays the MultiPurpose TestWare application version number and copyright information.
Access From the MPT Procedure Editor window, the access path is:
Help > About

Model 793.10 MultiPurpose TestWare
Other Windows and Control DescriptionsW
indo
ws
and
Cont
rols
Windows and Controls194
Model 793.10 MultiPurpose TestWare
Process Descriptions
Process Descriptions 195
Chapter 6
Process Descriptions
About MPT Processes 197
Command Processes 198
Segment Command 200
Cyclic Command 205
Dwell Command 216
Profile Command 219
External Command 228
Profile with ALC 236
Cyclic with ALC 242
Time History Output 245
Road Surface Output 257
Data Acquisition Processes 263
Peak/Valley Acquisition 265
Timed Acquisition 277
Max/Min Acquisition 281
Level Crossing Acquisition 286
High Speed Timed Acquisition 290
Cyclic Acquisition 295
Fatigue 303
Time History Input 316
Trend 321

Model 793.10 MultiPurpose TestWare
Proc
ess
Des
crip
tions
Process Descriptions196
Event Processes 331
Data Limit Detector 332
Digital Input Detector 340
Operator Event 348
Peak/Valley Change Detector 354
Program Event 364
Periodic Time Event 367
Failure Detector 373
External Control Processes 378
Digital Output 379
Temperature Control 384
Other Processes 390
Program Control 391
Group 396
Operator Information 398
Start Application 406
Data Display 411
Fatigue Monitoring Application 431
Trend Monitoring Application 440

About MPT Processes
Model 793.10 MultiPurpose TestWare
Process Descriptions
Process Descriptions 197
About MPT ProcessesWhen you create tests with the MPT application, you use MPT processes like building blocks to define test actions such as sending command signals, performing data acquisition, and responding to test events.
A complete MPT test normally consists of a number of MPT processes linked together and saved as an MPT procedure.
Process Palette Your MPT process icons are displayed on the Process Palette.
Process categories Processes are grouped on the palette in the following categories:
• Command Processes send commands to a servovalve or external controller to apply forces to the physical specimen.
• Data Acquisition Processes acquire sensor data from the physical specimen.
• Event Processes monitor test signals and perform actions when specified conditions are met.
• External Control Processes control external controllers or logic devices.
• Other Processes perform miscellaneous functions.
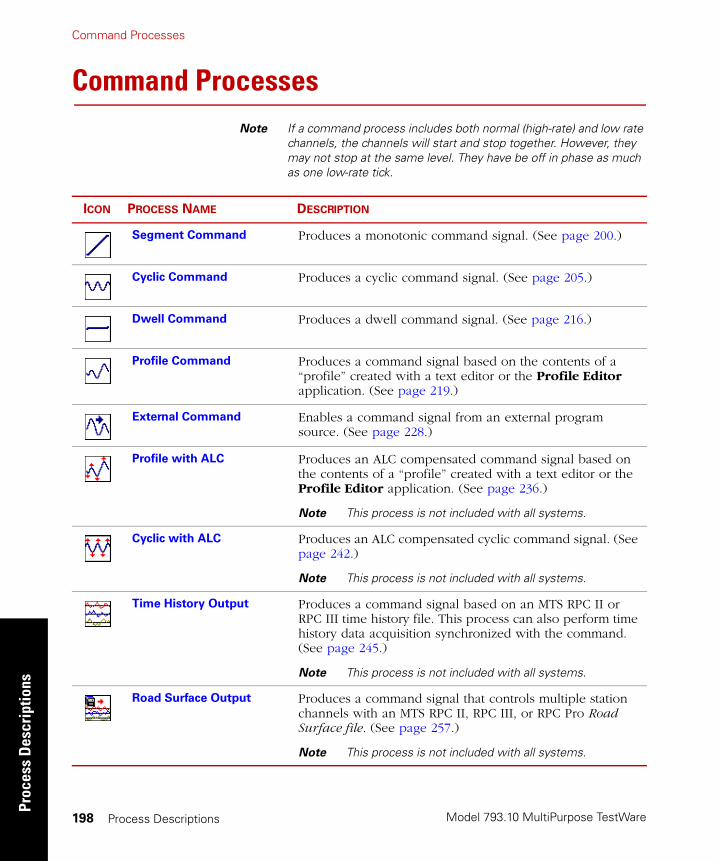
Model 793.10 MultiPurpose TestWare
Command ProcessesPr
oces
s D
escr
iptio
ns
Process Descriptions198
Command ProcessesNote If a command process includes both normal (high-rate) and low rate
channels, the channels will start and stop together. However, they may not stop at the same level. They have be off in phase as much as one low-rate tick.
ICON PROCESS NAME DESCRIPTION
Segment Command Produces a monotonic command signal. (See page 200.)
Cyclic Command Produces a cyclic command signal. (See page 205.)
Dwell Command Produces a dwell command signal. (See page 216.)
Profile Command Produces a command signal based on the contents of a “profile” created with a text editor or the Profile Editor application. (See page 219.)
External Command Enables a command signal from an external program source. (See page 228.)
Profile with ALC Produces an ALC compensated command signal based on the contents of a “profile” created with a text editor or the Profile Editor application. (See page 236.)
Note This process is not included with all systems.
Cyclic with ALC Produces an ALC compensated cyclic command signal. (See page 242.)
Note This process is not included with all systems.
Time History Output Produces a command signal based on an MTS RPC II or RPC III time history file. This process can also perform time history data acquisition synchronized with the command. (See page 245.)
Note This process is not included with all systems.
Road Surface Output Produces a command signal that controls multiple station channels with an MTS RPC II, RPC III, or RPC Pro Road Surface file. (See page 257.)
Note This process is not included with all systems.

Command Processes
Model 793.10 MultiPurpose TestWare
Process Descriptions
Process Descriptions 199
About Command Compensation
The Adaptive Compensators list includes all compensators available on at least one channel selected in the Channels tab. It is important to know which compensator is available for each channel in your station configuration because when this process is executed, compensation will occur only on the channels for which it was enabled.
Note A special annotation appears if the compensator is not available on all channels. For example, “AIC (1 of 3)” implies that the AIC compensator is only supported on one of the three included channels.
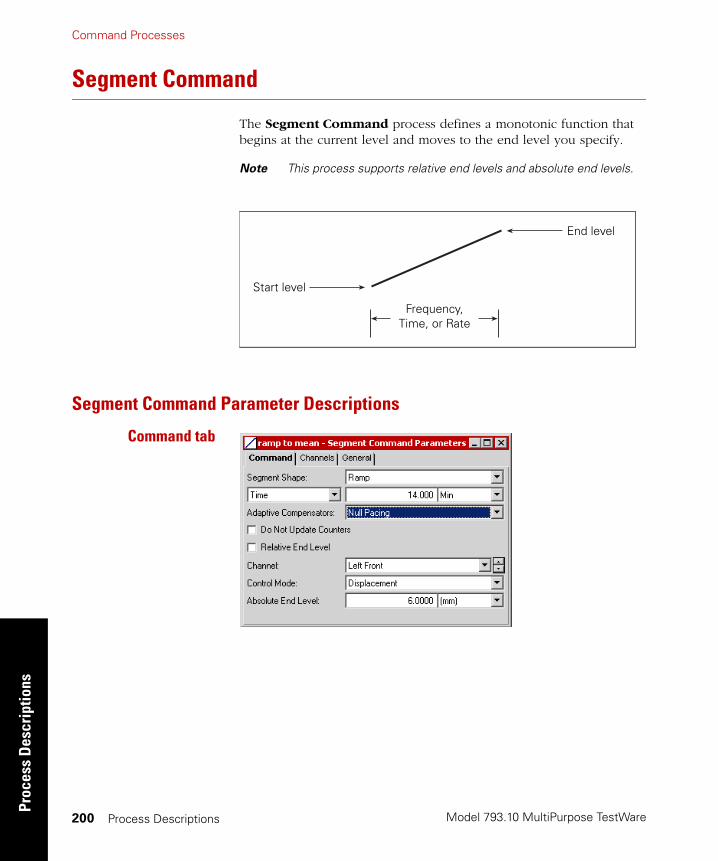
Model 793.10 MultiPurpose TestWare
Command ProcessesPr
oces
s D
escr
iptio
ns
Process Descriptions200
Segment Command
The Segment Command process defines a monotonic function that begins at the current level and moves to the end level you specify.
Note This process supports relative end levels and absolute end levels.
Segment Command Parameter Descriptions
Command tab
End level
Start level
Frequency, Time, or Rate
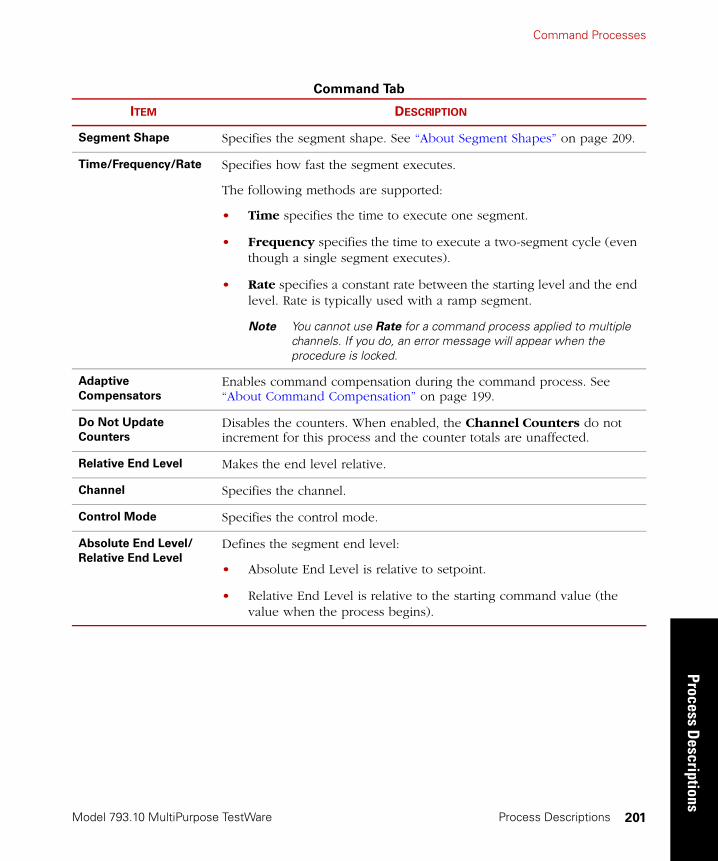
Command Processes
Model 793.10 MultiPurpose TestWare
Process Descriptions
Process Descriptions 201
Command Tab
ITEM DESCRIPTION
Segment Shape Specifies the segment shape. See “About Segment Shapes” on page 209.
Time/Frequency/Rate Specifies how fast the segment executes.
The following methods are supported:
• Time specifies the time to execute one segment.
• Frequency specifies the time to execute a two-segment cycle (even though a single segment executes).
• Rate specifies a constant rate between the starting level and the end level. Rate is typically used with a ramp segment.
Note You cannot use Rate for a command process applied to multiple channels. If you do, an error message will appear when the procedure is locked.
Adaptive
Compensators
Enables command compensation during the command process. See “About Command Compensation” on page 199.
Do Not Update
Counters
Disables the counters. When enabled, the Channel Counters do not increment for this process and the counter totals are unaffected.
Relative End Level Makes the end level relative.
Channel Specifies the channel.
Control Mode Specifies the control mode.
Absolute End Level/
Relative End Level
Defines the segment end level:
• Absolute End Level is relative to setpoint.
• Relative End Level is relative to the starting command value (the value when the process begins).

Model 793.10 MultiPurpose TestWare
Command ProcessesPr
oces
s D
escr
iptio
ns
Process Descriptions202
Channels tab Displays the channels available to this process. Use the arrow keys to move desired channels from the Available list to the Included list.
General tab
General Tab
ITEM DESCRIPTION
Name Specifies the process name displayed on the Procedure or Group process window.
Process Enabled Enables the process. (Clear this box to disable the process.)
Execute Process Specifies the number of times the process will be executed.
Counter Type Enables a process counter.
Options are None, Transient, or Fixed. Transient counters are displayed only when the process is active. Fixed counters are displayed throughout the test.
Counter Label Names the counter.
When you run the test, this name appears under Sequence Counters on the MPT control panel.
Note If this box is blank, the process name is used as the counter label.

Command Processes
Model 793.10 MultiPurpose TestWare
Process Descriptions
Process Descriptions 203
How to Define a Segment Command Process
1. Drag the icon from the Process Palette to your Group or
Procedure table.
2. Double-click the process icon in your Group or Procedure table.
3. Click the Channels tab.
4. Move the channels that you want to use to generate the command onto the Included list. Move all other channels to the Available list.
5. Click the Command tab.
6. In the Segment Shape list, click the segment shape.
7. Set the Time, Rate, or Frequency dimension; set the units of measurement; and then type a value.
8. Optional—In the Adaptive Compensators list, click a compensator.
9. Optional—If you do not want channel counters to increment when this process runs, click Do Not Update Counters.
10. Optional—If you want to define a relative end level, select the Relative End Levels check box.
11. In the Channel list, click your desired channel.
12. In the Control Mode list, click your desired control mode.
13. In the End Level box, set the units of measurement, and then type an end level value.
14. Repeat steps 11 - 13 for each channel you want to command with this segment process.

Model 793.10 MultiPurpose TestWare
Command ProcessesPr
oces
s D
escr
iptio
ns
Process Descriptions204
15. Click the General tab.
16. In the Name box, type a name for this process. (You can also name the process in the Procedure table.)
17. Select the Process Enabled check box. (If this box is cleared, the process will not execute.)
18. In the Execute Process box, enter the number of times you want the process to execute.
19. Optional—In the Counter Type list, click a counter type.
20. Optional—If you enabled a counter, type a Counter Label.
21. Close the parameters window, and set the desired Start and Interrupt triggers for the process in the Group or Procedure table.

Command Processes
Model 793.10 MultiPurpose TestWare
Process Descriptions
Process Descriptions 205
Cyclic Command
The Cyclic Command process defines a cyclic command by assembling two single segments and repeating them continuously for a specified number of cycles.
More About the Cyclic Command Process
When a cyclic command starts, it always moves first to End Level 1, and then to End Level 2.
Sine, ramp, andsquare start levels
Sine, ramp, and square commands use the first segment of the cyclic command to bridge any difference between the current level and the cyclic command End Level 1 that you specify. This transition segment is counted as the first segment.
+ =
One cycle command works like two segment commands.
Segment Segment Cycle
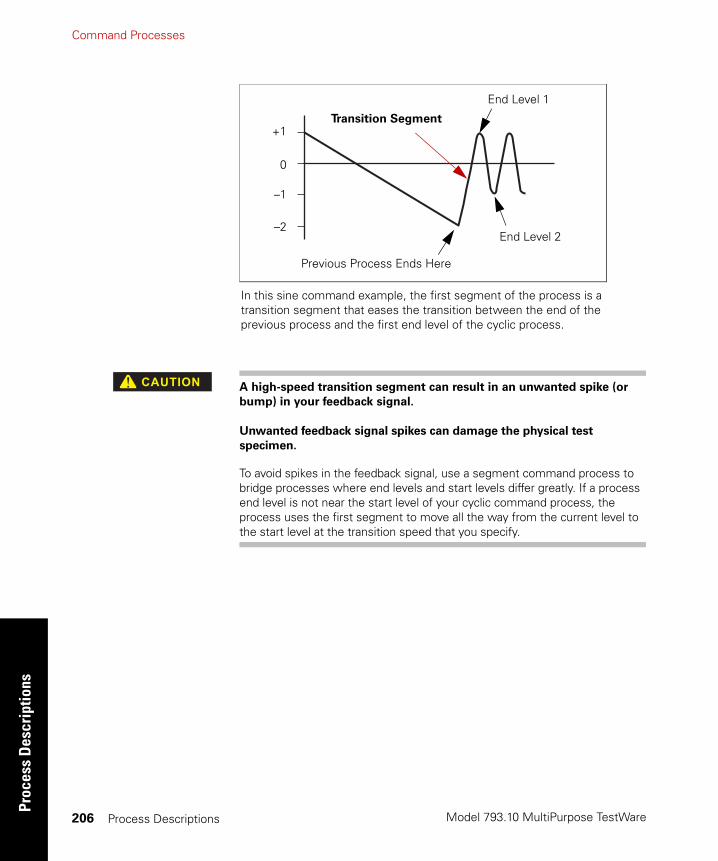
Model 793.10 MultiPurpose TestWare
Command ProcessesPr
oces
s D
escr
iptio
ns
Process Descriptions206
A high-speed transition segment can result in an unwanted spike (or
bump) in your feedback signal.
Unwanted feedback signal spikes can damage the physical test
specimen.
To avoid spikes in the feedback signal, use a segment command process to bridge processes where end levels and start levels differ greatly. If a process end level is not near the start level of your cyclic command process, the process uses the first segment to move all the way from the current level to the start level at the transition speed that you specify.
In this sine command example, the first segment of the process is a transition segment that eases the transition between the end of the previous process and the first end level of the cyclic process.
+1
0
–1
–2End Level 2
Transition Segment
Previous Process Ends Here
End Level 1
�������
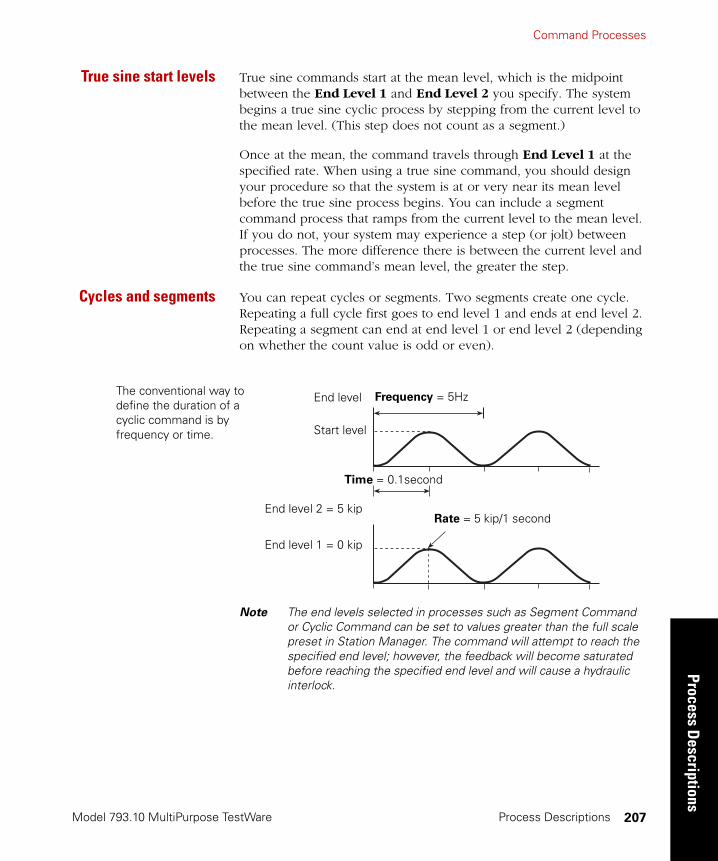
Command Processes
Model 793.10 MultiPurpose TestWare
Process Descriptions
Process Descriptions 207
True sine start levels True sine commands start at the mean level, which is the midpoint between the End Level 1 and End Level 2 you specify. The system begins a true sine cyclic process by stepping from the current level to the mean level. (This step does not count as a segment.)
Once at the mean, the command travels through End Level 1 at the specified rate. When using a true sine command, you should design your procedure so that the system is at or very near its mean level before the true sine process begins. You can include a segment command process that ramps from the current level to the mean level. If you do not, your system may experience a step (or jolt) between processes. The more difference there is between the current level and the true sine command’s mean level, the greater the step.
Cycles and segments You can repeat cycles or segments. Two segments create one cycle. Repeating a full cycle first goes to end level 1 and ends at end level 2. Repeating a segment can end at end level 1 or end level 2 (depending on whether the count value is odd or even).
Note The end levels selected in processes such as Segment Command or Cyclic Command can be set to values greater than the full scale preset in Station Manager. The command will attempt to reach the specified end level; however, the feedback will become saturated before reaching the specified end level and will cause a hydraulic interlock.
The conventional way to define the duration of a cyclic command is by frequency or time.
End level
Start level
End level 2 = 5 kip
End level 1 = 0 kip
Frequency = 5Hz
Rate = 5 kip/1 second
Time = 0.1second

Model 793.10 MultiPurpose TestWare
Command ProcessesPr
oces
s D
escr
iptio
ns
Process Descriptions208
End levels The two end levels specify the amplitude of the cyclic waveform. When two test command processes with different end levels are sequenced, the transition between them is accomplished at the rate and segment shape of the following process. This provides a smooth transition between test commands.
Example Assume a cyclic command completes its process at End Level 2 (in this case, +2 cm). The next Cyclic Command process is defined as End Level 1 = –1 cm and End Level 2 = +1 cm. The transition segment bridges the two commands from the +2 cm level to the –1 cm level at the time, rate, or frequency of the second process.

Command Processes
Model 793.10 MultiPurpose TestWare
Process Descriptions
Process Descriptions 209
About Segment Shapes
Each of the following examples uses the following parameters: Frequency (Hz) 1, Count (segments) 6, Level 1 (mm) 2, Level 2 (mm) 4, with a starting level of 0.0.
Square
Ramp
Sine
������
������
������������ ������ ������ ������ �����
�� ��� ��
������
�
�
������
������
������������ ������ ������ ������ �����
�� ��� ��
������
�
�
������
������
������ ������ ������ ������ ������ �����
�� ��� ��
������
�
�
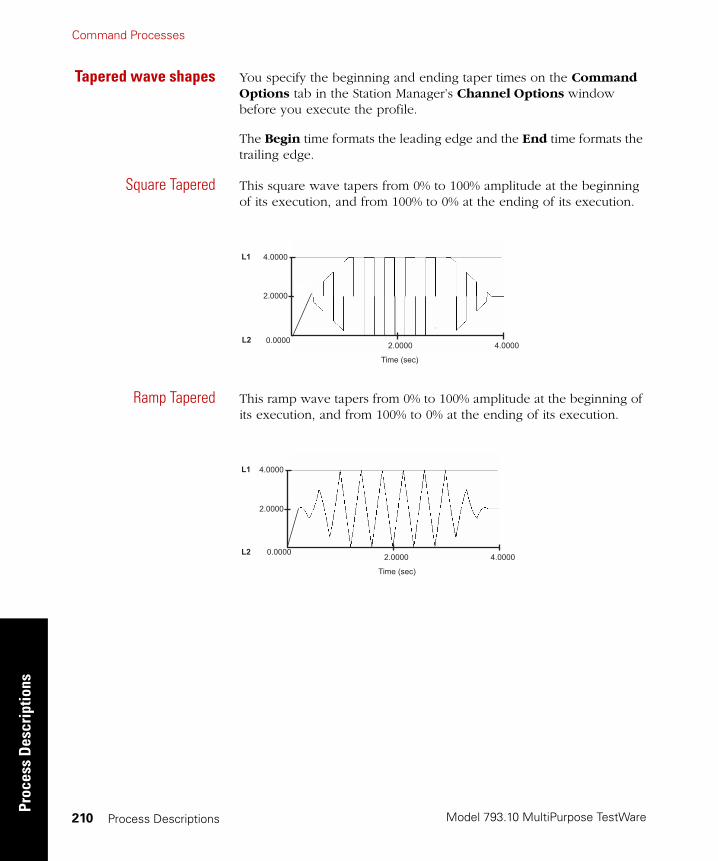
Model 793.10 MultiPurpose TestWare
Command ProcessesPr
oces
s D
escr
iptio
ns
Process Descriptions210
Tapered wave shapes You specify the beginning and ending taper times on the Command Options tab in the Station Manager’s Channel Options window before you execute the profile.
The Begin time formats the leading edge and the End time formats the trailing edge.
Square Tapered This square wave tapers from 0% to 100% amplitude at the beginning of its execution, and from 100% to 0% at the ending of its execution.
Ramp Tapered This ramp wave tapers from 0% to 100% amplitude at the beginning of its execution, and from 100% to 0% at the ending of its execution.
������
������
������������
�� ��� ��
������
�
�
������
������
������������
�� ��� ��
������
�
�
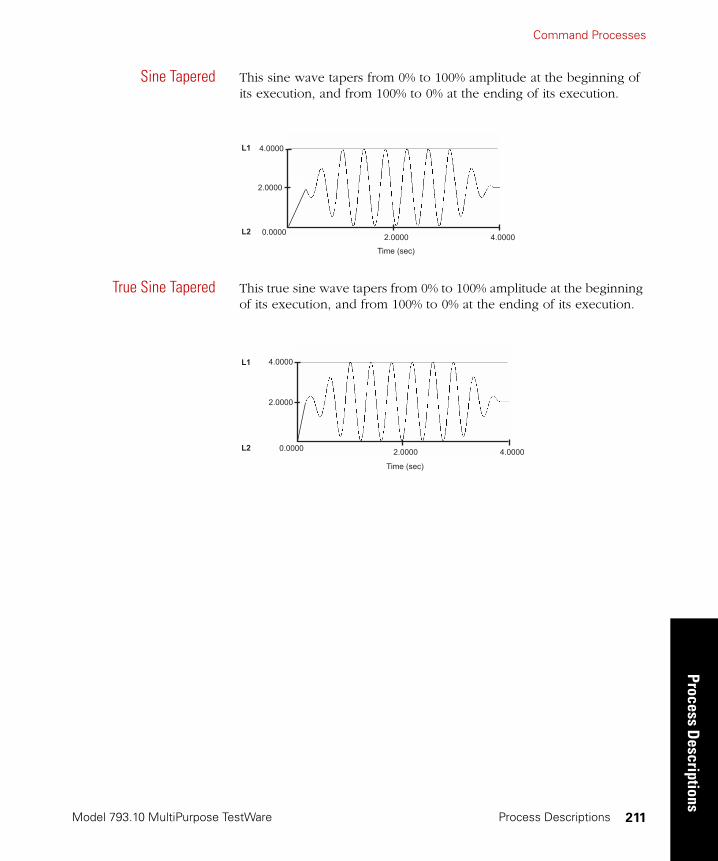
Command Processes
Model 793.10 MultiPurpose TestWare
Process Descriptions
Process Descriptions 211
Sine Tapered This sine wave tapers from 0% to 100% amplitude at the beginning of its execution, and from 100% to 0% at the ending of its execution.
True Sine Tapered This true sine wave tapers from 0% to 100% amplitude at the beginning of its execution, and from 100% to 0% at the ending of its execution.
������
������
������������
�� ��� ��
������
�
�
������
������
������ ������
�� ��� ��
������
�
�
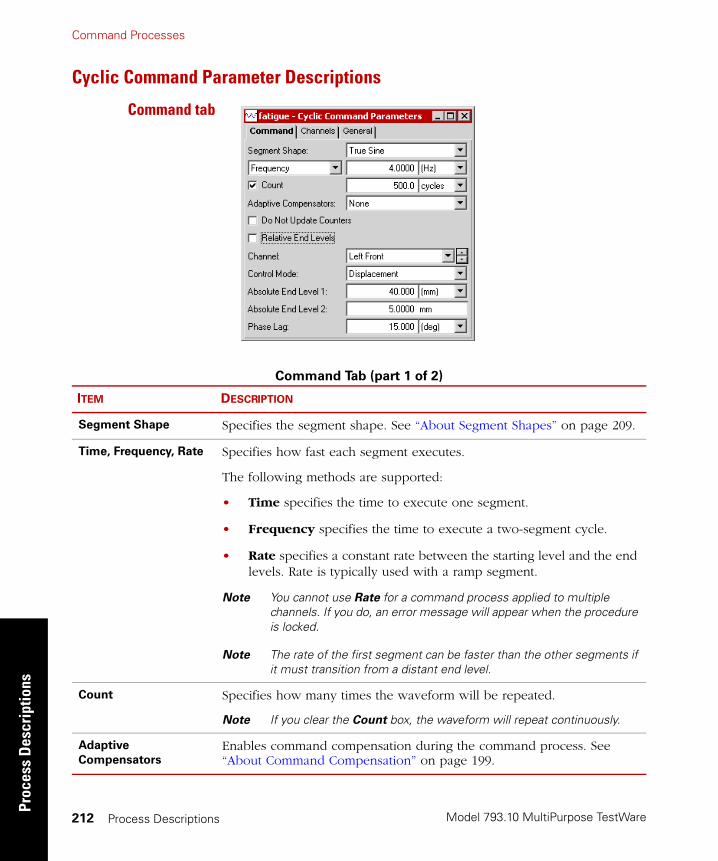
Model 793.10 MultiPurpose TestWare
Command ProcessesPr
oces
s D
escr
iptio
ns
Process Descriptions212
Cyclic Command Parameter Descriptions
Command tab
Command Tab (part 1 of 2)
ITEM DESCRIPTION
Segment Shape Specifies the segment shape. See “About Segment Shapes” on page 209.
Time, Frequency, Rate Specifies how fast each segment executes.
The following methods are supported:
• Time specifies the time to execute one segment.
• Frequency specifies the time to execute a two-segment cycle.
• Rate specifies a constant rate between the starting level and the end levels. Rate is typically used with a ramp segment.
Note You cannot use Rate for a command process applied to multiple channels. If you do, an error message will appear when the procedure is locked.
Note The rate of the first segment can be faster than the other segments if it must transition from a distant end level.
Count Specifies how many times the waveform will be repeated.
Note If you clear the Count box, the waveform will repeat continuously.
Adaptive
Compensators
Enables command compensation during the command process. See “About Command Compensation” on page 199.
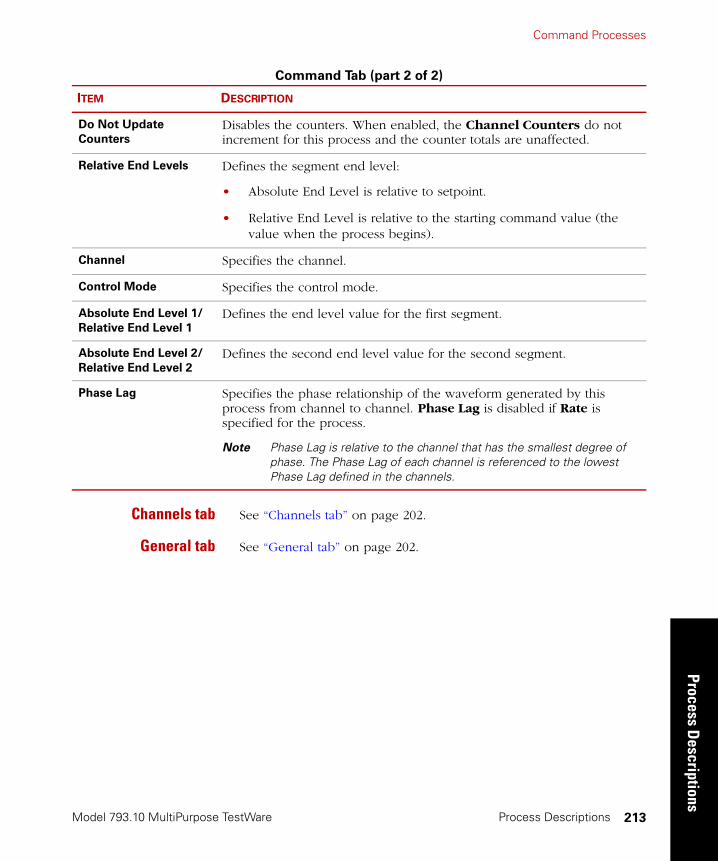
Command Processes
Model 793.10 MultiPurpose TestWare
Process Descriptions
Process Descriptions 213
Channels tab See “Channels tab” on page 202.
General tab See “General tab” on page 202.
Do Not Update
Counters
Disables the counters. When enabled, the Channel Counters do not increment for this process and the counter totals are unaffected.
Relative End Levels Defines the segment end level:
• Absolute End Level is relative to setpoint.
• Relative End Level is relative to the starting command value (the value when the process begins).
Channel Specifies the channel.
Control Mode Specifies the control mode.
Absolute End Level 1/
Relative End Level 1
Defines the end level value for the first segment.
Absolute End Level 2/
Relative End Level 2
Defines the second end level value for the second segment.
Phase Lag Specifies the phase relationship of the waveform generated by this process from channel to channel. Phase Lag is disabled if Rate is specified for the process.
Note Phase Lag is relative to the channel that has the smallest degree of phase. The Phase Lag of each channel is referenced to the lowest Phase Lag defined in the channels.
Command Tab (part 2 of 2)
ITEM DESCRIPTION
Model 793.10 MultiPurpose TestWare
Command ProcessesPr
oces
s D
escr
iptio
ns
Process Descriptions214
How to Define a Cyclic Command Process
1. Drag the icon from the Process Palette to your Group or
Procedure table.
2. Double-click the process icon in your Group or Procedure table.
3. Click the Channels tab.
4. Move all the channels you want to generate the command on to the Included list. Move all the others to the Available list.
5. Click the Command tab.
6. In the Segment Shape list, click the segment shape.
7. Select Time, Rate, or Frequency, set the units of measurement, and then type a value.
8. Select the Count check box. Set the units (cycles or segments), and then type the number of times the cyclic command is to repeat. For continuous cycling, clear the Count check box.
Note The Execute Process value multiplies the Count in the Command parameters. If the Execute Process parameter is set to 10 and the Command Count is set to 5, a total of 50 cycles will occur.
9. Optional—In the Adaptive Compensators list, click a compensator.
10. Optional—If you do not want channel counters to increment when this process runs, click Do Not Update Counters.
11. Optional—If you want to define a relative end level, select the Relative End Levels check box.
12. In the Channel list, click your desired channel.
13. In the Control Mode list, click your desired control mode.
14. Set the units of measurement for the end levels, then enter values for End Level 1 and End Level 2.
15. Optional—In the Phase Lag box, type a value.
16. Repeat steps 12 through 15 for each channel you want to command with this process.
17. Click the General tab.
Command Processes
Model 793.10 MultiPurpose TestWare
Process Descriptions
Process Descriptions 215
18. In the Name box, type a name for this process. (You can also name the process in the Procedure table.)
19. Select the Process Enabled check box. (If this box is cleared, the process will not execute.)
20. In the Execute Process box, type number of times you want the process to execute.
21. Optional—In the Counter Type list, click a counter type.
22. Optional—If you enabled a counter, type a Counter Label.
23. Close the parameters window, and set the desired Start and Interrupt signals for the process in the Group or Procedure table.

Model 793.10 MultiPurpose TestWare
Command ProcessesPr
oces
s D
escr
iptio
ns
Process Descriptions216
Dwell Command
The Dwell Command process is a single segment designed to hold your command at a static level for a specified amount of time.
When you define a Dwell Command process you must specify the duration of the command as a time or a frequency:
• Time specifies the amount of time to execute the single dwell command segment.
• Frequency specifies the frequency of a command cycle (two-segments). Since a dwell command is a single segment, the actual dwell command hold time is half of the frequency setting. (For example, a frequency setting of 2 Hz holds the command for 0.25 seconds.)
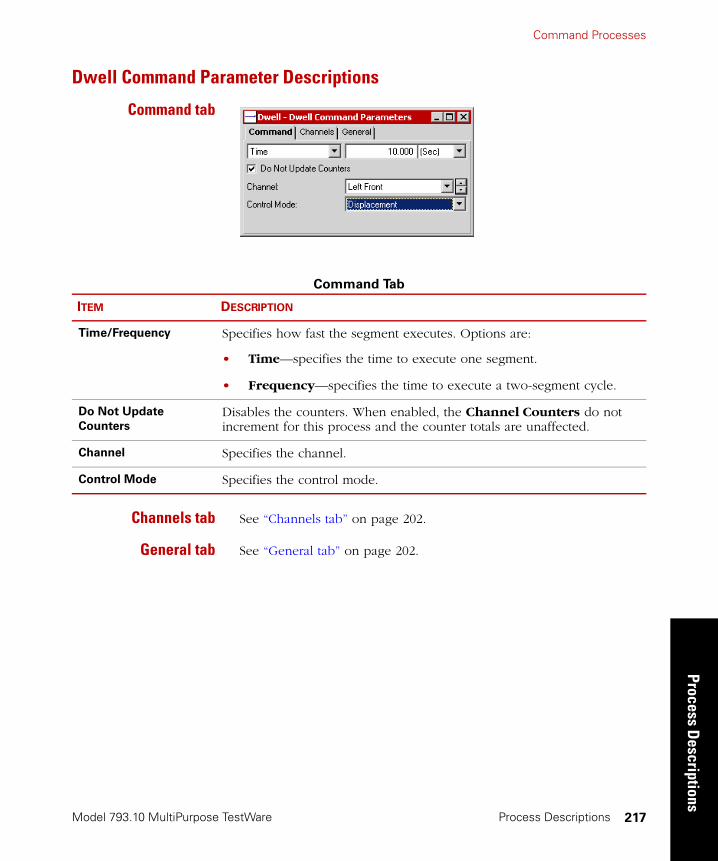
Command Processes
Model 793.10 MultiPurpose TestWare
Process Descriptions
Process Descriptions 217
Dwell Command Parameter Descriptions
Command tab
Channels tab See “Channels tab” on page 202.
General tab See “General tab” on page 202.
Command Tab
ITEM DESCRIPTION
Time/Frequency Specifies how fast the segment executes. Options are:
• Time—specifies the time to execute one segment.
• Frequency—specifies the time to execute a two-segment cycle.
Do Not Update
Counters
Disables the counters. When enabled, the Channel Counters do not increment for this process and the counter totals are unaffected.
Channel Specifies the channel.
Control Mode Specifies the control mode.

Model 793.10 MultiPurpose TestWare
Command ProcessesPr
oces
s D
escr
iptio
ns
Process Descriptions218
How to Define a Dwell Command Process
1. Drag the icon from the Process Palette to your Group or
Procedure table.
2. Double-click the process icon in your Group or Procedure table.
3. Click the Channels tab.
4. Move the channels that you want to use to generate the command onto the Included list. Move all the others to the Available list.
5. Click the Command tab.
6. Select Time or Frequency, set the units of measurement, then type a value.
7. Optional—If you do not want channel counters to increment when this process runs, click Do Not Update Counters.
8. In the Channel list, click your desired channel.
9. In the Control Mode list, click your desired control mode.
10. Repeat steps 8 and 9 for each channel you wish to control.
11. Click the General tab.
12. In the Name box, type a name for this process. (You can also name the process in the Procedure table.)
13. Select the Process Enabled check box. (If this box is cleared, the process will not execute.)
14. In the Execute Process box, enter the number of times you want the process to execute.
15. Optional—In the Counter Type list, click a counter type.
16. Optional—If you enabled a counter, type a Counter Label.
17. Close the parameters window, and set the desired Start and Interrupt signals for the process in the Group or Procedure table.

Command Processes
Model 793.10 MultiPurpose TestWare
Process Descriptions
Process Descriptions 219
Profile Command
The Profile Command process generates a command based on a profile file (or just profile for short) created with a text editor, spreadsheet application, or the MTS Profile Editor application. The MPT application supports Block-Arbitrary and Phase profile formats.
For additional information on profiles in general and syntax requirements for profiles, see “General Profile Syntax Requirements” on page 463.
More About Profiles
A profile is basically a spreadsheet that defines a particular command segment (or a series of segments) in each row. As the controller plays out the profile, it starts by playing the segment or cycle defined in the first row, then the second row, then the third row, and so forth.
Note A single profile often contains the command content of an entire procedure.
When you create a profile, you must define the segment shape, end levels values, time between end levels, and count for the command in each row. For information on creating profiles with the Profile Editor application, see the Model 793.11 Profile Editor manual.
User-defined actionsand counter names
The profile process supports counters and user-defined actions. Counters appear on the MPT control panel when the process is running and are incremented after the corresponding row in the profile has played out.
Sample Profile
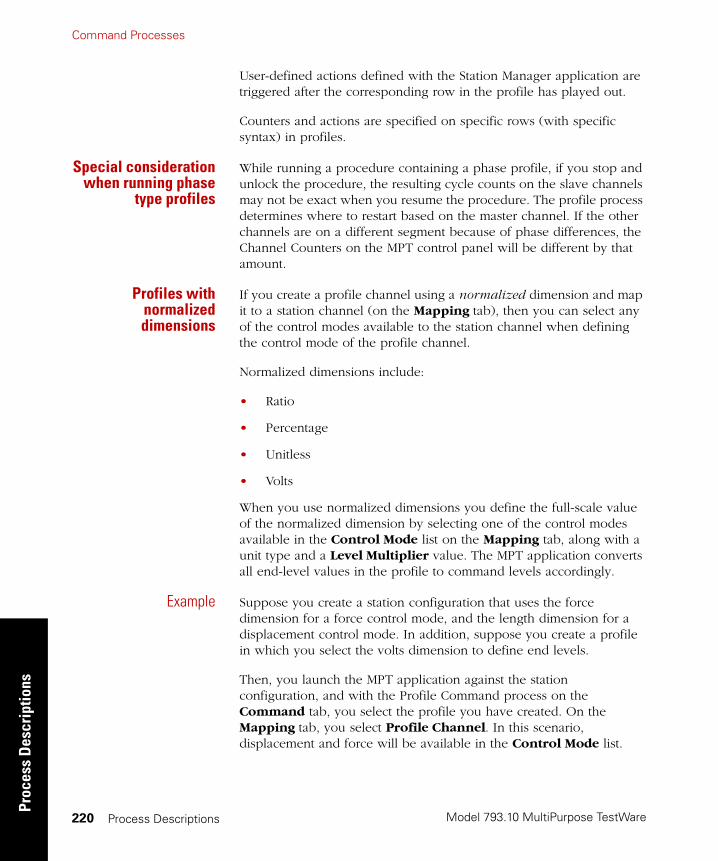
Model 793.10 MultiPurpose TestWare
Command ProcessesPr
oces
s D
escr
iptio
ns
Process Descriptions220
User-defined actions defined with the Station Manager application are triggered after the corresponding row in the profile has played out.
Counters and actions are specified on specific rows (with specific syntax) in profiles.
Special considerationwhen running phase
type profiles
While running a procedure containing a phase profile, if you stop and unlock the procedure, the resulting cycle counts on the slave channels may not be exact when you resume the procedure. The profile process determines where to restart based on the master channel. If the other channels are on a different segment because of phase differences, the Channel Counters on the MPT control panel will be different by that amount.
Profiles withnormalizeddimensions
If you create a profile channel using a normalized dimension and map it to a station channel (on the Mapping tab), then you can select any of the control modes available to the station channel when defining the control mode of the profile channel.
Normalized dimensions include:
• Ratio
• Percentage
• Unitless
• Volts
When you use normalized dimensions you define the full-scale value of the normalized dimension by selecting one of the control modes available in the Control Mode list on the Mapping tab, along with a unit type and a Level Multiplier value. The MPT application converts all end-level values in the profile to command levels accordingly.
Example Suppose you create a station configuration that uses the force dimension for a force control mode, and the length dimension for a displacement control mode. In addition, suppose you create a profile in which you select the volts dimension to define end levels.
Then, you launch the MPT application against the station configuration, and with the Profile Command process on the Command tab, you select the profile you have created. On the Mapping tab, you select Profile Channel. In this scenario, displacement and force will be available in the Control Mode list.
Command Processes
Model 793.10 MultiPurpose TestWare
Process Descriptions
Process Descriptions 221
Suppose you select displacement in the control mode list, and enter a value of 10 cm in the Level Multiplier box. This will cause all of the end-level values in the profile to be converted to displacement values. For volts, the full-scale value equals 10 V, which the MPT application will play out as 10 cm. So in this case, if the first end-level values in the profile are 2 V and 9 V, they will be played out as 2 cm and 9 cm.
Using the same profile, suppose you change the Control Mode selection to force, and enter a Level Multiplier value of 100 N. This will cause all of the end levels in the profile to be converted to force values. In this case, the MPT application will play out 10 V as 100 N. So if the first end-level values in the profile are 2 V and 9 V, they will be played out as 20 N and 90 N.
Full-scale values ofnormalized dimensions
Ratio = 1:1
Percentage = 100%
Unitless = 1.0
Volts = 10 V
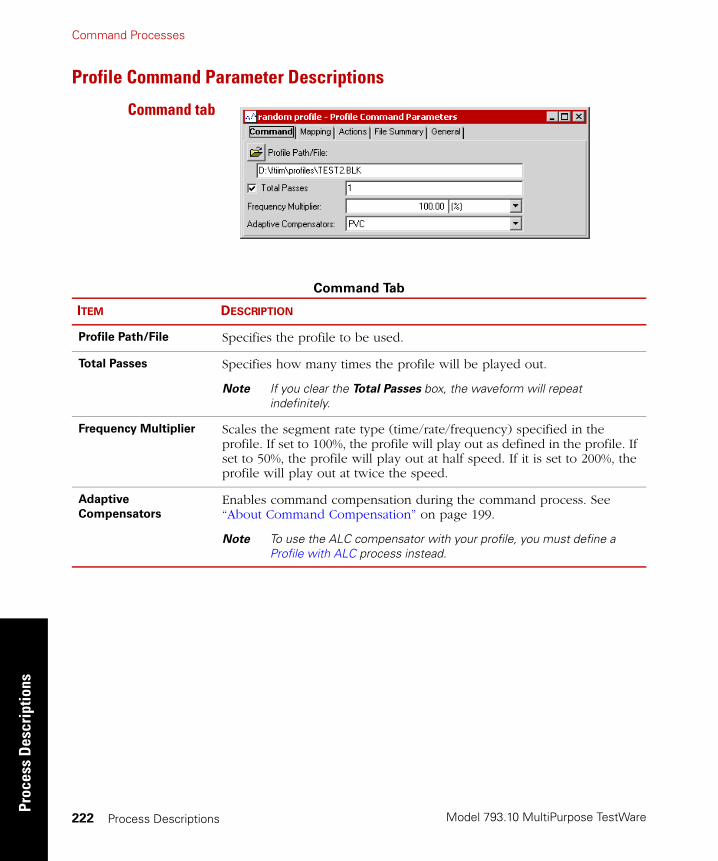
Model 793.10 MultiPurpose TestWare
Command ProcessesPr
oces
s D
escr
iptio
ns
Process Descriptions222
Profile Command Parameter Descriptions
Command tab
Command Tab
ITEM DESCRIPTION
Profile Path/File Specifies the profile to be used.
Total Passes Specifies how many times the profile will be played out.
Note If you clear the Total Passes box, the waveform will repeat indefinitely.
Frequency Multiplier Scales the segment rate type (time/rate/frequency) specified in the profile. If set to 100%, the profile will play out as defined in the profile. If set to 50%, the profile will play out at half speed. If it is set to 200%, the profile will play out at twice the speed.
Adaptive
Compensators
Enables command compensation during the command process. See “About Command Compensation” on page 199.
Note To use the ALC compensator with your profile, you must define a Profile with ALC process instead.
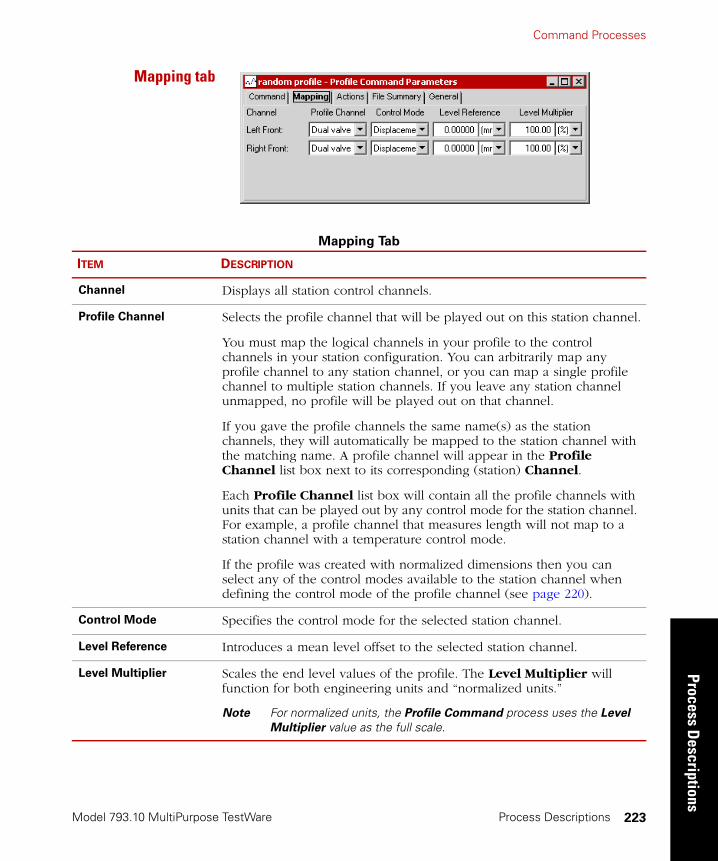
Command Processes
Model 793.10 MultiPurpose TestWare
Process Descriptions
Process Descriptions 223
Mapping tab
Mapping Tab
ITEM DESCRIPTION
Channel Displays all station control channels.
Profile Channel Selects the profile channel that will be played out on this station channel.
You must map the logical channels in your profile to the control channels in your station configuration. You can arbitrarily map any profile channel to any station channel, or you can map a single profile channel to multiple station channels. If you leave any station channel unmapped, no profile will be played out on that channel.
If you gave the profile channels the same name(s) as the station channels, they will automatically be mapped to the station channel with the matching name. A profile channel will appear in the Profile Channel list box next to its corresponding (station) Channel.
Each Profile Channel list box will contain all the profile channels with units that can be played out by any control mode for the station channel. For example, a profile channel that measures length will not map to a station channel with a temperature control mode.
If the profile was created with normalized dimensions then you can select any of the control modes available to the station channel when defining the control mode of the profile channel (see page 220).
Control Mode Specifies the control mode for the selected station channel.
Level Reference Introduces a mean level offset to the selected station channel.
Level Multiplier Scales the end level values of the profile. The Level Multiplier will function for both engineering units and “normalized units.”
Note For normalized units, the Profile Command process uses the Level
Multiplier value as the full scale.
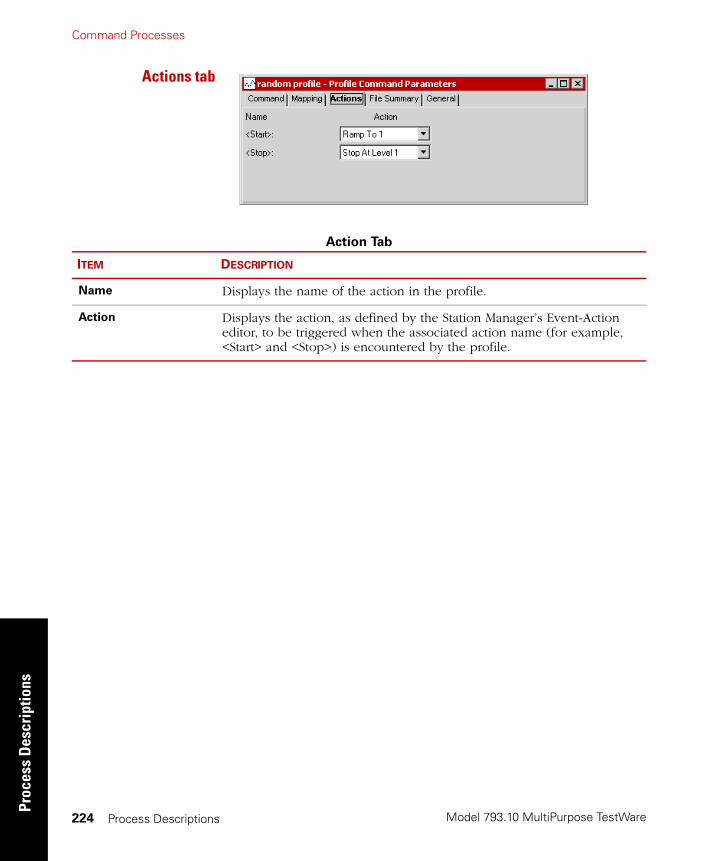
Model 793.10 MultiPurpose TestWare
Command ProcessesPr
oces
s D
escr
iptio
ns
Process Descriptions224
Actions tab
Action Tab
ITEM DESCRIPTION
Name Displays the name of the action in the profile.
Action Displays the action, as defined by the Station Manager’s Event-Action editor, to be triggered when the associated action name (for example, <Start> and <Stop>) is encountered by the profile.

Command Processes
Model 793.10 MultiPurpose TestWare
Process Descriptions
Process Descriptions 225
File Summary tab
General tab See “General tab” on page 202.
File Summary Tab
ITEM DESCRIPTION
Profile Channel Displays all available profile channels.
Units Displays the unit of measurement for the end level dimension.
Maximum Displays the maximum value for the channel.
Note This may be zero if the profile was not created using the MTS Profile
Editor application.
Minimum Displays the minimum value for the channel.
Note This may be zero if the profile was not created using the MTS Profile
Editor application.
Station Channels Displays the station control channels where the profile will be played out.
Note This box is blank if you have not mapped the profile channel to a station channel on the Mapping tab.
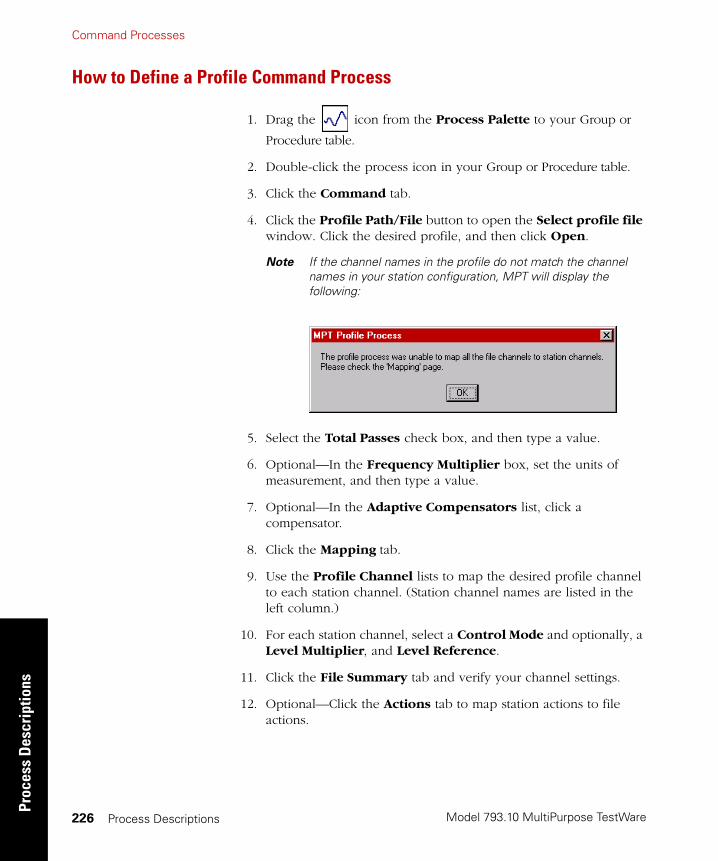
Model 793.10 MultiPurpose TestWare
Command ProcessesPr
oces
s D
escr
iptio
ns
Process Descriptions226
How to Define a Profile Command Process
1. Drag the icon from the Process Palette to your Group or
Procedure table.
2. Double-click the process icon in your Group or Procedure table.
3. Click the Command tab.
4. Click the Profile Path/File button to open the Select profile file window. Click the desired profile, and then click Open.
Note If the channel names in the profile do not match the channel names in your station configuration, MPT will display the following:
5. Select the Total Passes check box, and then type a value.
6. Optional—In the Frequency Multiplier box, set the units of measurement, and then type a value.
7. Optional—In the Adaptive Compensators list, click a compensator.
8. Click the Mapping tab.
9. Use the Profile Channel lists to map the desired profile channel to each station channel. (Station channel names are listed in the left column.)
10. For each station channel, select a Control Mode and optionally, a Level Multiplier, and Level Reference.
11. Click the File Summary tab and verify your channel settings.
12. Optional—Click the Actions tab to map station actions to file actions.
Command Processes
Model 793.10 MultiPurpose TestWare
Process Descriptions
Process Descriptions 227
13. Click the General tab.
14. In the Name box, type a name for this process. (You can also name the process in the Procedure table.)
15. Select the Process Enabled check box. (If this box is cleared, the process will not execute.)
16. In the Execute Process box, enter the number of times you want the process to execute.
Note The Execute Process value multiplies the Total Passes in the Command parameters. If the Execute Process parameter is set to 10 and the Total Passes is set to 5, a total of 50 passes will occur.
17. Optional—In the Counter Type list, click a counter type.
18. Optional—If you enabled a counter, type a Counter Label.
19. Close the parameters window, and set the desired Start and Interrupt signals for the process in the Group or Procedure table.

Model 793.10 MultiPurpose TestWare
Command ProcessesPr
oces
s D
escr
iptio
ns
Process Descriptions228
External Command
The External Command process accommodates program inputs from an external programmer or controller.
Before you can use an External Command process, you must:
• Connect the external command source to your controller.
• Use Station Builder to allocate an analog input resource (for the command input signal).
• Adjust the command input signals with the Station Manager application.
When you define an External Command process, you must define the command ramp time and which channel(s) the process will control.
Soft Start
Next, the process tapers to external command amplitude.
First, the process ramps fromthe end level of the previous
command process to theexternal command setpoint.
External Command

Command Processes
Model 793.10 MultiPurpose TestWare
Process Descriptions
Process Descriptions 229
More About the External Command Process
Starting externalcommands
If the external command is not running when MPT starts the External Command process, your test will stop responding.
To ensure your external program is running when it is needed, do one of the following:
• Start your external program source before you start your MPT procedure. This ensures that the external command is running when the External Command process starts and limits unwanted bumps in your command signal.
• If your external programmer supports digital input and output signals, configure a Digital Output to start the external program, and a Digital Input Detector to start the External Command process.
Stopping externalcommand processes
Typically, you will use an MPT Data Limit Detector or Digital Input Detector to end the External Command process.
• You can use a Data Limit Detector to interrupt the External Command process after a specified time period or when specified signal limits are reached.
• If your external programmer can issue a signal when the program is complete, you can use a Digital Input Detector to interrupt the External Command process.
• You can stop the External Command process manually by pressing the stop control on the Station Controls panel. This stops the process and the procedure.
• You can resume the External Command process by pressing the run control on the Station Controls panel.
When the External Command process stops or is interrupted, the signal tapers to the setpoint specified on the Scaling tab. If a setpoint is not specified on the Scaling tab, the signal tapers to the system setpoint.
If you click Run after holding the command, the command will ramp back to setpoint, and then it will taper up to the defined level. (The initial ramp will be skipped if all the channels are still at the setpoint.)

Model 793.10 MultiPurpose TestWare
Command ProcessesPr
oces
s D
escr
iptio
ns
Process Descriptions230
Setpoint/spansettings
You can also define a different setpoint and span to be used while the external command process plays out.
You should understand how setpoint and span settings on the different Station Manager and MPT windows affect one another.
• Scaling tab External Command Parameters window, MPT application.
The Change Setpoints and Change Spans check boxes let you override the system setpoint and span values while the process is being executed.
• Setpoint and Span window, Station Manager application.
This window contains the system setpoint (Setpoint slider) and span (Span slider) values that the External Command process overrides while the process is being executed.
• Command Options tab, Channel Options window, Station Manager application.
The value in the Setpoint entry box determines the default rate at which the controller ramps to the setpoint value entered in the External Command Parameters window. Likewise, the Begin control determines the rate at which the controller ramps the external program to the span value entered in the External Command Parameters window.
• Execution tab, MPT Options Editor, Span and Setpoint controls, MPT application.
The Span and Setpoint controls determine whether you can edit the setpoint and span values entered in the Station Manager’s Span and Setpoint window while the External Command process is being executed.
Command Processes
Model 793.10 MultiPurpose TestWare
Process Descriptions
Process Descriptions 231
Overriding systemsetpoint and span
With the External Command process, you can temporarily override the default system span and setpoint values, even if you select Disable and Reset for the Span and Setpoint controls on the Execution tab of the MPT Options Editor.
To do this, enable the Change Setpoints and/or Change Spans check boxes in the Scaling tab of the External Command Parameters window, and enter span and setpoint values in the associated entry boxes. This causes the span and setpoint values you enter to overwrite system span and setpoint values when MPT executes the External Command process.
The precise way MPT performs the override depends on whether you select Disable and Reset or Enable:
• If you select Disable and Reset, the controller will set span at 100% and setpoint at zero as it plays out the procedure until it begins to play out the External Command process. At that point the controller switches to the External Command process setpoint and span values. When the process is done, the setpoint reverts to zero, and the span reverts to 100% for the remainder of the procedure. With this selection, you cannot make adjustments to the Setpoint and Span sliders while the test is running.
• If you select Enable, the controller will use the system setpoint and span values as it plays out the procedure until it begins to play out the External Command process. At that point, the controller switches to the External Command process setpoint and span values and uses them for the remainder of the procedure. With this selection, you can make adjustments to the Setpoint and Span sliders while the procedure is running.
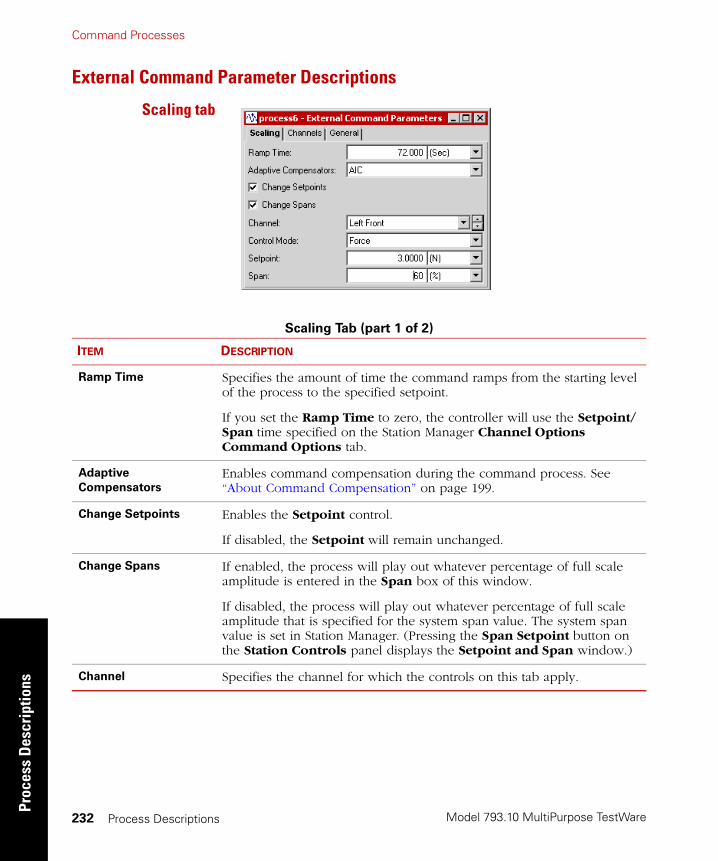
Model 793.10 MultiPurpose TestWare
Command ProcessesPr
oces
s D
escr
iptio
ns
Process Descriptions232
External Command Parameter Descriptions
Scaling tab
Scaling Tab (part 1 of 2)
ITEM DESCRIPTION
Ramp Time Specifies the amount of time the command ramps from the starting level of the process to the specified setpoint.
If you set the Ramp Time to zero, the controller will use the Setpoint/Span time specified on the Station Manager Channel Options Command Options tab.
Adaptive
Compensators
Enables command compensation during the command process. See “About Command Compensation” on page 199.
Change Setpoints Enables the Setpoint control.
If disabled, the Setpoint will remain unchanged.
Change Spans If enabled, the process will play out whatever percentage of full scale amplitude is entered in the Span box of this window.
If disabled, the process will play out whatever percentage of full scale amplitude that is specified for the system span value. The system span value is set in Station Manager. (Pressing the Span Setpoint button on the Station Controls panel displays the Setpoint and Span window.)
Channel Specifies the channel for which the controls on this tab apply.
Command Processes
Model 793.10 MultiPurpose TestWare
Process Descriptions
Process Descriptions 233
Channels tab See “Channels tab” on page 202.
Note Only channels in station configurations that have an external command signal defined in Station Builder are available to this process.
General tab See “General tab” on page 202.
Control mode Specifies the control mode. Only control modes that have the same dimension as the channel’s external input signal are available.
Setpoint Defines the setpoint value for the selected channel.
The value entered in the setpoint box will overwrite the system setpoint value when the process becomes active.
Span Defines the span value for the selected channel.
The value entered in the Span box will overwrite the system span value when the process becomes active.
Scaling Tab (part 2 of 2)
ITEM DESCRIPTION
Model 793.10 MultiPurpose TestWare
Command ProcessesPr
oces
s D
escr
iptio
ns
Process Descriptions234
How to Define an External Command Process
1. Drag the icon from the Process Palette to your Group or
Procedure table.
2. Double-click the process icon in your Group or Procedure table.
3. Click the Channels tab.
4. Move the channels that you want to use to generate the command onto the Included list. Move all other channels to the Available list.
5. Click the Scaling tab.
6. In the Ramp Time box, set the units of measurement, and then type a value.
7. Optional—In the Adaptive Compensators list, click a compensator.
8. Optional—If you want the external command to use a different setpoint than the one specified in Station Manager, select the Change Setpoints check box.
9. Optional—If you want the external command to use a different span than the one specified in Station Manager, select the Change Spans check box.
10. In the Channel list, click your desired channel.
11. In the Control Mode list, click your desired control mode.
12. If you selected Change Setpoints, define the new setpoint value and units in the Setpoint box.
13. If you selected Change Spans, enter a span value for the external command in the Span box.
14. Repeat steps 10 - 13 for each channel you wish command with the External Command process.
Command Processes
Model 793.10 MultiPurpose TestWare
Process Descriptions
Process Descriptions 235
15. Click the General tab.
16. In the Name box, type a name for this process. (You can also name the process in the Procedure table.)
17. Select the Process Enabled check box. (If this box is cleared, the process will not execute.)
18. In the Execute Process box, enter the number of times you want the process to execute.
19. Optional—In the Counter Type list, click a counter type.
20. Optional—If you enabled a counter, type a Counter Label.
21. Close the parameters window, and set the desired Start and Interrupt signals for the process in the Group or Procedure table.
Model 793.10 MultiPurpose TestWare
Command ProcessesPr
oces
s D
escr
iptio
ns
Process Descriptions236
Profile with ALC
The Profile with ALC process works the same as the Profile process (see page 219). You must use the Profile with ALC process if you want to play out a profile and use ALC (arbitrary end-level compensation).
Note The Profile with ALC process is optional. You must enter a special key code during installation to enable this process.
For additional information on creating and playing out profiles, see Appendix C, “Profiles”.
About ALCcompensation
Arbitrary end-level control compensation is an adaptive compensation technique that improves the tracking accuracy of MPT.
ALC compensates for peak and valley errors by building (and continually updating) a matrix of amplitude compensation factors.
For detailed information about the ALC compensator, see the Model 793.00 System Software manual.
Profile with ALC Parameter Descriptions
Command tab See “Command tab” on page 222.
Mapping tab See “Mapping tab” on page 223.
Actions tab See “Actions tab” on page 224.
File Summary tab See “File Summary tab” on page 225.
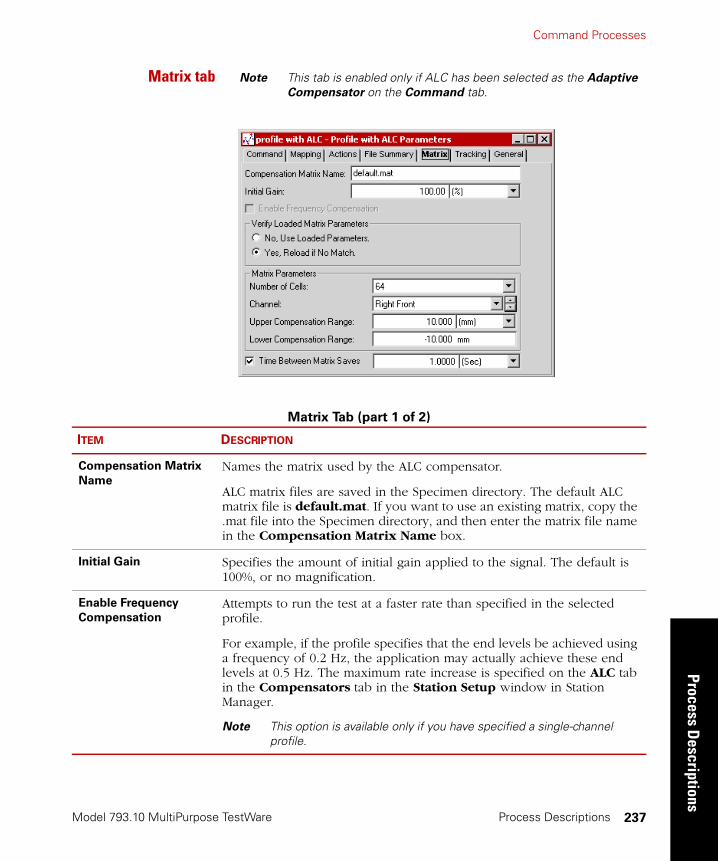
Command Processes
Model 793.10 MultiPurpose TestWare
Process Descriptions
Process Descriptions 237
Matrix tab Note This tab is enabled only if ALC has been selected as the Adaptive
Compensator on the Command tab.
Matrix Tab (part 1 of 2)
ITEM DESCRIPTION
Compensation Matrix
Name
Names the matrix used by the ALC compensator.
ALC matrix files are saved in the Specimen directory. The default ALC matrix file is default.mat. If you want to use an existing matrix, copy the .mat file into the Specimen directory, and then enter the matrix file name in the Compensation Matrix Name box.
Initial Gain Specifies the amount of initial gain applied to the signal. The default is 100%, or no magnification.
Enable Frequency
Compensation
Attempts to run the test at a faster rate than specified in the selected profile.
For example, if the profile specifies that the end levels be achieved using a frequency of 0.2 Hz, the application may actually achieve these end levels at 0.5 Hz. The maximum rate increase is specified on the ALC tab in the Compensators tab in the Station Setup window in Station Manager.
Note This option is available only if you have specified a single-channel profile.
Model 793.10 MultiPurpose TestWare
Command ProcessesPr
oces
s D
escr
iptio
ns
Process Descriptions238
Verify Loaded Matrix
Parameters
Specifies whether you want the application to compare the matrix parameters entered on this Matrix window with the parameters currently loaded in the controller’s real-time.
If you choose No, Use Loaded Parameters the application will disregard any file saved on disk that matches the entered name and use the matrix parameters currently loaded in the controller’s real-time.
If you choose Yes, Reload if No Match. the application will compare the matrix parameters entered in this Matrix window with the parameters currently loaded in the controller’s real-time. If the parameters do not match, the application will redefine the real-time matrix using the parameters currently entered in this Matrix window. In this case the application will also compare the entered parameters with those stored in any file in the current Specimen directory that uses the entered name. If they match, the matrix values from the disk file will be down-loaded into the real-time matrix. If not, the real-time matrix values will be reset to indicate no correction values are present.
To use a saved compensation matrix for the current test, you must copy (using Windows operating software) the desired matrix file into the current Specimen directory before you enter the desired matrix name (as it appears in the Specimen directory) and definition parameters in this window. If the name or other parameters do not match precisely, or if the desired matrix does not exist in the current Specimen directory, the application will create a new real-time matrix with the entered name.
Number of Cells Specifies the number of cells in each axis of the matrix (16, 32, or 64), which determines the resolution of the correction (the higher the number, the greater the resolution).
Channel Selects the channel to which the compensation ranges apply. Compensation ranges must be entered for each channel used by the profile.
Upper Compensation
Range
Specifies the upper range value and associated units of the compensation matrix for the selected channel.
Lower Compensation
Range
Specifies the lower range value and associated units of the compensation matrix for the selected channel.
Time Between Matrix
Saves
Selects the time interval between matrix saves. If you Hold the test, the timer for saving the matrix also holds.
Note If you want the matrix to be saved only at the end of the test, enter a time longer than the profile.
Matrix Tab (part 2 of 2)
ITEM DESCRIPTION
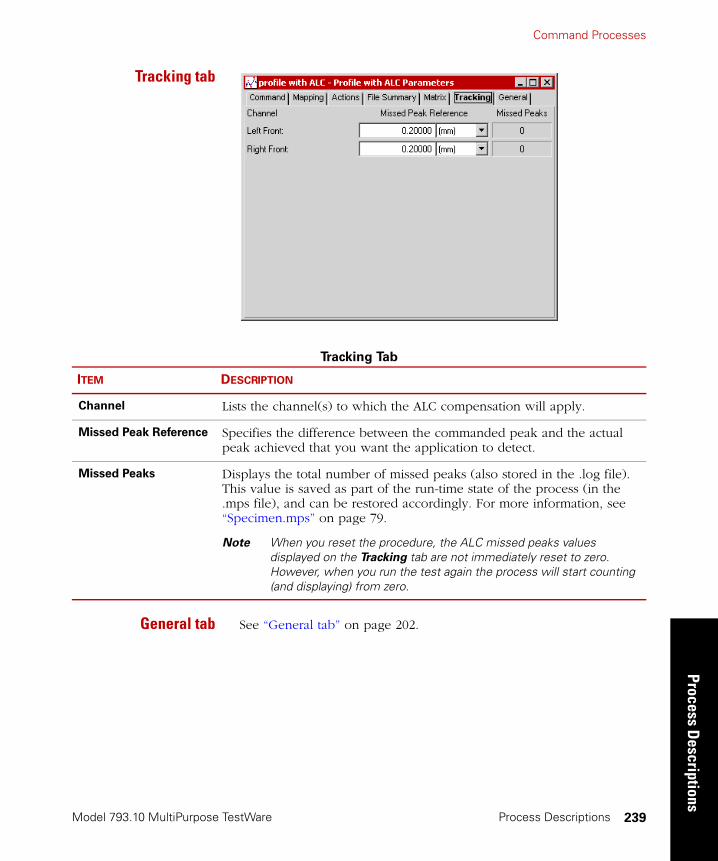
Command Processes
Model 793.10 MultiPurpose TestWare
Process Descriptions
Process Descriptions 239
Tracking tab
General tab See “General tab” on page 202.
Tracking Tab
ITEM DESCRIPTION
Channel Lists the channel(s) to which the ALC compensation will apply.
Missed Peak Reference Specifies the difference between the commanded peak and the actual peak achieved that you want the application to detect.
Missed Peaks Displays the total number of missed peaks (also stored in the .log file). This value is saved as part of the run-time state of the process (in the .mps file), and can be restored accordingly. For more information, see “Specimen.mps” on page 79.
Note When you reset the procedure, the ALC missed peaks values displayed on the Tracking tab are not immediately reset to zero. However, when you run the test again the process will start counting (and displaying) from zero.
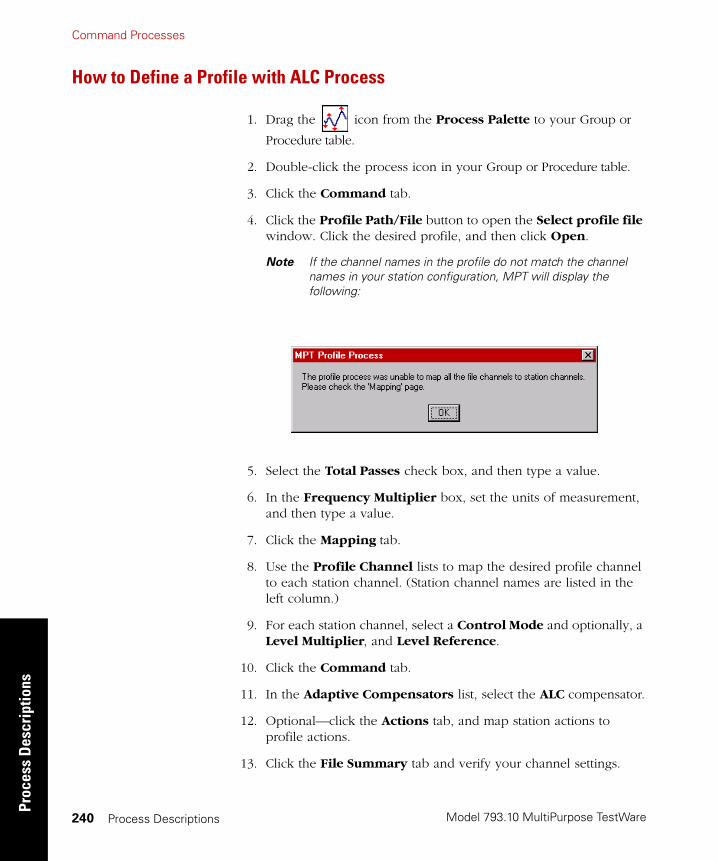
Model 793.10 MultiPurpose TestWare
Command ProcessesPr
oces
s D
escr
iptio
ns
Process Descriptions240
How to Define a Profile with ALC Process
1. Drag the icon from the Process Palette to your Group or
Procedure table.
2. Double-click the process icon in your Group or Procedure table.
3. Click the Command tab.
4. Click the Profile Path/File button to open the Select profile file window. Click the desired profile, and then click Open.
Note If the channel names in the profile do not match the channel names in your station configuration, MPT will display the following:
5. Select the Total Passes check box, and then type a value.
6. In the Frequency Multiplier box, set the units of measurement, and then type a value.
7. Click the Mapping tab.
8. Use the Profile Channel lists to map the desired profile channel to each station channel. (Station channel names are listed in the left column.)
9. For each station channel, select a Control Mode and optionally, a Level Multiplier, and Level Reference.
10. Click the Command tab.
11. In the Adaptive Compensators list, select the ALC compensator.
12. Optional—click the Actions tab, and map station actions to profile actions.
13. Click the File Summary tab and verify your channel settings.

Command Processes
Model 793.10 MultiPurpose TestWare
Process Descriptions
Process Descriptions 241
14. Click the Matrix tab and enter a Compensation Matrix Name.
15. Optional—Select the Enable Frequency Compensation check box.
16. Under Verify Loaded Matrix Parameters, select whether or not you want the application to verify the loaded matrix parameters.
17. Under Matrix Parameters, configure your ALC matrix.
18. Optional—If you want the matrix to be saved, select the Time Between Matrix Saves check box, and then enter a save interval.
19. Click the Tracking tab.
20. Set the units and enter a value for the Missed Peak Reference for each channel.
21. Click the General tab.
22. In the Name box, type a name for this process. (You can also name the process in the Procedure table.)
23. Select the Process Enabled check box. (If this box is cleared, the process will not execute.)
24. In the Execute Process box, enter the number of times you want the process to execute.
25. Optional—In the Counter Type list, click a counter type.
26. Optional—If you enabled a counter, type a Counter Label.
27. Close the parameters window, and set the desired Start and Interrupt signals for the process in the Group or Procedure table.
Model 793.10 MultiPurpose TestWare
Command ProcessesPr
oces
s D
escr
iptio
ns
Process Descriptions242
Cyclic with ALC
The Cyclic with ALC process works the same as the Cyclic process (see page 205). You must use the Cyclic with ALC process if you want to program a cyclic command and use ALC (arbitrary end-level compensation).
Note The Cyclic with ALC process is optional. You must enter a special key code during installation to enable this process.
About ALCcompensation
Arbitrary end-level control compensation is an adaptive compensation technique that improves the tracking accuracy of MPT.
ALC compensates for peak and valley errors by building (and continually updating) a matrix of amplitude compensation factors.
For detailed information on the ALC compensator, see the Model 793.00 System Software manual.
Cyclic with ALC Parameter Descriptions
Command tab See “Command tab” on page 212.
Channels tab See “Channels tab” on page 202.
Matrix tab See “Matrix tab” on page 237.
Tracking tab See “Tracking tab” on page 239.
General tab See “General tab” on page 202.
Command Processes
Model 793.10 MultiPurpose TestWare
Process Descriptions
Process Descriptions 243
How to Define a Cyclic with ALC Process
1. Drag the icon from the Process Palette to your Group or
Procedure table.
2. Double-click the process icon in your Group or Procedure table.
3. Click the Channels tab.
4. Move the channels that you want to use to generate the cyclic command onto the Included list. Move the other channels to the Available list.
5. Click the Command tab.
6. In the Segment Shape list, click the segment shape.
7. Select Time, Rate, or Frequency, and set the units of measurement, and then and type a value.
8. Select the Count check box. Set the units (cycles or segments), and then type the number of times the cyclic command is to repeat. For continuous cycling, clear the Count check box.
9. In the Adaptive Compensators list, click ALC.
10. Optional—If desired, select the Do Not Update Counters check box.
11. Optional—If you want to define a relative end level, select the Relative End Levels check box.
12. Select a Channel.
13. Select a Control Mode.
14. Select the units for the end levels, then enter values for End Level 1 and End Level 2.
15. Enter a Phase Lag.
16. Repeat steps 12 - 15 for each channel you want to command with this process.
17. Click the Matrix tab and enter a Compensation Matrix Name.
18. Optional—Select Enable Frequency Compensation.
19. Choose whether you want the application to verify the loaded matrix parameters.

Model 793.10 MultiPurpose TestWare
Command ProcessesPr
oces
s D
escr
iptio
ns
Process Descriptions244
20. Under Matrix Parameters, configure your ALC matrix.
21. Optional—If you want the matrix to be saved, select the Time Between Matrix Saves check box, and then enter a save interval.
22. Click the Tracking tab and enter a Missed Peak Reference amount and corresponding units.
23. Click the General tab.
24. In the Name box, type a name for this process. (You can also name the process in the Procedure table.)
25. Select the Process Enabled check box. (If this box is cleared, the process will not execute.)
26. In the Execute Process box, enter the number of times you want the process to execute.
27. Optional—In the Counter Type list, click a counter type.
28. Optional—If you enabled a counter, type a Counter Label.
29. Close the parameters window, and set the desired Start and Interrupt signals for the process in the Group or Procedure table.

Command Processes
Model 793.10 MultiPurpose TestWare
Process Descriptions
Process Descriptions 245
Time History Output
The Time History Output process drives one or more channels in your station with an RPC II or RPC III Time History file (with extension .drv).
It can also simultaneously digitize and store one or more channels of analog test response data in the RPC III file format. The digitized data will have the same sampling rate as the drive file, and the number of points sampled for the channel will match the drive file. This digitized file can be used to measure the system’s transfer function or iterate to a desired response signal. It can also be used with the RPC suite of software applications.
Note The Time History Output process is optional. You must enter a special key code during installation to enable this process. The purpose of this process is to drive station channels with time history files, and includes Command, Mapping, Actions, Status, and General tabs. This process offers an optional data acquisition feature, which also requires a special key code during installation. The data acquisition feature adds Acquisition and Trend tabs to this process. All tabs are documented in this section.
Model 793.10 MultiPurpose TestWare
Command ProcessesPr
oces
s D
escr
iptio
ns
Process Descriptions246
About Time History Output and Controller Rates
Time History rates supported by the controller are dependent on two parameters specified in your controller’s hardware interface file:
• System rate
• High-clock rate
Allowable command generation (drive) rates are sub-multiples of the system rate; that is, they equal the system rate divided by certain values (1, 2, 2.5, 5, and so on). This is because the time histories are up-sampled from their given sampling rates to the system rate, and then digitally filtered to remove the effects of up-sampling. For standard settings of the system rate, time histories with the following sampling rates are supported:
• 204.8 Hz
• 409.6 Hz
• 512.0 Hz
• 1024 Hz
The up-sampling filters are designed to begin cutting off the signal at 35% of the sampling rate and to be 60 dB down at 65% of that rate. When a time history is entered into this process, the software will check the signal’s sampling rate and determine whether it can be supported. If not, an error message will be generated.
Data acquisition rates are sub-multiples of the high-clock rate. If the RPC data acquisition option is enabled on your system, analog test data will be filtered using a 5-pole analog Bessel filter with a cutoff of 300 Hz. After being digitized, the signals are run through a digital filter whose cutoff is 40% of the requested sampling frequency, and then down-sampled to the requested sampling rate. These filters matched the ones used in RPC III 498 DSPAD boards, so data can be used interchangeably with that system. If RPC data acquisition is enabled, the software will also check the signal’s sampling rate to ensure that acquisition can also be supported.

Command Processes
Model 793.10 MultiPurpose TestWare
Process Descriptions
Process Descriptions 247
Time History Output Status Window
Note This panel is displayed only if the user enables the Show Status
Panel at Runtime option on the Status tab.
During a test, the Time History Output (or Input) Status panel displays on the MPT control panel. The status panel appears when you lock the procedure.
Time History Output Parameter Descriptions
Command tab
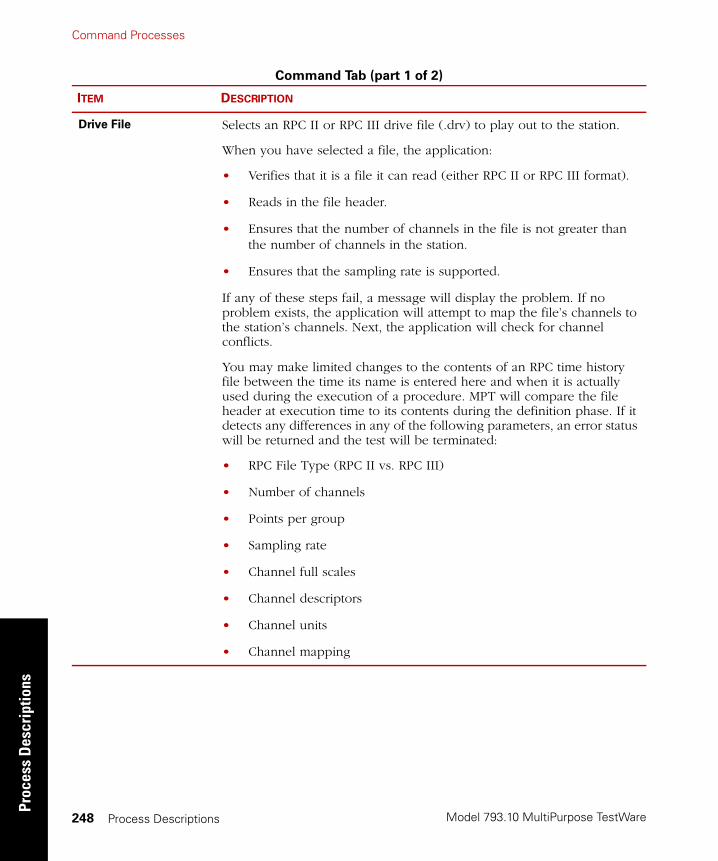
Model 793.10 MultiPurpose TestWare
Command ProcessesPr
oces
s D
escr
iptio
ns
Process Descriptions248
Command Tab (part 1 of 2)
ITEM DESCRIPTION
Drive File Selects an RPC II or RPC III drive file (.drv) to play out to the station.
When you have selected a file, the application:
• Verifies that it is a file it can read (either RPC II or RPC III format).
• Reads in the file header.
• Ensures that the number of channels in the file is not greater than the number of channels in the station.
• Ensures that the sampling rate is supported.
If any of these steps fail, a message will display the problem. If no problem exists, the application will attempt to map the file’s channels to the station’s channels. Next, the application will check for channel conflicts.
You may make limited changes to the contents of an RPC time history file between the time its name is entered here and when it is actually used during the execution of a procedure. MPT will compare the file header at execution time to its contents during the definition phase. If it detects any differences in any of the following parameters, an error status will be returned and the test will be terminated:
• RPC File Type (RPC II vs. RPC III)
• Number of channels
• Points per group
• Sampling rate
• Channel full scales
• Channel descriptors
• Channel units
• Channel mapping

Command Processes
Model 793.10 MultiPurpose TestWare
Process Descriptions
Process Descriptions 249
Passes Specifies the number of passes the drive file will play out each time the process executes, as specified on the General tab.
This function differs from the Execute Process value on the General tab. The difference is that the Time History Output process will come to a complete halt and then re-initialize and restart for each Execute Process count specified in the General tab. This creates a delay between the end of one count and the beginning of another.
Passes entered here do not result in a delay because the application simply reads data from the beginning of the already opened file and queues it in real time, which eliminates any delay.
Relative Time Signal If checked, the process will read the current command value on each channel when the process begins executing. These commands will be added to each point in the time history as it is read from its file and the modified command will be played out. This allows you to preload a channel and then play out the time history relative to that preloaded value. If not checked, the time history will be played out as stored in the disk file.
Status Displays messages about channel mapping and full-scale status after the application checks the mapping and unit selections on the Mapping tab. These messages are updated each time you modify the channel, mode, or unit selection on the Mapping tab.
The application will ensure that no two file channels are mapped to the same station channel. When the check is complete, the application will display either “Invalid Channel Map” or “Valid Channel Map.” The process cannot be executed with an invalid channel map.
If the mapping is valid, the application checks full scales of each channel in the file against the range of the selected control mode for each channel. The message “Full Scales Outside Limits” or “Full Scales In Limits” will display the results. If the mapping is bad, the outside limits text will display.
Since an RPC time file does not necessarily have data near its full scale, the command may not actually exceed the channel’s limits when the drive file is played out. However, the message is intended to warn you the potential exists for driving a channel outside its limits.
Command Tab (part 2 of 2)
ITEM DESCRIPTION
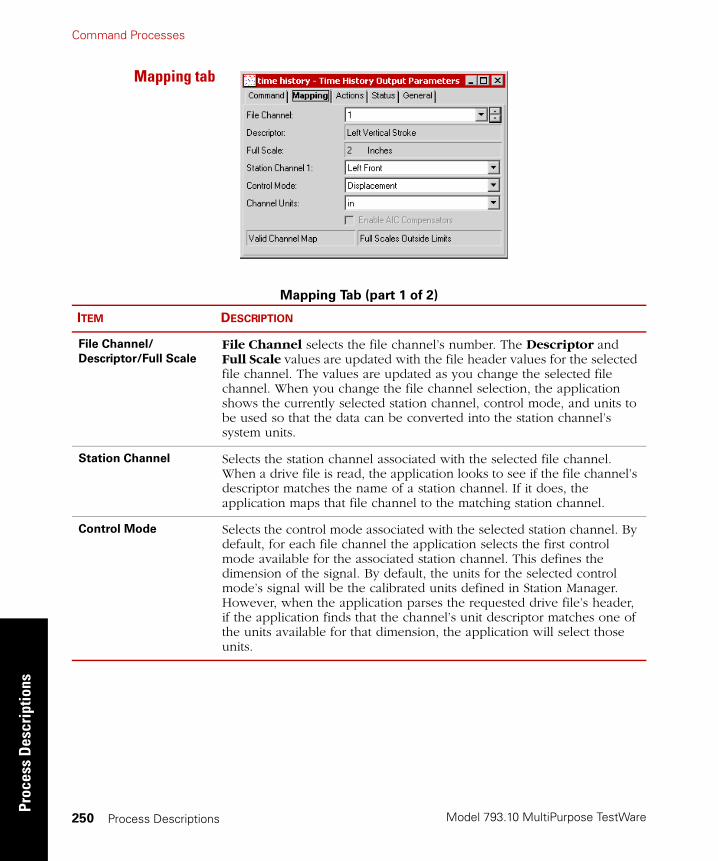
Model 793.10 MultiPurpose TestWare
Command ProcessesPr
oces
s D
escr
iptio
ns
Process Descriptions250
Mapping tab
Mapping Tab (part 1 of 2)
ITEM DESCRIPTION
File Channel/
Descriptor/Full Scale
File Channel selects the file channel’s number. The Descriptor and Full Scale values are updated with the file header values for the selected file channel. The values are updated as you change the selected file channel. When you change the file channel selection, the application shows the currently selected station channel, control mode, and units to be used so that the data can be converted into the station channel’s system units.
Station Channel Selects the station channel associated with the selected file channel. When a drive file is read, the application looks to see if the file channel’s descriptor matches the name of a station channel. If it does, the application maps that file channel to the matching station channel.
Control Mode Selects the control mode associated with the selected station channel. By default, for each file channel the application selects the first control mode available for the associated station channel. This defines the dimension of the signal. By default, the units for the selected control mode’s signal will be the calibrated units defined in Station Manager. However, when the application parses the requested drive file’s header, if the application finds that the channel’s unit descriptor matches one of the units available for that dimension, the application will select those units.

Command Processes
Model 793.10 MultiPurpose TestWare
Process Descriptions
Process Descriptions 251
Actions tab See “Actions tab” on page 236.
Note When referring to the Actions tab, keep in mind for Time History processes you will be selecting “sequences” for a drive file, instead of <actions> for a profile.
Channel Units Selects the units associated with the selected file channel.
Enable AIC
Compensators
Enables the Adaptive Inverse Control (AIC) compensation method for all control channels that will support it. This box is available when the file has been entered, a valid channel map exists, and at least one of the selected channels supports AIC Compensation (which is done in Station Builder—see the Edit Control Channels section for Station Builder in the Model 793.00 System Software manual).
Note This compensation method will not optimize signals with frequency content above 128Hz. Therefore, this process will not allow AIC to be enabled if the sampling rate of the time histories exceed 256Hz.
Status Displays messages about channel mapping and full-scale status after the application checks the mapping and unit selections on the Mapping tab. These messages are updated each time the user modifies the channel, mode, or unit selection in the Mapping tab.
The application will ensure that no two file channels are mapped to the same station channel. When the check is complete, the application will display either “Invalid Channel Map” or “Valid Channel Map.” The process cannot be executed with an invalid channel map.
If the mapping is valid, the application checks full scales of each channel in the file against the range of the selected control mode for each channel. The message “Full Scales Outside Limits” or “Full Scales Inside Limits” will display the results. If the mapping is bad, the outside limits text will display.
The valid/invalid channel map message and full scale in/outside limits messages reflect the validity of the channel mapping and the comparison of each file channel’s full scale versus the station channel’s full scale.
Mapping Tab (part 2 of 2)
ITEM DESCRIPTION
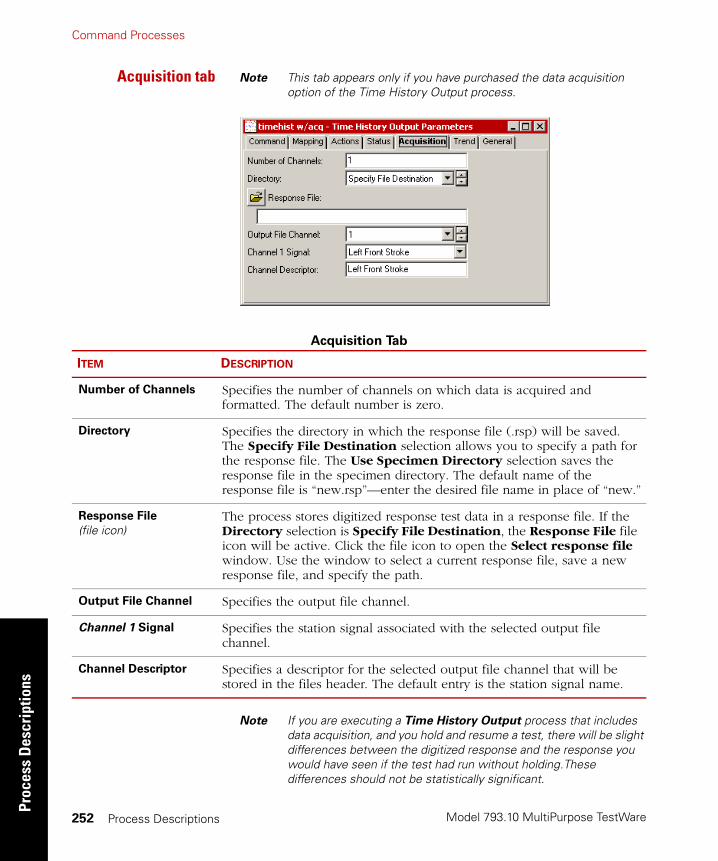
Model 793.10 MultiPurpose TestWare
Command ProcessesPr
oces
s D
escr
iptio
ns
Process Descriptions252
Acquisition tab Note This tab appears only if you have purchased the data acquisition option of the Time History Output process.
Note If you are executing a Time History Output process that includes data acquisition, and you hold and resume a test, there will be slight differences between the digitized response and the response you would have seen if the test had run without holding.These differences should not be statistically significant.
Acquisition Tab
ITEM DESCRIPTION
Number of Channels Specifies the number of channels on which data is acquired and formatted. The default number is zero.
Directory Specifies the directory in which the response file (.rsp) will be saved. The Specify File Destination selection allows you to specify a path for the response file. The Use Specimen Directory selection saves the response file in the specimen directory. The default name of the response file is “new.rsp”—enter the desired file name in place of “new.”
Response File
(file icon)The process stores digitized response test data in a response file. If the Directory selection is Specify File Destination, the Response File file icon will be active. Click the file icon to open the Select response file window. Use the window to select a current response file, save a new response file, and specify the path.
Output File Channel Specifies the output file channel.
Channel 1 Signal Specifies the station signal associated with the selected output file channel.
Channel Descriptor Specifies a descriptor for the selected output file channel that will be stored in the files header. The default entry is the station signal name.
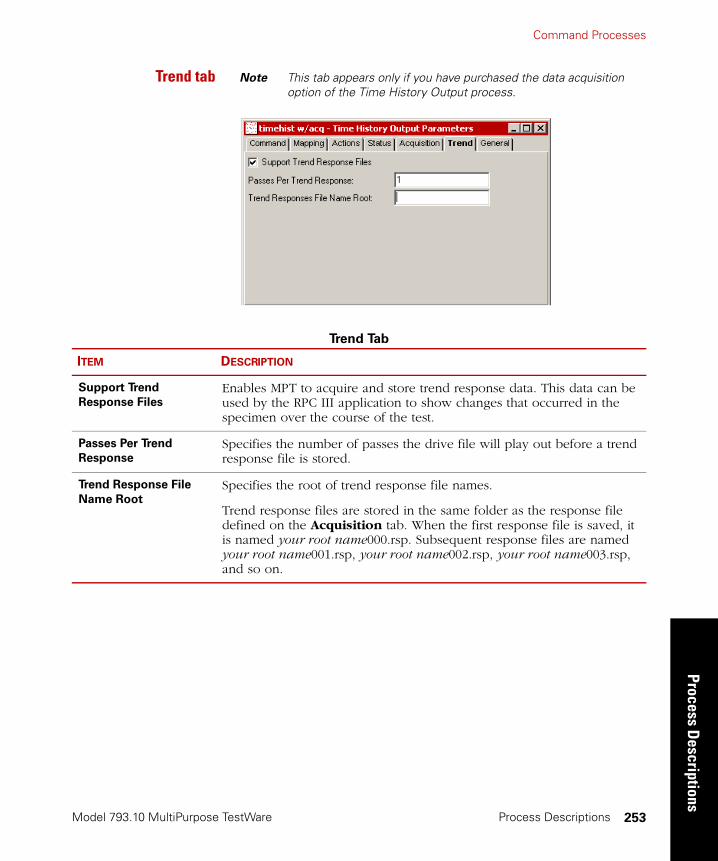
Command Processes
Model 793.10 MultiPurpose TestWare
Process Descriptions
Process Descriptions 253
Trend tab Note This tab appears only if you have purchased the data acquisition option of the Time History Output process.
Trend Tab
ITEM DESCRIPTION
Support Trend
Response Files
Enables MPT to acquire and store trend response data. This data can be used by the RPC III application to show changes that occurred in the specimen over the course of the test.
Passes Per Trend
Response
Specifies the number of passes the drive file will play out before a trend response file is stored.
Trend Response File
Name Root
Specifies the root of trend response file names.
Trend response files are stored in the same folder as the response file defined on the Acquisition tab. When the first response file is saved, it is named your root name000.rsp. Subsequent response files are named your root name001.rsp, your root name002.rsp, your root name003.rsp, and so on.
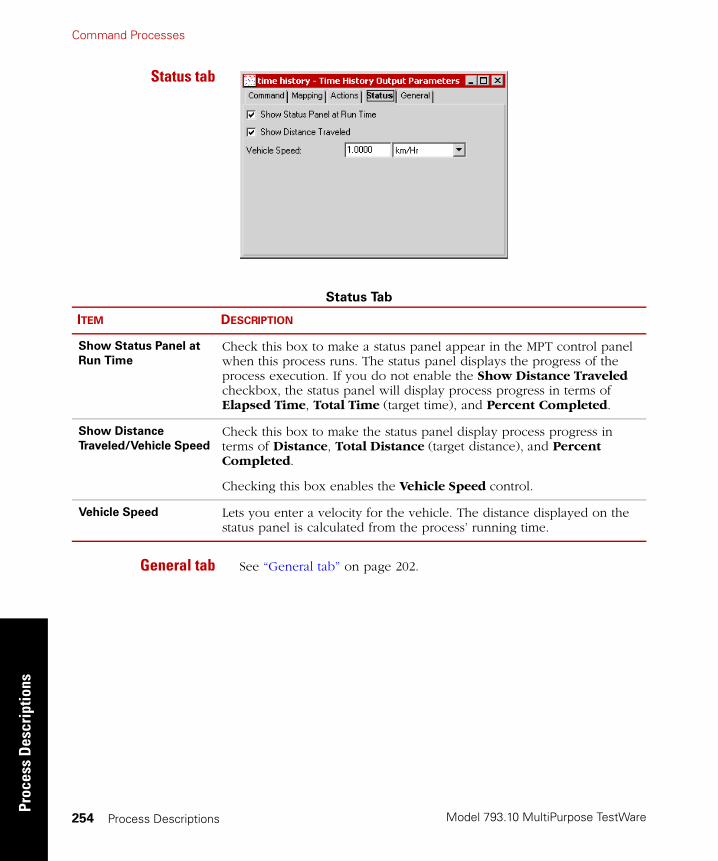
Model 793.10 MultiPurpose TestWare
Command ProcessesPr
oces
s D
escr
iptio
ns
Process Descriptions254
Status tab
General tab See “General tab” on page 202.
Status Tab
ITEM DESCRIPTION
Show Status Panel at
Run Time
Check this box to make a status panel appear in the MPT control panel when this process runs. The status panel displays the progress of the process execution. If you do not enable the Show Distance Traveled checkbox, the status panel will display process progress in terms of Elapsed Time, Total Time (target time), and Percent Completed.
Show Distance
Traveled/Vehicle Speed
Check this box to make the status panel display process progress in terms of Distance, Total Distance (target distance), and Percent Completed.
Checking this box enables the Vehicle Speed control.
Vehicle Speed Lets you enter a velocity for the vehicle. The distance displayed on the status panel is calculated from the process’ running time.
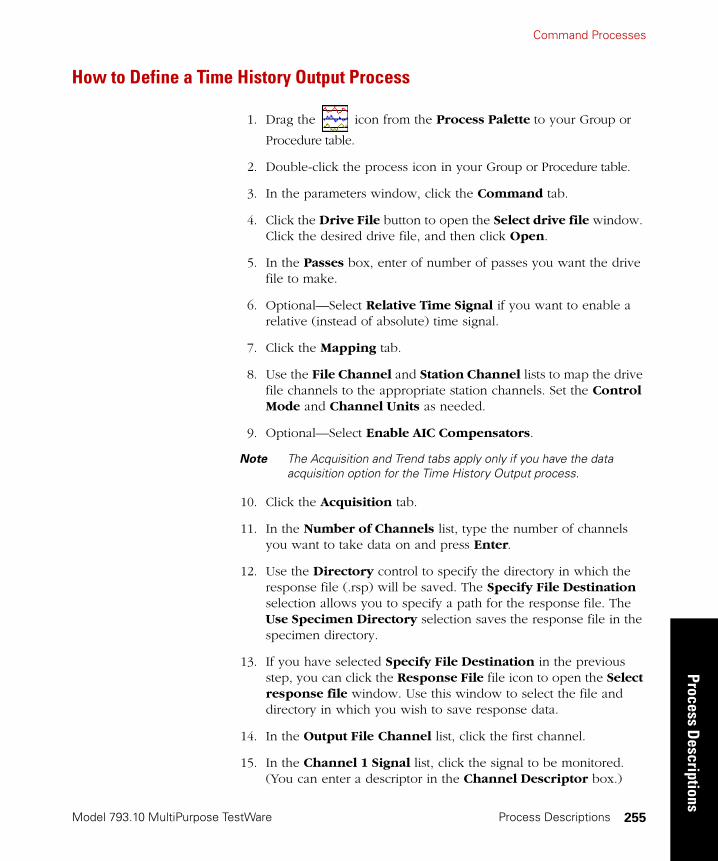
Command Processes
Model 793.10 MultiPurpose TestWare
Process Descriptions
Process Descriptions 255
How to Define a Time History Output Process
1. Drag the icon from the Process Palette to your Group or
Procedure table.
2. Double-click the process icon in your Group or Procedure table.
3. In the parameters window, click the Command tab.
4. Click the Drive File button to open the Select drive file window. Click the desired drive file, and then click Open.
5. In the Passes box, enter of number of passes you want the drive file to make.
6. Optional—Select Relative Time Signal if you want to enable a relative (instead of absolute) time signal.
7. Click the Mapping tab.
8. Use the File Channel and Station Channel lists to map the drive file channels to the appropriate station channels. Set the Control Mode and Channel Units as needed.
9. Optional—Select Enable AIC Compensators.
Note The Acquisition and Trend tabs apply only if you have the data acquisition option for the Time History Output process.
10. Click the Acquisition tab.
11. In the Number of Channels list, type the number of channels you want to take data on and press Enter.
12. Use the Directory control to specify the directory in which the response file (.rsp) will be saved. The Specify File Destination selection allows you to specify a path for the response file. The Use Specimen Directory selection saves the response file in the specimen directory.
13. If you have selected Specify File Destination in the previous step, you can click the Response File file icon to open the Select response file window. Use this window to select the file and directory in which you wish to save response data.
14. In the Output File Channel list, click the first channel.
15. In the Channel 1 Signal list, click the signal to be monitored. (You can enter a descriptor in the Channel Descriptor box.)

Model 793.10 MultiPurpose TestWare
Command ProcessesPr
oces
s D
escr
iptio
ns
Process Descriptions256
16. Perform steps 14 and 15 for any additional channels.
17. Click the Trend tab.
18. Optional—Select Support Trend Response Files if you want to store trend data for use with the RPC application.
If you select Support Trend Response Files:
A. In the Passes Per Trend Response box, type the number of passes you want to play out before you save trend data.
B. In the Trend Responses File Name Root box, type the root name for your trend response files.
19. Click the Actions tab.
20. Optional—Map station actions to drive file sequences.
21. Click the Status tab.
22. Optional—Select Show Status Panel at Run Time if you want the Time History Output Status Window to display when this process is active.
23. Click the General tab.
24. In the Name box, type a name for this process. (You can also name the process in the Procedure table.)
25. Select the Process Enabled check box. (If this box is cleared, the process will not execute.)
26. In the Execute Process box, enter the number of times you want the process to execute.
27. Optional—In the Counter Type list, click a counter type.
28. Optional—If you enabled a counter, type a Counter Label.
29. Close the parameters window, and set the desired Start and Interrupt signals for the process in the Group or Procedure table.

Command Processes
Model 793.10 MultiPurpose TestWare
Process Descriptions
Process Descriptions 257
Road Surface Output
The Road Surface Output process lets you drive a station with RPC III and RPC Pro Road Surface files (with extensions .drvrs and .seq)
Note The Road Surface Output process is optional. You must enter a special key code during installation to enable this process.
About Road Surface Files
A Road Surface file is a file that you create with RPC software. It consists of a list of time history files and other Road Surface files. Each file can have a different number of channels.
Creating road surfacefiles
A Road Surface file is created by the RPC RSURF program or RPC Pro. It lets you enter up to 30 file names in one Road Surface file. The order in which files are listed determines the order in which they are played out. For example, if files A, B, and C are entered in the list in alphabetical order and each file has two passes, the files are played out as follows:
RSURF allows you to nest files to four levels. The following diagram shows two levels of nesting. Files A, B, and C make up a Road Surface file named “ROAD1.DRVRS.” The level 2 drive Road Surface file, “NESTEDROADS.DRVRS”, contains four passes of ROAD1.DRVRS.
A A B B C C
Pass 1 of each file
Pass 2 of each file
ROAD1.DRVRS Road Surface file

Model 793.10 MultiPurpose TestWare
Command ProcessesPr
oces
s D
escr
iptio
ns
Process Descriptions258
.
You can nest a Road Surface file inside three other Road Surface files to produce a complex Road Surface file of drive files. For example, in the following diagram, R4.DRVRS is nested in Road Surface files R3.DRVRS, R2.DRVRS, and R1.DRVRS:
Road Surface Output Status Panel
During a test, the Road Surface Output Status panel displays on the MPT control panel. The status panel appears when you lock the procedure. Also, the sequence counter on the MPT control panel displays all files within the .DRVRS file, and indicates the active file.
Pass 1 of RoadSurface file
NESTEDROADS.DRVRS drive road surface
ROAD1.DRVRS Road Surface fileis played out four times
Pass 2 of Road Surface file
Pass 3 of RoadSurface file
Pass 4 of RoadSurface file
A A B B C C A A B B C C A A B B C CA A B B C C
R2.DRVRS
R4.DRVRSR3.DRVRS
D.DRIV
F.DRIV
A.DRIV
E.DRIV
C.DRIV
D.DRIV
A.DRIV
B.DRIV
R1.DRVRS
R2.DRVRS
R3.DRVRS R4.DRVRS

Command Processes
Model 793.10 MultiPurpose TestWare
Process Descriptions
Process Descriptions 259
Road Surface Output Parameter Descriptions
Command tab .
Command Tab (part 1 of 2)
ITEM DESCRIPTION
Road Surface File Selects an RPC III or RPC Pro Road Surface file to play out. When you have selected a file, the application:
• Verifies that it is a file it can read.
• Reads in the file.
• Reads in the headers of all time history files specified in the Road Surface file and any nested road surface file.
• Ensures that the number of channels in each drive file is not greater than the number of channels in the station.
• Ensures that the sampling rate is supported.
• Ensures that the sampling rate and the channel calibrations (values and units) are consistent between all drive files.
If any of these steps fail, a message will display the problem. If no problem exists, the application will attempt to map the file’s channels to the station’s channels. Next, the application will check for channel conflicts.
Passes Selects the number of passes the Road Surface file will play out each time the process executes, as specified on the General tab.
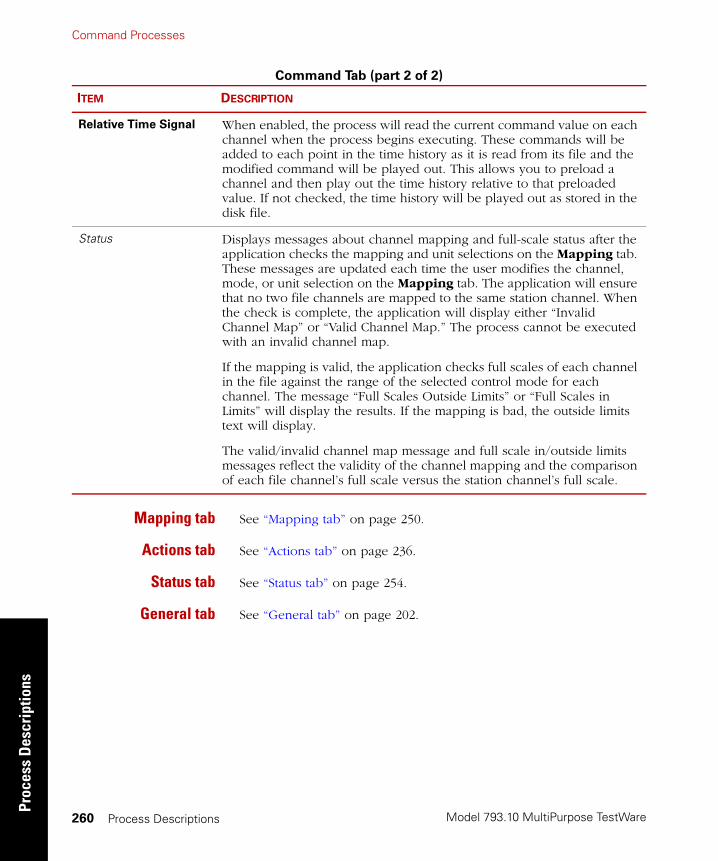
Model 793.10 MultiPurpose TestWare
Command ProcessesPr
oces
s D
escr
iptio
ns
Process Descriptions260
Mapping tab See “Mapping tab” on page 250.
Actions tab See “Actions tab” on page 236.
Status tab See “Status tab” on page 254.
General tab See “General tab” on page 202.
Relative Time Signal When enabled, the process will read the current command value on each channel when the process begins executing. These commands will be added to each point in the time history as it is read from its file and the modified command will be played out. This allows you to preload a channel and then play out the time history relative to that preloaded value. If not checked, the time history will be played out as stored in the disk file.
Status Displays messages about channel mapping and full-scale status after the application checks the mapping and unit selections on the Mapping tab. These messages are updated each time the user modifies the channel, mode, or unit selection on the Mapping tab. The application will ensure that no two file channels are mapped to the same station channel. When the check is complete, the application will display either “Invalid Channel Map” or “Valid Channel Map.” The process cannot be executed with an invalid channel map.
If the mapping is valid, the application checks full scales of each channel in the file against the range of the selected control mode for each channel. The message “Full Scales Outside Limits” or “Full Scales in Limits” will display the results. If the mapping is bad, the outside limits text will display.
The valid/invalid channel map message and full scale in/outside limits messages reflect the validity of the channel mapping and the comparison of each file channel’s full scale versus the station channel’s full scale.
Command Tab (part 2 of 2)
ITEM DESCRIPTION

Command Processes
Model 793.10 MultiPurpose TestWare
Process Descriptions
Process Descriptions 261
How to Define a Road Surface Output Process
1. Drag the icon from the Process Palette to your Procedure
table.
2. Double-click the process icon in your Procedure table.
3. Click the Command tab.
4. Click the Road Surface File button to open the Select road surface file window. Click the desired drive file, and then click Open.
5. In the Passes box, enter the number of passes you want the drive file to make.
6. Optional—Select Relative Time Signal if you want to enable a relative (instead of absolute) time signal.
7. Click the Mapping tab.
8. Use the File Channel and Station Channel lists to map the drive file channels to the appropriate station channels. Set the Control Mode and Channel Units as needed.
9. Optional—Select Enable AIC Compensators.
10. Click the Actions tab.
11. Optional—Map station actions to drive file sequences.
12. Click on the Status tab.
13. Optional—Select Show Status Panel at Run Time if you want the Road Surface Output Status Panel to display when this process is active.

Model 793.10 MultiPurpose TestWare
Command ProcessesPr
oces
s D
escr
iptio
ns
Process Descriptions262
14. Click the General tab.
15. In the Name box, type a name for this process. (You can also name the process in the Procedure table.)
16. Select the Process Enabled check box. (If this box is cleared, the process will not execute.)
17. In the Execute Process box, enter the number of times you want the process to execute.
18. Optional—In the Counter Type list, click a counter type.
19. Optional—If you enabled a counter, type a Counter Label.
20. Close the parameters window, and set the desired Start and Interrupt signals for the process.
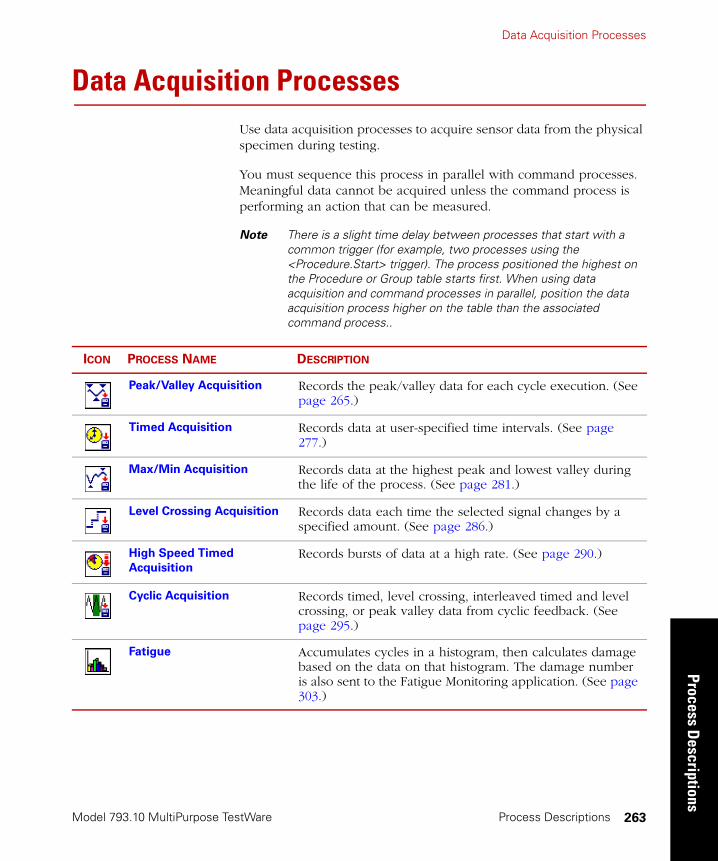
Data Acquisition Processes
Model 793.10 MultiPurpose TestWare
Process Descriptions
Process Descriptions 263
Data Acquisition ProcessesUse data acquisition processes to acquire sensor data from the physical specimen during testing.
You must sequence this process in parallel with command processes. Meaningful data cannot be acquired unless the command process is performing an action that can be measured.
Note There is a slight time delay between processes that start with a common trigger (for example, two processes using the <Procedure.Start> trigger). The process positioned the highest on the Procedure or Group table starts first. When using data acquisition and command processes in parallel, position the data acquisition process higher on the table than the associated command process..
ICON PROCESS NAME DESCRIPTION
Peak/Valley Acquisition Records the peak/valley data for each cycle execution. (See page 265.)
Timed Acquisition Records data at user-specified time intervals. (See page 277.)
Max/Min Acquisition Records data at the highest peak and lowest valley during the life of the process. (See page 281.)
Level Crossing Acquisition Records data each time the selected signal changes by a specified amount. (See page 286.)
High Speed Timed
Acquisition
Records bursts of data at a high rate. (See page 290.)
Cyclic Acquisition Records timed, level crossing, interleaved timed and level crossing, or peak valley data from cyclic feedback. (See page 295.)
Fatigue Accumulates cycles in a histogram, then calculates damage based on the data on that histogram. The damage number is also sent to the Fatigue Monitoring application. (See page 303.)
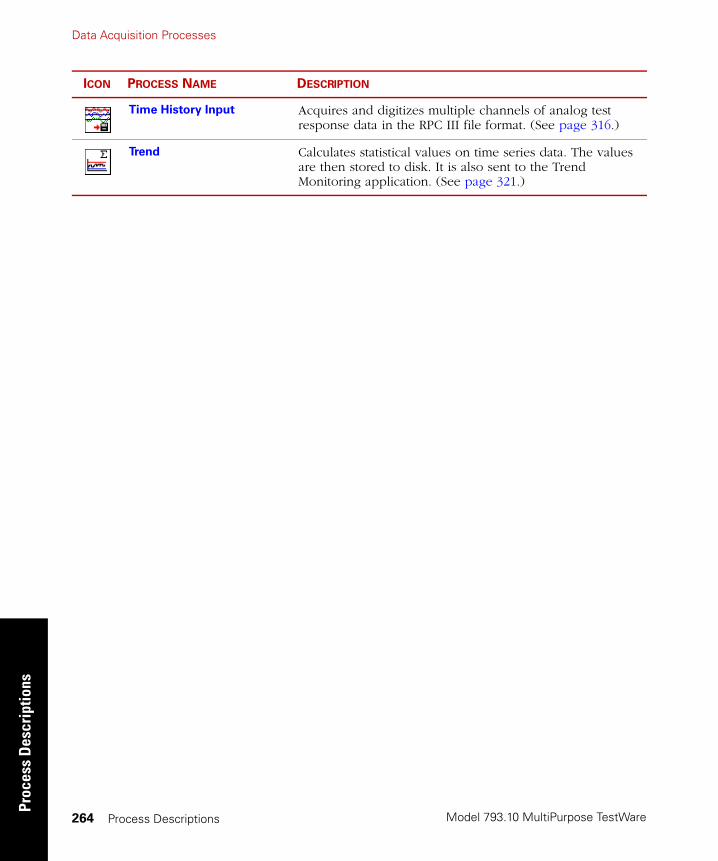
Model 793.10 MultiPurpose TestWare
Data Acquisition ProcessesPr
oces
s D
escr
iptio
ns
Process Descriptions264
Time History Input Acquires and digitizes multiple channels of analog test response data in the RPC III file format. (See page 316.)
Trend Calculates statistical values on time series data. The values are then stored to disk. It is also sent to the Trend Monitoring application. (See page 321.)
ICON PROCESS NAME DESCRIPTION

Data Acquisition Processes
Model 793.10 MultiPurpose TestWare
Process Descriptions
Process Descriptions 265
Peak/Valley Acquisition
The Peak/Valley Acquisition process records the output of all selected signals when the software detects a peak or valley in the master signal you specify.
When you define a Peak/Valley Acquisition process, you must define the master signal, the sensitivity, the signals you will record data on, the data destination, the buffer type, and the output units.
More About Data Acquisition Processes
When you set up data acquisition, you specify the signals for which data is acquired and the method of buffering.
Time
SensorSignal
Acquired Data Points

Model 793.10 MultiPurpose TestWare
Data Acquisition ProcessesPr
oces
s D
escr
iptio
ns
Process Descriptions266
Buffers Each type of buffer offers different operational characteristics:
• The buffer size specifies the maximum number of data elements the buffer will store before data is written to disk. (A data element includes the data from each selected signal.) You can set the buffer size between 1 and 16,000 data elements (default is 1024).
• Acquiring and saving data at fast rates can cause the computer to become sluggish (slow to respond to selections). If the acquisition rates are too fast, data over-run can occur. If this happens, the test stops and a message is logged.
• Linear buffers can generate a Process.Buffer Full signal when the controller acquires enough data elements to fill the specified buffer size. You can use this buffer full signal to start or interrupt other processes in the procedure.
Linear buffer A linear buffer records data until it is full, then saves the data to disk. The size of the buffer determines how much data is acquired before it is written to disk. Data is continuously saved to disk until the process ends or is stopped. When the process ends, any data in the buffer is sent to disk. The only limit is the size of your hard drive.
Circular buffer A circular buffer records data continuously. When the buffer is full, new data overwrites the oldest data. This type of buffering saves data to disk when the test is stopped, when the process reaches its preset count, or when the process ends. The circular buffer is useful for acquiring data just before some crucial event (such as specimen failure), where data is not required for the whole test.
SampleSample
SampleSample

Data Acquisition Processes
Model 793.10 MultiPurpose TestWare
Process Descriptions
Process Descriptions 267
Data file header The first line of the data file includes information like the decimal separator, column separator, time formats, date formats, and so forth.
A typical header looks like this:
MTS793|MPT|ENU|1|0|.|/|:|1|0|0|A
The format of this header line is as follows:
MPT generates a header for each data file buffer when the Write First Data Header Only check box is disabled (unchecked). When the check box is enabled, MPT suppresses all but the initial header.
Important You can use the Write First Data Header Only check box to specify whether or not headers are written to the buffer subsequent to the initial header. This option is provided as an aid to data sorting and analysis and is only provided for the Peak/Valley, Timed, Level Crossing, Cyclic Acquisition, and High Speed Acquisition processes.
MTS793|progName|sLanguage|version|iDelim|sDecimal|sDate|sTime|iCountry|iDate|iTime|sCode
Where:
progName= MPT or BTWsLanguage= Natural language (standard three-character abbreviation)version= Version of this format stringiDelim= Data delimeter: 0 for space (plain), 1 for comma (Lotus), 2 for tab (Excel)sDecimal= International decimal separatorsDate= International date separatorsTime= International time separatoriCountry= International country valueiDate= International date formatiTime= International time formatsCode= Character Set Code: A for ANSI, O for OEM (currently always A)

Model 793.10 MultiPurpose TestWare
Data Acquisition ProcessesPr
oces
s D
escr
iptio
ns
Process Descriptions268
Sensitivity A sensitivity value specifies how much the master signal must change to detect a peak or valley:
• Setting the sensitivity too low may cause signal noise to be recognized as peaks and valleys.
• Setting the sensitivity too high may cause low amplitude signals to be missed.
Data destination You set how your acquired data is saved on the Destination tab. The options are:
• Specimen data file
Acquired data is written to the specimen.dat file saved in your MPT specimen.
MPT specimens are located in your MPT Specimens folder (MPT > Specimens > spec01, spec02, and so forth).
• User-specified data file
Acquired data is written to the data file you specify (filename.dat) in the MPT specimen.
• Discard data
Acquired data is written to the buffer, but is not saved to disk. Typically, this option is used to trigger another process when the current acquisition process fills its buffer. See “How to Trigger a Process When the Buffer is Full” on page 275.
Detected Peaks
Detected Valleys
Sensitivity =

Data Acquisition Processes
Model 793.10 MultiPurpose TestWare
Process Descriptions
Process Descriptions 269
Peak/Valley Acquisition Parameter Descriptions
Acquisition tab
Acquisition Tab
ITEM DESCRIPTION
Master Signal Specifies the signal that is monitored by the peak/valley detector.
Sensitivity Defines how much the signal must change before a level is considered a peak or valley.
Total Samples Specifies the number of samples the process will acquire before it completes.
Note If disabled, samples will be taken as long as the process is active.
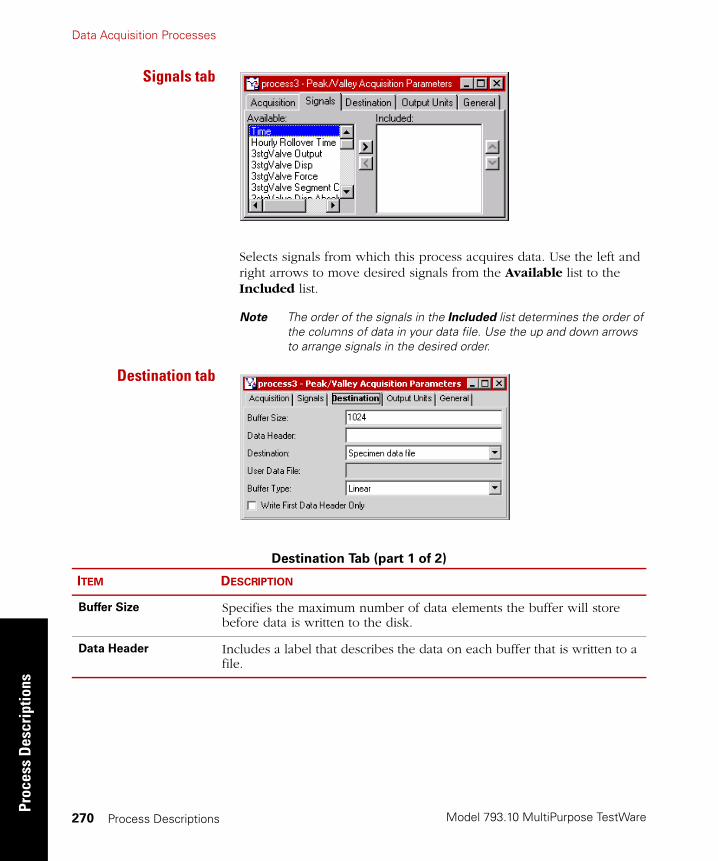
Model 793.10 MultiPurpose TestWare
Data Acquisition ProcessesPr
oces
s D
escr
iptio
ns
Process Descriptions270
Signals tab
Selects signals from which this process acquires data. Use the left and right arrows to move desired signals from the Available list to the Included list.
Note The order of the signals in the Included list determines the order of the columns of data in your data file. Use the up and down arrows to arrange signals in the desired order.
Destination tab
Destination Tab (part 1 of 2)
ITEM DESCRIPTION
Buffer Size Specifies the maximum number of data elements the buffer will store before data is written to the disk.
Data Header Includes a label that describes the data on each buffer that is written to a file.
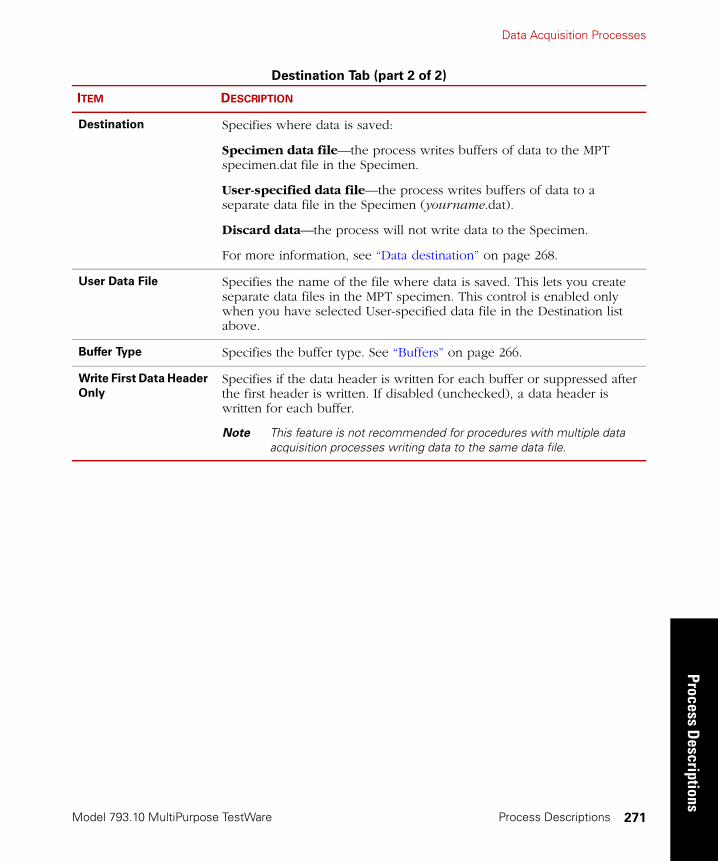
Data Acquisition Processes
Model 793.10 MultiPurpose TestWare
Process Descriptions
Process Descriptions 271
Destination Specifies where data is saved:
Specimen data file—the process writes buffers of data to the MPT specimen.dat file in the Specimen.
User-specified data file—the process writes buffers of data to a separate data file in the Specimen (yourname.dat).
Discard data—the process will not write data to the Specimen.
For more information, see “Data destination” on page 268.
User Data File Specifies the name of the file where data is saved. This lets you create separate data files in the MPT specimen. This control is enabled only when you have selected User-specified data file in the Destination list above.
Buffer Type Specifies the buffer type. See “Buffers” on page 266.
Write First Data Header
Only
Specifies if the data header is written for each buffer or suppressed after the first header is written. If disabled (unchecked), a data header is written for each buffer.
Note This feature is not recommended for procedures with multiple data acquisition processes writing data to the same data file.
Destination Tab (part 2 of 2)
ITEM DESCRIPTION
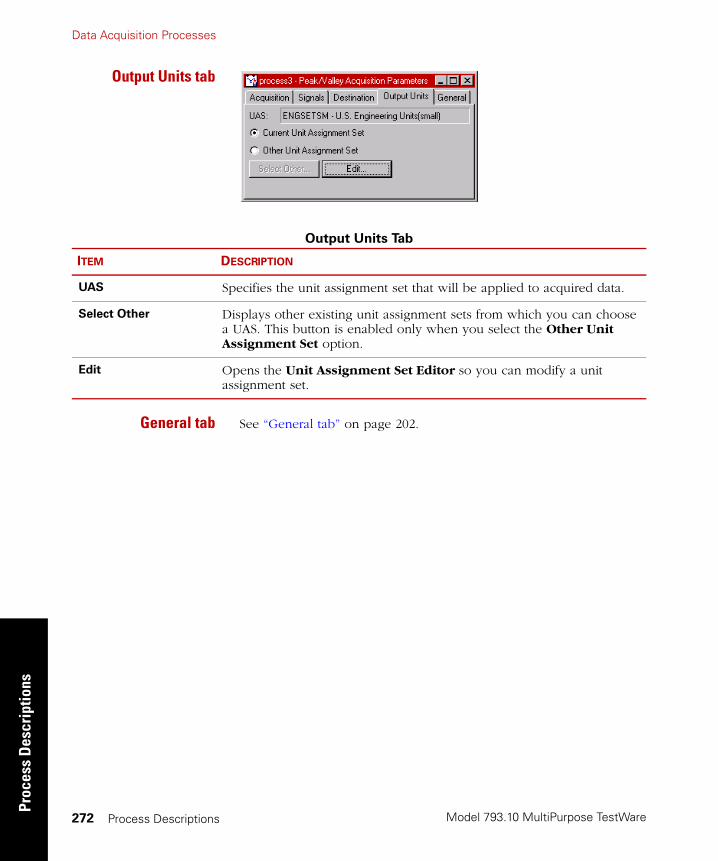
Model 793.10 MultiPurpose TestWare
Data Acquisition ProcessesPr
oces
s D
escr
iptio
ns
Process Descriptions272
Output Units tab
General tab See “General tab” on page 202.
Output Units Tab
ITEM DESCRIPTION
UAS Specifies the unit assignment set that will be applied to acquired data.
Select Other Displays other existing unit assignment sets from which you can choose a UAS. This button is enabled only when you select the Other Unit Assignment Set option.
Edit Opens the Unit Assignment Set Editor so you can modify a unit assignment set.
Data Acquisition Processes
Model 793.10 MultiPurpose TestWare
Process Descriptions
Process Descriptions 273
How to Define a Peak/Valley Acquisition Process
1. Drag the icon from the Process Palette to your Procedure
table.
2. Double-click the process icon in the Procedure table.
3. In the parameters window, click the Acquisition tab.
4. In the Master Signal list, click the signal you want to monitor with this process.
5. In the Sensitivity box, set the units, and then type a value.
6. Optional—If you want to specify the number of samples to be acquired, select the Total Samples box. Otherwise it will acquire data as long as the process is active.
7. Click the Signals tab.
8. Move all the signals you want to monitor to the Included list. Move all the others to the Available list.
Note The order of the signals in the Included list determines the order of the columns of data in your data file.
9. Click the Destination tab.
10. Type the Buffer Size and type a description of the data file in the Data Header box.
11. In the Destination list, click the destination for the acquired data. (If you click User-specified data file, enter a file name in the User Data File box.) See “Data destination” on page 268.
12. In the Buffer Type list, click the buffer type.
13. Optional—If desired, enable Write First Data Header Only checkbox. This feature aids data sorting and analysis.
14. Optional—Click the Output Units tab.
Change the unit assignment set if you want. Each data acquisition process can use a different unit assignment set.

Model 793.10 MultiPurpose TestWare
Data Acquisition ProcessesPr
oces
s D
escr
iptio
ns
Process Descriptions274
15. Click the General tab.
16. In the Name box, type a name for this process. (You can also name the process in the Procedure table.)
17. Select the Process Enabled check box. (If this box is cleared, the process will not execute.)
18. In the Execute Process box, enter the number of times you want the process to execute.
19. Optional—In the Counter Type list, click a counter type.
20. Optional—If you enabled a counter, type a Counter Label.
21. Close the parameters window, and set the desired Start and Interrupt signals for the process in the Procedure table.
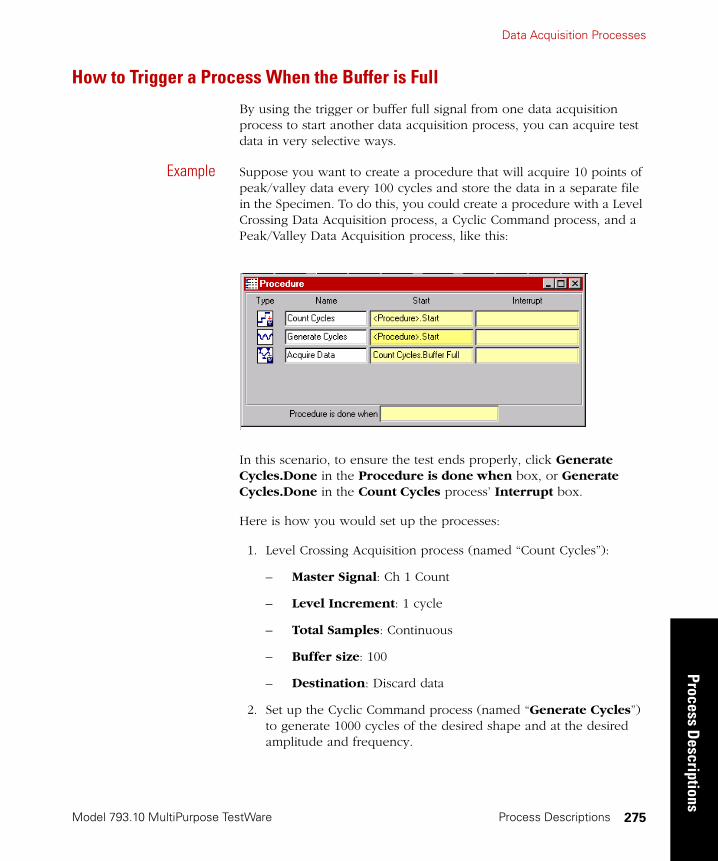
Data Acquisition Processes
Model 793.10 MultiPurpose TestWare
Process Descriptions
Process Descriptions 275
How to Trigger a Process When the Buffer is Full
By using the trigger or buffer full signal from one data acquisition process to start another data acquisition process, you can acquire test data in very selective ways.
Example Suppose you want to create a procedure that will acquire 10 points of peak/valley data every 100 cycles and store the data in a separate file in the Specimen. To do this, you could create a procedure with a Level Crossing Data Acquisition process, a Cyclic Command process, and a Peak/Valley Data Acquisition process, like this:
In this scenario, to ensure the test ends properly, click Generate Cycles.Done in the Procedure is done when box, or Generate Cycles.Done in the Count Cycles process’ Interrupt box.
Here is how you would set up the processes:
1. Level Crossing Acquisition process (named “Count Cycles”):
– Master Signal: Ch 1 Count
– Level Increment: 1 cycle
– Total Samples: Continuous
– Buffer size: 100
– Destination: Discard data
2. Set up the Cyclic Command process (named “Generate Cycles”) to generate 1000 cycles of the desired shape and at the desired amplitude and frequency.
Model 793.10 MultiPurpose TestWare
Data Acquisition ProcessesPr
oces
s D
escr
iptio
ns
Process Descriptions276
3. Peak/Valley Data Acquisition process (named “Acquire Data”):
– Master Signal: As desired
– Sensitivity: Appropriate for Master Signal (for example, 3mm)
– Total Samples: 10
– Signals: As desired
– Buffer size: 10
– Destination: User-specified data file
– User Data File: As desired
When you run this test, the Peak/Valley Data Acquisition process will be triggered by the Count Cycles.Buffer Full signal generated by the Level Crossing Data Acquisition process every 100 cycles, and will acquire 10 points of peak/valley data. The data will be stored to the file (in the Specimen) entered in the User Data File box on the Destination tab of the Peak/Valley Data Acquisition Parameters window.
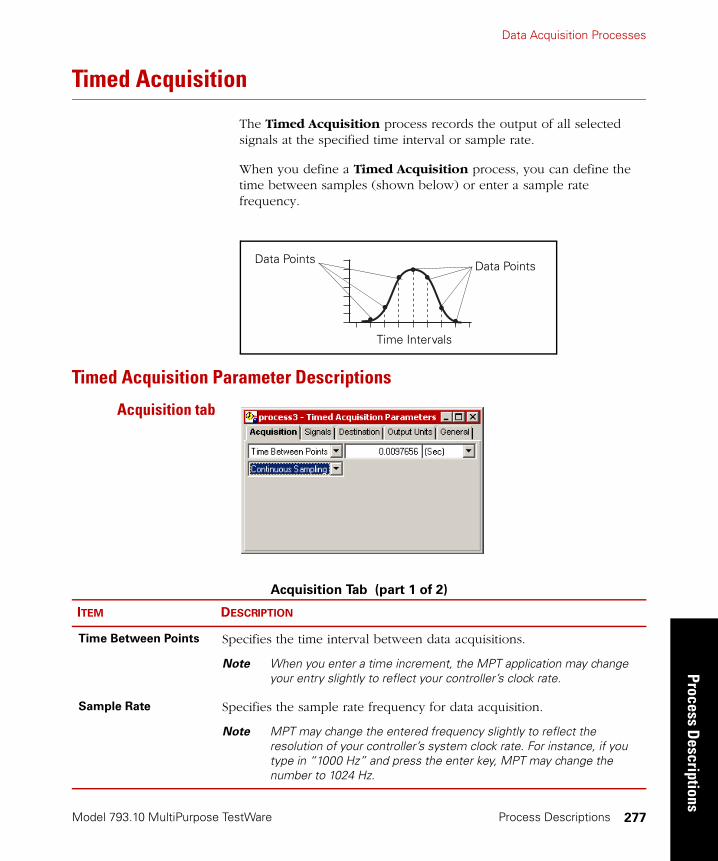
Data Acquisition Processes
Model 793.10 MultiPurpose TestWare
Process Descriptions
Process Descriptions 277
Timed Acquisition
The Timed Acquisition process records the output of all selected signals at the specified time interval or sample rate.
When you define a Timed Acquisition process, you can define the time between samples (shown below) or enter a sample rate frequency.
Timed Acquisition Parameter Descriptions
Acquisition tab
Time Intervals
Data PointsData Points
Acquisition Tab (part 1 of 2)
ITEM DESCRIPTION
Time Between Points Specifies the time interval between data acquisitions.
Note When you enter a time increment, the MPT application may change your entry slightly to reflect your controller’s clock rate.
Sample Rate Specifies the sample rate frequency for data acquisition.
Note MPT may change the entered frequency slightly to reflect the resolution of your controller’s system clock rate. For instance, if you type in “1000 Hz” and press the enter key, MPT may change the number to 1024 Hz.

Model 793.10 MultiPurpose TestWare
Data Acquisition ProcessesPr
oces
s D
escr
iptio
ns
Process Descriptions278
Signals tab See “Signals tab” on page 270.
Destination tab See “Destination tab” on page 270.
Output Units tab See “Output Units tab” on page 272.
General tab See “General tab” on page 202.
How to Define a Timed Acquisition Process
1. Drag the icon from the Process Palette to your Procedure
table.
2. Double-click the process icon in the Procedure table.
3. In the parameters window, click the Acquisition tab.
4. Set the timed data acquisition interval and units using Time Between Points or enter a Sample Rate frequency.
Note When you enter a time increment, the MPT application may change your entry slightly to reflect your controller’s clock rate.
Note MPT may change the entered sample rate frequency slightly to reflect the resolution of your controller’s system clock rate. For instance, if you type in “1000 Hz” and press the enter key, MPT may change the number to 1024 Hz.
Total Samples Specifies the number of samples the process will acquire before it completes.
Sampling Duration Specifies the length of time the process will attempt to acquire data.
Continuous Sampling Causes the process to acquire samples continuously until it is interrupted.
Acquisition Tab (part 2 of 2)
ITEM DESCRIPTION
Data Acquisition Processes
Model 793.10 MultiPurpose TestWare
Process Descriptions
Process Descriptions 279
5. If you want to:
• Cause the process to acquire samples continuously until it is interrupted, select Continuous Sampling (default selection).
• Specify the number of samples to be acquired, select the Total Samples, then enter the number of samples desired.
• Specify the length of time the process will attempt to acquire data, select Sampling Duration, then enter the time over which you wish to acquire data.
6. Click the Signals tab.
7. Move all the signals you want to monitor to the Included list. Move all the others to the Available list.
Note The order of the signals in the Included list determines the order of the columns of data in your data file.
8. Click the Destination tab.
9. Type the Buffer Size and type a description of the data file in the Data Header box.
10. In the Destination list, click the destination for the acquired data. (If you click User-specified data file, enter a file name in the User Data File box.) See “Data destination” on page 268.
11. In the Buffer Type list, click the buffer type.
12. Optional—If desired, enable Write First Data Header Only checkbox. This feature aids data sorting and analysis.
13. Optional—Click the Output Units tab.
Change the unit assignment set if you want. Each data acquisition process can use a different unit assignment set.
14. Click the General tab.
15. In the Name box, type a name for this process. (You can also name the process in the Procedure table.)

Model 793.10 MultiPurpose TestWare
Data Acquisition ProcessesPr
oces
s D
escr
iptio
ns
Process Descriptions280
16. Select the Process Enabled check box. (If this box is cleared, the process will not execute.)
17. In the Execute Process box, enter the number of times you want the process to execute.
18. Optional—In the Counter Type list, click a counter type.
19. Optional—If you enabled a counter, type a Counter Label.
20. Close the parameters window, and set the desired Start and Interrupt signals for the process in the Procedure table.

Data Acquisition Processes
Model 793.10 MultiPurpose TestWare
Process Descriptions
Process Descriptions 281
Max/Min Acquisition
The Max/Min Acquisition process records the maximum and minimum values of selected signals during a test.
You can configure this process to monitor selected signals for their maximum and minimum values. When the maximum and minimum values are detected, they are compared to the maximum and minimum values currently stored for the associated signals. If the new values exceed the stored values, they replace the stored values.
You can also configure this process to monitor a master signal for maximum or minimum values. When the maximum and minimum values are detected, the process samples the values of the other selected signals. When data is written to disk, the master signal values are absolute maximum and minimum values, while the other selected signals reflect their values at the time the master signal’s maximum and minimum values were detected.
Keep in mind that this process writes data to disk when:
• The procedure ends normally.
• The procedure is stopped.
• The process is interrupted.
Max/Min Acquisition Parameter Descriptions
Acquisition tab

Model 793.10 MultiPurpose TestWare
Data Acquisition ProcessesPr
oces
s D
escr
iptio
ns
Process Descriptions282
Signals tab See “Signals tab” on page 270.
Destination tab See “Destination tab” on page 270.
Note Buffer settings, Discard Data options, and Write First Data Header Only options are not available for the Max/Min Acquisition process.
Output Units tab See “Output Units tab” on page 272.
General tab See “General tab” on page 202.
Acquisition Tab
ITEM DESCRIPTION
Master Signal Specifies the signals that are monitored by the max/min detector.
When you select All Included Signals (default), the process monitors all included signals for their maximum and minimum values (as selected). When detected, the process compares them to the maximum and minimum values currently stored. If the new values exceed the stored values, they take their place.
When you select an individual master signal, the process monitors the signal for its maximum and minimum values (as selected). When detected, the process samples the values of the other included signals. When data is written to disk, the master signal values are absolute maximum and minimum values, while the other included signals reflect their values at the time the master signal’s maximum and minimum values were detected.
Maximum Values Causes the process to monitor the master signal selection for maximum values.
Minimum Values Causes the process to monitor the master signal selection for minimum values.
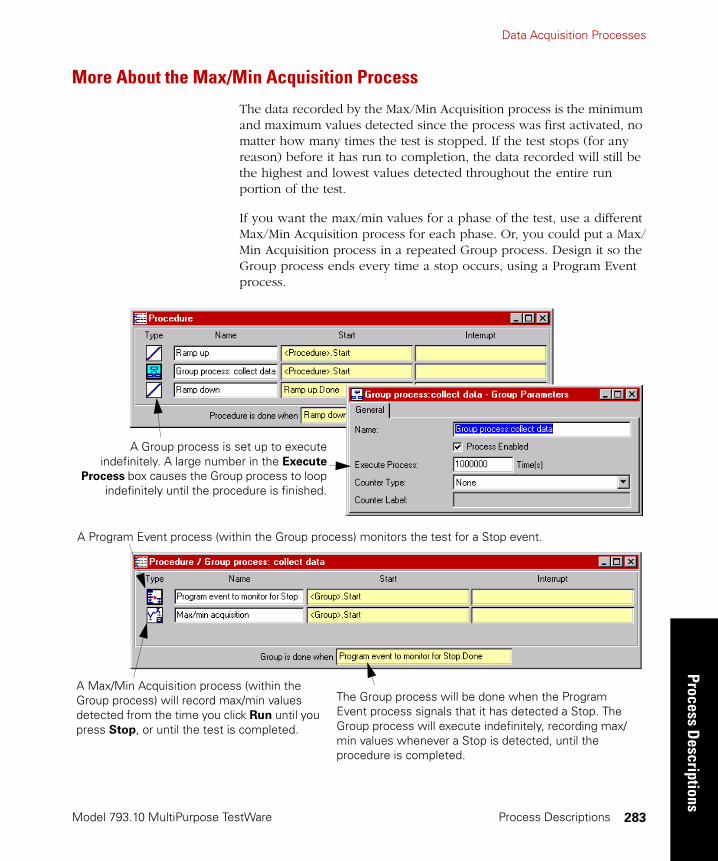
Data Acquisition Processes
Model 793.10 MultiPurpose TestWare
Process Descriptions
Process Descriptions 283
More About the Max/Min Acquisition Process
The data recorded by the Max/Min Acquisition process is the minimum and maximum values detected since the process was first activated, no matter how many times the test is stopped. If the test stops (for any reason) before it has run to completion, the data recorded will still be the highest and lowest values detected throughout the entire run portion of the test.
If you want the max/min values for a phase of the test, use a different Max/Min Acquisition process for each phase. Or, you could put a Max/Min Acquisition process in a repeated Group process. Design it so the Group process ends every time a stop occurs, using a Program Event process.
A Group process is set up to executeindefinitely. A large number in the Execute
Process box causes the Group process to loopindefinitely until the procedure is finished.
A Program Event process (within the Group process) monitors the test for a Stop event.
The Group process will be done when the Program Event process signals that it has detected a Stop. The Group process will execute indefinitely, recording max/min values whenever a Stop is detected, until the procedure is completed.
A Max/Min Acquisition process (within the Group process) will record max/min values detected from the time you click Run until you press Stop, or until the test is completed.
Model 793.10 MultiPurpose TestWare
Data Acquisition ProcessesPr
oces
s D
escr
iptio
ns
Process Descriptions284
How to Define a Max/Min Acquisition Process
1. Drag the icon from the Process Palette to your Procedure
table.
2. Double-click the process icon in the Procedure table.
3. Click the Acquisition tab.
4. Optional—Select a Master Signal, and then select whether you want to monitor the master signal for Maximum or Minimum values.
5. Click the Signals tab.
6. Move all the signals you want to monitor to the Included list. Move all the others to the Available list.
Note The order of the signals in the Included list determines the order of the columns of data in your data file.
7. Click the Destination tab.
8. Type a description of the data file in the Data Header box.
9. In the Destination list, click the destination for the acquired data. (If you click User-specified data file, enter a file name in the User Data File box.) See “Data destination” on page 268.
10. Optional—Click the Output Units tab.
Change the unit assignment set if you want. Each data acquisition process can use a different unit assignment set.
11. Click the General tab.
12. In the Name box, type a name for this process. (You can also name the process in the Procedure table.)
Data Acquisition Processes
Model 793.10 MultiPurpose TestWare
Process Descriptions
Process Descriptions 285
13. Select the Process Enabled check box. (If this box is cleared, the process will not execute.)
14. In the Execute Process box, enter the number of times you want the process to execute.
15. Optional—In the Counter Type list, click a counter type.
16. Optional—If you enabled a counter, type a Counter Label.
17. Close the parameters window, and set the desired Start and Interrupt signals for the process in the Procedure table.

Model 793.10 MultiPurpose TestWare
Data Acquisition ProcessesPr
oces
s D
escr
iptio
ns
Process Descriptions286
Level Crossing Acquisition
The Level Crossing Acquisition process records data each time the selected master signal changes by a specific amount.
When you define a Level Crossing Acquisition process, you must define the level increment at which data is collected.
Level crossingacquisition example
Assume you want to collect data every time the displacement changes 2 millimeters. You would select the displacement feedback signal as your master signal, and set the Level Increment to 2 mm.
Now, data will be recorded when the master signal reaches 2 mm, 4 mm, 6 mm, and so on.
Note You should not set the level increment below the level of any signal noise.
Data PointsLevel Increments
Data Points
Data is recorded each time the signal moves by the specified level increment
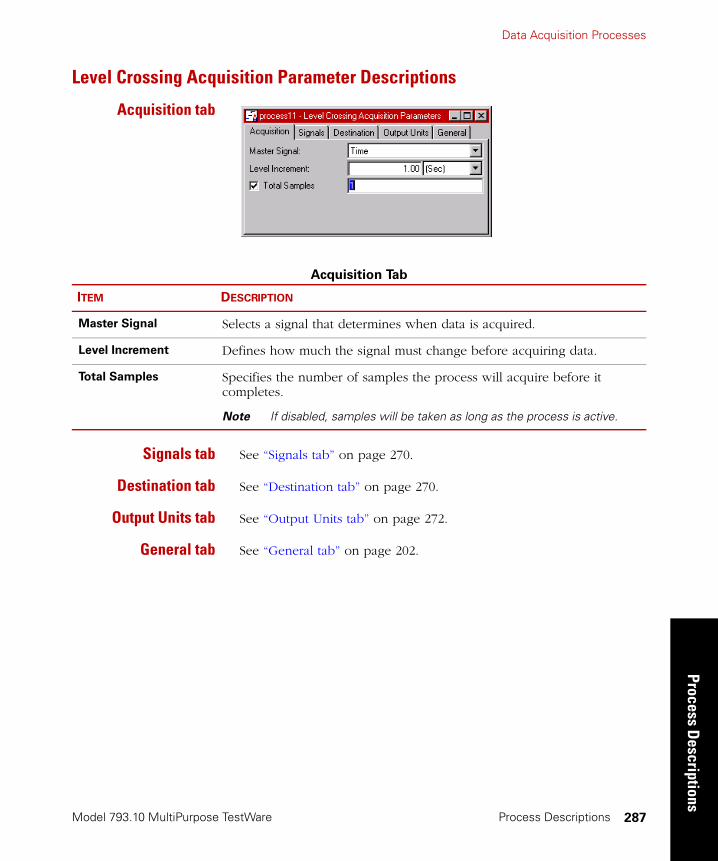
Data Acquisition Processes
Model 793.10 MultiPurpose TestWare
Process Descriptions
Process Descriptions 287
Level Crossing Acquisition Parameter Descriptions
Acquisition tab
Signals tab See “Signals tab” on page 270.
Destination tab See “Destination tab” on page 270.
Output Units tab See “Output Units tab” on page 272.
General tab See “General tab” on page 202.
Acquisition Tab
ITEM DESCRIPTION
Master Signal Selects a signal that determines when data is acquired.
Level Increment Defines how much the signal must change before acquiring data.
Total Samples Specifies the number of samples the process will acquire before it completes.
Note If disabled, samples will be taken as long as the process is active.

Model 793.10 MultiPurpose TestWare
Data Acquisition ProcessesPr
oces
s D
escr
iptio
ns
Process Descriptions288
How to Define a Level Crossing Acquisition Process
1. Drag the icon from the Process Palette to your Procedure
table.
2. Double-click the process icon in the Procedure table.
3. In the parameters window, click the Acquisition tab.
4. In the Master Signal list, click the signal you want to monitor with this process.
5. In the Level Increment box, set the units of measurement, and then type a value.
6. Optional—If you want to specify the number of samples to be acquired, select the Total Samples box. Otherwise it will acquire data as long as the process is active.
7. Click the Signals tab.
8. Move all the signals you want to monitor to the Included list. Move all the others to the Available list.
Note The order of the signals in the Included list determines the order of the columns of data in your data file.
9. Click the Destination tab.
10. Type the Buffer Size and type a description of the data file in the Data Header box.
11. In the Destination list, click the destination for the acquired data. (If you click User-specified data file, enter a file name in the User Data File box.) See “Data destination” on page 268.
12. In the Buffer Type list, click the buffer type.
13. Optional—If desired, enable Write First Data Header Only checkbox. This feature aids data sorting and analysis.
14. Optional—Click the Output Units tab.
Change the unit assignment set if you want. Each data acquisition process can use a different unit assignment set.

Data Acquisition Processes
Model 793.10 MultiPurpose TestWare
Process Descriptions
Process Descriptions 289
15. Click the General tab.
16. In the Name box, type a name for this process. (You can also name the process in the Procedure table.)
17. Select the Process Enabled check box. (If this box is cleared, the process will not execute.)
18. In the Execute Process box, enter the number of times you want the process to execute.
19. Optional—In the Counter Type list, click a counter type.
20. Optional—If you enabled a counter, type a Counter Label.
21. Close the parameters window, and set the desired Start and Interrupt signals for the process in the Procedure table.

Model 793.10 MultiPurpose TestWare
Data Acquisition ProcessesPr
oces
s D
escr
iptio
ns
Process Descriptions290
High Speed Timed Acquisition
The High Speed Timed Acquisition process records short bursts of sensor data conditioned by Model 493.21B and Model 493.25 Conditioners.
Unlike other data acquisition processes, this process is not designed to acquire data for the duration of a test, or for even long periods of time within a test. This process is typically used in tests in which it is triggered and then quickly interrupted by other processes, so that it is active only for short periods of time.
When you define a High Speed Timed Acquisition process, you must define the time between samples, or the sample rate. This determines how the process acquires data when it is active.
• You can acquire data at periodic intervals.
• Data is recorded in the units specified by the selected unit assignment set.
• You can specify how many samples are taken, and when the samples are acquired.
• If a number of samples is not specified, samples are taken as long as the process is active.
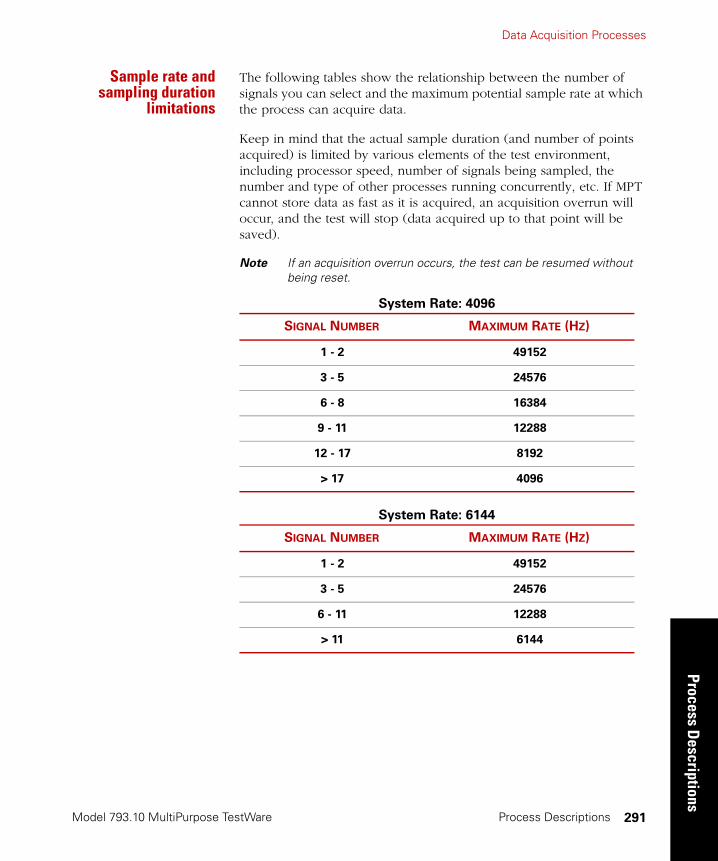
Data Acquisition Processes
Model 793.10 MultiPurpose TestWare
Process Descriptions
Process Descriptions 291
Sample rate andsampling duration
limitations
The following tables show the relationship between the number of signals you can select and the maximum potential sample rate at which the process can acquire data.
Keep in mind that the actual sample duration (and number of points acquired) is limited by various elements of the test environment, including processor speed, number of signals being sampled, the number and type of other processes running concurrently, etc. If MPT cannot store data as fast as it is acquired, an acquisition overrun will occur, and the test will stop (data acquired up to that point will be saved).
Note If an acquisition overrun occurs, the test can be resumed without being reset.
System Rate: 4096
SIGNAL NUMBER MAXIMUM RATE (HZ)
1 - 2 49152
3 - 5 24576
6 - 8 16384
9 - 11 12288
12 - 17 8192
> 17 4096
System Rate: 6144
SIGNAL NUMBER MAXIMUM RATE (HZ)
1 - 2 49152
3 - 5 24576
6 - 11 12288
> 11 6144
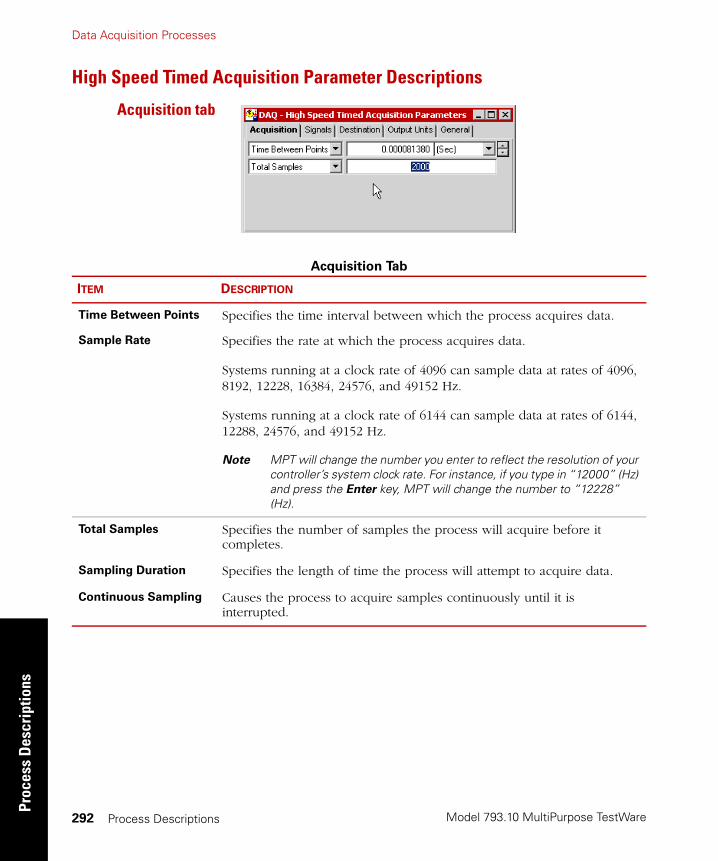
Model 793.10 MultiPurpose TestWare
Data Acquisition ProcessesPr
oces
s D
escr
iptio
ns
Process Descriptions292
High Speed Timed Acquisition Parameter Descriptions
Acquisition tab
Acquisition Tab
ITEM DESCRIPTION
Time Between Points
Sample Rate
Specifies the time interval between which the process acquires data.
Specifies the rate at which the process acquires data.
Systems running at a clock rate of 4096 can sample data at rates of 4096, 8192, 12228, 16384, 24576, and 49152 Hz.
Systems running at a clock rate of 6144 can sample data at rates of 6144, 12288, 24576, and 49152 Hz.
Note MPT will change the number you enter to reflect the resolution of your controller’s system clock rate. For instance, if you type in “12000” (Hz) and press the Enter key, MPT will change the number to “12228” (Hz).
Total Samples Specifies the number of samples the process will acquire before it completes.
Sampling Duration Specifies the length of time the process will attempt to acquire data.
Continuous Sampling Causes the process to acquire samples continuously until it is interrupted.
Data Acquisition Processes
Model 793.10 MultiPurpose TestWare
Process Descriptions
Process Descriptions 293
Signals tab See “Signals tab” on page 270.
Note Only the “Time” signal and signals conditioned by Models 493.21B and 493.25 Conditioners are available. If Time is selected data is generated, not sampled. The Time signal value always starts at zero.
Destination tab See “Destination tab” on page 270.
Note Discard Data options are not available for the High Speed Acquisition process.
Note The default buffer size is 16384, the range is from 1024 - 16384.
Output Units tab See “Output Units tab” on page 272.
General tab See “General tab” on page 202.
How to Define a High Speed Timed Acquisition Process
1. Drag the icon from the Process Palette to your Procedure
table.
2. Double-click the process icon in the Procedure table.
3. In the parameters window, click the Acquisition tab.
4. In the Time Between Points box, set the units of measurement and enter a value. Or, select Sample Rate, and specify the rate at which the system will acquire data.
5. In the Sample Duration box, specify the length of time you wish the system to acquire data. Or, select Total Samples, and specify the number of samples you wish the system to acquire.
6. Click the Signals tab.
7. Move all the signals you want to monitor to the Included list. Move all the others to the Available list.
Note The order of the signals in the Included list determines the order of the columns of data in your data file.
8. Click the Destination tab.
9. Type the Buffer Size and type a description of the data file in the Data Header box.
Model 793.10 MultiPurpose TestWare
Data Acquisition ProcessesPr
oces
s D
escr
iptio
ns
Process Descriptions294
10. In the Destination list, click the destination for the acquired data. (If you click User-specified data file, enter a file name in the User Data File box.) See “Data destination” on page 268.
11. In the Buffer Type list, click the buffer type.
12. Optional—If desired, enable Write First Data Header Only checkbox. This feature aids data sorting and analysis.
13. Optional—Click the Output Units tab.
Change the unit assignment set if you want. Each data acquisition process can use a different unit assignment set.
14. Click the General tab.
15. In the Name box, type a name for this process. (You can also name the process in the Procedure table.)
16. Select the Process Enabled check box. (If this box is cleared, the process will not execute.)
17. In the Execute Process box, enter the number of times you want the process to execute.
18. Optional—In the Counter Type list, click a counter type.
19. Optional—If you enabled a counter, type a Counter Label.
20. Close the parameters window, and set the desired Start and Interrupt signals for the process in the Procedure table.
Data Acquisition Processes
Model 793.10 MultiPurpose TestWare
Process Descriptions
Process Descriptions 295
Cyclic Acquisition
The Cyclic Acquisition process acquires timed, level crossing, interleaved timed and level crossing, or peak/valley data from cyclic feedback. You can specify the segments or cycles from which the process acquires data arbitrarily, or in linear or logarithmic progressions.
The Cyclic Acquisition process monitors sensor feedback that results from cyclic command. This process acquires data from feedback according to one of the following:
• Equal changes in time that you specify (time data)
• Equal changes in amplitude that you specify (level crossing data)
• Both changes in time and amplitude (interleaved timed and level crossing data)
• Signal reversals which occur outside of a sensitivity level that you specify (peak/valley data)
Sample uses You could use this process to sample the load feedback resulting from a long cyclic fatigue test according to a logarithmic progression, and simultaneously acquire level crossing and timed data from each sampled cycle.
The process saves all data pertaining to an individual cycle in the buffer, and then writes the entire cycle’s data to the data file in one block. By default, the process writes data to the specimen.dat file in the MPT specimen. If desired, the process will write data to a user-defined data file within the MPT specimen.
Model 793.10 MultiPurpose TestWare
Data Acquisition ProcessesPr
oces
s D
escr
iptio
ns
Process Descriptions296
More About the Cyclic Acquisition Process
Disabling the relativecount feature
If you clear the Relative Cycle or Segment Counts check box, the process will not acquire data on specified cycles that have occurred before the process was active.
For instance, suppose you begin a procedure with a Cyclic Command process that cycles the specimen one hundred times at a small amplitude to precondition the specimen before acquiring data.
Next, you use another Cyclic Command process to apply one million cycles to the specimen at a much larger amplitude, and simultaneously acquire data from the feedback with a cyclic acquisition process.
In this case, the cyclic acquisition process will not trigger until after cycle 100. So if you specified a logarithmic progression of 1, 2, 5, 10, and so on, the cyclic acquisition process would skip all of the cycles performed during preconditioning (1, 2, 5, 10, 20, 50, and 100), and begin acquiring data at cycle 200.
If you had enabled the Relative Cycle (or Segment) Counts, the process would trigger at cycle 101 of the test. The process would count cycle 101 of the test as cycle 1 of its logarithmic progression. This is because cycle 101 of the test is the first cycle performed relative to when the cyclic acquisition process is triggered.
Considerations whenacquiring cycle
clusters
By default, the process stores the data it acquires from each cluster in its buffer, and then writes the content of its buffer to the data file when it is finished acquiring data on the cluster.
On a slow test, the process may take a long time to fill its buffer for a given cluster. As the buffer fills, the data in the buffer will be lost if something interrupts the progress of the test (for example, power failure, crash, and so on) before the buffer fills completely.
The number of points the process acquires for a given cluster is open-ended and may become quite large, depending on the test frequency and acquisition intervals. For optimal results, some systems may require memory upgrades to accommodate this situation.
When acquiring data, the process fills its buffer by receiving small buffered chunks of data from the controller. Before the process can write this buffered data to its data file, the process buffer must fill completely. Because of timing and size differences between the controller buffer and process buffer, the process may take up to thirty seconds before it writes data to its data file once its buffer is full.
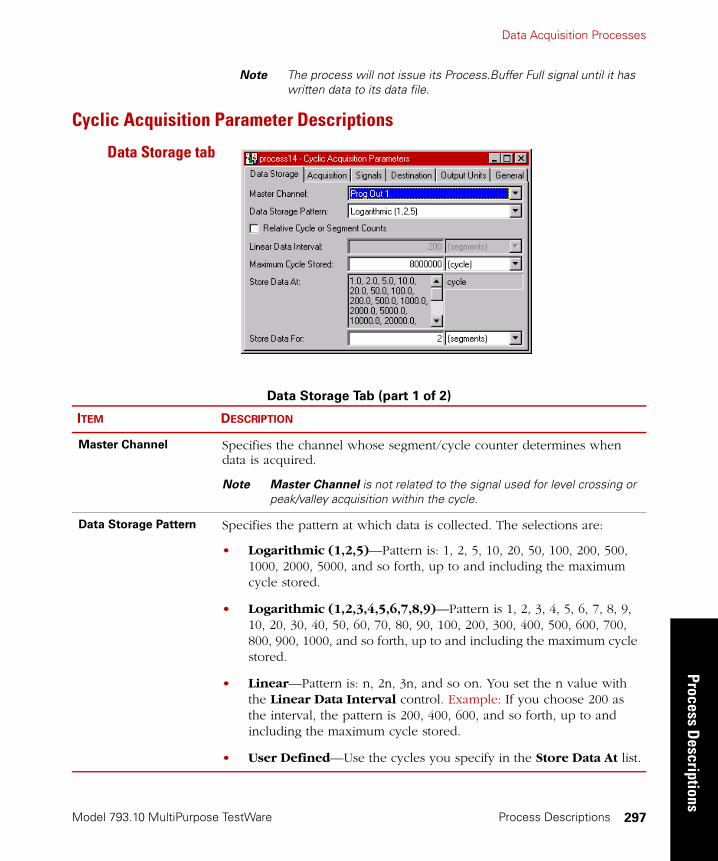
Data Acquisition Processes
Model 793.10 MultiPurpose TestWare
Process Descriptions
Process Descriptions 297
Note The process will not issue its Process.Buffer Full signal until it has written data to its data file.
Cyclic Acquisition Parameter Descriptions
Data Storage tab
Data Storage Tab (part 1 of 2)
ITEM DESCRIPTION
Master Channel Specifies the channel whose segment/cycle counter determines when data is acquired.
Note Master Channel is not related to the signal used for level crossing or peak/valley acquisition within the cycle.
Data Storage Pattern Specifies the pattern at which data is collected. The selections are:
• Logarithmic (1,2,5)—Pattern is: 1, 2, 5, 10, 20, 50, 100, 200, 500, 1000, 2000, 5000, and so forth, up to and including the maximum cycle stored.
• Logarithmic (1,2,3,4,5,6,7,8,9)—Pattern is 1, 2, 3, 4, 5, 6, 7, 8, 9, 10, 20, 30, 40, 50, 60, 70, 80, 90, 100, 200, 300, 400, 500, 600, 700, 800, 900, 1000, and so forth, up to and including the maximum cycle stored.
• Linear—Pattern is: n, 2n, 3n, and so on. You set the n value with the Linear Data Interval control. Example: If you choose 200 as the interval, the pattern is 200, 400, 600, and so forth, up to and including the maximum cycle stored.
• User Defined—Use the cycles you specify in the Store Data At list.
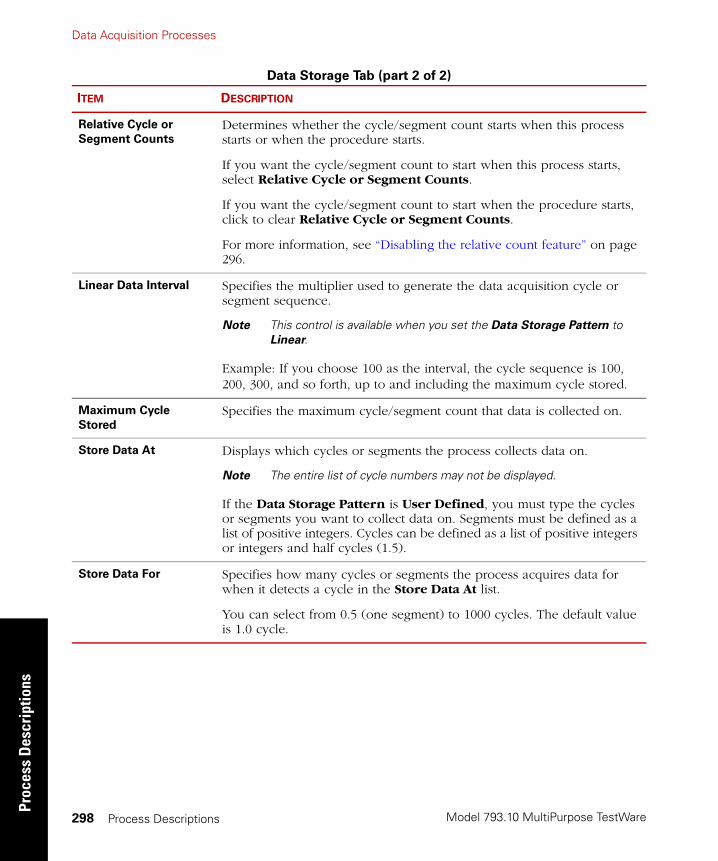
Model 793.10 MultiPurpose TestWare
Data Acquisition ProcessesPr
oces
s D
escr
iptio
ns
Process Descriptions298
Relative Cycle or
Segment Counts
Determines whether the cycle/segment count starts when this process starts or when the procedure starts.
If you want the cycle/segment count to start when this process starts, select Relative Cycle or Segment Counts.
If you want the cycle/segment count to start when the procedure starts, click to clear Relative Cycle or Segment Counts.
For more information, see “Disabling the relative count feature” on page 296.
Linear Data Interval Specifies the multiplier used to generate the data acquisition cycle or segment sequence.
Note This control is available when you set the Data Storage Pattern to Linear.
Example: If you choose 100 as the interval, the cycle sequence is 100, 200, 300, and so forth, up to and including the maximum cycle stored.
Maximum Cycle
Stored
Specifies the maximum cycle/segment count that data is collected on.
Store Data At Displays which cycles or segments the process collects data on.
Note The entire list of cycle numbers may not be displayed.
If the Data Storage Pattern is User Defined, you must type the cycles or segments you want to collect data on. Segments must be defined as a list of positive integers. Cycles can be defined as a list of positive integers or integers and half cycles (1.5).
Store Data For Specifies how many cycles or segments the process acquires data for when it detects a cycle in the Store Data At list.
You can select from 0.5 (one segment) to 1000 cycles. The default value is 1.0 cycle.
Data Storage Tab (part 2 of 2)
ITEM DESCRIPTION
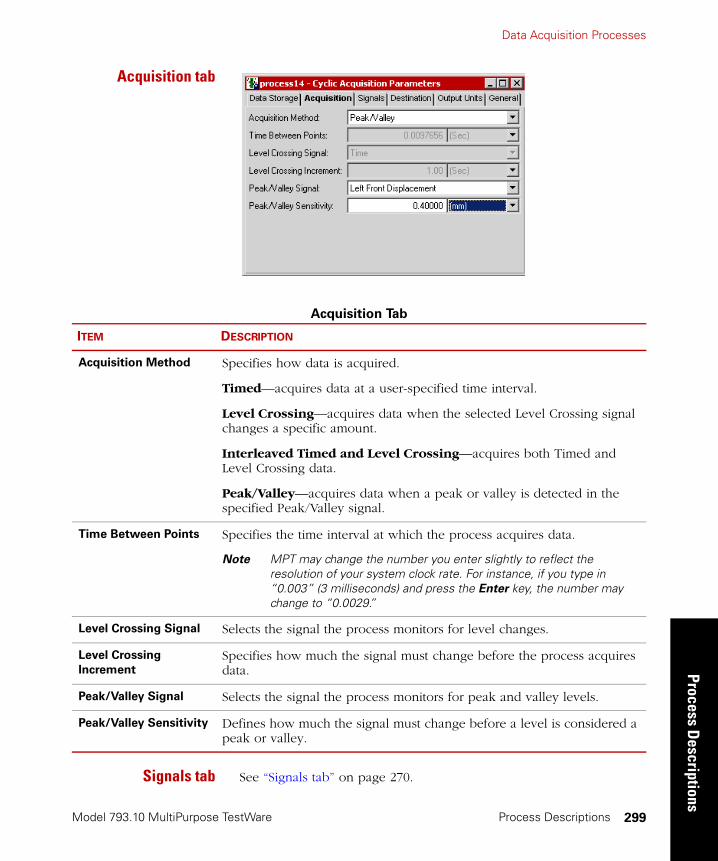
Data Acquisition Processes
Model 793.10 MultiPurpose TestWare
Process Descriptions
Process Descriptions 299
Acquisition tab
Signals tab See “Signals tab” on page 270.
Acquisition Tab
ITEM DESCRIPTION
Acquisition Method Specifies how data is acquired.
Timed—acquires data at a user-specified time interval.
Level Crossing—acquires data when the selected Level Crossing signal changes a specific amount.
Interleaved Timed and Level Crossing—acquires both Timed and Level Crossing data.
Peak/Valley—acquires data when a peak or valley is detected in the specified Peak/Valley signal.
Time Between Points Specifies the time interval at which the process acquires data.
Note MPT may change the number you enter slightly to reflect the resolution of your system clock rate. For instance, if you type in “0.003” (3 milliseconds) and press the Enter key, the number may change to “0.0029.”
Level Crossing Signal Selects the signal the process monitors for level changes.
Level Crossing
Increment
Specifies how much the signal must change before the process acquires data.
Peak/Valley Signal Selects the signal the process monitors for peak and valley levels.
Peak/Valley Sensitivity Defines how much the signal must change before a level is considered a peak or valley.
Model 793.10 MultiPurpose TestWare
Data Acquisition ProcessesPr
oces
s D
escr
iptio
ns
Process Descriptions300
Destination tab See “Destination tab” on page 270.
Note Buffer settings are not available for the Cyclic Data Acquisition process.
Output Units tab See “Output Units tab” on page 272.
General tab See “General tab” on page 202.
How to Define a Cyclic Acquisition Process
1. Drag the icon from the Process Palette to your Procedure
table.
2. Double-click the process icon in the Procedure table.
3. In the parameters window, click the Data Storage tab.
4. In the Master Channel list, click the channel you want to monitor with this process.
5. Choose a Data Storage Pattern, and then type a value in the Maximum Cycle Stored box.
For a linear pattern, type a value in the Linear Data Interval box. For a user-defined pattern, enter arbitrary values in the Store Data At box.
6. Optional—Select Relative Cycle or Segment Counts.
If you want the process to start acquiring data from cycles relative to when the process starts, select Relative Cycle or Segment Counts.
If you want the process to start acquiring data from cycles relative to the beginning of the procedure, click to clear Relative Cycle or Segment Counts.
7. Optional—In the Store Data For box, enter the number of cycles you want to collect data for each Store Data At entry.
8. Click the Acquisition tab.
Data Acquisition Processes
Model 793.10 MultiPurpose TestWare
Process Descriptions
Process Descriptions 301
9. Choose an Acquisition Method.
• For Timed data, enter a value in the Time Between Points box.
• For Level Crossing data, click a signal in the Level Crossing Signal list, and enter a value in the Level Crossing Increment box.
• For Interleaved Timed and Level Crossing data, enter a value in the Timed Between Points box, click a signal in the Level Crossing Signal box, and enter a value in the Level Crossing Increment box.
• For Peak/Valley data, click a signal in the Peak/Valley Signal list and enter a value in the Peak/Valley Sensitivity box.
10. Click the Signals tab.
11. Move all the signals you want to record data on to the Included list. Move all the others to the Available list.
Note The order of the signals in the Included list determines the order of the columns of data in your data file.
12. Click the Destination tab.
13. Type a description of the data file in the Data Header box.
14. In the Destination list, click the destination for the acquired data. (If you click User-specified data file, enter a file name in the User Data File box.) See “Data destination” on page 268.
15. Optional—If desired, enable Write First Data Header Only checkbox. This feature aids data sorting and analysis.
16. Optional—Click the Output Units tab.
Change the unit assignment set if you want. Each data acquisition process can use a different unit assignment set.
Model 793.10 MultiPurpose TestWare
Data Acquisition ProcessesPr
oces
s D
escr
iptio
ns
Process Descriptions302
17. Click the General tab.
18. In the Name box, type a name for this process. (You can also name the process in the Procedure table.)
19. Select the Process Enabled check box. (If this box is cleared, the process will not execute.)
20. In the Execute Process box, type number of times you want the process to execute.
21. Optional—In the Counter Type list, click a counter type.
22. Optional—If you enabled a counter, type a Counter Label.
23. Close the parameters window, and set the desired Start and Interrupt signals for the process in the Procedure table.

Data Acquisition Processes
Model 793.10 MultiPurpose TestWare
Process Descriptions
Process Descriptions 303
Fatigue
The Fatigue process accumulates cycles in a histogram and calculates a damage number (in the form of a statistical value) based on the histogram content.
Note The MPT Fatigue process calculates damage numbers using the same algorithms as the Advanced Editing and Analysis feature of the MTS RPC III™ product.
Periodically, the histogram and damage numbers are saved to disk, and sent to the Fatigue Monitoring Application via a proprietary data exchange protocol.
With the Fatigue Monitoring application, you can monitor the fatigue data in a real-time, graphical format. For more information, see “Fatigue Monitoring Application” on page 431.
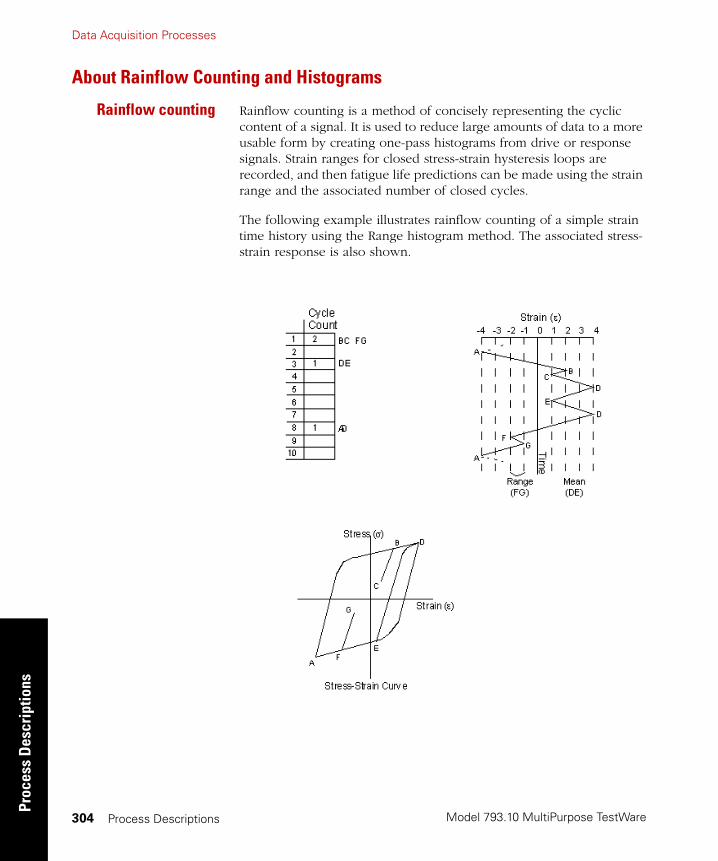
Model 793.10 MultiPurpose TestWare
Data Acquisition ProcessesPr
oces
s D
escr
iptio
ns
Process Descriptions304
About Rainflow Counting and Histograms
Rainflow counting Rainflow counting is a method of concisely representing the cyclic content of a signal. It is used to reduce large amounts of data to a more usable form by creating one-pass histograms from drive or response signals. Strain ranges for closed stress-strain hysteresis loops are recorded, and then fatigue life predictions can be made using the strain range and the associated number of closed cycles.
The following example illustrates rainflow counting of a simple strain time history using the Range histogram method. The associated stress-strain response is also shown.
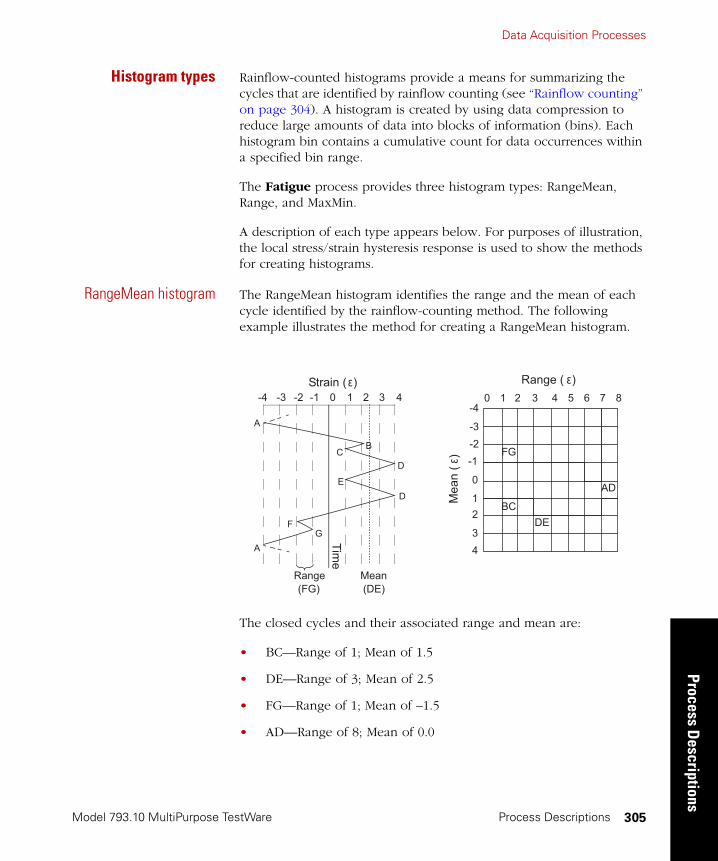
Data Acquisition Processes
Model 793.10 MultiPurpose TestWare
Process Descriptions
Process Descriptions 305
Histogram types Rainflow-counted histograms provide a means for summarizing the cycles that are identified by rainflow counting (see “Rainflow counting” on page 304). A histogram is created by using data compression to reduce large amounts of data into blocks of information (bins). Each histogram bin contains a cumulative count for data occurrences within a specified bin range.
The Fatigue process provides three histogram types: RangeMean, Range, and MaxMin.
A description of each type appears below. For purposes of illustration, the local stress/strain hysteresis response is used to show the methods for creating histograms.
RangeMean histogram The RangeMean histogram identifies the range and the mean of each cycle identified by the rainflow-counting method. The following example illustrates the method for creating a RangeMean histogram.
The closed cycles and their associated range and mean are:
• BC—Range of 1; Mean of 1.5
• DE—Range of 3; Mean of 2.5
• FG—Range of 1; Mean of –1.5
• AD—Range of 8; Mean of 0.0
�
��
�
��
�
�
�
��
� �������
�� �����
�� �� �� � � � ��� ���� ���ε� � ����� ε�
��
���ε�
��
��
��
�
�
�
�
�
� � � � � � � � ��
��
��
��
��

Model 793.10 MultiPurpose TestWare
Data Acquisition ProcessesPr
oces
s D
escr
iptio
ns
Process Descriptions306
MinMax histogram The MinMax histogram identifies the rainflow-counted cycles by the identified maximum/minimum value. The following example illustrates the method for creating a MinMax histogram.
When using the MinMax method, all the histogram counts must fall in the upper-right triangle of the histogram because the maximum value must be greater than the minimum value. The closed cycles and their associated minimum and maximum are:
• BC—Minimum of 1; Maximum of 2
• DE—Minimum of 1; Maximum of 4
• FG—Minimum of –2; Maximum of –1
• AD—Minimum of –4; Maximum of 4
��
��
��
�
�
�
�
�
�� �� �� � � � �
� !"�� ε�
��"
��ε�
�� ���
�� ��
��
���
��
�
��
�
��� �����#$�%�&�
�
�� �� �� � � � ������ ���ε�
�
�
�
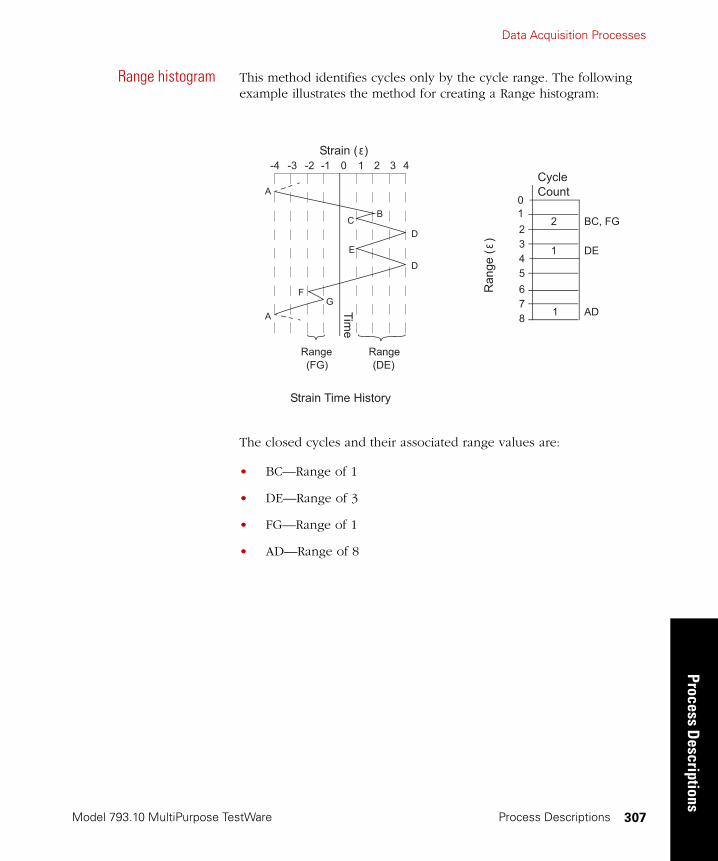
Data Acquisition Processes
Model 793.10 MultiPurpose TestWare
Process Descriptions
Process Descriptions 307
Range histogram This method identifies cycles only by the cycle range. The following example illustrates the method for creating a Range histogram:
The closed cycles and their associated range values are:
• BC—Range of 1
• DE—Range of 3
• FG—Range of 1
• AD—Range of 8
�
��
�
��
�
��� �����#$�%�&
��
�� �� �� � � � ������ ���ε�
�
�
�
� �������
� �������
�&'(��%"��
�
����
��
�
�
�
� �
����
ε�
��)���
��
��
�
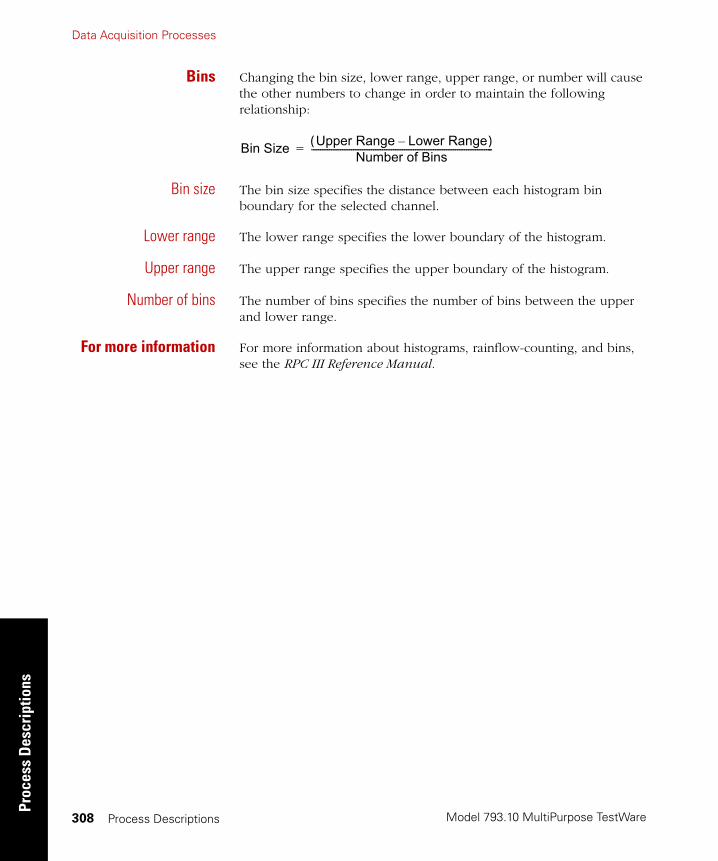
Model 793.10 MultiPurpose TestWare
Data Acquisition ProcessesPr
oces
s D
escr
iptio
ns
Process Descriptions308
Bins Changing the bin size, lower range, upper range, or number will cause the other numbers to change in order to maintain the following relationship:
Bin size The bin size specifies the distance between each histogram bin boundary for the selected channel.
Lower range The lower range specifies the lower boundary of the histogram.
Upper range The upper range specifies the upper boundary of the histogram.
Number of bins The number of bins specifies the number of bins between the upper and lower range.
For more information For more information about histograms, rainflow-counting, and bins, see the RPC III Reference Manual.
Bin Size Upper Range Lower Range�( )Number of Bins----------------------------------------------------------------------------------=
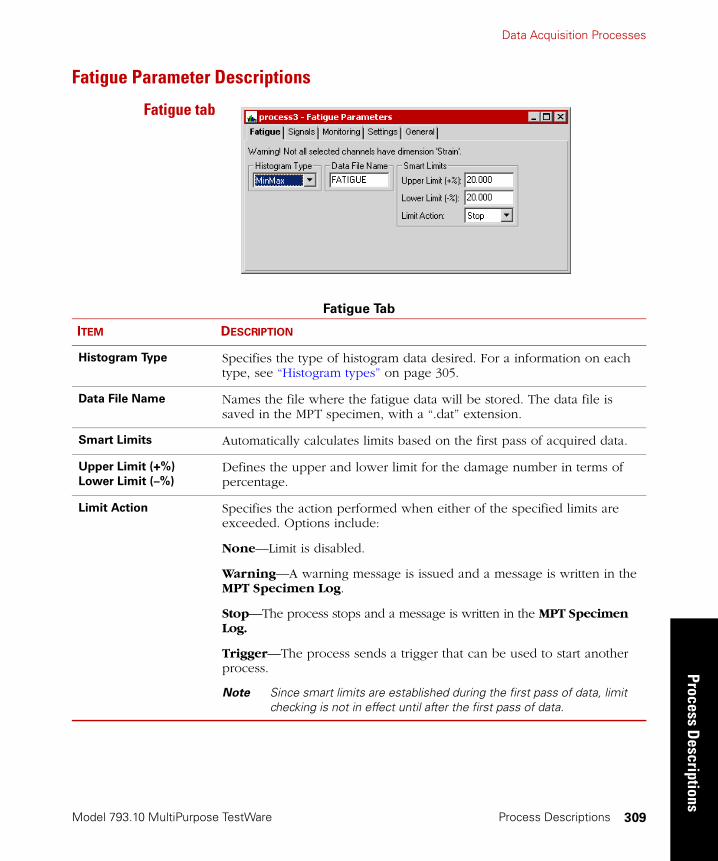
Data Acquisition Processes
Model 793.10 MultiPurpose TestWare
Process Descriptions
Process Descriptions 309
Fatigue Parameter Descriptions
Fatigue tab
Fatigue Tab
ITEM DESCRIPTION
Histogram Type Specifies the type of histogram data desired. For a information on each type, see “Histogram types” on page 305.
Data File Name Names the file where the fatigue data will be stored. The data file is saved in the MPT specimen, with a “.dat” extension.
Smart Limits Automatically calculates limits based on the first pass of acquired data.
Upper Limit (+%)
Lower Limit (–%)
Defines the upper and lower limit for the damage number in terms of percentage.
Limit Action Specifies the action performed when either of the specified limits are exceeded. Options include:
None—Limit is disabled.
Warning—A warning message is issued and a message is written in the MPT Specimen Log.
Stop—The process stops and a message is written in the MPT Specimen Log.
Trigger—The process sends a trigger that can be used to start another process.
Note Since smart limits are established during the first pass of data, limit checking is not in effect until after the first pass of data.
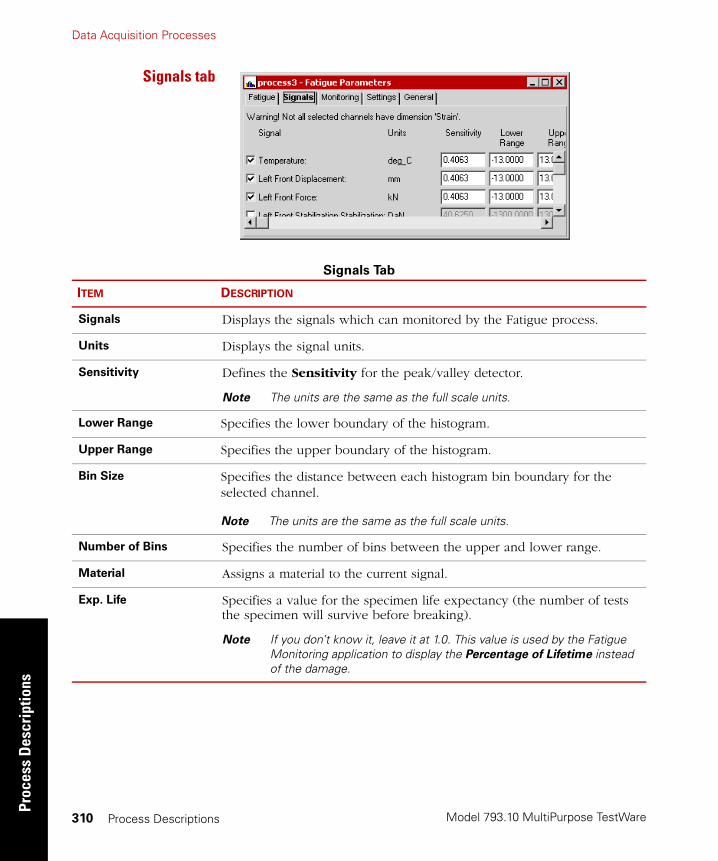
Model 793.10 MultiPurpose TestWare
Data Acquisition ProcessesPr
oces
s D
escr
iptio
ns
Process Descriptions310
Signals tab
Signals Tab
ITEM DESCRIPTION
Signals Displays the signals which can monitored by the Fatigue process.
Units Displays the signal units.
Sensitivity Defines the Sensitivity for the peak/valley detector.
Note The units are the same as the full scale units.
Lower Range Specifies the lower boundary of the histogram.
Upper Range Specifies the upper boundary of the histogram.
Bin Size Specifies the distance between each histogram bin boundary for the selected channel.
Note The units are the same as the full scale units.
Number of Bins Specifies the number of bins between the upper and lower range.
Material Assigns a material to the current signal.
Exp. Life Specifies a value for the specimen life expectancy (the number of tests the specimen will survive before breaking).
Note If you don’t know it, leave it at 1.0. This value is used by the Fatigue Monitoring application to display the Percentage of Lifetime instead of the damage.
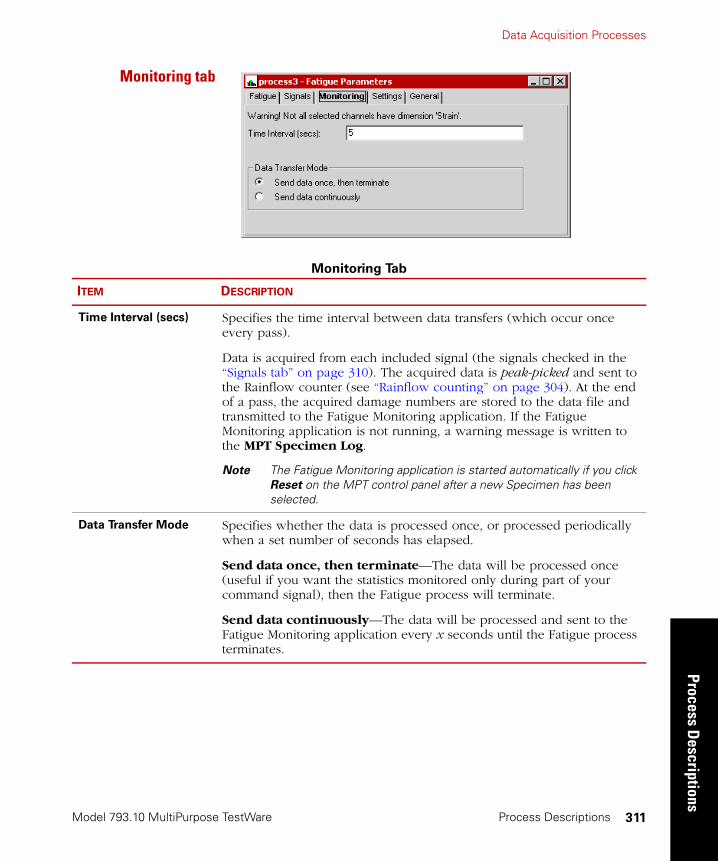
Data Acquisition Processes
Model 793.10 MultiPurpose TestWare
Process Descriptions
Process Descriptions 311
Monitoring tab
Monitoring Tab
ITEM DESCRIPTION
Time Interval (secs) Specifies the time interval between data transfers (which occur once every pass).
Data is acquired from each included signal (the signals checked in the “Signals tab” on page 310). The acquired data is peak-picked and sent to the Rainflow counter (see “Rainflow counting” on page 304). At the end of a pass, the acquired damage numbers are stored to the data file and transmitted to the Fatigue Monitoring application. If the Fatigue Monitoring application is not running, a warning message is written to the MPT Specimen Log.
Note The Fatigue Monitoring application is started automatically if you click Reset on the MPT control panel after a new Specimen has been selected.
Data Transfer Mode Specifies whether the data is processed once, or processed periodically when a set number of seconds has elapsed.
Send data once, then terminate—The data will be processed once (useful if you want the statistics monitored only during part of your command signal), then the Fatigue process will terminate.
Send data continuously—The data will be processed and sent to the Fatigue Monitoring application every x seconds until the Fatigue process terminates.
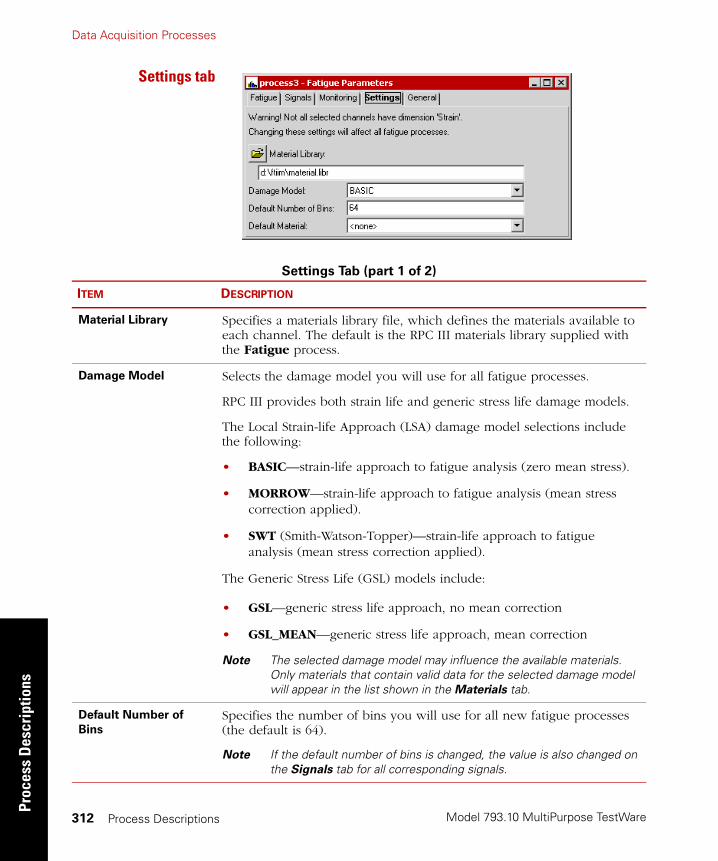
Model 793.10 MultiPurpose TestWare
Data Acquisition ProcessesPr
oces
s D
escr
iptio
ns
Process Descriptions312
Settings tab
Settings Tab (part 1 of 2)
ITEM DESCRIPTION
Material Library Specifies a materials library file, which defines the materials available to each channel. The default is the RPC III materials library supplied with the Fatigue process.
Damage Model Selects the damage model you will use for all fatigue processes.
RPC III provides both strain life and generic stress life damage models.
The Local Strain-life Approach (LSA) damage model selections include the following:
• BASIC—strain-life approach to fatigue analysis (zero mean stress).
• MORROW—strain-life approach to fatigue analysis (mean stress correction applied).
• SWT (Smith-Watson-Topper)—strain-life approach to fatigue analysis (mean stress correction applied).
The Generic Stress Life (GSL) models include:
• GSL—generic stress life approach, no mean correction
• GSL_MEAN—generic stress life approach, mean correction
Note The selected damage model may influence the available materials. Only materials that contain valid data for the selected damage model will appear in the list shown in the Materials tab.
Default Number of
Bins
Specifies the number of bins you will use for all new fatigue processes (the default is 64).
Note If the default number of bins is changed, the value is also changed on the Signals tab for all corresponding signals.
Data Acquisition Processes
Model 793.10 MultiPurpose TestWare
Process Descriptions
Process Descriptions 313
General tab See “General tab” on page 202.
Setting Up a Test to Acquire Fatigue Data
To acquire fatigue data during your test, you should define a Group process that includes the Fatigue process and your command process.
You should sequence your test so that:
• In the group process, the Fatigue process starts when the command process starts.
• When the command process ends, the Fatigue process is terminated.
• When the Fatigue process ends, the Group process ends.
In this setup, each execution of the Group process yields one point of data (which is not enough to create a fatigue plot). To acquire enough data points for your plot, you can set the number of times the Group process executes equal to the number of passes you desire (typically greater than one hundred).
Note You can use the Trend process in parallel with the Fatigue process to acquire trend data.
Default Material Specifies the material that will be the default for all new fatigue processes that are created.
Note If the default material is changed, the value is also changed on the Signals tab for all corresponding signals.
Settings Tab (part 2 of 2)
ITEM DESCRIPTION

Model 793.10 MultiPurpose TestWare
Data Acquisition ProcessesPr
oces
s D
escr
iptio
ns
Process Descriptions314
How to Define a Fatigue Process
1. Drag the icon from the Process Palette to your Procedure
table.
2. Double-click the Fatigue process icon.
3. In the parameters window, click the Fatigue tab.
4. Choose a Histogram Type, and enter a Data File Name.
Note If you have multiple Fatigue processes within one procedure in sequence, be sure to enter a unique file name for each process. Otherwise, all data will be written to the same data file.
5. Under Smart Limits, enter Upper Limit and Lower Limit values, and then set the Limit Action.
6. Click the Settings tab and specify the Materials Library, Damage Model, Default Number of Bins, and Default Material.
7. Click the Signals tab, and select the box next to each signal you want to acquire fatigue data from.
8. For the selected signals, enter the desired values for the Sensitivity, Lower Range, Upper Range, Bin Size, Number of Bins, Material, and Exp. Life (life expectancy).
9. Click the Monitoring tab, type a Time Interval, and then select the Data Transfer Mode.
10. Click the General tab.
11. In the Name box, type a name for this process. (You can also name the process in the Procedure table.)
12. Select the Process Enabled check box. (If this box is cleared, the process will not execute.)
13. In the Execute Process box, type the number of times you want the process to execute.
14. Optional—In the Counter Type list, click a counter type.
15. Optional—If you enabled a counter, type a Counter Label.
16. Close the parameters window, and set the desired Start and Interrupt signals for the process in the Procedure table.
Data Acquisition Processes
Model 793.10 MultiPurpose TestWare
Process Descriptions
Process Descriptions 315
Important tips If your procedure will run for a long time, make sure the Windows virtual memory paging file is large enough (MTS recommends 250 MB). To access the Windows paging file: Start > Settings > Control Panels > System.
In the Fatigue Process Parameters window, make sure the Fatigue process is enabled and the Execute Process value is set to one (on the General tab).
Because the Fatigue process parallels a command process, it will run as long as the command process is executing. However, it is possible to specify the Fatigue process’ run time within the Fatigue process:
1. Click the Monitoring tab.
2. Specify a Time Interval.
3. Select Send data once, then terminate.
Note If you choose Send data continuously on the Monitoring tab, the Fatigue process will not stop on its own, and therefore, will not repeat according to the Execute Process value you enter on the General tab.
Model 793.10 MultiPurpose TestWare
Data Acquisition ProcessesPr
oces
s D
escr
iptio
ns
Process Descriptions316
Time History Input
The Time History Input process acquires and digitizes multiple channels of analog test response data in the RPC III file format.
About Standard Data Acquisition Rates
Data acquisition rates are sub-multiples of the high-clock rate; that is, they equal the high-clock rate divided by certain integers (4, 8, 10, 16, 20, 32, and 40) as follows:
• 1024 Hz
• 512 Hz
• 409.6 Hz
• 256 Hz
• 204.8 Hz
• 128 Hz
• 102.4 Hz
The Time History Input process filters the analog test data you acquire through an analog 5-pole Bessel filter with a cutoff of 300 Hz. After being digitized, the signals are run through a digital filter whose cutoff is set to 40% of the requested sampling frequency and then down-sampled to the requested sampling rate. These digital filters match the ones used in RPC III 498 DSPAD boards so data can be used interchangeably with that system.
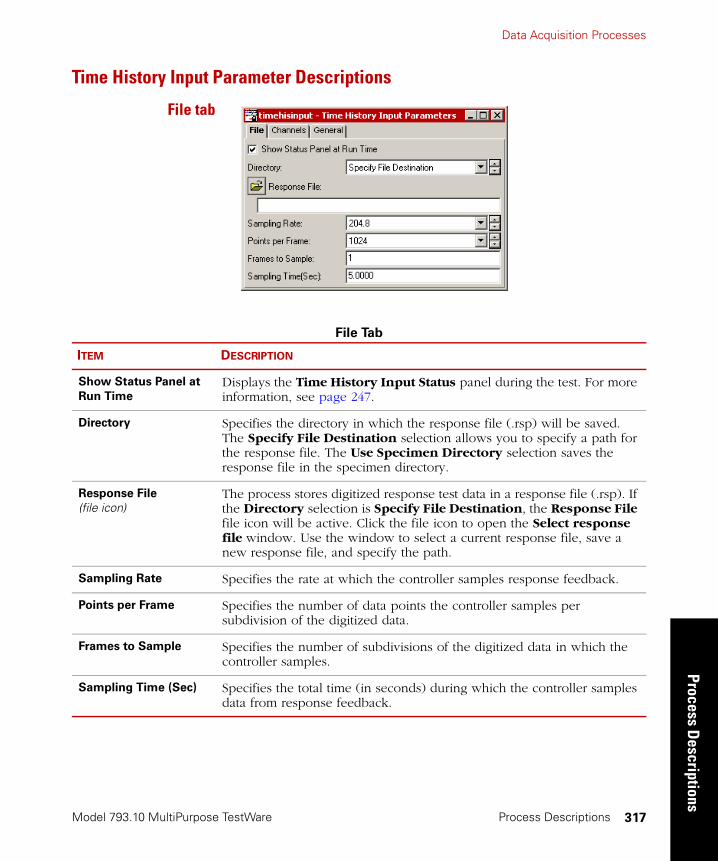
Data Acquisition Processes
Model 793.10 MultiPurpose TestWare
Process Descriptions
Process Descriptions 317
Time History Input Parameter Descriptions
File tab
File Tab
ITEM DESCRIPTION
Show Status Panel at
Run Time
Displays the Time History Input Status panel during the test. For more information, see page 247.
Directory Specifies the directory in which the response file (.rsp) will be saved. The Specify File Destination selection allows you to specify a path for the response file. The Use Specimen Directory selection saves the response file in the specimen directory.
Response File
(file icon)The process stores digitized response test data in a response file (.rsp). If the Directory selection is Specify File Destination, the Response File file icon will be active. Click the file icon to open the Select response file window. Use the window to select a current response file, save a new response file, and specify the path.
Sampling Rate Specifies the rate at which the controller samples response feedback.
Points per Frame Specifies the number of data points the controller samples per subdivision of the digitized data.
Frames to Sample Specifies the number of subdivisions of the digitized data in which the controller samples.
Sampling Time (Sec) Specifies the total time (in seconds) during which the controller samples data from response feedback.
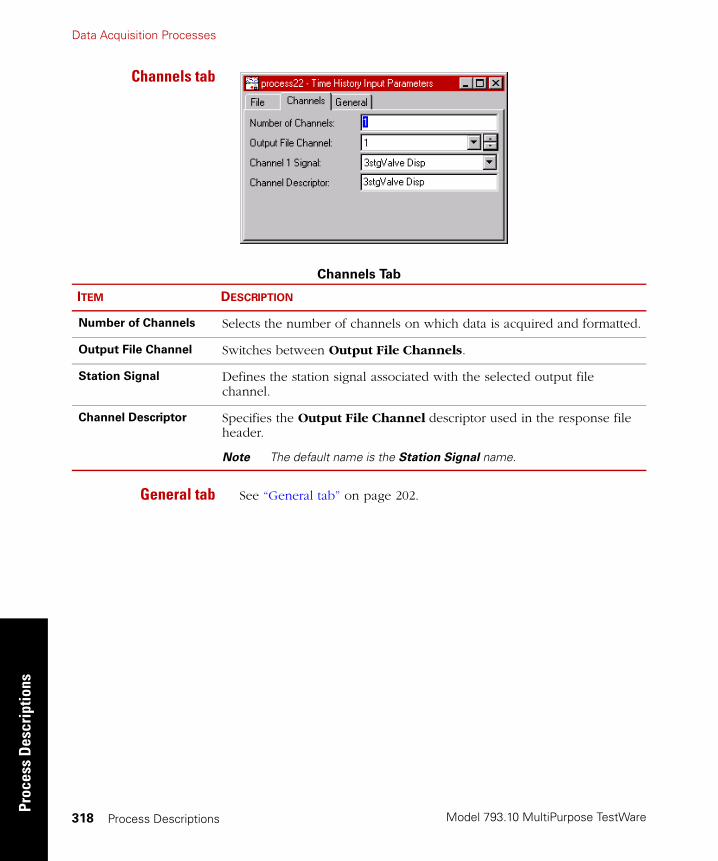
Model 793.10 MultiPurpose TestWare
Data Acquisition ProcessesPr
oces
s D
escr
iptio
ns
Process Descriptions318
Channels tab
General tab See “General tab” on page 202.
Channels Tab
ITEM DESCRIPTION
Number of Channels Selects the number of channels on which data is acquired and formatted.
Output File Channel Switches between Output File Channels.
Station Signal Defines the station signal associated with the selected output file channel.
Channel Descriptor Specifies the Output File Channel descriptor used in the response file header.
Note The default name is the Station Signal name.

Data Acquisition Processes
Model 793.10 MultiPurpose TestWare
Process Descriptions
Process Descriptions 319
How to Define a Time History Input Process
1. Drag the icon from the Process Palette to your Procedure
table.
2. Double-click the process icon in the Procedure table.
3. In the parameters window, click the Channels tab.
4. In the Number of Channels list, type the number of channels you want to take data on and press Enter.
5. In the Output File list, click the first channel.
6. In the Channel 1 Signal list, click the signal to be monitored. (You can enter a descriptor in the Channel Descriptor box.)
7. Perform steps 5 - 6 for any additional channels.
8. Click the File tab.
9. Optional—If desired, enable the Show Status Panel at Run Time control.
10. Use the Directory control to specify the directory in which the response file (.rsp) will be saved. The Specify File Destination selection allows you to specify a path for the response file. The Use Specimen Directory selection saves the response file in the specimen directory.
11. If you have selected Specify File Destination in the previous step, you can click the Response File file icon to open the Select response file window. Use this window to select the file and directory in which you wish to save response data.
12. In the Sampling Rate list, click the desired sampling rate.
13. In the Points per Frame list, click the desired number of data points the controller samples per subdivision of the digitized data.
14. In the Frames to Sample box, type the desired number of subdivisions of the digitized data in which the controller samples.
15. In the Sampling Time (Sec) list, type the total time (in seconds) during which the controller samples data from response feedback.

Model 793.10 MultiPurpose TestWare
Data Acquisition ProcessesPr
oces
s D
escr
iptio
ns
Process Descriptions320
16. Click the General tab.
17. In the Name box, type a name for this process. (You can also name the process in the Procedure table.)
18. Select the Process Enabled check box. (If this box is cleared, the process will not execute.)
19. In the Execute Process box, type number of times you want the process to execute.
20. Optional—In the Counter Type list, click a counter type.
21. Optional—If you enabled a counter, type a Counter Label.
22. Close the parameters window, and set the desired Start and Interrupt signals for the process in the Procedure table.
Data Acquisition Processes
Model 793.10 MultiPurpose TestWare
Process Descriptions
Process Descriptions 321
Trend
The Trend process collects signal data and calculates five statistical trend values: Minimum, Maximum, Mean, RMS, and Standard Deviation.
Periodically, the trend values are saved to disk, and sent to the Trend Monitoring Application via a proprietary data exchange protocol.
With the Trend Monitoring application, you can monitor the trend data in a real-time, graphical format. For more information about trend monitoring, see “Trend Monitoring Application” on page 440.
About Data Handling
Data is acquired for each included signal (the channels with a check mark next to their names). At the end of a pass, the acquired statistical values are stored to the data file and transmitted to the Trend Monitoring application. If the Trend Monitoring application is not running, a warning message will be written to the MPT Specimen Log.
Limits that are changed by the Trend Monitoring application during the procedure will be transferred back to the Trend process and used for the limit check.
Note The Trend Monitoring application is started automatically if you click Reset on the MPT control panel after a new Specimen has been selected.
Smart Limits are calculated after the first complete pass. This means that limit checking is effectively disabled until after the first pass has run to completion. If you need limit checking during the first pass as well, use the Trend tab to enter absolute limit values and adjust the limits as soon as the Trend Monitoring application shows the data for the first pass.
If a smart limit is based on the data value, and the data value is too small (<0.01% of range), limits based on full scale will be used instead.
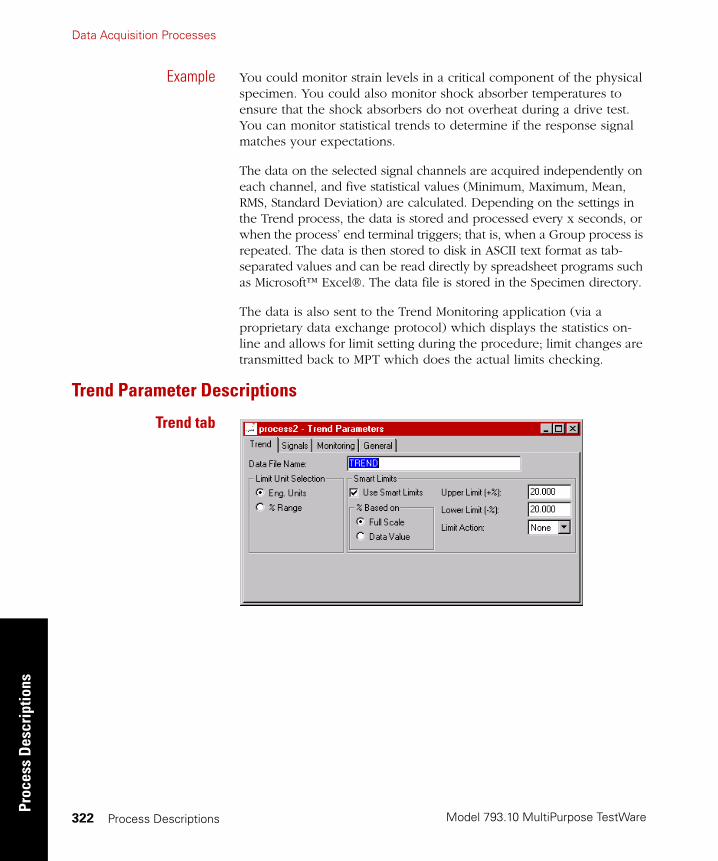
Model 793.10 MultiPurpose TestWare
Data Acquisition ProcessesPr
oces
s D
escr
iptio
ns
Process Descriptions322
Example You could monitor strain levels in a critical component of the physical specimen. You could also monitor shock absorber temperatures to ensure that the shock absorbers do not overheat during a drive test. You can monitor statistical trends to determine if the response signal matches your expectations.
The data on the selected signal channels are acquired independently on each channel, and five statistical values (Minimum, Maximum, Mean, RMS, Standard Deviation) are calculated. Depending on the settings in the Trend process, the data is stored and processed every x seconds, or when the process’ end terminal triggers; that is, when a Group process is repeated. The data is then stored to disk in ASCII text format as tab-separated values and can be read directly by spreadsheet programs such as Microsoft™ Excel®. The data file is stored in the Specimen directory.
The data is also sent to the Trend Monitoring application (via a proprietary data exchange protocol) which displays the statistics on-line and allows for limit setting during the procedure; limit changes are transmitted back to MPT which does the actual limits checking.
Trend Parameter Descriptions
Trend tab

Data Acquisition Processes
Model 793.10 MultiPurpose TestWare
Process Descriptions
Process Descriptions 323
Trend Tab
ITEM DESCRIPTION
Data File Name Names the file where the trend data is stored.
Note Trend files are stored in your MPT specimen with a “.dat” extension.
Limit Unit Selection Specifies the units for the trend data limits.
Use Smart Limits Automatically calculates limits during the procedure based on the first pass of acquired data.
Note If you select Use Smart Limits, the Signals Limits boxes (on the Signals tab) are disabled. Limits that are changed during the test by the Trend Monitoring application are transferred back to the MPT Trend process.
% Based on Defines the reference of the data value on which the limit % is based.
Full Scale—Uses the full scale value as the reference value.
Data Value—Uses the first-pass value as the reference value.
Upper Limit (+%)
Lower Limit (-%)
Defines the lower and upper limit for each statistical value.
Limit Action Specifies the action performed when either of the specified limits are exceeded. Options include:
None—Limit is disabled.
Warning—A warning message is issued and a message is written in the MPT message log.
Stop—The process stops and a message is written in the MPT Specimen Log.
Trigger—The process sends a trigger that can be used to start another process.
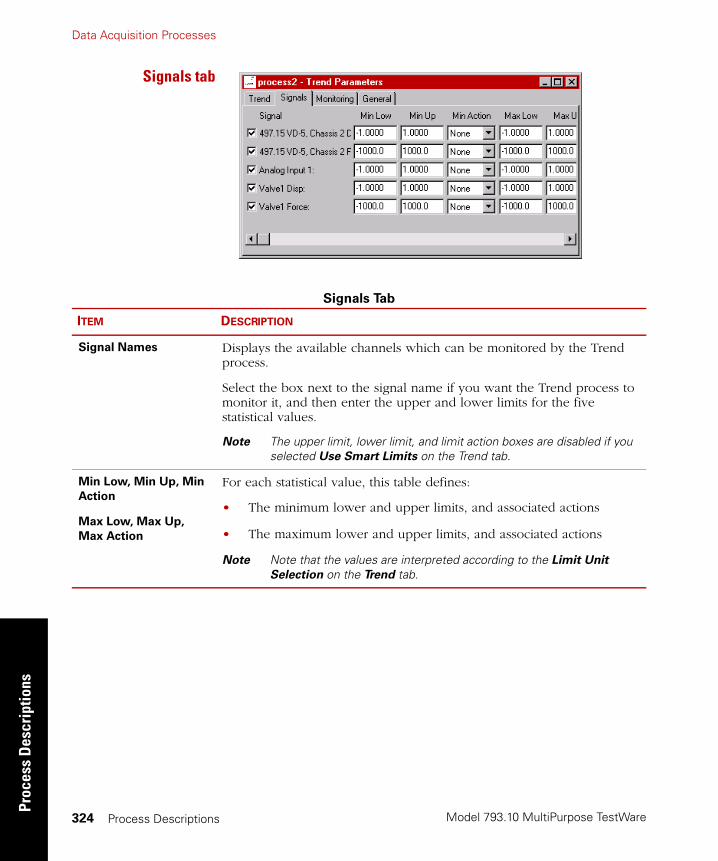
Model 793.10 MultiPurpose TestWare
Data Acquisition ProcessesPr
oces
s D
escr
iptio
ns
Process Descriptions324
Signals tab
Signals Tab
ITEM DESCRIPTION
Signal Names Displays the available channels which can be monitored by the Trend process.
Select the box next to the signal name if you want the Trend process to monitor it, and then enter the upper and lower limits for the five statistical values.
Note The upper limit, lower limit, and limit action boxes are disabled if you selected Use Smart Limits on the Trend tab.
Min Low, Min Up, Min
Action
Max Low, Max Up,
Max Action
For each statistical value, this table defines:
• The minimum lower and upper limits, and associated actions
• The maximum lower and upper limits, and associated actions
Note Note that the values are interpreted according to the Limit Unit
Selection on the Trend tab.

Data Acquisition Processes
Model 793.10 MultiPurpose TestWare
Process Descriptions
Process Descriptions 325
Monitoring tab
General tab See “General tab” on page 202.
Monitoring Tab
ITEM DESCRIPTION
Time Interval (secs) Specifies the time interval between data transfers (which happens once every pass).
First, choose a suitable time interval (for example, 120 seconds; thus, a pass would be two minutes in length).
Data Transfer Mode Specifies whether the data is saved and sent once, or saved and sent each time the specified Time Interval elapses.
Send data once, then terminate—The data will be saved and sent once at the end of the first Time Interval. (This setting is useful if you want the monitor statistics only for a part of the test.)
Send data continuously—The data will be saved and sent continuously in the Time Interval specified until the Trend process is done or interrupted.
Model 793.10 MultiPurpose TestWare
Data Acquisition ProcessesPr
oces
s D
escr
iptio
ns
Process Descriptions326
Setting Up a Test to Acquire Trend Data
To acquire trend data during your test, you should define a Group process that includes the Trend process and your command process.
Note Your command process is typically a Profile or Time History
Output process.
Typical trend tests are sequenced so that:
• When the command process starts, the Trend process starts.
• When the command process ends, the Trend process is terminated.
• When the Trend process ends, the Group process ends.
One pass of this Group process will yield only one point of data for each statistical value, which is not enough to create a trend plot. To acquire more points, you must set the number of times the Group process executes equal to the number of command process passes you desire (this is typically greater than one hundred).
Note If desired, you can use the Fatigue process in parallel with the Trend process to acquire fatigue data.
Data Acquisition Processes
Model 793.10 MultiPurpose TestWare
Process Descriptions
Process Descriptions 327
How to Define a Trend Process
1. Drag the icon from the Process Palette to your Procedure
or Group table.
2. Double-click the process icon in the Procedure or Group table.
3. Click the Trend tab. Enter a Data File Name, select the Limits Units and, if you want, enable the Smart Limits.
4. Click the Signals tab.
5. Select all the signals that you want to acquire data from by selecting the check box to the left of the signal name.
6. For each selected signal, and for each statistical value, enter the desired values for the upper and lower limit and the limit action. (This step applies only if Smart Limits are disabled.)
7. Click the Monitoring tab and select a Time Interval (typically set to 0) and Data Transfer Mode.
8. Click the General tab.
9. In the Name box, type a name for this process. (You can also name the process in the Procedure table.)
10. Select the Process Enabled check box. (If this box is cleared, the process will not execute.)
11. In the Execute Process box, type number of times you want the process to execute.
12. Optional—In the Counter Type list, click a counter type.
13. Optional—If you enabled a counter, type a Counter Label.
14. Close the parameters window, and set the desired Start and Interrupt signals for the process in the Procedure table.

Model 793.10 MultiPurpose TestWare
Data Acquisition ProcessesPr
oces
s D
escr
iptio
ns
Process Descriptions328
Important hints • If your procedure will run for a long time, make sure the Windows virtual memory paging file is large enough (MTS recommends 250 MB). To access the Windows paging file controls: Start > Settings > Control Panels > System
• On the General tab, make sure the Trend process is enabled and the Execute Process value is set to one. Because the Trend process parallels a command process, it will run as long as the command process is executing. However, it is possible to specify the Trend process’ run time within the Trend process:
Click the Monitoring tab.
Specify a Time Interval.
Select Send data once, then terminate.
Note If you choose Send data continuously on the Monitoring tab, the Trend process will not stop on its own, and therefore, will not repeat according to the Execute Process value you enter on the General tab.
• If you change limits during the procedure (using the Trend Monitoring application) the new limits are transferred to MPT and are displayed in the Signals tab in the MPT Trend Parameters window. Thus, if you store the procedure after running, these settings will be saved as well.

Data Acquisition Processes
Model 793.10 MultiPurpose TestWare
Process Descriptions
Process Descriptions 329
More About Smart Limits
• If you press Reset and start the procedure over, Smart Limits will not be calculated again.
• If you change the Specimen, Smart Limits will be calculated again (even if you load a previously run procedure).
• As mentioned above, if you change limits during the procedure, the new limits will be stored with the procedure if you decide to save the procedure after a run. However, if Smart Limits are enabled when you save, they will be calculated again at run time, thus effectively disabling the previously saved limits. (You may decide you want to disable Smart Limits before running the procedure.
Example Suppose you want to run a sine wave for 20,000 cycles and you want trend to be calculated every 1,000 cycles.
To achieve this, use a Group process with a repeat count of 20. (If you want to repeat a Trend process, you must put it into a Group process paralleled by a command process, or use the Timed Mode.
Inside the Group process, you will have the Cyclic command process (in this case, a sine wave running for 1,000 cycles) and the Trend process running in parallel. The Start signal for both processes should be Group.Start. The Group is Done signal should be Trend.Done (assuming the name of your Trend process is “Trend”). The Interrupt signal for the Trend process should be Cyclic.Done.
Model 793.10 MultiPurpose TestWare
Data Acquisition ProcessesPr
oces
s D
escr
iptio
ns
Process Descriptions330
More About RMS, Standard Deviation, and Asymmetric Full Scales
RMS and Standard Deviation are always positive numbers (greater than or equal to zero). Given a range of –10 mm to –5 mm, RMS then would be in the range of 5 through 10, and Standard Deviation would be 0 through 10. This is important to remember when entering limit values, either as engineering units or as percentages. The Smart Limits controls in the Trend tab takes these physical relationships into account and checks user input accordingly.
Another idiosyncrasy occurs when working with temperature channels, and using Celsius within MPT and Fahrenheit in the output unit assignment set. In this case the lower limit for Standard Deviation defaults to 0º C; however, this equals 32º F. Because the Standard Deviation for slowly changing signals (such as temperature) is close to zero, in this scenario the lower limit for Standard Deviation (32º F) would very likely be tripped after the first pass. The best way to avoid this situation is to use the same unit assignment set within MPT and as output unit assignment set.
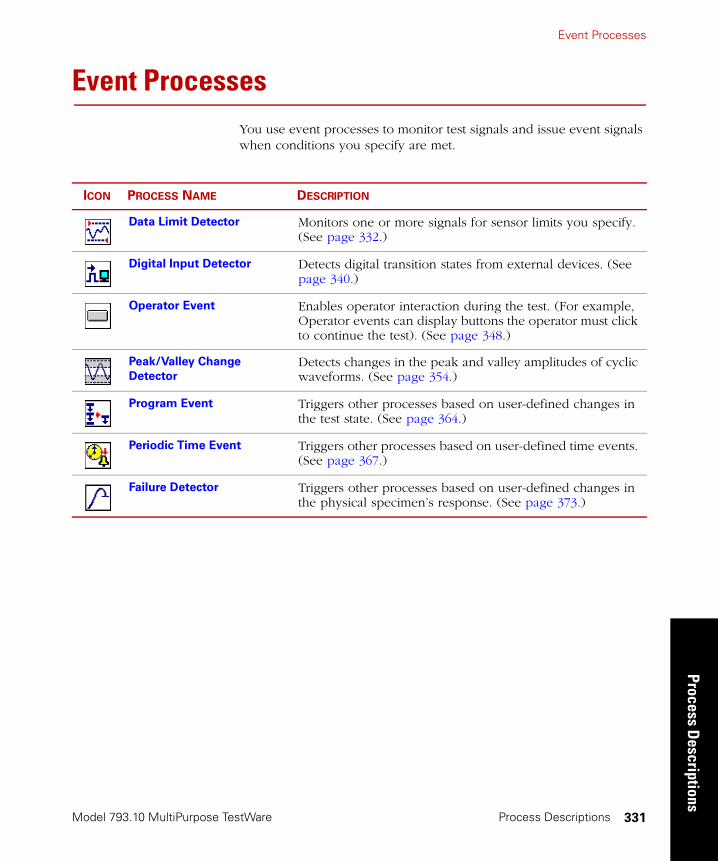
Event Processes
Model 793.10 MultiPurpose TestWare
Process Descriptions
Process Descriptions 331
Event ProcessesYou use event processes to monitor test signals and issue event signals when conditions you specify are met.
ICON PROCESS NAME DESCRIPTION
Data Limit Detector Monitors one or more signals for sensor limits you specify. (See page 332.)
Digital Input Detector Detects digital transition states from external devices. (See page 340.)
Operator Event Enables operator interaction during the test. (For example, Operator events can display buttons the operator must click to continue the test). (See page 348.)
Peak/Valley Change
Detector
Detects changes in the peak and valley amplitudes of cyclic waveforms. (See page 354.)
Program Event Triggers other processes based on user-defined changes in the test state. (See page 364.)
Periodic Time Event Triggers other processes based on user-defined time events. (See page 367.)
Failure Detector Triggers other processes based on user-defined changes in the physical specimen’s response. (See page 373.)
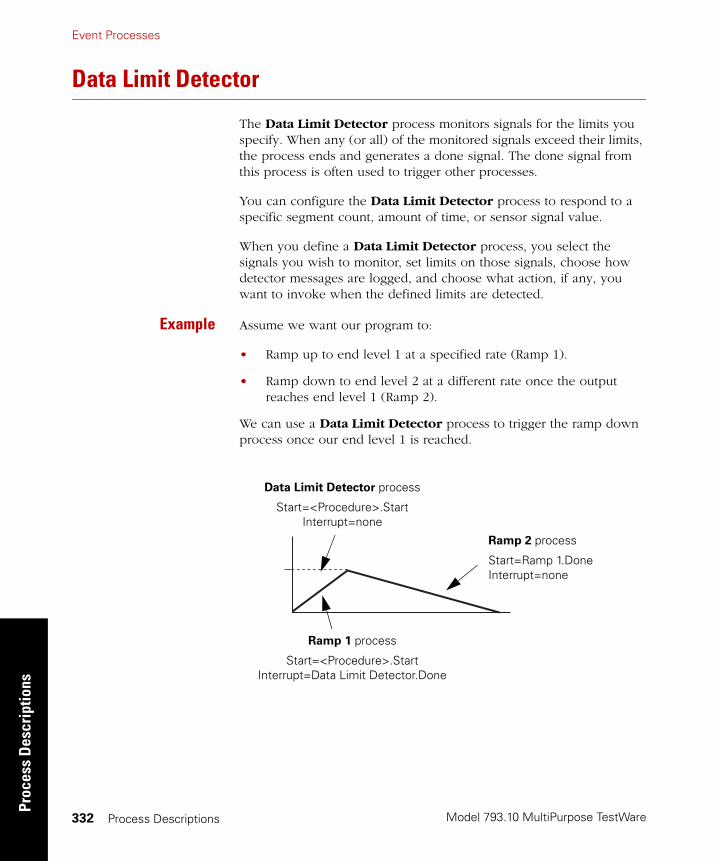
Model 793.10 MultiPurpose TestWare
Event ProcessesPr
oces
s D
escr
iptio
ns
Process Descriptions332
Data Limit Detector
The Data Limit Detector process monitors signals for the limits you specify. When any (or all) of the monitored signals exceed their limits, the process ends and generates a done signal. The done signal from this process is often used to trigger other processes.
You can configure the Data Limit Detector process to respond to a specific segment count, amount of time, or sensor signal value.
When you define a Data Limit Detector process, you select the signals you wish to monitor, set limits on those signals, choose how detector messages are logged, and choose what action, if any, you want to invoke when the defined limits are detected.
Example Assume we want our program to:
• Ramp up to end level 1 at a specified rate (Ramp 1).
• Ramp down to end level 2 at a different rate once the output reaches end level 1 (Ramp 2).
We can use a Data Limit Detector process to trigger the ramp down process once our end level 1 is reached.
Ramp 1 process
Start=<Procedure>.StartInterrupt=Data Limit Detector.Done
Ramp 2 process
Start=Ramp 1.DoneInterrupt=none
Data Limit Detector process
Start=<Procedure>.StartInterrupt=none

Event Processes
Model 793.10 MultiPurpose TestWare
Process Descriptions
Process Descriptions 333
About Limit Modes
This process supports relative limits (starting when the process begins) and absolute limits (from a zero reference).
Example Assume the test command ramps from 1 cm to 4 cm. An absolute limit value of 2 cm ends the process at 2 cm. A relative limit ends the process at 3 cm (2 cm relative to 1 cm).
Using actions with processes
The Station Manager includes an Event-Action Editor that lets you create user defined actions that you can link to test events.
The user defined actions that you create with the Station Manager, in addition to some built-in actions (Interlock, Station Power Off, Program Interlock, Program Stop, and Program Hold) are now available in the Action list boxes in the Data Limit Detector, Digital Input Detector, and Program Control processes.
Creating actionswhen MPT is running
To define actions with the Station Manager Event-Action Editor (in the Tools menu), you must have the Configuration access level selected. To select the Configuration access level, you must exit MultiPurpose TestWare, and any other applications that may be running, such a Basic TestWare. Once you have exited the applications, you can select the Configuration access level and define actions as desired with the Event-Action Editor. Then, before you relaunch MultiPurpose TestWare, you must select any other access level other than Configuration.
The user defined actions you have defined will appear in the Action list boxes in the Data Limit Detector, Digital Input Detector, and Program Control processes.
4
2 cm absolute2
3
1
cm
2 cm relative
Data Limit Detector process begins
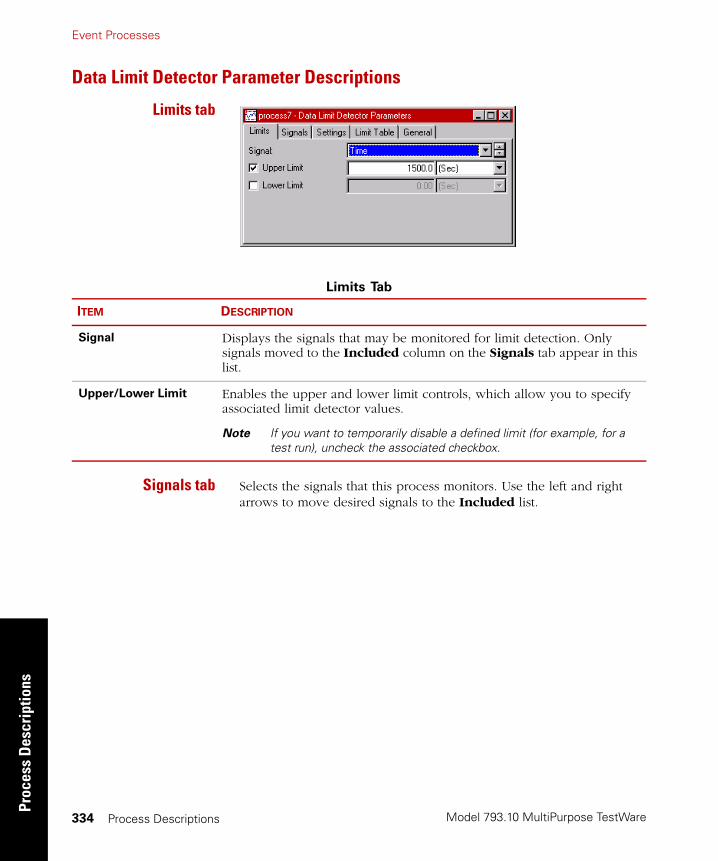
Model 793.10 MultiPurpose TestWare
Event ProcessesPr
oces
s D
escr
iptio
ns
Process Descriptions334
Data Limit Detector Parameter Descriptions
Limits tab
Signals tab Selects the signals that this process monitors. Use the left and right arrows to move desired signals to the Included list.
Limits Tab
ITEM DESCRIPTION
Signal Displays the signals that may be monitored for limit detection. Only signals moved to the Included column on the Signals tab appear in this list.
Upper/Lower Limit Enables the upper and lower limit controls, which allow you to specify associated limit detector values.
Note If you want to temporarily disable a defined limit (for example, for a test run), uncheck the associated checkbox.
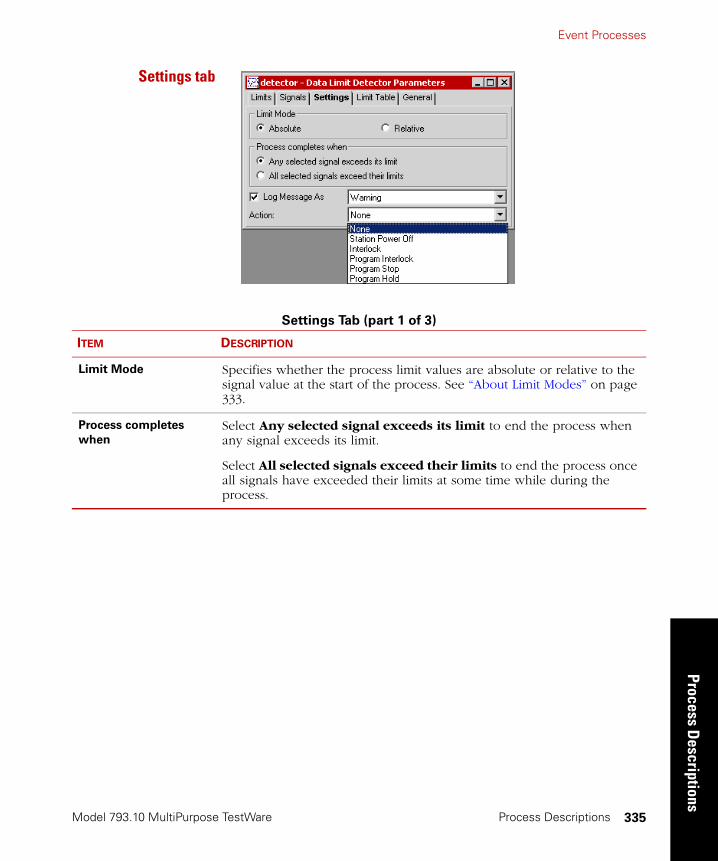
Event Processes
Model 793.10 MultiPurpose TestWare
Process Descriptions
Process Descriptions 335
Settings tab
Settings Tab (part 1 of 3)
ITEM DESCRIPTION
Limit Mode Specifies whether the process limit values are absolute or relative to the signal value at the start of the process. See “About Limit Modes” on page 333.
Process completes
when
Select Any selected signal exceeds its limit to end the process when any signal exceeds its limit.
Select All selected signals exceed their limits to end the process once all signals have exceeded their limits at some time while during the process.
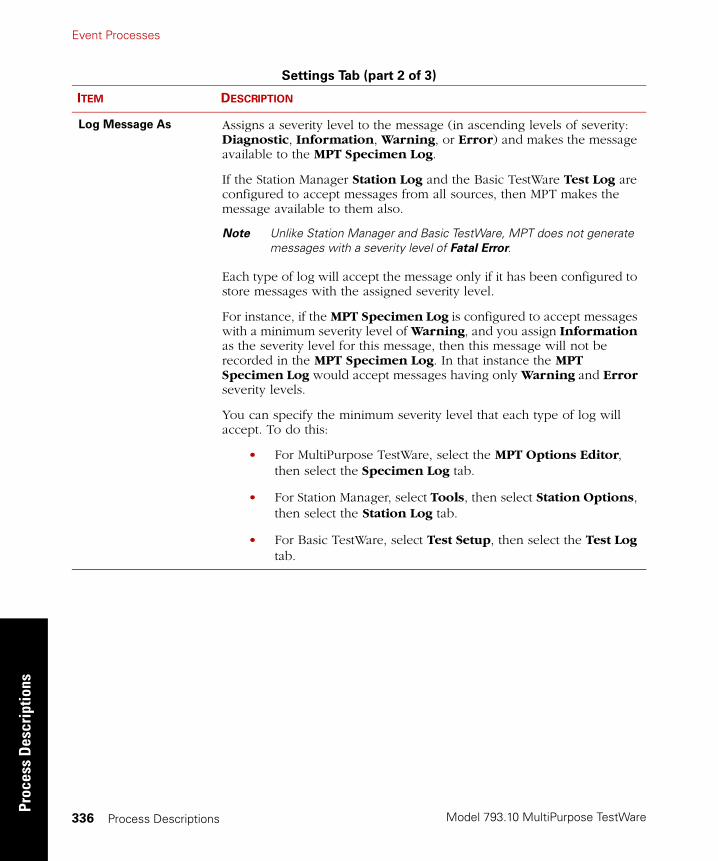
Model 793.10 MultiPurpose TestWare
Event ProcessesPr
oces
s D
escr
iptio
ns
Process Descriptions336
Log Message As Assigns a severity level to the message (in ascending levels of severity: Diagnostic, Information, Warning, or Error) and makes the message available to the MPT Specimen Log.
If the Station Manager Station Log and the Basic TestWare Test Log are configured to accept messages from all sources, then MPT makes the message available to them also.
Note Unlike Station Manager and Basic TestWare, MPT does not generate messages with a severity level of Fatal Error.
Each type of log will accept the message only if it has been configured to store messages with the assigned severity level.
For instance, if the MPT Specimen Log is configured to accept messages with a minimum severity level of Warning, and you assign Information as the severity level for this message, then this message will not be recorded in the MPT Specimen Log. In that instance the MPT Specimen Log would accept messages having only Warning and Error severity levels.
You can specify the minimum severity level that each type of log will accept. To do this:
• For MultiPurpose TestWare, select the MPT Options Editor, then select the Specimen Log tab.
• For Station Manager, select Tools, then select Station Options, then select the Station Log tab.
• For Basic TestWare, select Test Setup, then select the Test Log tab.
Settings Tab (part 2 of 3)
ITEM DESCRIPTION
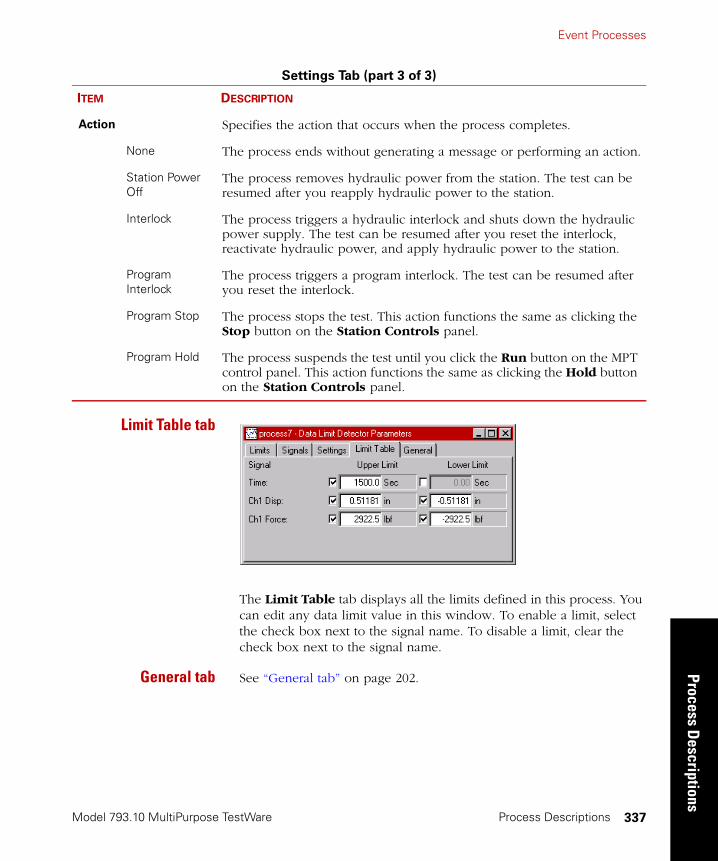
Event Processes
Model 793.10 MultiPurpose TestWare
Process Descriptions
Process Descriptions 337
Limit Table tab
The Limit Table tab displays all the limits defined in this process. You can edit any data limit value in this window. To enable a limit, select the check box next to the signal name. To disable a limit, clear the check box next to the signal name.
General tab See “General tab” on page 202.
Action Specifies the action that occurs when the process completes.
None The process ends without generating a message or performing an action.
Station Power Off
The process removes hydraulic power from the station. The test can be resumed after you reapply hydraulic power to the station.
Interlock The process triggers a hydraulic interlock and shuts down the hydraulic power supply. The test can be resumed after you reset the interlock, reactivate hydraulic power, and apply hydraulic power to the station.
Program Interlock
The process triggers a program interlock. The test can be resumed after you reset the interlock.
Program Stop The process stops the test. This action functions the same as clicking the Stop button on the Station Controls panel.
Program Hold The process suspends the test until you click the Run button on the MPT control panel. This action functions the same as clicking the Hold button on the Station Controls panel.
Settings Tab (part 3 of 3)
ITEM DESCRIPTION
Model 793.10 MultiPurpose TestWare
Event ProcessesPr
oces
s D
escr
iptio
ns
Process Descriptions338
How to Define a Data Limit Detector Process
1. Drag the icon from the Process Palette to your Procedure
table.
2. Double-click the process icon in your Procedure table.
3. Click the Signals tab.
4. Move all the signals you want to monitor to the Included list. Move all the others to the Available list.
5. Click the Limits tab.
6. For each signal you want to monitor:
A. In the Signal list, click the desired signal.
B. Set the units of measurement and enter a value for the Upper Limit and/or a Lower Limit.
Note If you want to disable an upper or lower limit, clear the Upper
Limit/Lower Limit check box.
7. Click the Settings tab.
8. Under Limit Mode, set the limit mode.
9. Under Process completes when, set when the process ends.
10. Optional—Enable (check) the Log Message As control and select the type of message you wish to generate.
11. Optional—Select an action.
12. Click the Limit Table tab.
13. Verify and, if needed, edit limit values on this tab.

Event Processes
Model 793.10 MultiPurpose TestWare
Process Descriptions
Process Descriptions 339
14. Click the General tab.
15. In the Name box, type a name for this process. (You can also name the process in the Procedure table.)
16. Select the Process Enabled check box. (If this box is cleared, the process will not execute.)
17. Optional—In the Counter Type list, click a counter type.
18. Optional—If you enabled a counter, type a Counter Label.
19. Close the parameters window, and set the desired Start and Interrupt signals for the process in the Procedure table.

Model 793.10 MultiPurpose TestWare
Event ProcessesPr
oces
s D
escr
iptio
ns
Process Descriptions340
Digital Input Detector
The Digital Input Detector process monitors digital input signals. When any (or all) of the monitored signals are received, the process ends and generates a done signal. The done signal from this process is used to trigger other processes.
When you define a Digital Input Detector process, you define the digital inputs you want to monitor, the required signal state, the trigger mode, how messages are logged, and what action, if any, you want the process to perform when it receives a monitored signal.
More About the Digital Input Detector Process
You must know what is connected to each digital input and what type of input is expected. See the Cabling chapter in the Controller Installation and Calibration manual for information about digital input connections.
Setting signal options With the Options list (on the Input Table tab), you can specify what input signal state is required to trigger the detector process.
The following states are supported:
ITEM DESCRIPTION
None Disables the input.
High/Low Detects transitions from a logic high state to a logic low state.
Low/High Detects transitions from a logic low state to a logic high state.
Either Detects any transition from high-to-low or low-to-high.
Channel Low Detects the logic low state.
Channel High Detects the logic high state.

Event Processes
Model 793.10 MultiPurpose TestWare
Process Descriptions
Process Descriptions 341
Design considerations If the signal is high when the process begins:
• The High/Low selection will cause the process to trigger when the signal becomes low.
• The Low/High selection will cause the process to trigger when the signal becomes low, then transitions to high.
• The Either selection will cause the process to trigger when the signal becomes low.
• The Channel Low selection will cause the process to trigger when the signal becomes low.
• The Channel High selection will cause the process to trigger immediately.
If the signal is low when the process begins:
• The High/Low selection will cause the process to trigger when the signal becomes high, then transitions to low.
• The Low/High selection will cause the process to trigger when the signal becomes high.
• The Either selection will cause the process to trigger when the signal becomes high.
• The Channel Low selection will cause the process to trigger immediately.
• The Channel High selection will cause the process to trigger when the signal becomes high.
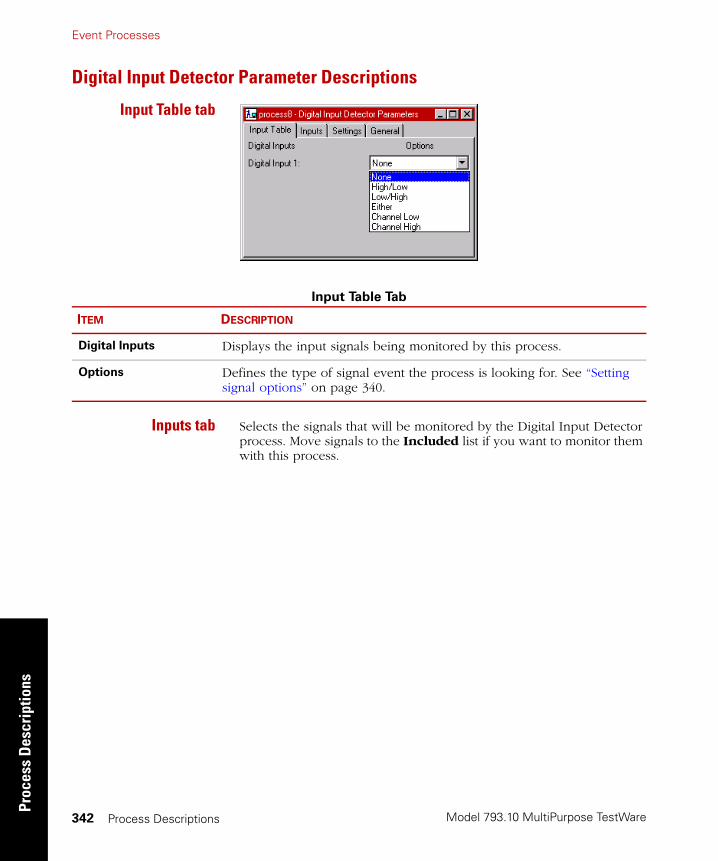
Model 793.10 MultiPurpose TestWare
Event ProcessesPr
oces
s D
escr
iptio
ns
Process Descriptions342
Digital Input Detector Parameter Descriptions
Input Table tab
Inputs tab Selects the signals that will be monitored by the Digital Input Detector process. Move signals to the Included list if you want to monitor them with this process.
Input Table Tab
ITEM DESCRIPTION
Digital Inputs Displays the input signals being monitored by this process.
Options Defines the type of signal event the process is looking for. See “Setting signal options” on page 340.
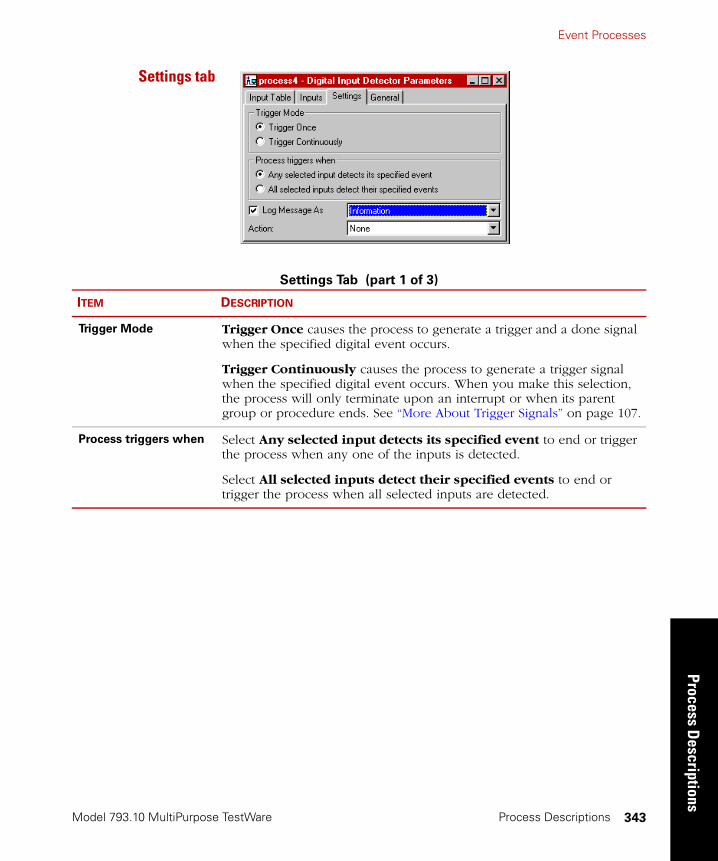
Event Processes
Model 793.10 MultiPurpose TestWare
Process Descriptions
Process Descriptions 343
Settings tab
Settings Tab (part 1 of 3)
ITEM DESCRIPTION
Trigger Mode Trigger Once causes the process to generate a trigger and a done signal when the specified digital event occurs.
Trigger Continuously causes the process to generate a trigger signal when the specified digital event occurs. When you make this selection, the process will only terminate upon an interrupt or when its parent group or procedure ends. See “More About Trigger Signals” on page 107.
Process triggers when Select Any selected input detects its specified event to end or trigger the process when any one of the inputs is detected.
Select All selected inputs detect their specified events to end or trigger the process when all selected inputs are detected.
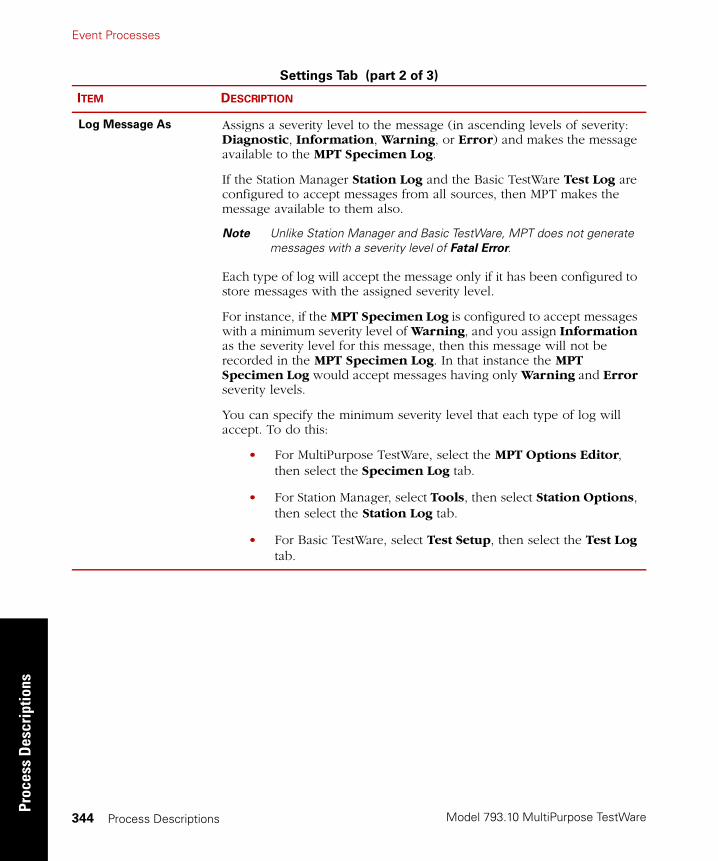
Model 793.10 MultiPurpose TestWare
Event ProcessesPr
oces
s D
escr
iptio
ns
Process Descriptions344
Log Message As Assigns a severity level to the message (in ascending levels of severity: Diagnostic, Information, Warning, or Error) and makes the message available to the MPT Specimen Log.
If the Station Manager Station Log and the Basic TestWare Test Log are configured to accept messages from all sources, then MPT makes the message available to them also.
Note Unlike Station Manager and Basic TestWare, MPT does not generate messages with a severity level of Fatal Error.
Each type of log will accept the message only if it has been configured to store messages with the assigned severity level.
For instance, if the MPT Specimen Log is configured to accept messages with a minimum severity level of Warning, and you assign Information as the severity level for this message, then this message will not be recorded in the MPT Specimen Log. In that instance the MPT Specimen Log would accept messages having only Warning and Error severity levels.
You can specify the minimum severity level that each type of log will accept. To do this:
• For MultiPurpose TestWare, select the MPT Options Editor, then select the Specimen Log tab.
• For Station Manager, select Tools, then select Station Options, then select the Station Log tab.
• For Basic TestWare, select Test Setup, then select the Test Log tab.
Settings Tab (part 2 of 3)
ITEM DESCRIPTION

Event Processes
Model 793.10 MultiPurpose TestWare
Process Descriptions
Process Descriptions 345
General tab See “General tab” on page 202.
Action Note For more information on Actions, see “Using actions with processes” on page 333
Specifies one of the following detector actions:
None The process ends without generating a message or performing an action.
Station Power Off
The process removes hydraulic power from the station. The test can be resumed after you reapply hydraulic power to the station.
Interlock The process triggers a hydraulic interlock and shuts down the hydraulic power supply. The test can be resumed after you reset the interlock, reactivate hydraulic power, and apply hydraulic power to the station.
Program Interlock
The process triggers a program interlock. The test can be resumed after you reset the interlock.
Program Stop The process stops the test. This action functions the same as clicking the Stop button on the Station Controls panel.
Program Hold The process suspends the test until you click the Run button on the Station Controls panel. This action functions the same as clicking the Hold button on the Station Controls panel.
Settings Tab (part 3 of 3)
ITEM DESCRIPTION

Model 793.10 MultiPurpose TestWare
Event ProcessesPr
oces
s D
escr
iptio
ns
Process Descriptions346
How to Define a Digital Input Detector Process
1. Drag the icon from the Process Palette to your Procedure
table.
2. Double-click the process icon in your Procedure table.
3. Click the Inputs tab.
4. Move all the signals you want to monitor to the Included list. Move all the others to the Available list.
5. Click the Input Table tab.
6. For each digital input signal listed, click the signal option in the Options list.
7. Click the Settings tab.
8. Under Trigger Mode, set the trigger mode.
9. Under Process triggers when, set when the process triggers.
10. Optional—Enable (check) the Log Message As control and select the type of message you wish to generate.
11. Optional—Select an action.
12. Click the General tab.
13. In the Name box, type a name for this process. (You can also name the process in the Procedure table.)

Event Processes
Model 793.10 MultiPurpose TestWare
Process Descriptions
Process Descriptions 347
14. Select the Process Enabled check box. (If this box is cleared, the process will not execute.)
15. In the Execute Process box, type number of times you want the process to execute.
Note Repeating the process will have no effect if you selected Trigger Continuously in step 8.
16. Optional—In the Counter Type list, click a counter type.
17. Optional—If you enabled a counter, type a Counter Label.
18. Close the parameters window, and set the desired Start and Interrupt signals for the process in the Procedure table.

Model 793.10 MultiPurpose TestWare
Event ProcessesPr
oces
s D
escr
iptio
ns
Process Descriptions348
Operator Event
The Operator Event process allows the operator to affect test progress through the use of custom buttons on a special control panel. It is useful for reminding the operator of particular test events or hazards.
Sample uses include:
• Prompting the operator before the test begins.
• Prompting the operator to perform an action before continuing the test.
• Triggering the beginning of a data acquisition process.
• Holding a test indefinitely.
When you define an Operator Event process, you must define the button ID, the button label, a message to the operator, the trigger mode, and how the event messages are logged.

Event Processes
Model 793.10 MultiPurpose TestWare
Process Descriptions
Process Descriptions 349
More About the Operator Event Process
The MPT control panel can display up to four operator event buttons and messages simultaneously. This means only four Operator Event processes can be active at any one time.
If your operator events will not run simultaneously, you can use the same button for multiple Operator Event processes. The button label and message will change to coincide with the next active Operator Event process.
Operator Eventexample
Suppose a portion of the test you are designing results in a noise hazard for the operator.
You could configure an Operator Event process (labeled Warning!) to hold the test just before the hazardous portion begins. This would give the operator time to acknowledge the warning and put on ear protection. Once the operator is ready, he or she could click the Warning! button to resume the test.
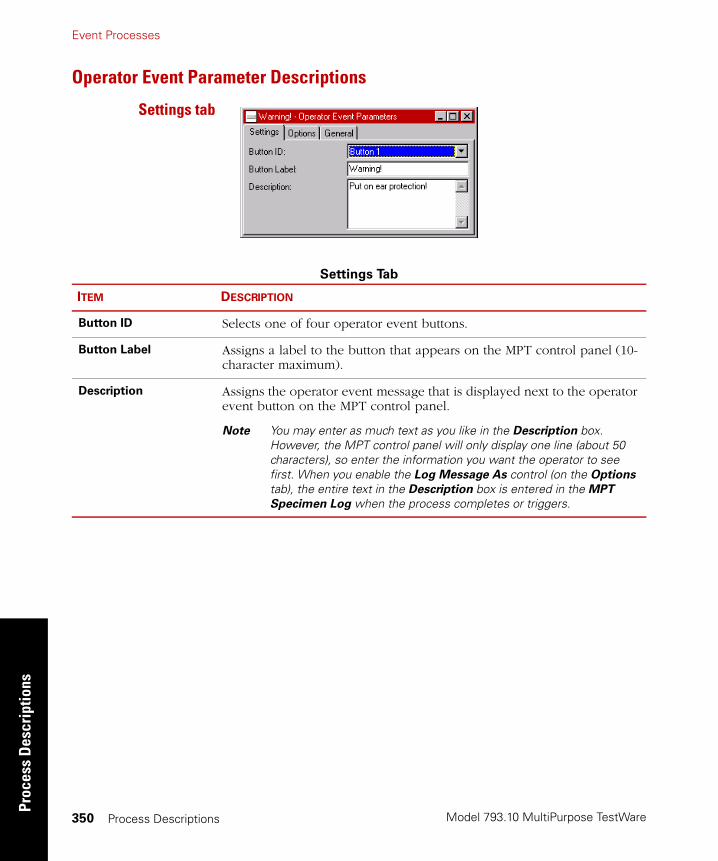
Model 793.10 MultiPurpose TestWare
Event ProcessesPr
oces
s D
escr
iptio
ns
Process Descriptions350
Operator Event Parameter Descriptions
Settings tab
Settings Tab
ITEM DESCRIPTION
Button ID Selects one of four operator event buttons.
Button Label Assigns a label to the button that appears on the MPT control panel (10-character maximum).
Description Assigns the operator event message that is displayed next to the operator event button on the MPT control panel.
Note You may enter as much text as you like in the Description box. However, the MPT control panel will only display one line (about 50 characters), so enter the information you want the operator to see first. When you enable the Log Message As control (on the Options tab), the entire text in the Description box is entered in the MPT
Specimen Log when the process completes or triggers.
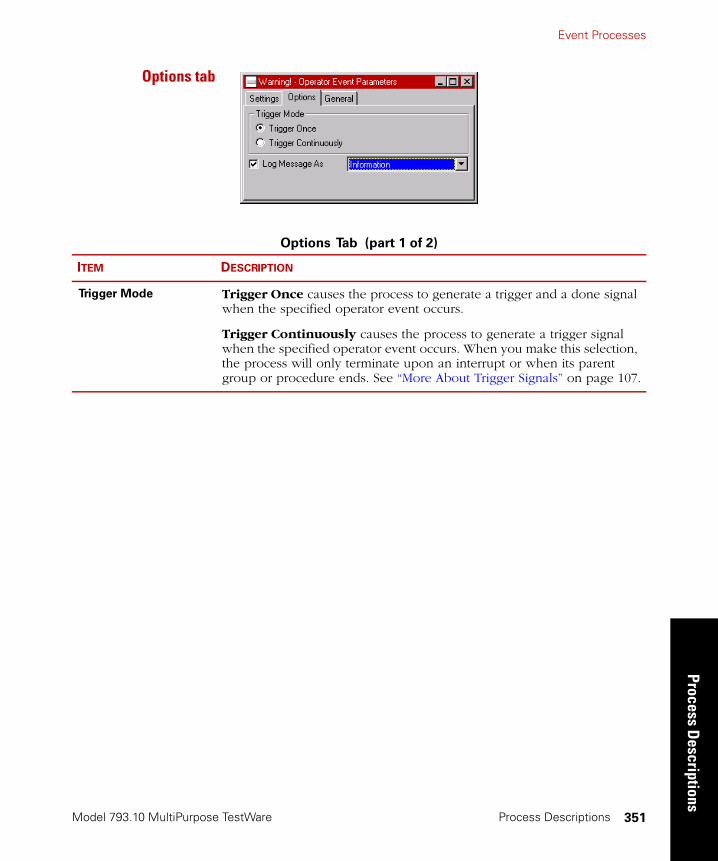
Event Processes
Model 793.10 MultiPurpose TestWare
Process Descriptions
Process Descriptions 351
Options tab
Options Tab (part 1 of 2)
ITEM DESCRIPTION
Trigger Mode Trigger Once causes the process to generate a trigger and a done signal when the specified operator event occurs.
Trigger Continuously causes the process to generate a trigger signal when the specified operator event occurs. When you make this selection, the process will only terminate upon an interrupt or when its parent group or procedure ends. See “More About Trigger Signals” on page 107.
Model 793.10 MultiPurpose TestWare
Event ProcessesPr
oces
s D
escr
iptio
ns
Process Descriptions352
General tab See “General tab” on page 202.
Log Message As Assigns a severity level to the message (in ascending levels of severity: Diagnostic, Information, Warning, or Error) and makes the message available to the MPT Specimen Log.
If the Station Manager Station Log and the Basic TestWare Test Log are configured to accept messages from all sources, then MPT makes the message available to them also.
Note Unlike Station Manager and Basic TestWare, MPT does not generate messages with a severity level of Fatal Error.
Each type of log will accept the message only if it has been configured to store messages with the assigned severity level.
For instance, if the MPT Specimen Log is configured to accept messages with a minimum severity level of Warning, and you assign Information as the severity level for this message, then this message will not be recorded in the MPT Specimen Log. In that instance the MPT Specimen Log would accept messages having only Warning and Error severity levels.
You can specify the minimum severity level that each type of log will accept. To do this:
• For MultiPurpose TestWare, select the MPT Options Editor, then select the Specimen Log tab.
• For Station Manager, select Tools, then select Station Options, then select the Station Log tab.
• For Basic TestWare, select Test Setup, then select the Test Log tab.
Options Tab (part 2 of 2)
ITEM DESCRIPTION
Event Processes
Model 793.10 MultiPurpose TestWare
Process Descriptions
Process Descriptions 353
How to Define an Operator Event Process
1. Drag the icon from the Process Palette to your Procedure
table.
2. Double-click the process icon in your Procedure table.
3. Click the Settings tab.
4. In the Button ID list, click the button you want to use.
5. In the Button Label box, type in the button label that appears on the MPT control panel.
6. In the Description box, enter the message you want to display on the MPT control panel when this process completes or triggers.
7. Click the Options tab.
8. Under Trigger Mode, set the trigger mode.
9. Optional—Enable (check) the Log Message As control and select the type of message you wish to generate.
10. Click the General tab.
11. In the Name box, type a name for this process. (You can also name the process in the Procedure table.)
12. Select the Process Enabled check box. (If this box is cleared, the process will not execute.)
13. In the Execute Process box, type number of times you want the process to execute.
Note Repeating the process will have no effect if you selected Trigger Continuously in step 8.
14. Optional—In the Counter Type list, click a counter type.
15. Optional—If you enabled a counter, type a Counter Label.
16. Close the parameters window, and set the desired Start and Interrupt signals for the process in the Procedure table.
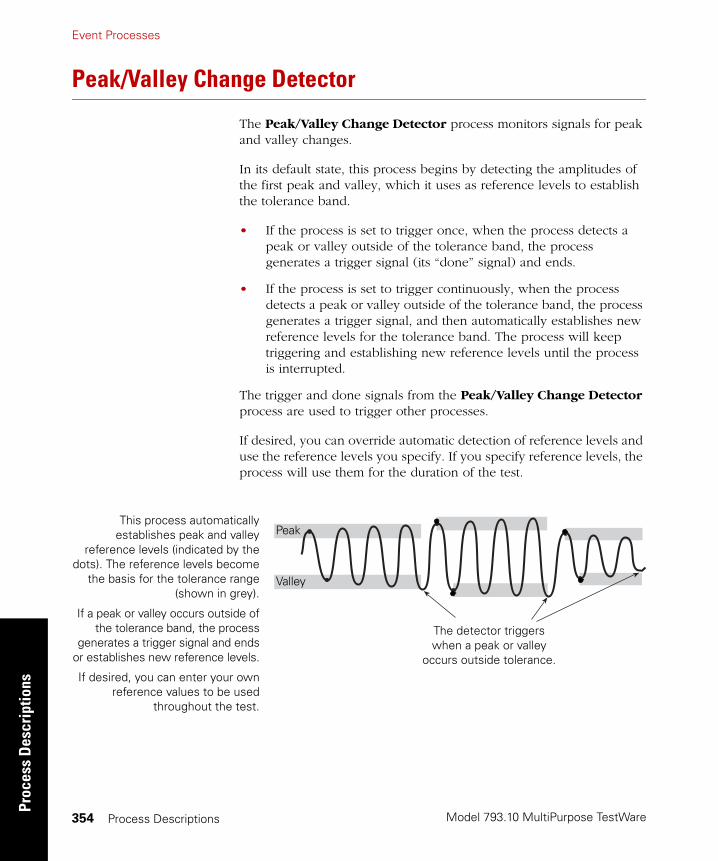
Model 793.10 MultiPurpose TestWare
Event ProcessesPr
oces
s D
escr
iptio
ns
Process Descriptions354
Peak/Valley Change Detector
The Peak/Valley Change Detector process monitors signals for peak and valley changes.
In its default state, this process begins by detecting the amplitudes of the first peak and valley, which it uses as reference levels to establish the tolerance band.
• If the process is set to trigger once, when the process detects a peak or valley outside of the tolerance band, the process generates a trigger signal (its “done” signal) and ends.
• If the process is set to trigger continuously, when the process detects a peak or valley outside of the tolerance band, the process generates a trigger signal, and then automatically establishes new reference levels for the tolerance band. The process will keep triggering and establishing new reference levels until the process is interrupted.
The trigger and done signals from the Peak/Valley Change Detector process are used to trigger other processes.
If desired, you can override automatic detection of reference levels and use the reference levels you specify. If you specify reference levels, the process will use them for the duration of the test.
Peak
Valley
The detector triggers when a peak or valley
occurs outside tolerance.
This process automaticallyestablishes peak and valley
reference levels (indicated by thedots). The reference levels become
the basis for the tolerance range(shown in grey).
If a peak or valley occurs outside ofthe tolerance band, the process
generates a trigger signal and endsor establishes new reference levels.
If desired, you can enter your ownreference values to be used
throughout the test.
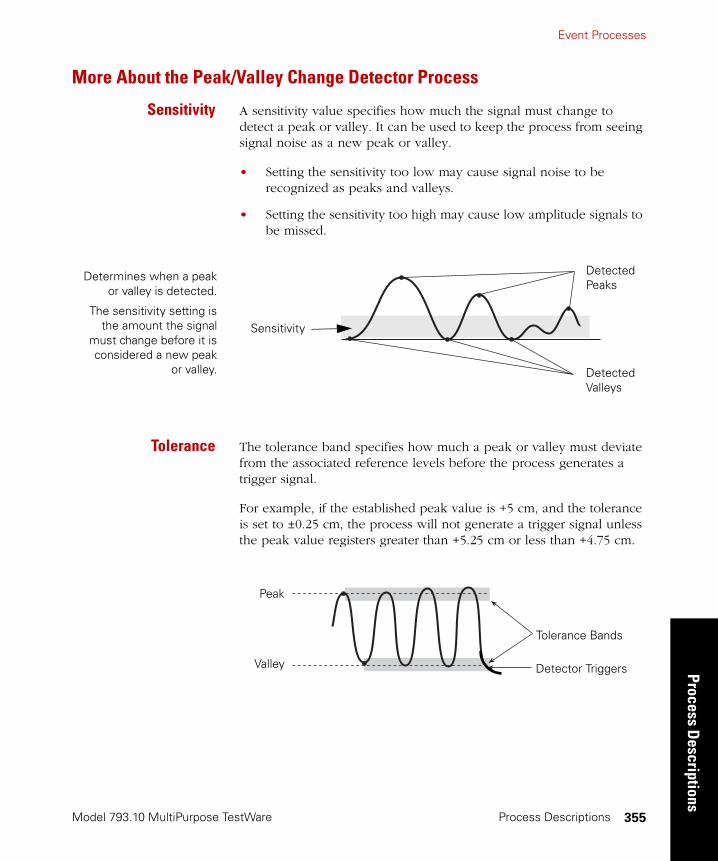
Event Processes
Model 793.10 MultiPurpose TestWare
Process Descriptions
Process Descriptions 355
More About the Peak/Valley Change Detector Process
Sensitivity A sensitivity value specifies how much the signal must change to detect a peak or valley. It can be used to keep the process from seeing signal noise as a new peak or valley.
• Setting the sensitivity too low may cause signal noise to be recognized as peaks and valleys.
• Setting the sensitivity too high may cause low amplitude signals to be missed.
Tolerance The tolerance band specifies how much a peak or valley must deviate from the associated reference levels before the process generates a trigger signal.
For example, if the established peak value is +5 cm, and the tolerance is set to ±0.25 cm, the process will not generate a trigger signal unless the peak value registers greater than +5.25 cm or less than +4.75 cm.
Determines when a peakor valley is detected.
The sensitivity setting isthe amount the signal
must change before it isconsidered a new peak
or valley.
Detected Peaks
Detected Valleys
Sensitivity
Peak
Valley
Tolerance Bands
Detector Triggers

Model 793.10 MultiPurpose TestWare
Event ProcessesPr
oces
s D
escr
iptio
ns
Process Descriptions356
Enable after On the Options tab, you can use the Enable After command to specify how many feedback cycles will occur before the process begins to monitor the selected signal. This allows the signal to “settle-in” or stabilize before it is monitored.
If you select a channel for the Channel Reference on the Command tab, the process will begin counting cycles after the tapering is complete.
For example, if you specify 6 cycles, and the waveform begins with a taper that includes 2 cycles, the process will begin monitoring peaks and valleys on cycle 9.
If you do not use Channel Reference, the process will begin counting cycles immediately after the number of cycles you specify. For instance, if you specify 6 cycles, and the waveform begins with a taper that includes 2 cycles, the process will begin monitoring for peaks and valleys on cycle 7.
In either case, if you press stop and then run on the Station Controls panel, the process will begin the count over.
Reference values On the Options tab, if you select Default under Reference Values, the first peak and valley detected by the process become the reference levels for the tolerance band.
Note The process will not generate a trigger signal based on the first peak or valley.
On the Options tab, if you select User-specified under Reference Values, you enter the upper and lower level values for the tolerance band. This is a useful feature if it is possible that the first peak and valley used to establish the reference values could be unusually large or otherwise irregular. With User-specified reference values, the controller uses your preset reference values and compares them with the very first peak or valley, (at the start of the process or after the process resets itself after issuing a trigger). Because of this, in the Trigger Continuously mode, the process may generate more triggers if you use user-specified reference values than if you use default reference values.
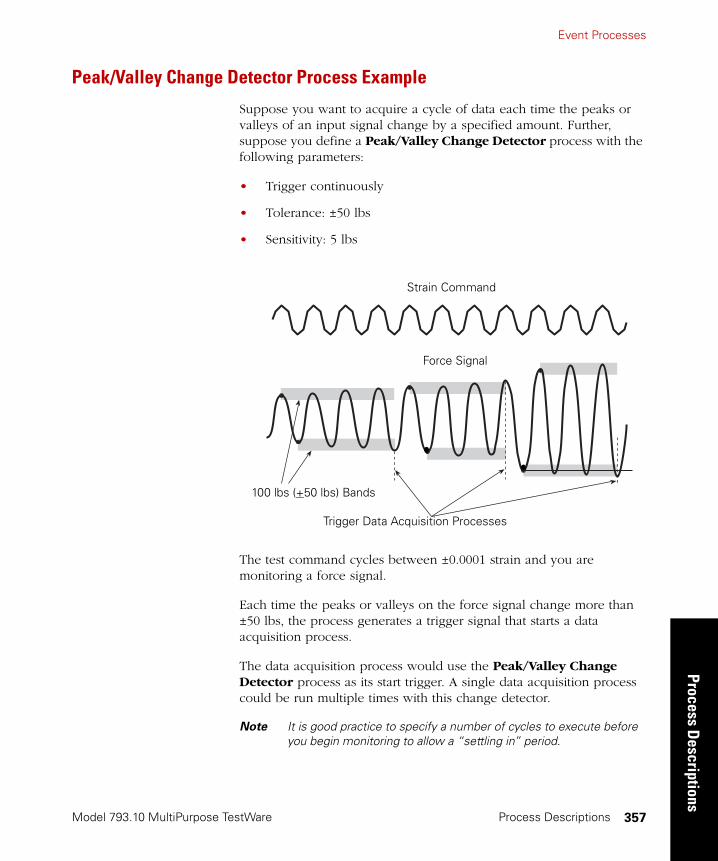
Event Processes
Model 793.10 MultiPurpose TestWare
Process Descriptions
Process Descriptions 357
Peak/Valley Change Detector Process Example
Suppose you want to acquire a cycle of data each time the peaks or valleys of an input signal change by a specified amount. Further, suppose you define a Peak/Valley Change Detector process with the following parameters:
• Trigger continuously
• Tolerance: ±50 lbs
• Sensitivity: 5 lbs
The test command cycles between ±0.0001 strain and you are monitoring a force signal.
Each time the peaks or valleys on the force signal change more than ±50 lbs, the process generates a trigger signal that starts a data acquisition process.
The data acquisition process would use the Peak/Valley Change Detector process as its start trigger. A single data acquisition process could be run multiple times with this change detector.
Note It is good practice to specify a number of cycles to execute before you begin monitoring to allow a “settling in” period.
Strain Command
100 lbs (+50 lbs) Bands
Trigger Data Acquisition Processes
Force Signal
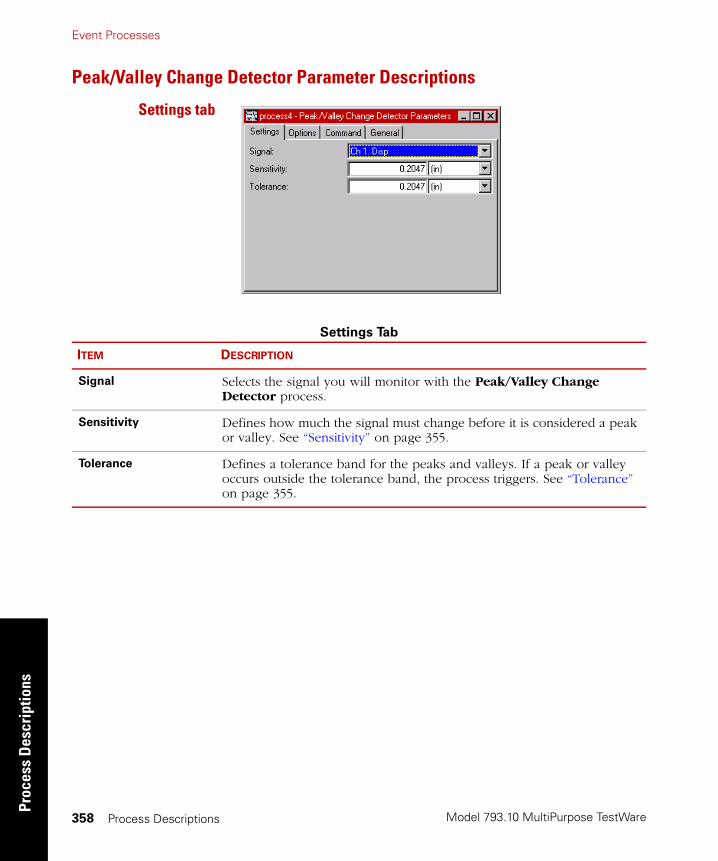
Model 793.10 MultiPurpose TestWare
Event ProcessesPr
oces
s D
escr
iptio
ns
Process Descriptions358
Peak/Valley Change Detector Parameter Descriptions
Settings tab
Settings Tab
ITEM DESCRIPTION
Signal Selects the signal you will monitor with the Peak/Valley Change Detector process.
Sensitivity Defines how much the signal must change before it is considered a peak or valley. See “Sensitivity” on page 355.
Tolerance Defines a tolerance band for the peaks and valleys. If a peak or valley occurs outside the tolerance band, the process triggers. See “Tolerance” on page 355.
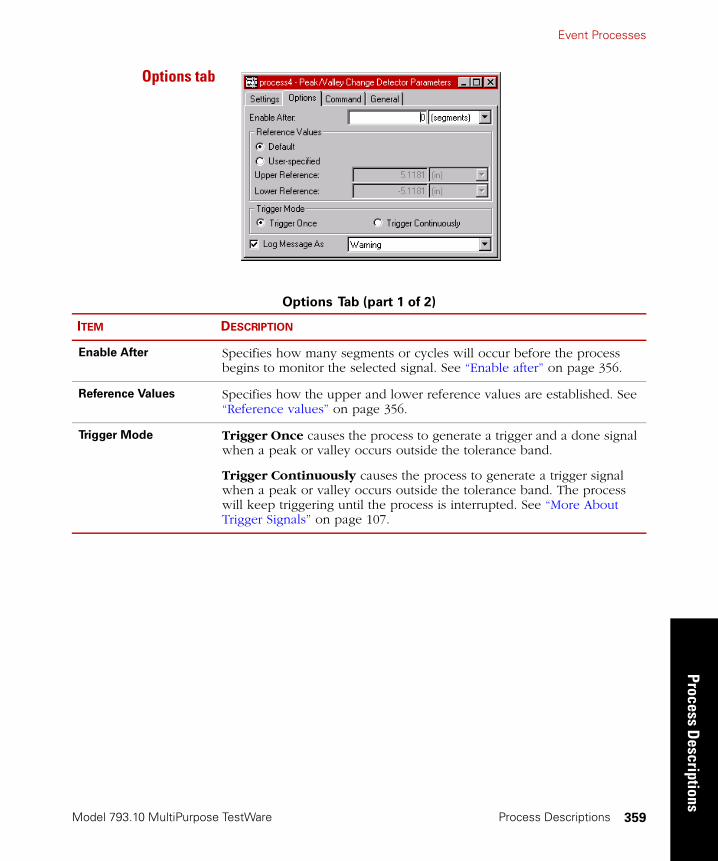
Event Processes
Model 793.10 MultiPurpose TestWare
Process Descriptions
Process Descriptions 359
Options tab
Options Tab (part 1 of 2)
ITEM DESCRIPTION
Enable After Specifies how many segments or cycles will occur before the process begins to monitor the selected signal. See “Enable after” on page 356.
Reference Values Specifies how the upper and lower reference values are established. See “Reference values” on page 356.
Trigger Mode Trigger Once causes the process to generate a trigger and a done signal when a peak or valley occurs outside the tolerance band.
Trigger Continuously causes the process to generate a trigger signal when a peak or valley occurs outside the tolerance band. The process will keep triggering until the process is interrupted. See “More About Trigger Signals” on page 107.

Model 793.10 MultiPurpose TestWare
Event ProcessesPr
oces
s D
escr
iptio
ns
Process Descriptions360
Log Message As Assigns a severity level to the message (in ascending levels of severity: Diagnostic, Information, Warning, or Error) and makes the message available to the MPT Specimen Log.
If the Station Manager Station Log and the Basic TestWare Test Log are configured to accept messages from all sources, then MPT makes the message available to them also.
Note Unlike Station Manager and Basic TestWare, MPT does not generate messages with a severity level of Fatal Error.
Each type of log will accept the message only if it has been configured to store messages with the assigned severity level.
For instance, if the MPT Specimen Log is configured to accept messages with a minimum severity level of Warning, and you assign Information as the severity level for this message, then this message will not be recorded in the MPT Specimen Log. In that instance the MPT Specimen Log would accept messages having only Warning and Error severity levels.
You can specify the minimum severity level that each type of log will accept. To do this:
• For MultiPurpose TestWare, select the MPT Options Editor, then select the Specimen Log tab.
• For Station Manager, select Tools, then select Station Options, then select the Station Log tab.
• For Basic TestWare, select Test Setup, then select the Test Log tab.
Options Tab (part 2 of 2)
ITEM DESCRIPTION
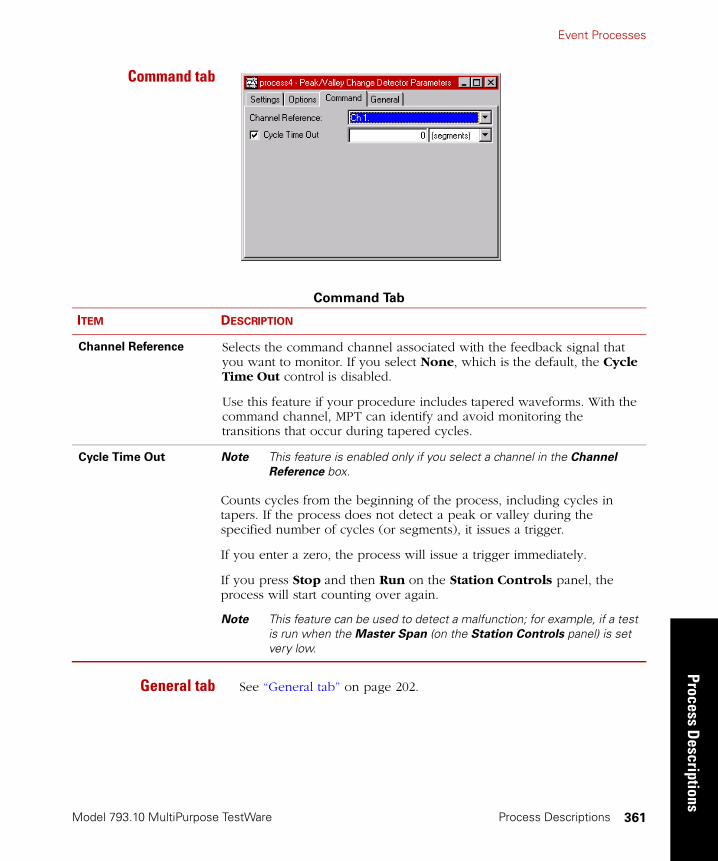
Event Processes
Model 793.10 MultiPurpose TestWare
Process Descriptions
Process Descriptions 361
Command tab
General tab See “General tab” on page 202.
Command Tab
ITEM DESCRIPTION
Channel Reference Selects the command channel associated with the feedback signal that you want to monitor. If you select None, which is the default, the Cycle Time Out control is disabled.
Use this feature if your procedure includes tapered waveforms. With the command channel, MPT can identify and avoid monitoring the transitions that occur during tapered cycles.
Cycle Time Out Note This feature is enabled only if you select a channel in the Channel
Reference box.
Counts cycles from the beginning of the process, including cycles in tapers. If the process does not detect a peak or valley during the specified number of cycles (or segments), it issues a trigger.
If you enter a zero, the process will issue a trigger immediately.
If you press Stop and then Run on the Station Controls panel, the process will start counting over again.
Note This feature can be used to detect a malfunction; for example, if a test is run when the Master Span (on the Station Controls panel) is set very low.

Model 793.10 MultiPurpose TestWare
Event ProcessesPr
oces
s D
escr
iptio
ns
Process Descriptions362
How to Define a Peak/Valley Change Detector Process
1. Drag the icon from the Process Palette to your Procedure
table.
2. Double-click the process icon in your Procedure table.
3. Click the Settings tab.
4. In the Signal list, click the signal you want to monitor.
5. In the Sensitivity box, set the units, and then enter a value.
6. In the Tolerance box, set the units, and then enter a value.
7. Click the Options tab.
8. Optional—If you want to delay the Peak/Valley monitoring process for a number of cycles to allow for a “settling in” period, enter a value in the Enable After box.
9. Under Reference Values, select Default or User-specified.
If you select User-specified Reference Values, enter the desired Upper and Lower Reference Level values.
10. Under Trigger Mode, set the trigger mode.
11. Optional—Enable (check) the Log Message As control and select the type of message you wish to generate.
12. Optional—Click the Command tab, click a Channel Reference signal and enter a Cycle Time Out value.
Event Processes
Model 793.10 MultiPurpose TestWare
Process Descriptions
Process Descriptions 363
13. Click the General tab.
14. In the Name box, type a name for this process. (You can also name the process in the Procedure table.)
15. Select the Process Enabled check box. (If this box is cleared, the process will not execute.)
16. In the Execute Process box, type number of times you want the process to execute.
Note Repeating the process will have no effect if you selected Trigger Continuously in step 10.
17. Optional—In the Counter Type list, click a counter type.
18. Optional—If you enabled a counter, type a Counter Label.
19. Close the parameters window, and set the desired Start and Interrupt signals for the process in the Procedure table.

Model 793.10 MultiPurpose TestWare
Event ProcessesPr
oces
s D
escr
iptio
ns
Process Descriptions364
Program Event
The Program Event process is typically used to trigger other processes in response to a change in the test state.
There are seven test states that can generate a trigger and/or done signal in the Program Event process:
• Running—the state in which the procedure is controlling the machine and playing out a waveform.
• Entering Hold—the transition state between Running and Holding.
• Holding—the state in which the test is suspended (the actuator is not moving), but the test can be continued by clicking the Run button.
Note This process sees a “paused” state in the same way that it sees a Holding state. That is, as the run indicator on the Station Controls panel blinks while “paused,” this process will see the following sequence of transitions: Running>Entering Hold>Holding>Exiting Hold>Running.
• Exiting Hold—the transition state between Holding and Running. It will typically complement what is done in the Entering Hold state.
• Entering Stopped—the transition state between Running/Holding and Stopped.
• Stopped—the Stopped state. Once in this state, the actuators are fully stopped. If appropriate, the test can be continued by clicking the Run button, but it will not start up by itself.
Note The only MPT command process that will execute during a Stopped state is the Digital Output process.
• Exiting Stopped—the transition state between Stopped and Running. It typically complements what is done in the Entering Stopped state.
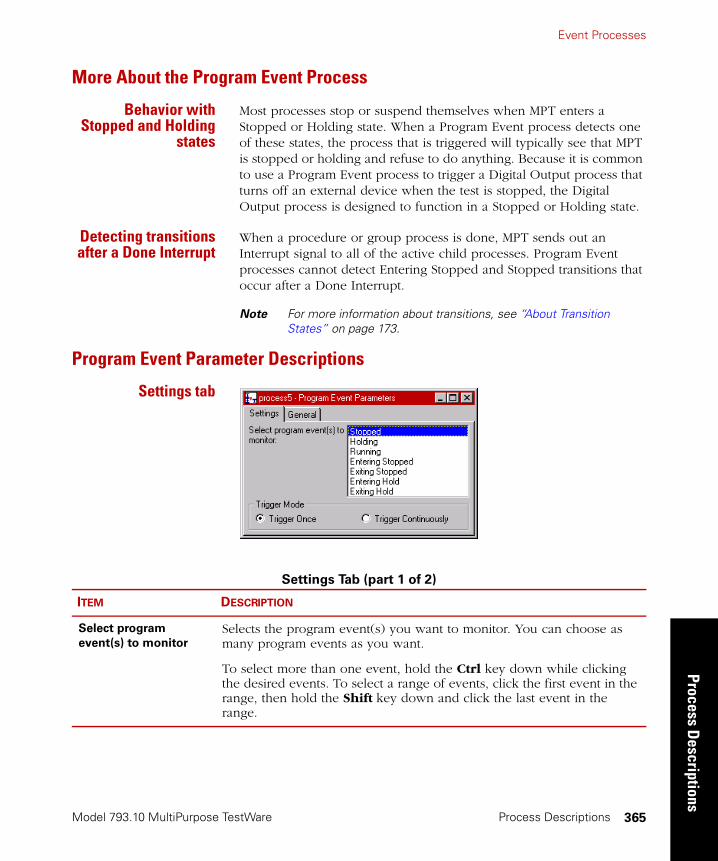
Event Processes
Model 793.10 MultiPurpose TestWare
Process Descriptions
Process Descriptions 365
More About the Program Event Process
Behavior withStopped and Holding
states
Most processes stop or suspend themselves when MPT enters a Stopped or Holding state. When a Program Event process detects one of these states, the process that is triggered will typically see that MPT is stopped or holding and refuse to do anything. Because it is common to use a Program Event process to trigger a Digital Output process that turns off an external device when the test is stopped, the Digital Output process is designed to function in a Stopped or Holding state.
Detecting transitionsafter a Done Interrupt
When a procedure or group process is done, MPT sends out an Interrupt signal to all of the active child processes. Program Event processes cannot detect Entering Stopped and Stopped transitions that occur after a Done Interrupt.
Note For more information about transitions, see “About Transition States” on page 173.
Program Event Parameter Descriptions
Settings tab
Settings Tab (part 1 of 2)
ITEM DESCRIPTION
Select program
event(s) to monitor
Selects the program event(s) you want to monitor. You can choose as many program events as you want.
To select more than one event, hold the Ctrl key down while clicking the desired events. To select a range of events, click the first event in the range, then hold the Shift key down and click the last event in the range.
Model 793.10 MultiPurpose TestWare
Event ProcessesPr
oces
s D
escr
iptio
ns
Process Descriptions366
General tab See “General tab” on page 202.
How to Define a Program Event Process
1. Drag the icon from the Process Palette to your Procedure
table.
2. Double-click the process icon in your Procedure table.
3. Click the Settings tab.
4. Hold the Ctrl key and click the program events you want to monitor.
5. Under Trigger Mode, set the trigger mode.
6. Click the General tab.
7. In the Name box, type a name for this process. (You can also name the process in the Procedure table.)
8. Select the Process Enabled check box. (If this box is cleared, the process will not execute.)
9. In the Execute Process box, type number of times you want the process to execute.
Note Repeating the process will have no effect if you selected Trigger Continuously in step 5.
10. Optional—In the Counter Type list, click a counter type.
11. Optional—If you enabled a counter, type a Counter Label.
12. Close the parameters window, and set the desired Start and Interrupt signals for the process in the Procedure table.
Trigger Mode Trigger Once causes the process to generate a trigger and a done signal when a program event occurs.
Trigger Continuously causes the process to generate a trigger signal when a program event occurs. The process will keep triggering on program events until the process is interrupted. See “More About Trigger Signals” on page 107.
Settings Tab (part 2 of 2)
ITEM DESCRIPTION
Event Processes
Model 793.10 MultiPurpose TestWare
Process Descriptions
Process Descriptions 367
Periodic Time Event
With the Periodic Time Event process, you can schedule arbitrary and repetitive times at which the process will produce a trigger, or a series of triggers. You can use these time based triggers to invoke an event, such as triggering another process, actuating an external device, etc.
When you define a Periodic Time Event process, you can specify periodic trigger times, the trigger mode, and whether or not the process writes a message to the message log when it invokes a trigger event.
Note To produce a trigger the Periodic Time Event process must be active at the time you wish the trigger event to occur, so it is important to keep that in mind when designing your test.
Periodic Time Eventexample
Suppose you need to start warming up a temperature chamber before a technician arrives at your facility, so that it has achieved and stabilized at the desired temperature by the time the technician begins testing. Further, suppose the technician is scheduled to perform tests at 8:00AM on Mondays, Wednesdays, and Thursdays beginning in March and continuing through May.
In this case you could use a Periodic Time Event process to trigger a Temperature Control process hours before the technician arrives on the days and in the months testing is scheduled.
Model 793.10 MultiPurpose TestWare
Event ProcessesPr
oces
s D
escr
iptio
ns
Process Descriptions368
Periodic Time Event Parameter Descriptions
Settings tab Double-click the process icon to open the process parameters window. Click each tab to access a different set of process parameters.
You may type in entries in any of the entry boxes or choose from the selection list. To display the selection list of an entry box, double-click on the box, or position the cursor in the edit field of the desired box and press the up or down arrow keys.
Each box may be empty (meaning any value), may contain a single value, or may contain a list of values separated by commas. Each value may be a single value or a range of values (two separate values joined by a dash). For example: 1-3, 5, 7, 8-13, 19 means 1 through 3, or 5, or 7, or 8 through 13, or 19.
While running or holding, the process checks the time (clock and calendar time) at which it begins and then periodically at one-minute intervals.

Event Processes
Model 793.10 MultiPurpose TestWare
Process Descriptions
Process Descriptions 369
The process triggers when the current time matches the schedule criteria. For example, in the window shown below, the process will trigger Monday through Sunday (everyday) of every month at 12:07 AM.
Settings Tab
ITEM DESCRIPTION
Minute Accepts values from 0 to 59.
Hour Contains selections displayed in 12 or 24 hour format based on the regional settings of the operating system. Accepts value entries in either the 12 or 24 hour format.
Day of Week Contains selections displayed according to the regional settings of the operating system. Accepts entries in English or local language.
Day of Month Accepts values from 1 to 31.
Month of Year Contains selections displayed according to the regional settings of the operating system. Accepts entries in English or local language.

Model 793.10 MultiPurpose TestWare
Event ProcessesPr
oces
s D
escr
iptio
ns
Process Descriptions370
Options tab
Options Tab (part 1 of 2)
ITEM DESCRIPTION
Trigger Mode Trigger Once causes the process to generate a trigger and a done signal when the specified event occurs.
Trigger Continuously causes the process to generate a trigger signal when the specified event occurs. When you make this selection, the process will only terminate upon an interrupt or when its parent group or procedure ends. See “More About Trigger Signals” on page 107.
Trigger For Duration is the same as the Trigger Continuously control except you can specify the duration of time the process remains active. When selected, the End After control is enabled, which allows you to specify the time that the process will end in relation to when it invoked its first trigger.
Event Processes
Model 793.10 MultiPurpose TestWare
Process Descriptions
Process Descriptions 371
General tab See “General tab” on page 202.
Log Message As Assigns a severity level to the message (in ascending levels of severity: Diagnostic, Information, Warning, or Error) and makes the message available to the MPT Specimen Log.
If the Station Manager Station Log and the Basic TestWare Test Log are configured to accept messages from all sources, then MPT makes the message available to them also.
Note Unlike Station Manager and Basic TestWare, MPT does not generate messages with a severity level of Fatal Error.
Each type of log will accept the message only if it has been configured to store messages with the assigned severity level.
For instance, if the MPT Specimen Log is configured to accept messages with a minimum severity level of Warning, and you assign Information as the severity level for this message, then this message will not be recorded in the MPT Specimen Log. In that instance the MPT Specimen Log would accept messages having only Warning and Error severity levels.
You can specify the minimum severity level that each type of log will accept. To do this:
• For MultiPurpose TestWare, select the MPT Options Editor, then select the Specimen Log tab.
• For Station Manager, select Tools, then select Station Options, then select the Station Log tab.
• For Basic TestWare, select Test Setup, then select the Test Log tab.
Options Tab (part 2 of 2)
ITEM DESCRIPTION

Model 793.10 MultiPurpose TestWare
Event ProcessesPr
oces
s D
escr
iptio
ns
Process Descriptions372
How to Define a Periodic Time Event Process
1. Drag the icon from the Process Palette to your Procedure
table.
2. Double-click the process icon in your Procedure table.
3. Click the Settings tab.
Note Double-clicking an entry box displays its selection list.
4. Enter or select desired values in the Minute, Hour, Day of Week, Day of Month, and Month of Year entry boxes.
5. Click the Options tab.
6. Under Trigger Mode, set the trigger mode.
7. Optional—Enable (check) the Log Message As control and select the type of message you wish to generate.
8. Click the General tab.
9. In the Name box, type a name for this process. (You can also name the process in the Procedure table.)
10. Select the Process Enabled check box. (If this box is cleared, the process will not execute.)
11. In the Execute Process box, type number of times you want the process to execute.
Note Repeating the process will have no effect if you selected Trigger Continuously in step 6.
12. Optional—In the Counter Type list, click a counter type.
13. Optional—If you enabled a counter, type a Counter Label.
14. Close the parameters window, and set the desired Start and Interrupt signals for the process in the Procedure table.
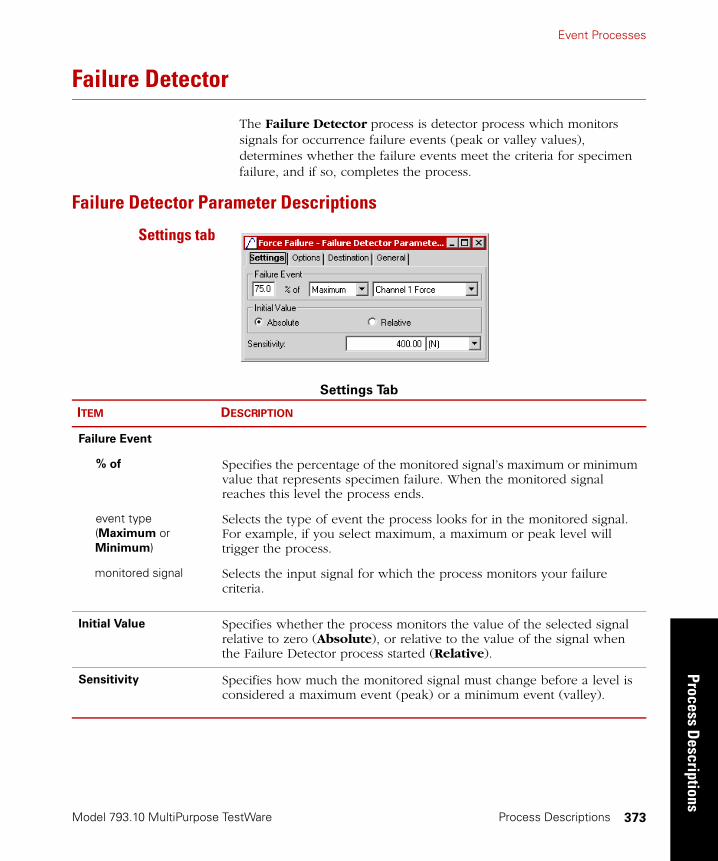
Event Processes
Model 793.10 MultiPurpose TestWare
Process Descriptions
Process Descriptions 373
Failure Detector
The Failure Detector process is detector process which monitors signals for occurrence failure events (peak or valley values), determines whether the failure events meet the criteria for specimen failure, and if so, completes the process.
Failure Detector Parameter Descriptions
Settings tab
Settings Tab
ITEM DESCRIPTION
Failure Event
% of
event type
(Maximum or Minimum)
monitored signal
Specifies the percentage of the monitored signal’s maximum or minimum value that represents specimen failure. When the monitored signal reaches this level the process ends.
Selects the type of event the process looks for in the monitored signal. For example, if you select maximum, a maximum or peak level will trigger the process.
Selects the input signal for which the process monitors your failure criteria.
Initial Value Specifies whether the process monitors the value of the selected signal relative to zero (Absolute), or relative to the value of the signal when the Failure Detector process started (Relative).
Sensitivity Specifies how much the monitored signal must change before a level is considered a maximum event (peak) or a minimum event (valley).

Model 793.10 MultiPurpose TestWare
Event ProcessesPr
oces
s D
escr
iptio
ns
Process Descriptions374
Options tab
Options Tab (part 1 of 2)
ITEM DESCRIPTION
Log Message As Assigns a severity level to the message (in ascending levels of severity: Diagnostic, Information, Warning, or Error) and makes the message available to the MPT Specimen Log.
If the Station Manager Station Log and the Basic TestWare Test Log are configured to accept messages from all sources, then MPT makes the message available to them also.
Note Unlike Station Manager and Basic TestWare, MPT does not generate messages with a severity level of Fatal Error.
Each type of log will accept the message only if it has been configured to store messages with the assigned severity level.
For instance, if the MPT Specimen Log is configured to accept messages with a minimum severity level of Warning, and you assign Information as the severity level for this message, then this message will not be recorded in the MPT Specimen Log. In that instance the MPT Specimen Log would accept messages having only Warning and Error severity levels.
You can specify the minimum severity level that each type of log will accept. To do this:
• For MultiPurpose TestWare, select the MPT Options Editor, then select the Specimen Log tab.
• For Station Manager, select Tools, then select Station Options, then select the Station Log tab.
• For Basic TestWare, select Test Setup, then select the Test Log tab.
Event Processes
Model 793.10 MultiPurpose TestWare
Process Descriptions
Process Descriptions 375
Destination tab See “Data destination” on page 268.
General tab See “General tab” on page 202.
Action Specifies the action that occurs when the process completes.
None The process ends without generating a message or performing an action.
Station Power Off
The process removes hydraulic power from the station. The test can be resumed after you reapply hydraulic power to the station.
Interlock The process triggers a hydraulic interlock and shuts down the hydraulic power supply. The test can be resumed after you reset the interlock, reactivate hydraulic power, and apply hydraulic power to the station.
Program Interlock
The process triggers a program interlock. The test can be resumed after you reset the interlock.
Program Stop The process stops the test. This action functions the same as clicking the Stop button on the Station Controls panel.
Program Hold The process suspends the test until you click the Run button on the MPT control panel. This action functions the same as clicking the Hold button on the Station Controls panel.
Options Tab (part 2 of 2)
ITEM DESCRIPTION
Model 793.10 MultiPurpose TestWare
Event ProcessesPr
oces
s D
escr
iptio
ns
Process Descriptions376
How to Define a Failure Detector Process
1. Drag the icon from the Process Palette to your Procedure
table.
2. Double-click the process icon in your Procedure table.
3. Click the Settings tab.
4. Define your desired specimen failure criteria with the Failure Event, Initial Settings, and Sensitivity controls.
5. Click the Options tab.
6. Optional—Enable (check) the Log Message As control and select the type of message you wish to generate.
7. Optional—Select the desired action you wish to occur if the specimen condition matches your failure criteria and the process completes.
8. Click the Destination tab.
9. In the Destination list, click the destination for the acquired data. (If you click User-specified data file, enter a file name in the User Data File box.) See “Data destination” on page 268.
10. Type a description of the data file in the Data Header box.
11. Click the General tab.
12. In the Name box, type a name for this process. (You can also name the process in the Procedure table.)

Event Processes
Model 793.10 MultiPurpose TestWare
Process Descriptions
Process Descriptions 377
13. Select the Process Enabled check box. (If this box is cleared, the process will not execute.)
14. In the Execute Process box, type number of times you want the process to execute.
15. Optional—In the Counter Type list, click a counter type.
16. Optional—If you enabled a counter, type a Counter Label.
17. Close the parameters window, and set the desired Start and Interrupt signals for the process in the Procedure table.
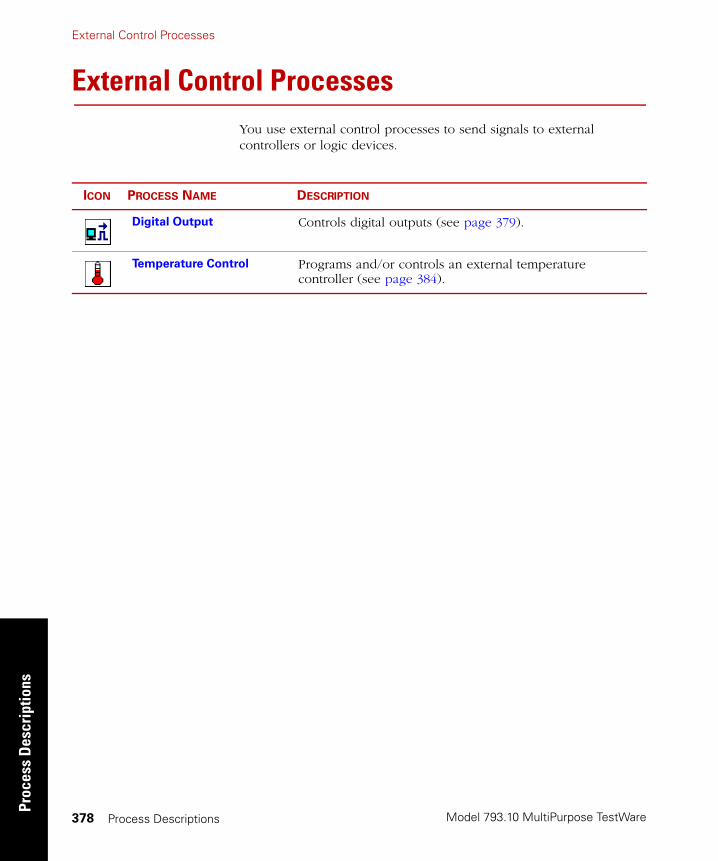
Model 793.10 MultiPurpose TestWare
External Control ProcessesPr
oces
s D
escr
iptio
ns
Process Descriptions378
External Control ProcessesYou use external control processes to send signals to external controllers or logic devices.
ICON PROCESS NAME DESCRIPTION
Digital Output Controls digital outputs (see page 379).
Temperature Control Programs and/or controls an external temperature controller (see page 384).
External Control Processes
Model 793.10 MultiPurpose TestWare
Process Descriptions
Process Descriptions 379
Digital Output
The Digital Output process invokes the controller to issue digital signals that can be sent to external switches and logic devices.
Note Before you configure a Digital Output process to signal an external device, ensure the signal values listed below are compatible with the device.
The following signal options are available with the Digital Output process:
• None–The process does not send a digital signal, but the done signal can still be used to start and interrupt other processes.
• Set–The process generates a logic high signal (+12 V DC).
• Clear–The process generates a logic low signal (0 V DC).
• Toggle–The process inverts the current state (from low-to-high or high-to-low).
• Pulse–The process inverts the current state with a pulse signal, holds the inverted state for the time specified in the Pulse Width control, then returns to the original state.
Note Once the controller issues the pulse, the pulse will not be affected by the stop or hold controls on the Station Controls panel.

Model 793.10 MultiPurpose TestWare
External Control ProcessesPr
oces
s D
escr
iptio
ns
Process Descriptions380
More About the Digital Output Process
Most of the time, processes stop or suspend themselves when MPT enters a stopped or holding state. This is not true of the Digital Output process.
A Digital Output process will still function when MPT enters a Stopped or Holding state. It is common to use a Program Event process to trigger a Digital Output process (to turn off an external device) when the test is stopped or held.
Keep in mind When you are configuring a Digital Output process for use in your procedure, keep in mind:
• You must allocate a digital output resource in the station configuration file in order to use the Digital Output process.
• You should choose an output signal option that is compatible with the external device connected.
• Outputs assigned for a Digital Output process cannot be manually triggered from Station Manager while MPT is in the execute mode.
• When the Digital Output process ends, the state of the external device will remain in the current state until a new station is opened or until another Digital Output process changes that state.
Note Use the Pulse option if you want to return the output to its initial state when the process is done.

External Control Processes
Model 793.10 MultiPurpose TestWare
Process Descriptions
Process Descriptions 381
Digital Output Parameter Descriptions
Output Table tab
Output Table Tab
ITEM DESCRIPTION
Digital Outputs Lists the digital outputs included on the Outputs tab.
Options Defines the type of digital signal that will be sent to the external device:
• None–The process does not send a digital signal, but the done signal can still be used to start and interrupt other processes.
• Set–The process generates a logic high signal (+12 V DC).
• Clear–The process generates a logic low signal (0 V DC).
• Toggle–The process inverts the current state (from low-to-high or high-to-low).
• Pulse–The process inverts the current state with a pulse signal, holds the inverted state for the time specified in the Pulse Width control, and then returns to the original state.
If you choose the Set, Clear, or Toggle selections, the process generates a done trigger as soon as it sends the selected digital signals to the external device. If you select the Pulse selection, the process does not generate the done signal until the pulse width time has expired and those outputs return to their original state.

Model 793.10 MultiPurpose TestWare
External Control ProcessesPr
oces
s D
escr
iptio
ns
Process Descriptions382
Outputs tab Selects the digital output channels that this process will control. Use the arrow keys to move the desired channels from the Available list to the Included list.
Settings tab
General tab See “General tab” on page 202.
Settings Tab
ITEM DESCRIPTION
Pulse Width Specifies the duration of the pulse the controller sends to the external device. You may select a time in the range of 100 milliseconds to 2 seconds with an increment of 10 milliseconds.
Note This control is enabled only if you have a digital output channel using the Pulse option.

External Control Processes
Model 793.10 MultiPurpose TestWare
Process Descriptions
Process Descriptions 383
How to Define a Digital Output Process
1. Drag the icon from the Process Palette to your Procedure
table.
2. Double-click the process icon in your Procedure table.
3. Click the Outputs tab.
4. Move all the channels you want to send digital signals to the Included list. Move all the others to the Available list.
5. Click the Output Table tab.
6. Select an option for each digital output channel listed.
Note If you select Pulse for any channel, you must specify a Pulse Width on the Settings tab.
7. Click the General tab.
8. In the Name box, type a name for this process. (You can also name the process in the Procedure table.)
9. Select the Process Enabled check box. (If this box is cleared, the process will not execute.)
10. In the Execute Process box, type number of times you want the process to execute.
11. Optional—In the Counter Type list, click a counter type.
12. Optional—If you enabled a counter, type a Counter Label.
13. Close the parameters window, and set the desired Start and Interrupt signals for the process in the Procedure table.
Model 793.10 MultiPurpose TestWare
External Control ProcessesPr
oces
s D
escr
iptio
ns
Process Descriptions384
Temperature Control
The Temperature Control process provides setpoint programming to external temperature controllers cabled to your test system.
Depending on how your hardware is configured, you may be able to:
• Use temperature feedback from a single thermocouple to maintain a specified temperature tolerance for a specified amount of time.
• Use temperature feedback from multiple thermocouples to ensure the desired temperature “soaks into” the specimen.
Note Typically, one thermocouple is placed in the chamber, and a second thermocouple is attached to the physical specimen.
When you define a Temperature Control process, you must specify the desired end level (temperature), a transition time to the specified temperature, and the amount of time you want to maintain that temperature.
Note The external temperature controller must be properly cabled to your controller in order for this process to work correctly. For cabling information, see the Controller Setup or Programmer Setup manual that accompanied your test system.
More About the Temperature Control Process
High and lowrate channels
The Model 793.00 System Software supports normal and “low-rate” programming channels. Since temperature controllers do not require frequent setpoint updates, they are often configured as low-rate channels.
By default, low-rate channels operate at a command rate of 25.6 Hz (1 Hz for Eurotherm temperature controllers connected to the TestStar IIs J51 serial-port interface). For more information on low-rate channels, see the Model 793.00 System Software manual that accompanied your test system.
Note If a process includes both normal (high-rate) and low rate channels, the channels will start and stop together. However, they may not stop at the same level. They have be off in phase as much as one low-rate tick.
External Control Processes
Model 793.10 MultiPurpose TestWare
Process Descriptions
Process Descriptions 385
Programming multiplechannels with your
controller
Since low-rate channels do not require as much processing power, you can program a temperature controller on a low-rate channel and a servovalve on a normal-rate channel at the same time.
Controller optionswith your controller
Depending on the type of external controller you are programming, the Temperature Control process may be configured differently. Refer to the following sections for special considerations.
Eurotherm controllers Some controllers support a special cabling configuration for Eurotherm temperature controllers. When a Eurotherm temperature controller is connected to your system, special Temp Output 1 and Temp Input 1 resources must be added to your .hwi file.
When configured this way, the Temperature Control process sends temperature commands to the Eurotherm controller through the J51 serial connector at 1 Hz, and receives temperature feedback (for data acquisition) through the same connector at 0.5 Hz (EI-BISYNCH protocol). In the temperature control process parameters window, you can set a Control Tolerance and a Dwell Period. If your configuration includes an additional analog input resource for an external temperature conditioner, you can also set the Monitor Tolerance.
Other controllers withProgram w/Feedback
If the programming channel is configured as Program with Feedback, the process sends the MPT end level command to the temperature controller, and can monitor temperature feedback to maintain a Control Tolerance and a Dwell Period.
If your configuration includes an additional analog input resource for an external temperature conditioner, you can also set the Monitor Tolerance.
Note The Control Tolerance and Monitor Tolerance features require independent feedback channels.
Note In most cases, Program with Feedback channels are configured as low-rate channels.
Other controllers withProgram Only
If the programming channel is configured as Program Only, the process sends the MPT end level command to the temperature controller, which maintains the control loop. In this scenario, you cannot set a Control Tolerance, Monitor Tolerance, or limits on temperature feedback.
Note In most cases, Program Only channels are configured as low-rate channels.

Model 793.10 MultiPurpose TestWare
External Control ProcessesPr
oces
s D
escr
iptio
ns
Process Descriptions386
Temperature Control Parameter Descriptions
Command tab
Command Tab (part 1 of 2)
ITEM DESCRIPTION
rate type Specifies the method with which the controller ramps the temperature to the specified end level.
The following rate types are supported:
• Time specifies the time to execute one segment.
• Frequency specifies the time to execute a two-segment cycle (even though a single segment executes).
• Rate specifies a constant rate between the starting level and the end level.
Note You cannot use Rate for a process applied to multiple channels. If you do, an error message will appear when the procedure is locked.
Dwell Period Specifies the amount of time the temperature feedback must stay within tolerance before the process terminates. The dwell period begins as soon as the temperature enters the specified control tolerance range.
Note If the temperature strays outside of the tolerance range during the dwell period, the dwell period resets. The dwell period starts over when the temperature reenters the tolerance range.
If you choose a dwell period of zero, the process will terminate as soon as the temperature feedback becomes within tolerance.
If your station configuration supports the monitor feature, then the dwell period applies to both the control tolerance and monitor tolerance ranges.
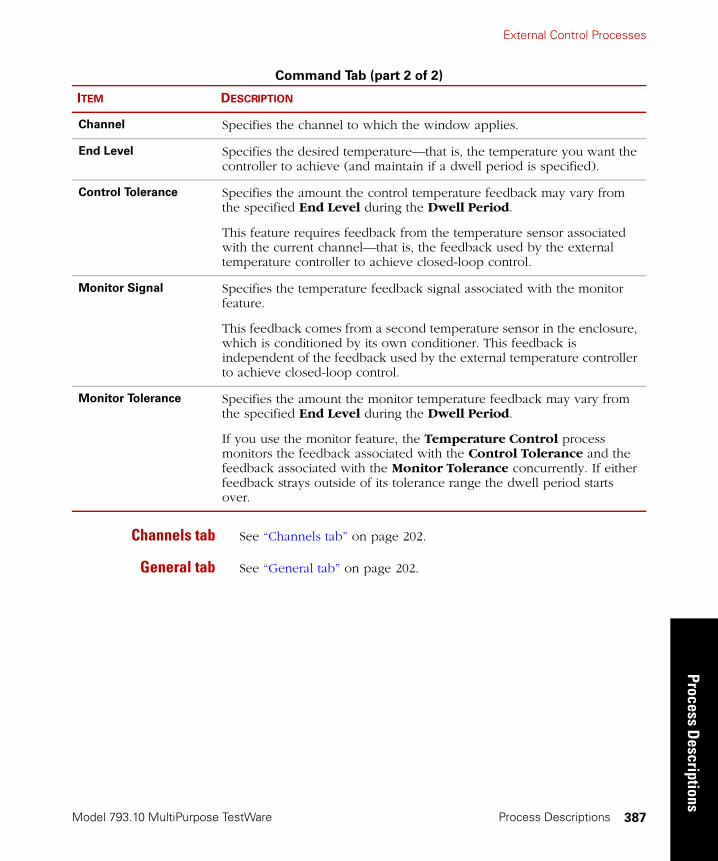
External Control Processes
Model 793.10 MultiPurpose TestWare
Process Descriptions
Process Descriptions 387
Channels tab See “Channels tab” on page 202.
General tab See “General tab” on page 202.
Channel Specifies the channel to which the window applies.
End Level Specifies the desired temperature—that is, the temperature you want the controller to achieve (and maintain if a dwell period is specified).
Control Tolerance Specifies the amount the control temperature feedback may vary from the specified End Level during the Dwell Period.
This feature requires feedback from the temperature sensor associated with the current channel—that is, the feedback used by the external temperature controller to achieve closed-loop control.
Monitor Signal Specifies the temperature feedback signal associated with the monitor feature.
This feedback comes from a second temperature sensor in the enclosure, which is conditioned by its own conditioner. This feedback is independent of the feedback used by the external temperature controller to achieve closed-loop control.
Monitor Tolerance Specifies the amount the monitor temperature feedback may vary from the specified End Level during the Dwell Period.
If you use the monitor feature, the Temperature Control process monitors the feedback associated with the Control Tolerance and the feedback associated with the Monitor Tolerance concurrently. If either feedback strays outside of its tolerance range the dwell period starts over.
Command Tab (part 2 of 2)
ITEM DESCRIPTION

Model 793.10 MultiPurpose TestWare
External Control ProcessesPr
oces
s D
escr
iptio
ns
Process Descriptions388
How to Define a Temperature Control Process
1. Drag the icon from the Process Palette to your Procedure
table.
2. Double-click the process icon in your Procedure table.
3. Click the Channels tab.
4. Move all the channels you want to program with this process to the Included list. Move all the others to the Available list.
5. Click the Command tab.
6. Set the rate type (Time, Rate, or Frequency), set the units of measurement, and then type a value.
7. In the Dwell Period box, set the units of measurement for the dwell period, and then type a value.
8. In the Channels list, click each temperature control channel in succession.
9. In the End Level box, set the units of measurement for the end level, and then type a value.
10. In the Control Tolerance box, type a value.
11. Optional—In the Monitor Signal list, click the channel you want to monitor temperature feedback on (this signal should be from an independent temperature sensor).
12. Optional—In the Monitor Tolerance box, type a value.
13. Repeat steps 8 through 12 for each temperature control channel.
External Control Processes
Model 793.10 MultiPurpose TestWare
Process Descriptions
Process Descriptions 389
14. Click the General tab.
15. In the Name box, type a name for this process. (You can also name the process in the Procedure table.)
16. Select the Process Enabled check box. (If this box is cleared, the process will not execute.)
17. In the Execute Process box, type number of times you want the process to execute.
18. Optional—In the Counter Type list, click a counter type.
19. Optional—If you enabled a counter, type a Counter Label.
20. Close the parameters window, and set the desired Start and Interrupt signals for the process in the Procedure table.
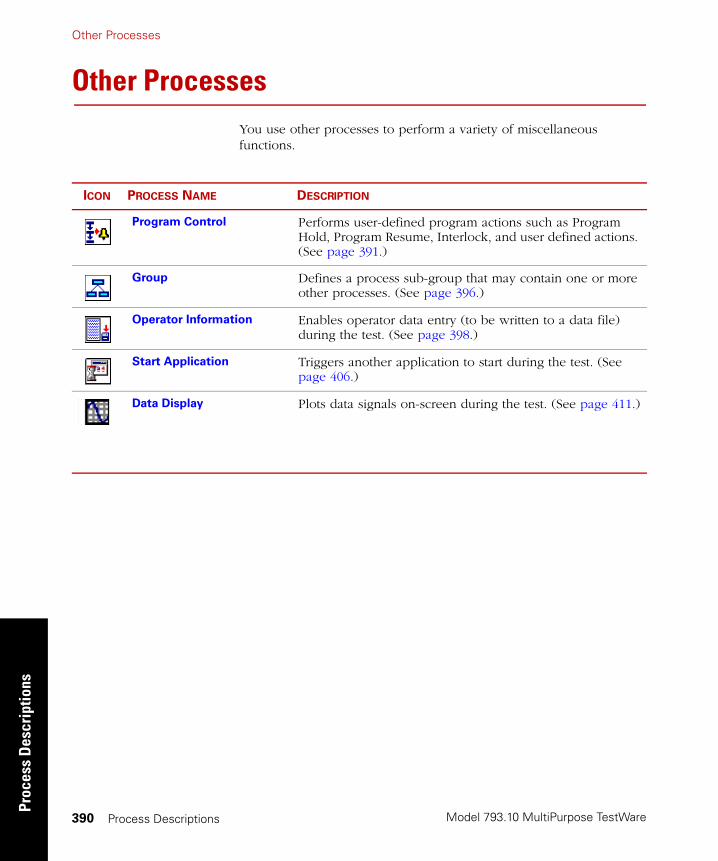
Model 793.10 MultiPurpose TestWare
Other ProcessesPr
oces
s D
escr
iptio
ns
Process Descriptions390
Other ProcessesYou use other processes to perform a variety of miscellaneous functions.
ICON PROCESS NAME DESCRIPTION
Program Control Performs user-defined program actions such as Program Hold, Program Resume, Interlock, and user defined actions. (See page 391.)
Group Defines a process sub-group that may contain one or more other processes. (See page 396.)
Operator Information Enables operator data entry (to be written to a data file) during the test. (See page 398.)
Start Application Triggers another application to start during the test. (See page 406.)
Data Display Plots data signals on-screen during the test. (See page 411.)
Other Processes
Model 793.10 MultiPurpose TestWare
Process Descriptions
Process Descriptions 391
Program Control
The Program Control process can be used to generate a message and/or perform a specified action. Once the process performs the specified action, the process ends.
Note Generally, you use a detector process to start a Program Control process.
Logging ProgramControl messages
If desired, you can save generated messages to the message logs.
Note When logging messages via the Program Control process, messages from the process may appear in the log before the “Running” message that pertains to the procedure.
More About the Program Control Process
Program Controlprocess example
Suppose you wish to add a new capability to your existing procedure in which the message “‘Failure Threshold Attained” is issued to the message log if displacement feedback reaches 2 cm.
To do this, you would add a Data Limit Detector process and a Program Control process to your procedure.
You would configure the Data Limit Detector process to monitor displacement feedback and attain its done state if displacement feedback equals 2 cm.
You would sequence the Program Control process to start when the Data Limit Detector process is done.
Then you would configure the Program Control process by selecting the Message Only action, and entering “Failure Threshold Attained” in the message entry box.
When you run a test with the modified procedure, the message “Failure Threshold Attained” will log if displacement feedback reaches 2 cm.

Model 793.10 MultiPurpose TestWare
Other ProcessesPr
oces
s D
escr
iptio
ns
Process Descriptions392
Program Control Parameter Descriptions
Action tab
Action Tab (part 1 of 3)
ITEM DESCRIPTION
Action Note For more information on Actions, see “Using actions with processes” on page 333
Specifies the action that occurs when the process completes.
None The process ends without generating a message or performing an action.
Message Only The process writes a message to the MPT Specimen Log. (You define the content of the message in the Message box.)
Program Hold The process suspends the test until you click the Run button on the Station Controls panel. This action functions the same as clicking the Hold button on the Station Controls panel.
Program Stop The process stops the test. This action functions the same as clicking the Stop button on the Station Controls panel.
Program Pause Similar to the Program Hold action, but the test can be resumed by a Program Resume action from another Program Control process.
Program Resume
Resumes a test paused by a Program Pause action.
Procedure Error The process stops the test and generates an error. The procedure goes to the error state and cannot be resumed. To run the procedure again, click the Reset button, then click the Run button on the Station Controls panel.
Station Power Off
The process removes hydraulic power from the station. The test can be resumed after you reapply hydraulic power to the station.

Other Processes
Model 793.10 MultiPurpose TestWare
Process Descriptions
Process Descriptions 393
Interlock The process triggers a hydraulic interlock and shuts down the hydraulic power supply. The test can be resumed after you reset the interlock, reactivate hydraulic power, and apply hydraulic power to the station.
Program Interlock
The process triggers a program interlock. The test can be resumed after you reset the interlock.
Log Message As Assigns a severity level to the message (in ascending levels of severity: Diagnostic, Information, Warning, or Error) and makes the message available to the MPT Specimen Log.
If the Station Manager Station Log and the Basic TestWare Test Log are configured to accept messages from all sources, then MPT makes the message available to them also.
Note Unlike Station Manager and Basic TestWare, MPT does not generate messages with a severity level of Fatal Error.
Each type of log will accept the message only if it has been configured to store messages with the assigned severity level.
For instance, if the MPT Specimen Log is configured to accept messages with a minimum severity level of Warning, and you assign Information as the severity level for this message, then this message will not be recorded in the MPT Specimen Log. In that instance the MPT Specimen Log would accept messages having only Warning and Error severity levels.
You can specify the minimum severity level that each type of log will accept. To do this:
• For MultiPurpose TestWare, select the MPT Options Editor, then select the Specimen Log tab.
• For Station Manager, select Tools, then select Station Options, then select the Station Log tab.
• For Basic TestWare, select Test Setup, then select the Test Log tab.
Action Tab (part 2 of 3)
ITEM DESCRIPTION

Model 793.10 MultiPurpose TestWare
Other ProcessesPr
oces
s D
escr
iptio
ns
Process Descriptions394
General tab See “General tab” on page 202.
How to Define a Program Control Process
1. Drag the icon from the Process Palette to your Procedure
table.
2. Double-click the process icon in your Procedure table.
3. Click the Action tab.
4. In the Action list, click the action for this process.
5. Optional—If you want to write a message to the log when this process triggers, select the Log Message As check box and click Diagnostic, Information, Warning, or Error in the list.
6. Type the message that you want to send to the various message logs when the process triggers.
7. Click the General tab.
Message Defines the content of the message written to the log.
Include Counters1 Includes counter information with the message written to the message log.
Note This option can be used to periodically log counter information.
1. If the Program Control process is configured to include counters and log on a transition state change, your log will contain two similar messages each time the state changes. This occurs because all state transitions are automatically logged with counter information. Keep in mind that the automatic logs are displayed as Information, while the Program Control logs are displayed in the severity level you specify (Information, Warning, Error, or Diagnostic). This allows you discern between these log entries if desired.
Action Tab (part 3 of 3)
ITEM DESCRIPTION

Other Processes
Model 793.10 MultiPurpose TestWare
Process Descriptions
Process Descriptions 395
8. In the Name box, type a name for this process. (You can also name the process in the Procedure table.)
9. Select the Process Enabled check box. (If this box is cleared, the process will not execute.)
10. In the Execute Process box, type number of times you want the process to execute.
11. Optional—In the Counter Type list, click a counter type.
12. Optional—If you enabled a counter, type a Counter Label.
13. Close the parameters window, and set the desired Start and Interrupt signals for the process in the Procedure table.

Model 793.10 MultiPurpose TestWare
Other ProcessesPr
oces
s D
escr
iptio
ns
Process Descriptions396
Group
The Group process is basically a sub-procedure that runs within your main procedure (or within another Group process). On the Procedure table, you can double-click the Group process icon to display the Group Parameters window.
The Group table looks similar to the Procedure table. You add processes to it in the same manner.
For information on sequencing Group processes, see “Sequencing Group Processes” on page 116.
How to Move In and Out of a Group Process Window
When you click a Group process icon on a table and click the Next Group Table button on the MPT toolbar, a new Group table appears. You can also right-click on a Group process icon on a table and select Open Table to make a new table appear.
To move back to a Group process’ parent table, click the Previous Group Table button on the toolbar:
Group Parameter Descriptions
General tab See “General tab” on page 202.
Next Group Table
Previous Group Table

Other Processes
Model 793.10 MultiPurpose TestWare
Process Descriptions
Process Descriptions 397
How to Define a Group Process
1. Drag the icon from the Process Palette to your Group or
Procedure table.
2. Click the Group process icon in your Group or Procedure table,
and then click on the MPT Procedure Editor.
3. Add processes to your Group table. Make sure to set the parameters for each process included in your group.
4. Set Start and Interrupt signals for each process in your group. Also, set the Group is done when signal.
5. Click on the MPT Procedure Editor to return to the parent
table.
6. Double-click the Group process icon in your Group or Procedure table.
7. Click the General tab.
8. In the Name box, type a name for this process. (You can also name the process in the Procedure table.)
9. Select the Process Enabled check box. (If this box is cleared, the process will not execute.)
10. In the Execute Process box, type number of times you want the process to execute.
11. Optional—In the Counter Type list, click a counter type.
12. Optional—If you enabled a counter, type a Counter Label.
13. Close the parameters window, and set the desired Start and Interrupt signals for the process in the Group or Procedure table.

Model 793.10 MultiPurpose TestWare
Other ProcessesPr
oces
s D
escr
iptio
ns
Process Descriptions398
Operator Information
The Operator Information process requires the operator to enter information at a specific time during the test. The information entered can be archived along with other data during the test.
Some examples of the types of things a test designer can do with the Operator Information process include:
• Controlling the test flow by prompting the operator for information at any time during the test.
• Providing information about the physical specimen with the data file.
• Prompting the operator for specific information, such as:
– Operator ID
– Batch number
– Workstation number
– Part number
– Operator comments
When an Operator Information process is triggered, it displays a window that requires the operator to enter the type of information specified by the test designer. As the test designer, you can choose whether the information is non-editable, or whether specific information, comments, or values must be entered when the window appears.
When the operator enters the required information in the window and clicks OK, the information is output to a test data file.
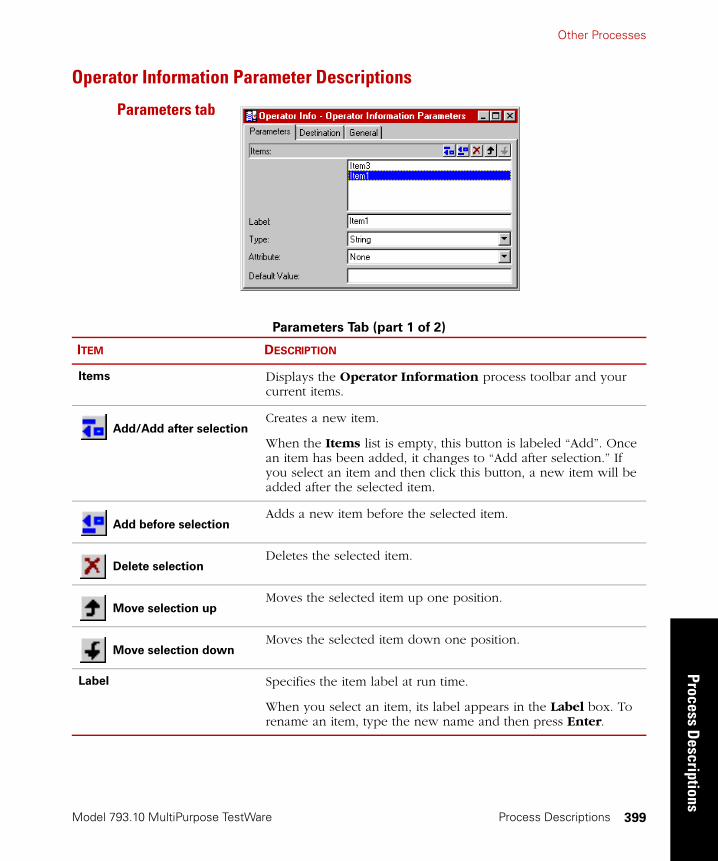
Other Processes
Model 793.10 MultiPurpose TestWare
Process Descriptions
Process Descriptions 399
Operator Information Parameter Descriptions
Parameters tab
Parameters Tab (part 1 of 2)
ITEM DESCRIPTION
Items Displays the Operator Information process toolbar and your current items.
Add/Add after selectionCreates a new item.
When the Items list is empty, this button is labeled “Add”. Once an item has been added, it changes to “Add after selection.” If you select an item and then click this button, a new item will be added after the selected item.
Add before selectionAdds a new item before the selected item.
Delete selectionDeletes the selected item.
Move selection upMoves the selected item up one position.
Move selection downMoves the selected item down one position.
Label Specifies the item label at run time.
When you select an item, its label appears in the Label box. To rename an item, type the new name and then press Enter.

Model 793.10 MultiPurpose TestWare
Other ProcessesPr
oces
s D
escr
iptio
ns
Process Descriptions400
Type Specifies the type of information that will be displayed in the Operator Information window:
String—Can be any arbitrary text string.
Real—Can be any real number (includes decimal expressions, such as 1.2) within the defined range. If you select Real, the dimension boxes are enabled (see below).
Integer—Can be any number (zero, 1, 2, and so on) within the defined range.
List—A list of items from which the operator can select. This selection allow the designer to create a custom list for the operator.
Attribute None—Operator can edit or delete the default entry.
Non-Editable—Operator cannot edit text.
Non-Blank—Operator must enter information. The entry cannot be blank.
Default Value Specifies a default value displayed in the Operator Information data entry box.
Note The operator can change units when entering data, but MPT writes the data to the data file in the units selected here.
Dimension
(Real Type only)Specifies the dimension for the Default Value.
Minimum/Maximum
(Real and Integer Types only)Enables the minimum/maximum limit to be enforced at runtime.
Note If the operator tries to enter a value outside the limits, the displayed value will revert to last valid limit value.
Inclusive
(Real and Integer Types only)When selected, includes the specified minimum/maximum limit value. If this checkbox is cleared, the value you enter can be close to but cannot equal the limit value.
Selections
(List Type only)This is a toolbar identical to the Items toolbar. It allows you to create, delete, and choose selections available for the custom list.
Description
(List Type only)Allows you to edit the default list names generated by the Selections toolbar.
Parameters Tab (part 2 of 2)
ITEM DESCRIPTION
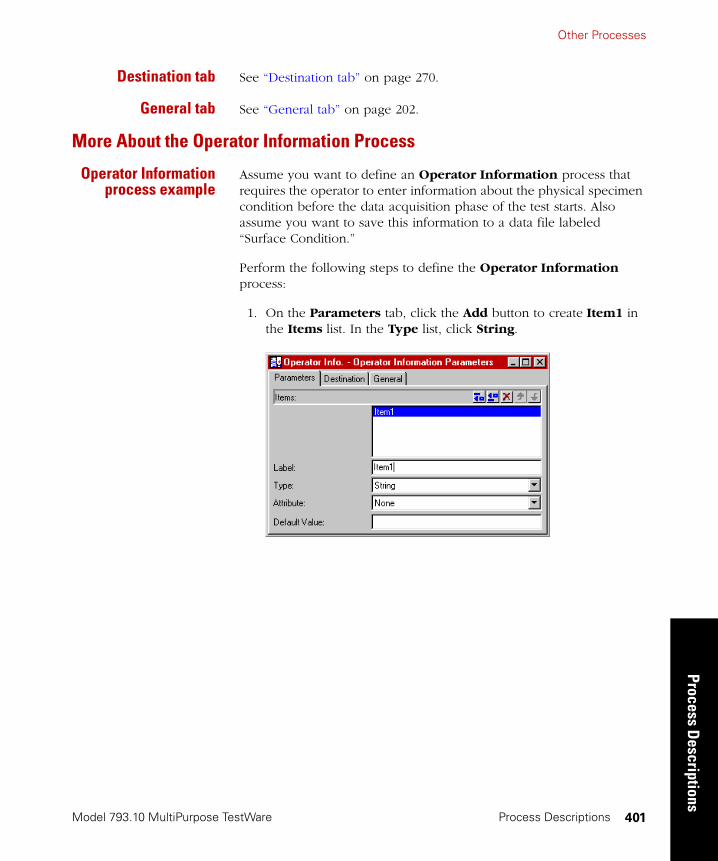
Other Processes
Model 793.10 MultiPurpose TestWare
Process Descriptions
Process Descriptions 401
Destination tab See “Destination tab” on page 270.
General tab See “General tab” on page 202.
More About the Operator Information Process
Operator Informationprocess example
Assume you want to define an Operator Information process that requires the operator to enter information about the physical specimen condition before the data acquisition phase of the test starts. Also assume you want to save this information to a data file labeled “Surface Condition.”
Perform the following steps to define the Operator Information process:
1. On the Parameters tab, click the Add button to create Item1 in the Items list. In the Type list, click String.
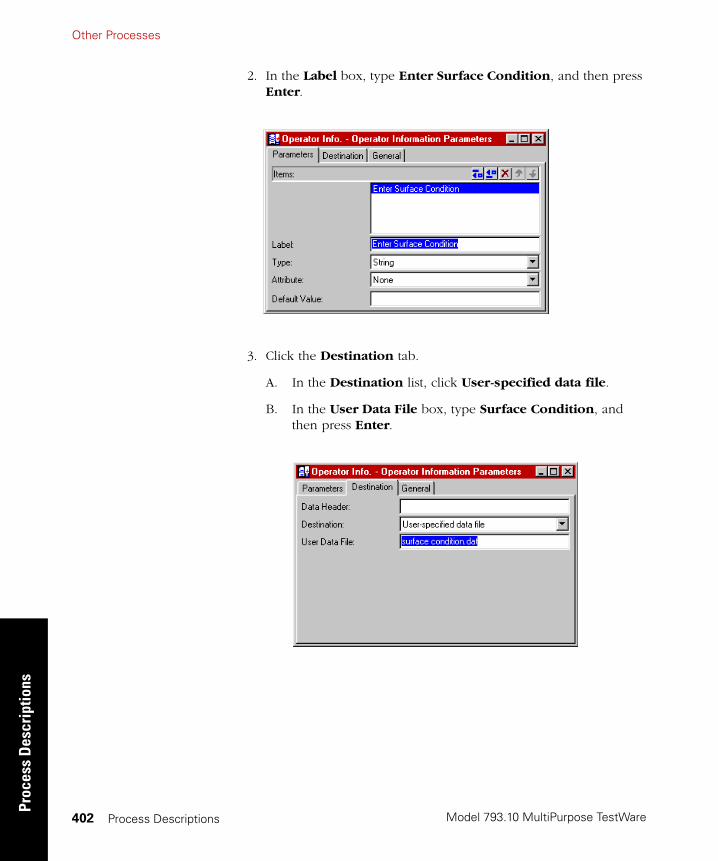
Model 793.10 MultiPurpose TestWare
Other ProcessesPr
oces
s D
escr
iptio
ns
Process Descriptions402
2. In the Label box, type Enter Surface Condition, and then press Enter.
3. Click the Destination tab.
A. In the Destination list, click User-specified data file.
B. In the User Data File box, type Surface Condition, and then press Enter.

Other Processes
Model 793.10 MultiPurpose TestWare
Process Descriptions
Process Descriptions 403
Process output Now, the test will pause when the Operator Information process starts, and the Operator Information runtime window will appear. The data entry box will be labeled Enter Surface Condition.
When the test is run, the operator will enter the condition of the physical specimen:
When the operator finishes entering the information and clicks OK, the information is written to a separate file (named Surface Condition) that is stored in the MPT specimen, and the procedure resumes with the next process.
Model 793.10 MultiPurpose TestWare
Other ProcessesPr
oces
s D
escr
iptio
ns
Process Descriptions404
How to Define an Operator Information Process
1. Drag the icon from the Process Palette to your Group or
Procedure table.
2. Double-click the process icon in your Group or Procedure table.
3. Click the Parameters tab, and then click to create an item.
4. In the Label box, type the text you want to appear when the runtime window is displayed.
5. In the Type list, click the item type, and then click the Attribute.
6. In the Dimension list, click the dimension (real types only).
7. In the Selections panel, add, arrange, and label custom list items (list types only).
8. In the Default Value box, type a default value.
9. Enter Minimum and Maximum values (real and integer types only).
10. Repeat steps 3 - 9 for each item you want to define.
11. Click the Destination tab.
12. Type a description of the data file in the Data Header box.
13. In the Destination list, click the destination for the acquired data. (If you click User-specified data file, enter a file name in the User Data File box.) See “Data destination” on page 268.
14. Click the General tab.

Other Processes
Model 793.10 MultiPurpose TestWare
Process Descriptions
Process Descriptions 405
15. In the Name box, type a name for this process. (You can also name the process in the Procedure table.)
16. Select the Process Enabled check box. (If this box is cleared, the process will not execute.)
17. In the Execute Process box, type number of times you want the process to execute.
18. Optional—In the Counter Type list, click a counter type.
19. Optional—If you enabled a counter, type a Counter Label.
20. Close the parameters window, and set the desired Start and Interrupt signals for the process in the Group or Procedure table.
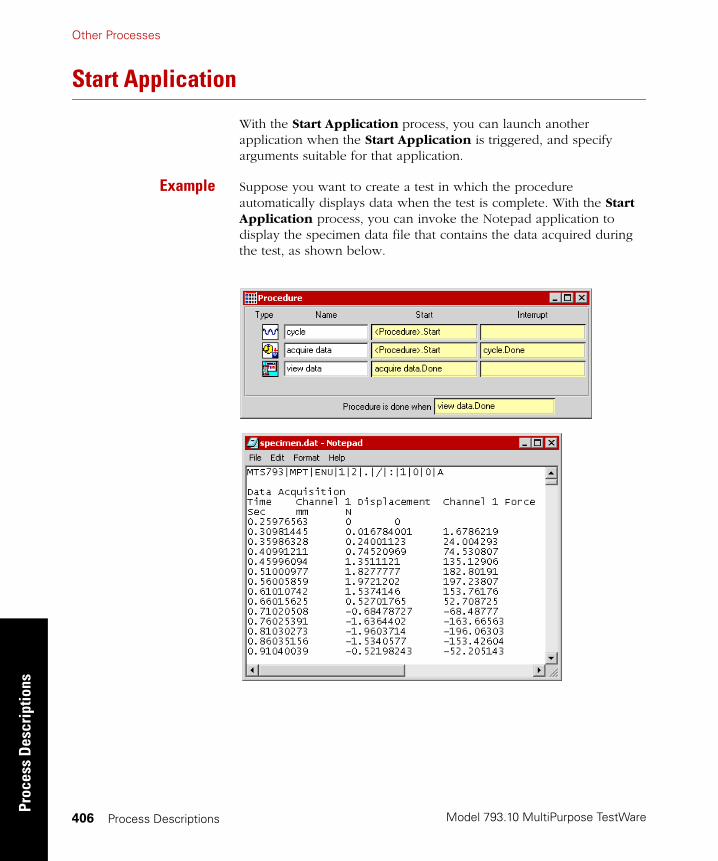
Model 793.10 MultiPurpose TestWare
Other ProcessesPr
oces
s D
escr
iptio
ns
Process Descriptions406
Start Application
With the Start Application process, you can launch another application when the Start Application is triggered, and specify arguments suitable for that application.
Example Suppose you want to create a test in which the procedure automatically displays data when the test is complete. With the Start Application process, you can invoke the Notepad application to display the specimen data file that contains the data acquired during the test, as shown below.
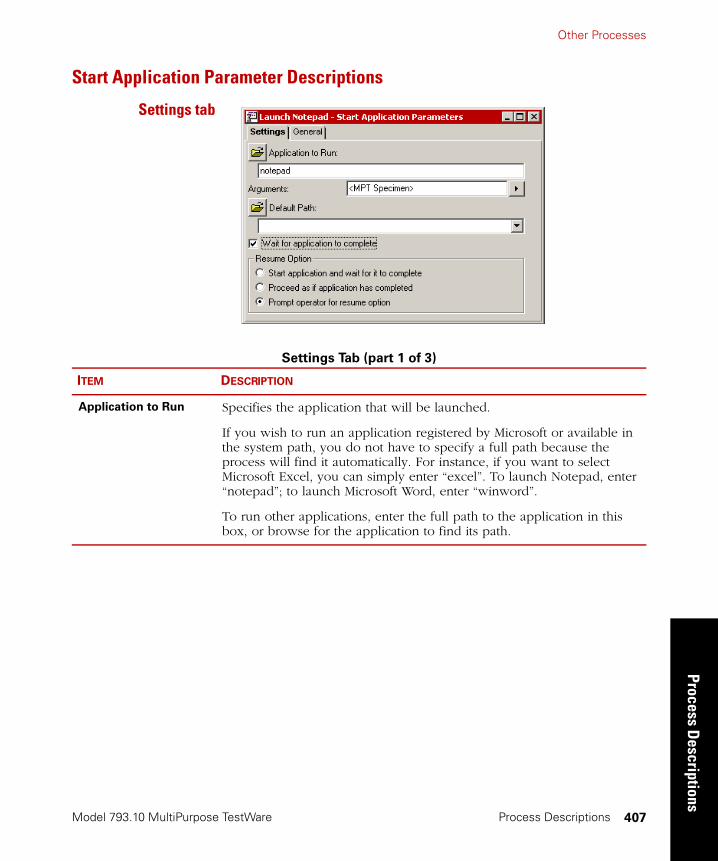
Other Processes
Model 793.10 MultiPurpose TestWare
Process Descriptions
Process Descriptions 407
Start Application Parameter Descriptions
Settings tab
Settings Tab (part 1 of 3)
ITEM DESCRIPTION
Application to Run Specifies the application that will be launched.
If you wish to run an application registered by Microsoft or available in the system path, you do not have to specify a full path because the process will find it automatically. For instance, if you want to select Microsoft Excel, you can simply enter “excel”. To launch Notepad, enter “notepad”; to launch Microsoft Word, enter “winword”.
To run other applications, enter the full path to the application in this box, or browse for the application to find its path.
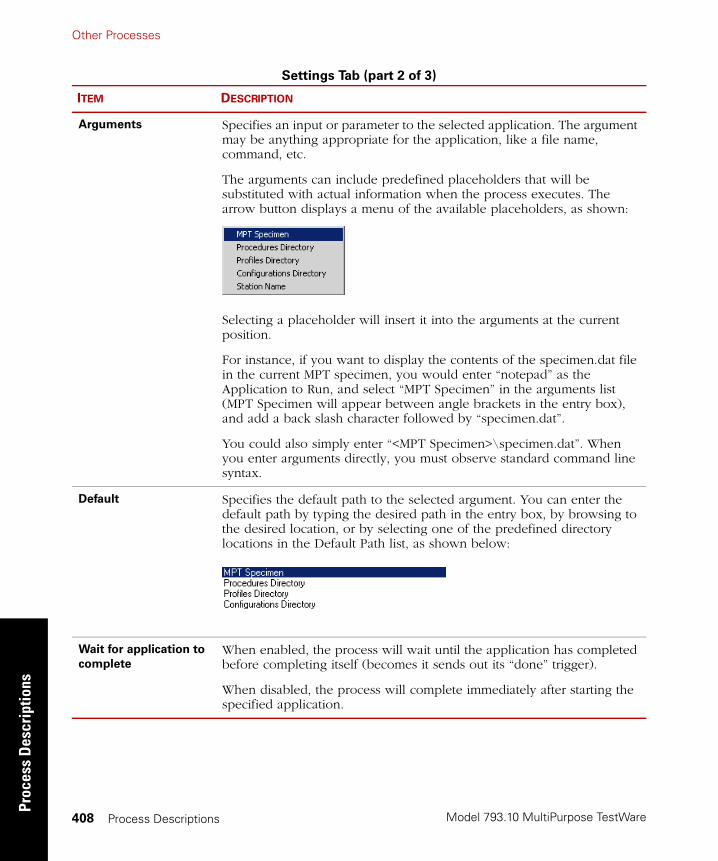
Model 793.10 MultiPurpose TestWare
Other ProcessesPr
oces
s D
escr
iptio
ns
Process Descriptions408
Arguments Specifies an input or parameter to the selected application. The argument may be anything appropriate for the application, like a file name, command, etc.
The arguments can include predefined placeholders that will be substituted with actual information when the process executes. The arrow button displays a menu of the available placeholders, as shown:
Selecting a placeholder will insert it into the arguments at the current position.
For instance, if you want to display the contents of the specimen.dat file in the current MPT specimen, you would enter “notepad” as the Application to Run, and select “MPT Specimen” in the arguments list (MPT Specimen will appear between angle brackets in the entry box), and add a back slash character followed by “specimen.dat”.
You could also simply enter “<MPT Specimen>\specimen.dat”. When you enter arguments directly, you must observe standard command line syntax.
Default Specifies the default path to the selected argument. You can enter the default path by typing the desired path in the entry box, by browsing to the desired location, or by selecting one of the predefined directory locations in the Default Path list, as shown below:
Wait for application to
complete
When enabled, the process will wait until the application has completed before completing itself (becomes it sends out its “done” trigger).
When disabled, the process will complete immediately after starting the specified application.
Settings Tab (part 2 of 3)
ITEM DESCRIPTION
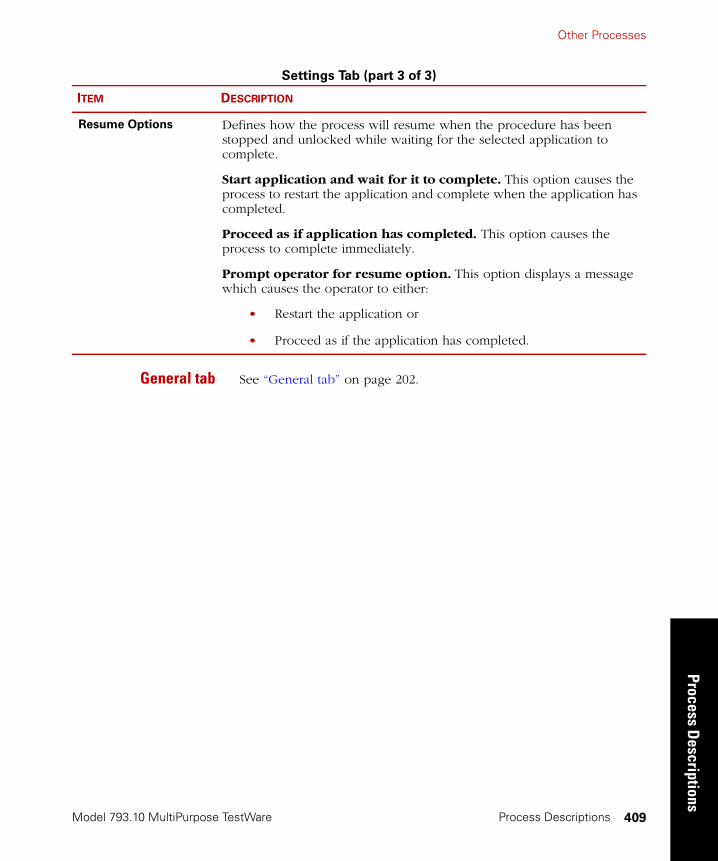
Other Processes
Model 793.10 MultiPurpose TestWare
Process Descriptions
Process Descriptions 409
General tab See “General tab” on page 202.
Resume Options Defines how the process will resume when the procedure has been stopped and unlocked while waiting for the selected application to complete.
Start application and wait for it to complete. This option causes the process to restart the application and complete when the application has completed.
Proceed as if application has completed. This option causes the process to complete immediately.
Prompt operator for resume option. This option displays a message which causes the operator to either:
• Restart the application or
• Proceed as if the application has completed.
Settings Tab (part 3 of 3)
ITEM DESCRIPTION
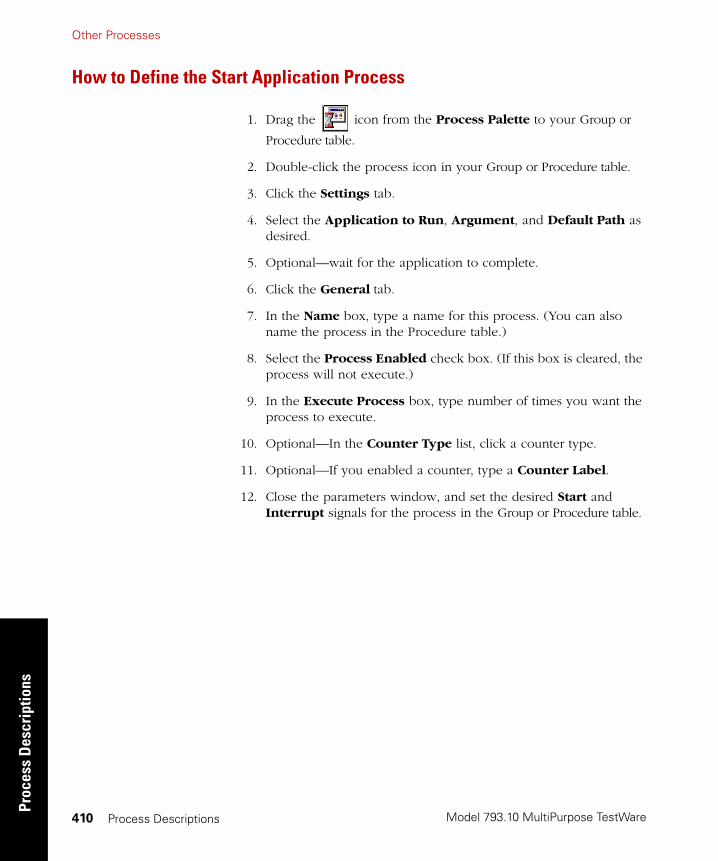
Model 793.10 MultiPurpose TestWare
Other ProcessesPr
oces
s D
escr
iptio
ns
Process Descriptions410
How to Define the Start Application Process
1. Drag the icon from the Process Palette to your Group or
Procedure table.
2. Double-click the process icon in your Group or Procedure table.
3. Click the Settings tab.
4. Select the Application to Run, Argument, and Default Path as desired.
5. Optional—wait for the application to complete.
6. Click the General tab.
7. In the Name box, type a name for this process. (You can also name the process in the Procedure table.)
8. Select the Process Enabled check box. (If this box is cleared, the process will not execute.)
9. In the Execute Process box, type number of times you want the process to execute.
10. Optional—In the Counter Type list, click a counter type.
11. Optional—If you enabled a counter, type a Counter Label.
12. Close the parameters window, and set the desired Start and Interrupt signals for the process in the Group or Procedure table.

Other Processes
Model 793.10 MultiPurpose TestWare
Process Descriptions
Process Descriptions 411
Data Display
The Data Display process acquires data on the signals you specify, and then plots the data on-screen during the test.
With this process, you can view events as they occur on multiple data channels. This process acquires data each time a selected signal changes a specified amount. This process must run in parallel with a command process; it cannot acquire data unless the command process is performing an action that it can measure.
Note The Data Display process does not store data to a disk. The data that is acquired is used for display only.
Within a single Data Display process, you can define any number of plot configurations, each of which can be enabled or disabled for the test. When the test starts, a plot window (similar to the Station Manger Scope window) appears on-screen for each enabled plot configuration.
Plot Window Example

Model 793.10 MultiPurpose TestWare
Other ProcessesPr
oces
s D
escr
iptio
ns
Process Descriptions412
Data Display Parameter Descriptions
Plots tab This window lets you create, delete, and rearrange plots using its toolbar icons.
Note To save the position of the plot window(s), you must save the procedure (’position’ refers to the location of the plot on your PC monitor). If you move the plot window from its default position and exit the procedure without saving, the plot window will appear in its default (or last saved) position.
Plots Tab (part 1 of 2)
ITEM DESCRIPTION
Plots: Displays the Data Display process toolbar and your current plots.
Add/Add after
selection
Creates a new plot.
When the Plots list is empty, this button is labeled “Add”. Once an item has been added, it changes to “Add after selection.” If you select a plot and then click this button, a new plot will be added after the selected item.
Add before
selection
Adds a new plot before the selected item.
Delete selectionDeletes the selected plot.

Other Processes
Model 793.10 MultiPurpose TestWare
Process Descriptions
Process Descriptions 413
Move selection
up
Moves the selected plot up one position.
Move selection
down
Moves the selected plot down one position.
Plot Title Specifies the plot window title.
Plot Enabled Displays the plot when the test is run.
Note Only plots that are enabled are displayed on-screen during the test.
Plots Tab (part 2 of 2)
ITEM DESCRIPTION
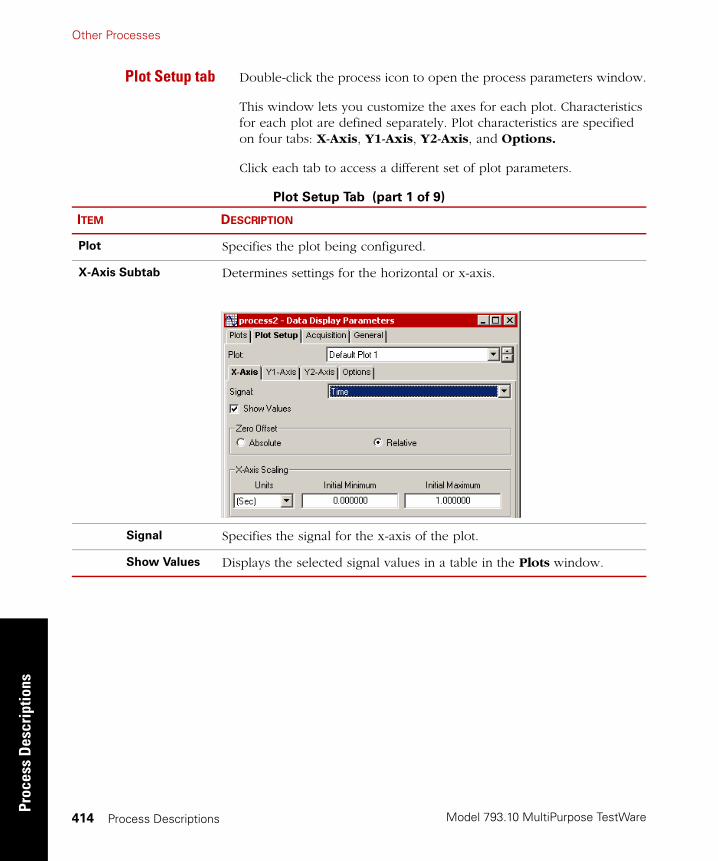
Model 793.10 MultiPurpose TestWare
Other ProcessesPr
oces
s D
escr
iptio
ns
Process Descriptions414
Plot Setup tab Double-click the process icon to open the process parameters window.
This window lets you customize the axes for each plot. Characteristics for each plot are defined separately. Plot characteristics are specified on four tabs: X-Axis, Y1-Axis, Y2-Axis, and Options.
Click each tab to access a different set of plot parameters.
Plot Setup Tab (part 1 of 9)
ITEM DESCRIPTION
Plot Specifies the plot being configured.
X-Axis Subtab Determines settings for the horizontal or x-axis.
Signal Specifies the signal for the x-axis of the plot.
Show Values Displays the selected signal values in a table in the Plots window.

Other Processes
Model 793.10 MultiPurpose TestWare
Process Descriptions
Process Descriptions 415
Zero Offset Note This control is most useful for continuously increasing signals, such as time, segment count, etc.
Determines the starting point:
• Absolute: Plotted data begins where the output begins
• Relative: Plotted data begins at zero
Example: Suppose the Test Procedure includes a Cyclic Command process that precycles the specimen for 30 seconds prior to starting another Cyclic Command process that applies test cycles to the specimen, and a parallel Data Display process that displays a plot of the test cycles. In this scenario, if Zero Offset is set to Absolute and the x-axis signal is time, the plot will begin at 30 seconds, leaving a gap from 0 to 30 seconds on the plot. If Zero Offset is set to Relative, the plot will begin at 0 seconds.
Units Specifies the units for the x-axis.
Initial
Minimum/
Maximum
Sets the initial x-axis maximum and minimum values. The plots will automatically rescale if necessary.
Plot Setup Tab (part 2 of 9)
ITEM DESCRIPTION
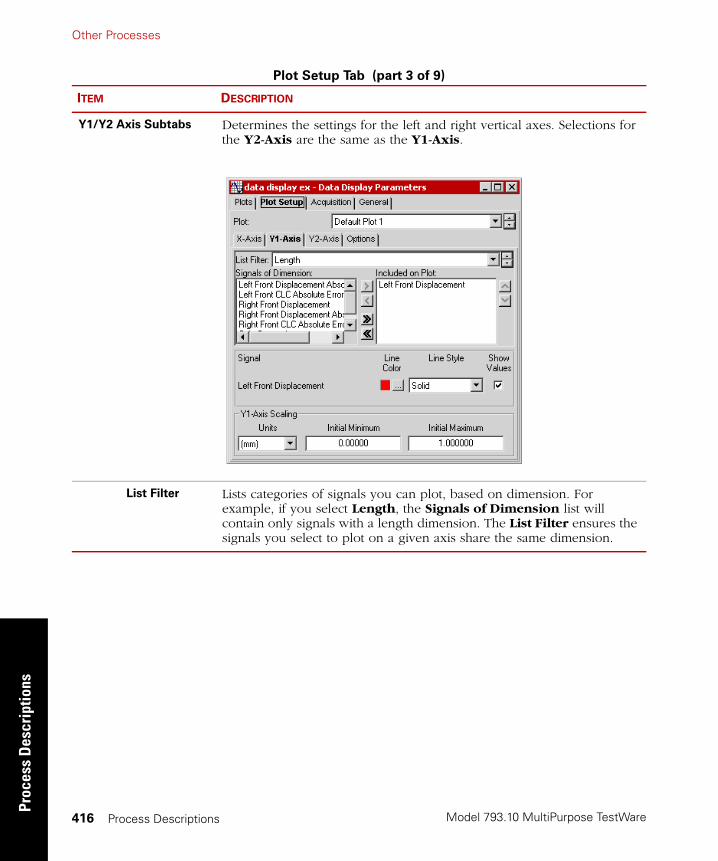
Model 793.10 MultiPurpose TestWare
Other ProcessesPr
oces
s D
escr
iptio
ns
Process Descriptions416
Y1/Y2 Axis Subtabs Determines the settings for the left and right vertical axes. Selections for the Y2-Axis are the same as the Y1-Axis.
List Filter Lists categories of signals you can plot, based on dimension. For example, if you select Length, the Signals of Dimension list will contain only signals with a length dimension. The List Filter ensures the signals you select to plot on a given axis share the same dimension.
Plot Setup Tab (part 3 of 9)
ITEM DESCRIPTION
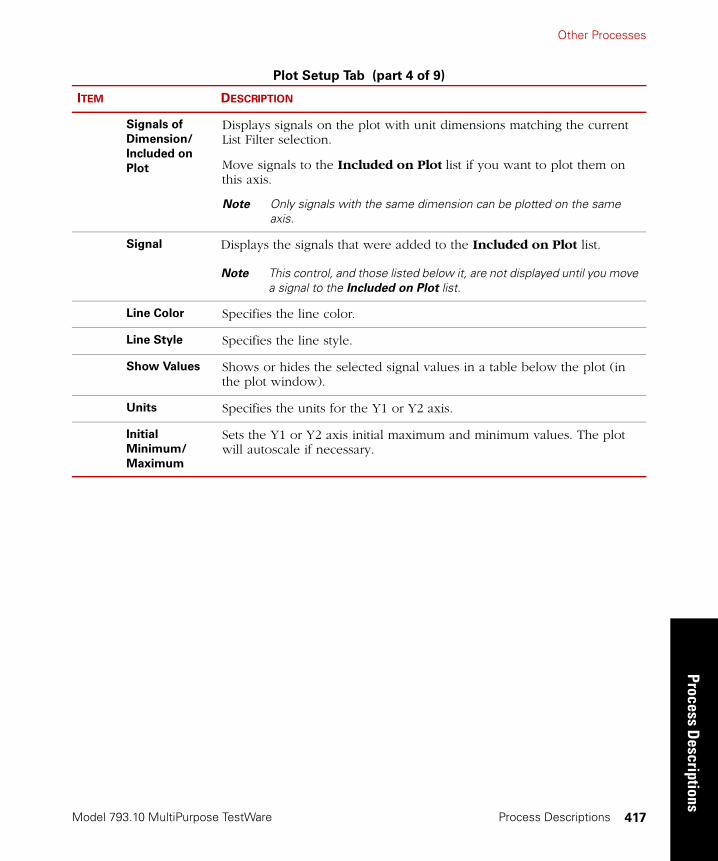
Other Processes
Model 793.10 MultiPurpose TestWare
Process Descriptions
Process Descriptions 417
Signals of
Dimension/
Included on
Plot
Displays signals on the plot with unit dimensions matching the current List Filter selection.
Move signals to the Included on Plot list if you want to plot them on this axis.
Note Only signals with the same dimension can be plotted on the same axis.
Signal Displays the signals that were added to the Included on Plot list.
Note This control, and those listed below it, are not displayed until you move a signal to the Included on Plot list.
Line Color Specifies the line color.
Line Style Specifies the line style.
Show Values Shows or hides the selected signal values in a table below the plot (in the plot window).
Units Specifies the units for the Y1 or Y2 axis.
Initial
Minimum/
Maximum
Sets the Y1 or Y2 axis initial maximum and minimum values. The plot will autoscale if necessary.
Plot Setup Tab (part 4 of 9)
ITEM DESCRIPTION

Model 793.10 MultiPurpose TestWare
Other ProcessesPr
oces
s D
escr
iptio
ns
Process Descriptions418
Options Subtab Lets you define visual characteristics of the plot and buffer size, and choose which data is displayed.
Show Grid Hides or displays the grid in the plot window.
Show Legend Hides or displays the legend in the plot window.
Transpose X/Y
Axis
Transposes the X and Y1 axes.
Note This option is disabled if both the Y1 and Y2 axes are used.
Buffer Size Sets the size of the display buffer, which ranges between 4096 and 16,384.
Note When the buffer is filled, room for new data in the buffer is based on the Decimation Option (data is deleted according to the current Decimation Option).
Plot Setup Tab (part 5 of 9)
ITEM DESCRIPTION

Other Processes
Model 793.10 MultiPurpose TestWare
Process Descriptions
Process Descriptions 419
Decimation
Option
Decimation refers to discarding a portion of the data in the display buffer when it fills. Each option controls the flow of data through the display buffer in a unique way, and creates a corresponding type of display on the plot.
Each option follows the same general process:
• The buffer fills with data
• The data is decimated (reduced) according to the option selected
• The retained data is shifted to the front of the buffer to form a contiguous block
• The process is repeated
Every Other Point—This option causes the buffer to accept acquired data until it fills, perform a decimation of every other point, shift data, and repeat. This option decreases the resolution of the initial data as a function of the number of times the buffer fills.
First pass: When the buffer fills for the first time, it accepts every point of acquired data until the buffer is full, then performs a decimation by discarding every other point in the buffer. The retained points are shifted to the front of the buffer to form a contiguous block, leaving the back half of the buffer empty and ready to receive new data.
Second pass: The buffer fills the second time as before until full, then performs another decimation and data shift.
Subsequent passes: The process is repeated in subsequent passes in the same way until stopped.
Plot Setup Tab (part 6 of 9)
ITEM DESCRIPTION
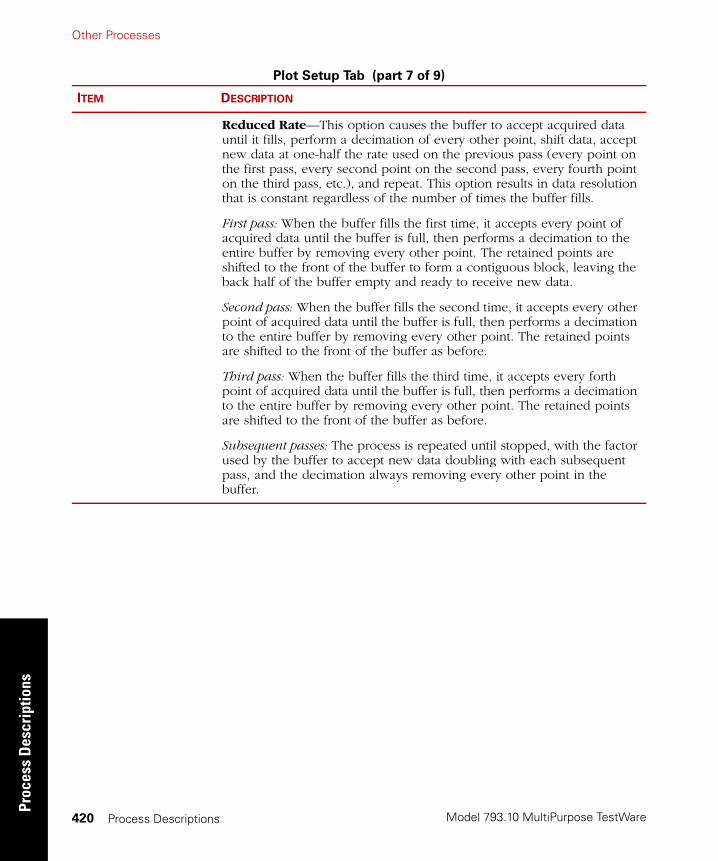
Model 793.10 MultiPurpose TestWare
Other ProcessesPr
oces
s D
escr
iptio
ns
Process Descriptions420
Reduced Rate—This option causes the buffer to accept acquired data until it fills, perform a decimation of every other point, shift data, accept new data at one-half the rate used on the previous pass (every point on the first pass, every second point on the second pass, every fourth point on the third pass, etc.), and repeat. This option results in data resolution that is constant regardless of the number of times the buffer fills.
First pass: When the buffer fills the first time, it accepts every point of acquired data until the buffer is full, then performs a decimation to the entire buffer by removing every other point. The retained points are shifted to the front of the buffer to form a contiguous block, leaving the back half of the buffer empty and ready to receive new data.
Second pass: When the buffer fills the second time, it accepts every other point of acquired data until the buffer is full, then performs a decimation to the entire buffer by removing every other point. The retained points are shifted to the front of the buffer as before.
Third pass: When the buffer fills the third time, it accepts every forth point of acquired data until the buffer is full, then performs a decimation to the entire buffer by removing every other point. The retained points are shifted to the front of the buffer as before.
Subsequent passes: The process is repeated until stopped, with the factor used by the buffer to accept new data doubling with each subsequent pass, and the decimation always removing every other point in the buffer.
Plot Setup Tab (part 7 of 9)
ITEM DESCRIPTION
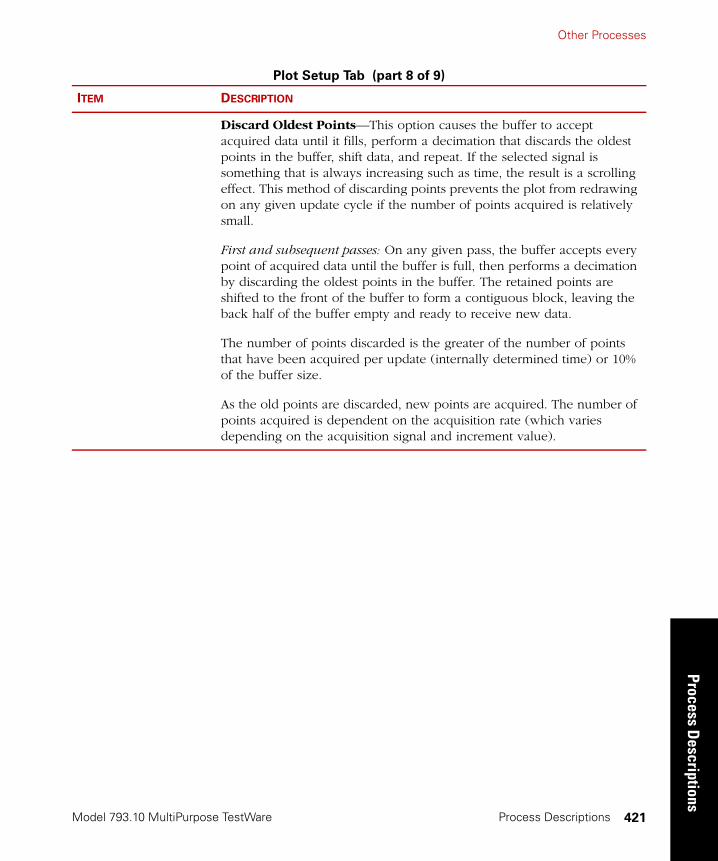
Other Processes
Model 793.10 MultiPurpose TestWare
Process Descriptions
Process Descriptions 421
Discard Oldest Points—This option causes the buffer to accept acquired data until it fills, perform a decimation that discards the oldest points in the buffer, shift data, and repeat. If the selected signal is something that is always increasing such as time, the result is a scrolling effect. This method of discarding points prevents the plot from redrawing on any given update cycle if the number of points acquired is relatively small.
First and subsequent passes: On any given pass, the buffer accepts every point of acquired data until the buffer is full, then performs a decimation by discarding the oldest points in the buffer. The retained points are shifted to the front of the buffer to form a contiguous block, leaving the back half of the buffer empty and ready to receive new data.
The number of points discarded is the greater of the number of points that have been acquired per update (internally determined time) or 10% of the buffer size.
As the old points are discarded, new points are acquired. The number of points acquired is dependent on the acquisition rate (which varies depending on the acquisition signal and increment value).
Plot Setup Tab (part 8 of 9)
ITEM DESCRIPTION
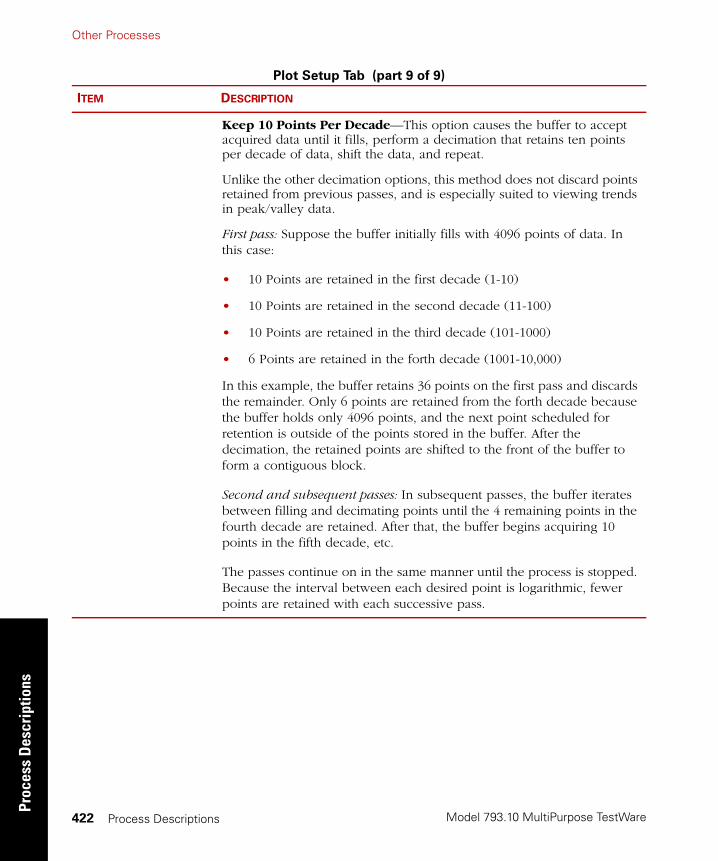
Model 793.10 MultiPurpose TestWare
Other ProcessesPr
oces
s D
escr
iptio
ns
Process Descriptions422
Keep 10 Points Per Decade—This option causes the buffer to accept acquired data until it fills, perform a decimation that retains ten points per decade of data, shift the data, and repeat.
Unlike the other decimation options, this method does not discard points retained from previous passes, and is especially suited to viewing trends in peak/valley data.
First pass: Suppose the buffer initially fills with 4096 points of data. In this case:
• 10 Points are retained in the first decade (1-10)
• 10 Points are retained in the second decade (11-100)
• 10 Points are retained in the third decade (101-1000)
• 6 Points are retained in the forth decade (1001-10,000)
In this example, the buffer retains 36 points on the first pass and discards the remainder. Only 6 points are retained from the forth decade because the buffer holds only 4096 points, and the next point scheduled for retention is outside of the points stored in the buffer. After the decimation, the retained points are shifted to the front of the buffer to form a contiguous block.
Second and subsequent passes: In subsequent passes, the buffer iterates between filling and decimating points until the 4 remaining points in the fourth decade are retained. After that, the buffer begins acquiring 10 points in the fifth decade, etc.
The passes continue on in the same manner until the process is stopped. Because the interval between each desired point is logarithmic, fewer points are retained with each successive pass.
Plot Setup Tab (part 9 of 9)
ITEM DESCRIPTION

Other Processes
Model 793.10 MultiPurpose TestWare
Process Descriptions
Process Descriptions 423
Acquisition tab This window lets you select the method with which the process acquires data to plot.
Acquisition Tab (part 1 of 3)
ITEM DESCRIPTION
Acquisition Method:
Peak/Valley The Peak/Valley Acquisition Method acquires data on slave signals when the software detects a peak or valley in the specified master signal. When selected, the application:
• Permits only channel count signals to display on the x-axis (the signal list on the X-Axis subtab of the Plot Setup tab will display only channel count signals).
• Displays two traces per selected y-axis signal (selected on the Y1-Axis and Y2-Axis subtabs of the Plot Setup tab); one displays peaks, the other displays valleys.
• Selects logarithmic scaling on the x-axis by default. You can change the scaling in the Properties window (right-click on the plot to access the Properties window).
When you select the Peak/Valley Acquisition Method, you must define the master signal and sensitivity.
Master Signal Selects a signal that determines when data is acquired.
Count
SensorSignal
Acquired Data Points
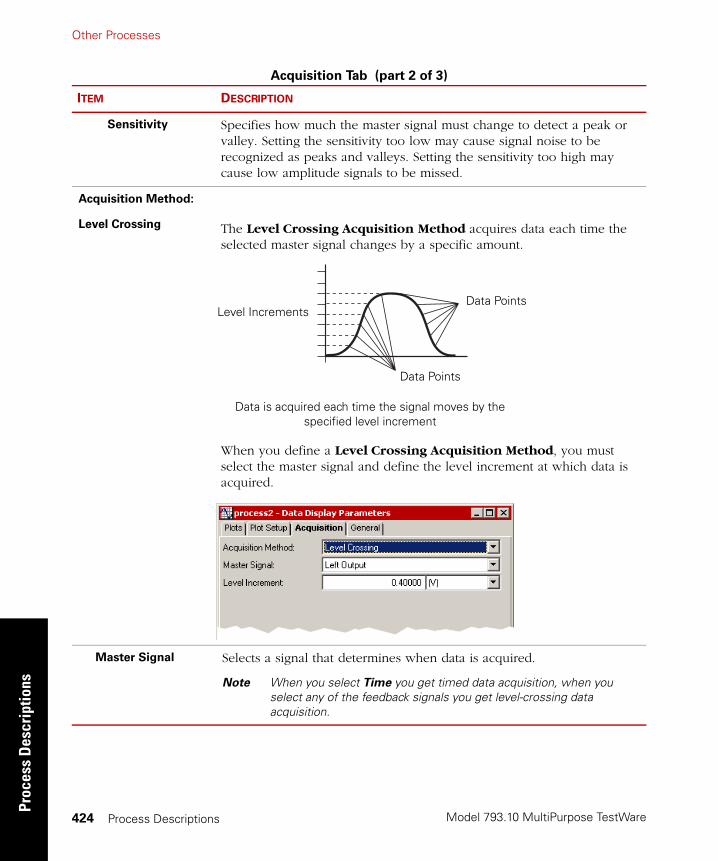
Model 793.10 MultiPurpose TestWare
Other ProcessesPr
oces
s D
escr
iptio
ns
Process Descriptions424
Sensitivity Specifies how much the master signal must change to detect a peak or valley. Setting the sensitivity too low may cause signal noise to be recognized as peaks and valleys. Setting the sensitivity too high may cause low amplitude signals to be missed.
Acquisition Method:
Level Crossing The Level Crossing Acquisition Method acquires data each time the selected master signal changes by a specific amount.
When you define a Level Crossing Acquisition Method, you must select the master signal and define the level increment at which data is acquired.
Master Signal Selects a signal that determines when data is acquired.
Note When you select Time you get timed data acquisition, when you select any of the feedback signals you get level-crossing data acquisition.
Acquisition Tab (part 2 of 3)
ITEM DESCRIPTION
Data PointsLevel Increments
Data Points
Data is acquired each time the signal moves by the specified level increment
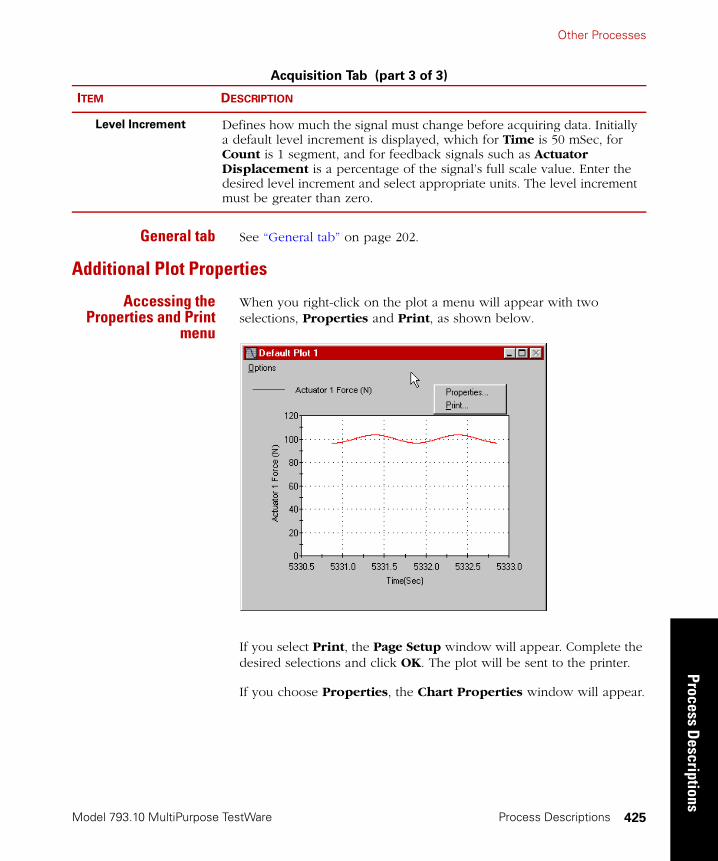
Other Processes
Model 793.10 MultiPurpose TestWare
Process Descriptions
Process Descriptions 425
General tab See “General tab” on page 202.
Additional Plot Properties
Accessing theProperties and Print
menu
When you right-click on the plot a menu will appear with two selections, Properties and Print, as shown below.
If you select Print, the Page Setup window will appear. Complete the desired selections and click OK. The plot will be sent to the printer.
If you choose Properties, the Chart Properties window will appear.
Level Increment Defines how much the signal must change before acquiring data. Initially a default level increment is displayed, which for Time is 50 mSec, for Count is 1 segment, and for feedback signals such as Actuator Displacement is a percentage of the signal’s full scale value. Enter the desired level increment and select appropriate units. The level increment must be greater than zero.
Acquisition Tab (part 3 of 3)
ITEM DESCRIPTION
Model 793.10 MultiPurpose TestWare
Other ProcessesPr
oces
s D
escr
iptio
ns
Process Descriptions426
Chart Properties Axesand Chart Properties
General Tabs
These windows (not shown) allow you to define various properties of the x and y axes, as well as colors and fonts for each plot. The selections in these windows take effect on the plot when you press OK.
Zooming Options You can zoom in on a plot’s axis by pressing the Shift key while holding down the left mouse button, and then moving the mouse to the area of interest and releasing the button.
You can zoom in on a part of the trace by pressing the Ctrl key while holding down the left mouse button, and then moving the mouse to the area of interest and releasing the button.
Return to default To return to the default plot display, press “r.” This will remove all interactive scaling and zooming.

Other Processes
Model 793.10 MultiPurpose TestWare
Process Descriptions
Process Descriptions 427
Working with the Data Display Process
Data DisplayCharacteristics
This process is used to view data. The data will not be saved to disk.
• Plots can be enabled and/or disabled.
• Plot settings can be saved.
• The plot will appear when the procedure is locked. Likewise, it will disappear when the procedure is unlocked.
Note To save the position of the plot window(s), you must save the procedure (’position’ refers to the location of the plot on your PC monitor). If you move the plot window from its default position and exit the procedure without saving, the plot window will appear in its default (or last saved) position.
1. Drag the icon from the Process Palette to your Group or
Procedure table.
2. Double-click the process icon on the table.
3. Click the Plots tab.
4. Select an existing plot or create a new plot.
A. Select an existing plot—Highlight the desired plot.
B. Create a new plot—Click one of the add plot buttons .
5. Enter a name for the plot in the Plot Title box.
6. Click the Plot Enabled check box to enable the plot. (If the box is not checked the plot will be disabled.)
7. Click the Acquisition tab.
8. Select an Acquisition Method.
Model 793.10 MultiPurpose TestWare
Other ProcessesPr
oces
s D
escr
iptio
ns
Process Descriptions428
9. If you select the Peak/Valley Acquisition Method:
A. Select a Master Signal from the pull down menu.
B. Select a Units type for the Sensitivity.
C. Enter the desired value for the Sensitivity.
If you select the Level Crossing Acquisition Method:
A. Select a Master Signal from the pull down menu.
B. Select a Units type for the Level Increment.
C. Enter the desired value for the Level Increment.
10. Click the Plot Setup tab.
11. Click the X-Axis tab.
12. Select the desired Signal.
13. Check the Show Values check box if you want the values to be displayed on the plot.
14. Select the desired Zero Offset setting.
15. Select the desired Units.
16. Enter the desired Initial Minimum and Initial Maximum values.
17. Click the Y1-Axis tab.
18. In the List Filter box, select the desired dimension category.
19. Double-click the individual signals you want to appear on the Y1-Axis.
20. For each signal included on the plot, define the Line Color and Line Style controls as desired, and enable the Show Values control as desired.
21. Click the Y2-Axis tab.
22. In the List Filter box, select the desired dimension category.
23. Double-click the individual signals you want to appear on the Y2-Axis.

Other Processes
Model 793.10 MultiPurpose TestWare
Process Descriptions
Process Descriptions 429
24. For each signal included on the plot, define the Line Color and Line Style controls as desired, and enable the Show Values control as desired.
25. Click the Options tab.
26. Check the Show Grid box if you want the grid to appear on the plot.
27. Check the Show Legend box if you want the legend to appear on the plot.
28. Check the Transpose X/Y Axes if you want to exchange the position of the axes.
29. Enter the desired buffer size.
30. Select the desired Decimation Option.
31. Click the General tab.
32. In the Name box, type a name for this process. (You can also name the process in the Procedure table.)
33. Select the Process Enabled check box. (If this box is cleared, the process will not execute.)
34. In the Execute Process box, type number of times you want the process to execute.
35. Optional—In the Counter Type list, click a counter type.
36. Optional—If you enabled a counter, type a Counter Label.
37. Close the parameters window, and set the desired Start and Interrupt signals for the process in the Group or Procedure table.
Model 793.10 MultiPurpose TestWare
Other ProcessesPr
oces
s D
escr
iptio
ns
Process Descriptions430
Defining AdditionalChart Properties
1. Right-click on the plot. The Chart Properties window will appear.
2. Click the Axis tab.
3. Select the desired Axis you wish to format.
4. Check the desired Auto formatting boxes and enter corresponding values for each.
5. Click Save Defaults if you want to save these settings as default settings.
6. Click the desired colors and font selections on the General tab.
Important The Graph Area Color and the Background Color must be different colors. Your text will not appear if they are the same color.
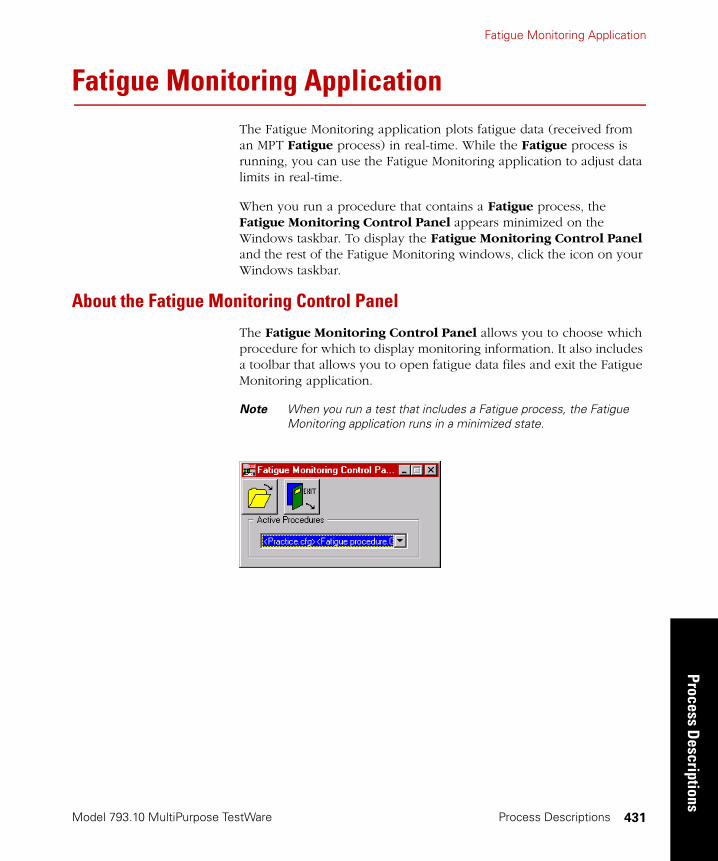
Fatigue Monitoring Application
Model 793.10 MultiPurpose TestWare
Process Descriptions
Process Descriptions 431
Fatigue Monitoring ApplicationThe Fatigue Monitoring application plots fatigue data (received from an MPT Fatigue process) in real-time. While the Fatigue process is running, you can use the Fatigue Monitoring application to adjust data limits in real-time.
When you run a procedure that contains a Fatigue process, the Fatigue Monitoring Control Panel appears minimized on the Windows taskbar. To display the Fatigue Monitoring Control Panel and the rest of the Fatigue Monitoring windows, click the icon on your Windows taskbar.
About the Fatigue Monitoring Control Panel
The Fatigue Monitoring Control Panel allows you to choose which procedure for which to display monitoring information. It also includes a toolbar that allows you to open fatigue data files and exit the Fatigue Monitoring application.
Note When you run a test that includes a Fatigue process, the Fatigue Monitoring application runs in a minimized state.
Model 793.10 MultiPurpose TestWare
Fatigue Monitoring ApplicationPr
oces
s D
escr
iptio
ns
Process Descriptions432
About the Fatigue Monitoring Window
The Fatigue Monitoring window consists of your fatigue plot, a channel selection box, and a toolbar. If you are running a new procedure, the Procedure File View displays. If you open an existing data file, the Data File View displays.
The current damage values and limit settings are displayed on the data plot. If you are creating a new process, the system will plot only the first channel in the list by default.
Note If just one fatigue value has been plotted, and you have specified limits, the limits are also displayed on the plot. If multiple values are plotted, the limits are not displayed.
Fatigue Monitoring Control Panel
ITEM DESCRIPTION
Opens the Open Fatigue Data File window.
You use this window to open an existing fatigue data file and display its contents. If a data file has been opened before, the display will be updated to show the new fatigue data.
Quits the Fatigue Monitoring application.
Note If data has already been received, a message will prompt you to confirm the Exit command.
Active Procedures Specifies a procedure to display.
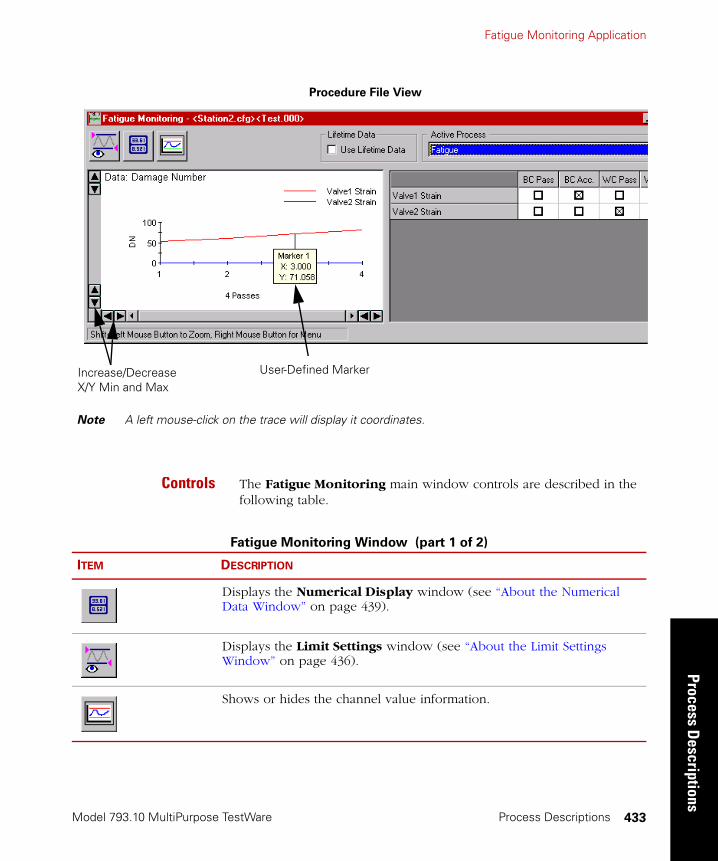
Fatigue Monitoring Application
Model 793.10 MultiPurpose TestWare
Process Descriptions
Process Descriptions 433
Controls The Fatigue Monitoring main window controls are described in the following table.
Procedure File View
Increase/Decrease X/Y Min and Max
User-Defined Marker
Note A left mouse-click on the trace will display it coordinates.
Fatigue Monitoring Window (part 1 of 2)
ITEM DESCRIPTION
Displays the Numerical Display window (see “About the Numerical Data Window” on page 439).
Displays the Limit Settings window (see “About the Limit Settings Window” on page 436).
Shows or hides the channel value information.

Model 793.10 MultiPurpose TestWare
Fatigue Monitoring ApplicationPr
oces
s D
escr
iptio
ns
Process Descriptions434
Active Process Selects the process or file to view. You can have multiple processes or multiple files per window.
Lifetime Data Displays “percentage of lifetime” instead of damage number.
Channel Selection Specifies the damage value plotted for a particular signal. Up to six different values can be plotted at the same time.
• Clicking the Pass/Acc. button at the head of a column selects the top six values in that column.
• Clicking on the channel name selects all damage values for this channel.
• To select values randomly (for example, Channel 1 BC Pass and Channel 2 WC Acc), press the Ctrl key while clicking on the check boxes.
Fatigue Monitoring Window (part 2 of 2)
ITEM DESCRIPTION
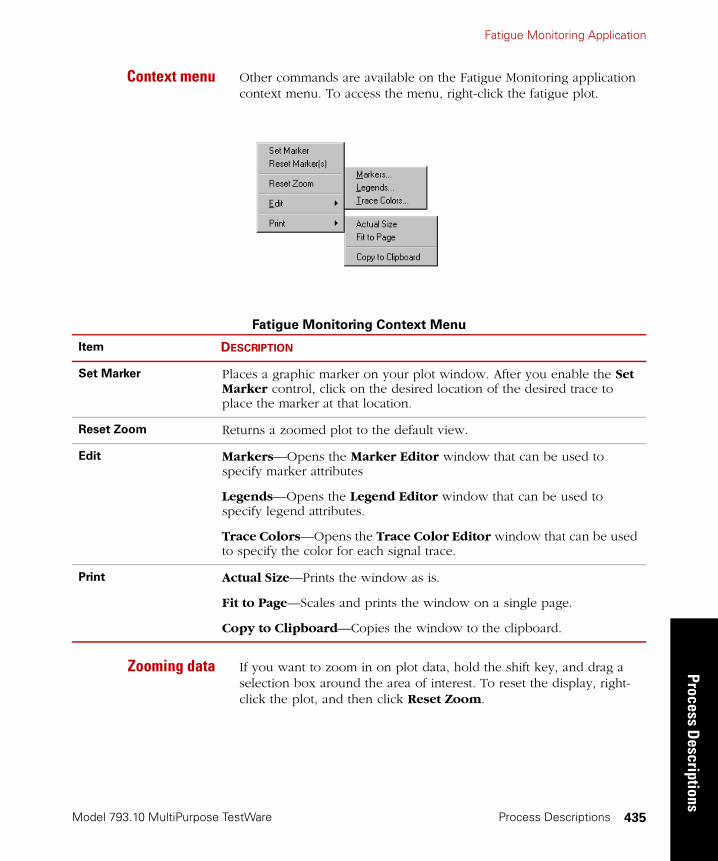
Fatigue Monitoring Application
Model 793.10 MultiPurpose TestWare
Process Descriptions
Process Descriptions 435
Context menu Other commands are available on the Fatigue Monitoring application context menu. To access the menu, right-click the fatigue plot.
Zooming data If you want to zoom in on plot data, hold the shift key, and drag a selection box around the area of interest. To reset the display, right-click the plot, and then click Reset Zoom.
Fatigue Monitoring Context Menu
Item DESCRIPTION
Set Marker Places a graphic marker on your plot window. After you enable the Set Marker control, click on the desired location of the desired trace to place the marker at that location.
Reset Zoom Returns a zoomed plot to the default view.
Edit Markers—Opens the Marker Editor window that can be used to specify marker attributes
Legends—Opens the Legend Editor window that can be used to specify legend attributes.
Trace Colors—Opens the Trace Color Editor window that can be used to specify the color for each signal trace.
Print Actual Size—Prints the window as is.
Fit to Page—Scales and prints the window on a single page.
Copy to Clipboard—Copies the window to the clipboard.
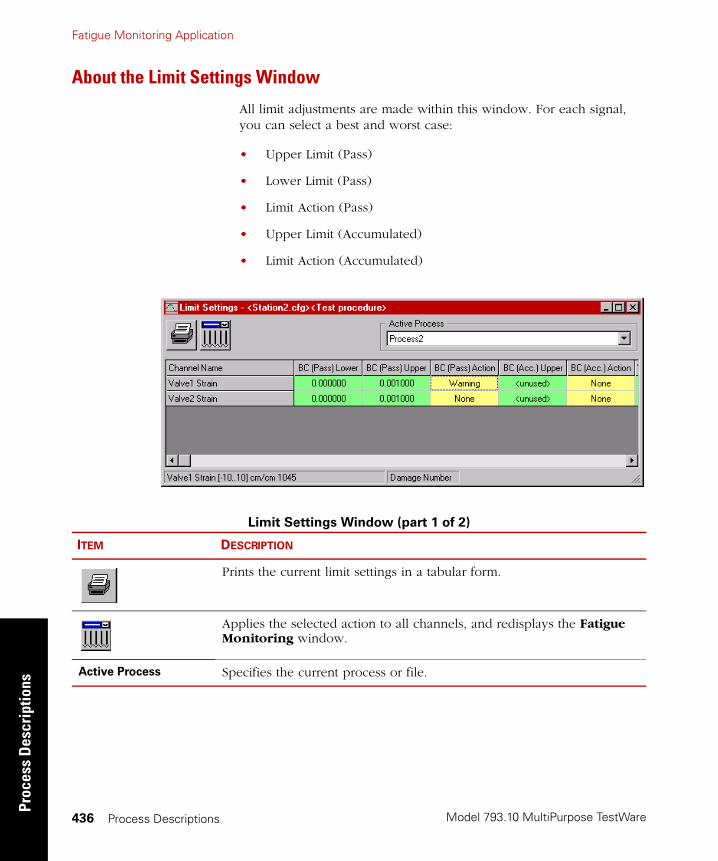
Model 793.10 MultiPurpose TestWare
Fatigue Monitoring ApplicationPr
oces
s D
escr
iptio
ns
Process Descriptions436
About the Limit Settings Window
All limit adjustments are made within this window. For each signal, you can select a best and worst case:
• Upper Limit (Pass)
• Lower Limit (Pass)
• Limit Action (Pass)
• Upper Limit (Accumulated)
• Limit Action (Accumulated)
Limit Settings Window (part 1 of 2)
ITEM DESCRIPTION
Prints the current limit settings in a tabular form.
Applies the selected action to all channels, and redisplays the Fatigue Monitoring window.
Active Process Specifies the current process or file.

Fatigue Monitoring Application
Model 793.10 MultiPurpose TestWare
Process Descriptions
Process Descriptions 437
Upper/Lower Limit
values for channels
For a data file: Displays the limit values.
For a procedure file: Displays editable limit values. To edit them, double-click a value, then type the new value. Press the Enter key to accept changes.
Limit Action For a data file: Displays the action settings.
For a procedure file: Displays editable action settings. To change a setting, double-click it. A list appears with the following options:
None—Limit is disabled.
Warning—A warning message is issued and a message is written to the MPT Specimen Log.
Stop—The process stops and a message is written in the MPT Specimen Log.
Trigger—The process triggers another process.
Status bar Displays the name, full scale and dimensions of the selected channel.
Limit Settings Window (part 2 of 2)
ITEM DESCRIPTION
Model 793.10 MultiPurpose TestWare
Fatigue Monitoring ApplicationPr
oces
s D
escr
iptio
ns
Process Descriptions438
About best case/worst case
The terms “worst case” and “best case” refer to the methods MPT uses to analyze each histogram bin. Each histogram bin has an associated cycle count that increments whenever a data value occurs within the bin boundaries. Therefore, when analyzing the damage content of a histogram, the MPT analysis assumes a maximum or minimum bin value for each cycle that is counted. The bin size (resolution) affects the best case/worst case answers. The larger the bin size, the larger the potential for errors in the damage calculations. In general, assuming maximum values for a bin results in a maximum damage (worst case) scenario. Likewise, assuming minimum values for a bin results in a minimum damage (best case) scenario.
Worst case “Worst case” assumes that the cycles in the bin have the largest range and tensile mean (for strain life and generic stress life damage models) and that the cycles “hang” from the bounding hysteresis loop in a way that yields the maximum (tensile) mean stress (for strain life damage models only).
Best case “Best case” assumes that the cycles in the bin have the smallest range and tensile mean (for strain life and generic stress life damage models) and that the cycles “hang” from the bounding hysteresis loop in a way that yields the minimum (tensile) mean stress (for strain life damage models only).

Fatigue Monitoring Application
Model 793.10 MultiPurpose TestWare
Process Descriptions
Process Descriptions 439
About the Numerical Data Window
The Numerical Data window displays the current or past values for all damage data for one pass. This view is updated with the data of a new pass only when the last pass is displayed. If you use the pass slider to look at a previous pass, this view will not change when new pass data is received. You can use the slider again or click on the pass number field to display the latest pass.
Red or purple numbers in the numerical data boxes indicate that these values are outside the defined limits. Red denotes “upper limit tripped” and purple denotes “lower limit tripped.”
Numerical Data Window
ITEM DESCRIPTION
Prints the current limit settings in a tabular form.
Pass Selects the pass for which you want to display data.
To show numerical data for a particular pass, enter the desired pass number, and then press return.
Active Process Specifies the desired process or file.
Status bar Displays the name, full scale and dimensions of the selected channel.

Model 793.10 MultiPurpose TestWare
Trend Monitoring ApplicationPr
oces
s D
escr
iptio
ns
Process Descriptions440
Trend Monitoring ApplicationThe Trend Monitoring application plots trend data (received from an MPT Trend process) in real-time. While the Trend process is running, you can use the Trend Monitoring application to adjust limits in real-time.
Note Limit changes are transmitted back to the MPT application which does the actual limit-checking.
When you run a procedure that contains a Trend process, the Trend Monitoring Control Panel appears minimized on the Windows taskbar. To display the Trend Monitoring Control Panel and the rest of the Trend Monitoring windows, click the icon on your Windows taskbar.
About the Trend Monitoring Control Panel
The Trend Monitoring Control Panel allows you to choose which procedure for which to display trend information. It also includes a toolbar that allows you to open trend data files and exit the Trend Monitoring application.
Trend Monitoring Application
Model 793.10 MultiPurpose TestWare
Process Descriptions
Process Descriptions 441
Trend Monitoring Control Panel
ITEM DESCRIPTION
Displays the Open Trend Data File window:
You use this window to open an existing trend data file and display its contents. If a data file has been opened before, the display will be updated to show the new trend data.
Quits the Trend Monitoring application.
Note If data has already been received, a message will prompt you to confirm the Exit command.
Active Procedures Specifies a procedure to display.
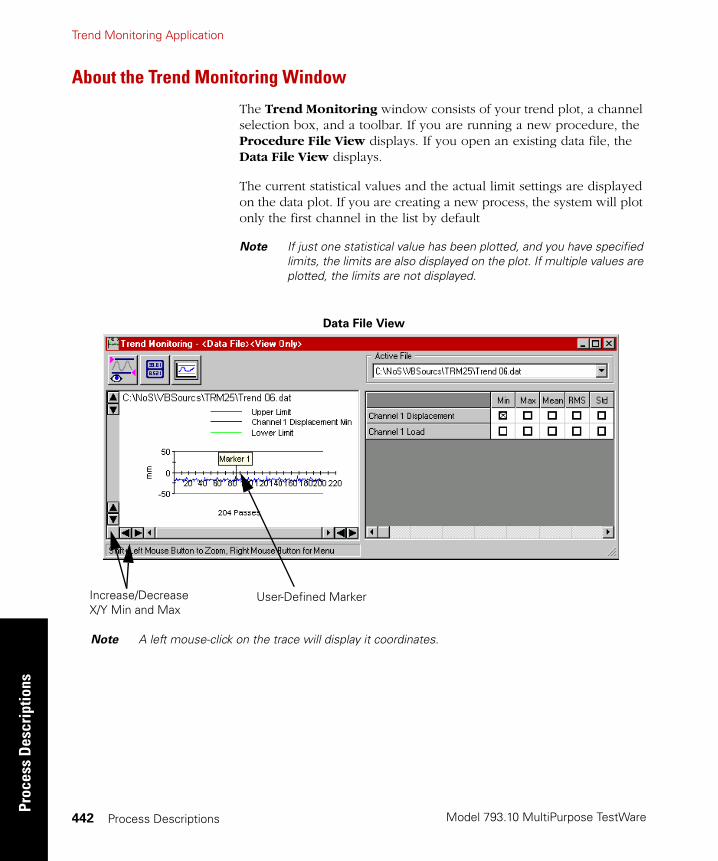
Model 793.10 MultiPurpose TestWare
Trend Monitoring ApplicationPr
oces
s D
escr
iptio
ns
Process Descriptions442
About the Trend Monitoring Window
The Trend Monitoring window consists of your trend plot, a channel selection box, and a toolbar. If you are running a new procedure, the Procedure File View displays. If you open an existing data file, the Data File View displays.
The current statistical values and the actual limit settings are displayed on the data plot. If you are creating a new process, the system will plot only the first channel in the list by default
Note If just one statistical value has been plotted, and you have specified limits, the limits are also displayed on the plot. If multiple values are plotted, the limits are not displayed.
Data File View
Increase/Decrease X/Y Min and Max
User-Defined Marker
Note A left mouse-click on the trace will display it coordinates.

Trend Monitoring Application
Model 793.10 MultiPurpose TestWare
Process Descriptions
Process Descriptions 443
Controls The Trend Monitoring main window controls are described in the following table.
Trend Monitoring Window
ITEM DESCRIPTION
Displays the Numerical Display window (see “About the Numerical Data Window” on page 447).
Displays the Limit Settings window (see “About the Limit Settings Window” on page 445).
Shows or hides the channel selection information.
Active Process Selects the process or file to view. You can have multiple processes or multiple files per window.
Channel Selection Specifies the statistical value plotted for that signal. Up to five different values (Min, Max, Mean, RMS, Std.) can be plotted at the same time.
• Clicking the Pass/Acc. button at the head of a column selects the top six values in that column.
• Clicking on the channel name selects all statistical values for this channel. (Note that the scaling of the Y-axis on the plot changes to percentage of full scale if more than one value is selected.)
• If you want to select values randomly, press the Ctrl key while clicking on the check boxes.
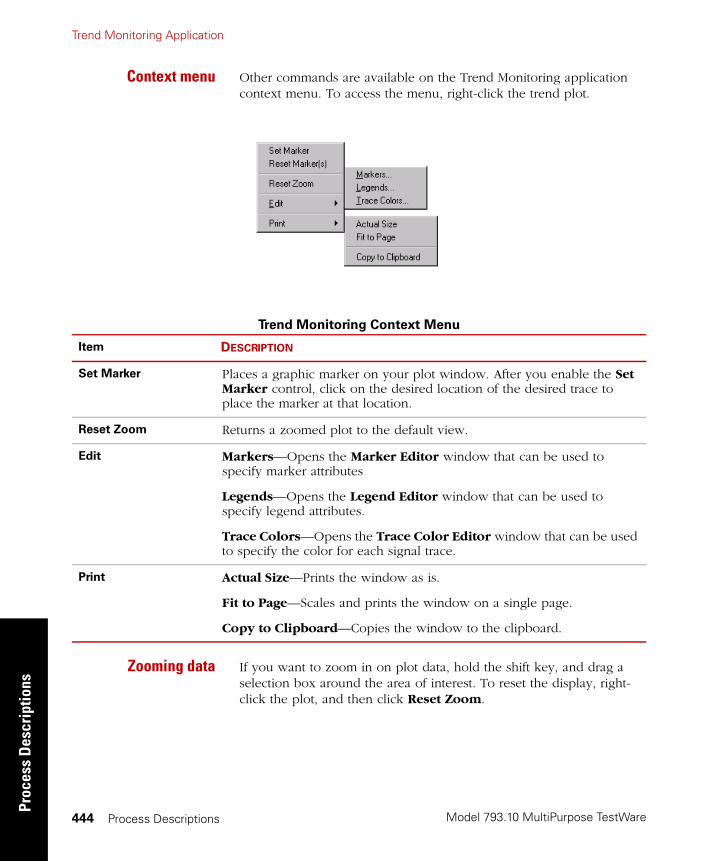
Model 793.10 MultiPurpose TestWare
Trend Monitoring ApplicationPr
oces
s D
escr
iptio
ns
Process Descriptions444
Context menu Other commands are available on the Trend Monitoring application context menu. To access the menu, right-click the trend plot.
Zooming data If you want to zoom in on plot data, hold the shift key, and drag a selection box around the area of interest. To reset the display, right-click the plot, and then click Reset Zoom.
Trend Monitoring Context Menu
Item DESCRIPTION
Set Marker Places a graphic marker on your plot window. After you enable the Set Marker control, click on the desired location of the desired trace to place the marker at that location.
Reset Zoom Returns a zoomed plot to the default view.
Edit Markers—Opens the Marker Editor window that can be used to specify marker attributes
Legends—Opens the Legend Editor window that can be used to specify legend attributes.
Trace Colors—Opens the Trace Color Editor window that can be used to specify the color for each signal trace.
Print Actual Size—Prints the window as is.
Fit to Page—Scales and prints the window on a single page.
Copy to Clipboard—Copies the window to the clipboard.

Trend Monitoring Application
Model 793.10 MultiPurpose TestWare
Process Descriptions
Process Descriptions 445
About the Limit Settings Window
All limit adjustments are made within this window. For each channel, you can select Lower Limit, Upper Limit, and Limit Action.
Limit Settings Window (part 1 of 2)
ITEM DESCRIPTION
Prints the current limit settings in a tabular form.
Applies the selected action to all channels, and redisplays the Trend Monitoring window.
Active Process Selects the desired process or file.

Model 793.10 MultiPurpose TestWare
Trend Monitoring ApplicationPr
oces
s D
escr
iptio
ns
Process Descriptions446
Upper/Lower Limit For a data file: Displays the limit values.
For a procedure file: Displays editable limit values. To edit them, double-click a value, then type the new value. Press the Enter key to accept changes.
Limit Action For a data file: Displays the action settings.
For a procedure: Displays editable action settings. To change a setting, double-click it. A list appears with the following options:
None—Limit is disabled.
Warning—A warning message is issued and a message is written to the MPT Message Log.
Stop—The process stops and a message is written in the MPT Message Log.
Trigger—The process triggers another process.
Status bar Displays the name, dimensions, and full scale of the selected channel.
Limit Settings Window (part 2 of 2)
ITEM DESCRIPTION
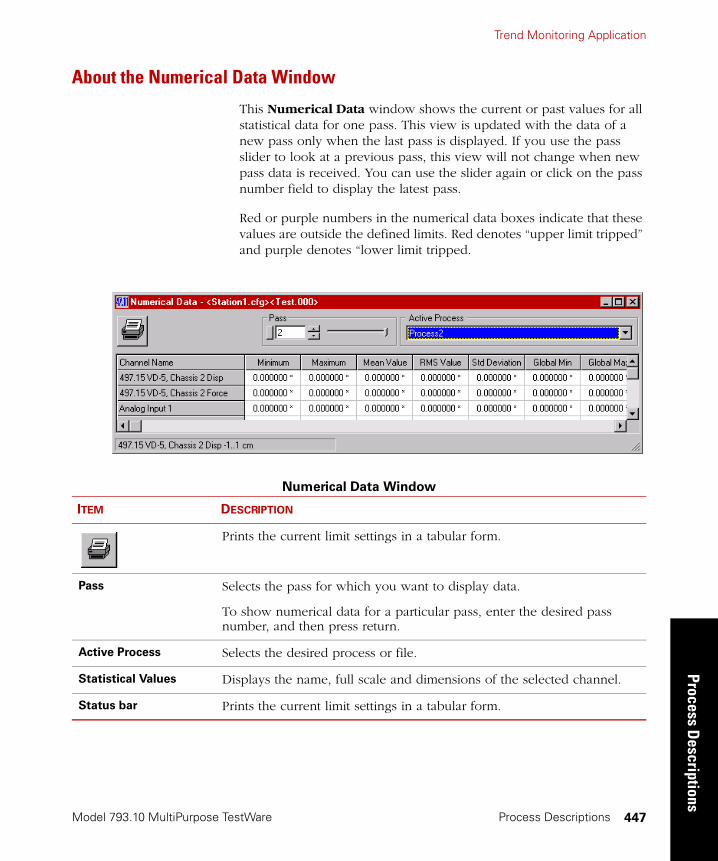
Trend Monitoring Application
Model 793.10 MultiPurpose TestWare
Process Descriptions
Process Descriptions 447
About the Numerical Data Window
This Numerical Data window shows the current or past values for all statistical data for one pass. This view is updated with the data of a new pass only when the last pass is displayed. If you use the pass slider to look at a previous pass, this view will not change when new pass data is received. You can use the slider again or click on the pass number field to display the latest pass.
Red or purple numbers in the numerical data boxes indicate that these values are outside the defined limits. Red denotes “upper limit tripped” and purple denotes “lower limit tripped.
Numerical Data Window
ITEM DESCRIPTION
Prints the current limit settings in a tabular form.
Pass Selects the pass for which you want to display data.
To show numerical data for a particular pass, enter the desired pass number, and then press return.
Active Process Selects the desired process or file.
Statistical Values Displays the name, full scale and dimensions of the selected channel.
Status bar Prints the current limit settings in a tabular form.

Model 793.10 MultiPurpose TestWare
Trend Monitoring ApplicationPr
oces
s D
escr
iptio
ns
Process Descriptions448
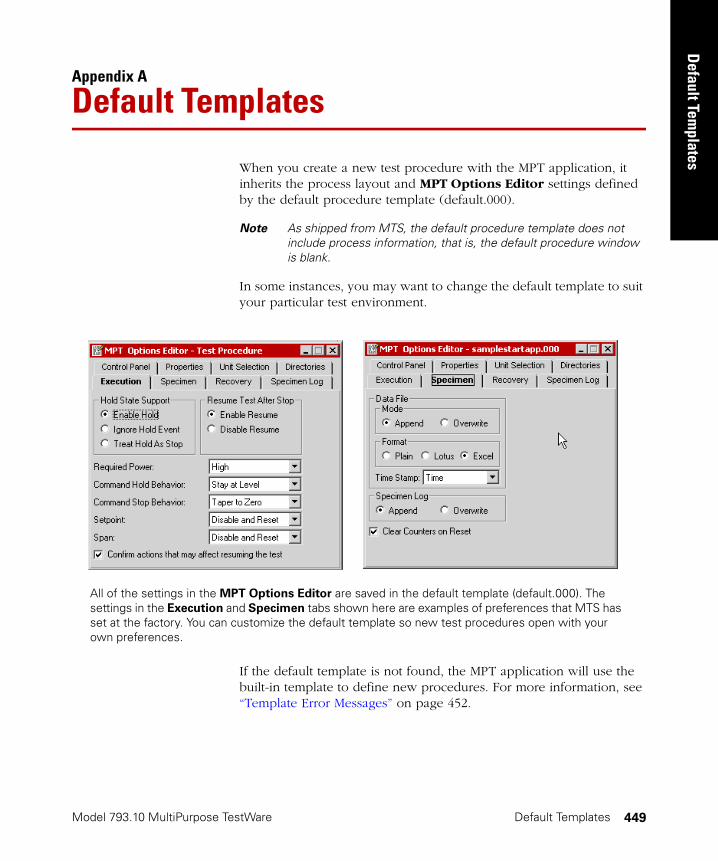
Model 793.10 MultiPurpose TestWare
Default Tem
plates
Default Templates 449
Appendix A
Default Templates
When you create a new test procedure with the MPT application, it inherits the process layout and MPT Options Editor settings defined by the default procedure template (default.000).
Note As shipped from MTS, the default procedure template does not include process information, that is, the default procedure window is blank.
In some instances, you may want to change the default template to suit your particular test environment.
If the default template is not found, the MPT application will use the built-in template to define new procedures. For more information, see “Template Error Messages” on page 452.
All of the settings in the MPT Options Editor are saved in the default template (default.000). The settings in the Execution and Specimen tabs shown here are examples of preferences that MTS has set at the factory. You can customize the default template so new test procedures open with your own preferences.
Model 793.10 MultiPurpose TestWare
Customizing a Default TemplateD
efau
lt Te
mpl
ates
Default Templates450
Customizing a Default TemplateYou can change the settings and processes defined by the default template to suit your particular test environment.
How to Customize the Default Template
1. In Station Manager, from the Applications menu, select MPT.
2. From the MPT file icon pull-down menu, click Open Procedure.
3. In the Open Procedure window, right-click the default.000 file, and then click Properties.
4. In the Properties window, clear the Read Only check box, and then click OK.
5. In the Open Procedure window, double-click the default.000 file to open it.
6. On the MPT control panel toolbar (or the MPT Procedure Editor), click the MPT Options Editor icon. Customize the settings on each tab as desired. (These settings will be used by new tests.)
Note When shipped, the default.000 file does not contain process information—that is, the procedure table is blank. If you add processes to the default.000 file, new test procedures will open with those processes preloaded in the procedure window.
7. From the MPT file icon pull-down menu, click Save Procedure to save the customized default template. This new customized template will be used when creating any new procedures.
8. Close the file.
9. From the MPT file icon pull-down menu, click Open Procedure.
10. In the Open Procedure window, right-click the default.000 file, and then click Properties.
11. In the Properties window, select the Read Only check box, and then click OK. This protects the new custom template from being inadvertently changed.
Using Multiple Default Templates
Model 793.10 MultiPurpose TestWare
Default Tem
plates
Default Templates 451
Using Multiple Default TemplatesYou may create multiple unique default templates for your testing needs. However, each template must be named default.000, and must be stored in a separate directory—you cannot save more than one default.000 file in a given directory.
How to Create and Use Multiple Default Templates
1. Open your current default template (default.000).
2. Modify the default template as desired.
3. From the MPT file icon pull-down menu, click Save Procedure As.
4. Use the Save Procedure As window to save the file to a different directory, with the label default.000. (All default templates must be named default.000.)
If you want MPT to use the alternate default template:
1. On the MPT control panel toolbar, click the MPT Options Editor icon.
2. Click the Directories tab, and then click Template Files.
3. Use the directory controls to locate the folder where your new default template is saved, and then click Set Default to update the registry with the new default template location.
The alternate default template will be used for the next procedure you create. MPT will always use the default template that has been assigned in the Directories tab of the MPT Options Editor.
Note It is good practice to designate your default templates as “read only” so they cannot be inadvertently changed.

Model 793.10 MultiPurpose TestWare
Template Error MessagesD
efau
lt Te
mpl
ates
Default Templates452
Template Error MessagesMPT displays various error messages if it cannot locate a default template file.
The built-in template If MPT cannot locate the default template, it will display a default error message, and create a procedure based on its built-in template.
The built-in template uses factory-set preferences that cannot be changed.
If the default template has been misplaced in another directory, you can use the file browser in the Directories tab of the MPT Options Editor to find the file. Once you locate the default template you can relink it to the MPT application.
If the default template has been deleted, you can create a new procedure with the desired attributes and save it as “Default.000.”
When you start MPT The following message is displayed when you start the MPT application and MPT cannot find a default.000 file in the directory specified on the Directories tab:
When you click OK, MPT will use its own built-in template to open a test procedure.
When you select Newafter opening a
procedure
The following message is displayed in the event you open a test procedure, select New from the File menu, and the MPT application cannot find a default.000 file in the path specified for template files:
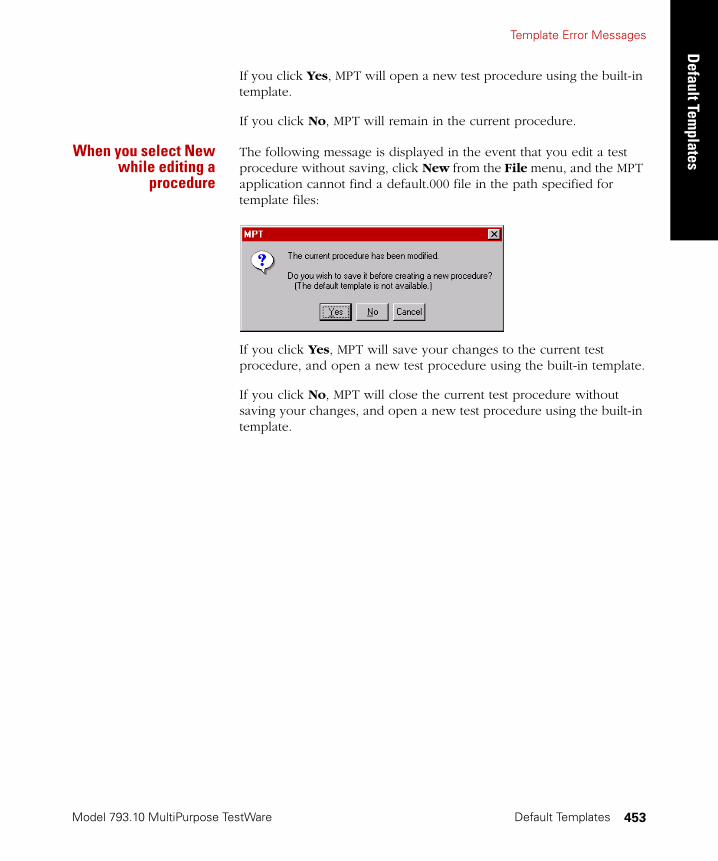
Template Error Messages
Model 793.10 MultiPurpose TestWare
Default Tem
plates
Default Templates 453
If you click Yes, MPT will open a new test procedure using the built-in template.
If you click No, MPT will remain in the current procedure.
When you select Newwhile editing a
procedure
The following message is displayed in the event that you edit a test procedure without saving, click New from the File menu, and the MPT application cannot find a default.000 file in the path specified for template files:
If you click Yes, MPT will save your changes to the current test procedure, and open a new test procedure using the built-in template.
If you click No, MPT will close the current test procedure without saving your changes, and open a new test procedure using the built-in template.

Model 793.10 MultiPurpose TestWare
Template Error MessagesD
efau
lt Te
mpl
ates
Default Templates454

New Technical Manual Template
Excel File Converter
Excel File Converter 455
Appendix B
Excel File Converter
The MTS Excel File Converter is a utility that optimizes MPT data files for viewing with Microsoft® Excel.
Note For more information on MPT data files, see “Specimen.dat” on page 74.
When this utility is installed and enabled, Microsoft Excel can interpret MultiPurpose TestWare (and Basic TestWare) data files more intelligently than it normally interprets text files.
For example, the MTS Excel File Converter can be used to:
• Permit loading an unlimited number of rows of data—up to the memory capacity of your system. (Microsoft Excel has a limit of 65,535 rows of data on each sheet.) The converter splits the data into multiple sheets.
• Scan the data file for certain labels and use smart processing to determine when data should be written to a new worksheet. (This keeps your data organized more efficiently.)
• Enable .dat, .t31, and .f31 files to be browsed and opened directly from the Microsoft Excel Open window.
Compatible data fileformats
The Excel File Converter works best with tab-delimited data files (Excel format). If you want to use the Excel File Converter, you should make sure your data files are written in the Excel format. For more information on specifying your data file format, see “Formatting the data in the MPT specimen data file” on page 75.
Comma-delimited data files (Lotus format) can be processed by the converter, but the format of the resulting spreadsheet may not be desirable. Space-delimited data files (Plain format) will not be processed by the converter.
Note Files in "Lotus" format will be read in, but the format of the resulting spreadsheet may not be desirable. If your Windows operating system’s regional settings specify that decimal points should be commas (as is typical in parts of Europe) the "Lotus" format will not be readable. Use the "Excel" format whenever possible.

New Technical Manual Template
Exce
l File
Con
vert
er
Excel File Converter456
How to Install the Excel File Converter
The Excel File Converter is included with the Model 793.00 System Software. During the system software installation, you will asked if you want to install the MTS Excel File Converter.
If you did not install it during the main software installation, insert the Model 793.00 System Software disc into your CD-ROM drive and follow these steps:
1. Follow this path using Windows NT Explorer:
Your CD-ROM drive > Excel Converter > Setup.exe
The following window appears:
2. Click Yes.
3. In the Select Directory window, specify the location for the MTS Excel File Converter utility, and then click Next.
4. Click OK to acknowledge a successful installation.
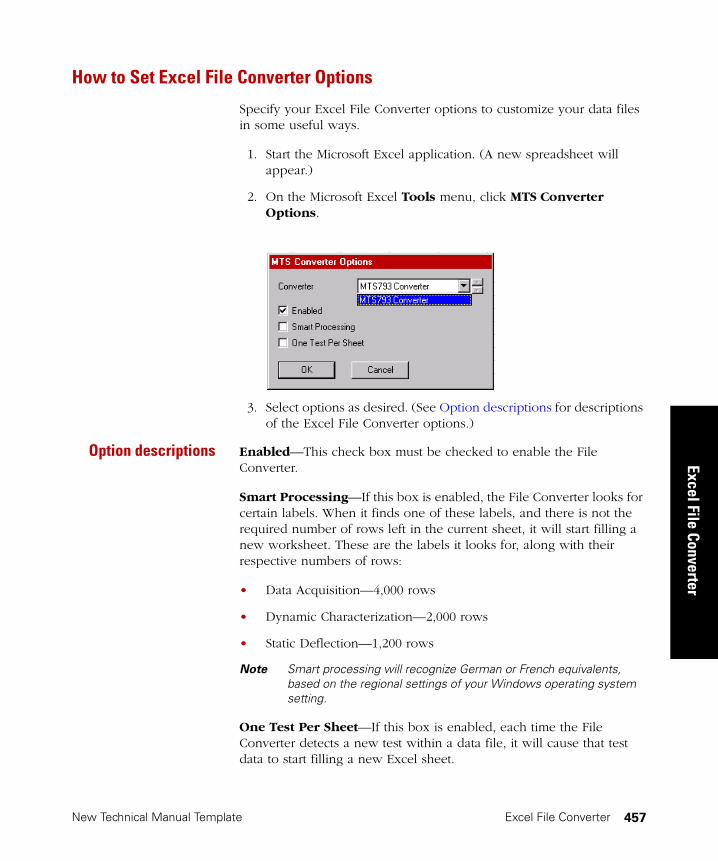
New Technical Manual Template
Excel File Converter
Excel File Converter 457
How to Set Excel File Converter Options
Specify your Excel File Converter options to customize your data files in some useful ways.
1. Start the Microsoft Excel application. (A new spreadsheet will appear.)
2. On the Microsoft Excel Tools menu, click MTS Converter Options.
3. Select options as desired. (See Option descriptions for descriptions of the Excel File Converter options.)
Option descriptions Enabled—This check box must be checked to enable the File Converter.
Smart Processing—If this box is enabled, the File Converter looks for certain labels. When it finds one of these labels, and there is not the required number of rows left in the current sheet, it will start filling a new worksheet. These are the labels it looks for, along with their respective numbers of rows:
• Data Acquisition—4,000 rows
• Dynamic Characterization—2,000 rows
• Static Deflection—1,200 rows
Note Smart processing will recognize German or French equivalents, based on the regional settings of your Windows operating system setting.
One Test Per Sheet—If this box is enabled, each time the File Converter detects a new test within a data file, it will cause that test data to start filling a new Excel sheet.
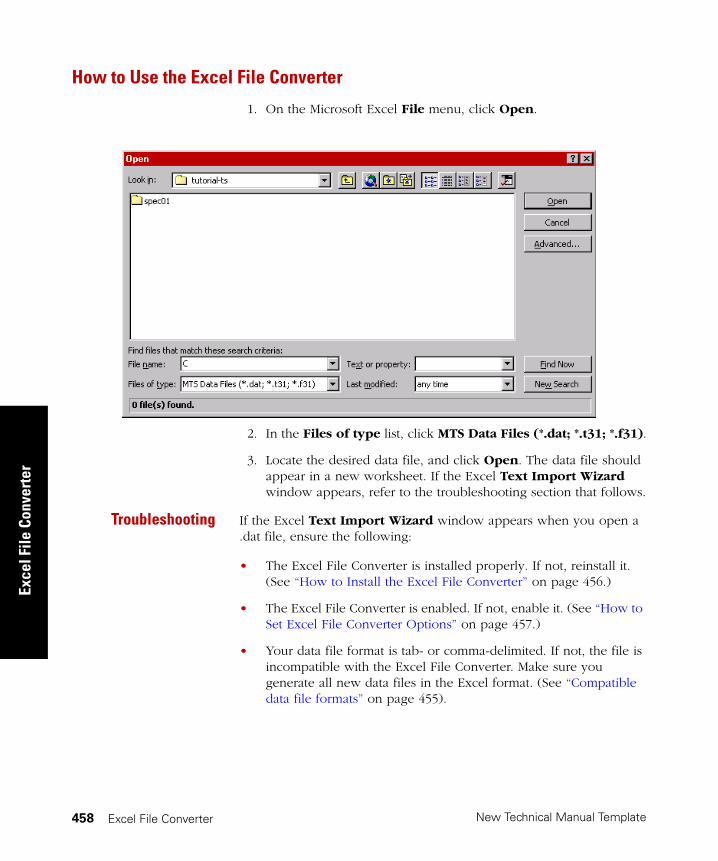
New Technical Manual Template
Exce
l File
Con
vert
er
Excel File Converter458
How to Use the Excel File Converter
1. On the Microsoft Excel File menu, click Open.
2. In the Files of type list, click MTS Data Files (*.dat; *.t31; *.f31).
3. Locate the desired data file, and click Open. The data file should appear in a new worksheet. If the Excel Text Import Wizard window appears, refer to the troubleshooting section that follows.
Troubleshooting If the Excel Text Import Wizard window appears when you open a .dat file, ensure the following:
• The Excel File Converter is installed properly. If not, reinstall it. (See “How to Install the Excel File Converter” on page 456.)
• The Excel File Converter is enabled. If not, enable it. (See “How to Set Excel File Converter Options” on page 457.)
• Your data file format is tab- or comma-delimited. If not, the file is incompatible with the Excel File Converter. Make sure you generate all new data files in the Excel format. (See “Compatible data file formats” on page 455).

Model 793.10 MultiPurpose TestWare
Profiles
Profiles 459
Appendix C
Profiles
About Profiles 460
Creating Profiles 462
General Profile Syntax Requirements 463
Block-Arbitrary Profile Example 471
Phase Profile Example 473
About Cycle and Segment Behavior 475
About Transitions 477
Working with Dimensions 480

Model 793.10 MultiPurpose TestWare
About ProfilesPr
ofile
s
Profiles460
About ProfilesA profile is an ASCII text file that defines a series of command elements in a spreadsheet-style (or grid-style) format.
A profile grid contains a number of rows, with each row defining a single command element. Command elements may be a single segment or series of segments (cycles). Each segment or cycle is defined by its waveshape, end levels, rate type (time, frequency, or rate), and count.
A single profile can (and often does) contain the command content of an entire procedure.
Sample Profile Grid
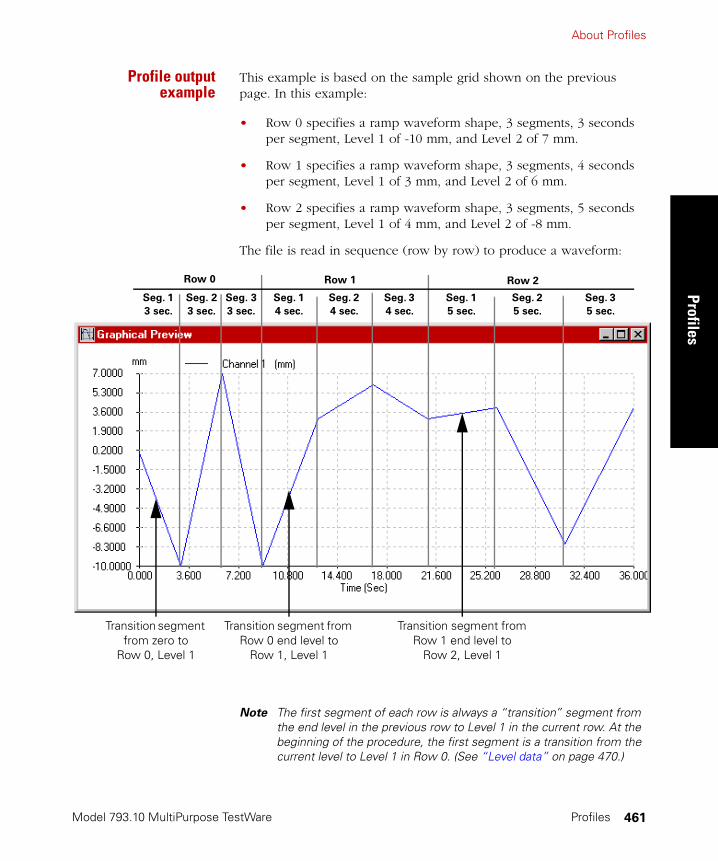
About Profiles
Model 793.10 MultiPurpose TestWare
Profiles
Profiles 461
Profile outputexample
This example is based on the sample grid shown on the previous page. In this example:
• Row 0 specifies a ramp waveform shape, 3 segments, 3 seconds per segment, Level 1 of -10 mm, and Level 2 of 7 mm.
• Row 1 specifies a ramp waveform shape, 3 segments, 4 seconds per segment, Level 1 of 3 mm, and Level 2 of 6 mm.
• Row 2 specifies a ramp waveform shape, 3 segments, 5 seconds per segment, Level 1 of 4 mm, and Level 2 of -8 mm.
The file is read in sequence (row by row) to produce a waveform:
Note The first segment of each row is always a “transition” segment from the end level in the previous row to Level 1 in the current row. At the beginning of the procedure, the first segment is a transition from the current level to Level 1 in Row 0. (See “Level data” on page 470.)
Seg. 3
3 sec.
Seg. 3
4 sec.
Seg. 1
5 sec.
Seg. 2
5 sec.
Seg. 3
5 sec.
Seg. 1
4 sec.
Seg. 2
4 sec.
Seg. 2
3 sec.
Seg. 1
3 sec.
Transition segment from zero to
Row 0, Level 1
Transition segment from Row 0 end level to
Row 1, Level 1
Transition segment from Row 1 end level to
Row 2, Level 1
Row 0 Row 1 Row 2
Model 793.10 MultiPurpose TestWare
Creating ProfilesPr
ofile
s
Profiles462
Creating ProfilesThe MPT Profile Command and Profile with ALC processes support block-arbitrary profiles and phase profiles.
You can create a profile using one of the following tools:
• A text editor
• A spreadsheet application
• The MTS Model 793.11 Profile Editor application
Block-arbitraryprofiles
A block-arbitrary profile defines a particular command segment (or a series of segments) for each channel. Each segment can have a different shape, rate, repeat count, and amplitude.
A block-arbitrary profile can define several channels of data since there is no interaction between the data channels. For more information, see “Block-Arbitrary Profile Example” on page 471.
Phase profiles A phase profile also defines a particular command segment (or a series of segments) for each channel. However, the segment shape, time base and count must be the same for each channel.
A phase profile can define several channels of data. Each row of segment data can have Phase Lag defined for it. The Phase Lag of each channel is referenced to the lowest Phase Lag defined in a channel. For more information, see “Phase Profile Example” on page 473.
Creating Profiles
Model 793.10 MultiPurpose TestWare
Profiles
Profiles 463
General Profile Syntax Requirements
If you create a profile using the Profile Editor application, the syntax of the profile is managed automatically by the Profile Editor application.
If you are creating a profile with an external spreadsheet or text editor application, you should review the following profile syntax requirements before you start:
• Profiles should be saved with a .blk extension so the default file filter in MPT will recognize them.
• You must separate profile entries with a space or a tab (when using a text editor).
• Blank lines between rows may be used to improve readability.
• The profile must start with the header data definition, then with channel and command data definitions for each succeeding channel defined in the profile. (Header data, Channel 1 data, Channel 1 command data, Channel 2 data, Channel 2 command data, and so forth.)
• Keywords are not case-sensitive.
• Do not leave a space between the keyword and the equals sign (=). However, you can insert a space after the equals sign to improve readability.
• Use header keywords (FileType, Date, and so on) only once.
• Use channel keywords (level, frequency, and so on) only once for each channel definition.
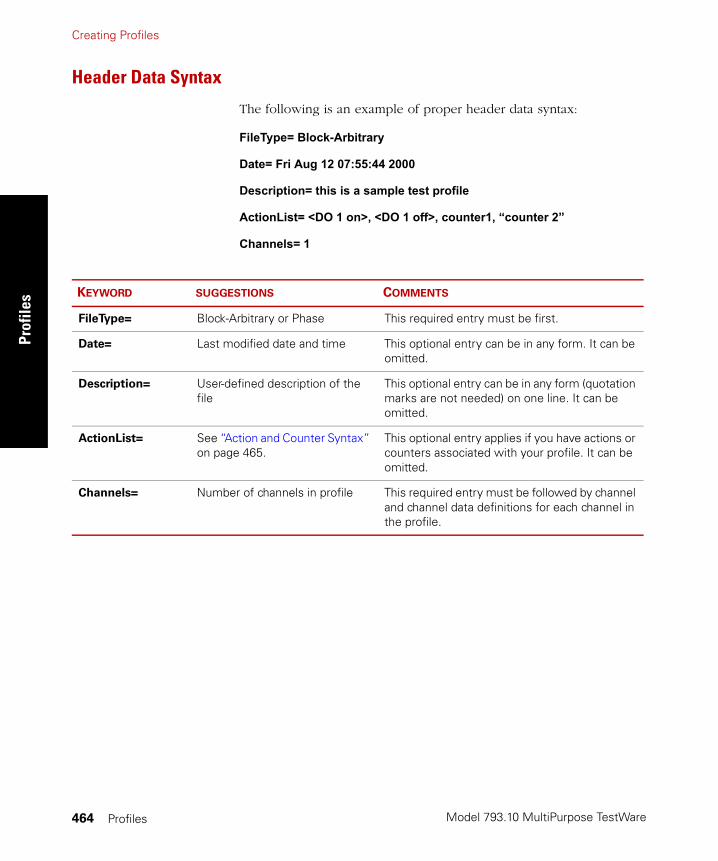
Model 793.10 MultiPurpose TestWare
Creating ProfilesPr
ofile
s
Profiles464
Header Data Syntax
The following is an example of proper header data syntax:
FileType= Block-Arbitrary
Date= Fri Aug 12 07:55:44 2000
Description= this is a sample test profile
ActionList= <DO 1 on>, <DO 1 off>, counter1, �counter 2�
Channels= 1
KEYWORD SUGGESTIONS COMMENTS
FileType= Block-Arbitrary or Phase This required entry must be first.
Date= Last modified date and time This optional entry can be in any form. It can be omitted.
Description= User-defined description of the file
This optional entry can be in any form (quotation marks are not needed) on one line. It can be omitted.
ActionList= See “Action and Counter Syntax” on page 465.
This optional entry applies if you have actions or counters associated with your profile. It can be omitted.
Channels= Number of channels in profile This required entry must be followed by channel and channel data definitions for each channel in the profile.
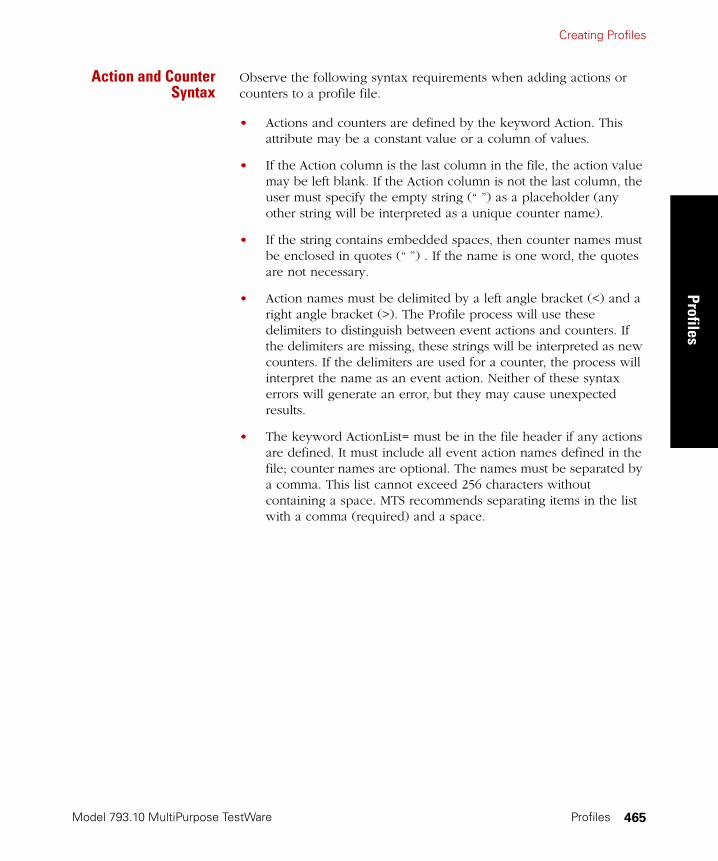
Creating Profiles
Model 793.10 MultiPurpose TestWare
Profiles
Profiles 465
Action and CounterSyntax
Observe the following syntax requirements when adding actions or counters to a profile file.
• Actions and counters are defined by the keyword Action. This attribute may be a constant value or a column of values.
• If the Action column is the last column in the file, the action value may be left blank. If the Action column is not the last column, the user must specify the empty string (“ ”) as a placeholder (any other string will be interpreted as a unique counter name).
• If the string contains embedded spaces, then counter names must be enclosed in quotes (“ ”) . If the name is one word, the quotes are not necessary.
• Action names must be delimited by a left angle bracket (<) and a right angle bracket (>). The Profile process will use these delimiters to distinguish between event actions and counters. If the delimiters are missing, these strings will be interpreted as new counters. If the delimiters are used for a counter, the process will interpret the name as an event action. Neither of these syntax errors will generate an error, but they may cause unexpected results.
• The keyword ActionList= must be in the file header if any actions are defined. It must include all event action names defined in the file; counter names are optional. The names must be separated by a comma. This list cannot exceed 256 characters without containing a space. MTS recommends separating items in the list with a comma (required) and a space.
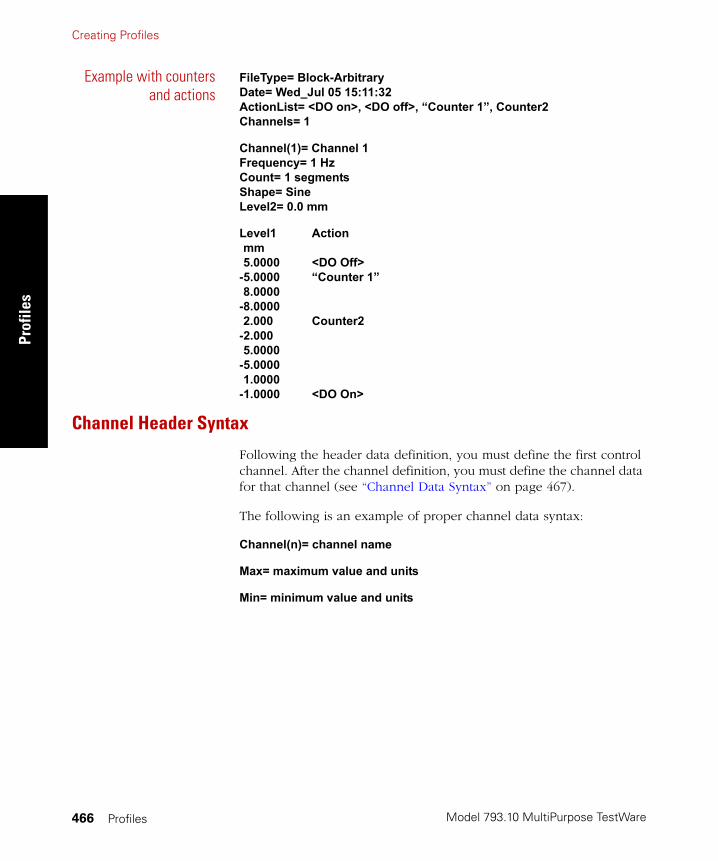
Model 793.10 MultiPurpose TestWare
Creating ProfilesPr
ofile
s
Profiles466
Example with countersand actions
FileType= Block-ArbitraryDate= Wed_Jul 05 15:11:32 ActionList= <DO on>, <DO off>, �Counter 1�, Counter2Channels= 1
Channel(1)= Channel 1Frequency= 1 HzCount= 1 segmentsShape= SineLevel2= 0.0 mm
Level1 Actionmm5.0000 <DO Off>
-5.0000 �Counter 1�8.0000
-8.00002.000 Counter2
-2.0005.0000
-5.00001.0000
-1.0000 <DO On>
Channel Header Syntax
Following the header data definition, you must define the first control channel. After the channel definition, you must define the channel data for that channel (see “Channel Data Syntax” on page 467).
The following is an example of proper channel data syntax:
Channel(n)= channel name
Max= maximum value and units
Min= minimum value and units
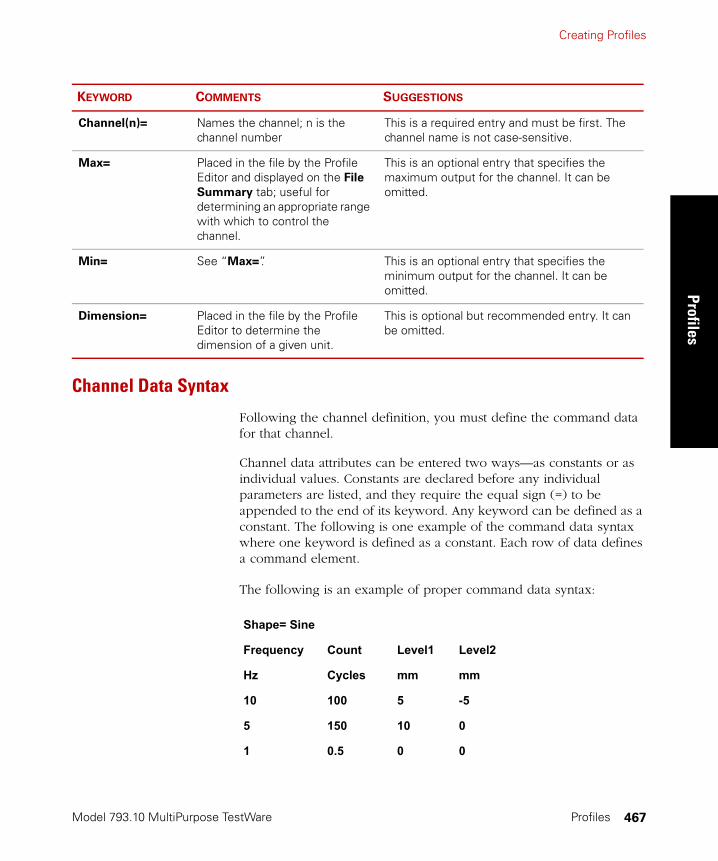
Creating Profiles
Model 793.10 MultiPurpose TestWare
Profiles
Profiles 467
Channel Data Syntax
Following the channel definition, you must define the command data for that channel.
Channel data attributes can be entered two ways—as constants or as individual values. Constants are declared before any individual parameters are listed, and they require the equal sign (=) to be appended to the end of its keyword. Any keyword can be defined as a constant. The following is one example of the command data syntax where one keyword is defined as a constant. Each row of data defines a command element.
The following is an example of proper command data syntax:
KEYWORD COMMENTS SUGGESTIONS
Channel(n)= Names the channel; n is the channel number
This is a required entry and must be first. The channel name is not case-sensitive.
Max= Placed in the file by the Profile Editor and displayed on the File
Summary tab; useful for determining an appropriate range with which to control the channel.
This is an optional entry that specifies the maximum output for the channel. It can be omitted.
Min= See “Max=”. This is an optional entry that specifies the minimum output for the channel. It can be omitted.
Dimension= Placed in the file by the Profile Editor to determine the dimension of a given unit.
This is optional but recommended entry. It can be omitted.
Shape= Sine
Frequency Count Level1 Level2
Hz Cycles mm mm
10 100 5 -5
5 150 10 0
1 0.5 0 0
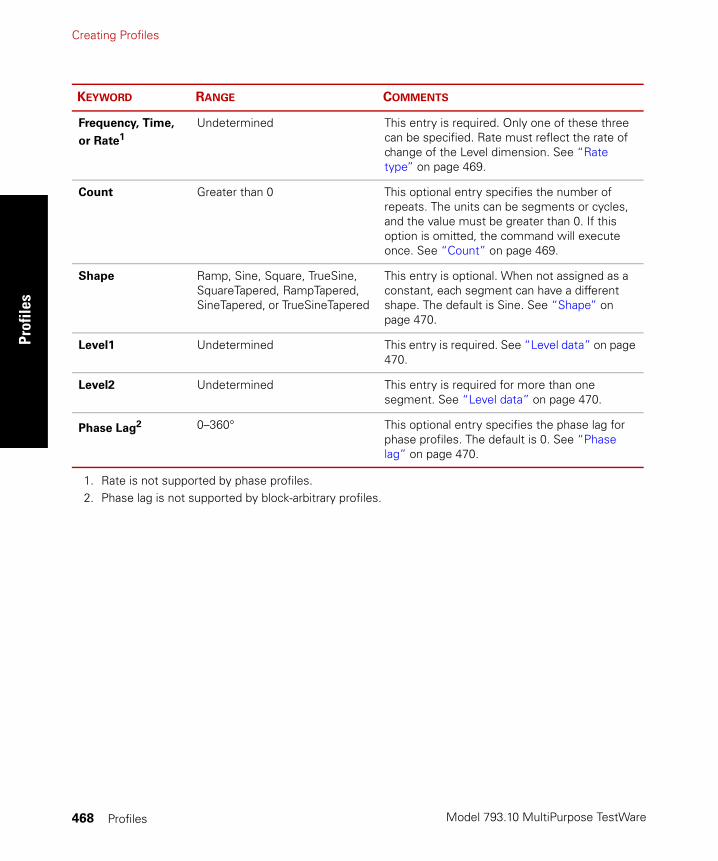
Model 793.10 MultiPurpose TestWare
Creating ProfilesPr
ofile
s
Profiles468
KEYWORD RANGE COMMENTS
Frequency, Time,
or Rate1
1. Rate is not supported by phase profiles.
Undetermined This entry is required. Only one of these three can be specified. Rate must reflect the rate of change of the Level dimension. See “Rate type” on page 469.
Count Greater than 0 This optional entry specifies the number of repeats. The units can be segments or cycles, and the value must be greater than 0. If this option is omitted, the command will execute once. See “Count” on page 469.
Shape Ramp, Sine, Square, TrueSine, SquareTapered, RampTapered, SineTapered, or TrueSineTapered
This entry is optional. When not assigned as a constant, each segment can have a different shape. The default is Sine. See “Shape” on page 470.
Level1 Undetermined This entry is required. See “Level data” on page 470.
Level2 Undetermined This entry is required for more than one segment. See “Level data” on page 470.
Phase Lag2
2. Phase lag is not supported by block-arbitrary profiles.
0–360° This optional entry specifies the phase lag for phase profiles. The default is 0. See “Phase lag” on page 470.
Creating Profiles
Model 793.10 MultiPurpose TestWare
Profiles
Profiles 469
Rate type A rate type determines the time base of the waveform. Three types of rate expressions (keywords) are supported.
• FREQUENCY (Hz, cps)
• TIME (msec, sec, minutes, and so on)
• RATE (units per time; for example, kips/sec)
A constant rate type of TIME= 2.5 sec assigns 2.5 seconds to each row of segment data. When a constant is defined, the related column (Frequency/Rate/Time) is not allowed. A variable rate type identifies a column of time values, where each row can have a different time base.
Count The count lets you repeat a cyclic waveform a specific number of times. The COUNT keyword can repeat segments or cycles.
• 1 cycle = 2 segments
• A cycle count of 0.5 is the same as a single segment.
• Repeating a segment an even number of times ends at Level 2.
• Repeating a segment an odd number of times ends at Level 1.
The count can be set to a constant such as COUNT= 1 SEGMENTS. This executes each Level 1 parameter once. It is useful for profiles that issue a series of arbitrary end levels. In this case the values in Level 2 are not used.
Note The True Sine segment shape always starts and stops at its mean level, and will cause a step if the previous row did not end at its mean level.
Model 793.10 MultiPurpose TestWare
Creating ProfilesPr
ofile
s
Profiles470
Shape A waveshape defines how to go from the current end level to the next end level. The SHAPE keyword can define a waveshape as a constant at the beginning of the channel (SHAPE= RAMP), or it can define a column of data to assign a shape to each row.
Level data The level data defines the end level of the rows. The file requires a Level 1 value for each row. If a Level 2 value is included, multiple segments are being specified (cycles). Cycles execute from the current level to Level 1, then to Level 2.
Note The first segment of each row is always a “transition” segment from the end level in the previous row to the Level 1 value in the current row. At the beginning of the procedure, the first segment is a transition from the current level to Level 1 in Row 0.
Phase lag The Phase file type is the same as the Block-Arbitrary file type, except that phase relationships between channels can be specified. When Phase is used, the following requirements must be observed:
• The waveform rate, shape, and count must be the same for all phased channels. They must be defined with the first channel.
• The phase of one channel is compared to another; the higher value lags the lower value.
• Each row of data defines a waveform. The first segment of each of the waveforms is stretched to achieve the phase lag.

Creating Profiles
Model 793.10 MultiPurpose TestWare
Profiles
Profiles 471
Block-Arbitrary Profile Example
Header data Filetype= Block-Arbitrary
Date=10-Dec-00
Description= Two Channel Test
Channels= 2
Channel 1 header Channel(1)= Right Front
Frequency= 1 Hz
Shape= TrueSineChannel 1 data
Channel 2 header Channel(2)= Left Front
Frequency= 2 Hz
Shape= RampChannel 2 data
Level1 Level2 Count
in in segments
5 -5 10
10 -10 20
Level1 Level2 Count
lbf lbf segments
5000 -5000 15
10000 -10000 20
2000 -200 20
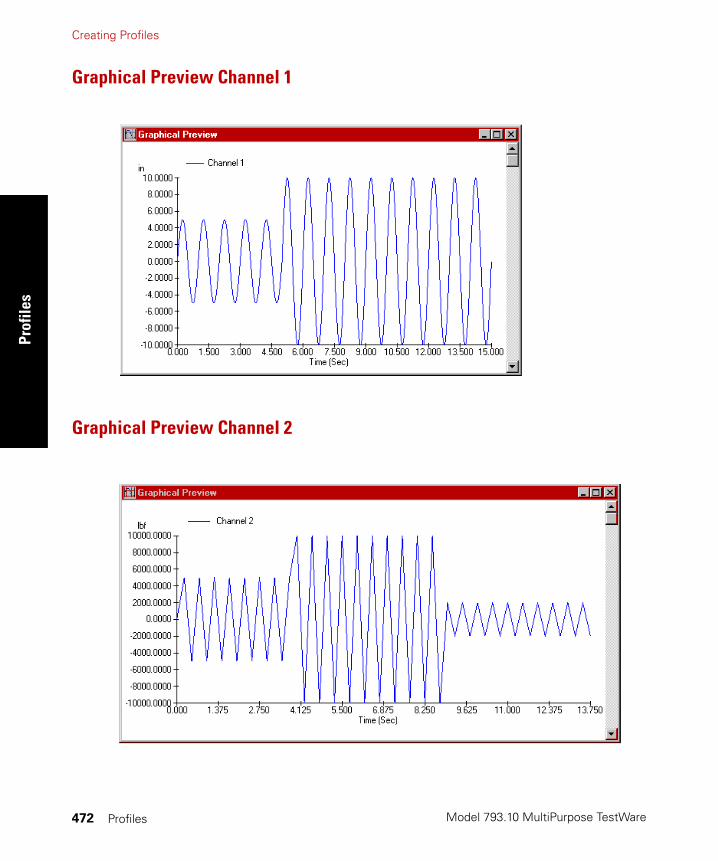
Model 793.10 MultiPurpose TestWare
Creating ProfilesPr
ofile
s
Profiles472
Graphical Preview Channel 1
Graphical Preview Channel 2
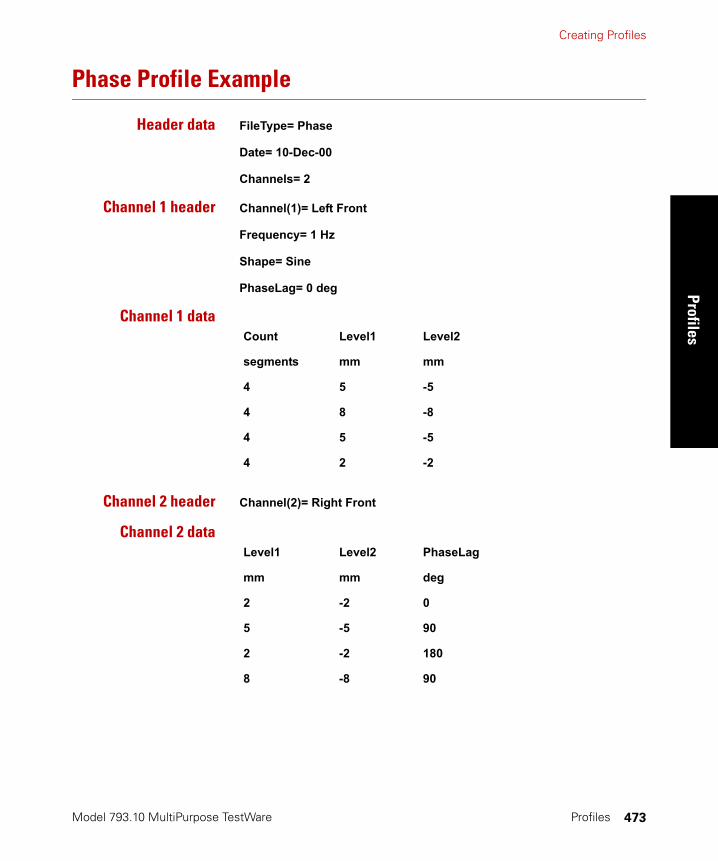
Creating Profiles
Model 793.10 MultiPurpose TestWare
Profiles
Profiles 473
Phase Profile Example
Header data FileType= Phase
Date= 10-Dec-00
Channels= 2
Channel 1 header Channel(1)= Left Front
Frequency= 1 Hz
Shape= Sine
PhaseLag= 0 deg
Channel 1 data
Channel 2 header Channel(2)= Right Front
Channel 2 data
Count Level1 Level2
segments mm mm
4 5 -5
4 8 -8
4 5 -5
4 2 -2
Level1 Level2 PhaseLag
mm mm deg
2 -2 0
5 -5 90
2 -2 180
8 -8 90
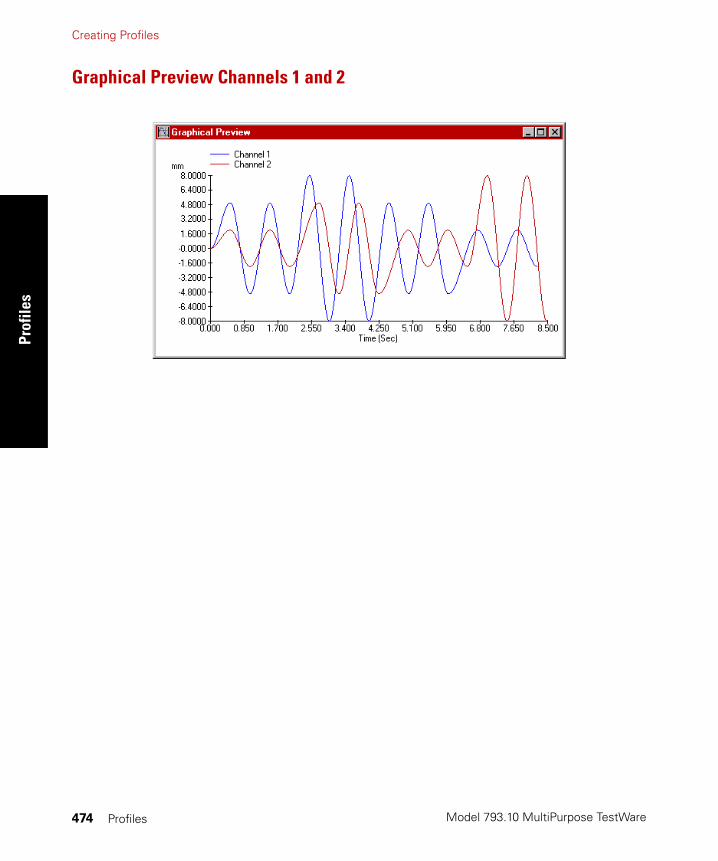
Model 793.10 MultiPurpose TestWare
Creating ProfilesPr
ofile
s
Profiles474
Graphical Preview Channels 1 and 2
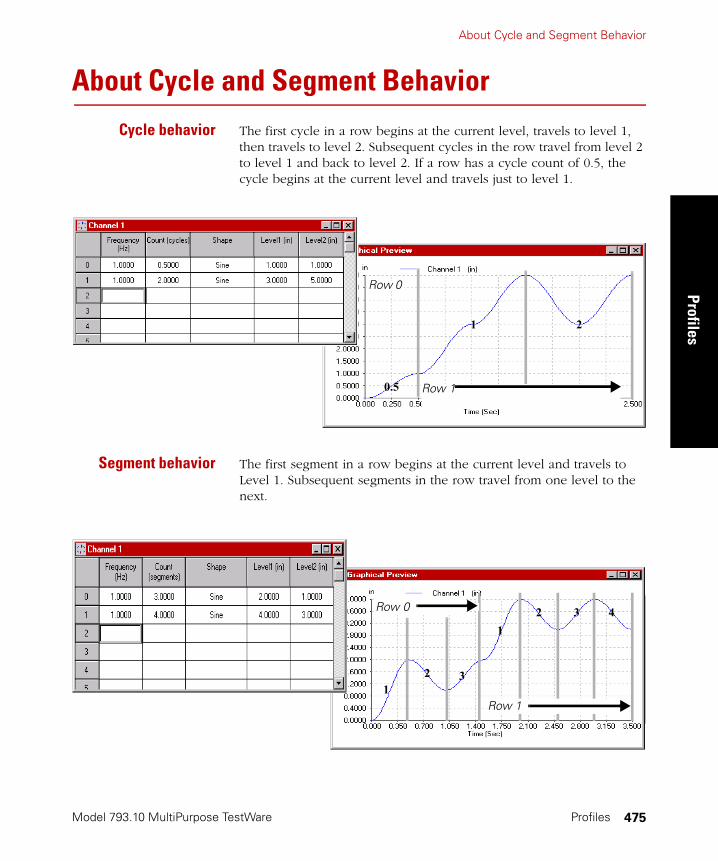
About Cycle and Segment Behavior
Model 793.10 MultiPurpose TestWare
Profiles
Profiles 475
About Cycle and Segment Behavior
Cycle behavior The first cycle in a row begins at the current level, travels to level 1, then travels to level 2. Subsequent cycles in the row travel from level 2 to level 1 and back to level 2. If a row has a cycle count of 0.5, the cycle begins at the current level and travels just to level 1.
Segment behavior The first segment in a row begins at the current level and travels to Level 1. Subsequent segments in the row travel from one level to the next.
Row 0
Row 1 0.5
1 2
Row 0
Row 1 1
2 3
12 3 4
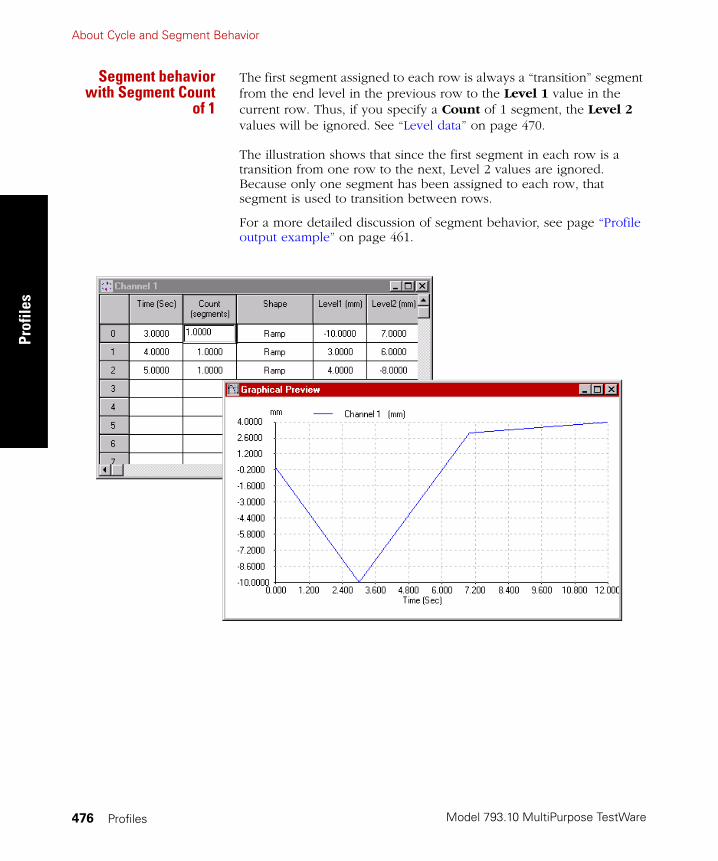
Model 793.10 MultiPurpose TestWare
About Cycle and Segment BehaviorPr
ofile
s
Profiles476
Segment behaviorwith Segment Count
of 1
The first segment assigned to each row is always a “transition” segment from the end level in the previous row to the Level 1 value in the current row. Thus, if you specify a Count of 1 segment, the Level 2 values will be ignored. See “Level data” on page 470.
The illustration shows that since the first segment in each row is a transition from one row to the next, Level 2 values are ignored. Because only one segment has been assigned to each row, that segment is used to transition between rows.
For a more detailed discussion of segment behavior, see page “Profile output example” on page 461.

About Transitions
Model 793.10 MultiPurpose TestWare
Profiles
Profiles 477
About TransitionsNote The following information applies only to Sine, Ramp, and Square
waveshapes. True Sine and tapered waveshapes always start and stop from their mean level.
It is useful to understand how MPT generates transitions between rows, and how to add segments to modify the transitions.
The first segment (or the first half of the first cycle) in a row travels from the current level to the Level 1 value. It has special significance because it is the portion of the waveform that makes the transition between the rows of the profile.

Model 793.10 MultiPurpose TestWare
About TransitionsPr
ofile
s
Profiles478
More About Automatic Transitions
This MTS Profile Editor example shows how MPT automatically generates the transition segments between the rows of the sample profile (Row 0, Segment 1 and Row 1, Segment 1).
5
Row 0
2 4 5 6
1
2 6
1
3
3 4
Row 1
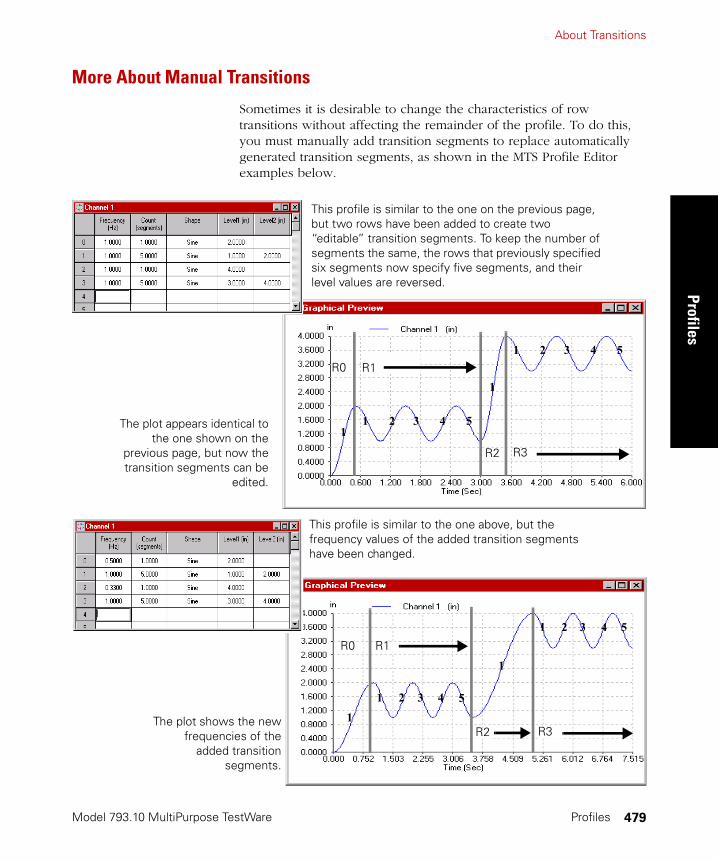
About Transitions
Model 793.10 MultiPurpose TestWare
Profiles
Profiles 479
More About Manual Transitions
Sometimes it is desirable to change the characteristics of row transitions without affecting the remainder of the profile. To do this, you must manually add transition segments to replace automatically generated transition segments, as shown in the MTS Profile Editor examples below.
1
R0
R2
R1
1
1
2 3 4 5
1 2 3 4 5
R3
1
R1
1
1
2 3 4 5
1
2 3 4 5
R3
R0
R2
The plot appears identical tothe one shown on the
previous page, but now thetransition segments can be
edited.
The plot shows the newfrequencies of the
added transitionsegments.
This profile is similar to the one on the previous page, but two rows have been added to create two “editable” transition segments. To keep the number of segments the same, the rows that previously specified six segments now specify five segments, and their level values are reversed.
This profile is similar to the one above, but the frequency values of the added transition segments have been changed.
Model 793.10 MultiPurpose TestWare
Working with DimensionsPr
ofile
s
Profiles480
Working with Dimensions
Using standarddimensions
You create a profile by entering the end level values you desire the actuator to achieve during the course of the profile. For end level values to be meaningful, they must be associated with a dimension and unit type. With the Profile Editor application, you specify the dimension and unit type separately (for instance, length and cm). When you create profiles with other applications (such as text editors), you select only the unit type, which has an inherent dimension (for instance, cm, which is associated with length).
Note MTS recommends that you include the keyword “Dimension=” in your profiles to clarify unit type, because some unit types occur in more than one dimension.
When you start MPT against a station configuration, MPT inherits resources—including the control mode dimensions—defined in the station configuration file.
When you select the control mode for a profile channel with the Profile process, the dimension of the profile end levels must match one of the control mode dimensions available to the current station configuration.
Example Suppose you create a station configuration that uses the force dimension for a force control mode, and the length dimension for a displacement control mode. In addition, you create a profile in which you select a unit type associated with the length dimension to define end levels.
Next, you start MPT against the station configuration, and with the Profile process, on the Command tab, you select the profile you have created. On the Mapping tab, you select a Profile Channel. In this scenario, only displacement will be available in the Control Mode list.
Also, the Level Multiplier box will display 100% by default, which means MPT will play out the end level values in the profile without scaling them. In this case, if the first end level values in the profile are 2 cm and 9 cm, they will be played out as 2 cm and 9 cm. If you changed the Level Multiplier value to 200%, MPT would play out the these values as 4 cm and 18 cm.

Working with Dimensions
Model 793.10 MultiPurpose TestWare
Profiles
Profiles 481
Using normalizeddimensions
If you create a profile using a normalized dimension, such as ratio, percentage, unitless, or volts, you can select any of the control modes available to the station configuration when selecting the control mode for the profile channel.
When you do this, you define the full-scale value of the normalized dimension by selecting one of the control modes and its associated engineering dimension available in the Control Mode list on the Mapping tab, along with a unit type and a Level Multiplier value. MPT converts all end level values in the profile to command levels accordingly.
Example Suppose you create a station configuration that uses the force dimension for a force control mode, and the length dimension for a displacement control mode. In addition, suppose you create a profile in which you select the volts dimension to define end levels.
Next, you start MPT against the station configuration, and with the Profile process, on the Command tab, you select the profile you have created. On the Mapping tab, you select a Profile Channel. In this scenario, both displacement and force will be available in the Control Mode list.
Suppose you select displacement, and enter a value of 5 cm in the Level Multiplier box. This will cause all of the end level values in the profile to be converted to displacement values. For volts, the full-scale value equals 10 volts, which MPT will play out as 5 cm. So in this case, if the first end level values in the profile are 2 volts and 9 volts, they will be played out as 1 cm and 4.5 cm.
Using the same profile, suppose you change the Control Mode selection to force, and enter a Level Multiplier value of 100 N. This will cause all of the end levels in the profile to be converted to force values. In this case, MPT will play out 10 volts as 100 N. So if the first end level values in the profile are 2 volts and 9 volts, they will be played out as 20 N and 90 N.
Model 793.10 MultiPurpose TestWare
Working with DimensionsPr
ofile
s
Profiles482
Full-scale values ofnormalized dimensions
Using normalizeddimensions to define
control modes
You can use any of these normalized dimensions to define a control mode in a station configuration. If you do this, and then attempt to play out a profile that also uses a normalized dimension, MPT will treat it as a standard dimension when you define a Profile process.
Example Suppose you create a station configuration that uses volts as a dimension for a volt control mode, which is associated with a conditioner that is cabled to a displacement sensor with a full-scale displacement of ±200 cm.
Next, you create a profile in which you select the volts dimension to define end levels.
Then you start MPT against the station configuration, and with the Profile process, on the Command tab, you select the profile you have created.
On the Mapping tab, you select a Profile Channel, and note that volts is available in the Control Mode list, and that the Level Multiplier box displays 100%.
In this scenario, if the first end level values in the profile are 1 V and 9 V, they will be played out as 20 cm and 180 cm. If you change the Level Multiplier value to 50%, MPT would play out these values as 10 cm and 90 cm.
DIMENSION FULL-SCALE VALUE
Ratio 1:1
Percentage 100%
Unitless 1.0
Volts 10V

Model 793.10 MultiPurpose TestWare
MPT Shortcuts
MPT Shortcuts 483
Appendix D
MPT Shortcuts
You can use an MPT shortcut to perform a number of tasks automatically when you start the MPT application.
For instance, you can use MPT shortcuts to:
• Automatically load a specific procedure
• Automatically load a specific specimen
• Launch MPT as an editor (edit only mode)
• Automatically display the MPT Procedure Editor when MPT is launched
• Connect to a specific station
• Connect to a specific test system
To specify the MPT shortcut parameters, you must create an MPT shortcut, and then edit the shortcut command line.

Model 793.10 MultiPurpose TestWare
About the Shortcut Command LineM
PT S
hort
cuts
MPT Shortcuts484
About the Shortcut Command LineNote The syntax of the shortcut command lines are critical. If you do not
use a supported shortcut command line, the shortcut will not work.
Parameter and prefix descriptions are listed as follows:
PARAMETER PREFIX EXAMPLE
Load a Procedure file /Procedure1, or /P
1. If the parameter name contains spaces (for example, test 257.000), the name must be enclosed in quotation marks (“test 257.000“).
/P default.000
Load a Specimen /Specimen1, or /Sp /Sp spec03
Launch MPT as an Editor (no
execution)
/EditOnly
Launch the Procedure Editor
with MPT
/Editor [x:y:w:h:style] mpt /editor 400:400:300:300:StyleMinimized
Connect to a Station /Station1, or /St /St station1.cfg
Connect to a System /System1, or /Sy /Sy 148.150.203.191
Controller Name /Controller name /Controller 001
Display the MPT command-line
options
/Help, or /H

About the Shortcut Command Line
Model 793.10 MultiPurpose TestWare
MPT Shortcuts
MPT Shortcuts 485
Command linepractices
When you are editing the command line, keep in mind:
• The order of the parameters is not important.
• Prefixes can be spelled out or abbreviated in the command line.
• The prefix and the parameter must be separated by a space.
• If the parameter name contains a space (for example, my first test.000), it must be enclosed in quotation marks.
• The option names can be abbreviated to anything which is unque.
About the /EditOnlycommand
The /EditOnly option will launch MPT as an editor only. When you use this option, the MPT Specimen Log and Edit/Execute toolbar buttons will be disabled. MultiPurpose TestWare is not embedded in Station Manager in this mode. Since it is not embedded, it can be run on a different PC or as a second copy of MPT, etc.
About the /Editor [...]command
The /Editor [...] option will launch MPT in the embedded mode with the Procedure Editor already displayed. The syntax of the optional arguments (x:y:w:h:style) that specify the initial size and placement of the Procedure Editor window are as follows:
• “x” specifies the x-coordinate of the upper left-hand corner of the window
• “y” specifies the y-coordinate of the upper left-hand corner of the window
• “w” specifies the width of the window in pixels
• “h” specifies the height of the window in pixels
• “style” specifies whether the window is maximized or minimized
An example of the full specification is:
“mpt /editor 400:400:300:300:StyleMinimized”
Model 793.10 MultiPurpose TestWare
About the Shortcut Command LineM
PT S
hort
cuts
MPT Shortcuts486
Omitting arguments Any of these arguments may be omitted, but the “:” must remain as a placeholder if an argument is omitted in the middle of the string. Arguments at the end can be omitted.
If an argument is omitted, the application will use a default value. For example, suppose you are not sure what size you want the Procedure Editor window to be, but you are sure you want it to appear in the upper left corner. In this case, you would enter:
“mpt /editor 10:10”
Likewise, suppose you want the Procedure Editor window to appear in the default location, but you want its size to be smaller than its default size. It this case, you would enter:
“mpt /editor ::200:200”
Entering invalid valuesfor your screen
Also, if you enter x or y coordinate values that are not valid for your screen (values that would place part or all of the Procedure Editor window off the screen), MPT will override your values so that the window appears fully on your screen.
Likewise, if you inadvertently enter negative values for width or height, MPT will use the default (positive) values for width and height instead of the negative values.
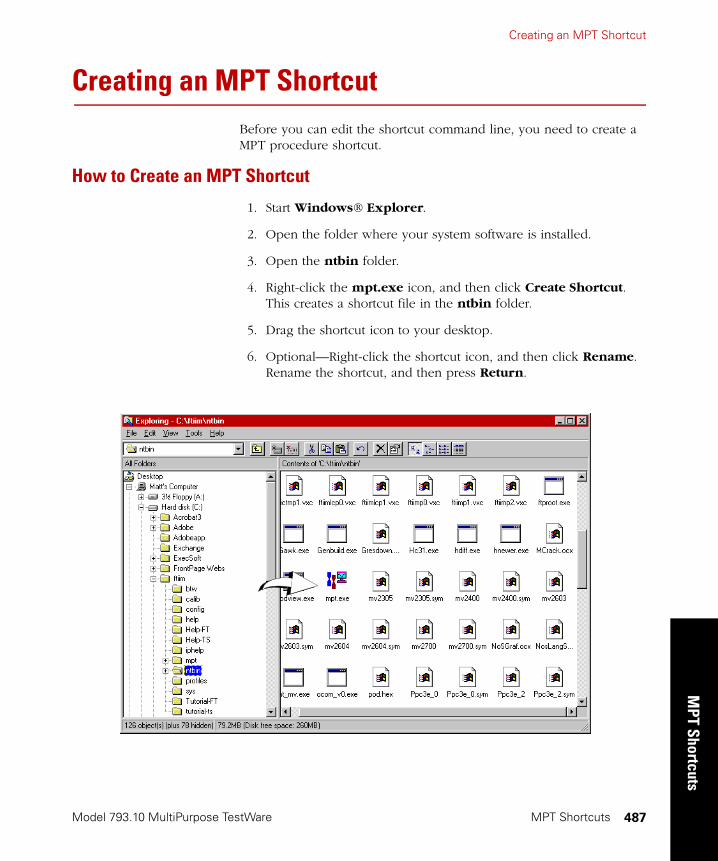
Creating an MPT Shortcut
Model 793.10 MultiPurpose TestWare
MPT Shortcuts
MPT Shortcuts 487
Creating an MPT ShortcutBefore you can edit the shortcut command line, you need to create a MPT procedure shortcut.
How to Create an MPT Shortcut
1. Start Windows® Explorer.
2. Open the folder where your system software is installed.
3. Open the ntbin folder.
4. Right-click the mpt.exe icon, and then click Create Shortcut. This creates a shortcut file in the ntbin folder.
5. Drag the shortcut icon to your desktop.
6. Optional—Right-click the shortcut icon, and then click Rename. Rename the shortcut, and then press Return.

Model 793.10 MultiPurpose TestWare
Editing the Shortcut Command LineM
PT S
hort
cuts
MPT Shortcuts488
Editing the Shortcut Command LineEdit the shortcut command line to define your desired procedure parameters.
How to Edit the Shortcut Command Line
1. Right-click the shortcut icon you created on your desktop, and then click Properties.
2. In the Properties window, click the Shortcut tab.
3. In the Target box, type your command line.
Note There must be a space between mpt.exe and your command line addition.
4. Click OK.
Test your shortcut To test your shortcut command line, make sure the Station Manager application is started and the proper configuration file is open. Then double-click your shortcut icon.
Type your command line here. Be sure to put a space between mpt.exe and the start of your command line.
Click OK.
MultiPurpose TestWare
Index
Index 489
Index
Symbols
.dat files 74
.log files 77
.mpp files 78
.mps files 79
.prm files 80
A
aboutALC compensation 236processes 35, 98, 197segment shapes 209
About window 193adding processes to the procedure window 99, 198ALC
about 236profile with ALC command process 236
Application Controls panelMultiPurpose TestWare 18, 19
assigning specimen folders 68asymmetric full scales (trend process) 330auto-archiving (Message Log) 156
B
bin size 308block-arbitrary profiles 462
example 471buffer full signals 105
about 106how to trigger a process with a buffer full
signal 275buffers, about 266
C
Channel Counters 18channel data syntax 466Chart Properties
Axis tab 426command data syntax 467
command hold and stop behaviors 170command line, editing the MPT shortcut 483Control Panel
Fatigue Monitoring application 431loading specimen folders 81setting options 186
control panel 18, 19Control Panel tab—Options Editor 186controller rates 246copying process icons 103creating actions when MPT is running 333cutting process icons 103cycle behavior (profiles) 475cycles vs. segments 207cyclic command process 205
cycles and segments 207end levels 208how to define 214parameter descriptions 212start levels 205
cyclic data acquisition process 295how to define 300parameter descriptions 297
cyclic with ALC command process 242how to define 243parameter descriptions 242
D
data acquisition processes 263data acquisition rates, about 316Data Display
ParametersPlots tab 412, 416
processdefining 427working with 427
data files 74formatting 75parsing 75user-specified 76using the Excel file converter 455
data handling (trend process) 321data limit detector process 332
how to define 338parameter descriptions 334
default template (procedure) 449demo system loader 22
MultiPurpose TestWare
Inde
x
Index490
digital input detector process 340how to define 346parameter descriptions 342
digital output process 379how to define 383parameter descriptions 381
dimensionsnormalized 220
dimensions, working with 480Directories tab 191disabled icon 19disabling processes 122Display menu 142done signals 104
how to specify 113dwell command process 216
how to define 218parameter descriptions 217
E
Edit menu 140end levels
cyclic command process 208ending a procedure 105error messages, procedure template 452event processes 331Excel (data format) 75Excel file converter 455execution icon 19Execution tab 166external command process 228
how to define 234parameter descriptions 232set point and span settings 230starting 229stopping 229
external control processes 378
F
fan-in process 105fan-out process 105Fatigue Monitoring application 431
control panel 431Limit Settings window 436Numerical Data window 439
fatigue process 303how to define 314parameter descriptions 309setting up a test to acquire fatigue data 313
File menu 139, 146formatting data files 75
G
Group menu 141group process 396
about interrupts 119how to define 397how to move between the group and the main
procedure windows 396start and interrupt signals 104user-defined interrupts 121
H
header data syntax 464Help menu 145histogram
types 305histograms
MinMax 306range 307rangemean 305
histograms, about 304hold behaviors 170Hold button 136
enabling and disabling 167how to
create a specimen file 26use normalized dimensions 220
hydraulics, required state 132, 168
I
indicators, process 149initial display, MPT 125Interrupt (control) 149interrupt signals 104
how to specify 112
L
level crossing data acquisition process 286how to define 288parameter descriptions 287
limit modes, about 333Limit Settings window
Fatigue Monitoring application 436Trend Monitoring application 445
linking specimen folders to test procedures 69Load Specimen window 82
MultiPurpose TestWare
Index
Index 491
loading specimen folders 81Lotus (data format) 75low rate channels (temperature controller) 384
M
max/min acquisition process 281max/min data acquisition process
how to define 284parameter descriptions 284
menusDisplay menu 142Edit menu 140File menu 139, 146Group 141Help menu 145Tools menu 143Window menu 144
Message Log 155how to add entries 159how to set options 159log files 77
MinMax histogram 306MPT
initial display 125Message Log 155Options Editor 165shortcuts 483Specimen Editor 159toolbar 146
MultiPurpose TestWareData Display Parameters 412, 416Station Manager, starting in 18, 19
N
name template (specimen) 161normalized dimensions 220normalized dimensions, using 481Numerical Data window
Fatigue Monitoring application 439Trend Monitoring application 447
O
Open Procedure (window) 151operator event process 348
how to define 353, 372, 376parameter descriptions 350, 373
operator information process 398how to define 404parameter descriptions 399
Options Editor 165overriding system set point and span 231overview
performing a test 27
P
parameterscyclic command process 212cyclic data acquisition process 297cyclic with ALC command process 242data limit detector process 334digital input detector process 342digital output process 381dwell command process 217external command process 232fatigue process 309level crossing data acquisition 287max/min data acquisition process 284operator event process 350, 373operator information process 399peak/valley change detector process 358peak/valley data acquisition process 269profile with ALC command process 236program control process 391road surface output command process 259segment command process 200temperature control process 386time history input process 317time history output command process 247timed data acquisition process 277, 292trend process 322
parsing data files 75pass-through icon 19pasting process icons 103peak/valley change detector process 354
how to define 362parameter descriptions 358
peak/valley data acquisition process 265how to define 273parameter descriptions 269
phase profileexample 473
phase profiles 462plain (data format) 75Plot
additional properties 425Chart Properties
Axis tab 426Setup tab
Y1, Y2 axis 416Plots tab 412, 416print preview 139Print Procedure to File (window) 153
MultiPurpose TestWare
Inde
x
Index492
Procedure is done when (control) 149procedure template
customizing 450error messages 452using multiple 451
proceduresdone signals 104specifying the end 105start and interrupt signals 104
process indicators (procedure window) 149Process Palette 19Process Types Palette 98, 154, 197processes 97, 195
about 35, 98, 197adding to the procedure window 99, 198cutting, copying, and pasting 103disabling 122fan-in and fan-out 105selecting one or more process icons 101sequencing 104
profilesyntax 463
profile command process 219how to define 226
profile with ALC command process 236how to define 240parameter descriptions 236
profiles 459about transitions 477creating 462cycle and segment behavior 475
program control process 391how to define 394parameter descriptions 391
program event process 364how to define 366
Properties tab 188
R
rainflow counting, about 304ramp tapered wave shape 210ramp wave shape 209range histogram 307rangemean histogram 305rates, data acquisition 316recovery
about test 181enabling test 167
recovery files.mpp 78.mps 79
Recovery tab 180required hydraulic state 132, 168resuming a test 167RMS (trend process) 330road surface files, creating 257
road surface output commandhow to define 261
road surface output command process 257parameter descriptions 259
Road Surface Output Status window 258RPC files, playing out 245Run button 136
S
Save/Save Procedure As (window) 152segment behavior (profiles) 475segment command process 200
how to define 203parameter descriptions 200
segment shapes 209segments vs. cycles 207select
a specimen 26selecting process icons 101Sequence Counters 18sequencing processes 104
example 110group processes 116
set pointexternal command process 230overriding 231
shortcuts, MPT 483signals
buffer full 105done 104start and interrupt 104trigger 105
sine tapered wave shape 211sine wave shape 209smart limits (trend process) 329span
external command process 230overriding 231
specimendefinition 26selecting file 26spec01 26
Specimen Editor 159specimen folders
.dat files 74
.log files 77
.mpp files 78
.mps files 79
.prm files 80aboutassigning 68creating and linking 69file descriptions 73loading 81
Specimen tab 173specimens. See specimen folders
MultiPurpose TestWare
Index
Index 493
square tapered wave shape 210square wave shape 209Start (control) 149start levels
cyclic command process 205start signals 104
how to specify 111starting an external command process 229starting MPT 22Status and progress indicator 19stop behaviors 170Stop button 136stopping an external command process 229sweep command process
how to define 216syntax, profile 463system loader 22
T
tapered wave shapes 210temperature control process 384
how to define 388parameter descriptions 386
templatesSee default template (procedure)See name template (specimen)
testdata 26specimen 26
test procedureshow to create (example) 35how to create new 22how to open 23how to preview 24how to print 24how to run (example) 27how to save 23
test recovery 181how to enable 167
time history input process 316how to define 319parameter descriptions 317
time history output command process 245how to define 255parameter descriptions 247
Time History Output Status window 247timed data acquisition process 277
how to define 278, 293parameter descriptions 277, 292
toolbar 146Tools menu 143transitions, about (profiles) 477Trend Monitoring application 440
control panel 440Limit Settings window 445Numerical Data window 447
trend process 321about data handling 321about RMS, variance, and asymmetric full
scales 330about smart limits 329how to define 327parameter descriptions 322setting up a test to acquire trend data 326
trigger signals 105about 107using (example) 108
true sine tapered wave shape 211
U
UAS Editor 162UAS tab 189unit assignment set editor 162Unit Selection tab 189unit sets, standard 164user-defined interrupts 121user-specified.dat files 76
V
variance (trend process) 330
W
wave shapes 209ramp 209ramp tapered 210sine 209sine tapered 211square 209square tapered 210tapered 210true sine tapered 211
Window menu 144working with
normalized dimensions 220
Y
Y1, Y2 Axis subtab 416