multiple intelligences: can they be measured? - psychologie-aktuell
TRANSCRIPT

Psychological Test and Assessment Modeling, Volume 55, 2013 (4), 438-461
Multiple intelligences: Can they be
measured?
Kirsi Tirri1, Petri Nokelainen
2 & Erkki Komulainen
3
Abstract
This paper is about issues relating to the assessment of multiple intelligences. The first section
introduces the authors’ work on building measures of multiple intelligences and moral sensitivities.
It also provides a conceptual definition of multiple intelligences based on Multiple Intelligences
theory by Howard Gardner (1983). The second section discusses the context specificity of intelli-
gences and alternative approaches to measuring multiple intelligences. The third section analyses
the validity of self-evaluation instruments and provides a case example of building such an instru-
ment. The paper ends with concluding remarks.
Key words: Giftedness, multiple intelligences theory, MIPQ, CFA, Bayesian modeling
1 Correspondence concerning this article should be addressed to: Prof. Kirsi Tirri, PhD, MTh, Depart-
ment of Teacher Education, Faculty of Behavioral Sciences, P. O. Box 9 (Siltavuorenpenger 5 A),
FI-00014 University of Helsinki, Finland; email: [email protected] 2 University of Tampere, Finland
3 University of Helsinki, Finland

Multiple intelligences: Can they be measured? 439
Introduction
In this paper, we introduce our work on building measures of multiple intelligences and
moral sensitivities based on the Multiple Intelligences theory of Howard Gardner (1983,
1993). We have developed several instruments for self-assessment that can be used in
educational settings (Tirri & Nokelainen, 2011). Gardner’s theory of Multiple Intelli-
gences (MI) focuses on the concept of an ‘intelligence’, which he defines as “the ability
to solve problems, or to create products, that are valued within one or more cultural
settings” (Gardner, 1993, p. x). Gardner lists seven intelligences that meet his criteria for
an intelligence, namely linguistic, logical-mathematical, musical, spatial, bodily kines-
thetic, interpersonal, and intrapersonal (Gardner, 1993, p. xi).
In a broad sense, Gardner views his theory as a contribution to the tradition advocated by
Thurstone (1960) and Guilford (1967) because all these theories argue for the existence
of a number of factors, or components, of intelligence. All these theories also view intel-
ligence as being broader and multidimensional rather than a single, general capacity for
conceptualization and problem-solving. Gardner differs from the other pluralists, howev-
er, in his attempt to base MI theory upon neurological, evolutionary, and cross-cultural
evidence (Gardner, 1993, p. xii). In the first edition of his MI theory, thirty years ago,
Gardner (1983) adopted a very individualistic point of view in exploring various intelli-
gences. In a newer edition of MI theory, however, Gardner (1993) places more emphasis
on the cultural and contextual factors involved in the development of the seven intelli-
gences. Gardner retained the original seven intelligences, but acknowledged the possibil-
ity of adding new intelligences to the list. For example, he has worked on an eighth intel-
ligence – the intelligence of the naturalist – to be included in his list of multiple intelli-
gences (Gardner, 1995, p. 206).
Robert Sternberg identifies Gardner’s MI theory as a systems approach, similar to his
own triarchic theory. Although he appreciates Gardner’s assessments at a theoretical
level, he believes them to be a psychometric nightmare. The biggest challenge for advo-
cates of Gardner’s approach, then, is to demonstrate the psychometric soundness of their
instrument. Sternberg is calling for hard data that would show that the theory works
operationally in a way that will satisfy scientists as well as teachers. Sternberg’s own
theory promises the broader measurement implied by the triarchic theory (Sternberg,
1985). His theory provides “process scores for componential processing, coping with
novelty, automatization, and practical-contextual intelligence, and content scores for the
verbal, quantitative, and figural content domains” (Sternberg, 1991, p. 266).
Sternberg’s observations on Gardner’s theory should be kept in mind in attempts to
create tests based on his theory. However, in the educational setting his theory can be
used as a framework in planning a program that would meet the needs of different learn-
ers (Tirri, 1997). Gardner has shown a special interest in how schools encourage the
different intelligences in students (Gardner, 1991). Gardner’s theory has been applied in
educational settings and in schools (see, e.g., Armstrong, 1993). Nevertheless, Gardner
warns against using his theory as the only educational approach. There is no single way
to adapt his theory, but he has given some guidelines for the possible uses of his theory
in schools (Gardner, 1995, pp. 206-209).

K. Tirri, P. Nokelainen & E. Komulainen
440
Measuring multiple intelligences
According to Moran and Gardner (2006), multiple intelligences can interact through
interference, compensation or catalysis. Interference means that weakness in one intelli-
gence area may hinder the actualization of full potential on another intelligence area. For
example, a musically gifted student with weak self-regulatory (intrapersonal) abilities
may have difficulties learning piano compositions because she cannot concentrate during
practice. By contrast, through compensation strong intelligence areas may support the
weaker ones. We all know that some popular contemporary music artists are better at
writing music than they are at writing lyrics – and vice versa. Catalysis is the third form
of interaction where one intelligence amplifies the expression of another. In this case, a
student may use his bodily-kinesthetic intelligence to play the drumset (bodily-
kinesthetic intelligence catalyzes both musical and logical-mathematical intelligences).
These different interaction types indicate that multiple intelligences should neither be
assessed solely in a linear fashion nor without considering the effect of context. For
example, a student who receives low grades at school for sports (bodily-kinesthetic intel-
ligence) may be a top ice hockey player outside school hours in a local team as she is
interested in only one aspect of that school curriculum area. Shearer’s (2009) review,
based on data from 22 countries, shows many different context-specific ways of as-
sessing multiple intelligences, for example, with structured interviews or self-report as
well as using significant others as informants. His own Multiple Intelligences Develop-
mental Assessment Scales (MIDAS) self-report questionnaire produces both a qualitative
and quantitative profile of a student’s multiple intelligences.
According to Moran and Gardner (2006), the context effect may also apply to students
who do not perform well in tests: “their linguistic intelligence of reading and writing
may interfere with the expression of whatever content the test is assessing” (p. 126). This
might be an indicator of both multiplicative and additive effects of intelligences. Our
studies showing correlations among intelligences support this assumption (e.g., Tirri &
Nokelainen, 2008).
Self-evaluated multiple intelligences
In our instrument development work, Gardner’s Multiple Intelligences theory (1983) is
the framework to build tools for students’ self-evaluation. Self-evaluated intelligence is
closely related to a person’s self-concept (SC). According to leading researchers, self-
concept has a two-factor structure: general self-concept and academic self-concept
(Shavelson, Hubner, & Stanton, 1976). Byrne and Gavin (1996) argue that SC is a multi-
dimensional construct, which in their study comprised the four facets of general, aca-
demic, English, and mathematics self-concepts. Self-evaluated intelligence can reflect
both the general and academic components of a person’s self-concept. Furthermore, self-
evaluated intelligence is closely related to a person’s self-esteem and self-confidence.
The concept of self-efficacy also needs to be acknowledged in the context of self-

Multiple intelligences: Can they be measured? 441
evaluation. According to Bandura (1978), self-efficacy is specific to a particular activity
or situation, in contrast to global beliefs like self-concept.
In our research, we concentrated on self-evaluations of intelligence within the Gardneri-
an framework. We assumed that students reflect both general and academic self-concepts
in their self-assessments of their strengths and weaknesses. According to Moran (2011),
MI self-report measures filter assessment of the other intelligences through intrapersonal
intelligence by providing indicators of both the intelligence that is being measured
alongwith the person's perception of that intelligence. This information may help stu-
dents to understand their self-regulation processes better.
Intelligence may be “a nightmare” as a target for self-evaluation. In addition to meas-
urement issues related to reliability and validity, the creators need to define what they
mean by the concept ‘intelligence’. In our work, we argue that students’ perceptions of
and beliefs about themselves as learners, together with their intertwined affective experi-
ences of self in relation to all areas of the seven intelligences presented in Gardner’s
theory, are the primary dynamic aspects in their personal learning processes. According
to Malmivuori (2001, pp. 59-78), beliefs and perceptions of self constitute the most
central cognitive feature or determinant behind students’ personal understandings, inter-
pretations, and self-regulation. Hence, we claim that self-evaluated intelligence, which
entails students’ own perceptions of and beliefs about themselves as learners, can serve
as an empowering tool in their studies. Self-evaluation has been shown to be less threat-
ening than evaluations completed by the teacher or somebody else (Tirri, 1993). Fur-
thermore, self-evaluation is a viable starting point in the process of learning new things.
Self-evaluation can be viewed as a form of evaluation that suits an autonomous, reflec-
tive student in continuous growth and development. It is easy to implement because it
does not require large investment of personnel or financial resources. In the context of
virtual teaching and learning, self-assessment can provide some of the guidance and
feedback that students and teachers need in the teaching-studying-learning process.
Next we will describe a detailed example of the psychometric validation process of the
Multiple Intelligences Profiling Questionnaire (MIPQ, see e.g., Tirri & Nokelainen,
2008, 2011; Tirri, K., Komulainen, Nokelainen, & Tirri, H., 2002, 2003).
Development of multiple intelligences profiling questionnaire
In this section, we explore the development (e.g., DeVellis, 2003) of a self-evaluation
instrument based on Gardner’s Multiple Intelligences theory (1983, 1993) with two
empirical samples (n = 408).
The first sample (n = 256) was drawn from students from five different Finnish universi-
ties. The students represent different disciplines, such as teacher education, forestry, and
computer science. These participants responded to the original questionnaire that con-
sisted of 70 items operationalized from Gardner’s theory. The participants used a 7-point
Likert scale to assess their strengths on ten items for each of the seven intelligence di-
mensions (1 = Totally disagree … 7 = Totally agree). According to a simulation study by
Johnson and Creech (1983), discrete indicators work quite well with continuous varia-
K. Tirri, P. Nokelainen & E. Komulainen
442
bles (such as the seven MI dimensions). They noted that while categorization errors do
cause distortions in multiple indicator models, the bias under most of the conditions
explored was insufficient to alter substantive interpretations. The complete set of items is
listed in the Appendix.
The second sample (n = 152) was drawn from Finnish secondary level vocational stu-
dents who have participated in international vocational skills competitions (WorldSkills,
see Nokelainen, Smith, Rahimi, Stasz, & James, 2012). They represent different skills
areas, such as hairdressing, gardening, web design, robotics and caring. These partici-
pants responded to the optimized version of the questionnaire that consisted of 28 items.
The participants used a 5-point Likert scale to assess their strengths on four items for
each of the seven intelligence dimensions (1 = Totally disagree … 5 = Totally agree).
These items are marked with an asterisk symbol in the Appendix.
We begin by using the first sample discussing the composition of items and their rela-
tionship to the theory. Then we describe the exploratory optimization process that was
used to transform the item pool of 70 statements to the final 28-item version. Finally,
using both samples, we test the scale’s structure with data mining (Bayesian) and con-
firmatory (SEM) techniques.
Analysis of the item level distributions
The validity of a self-evaluation instrument is affected by the same defects as any rating
system. In general for rating systems, in addition to halo effects, which are difficult to
avoid, the following three types of error are often associated with rating scales: the error
of severity (“a general tendency to rate all individuals too low on all characteristics”), the
error of leniency (“an opposite tendency to rate too high”), and the error of central ten-
dency (a “general tendency to avoid all extreme judgments and rate right down the mid-
dle of a rating scale”) (Kerlinger, 1973, pp. 548-549). The general response tendency in
our study shows that the students used all the seven response options in their answers.
However, if all the items used were stacked into one single column, the distribution of
responses into the seven alternatives in the scale could be described as unimodal, platy-
curtic and negatively skewed. The means (mean level of all items) between subjects (n =
256) varied heavily (min = 2.77, max = 5.86). A two-way mixed-effect ANOVA showed
that the between people variation was about 11 % of the all-item mean variation. This
focuses on the fact that response set and/or general self-esteem is strongly present in
these measurements. The between measures (p = 70) (within people) variation is also
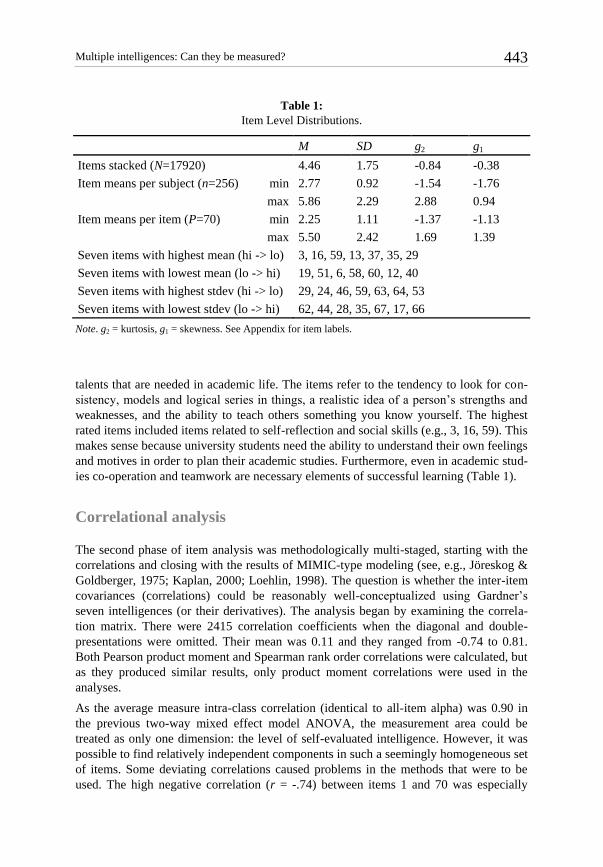
quite notable (min = 2.25, max = 5.50), this share being almost 15 % (see Table 1).
The items with the lowest means (e.g., 19, 51, 6) refer to specific actions, such as writing
little songs or instrumental pieces, keeping a diary, or forming mental pictures of objects
by touching them. All these activities are so specific that it is not surprising that the
students have given low ratings on them. The items with the lowest standard deviations
(e.g., 44, 28, 35) are such that they do not discern amongst the student population very
well. This can be explained by the nature of the items. Most measure general attitudes or
Multiple intelligences: Can they be measured? 443
Table 1:
Item Level Distributions.
M SD g2 g1
Items stacked (N=17920) 4.46 1.75 -0.84 -0.38
Item means per subject (n=256) min 2.77 0.92 -1.54 -1.76
max 5.86 2.29 2.88 0.94
Item means per item (P=70) min 2.25 1.11 -1.37 -1.13
max 5.50 2.42 1.69 1.39
Seven items with highest mean (hi -> lo) 3, 16, 59, 13, 37, 35, 29
Seven items with lowest mean (lo -> hi) 19, 51, 6, 58, 60, 12, 40
Seven items with highest stdev (hi -> lo) 29, 24, 46, 59, 63, 64, 53
Seven items with lowest stdev (lo -> hi) 62, 44, 28, 35, 67, 17, 66
Note. g2 = kurtosis, g1 = skewness. See Appendix for item labels.
talents that are needed in academic life. The items refer to the tendency to look for con-
sistency, models and logical series in things, a realistic idea of a person’s strengths and
weaknesses, and the ability to teach others something you know yourself. The highest
rated items included items related to self-reflection and social skills (e.g., 3, 16, 59). This
makes sense because university students need the ability to understand their own feelings
and motives in order to plan their academic studies. Furthermore, even in academic stud-
ies co-operation and teamwork are necessary elements of successful learning (Table 1).
Correlational analysis
The second phase of item analysis was methodologically multi-staged, starting with the
correlations and closing with the results of MIMIC-type modeling (see, e.g., Jöreskog &
Goldberger, 1975; Kaplan, 2000; Loehlin, 1998). The question is whether the inter-item
covariances (correlations) could be reasonably well-conceptualized using Gardner’s
seven intelligences (or their derivatives). The analysis began by examining the correla-
tion matrix. There were 2415 correlation coefficients when the diagonal and double-
presentations were omitted. Their mean was 0.11 and they ranged from -0.74 to 0.81.
Both Pearson product moment and Spearman rank order correlations were calculated, but
as they produced similar results, only product moment correlations were used in the
analyses.
As the average measure intra-class correlation (identical to all-item alpha) was 0.90 in
the previous two-way mixed effect model ANOVA, the measurement area could be
treated as only one dimension: the level of self-evaluated intelligence. However, it was
possible to find relatively independent components in such a seemingly homogeneous set
of items. Some deviating correlations caused problems in the methods that were to be
used. The high negative correlation (r = -.74) between items 1 and 70 was especially

K. Tirri, P. Nokelainen & E. Komulainen
444
disturbing and a clear outsider in the distribution. The reason for this was that the word-
ing of item 70 contained two dimensions, the first one (“At school, studies in native
language or social studies were easier for me …”) relating to linguistic ability and the
second one (“… than mathematics, physics and chemistry”) relating to logical-
mathematical ability. For this reason, the wording of item 70 was changed to “At school,
studies in native language were easy for me.”
There was also a positive tail, indicated by correlations greater than 0.60. This points to
many, but rather specific, components in the matrix. The correlative properties of items
with other items also differed notably. The column (and row) means of correlations and
their dispersion properties (to the other 69 items) show clearly that there were items that
cannot be part of any substantive concept or factor. The same phenomenon could be seen
in a condensed way in the initial communality values of the items (squared multiple
correlation, SMC), and also in the way they loaded onto the first principal component
(see Table 2).
The first two criteria omit the items 12, 11, 6, 60 and 57. The third criterion omits item 1,
which refers to the school experiences in math, physics and chemistry. This item is not
well formulated and is prone to errors. A person might be very good in mathematics,
Table 2:
The Correlative Properties of Items.
Share with other items
M r2 min max
0.036 0.010 0.077
Seven highest (hi -> lo) 14, 15, 32, 62, 55, 61, 2
Seven lowest (lo -> hi) 12, 11, 60, 6, 69, 64, 57
Share with other items
M R2 min max
0.592 0.350 0.834
Seven highest (hi -> lo) 62, 15, 14, 32, 33, 29, 25
Seven lowest (lo -> hi) 12, 6, 20, 11, 57, 60, 64
Principal Component Analysis
First PC loading min max
0.342 -0.271 0.673
Seven highest (hi -> lo) 32, 49, 14, 22, 15, 26, 2
Seven lowest (lo -> hi) 1, 54, 39, 27, 12, 38, 67
Note. See Appendix for item labels.
Multiple intelligences: Can they be measured? 445
physics and chemistry, for example, but still not rank them as his/her favorite subjects.
Alternatively, multi-talented people might prefer arts and physical education and rate
item 1 low for these reasons. It is clear that the enjoyment of an activity and being good
at that activity are quite different. Furthermore, as it was the first item in the question-
naire, this might have had an influence on the rating behavior demonstrated by the stu-
dents (Table 2).
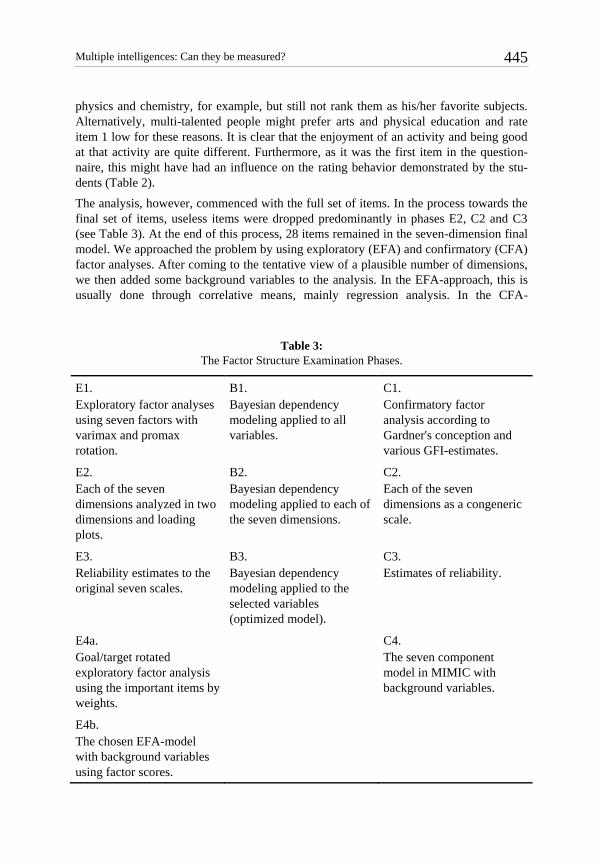
The analysis, however, commenced with the full set of items. In the process towards the
final set of items, useless items were dropped predominantly in phases E2, C2 and C3
(see Table 3). At the end of this process, 28 items remained in the seven-dimension final
model. We approached the problem by using exploratory (EFA) and confirmatory (CFA)
factor analyses. After coming to the tentative view of a plausible number of dimensions,
we then added some background variables to the analysis. In the EFA-approach, this is
usually done through correlative means, mainly regression analysis. In the CFA-
Table 3:
The Factor Structure Examination Phases.
E1.
Exploratory factor analyses
using seven factors with
varimax and promax
rotation.
B1.
Bayesian dependency
modeling applied to all
variables.
C1.
Confirmatory factor
analysis according to
Gardner's conception and
various GFI-estimates.
E2.
Each of the seven
dimensions analyzed in two
dimensions and loading
plots.
B2.
Bayesian dependency
modeling applied to each of
the seven dimensions.
C2.
Each of the seven
dimensions as a congeneric
scale.
E3.
Reliability estimates to the
original seven scales.
B3.
Bayesian dependency
modeling applied to the
selected variables
(optimized model).
C3.
Estimates of reliability.
E4a.
Goal/target rotated
exploratory factor analysis
using the important items by
weights.
C4.
The seven component
model in MIMIC with
background variables.
E4b.
The chosen EFA-model
with background variables
using factor scores.

K. Tirri, P. Nokelainen & E. Komulainen
446
approach, the final step is completed using SEM-modeling and manifest variables with
estimated latent factor scores. We used a Bayesian approach (e.g., Bernardo & Smith,
2000), namely Bayesian Dependency Modeling (BDM, see Nokelainen, 2008), to find
with a data mining approach the most probable model of the statistical dependences
among all the variables. Besides revealing the structure of the domain of the data, we
interactively studied the dependency model by probing it. The approach is summarized
in Table 3.
Modeling of the factor structure
In the following, we apply EFA, CFA, MIMIC and BDM to the data. In each step of the
statistical analysis we refer to the corresponding cell of Table 3. The first step in the
analysis (C1 in Table 3) is the joining of exploratory factor analysis, confirmatory factor
analysis and multiple regression models into a MIMIC model (see, e.g., Bijleveld & van
der Kamp, 1998).
The Chi-Square Test of Model Fit resulted a value of 5791.16 (df = 2324, p <.001, 2
2.49df
). The root mean square error of approximation (RMSEA) is designed to evalu-
ate the approximate fit of the model in the population (Kaplan, 2000). The estimate 0.076
(C.I. = 0.074 - 0.079) was within the range of fair fit level (0.05 – 0.08), indicating medio-
cre fit (for details, see Browne & Cudeck, 1993; Hair et al., 1998). The standardized root
mean square residuals (SRMR) help the investigator to examine how well the aspects of the
data are captured by the model (Loehlin, 2004). The SRMR value of 0.116 indicated some
problems in this aspect, as it was above the cut-off value of .08 (Hu & Bentler, 1995).
Incremental fit measures compare the proposed model to a baseline model that all other
models should be expected to exceed (Hair et al., 1998). Unfortunately the Tucker-Lewis
index (TLI = 0.564), also known as the Non-normed Fit Index (NNFI), was clearly below
the recommended level of .90 (Tucker & Lewis, 1973). That was also the case with a simi-
lar measure, the comparative fit index (CFI = 0.580). Due to such modest fit indices, fur-
ther modeling was not possible without having more information from the exploratory
analyses. For this reason, the following step was then to proceed to E1 (Table 3).
The scree plot of the eigenvalues (of the principal components extracted from the 70*70
correlation matrix) demonstrated, as expected, that there was a strong first component.
We found 18 eigenvalues equal to or greater than 1.0, suggesting an 18-component mod-
el. Further examinations with EFA (step E1 in Table 3) using ML (Maximum Likeli-
hood) method with both orthogonal and oblique rotations revealed that some items did
not share any common component, and the seven-factor solution did not reflect many of
the proposed seven multiple intelligence dimensions.
In step B1, we investigated probabilistic dependences among the variables (for variable
description see Appendix) with a Bayesian search algorithm (Myllymäki, Silander, Tirri,
& Uronen, 2002) in order to find a model with the highest probability. Bayesian De-
pendency Modeling (BDM) allows the analysis of ordinal indicators, and is able to detect

Multiple intelligences: Can they be measured? 447
both linear and nonlinear dependencies (Congdon, 2001). BDM produces a Bayesian
Network (BN, see, e.g., Heckerman, Geiger, & Chickering, 1995) that is a representation
of a probability distribution over the multiple intelligences items.
During the data mining process, 4.027.597 models were evaluated. Table 4 shows a
graphical visualization of BN containing two components: (1) observed variables visual-
ized as ellipses and (2) dependences visualized as lines between nodes. Solid lines indi-
cate direct statistical relations and dashed lines indicate dependency where it is not sure
if there is a direct or indirect (latent) relation. A variable is considered independent of all
other variables if there is no line attached to it.
The first column of Table 4 presents the BN of multiple intelligences variables. The
seven intelligences construct quite clear clusters to the network. Each cluster is labeled
according to the following list: (1) linguistic, (2) logical-mathematical, (3) musical, (4)
spatial, (5) bodily-kinesthetic, (6) interpersonal, and (7) intrapersonal intelligence.
Table 4:
The Initial Bayesian Dependency Model and the Importance Ranking of the Weakest Loading
Variables Measuring Self-evaluated Intelligence.
K. Tirri, P. Nokelainen & E. Komulainen
448
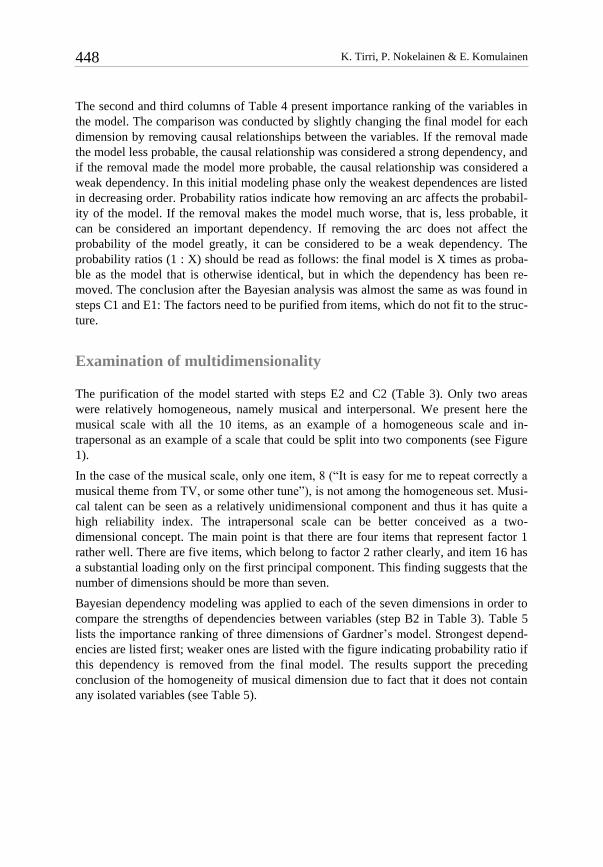
The second and third columns of Table 4 present importance ranking of the variables in
the model. The comparison was conducted by slightly changing the final model for each
dimension by removing causal relationships between the variables. If the removal made
the model less probable, the causal relationship was considered a strong dependency, and
if the removal made the model more probable, the causal relationship was considered a
weak dependency. In this initial modeling phase only the weakest dependences are listed
in decreasing order. Probability ratios indicate how removing an arc affects the probabil-
ity of the model. If the removal makes the model much worse, that is, less probable, it
can be considered an important dependency. If removing the arc does not affect the
probability of the model greatly, it can be considered to be a weak dependency. The
probability ratios (1 : X) should be read as follows: the final model is X times as proba-
ble as the model that is otherwise identical, but in which the dependency has been re-
moved. The conclusion after the Bayesian analysis was almost the same as was found in
steps C1 and E1: The factors need to be purified from items, which do not fit to the struc-
ture.
Examination of multidimensionality
The purification of the model started with steps E2 and C2 (Table 3). Only two areas
were relatively homogeneous, namely musical and interpersonal. We present here the
musical scale with all the 10 items, as an example of a homogeneous scale and in-
trapersonal as an example of a scale that could be split into two components (see Figure
1).
In the case of the musical scale, only one item, 8 (“It is easy for me to repeat correctly a
musical theme from TV, or some other tune”), is not among the homogeneous set. Musi-
cal talent can be seen as a relatively unidimensional component and thus it has quite a
high reliability index. The intrapersonal scale can be better conceived as a two-
dimensional concept. The main point is that there are four items that represent factor 1
rather well. There are five items, which belong to factor 2 rather clearly, and item 16 has
a substantial loading only on the first principal component. This finding suggests that the
number of dimensions should be more than seven.
Bayesian dependency modeling was applied to each of the seven dimensions in order to
compare the strengths of dependencies between variables (step B2 in Table 3). Table 5
lists the importance ranking of three dimensions of Gardner’s model. Strongest depend-
encies are listed first; weaker ones are listed with the figure indicating probability ratio if
this dependency is removed from the final model. The results support the preceding
conclusion of the homogeneity of musical dimension due to fact that it does not contain
any isolated variables (see Table 5).

Multiple intelligences: Can they be measured? 449
Note. See Appendix for item labels.
Figure 1:
Principal Component Analysis Plots of the Homogeneous Musical (3) and the Two-
dimensional Intrapersonal (7) Scale.

K. Tirri, P. Nokelainen & E. Komulainen
450
Tab
le 5
:
Import
ance
Ran
kin
g o
f th
e L
inguis
tic,
Musi
cal,
and I
ntr
aper
sonal
Sca
les
in t
he
Bay
esia
n D
epen
den
cy M
odel
.
No
te. In
f. =
In
fin
itel
y (
extr
emel
y)
imp
ort
ant
var
iable
in t
he
BN
.

Multiple intelligences: Can they be measured? 451
Interpretation of the selected factor structure
The results of the factor structure analysis with the reliability estimates are presented in
Table 6 (steps E3 and C3 in Table 3). The estimates of reliability applied in this study
were the Cronbach’s alpha (α, see Cronbach, 1951; Cronbach, Schonemann, & McKie,
1965) and the Tarkkonen’s rho (T, see Tarkkonen, 1987). The Cronbach alpha’s basic
assumptions allow one-dimensional reliability examination, but the Tarkkonen’s reliabil-
ity index also operates in the context of multi-dimensional models (Vehkalahti, 2000;
MacDougall, 2011). Reliabilities, in the reduced 7*4 = 28 items version, form a relative-
ly sufficient set for a screening device for both samples. Tarkkonen’s unbiased estimates
confirm this conclusion (see Table 6).
The first column of Table 7 presents a BN showing statistical dependencies among the
multiple intelligence variables (step B3 in Table 3). This demonstrates that the 28 select-
ed variables form substantially clearer clusters with the first sample, when compared to
the initial network model of seventy variables. The clusters are labeled as seen in Table
6. The initial examination of this visualization suggests that variable 65 (“When I read, I
form illustrative pictures or designs in my mind”) should be removed from the final
model. The network model indicates that musical (3) and bodily-kinesthetic (5) dimen-
sions form two separate and isolated homogeneous clusters. Linguistic (1), logical-
mathematical (2), spatial (4), interpersonal (6), and intrapersonal (7) intelligences are
closely related to each other through statistical dependencies. Closer examination of the
probability ratios of dependencies reveals that variables 56 (“Metaphors and vivid verbal
expressions help me learn efficiently”), 32 (“I make contact easily with other people”),
Table 6:
The Results of the Factor Structure Analysis with the Reliability Estimates.
Original 7-component
(70 items)
Optimized 7-component
(28 items)
University students University students Vocational students
(n=256) (n=256) (n=152)
α T α T α T
1. Linguistic .64 .77 .71 .74 .58 .59
2. Logical-
mathematical
.76 .81 .75 .77 .67 .74
3. Musical .93 .96 .90 .93 .80 .82
4. Spatial .73 .76 .70 .74 .55 .61
5. Bodily-kinesthetic .74 .87 .85 .89 .82 .85
6. Interpersonal .82 .92 .86 .89 .77 .80
7. Intrapersonal .70 .81 .77 .81 .69 .75
Note. α = Cronbach alpha; T = Tarkkonen rho.

K. Tirri, P. Nokelainen & E. Komulainen
452
Table 7:
Bayesian Dependency Model and the Importance Ranking of the 28 Selected Variables
Measuring Self-evaluated Intelligence.
Note. Inf. = Infinitely (extremely) important variable in the BN, 1=linguistic, 2=logical-mathematical,
3=musical, 4=spatial, 5=bodily-kinesthetic, 6=interpersonal, and 7=intrapersonal intelligence.

Multiple intelligences: Can they be measured? 453
and 48 (“It is easy for me to conceptualize complex and multidimensional patterns”)
should also be omitted from the model.
Table 7 shows that the Bayesian network of the second sample (n = 152) contains only
18 variables. The network for the second sample shows clear clusters of items measuring
the musical, bodily-kinesthetic, interpersonal and intrapersonal dimensions. We believe
that this is mostly due to a smaller sample size, which leads to a lack of power in the
analysis (Murphy & Myors, 1998).
Modeling of the optimized factor structure
Goal rotation, using one core item per scale in a more influential position in rotation,
does not add much to the picture obtained with the full-free, non-constrained EFA. When
factor scores are calculated from the ML solution (7 factors, promax rotation), they
show, however, a rather good fit to the factor scores. The 28-item seven-component
model was factor analyzed in the CFA mode using congeneric thinking: an index had a
path from one latent variable only (step E4a in Table 3). In addition, as no error covari-
ances were allowed (the error terms were kept uncorrelated), the model represented
several sets of congeneric scores (Jöreskog & Sörbom, 1979, pp. 52-54). The general
self-esteem or general self-concept is difficult to model, although there were strong indi-
cations of such a dimension in the initial data screening.
The results of CFA indicate that the 28-item optimized model fits the first sample well.
The ratio of the chi-square to the degrees of freedom (2.43) and the RMSEA (0.08) are
small, indicating good model fit. Earlier research (Tirri & Komulainen, 2002) studied the
possibility of a 12-component model with 53 items. The psychometric exploration indi-
cated that the 12-component model would be more valid and appropriate to measure all
the different areas of Gardner’s intelligences. However, the optimized seven-component
model with 28 items is shorter and more convenient in practice. Furthermore, the seven-
component model revealed the same trends as the more detailed 12-component one. Also
the corresponding indices for the second sample were satisfactory given that the model
consisted of 28 observed variables but only 152 observations (see Table 8).
Some areas in self-evaluated intelligence are explained by the background information of
the participants (step E4b in Table 3). Table 9 presents the following background varia-
bles – gender (1 = Male, 2 = Female); age (date of birth, from 1950 to 1981); mother
tongue (first sample: matriculation examination score, from 1 = lowest to 6 = highest;
second sample: self-assessed score, from 1 = lowest to 5 = highest); mathematical skills
(first sample: matriculation examination score, from 1 = lowest to 6 = highest; second
sample: self-assessed score, from 1 = lowest to 5 = highest); and motivation (self-rated
score from 1 = lowest to 5 = highest) – and their zero-order correlations to the multiple
intelligences dimensions. The results regarding the first sample (university students, n =
256) indicate that gender is a powerful explanation of verbal facility (r = .49, p < .001) as
the females rated their abilities higher than did the males. Furthermore, linguistic ability
seems to increase with age (r = .22, p < .001). These correlations were not present in the

K. Tirri, P. Nokelainen & E. Komulainen
454
Table 8:
The Goodness-of-fit Values for the 7-component Model.
7-component optimized model
Statistic University students
(n=256)
Vocational students
(n=152)
Chi-Square 799.46 915.35
Df 329 329
p-value < .001 < .001
Chi-square/df 2.43 2.78
CFI .864 .662
TLI .843 .612
RMSEA .075 .109
CI90 .068 <-> .081 .100 <-> .117
SRMR .088 .118
results of the second sample (vocational students, n = 152). Both samples showed that
good grades in the mother tongue also explained high ratings in this component, univer-
sity students r(256) = .34, p < .001 and vocational students r(152) = .25, p < .01. The
female university students were shown to rate themselves significantly higher than did
the males in both interpersonal (r = .29, p < .001) and intrapersonal intelligence (r = .45,
p < .001). Also the female vocational students rated their intrapersonal intelligence sig-
nificantly higher than males, r(152) = .23, p < .01. The males in both samples perceived
their logical-mathematical skills significantly better than did their female colleagues,
r(256) = -.27, p < .001 and r(152) = -.27, p < .01. Both samples also indicated that high
motivation explained statistically significant skills in the interpersonal, r(256) = .35, p <
.001 and r(152) = .32, p < .01, and intrapersonal areas, r(256) = .19, p < .001 and r(152)
= .24, p < .01. Statistically significant correlation was also found from both samples
between school success in mathematics and self-assessed logical-mathematical intelli-
gence, r(256) = .19, p < .05 and r(152) = .37, p < .01. Both samples also indicated nega-
tive correlation between mathematical ability and interpersonal intelligence, r(256) =
-.22, p < .001 and r(152) = -.14, ns. An interesting finding related to the second sample
(vocational students) was that the international vocational skills competition final score
correlated statistically significantly with interpersonal, r(152) = .23, p < .01, and in-
trapersonal r(152) = .25, p < .01, intelligences (Table 9).
These analyses will give no definite answer to the basic question of whether the multiple
intelligences model can be confirmed in self-evaluated intelligence. This inspection
indicates, however, that we may proceed with such an instrument and its development.
Concerning our psychometric testing, Gardner’s theory offers a promising background to
the revision of self-concept, especially that relating to the academic area.

Multiple intelligences: Can they be measured? 455
Table 9:
The Background Variables Explaining the Self-evaluated Intelligence.
7-component model (28 items) Gender Age Mother
tongue
Mathematics Motivation
University students (n=256)
1. Linguistic .49*** .22*** .34*** -.16** .14*
2. Logical-mathematical -.27*** -.03 -.02 .19** .15
3. Musical .04 .13* .07 -.07 .13*
4. Spatial .09 .08 -.06 -.17** .09
5. Bodily-kinesthetic .01 .02 -.15* -.12 .04
6. Interpersonal .29*** .20*** .07 -.22*** .35***
7. Intrapersonal .45*** .16** .05 -.15* .19**
Vocational students (n=152)
1. Linguistic .07 -.01 .25** -.01 .15
2. Logical-mathematical -.27** .01 .07 .37** .18*
3. Musical .12 .03 .16* .02 .13
4. Spatial -.27** .05 .11 .19* .26**
5. Bodily-kinesthetic -.13 .06 .04 -.12 .07
6. Interpersonal .09 .10 .03 -.14 .32**
7. Intrapersonal .23** .07 .25** -.05 .24**
* p < .05; ** p < .01; *** p < .001
Concluding remarks: Are we measuring intelligences or
sensitivities?
We do not equate all the positive qualities we find in people with intelligences. There are
many strengths and skills, in addition to intelligence, that need to be educated. Those
qualities that do not meet the original criteria for multiple intelligences proposed by
Gardner may be called sensitivities. In our work, we introduce several sensitivity
measures that some authors may call intelligences. These sensitivities include spiritual
sensitivity, environmental sensitivity, ethical sensitivity, emotional sensitivity and inter-
cultural and interreligious sensitivities (Tirri & Nokelainen, 2011).
The existence of spiritual intelligence, for example, has been a widely debated issue and
not everybody is ready to label advanced thinking in religious or spiritual domains as
intelligence (Tirri, Nokelainen, & Ubani, 2006). This has guided us to use the term ‘sen-
sitivity’, which is easier to justify than ‘intelligence’ in these areas of human behavior.
Furthermore, environmental sensitivity includes many elements that are very close to the
possible naturalist intelligence suggested by Gardner, while emotional sensitivity reflects
many aspects of emotional intelligence or social intelligence (Goleman, 1995, 1996).

K. Tirri, P. Nokelainen & E. Komulainen
456
Ethical sensitivity, on the other hand, is very close to the qualities some authors call
moral intelligence (Lennick & Kiel, 2005). According to Moran (2011), assessing a
person’s sensitivity to opportunities to engage the intelligence allows further investiga-
tion of the person/environment interaction. She argues that both educators and students
could use such assessments “as supports for developing their awareness and sensitivity to
their growing selves and how that self impacts the wider world” (p. 131).
References
Armstrong, T. (1993). 7 kinds of smart. New York: A Blume Book.
Bandura, A. (1978). Reflections on self-efficacy. Advances in Behavior Research Therapy, 1,
237-269.
Bernardo, J., & Smith, A. (2000). Bayesian Theory. New York: John Wiley & Sons.
Bijleveld, C., & van der Kamp, L. (1998). Longitudinal data analysis. Designs, models and
methods. SAGE Publications: London.
Browne, M. W., & Cudeck, R. (1993). Alternative ways of assessing model fit. In K. A. Bol-
len & S. Long (Eds.), Testing structural equation models (pp. 136-162). Newbury Park:
Sage.
Byrne, B., & Gavin, D. (1996). The Shavelson model revisited: Testing for the structure of
academic self-concept across pre-, early, and late adolescents. Journal of Educational
Psychology, 88, 215-228.
Congdon, P. (2001). Bayesian Statistical Modelling. London: Wiley.
Cronbach, L. (1951). Coefficient alpha and the internal structure of tests. Psychometrica, 16,
297-334.
Cronbach, L., Schonemann, P., & McKie, D. (1965). Alpha coefficients for stratified-parallel
tests. Educational and Psychological Measurement, 25, 291-312.
DeVellis, R. F. (2003). Scale Development. Theory and Applications. Second edition. Thou-
sand Oaks, CA: Sage.
Gardner, H. (1991). The unschooled mind. London: Fontana Press.
Gardner, H. (1993). Frames of mind. New York: Basic Books.
Gardner, H. (1995). Reflections on multiple intelligences: Myths and Messages. Phi Delta
Kappan, 77(3), 200-209.
Goleman, D. (2005). Emotional Intelligence. New York: Bantam Books.
Goleman, D. (2006). Social Intelligence. New York: Bantam Books.
Guildford, J. (1967). The nature of human intelligence. New York: Mc Graw-Hill.
Hair, J. F., Anderson, R. E., Tatham, R. L., & Black, W. C. (1998). Multivariate Data Analy-
sis. Fifth edition. Englewood Cliffs, NJ: Prentice Hall.
Heckerman, D., Geiger, D., & Chickering, D. M. (1995). Learning Bayesian networks: The
combination of knowledge and statistical data. Machine Learning, 20, 197–243.
Multiple intelligences: Can they be measured? 457
Hu, L., & Bentler, P. (1995). Evaluating model fit. In R. H. Hoyle (Ed.), Structural equation
modeling: Concepts, issues and applications (pp. 76-99). Thousand Oaks: Sage.
Johnson, D. R., & Creech, J. C. (1983). Ordinal Measures in Multiple Indicator Models: A
Simulation Study of Categorization Error. American Sociological Review, 48(3), 398–
407.
Jöreskog, K., & Goldberger, A. (1975). Estimation of a model with multiple indicators and
multiple causes of a single latent variable. Journal of American Statistical Association,
70, 631-639.
Jöreskog, K., & Sörbom, D. (1979). Advances in factor analysis and structural equation
models. Cambridge, MA: Abt Books.
Kerlinger, F. (1973). Foundations of behavioral research. London: Holt, Rinehart & Winston.
Kaplan, D. (2000). Structural Equation Modeling. Foundations and Extensions. Thousand
Oaks: Sage.
Lennick, D., & Kiel, F. (2005). Moral Intelligence: Enhancing Business Performance and
Leadership Success. Upper Saddle River, NJ: Pearson.
Loehlin, J. (1998). Latent variable models. An introduction to factor, path, and structural
analysis. Third Edition. Mahwah, NJ: Lawrence Erlbaum Associates.
MacDougall, M. (2011). Moving Beyond the Nuts and Bolts of Score Reliability in Medical
Education: Some Valuable Lessons from Measurement Theory. Advances and Applica-
tions in Statistical Sciences, 6(7), 643-664.
Malmivuori, M. (2001). The dynamics of affect, cognition, and social environment in the
regulation of personal learning processes: The case of mathematics. Research report 172.
Department of Education. Helsinki: University of Helsinki.
Moran, S. (2011). Assessing and developing multiple intelligences purposefully. In K. Tirri &
P. Nokelainen, Measuring multiple intelligences and moral sensitivities in education (pp.
123-135). Rotterdam: Sense Publishers.
Moran, S., & Gardner, H. (2006). Multiple intelligences in the workplace. In H. Gardner
(Ed.), Multiple intelligences: New horizons (pp. 213-232). New York: Basic Books.
Murphy, K. R., & Myors, B. (1998). Statistical Power Analysis. A Simple and General Model
for Traditional and Modern Hypothesis Tests. Mahwah, NJ: Lawrence Erlbaum Associ-
ates.
Myllymäki, P., Silander, T., Tirri, H., & Uronen, P. (2002). B-Course: A Web-Based Tool for
Bayesian and Causal Data Analysis. International Journal on Artificial Intelligence Tools,
11(3), 369-387.
Nokelainen, P. (2008). Modeling of Professional Growth and Learning: Bayesian approach.
Tampere: Tampere University Press.
Nokelainen, P., Smith, H., Rahimi, M., Stasz, C., & James, S. (2012). What Contributes to
Vocational Excellence? Characteristics and experiences of Competitors and Experts in
WorldSkills London 2011. Madrid, Spain: WorldSkills Foundation. Retrieved 6th of July,
2013, from: http://www.worldskillsfoundation.org/downloads/WSF_MoVE_Global_re
port_WSC2011.pdf.

K. Tirri, P. Nokelainen & E. Komulainen
458
Shavelson, R., Hubner, J., & Stanton, G. (1996). Self-concept: Validation of construct inter-
pretations. Review of Educational Research, 46, 407-441.
Shearer, C. B. (2009). The challenges of assessing multiple intelligences around the world. In
J. Chen, S. Moran, & H. Gardner (Eds.), Multiple intelligences around the world (pp. 352-
362). San Francisco: Jossey-Bass.
Sternberg, R. (1985). Beyond IQ: a triarchic theory of human intelligence. New York: Cam-
bridge University Press.
Sternberg, R. (1991). Death, taxes, and bad intelligence tests. Editorial. Intelligence, 15(3),
257-269.
Tarkkonen, L. (1987). On reliability of composite scales. An essay on the structure of meas-
urement and the properties of the coefficients of reliability – a unified approach. Statisti-
cal Studies 7. Helsinki: The Finnish Statistical Society.
Thurstone, L. (1960). The nature of intelligence. Littlefield: Adams.
Tirri, K. (1993). Evaluating teacher effectiveness by self-assessment: a cross-cultural study.
Research report 122. Department of Teacher Education. Helsinki: Yliopistopaino.
Tirri, K. (1997). How Finland meets the needs of gifted and talented pupils. High Ability
Studies, 8(2), 213-222.
Tirri, K., & Komulainen, E. (2002). Modeling a Self-rated Intelligence-profile for Virtual
University. In H. Niemi & P. Ruohotie (Eds.), Theoretical Understandings for Learning
in Virtual University (pp. 139-168). Research Centre for Vocational Education and Train-
ing, University of Tampere. Hämeenlinna: RCVE.
Tirri, K., Komulainen, E., Nokelainen, P., & Tirri, H. (2002). Conceptual Modeling of Self-
Rated Intelligence Profile. In Proceedings of the 2nd International Self-Concept Research
Conference. Sydney: University of Western Sydney.
Tirri, K., Komulainen, E., Nokelainen, P., & Tirri, H. (2003, April). Gardner's Theory Ap-
plied to Model a Self-Rated Intelligence Profile. Paper presented at the annual meeting of
the American Educational Research Association, Multiple Intelligences SIG, Chicago,
USA.
Tirri, K., & Nokelainen, P. (2008). Identification of multiple intelligences with the Multiple
Intelligence Profiling Questionnaire III. Psychology Science Quarterly, 50(2), 206-221.
Tirri, K., & Nokelainen, P. (2011). Measuring multiple intelligences and moral sensitivities in
education. Rotterdam: SensePublishers.
Tirri, K., Nokelainen, P., & Ubani, M. (2006). Conceptual definition and empirical validation
of a spiritual sensitivity scale. Journal of Empirical Theology, 19(1), 37-62.
Tucker, T. L., & Lewis, C. (1973). A reliability coefficient for maximum likelihood factor
analysis. Psychometrica, 38, 1-10.
Vehkalahti, K. (2000). Reliability of measurement scales. Tarkkonen’s general method super-
sedes Cronbach’s alpha. Statistical Studies 17. Helsinki: The Finnish Statistical Society.

Multiple intelligences: Can they be measured? 459
Appendix
Item selection process
Original version Initial version Final version
1. Linguistic 04, 09, 12, 31, 34, 40,
56, 60, 69, 70
04, 40, 37, 70 04, 40, 56,
70
2. Logical-
mathematical
01, 21, 27, 30, 37, 39,
44, 54, 57, 66
01, 30, 39, 44, 27 01, 30, 39,
54
3. Musical 02, 08, 14, 15, 19, 26,
55, 58, 61, 62
02, 14, 15, 19, 55, 61,
62
14, 15, 55,
62
4. Spatial 05, 10, 13, 18, 20, 38,
48, 53, 63, 65
05, 13, 38, 48, 53, 65 05, 48, 53,
65
5. Bodily-
kinesthetic
06, 07, 25, 29, 33, 36,
45, 47, 52, 67
07, 25, 29, 33, 45, 67 29, 33, 45,
67
6. Interpersonal 11, 22, 23, 32, 35, 43,
46, 49, 50, 59
23, 32, 49, 50 22, 23, 32,
59
7. Intrapersonal 03, 16, 17, 24, 28, 41,
42, 51, 64, 68
03, 17, 24, 42, 51 03, 16, 17,
42
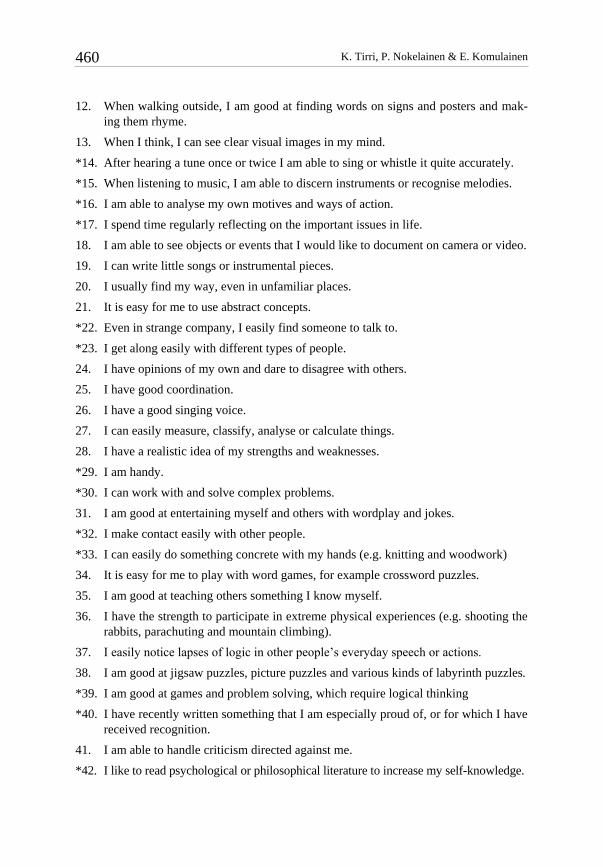
The Multiple Intelligences Profiling Questionnaire
Items selected for the final version are marked with *
*1. At school I was good at mathematics, physics or chemistry.
2. I am good at singing or playing an instrument.
*3. I often think about my own feelings and sentiments and seek reasons for them.
*4. Writing is a natural way for me to express myself.
*5. At school, geometry and various kinds of assignments involving spatial perception
were easier for me than solving equations.
6. I have a talent to form a mental picture of objects by touching them.
7. I am very good at tasks that require good coordination.
8. It is easy for me to repeat correctly a musical theme from TV, or some other tune.
9. I enjoy reading demanding novels or classics.
10. Other people say that I am good with colours.
11. One of my strengths is problem solving together with other people.
K. Tirri, P. Nokelainen & E. Komulainen
460
12. When walking outside, I am good at finding words on signs and posters and mak-
ing them rhyme.
13. When I think, I can see clear visual images in my mind.
*14. After hearing a tune once or twice I am able to sing or whistle it quite accurately.
*15. When listening to music, I am able to discern instruments or recognise melodies.
*16. I am able to analyse my own motives and ways of action.
*17. I spend time regularly reflecting on the important issues in life.
18. I am able to see objects or events that I would like to document on camera or video.
19. I can write little songs or instrumental pieces.
20. I usually find my way, even in unfamiliar places.
21. It is easy for me to use abstract concepts.
*22. Even in strange company, I easily find someone to talk to.
*23. I get along easily with different types of people.
24. I have opinions of my own and dare to disagree with others.
25. I have good coordination.
26. I have a good singing voice.
27. I can easily measure, classify, analyse or calculate things.
28. I have a realistic idea of my strengths and weaknesses.
*29. I am handy.
*30. I can work with and solve complex problems.
31. I am good at entertaining myself and others with wordplay and jokes.
*32. I make contact easily with other people.
*33. I can easily do something concrete with my hands (e.g. knitting and woodwork)
34. It is easy for me to play with word games, for example crossword puzzles.
35. I am good at teaching others something I know myself.
36. I have the strength to participate in extreme physical experiences (e.g. shooting the
rabbits, parachuting and mountain climbing).
37. I easily notice lapses of logic in other people’s everyday speech or actions.
38. I am good at jigsaw puzzles, picture puzzles and various kinds of labyrinth puzzles.
*39. I am good at games and problem solving, which require logical thinking
*40. I have recently written something that I am especially proud of, or for which I have
received recognition.
41. I am able to handle criticism directed against me.
*42. I like to read psychological or philosophical literature to increase my self-knowledge.

Multiple intelligences: Can they be measured? 461
43. I am the kind of person that neighbours, colleagues or fellow students turn to for
advice and instructions.
44. I tend to look for consistency, models and logical series in things.
*45. I am good at showing how to do something in practise.
46. I easily recognise other peoples’ motives.
47. It is easy for me to imitate other peoples’ gestures, facial expressions and ways of
moving.
*48. It is easy for me to conceptualise complex and multidimensional patterns.
49. It is easy for me to understand other peoples’ feelings and moods.
50. I consider myself a leader (or have been called one by other people).
51. I keep a diary or note down happenings of my inner life.
52. I often “talk with my hands“ and/or otherwise use body language when talking to
someone.
*53. I can easily imagine how a landscape looks from a bird’s-eye view.
*54. Mental arithmetic is easy for me.
*55. I can easily keep the rhythm when drumming a melody.
*56. Metaphors and vivid verbal expressions help me learn efficiently.
57. I am good at making decisions or predictions from new scientific discoveries.
58. I play a musical instrument or otherwise take part in musical activities.
*59. In negotiations and groupwork, I am able to support the group to find a consensus.
60. I have a talent to use concepts or expressions, which are not very typical in other
people's everyday talk.
61. I quickly recognise a song or piece of music.
*62. I notice immediately if a melody is out of tune.
63. I’m good at drawing and designing various kinds of figures.
64. When necessary, I am able to motivate myself, even for unpleasant tasks.
*65. When I read, I form illustrative pictures or designs in my mind.
66. I want to present things as logically as possible and give reasons for them.
*67. I was good at handicrafts at school.
68. I can handle the emotions caused by serious setbacks.
69. In conversation, I often refer to things that I have read or heard about.
*70. At school studies in native language or social studies were easier for me than math-
ematics, physics and chemistry. (Note new wording: At school, studies in native
language were easy for me.)