multifamily monthly - apartmentpropertytransactions.us · since it is very close to the long-term...
TRANSCRIPT

Multifamily Monthly
February 2018

Sacramento’s Long Reign Ends; Multifamily Rents Steady
U.S. multifamily rents barely budged again in Feb-ruary, and have been virtually unchanged since last summer. The deceleration was expected, coming after a long period of above-trend growth and just as deliveries were reaching a cycle peak. We fore-cast a slowdown, so growth of 2.7% is not surpris-ing. Nor is it something to be disappointed with, since it is very close to the long-term average.
If there is anything in the results to keep an eye on, it is that February’s growth was the weakest seasonal gain since the recovery took hold. In oth-er words, you would have to go back seven years to find a February in which rents increased less. Multifamily rents are seasonal, with most growth traditionally coming in the first half of the year. Demand for apartments should get a marginal boost from the new tax law, which reduces some of the tax benefits of homeownership, especially in states with high single-family home prices. So
it’s possible that rent growth will soon pick up as it normally does in the spring months.
If not, then it could be a sign that the headwinds are stronger than many anticipated. Not only are there concerns about property fundamentals but now economic uncertainty has started to creep into the picture. Interest rates are rising amid worries about inflation, and the baffling rush to implement tariffs on steel and aluminum threat-ens to cancel the business confidence boost pro-vided by the ongoing regulatory relief and corpo-rate tax cuts that are going into effect this year.
Meanwhile, a recent surge has raised Orlando to the top spot in the Matrix metro rankings. Its 7.0% year-over-year growth pushes Sacramento (second at 6.8%) out of that placement for the first time since June 2016.
National Average Rents
National averages include 125 markets tracked by Matrix, not just the 30 metros featured in the report. All data provided by YardiMatrix.
■ U.S. multifamily rents remained steady in February, rising $1 to $1,364. On a year-over-year basis, rent growth was 2.7% through February, down 10 basis points from the prior month.
■ Rents have barely budged over the last eight months. Average U.S. rents hit $1,363 in July, and have remained within a $2 range—between $1,363 and the all-time high of $1,365 set in August 2017—ever since. We expect growth to remain moderate this year, as metros deal with a host of issues that include the growing amount of new supply and demand for units affordable to middle-income Americans.
■ Orlando has surged to the top of the metro ranking, with year-over-year growth of 7.0%, marking the first time in 21 months—since June 2016—that Sacramento was not the top metro.
Matrix Monthly | February 2018 | 02

Matrix Monthly | February 2018 | 03
Year-Over-Year Rent Growth: Orlando Jumps to the Head of the Class
Year-Over-Year Rent Growth— Renter-by-Necessity Asset Class
Year-Over-Year Rent Growth— Lifestyle Asset Class
Year-Over-Year Rent Growth— All Asset Classes
Source: YardiMatrix Source: YardiMatrix Source: YardiMatrix
■ U.S. rent growth increased 2.7% on a year-over-year basis in February. Orlando (7.0%) was the fastest-growing market, unseating Sacramento (6.8%) atop our ranking for the first time since June 2016.
■ Renter-by-Necessity (RBN) properties (3.3%) outperformed luxury Lifestyle (1.9%) properties, as the gap between workforce and luxury rent growth widens. Nearly 90% of new supply is Lifestyle.
■ Orlando has benefited from continuously strong job growth, increased migration in the wake of Hurricane Maria, and a warm climate that does not lend itself to seasonal rental declines.

Matrix Monthly | February 2018 | 04
Trailing 3 Months Sequential— Lifestyle Asset Class
Trailing 3 Months Sequential— Renter-by-Necessity Asset Class
Trailing 3 Months Sequential— All Asset Classes
Trailing 3 Months: Sunbelt Metros, Twin Cities Post Strong Gains
Rents were once again flat nationwide on a trail-ing three-month (T-3) basis, which compares the last three months to the previous three months. The T-3 reflects short-term changes and may not be indicative of long-term trends.
Orlando led all markets with 0.6% overall rent growth, followed by Miami (0.4%), Phoenix and
Source: YardiMatrix Source: YardiMatrix Source: YardiMatrix
■ Growth was strongest in Sunbelt metros and the Twin Cities.
■ Some markets with active delivery pipelines are lagging in short-term rent growth.
the Twin Cities (both 0.3%). Despite the Minneso-ta winter, the Twin Cities are experiencing ongoing strong multifamily demand—and it helps to have the highest occupancy rate in the nation at 97.3%.
Austin, Charlotte (both -0.3%), Raleigh and Nash-ville (both -0.2%) round out the bottom of the ranking, with sizeable new supply a drag on rents.
Sacramento rents have been at or near the top of the rankings for four years due to weak supply growth and demand from residents moving from the Bay Area, but there are some indications of softening. For example, rents of luxury Lifestyle units declined 40 basis points on a T-3 basis.

Matrix Monthly | February 2018 | 05
To understand the decline in rent growth by metro between year-end 2016 and 2017, we analyzed multiple factors, including changes in employment and the overall increase in supply. By far the metric that tracked most closely with the change in rents was the occupancy rate. There is a clear connection between the amount of new stock coming online and changes in occupancy rates, although metros where job growth remains robust and produces high demand are better able to absorb new units.
Although occupancy rates are high by historical levels, they have fallen 60 basis points in each of the last two years. With supply growth expected to hit a cycle peak of 360,000 in 2018, it’s a good bet that rent growth will level off or continue to decel-erate in most metros for another year or two. Be-yond that, rent increases will depend on how well developers calibrate their efforts with demand for rental units. The link is strongest over the short term, as the correlation fades over three- and five-year periods.
For full details about the study, see the paper, “It’s the Occupancy: Why Rents are Decelerat-ing,” which is available on the Publications page of the Yardi Matrix website.
Orlando’s rise to the top of the rankings is driven by strong employment growth and in-migration from households moving from colder, more expensive parts of the country. Year-over-year job growth as of December was 2.9%, helping keep rent increas-es high even though supply grew 3.1% in 2017.
Other metros with robust employment gains and among the highest rent growth include:
■ Las Vegas (rents up 5.8%), with 2.9% year-over-year job growth and only 1.3% increase in supply.
■ The Inland Empire (rents up 4.4%), with 3.0% job growth and only 0.9% increase in supply.
■ Tampa (rents up 4.0%), with 2.5% job growth and 2.8% increase in supply.
Employment, Supply and Occupancy Trends; Forecast Rent Growth
■ National occupancy rates continue their slow slide downward as new deliveries reach a cycle high.
■ On a metro level, how much rent growth has decelerated is closely correlated with how much occupancy rates have declined over the short term.
■ Strong job growth has boosted demand in most of the metros where rent increases remain high.

Matrix Monthly | February 2018 | 06
I N S P I R A T I O N H U T - 0 . 2 5 C M G R I D
Employment, Supply and Occupancy Trends; Forecast Rent Growth
Market
YoY Rent Growth as of Feb - 18
Forecast Rent Growth
(YE 2018)
YoY Job Growth (6-mo. moving avg.)
as of Dec - 17
Completions as % of Total Stock
as of Feb - 18
Occupancy Rates as of
Jan - 17
Occupancy Rates as of
Jan - 18
Sacramento 6.8% 7.2% 1.9% 0.3% 97.0% 96.5%
Phoenix 4.1% 5.0% 1.9% 2.2% 95.0% 94.4%
Inland Empire 4.4% 4.9% 3.0% 0.9% 96.5% 95.8%
Las Vegas 5.8% 4.8% 2.9% 1.3% 95.4% 94.5%
Seattle 3.0% 4.8% 2.4% 5.1% 96.4% 95.1%
Los Angeles 3.7% 4.7% 1.2% 2.1% 97.1% 96.7%
Orlando 7.0% 4.5% 2.9% 3.1% 96.0% 95.4%
Dallas 2.4% 4.4% 2.7% 2.7% 95.6% 94.7%
Tampa 4.0% 3.7% 2.5% 2.8% 95.6% 95.1%
Atlanta 3.2% 3.7% 2.6% 2.8% 94.5% 94.1%
Twin Cities 3.6% 3.7% 2.3% 2.3% 97.9% 97.3%
Raleigh 1.5% 3.5% 3.0% 2.6% 95.3% 94.3%
Orange County 2.8% 3.1% 0.7% 2.4% 96.9% 96.0%
Denver 2.7% 3.0% 2.1% 3.3% 95.0% 94.8%
Indianapolis 2.0% 3.0% 1.9% 1.8% 94.3% 93.8%
Chicago 1.1% 2.8% 0.6% 2.7% 95.4% 94.6%
San Francisco 2.4% 2.8% 1.5% 2.3% 96.5% 95.7%
Boston 2.0% 2.6% 2.0% 3.4% 96.8% 96.3%
San Jose 2.6% 2.4% 1.5% 2.7% 96.1% 95.5%
Houston 2.9% 2.3% 1.5% 3.2% 93.3% 93.4%
Miami 2.0% 2.3% 2.2% 4.0% 95.9% 94.9%
Philadelphia 2.0% 2.3% 1.5% 1.6% 95.9% 95.4%
Charlotte 1.4% 2.2% 2.0% 2.9% 95.7% 95.1%
Nashville 0.0% 2.1% 2.7% 4.5% 96.0% 94.3%
Kansas City 2.8% 2.0% 1.1% 2.7% 95.3% 94.8%
San Antonio 1.2% 2.0% 2.7% 2.7% 93.7% 92.6%
Austin 0.1% 1.6% 2.5% 4.1% 94.5% 94.1%
Baltimore 0.9% 1.5% 1.3% 1.5% 94.8% 94.4%
Portland 1.1% 1.5% 2.4% 2.7% 95.9% 94.9%
Washington DC 0.2% 1.3% 1.8% 2.3% 95.8% 95.0%
Source: YardiMatrix

Matrix Monthly | February 2018 | 07
I N S P I R A T I O N H U T - 0 . 2 5 C M G R I D
Occupancy—All Asset Classes by Month
Overall Lifestyle Renter-by-Necessity
Occupancy & Asset Classes
Source: YardiMatrix
Year-Over-Year Rent Growth, Other Markets
MarketFebruary 2018
Overall Lifestyle Renter-by-NecessityReno 10.4% 8.0% 11.9%
Tacoma 6.9% 5.7% 8.2%
Colorado Springs 5.1% 4.4% 5.8%
Central Valley 5.1% 3.6% 5.4%
San Fernando Valley 4.5% 3.5% 5.2%
Long Island 4.2% 3.7% 4.4%
Tucson 3.8% 4.0% 3.9%
NC Triad 3.0% 2.2% 3.6%
SW Florida Coast 3.0% 2.4% 3.6%
Indianapolis 2.0% 1.2% 2.6%
Northern New Jersey 1.8% 0.5% 2.9%
Louisville 1.8% -0.2% 2.7%
Albuquerque 1.7% 1.3% 1.8%
Bridgeport–New Haven 1.6% 1.7% 1.6%
St. Louis 1.5% -1.0% 2.1%
El Paso 0.9% 2.1% 0.4%
Central East Texas -2.4% -3.7% -2.0%
Source: YardiMatrix

Matrix Monthly | February 2018 | 08
-4%
-2%
0%
2%
4%
6%
8%
10%
12%
02/1/14 02/1/15 02/1/16 02/1/17 02/1/18
Boston
-4%
-2%
0%
2%
4%
6%
8%
10%
12%
02/1/14 02/1/15 02/1/16 02/1/17 02/1/18
Denver
-4%
-2%
0%
2%
4%
6%
8%
10%
12%
02/1/14 02/1/15 02/1/16 02/1/17 02/1/18
Dallas
-4%
-2%
0%
2%
4%
6%
8%
10%
12%
02/1/14 02/1/15 02/1/16 02/1/17 02/1/18
Houston
-4%
-2%
0%
2%
4%
6%
8%
10%
12%
02/1/14 02/1/15 02/1/16 02/1/17 02/1/18
Inland Empire
-4%
-2%
0%
2%
4%
6%
8%
10%
12%
02/1/14 02/1/15 02/1/16 02/1/17 02/1/18
Atlanta
-4%
-2%
0%
2%
4%
6%
8%
10%
12%
02/1/14 02/1/15 02/1/16 02/1/17 02/1/18
Boston
-4%
-2%
0%
2%
4%
6%
8%
10%
12%
02/1/14 02/1/15 02/1/16 02/1/17 02/1/18
Denver
-4%
-2%
0%
2%
4%
6%
8%
10%
12%
02/1/14 02/1/15 02/1/16 02/1/17 02/1/18
Dallas
-4%
-2%
0%
2%
4%
6%
8%
10%
12%
02/1/14 02/1/15 02/1/16 02/1/17 02/1/18
Houston
-4%
-2%
0%
2%
4%
6%
8%
10%
12%
02/1/14 02/1/15 02/1/16 02/1/17 02/1/18
Inland Empire
-4%
-2%
0%
2%
4%
6%
8%
10%
12%
02/1/14 02/1/15 02/1/16 02/1/17 02/1/18
Atlanta
Dallas
Houston
Atlanta Boston
Inland Empire
Denver
Trailing 12 Months Overall Trailing 12 Months Lifestyle Trailing 12 Months Renter-by-Necessity
Market Rent Growth by Asset Class
Source: YardiMatrix

Matrix Monthly | February 2018 | 09
Phoenix
Orange County
Orlando
Las Vegas
-4%
-2%
0%
2%
4%
6%
8%
10%
12%
02/1/14 02/1/15 02/1/16 02/1/17 02/1/18
Los Angeles
-4%
-2%
0%
2%
4%
6%
8%
10%
12%
02/1/14 02/1/15 02/1/16 02/1/17 02/1/18
Las Vegas
-4%
-2%
0%
2%
4%
6%
8%
10%
12%
02/1/14 02/1/15 02/1/16 02/1/17 02/1/18
Miami
-4%
-2%
0%
2%
4%
6%
8%
10%
12%
02/1/14 02/1/15 02/1/16 02/1/17 02/1/18
OC
-4%
-2%
0%
2%
4%
6%
8%
10%
12%
02/1/14 02/1/15 02/1/16 02/1/17 02/1/18
Orlando
-4%
-2%
0%
2%
4%
6%
8%
10%
12%
02/1/14 02/1/15 02/1/16 02/1/17 02/1/18
Phoenix
-4%
-2%
0%
2%
4%
6%
8%
10%
12%
02/1/14 02/1/15 02/1/16 02/1/17 02/1/18
Los Angeles
-4%
-2%
0%
2%
4%
6%
8%
10%
12%
02/1/14 02/1/15 02/1/16 02/1/17 02/1/18
Las Vegas
-4%
-2%
0%
2%
4%
6%
8%
10%
12%
02/1/14 02/1/15 02/1/16 02/1/17 02/1/18
Miami
-4%
-2%
0%
2%
4%
6%
8%
10%
12%
02/1/14 02/1/15 02/1/16 02/1/17 02/1/18
OC
-4%
-2%
0%
2%
4%
6%
8%
10%
12%
02/1/14 02/1/15 02/1/16 02/1/17 02/1/18
Orlando
-4%
-2%
0%
2%
4%
6%
8%
10%
12%
02/1/14 02/1/15 02/1/16 02/1/17 02/1/18
Phoenix
Miami
Los Angeles
Market Rent Growth by Asset Class
Trailing 12 Months Overall Trailing 12 Months Lifestyle Trailing 12 Months Renter-by-Necessity
Source: YardiMatrix

Matrix Monthly | February 2018 | 10
Washington, D.C.
Seattle
Tampa
San Francisco
-4%
-2%
0%
2%
4%
6%
8%
10%
12%
02/1/14 02/1/15 02/1/16 02/1/17 02/1/18
Seattle
-4%
-2%
0%
2%
4%
6%
8%
10%
12%
02/1/14 02/1/15 02/1/16 02/1/17 02/1/18
San Fran
-4%
-2%
0%
2%
4%
6%
8%
10%
12%
02/1/14 02/1/15 02/1/16 02/1/17 02/1/18
Sacramento
-4%
-2%
0%
2%
4%
6%
8%
10%
12%
02/1/14 02/1/15 02/1/16 02/1/17 02/1/18
San Diego
-4%
-2%
0%
2%
4%
6%
8%
10%
12%
02/1/14 02/1/15 02/1/16 02/1/17 02/1/18
Wash DC
-4%
-2%
0%
2%
4%
6%
8%
10%
12%
02/1/14 02/1/15 02/1/16 02/1/17 02/1/18
Tampa
-4%
-2%
0%
2%
4%
6%
8%
10%
12%
02/1/14 02/1/15 02/1/16 02/1/17 02/1/18
Seattle
-4%
-2%
0%
2%
4%
6%
8%
10%
12%
02/1/14 02/1/15 02/1/16 02/1/17 02/1/18
San Fran
-4%
-2%
0%
2%
4%
6%
8%
10%
12%
02/1/14 02/1/15 02/1/16 02/1/17 02/1/18
Sacramento
-4%
-2%
0%
2%
4%
6%
8%
10%
12%
02/1/14 02/1/15 02/1/16 02/1/17 02/1/18
San Diego
-4%
-2%
0%
2%
4%
6%
8%
10%
12%
02/1/14 02/1/15 02/1/16 02/1/17 02/1/18
Wash DC
-4%
-2%
0%
2%
4%
6%
8%
10%
12%
02/1/14 02/1/15 02/1/16 02/1/17 02/1/18
Tampa-4%
-2%
0%
2%
4%
6%
8%
10%
12%
02/1/14 02/1/15 02/1/16 02/1/17 02/1/18
Seattle
-4%
-2%
0%
2%
4%
6%
8%
10%
12%
02/1/14 02/1/15 02/1/16 02/1/17 02/1/18
San Fran
-4%
-2%
0%
2%
4%
6%
8%
10%
12%
02/1/14 02/1/15 02/1/16 02/1/17 02/1/18
Sacramento
-4%
-2%
0%
2%
4%
6%
8%
10%
12%
02/1/14 02/1/15 02/1/16 02/1/17 02/1/18
San Diego
-4%
-2%
0%
2%
4%
6%
8%
10%
12%
02/1/14 02/1/15 02/1/16 02/1/17 02/1/18
Wash DC
-4%
-2%
0%
2%
4%
6%
8%
10%
12%
02/1/14 02/1/15 02/1/16 02/1/17 02/1/18
Tampa
-4%
-2%
0%
2%
4%
6%
8%
10%
12%
02/1/14 02/1/15 02/1/16 02/1/17 02/1/18
Seattle
-4%
-2%
0%
2%
4%
6%
8%
10%
12%
02/1/14 02/1/15 02/1/16 02/1/17 02/1/18
San Fran
-4%
-2%
0%
2%
4%
6%
8%
10%
12%
02/1/14 02/1/15 02/1/16 02/1/17 02/1/18
Sacramento
-4%
-2%
0%
2%
4%
6%
8%
10%
12%
02/1/14 02/1/15 02/1/16 02/1/17 02/1/18
San Diego
-4%
-2%
0%
2%
4%
6%
8%
10%
12%
02/1/14 02/1/15 02/1/16 02/1/17 02/1/18
Wash DC
-4%
-2%
0%
2%
4%
6%
8%
10%
12%
02/1/14 02/1/15 02/1/16 02/1/17 02/1/18
Tampa
San Diego Sacramento
Market Rent Growth by Asset Class
Trailing 12 Months Overall Trailing 12 Months Lifestyle Trailing 12 Months Renter-by-Necessity
Source: YardiMatrix
Matrix Monthly | February 2018 | 11
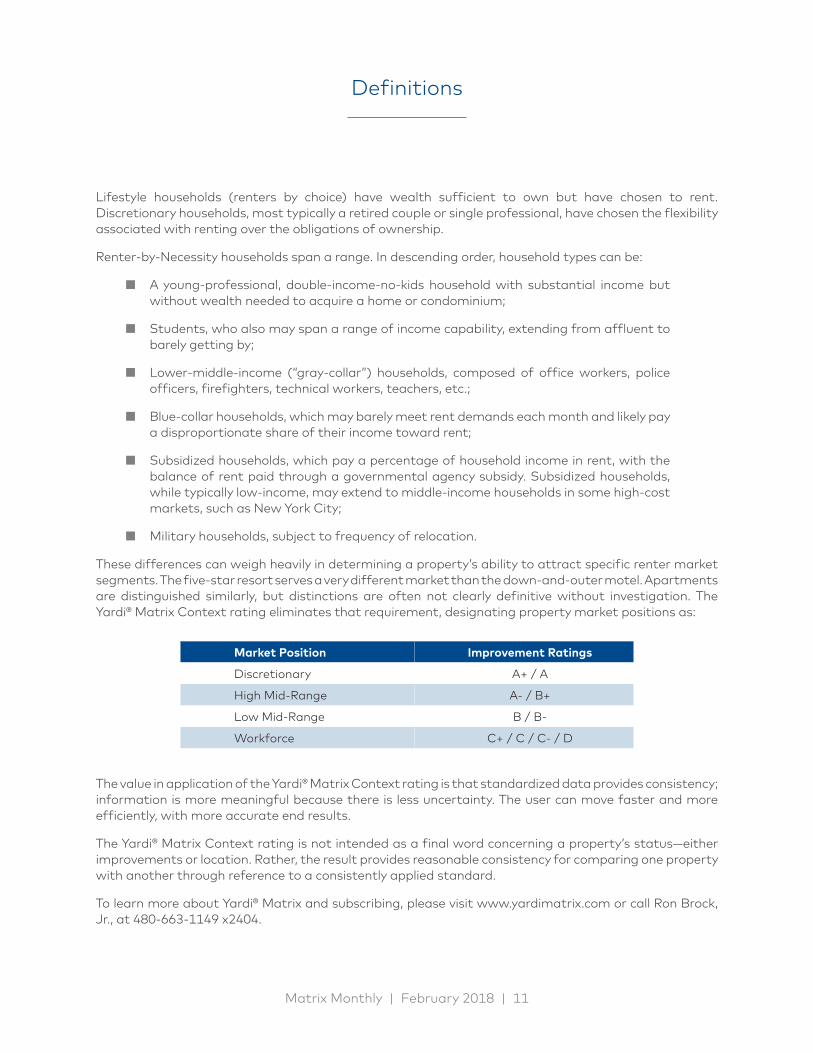
Market Position Improvement Ratings
Discretionary A+ / A
High Mid-Range A- / B+
Low Mid-Range B / B-
Workforce C+ / C / C- / D
The value in application of the Yardi® Matrix Context rating is that standardized data provides consistency; information is more meaningful because there is less uncertainty. The user can move faster and more efficiently, with more accurate end results.
The Yardi® Matrix Context rating is not intended as a final word concerning a property’s status—either improvements or location. Rather, the result provides reasonable consistency for comparing one property with another through reference to a consistently applied standard.
To learn more about Yardi® Matrix and subscribing, please visit www.yardimatrix.com or call Ron Brock, Jr., at 480-663-1149 x2404.
Lifestyle households (renters by choice) have wealth sufficient to own but have chosen to rent. Discretionary households, most typically a retired couple or single professional, have chosen the flexibility associated with renting over the obligations of ownership.
Renter-by-Necessity households span a range. In descending order, household types can be:
■ A young-professional, double-income-no-kids household with substantial income but without wealth needed to acquire a home or condominium;
■ Students, who also may span a range of income capability, extending from affluent to barely getting by;
■ Lower-middle-income (“gray-collar”) households, composed of office workers, police officers, firefighters, technical workers, teachers, etc.;
■ Blue-collar households, which may barely meet rent demands each month and likely pay a disproportionate share of their income toward rent;
■ Subsidized households, which pay a percentage of household income in rent, with the balance of rent paid through a governmental agency subsidy. Subsidized households, while typically low-income, may extend to middle-income households in some high-cost markets, such as New York City;
■ Military households, subject to frequency of relocation.
These differences can weigh heavily in determining a property’s ability to attract specific renter market segments. The five-star resort serves a very different market than the down-and-outer motel. Apartments are distinguished similarly, but distinctions are often not clearly definitive without investigation. The Yardi® Matrix Context rating eliminates that requirement, designating property market positions as:
Definitions

DISCLAIMER
Although every effort is made to ensure the accuracy, timeliness and completeness of the information provided in this publication, the information is provided “AS IS” and Yardi Matrix does not guarantee, warrant, represent or undertake that the information provided is correct, accurate, current or complete. Yardi Matrix is not liable for any loss, claim, or demand arising directly or indirectly from any use or reliance upon the information contained herein.
COPYRIGHT NOTICE
This document, publication and/or presentation (collectively, “document”) is protected by copyright, trademark and other intellectual property laws. Use of this document is subject to the terms and conditions of Yardi Systems, Inc. dba Yardi Matrix’s Terms of Use (http://www.yardimatrix.com/Terms) or other agreement including, but not limited to, restrictions on its use, copying, disclosure, distribution and decompilation. No part of this document may be disclosed or reproduced in any form by any means without the prior written authorization of Yardi Systems, Inc. This document may contain proprietary information about software and service processes, algorithms, and data models which is confidential and constitutes trade secrets. This document is intended for utilization solely in connection with Yardi Matrix publications and for no other purpose.
Yardi®, Yardi Systems, Inc., the Yardi Logo, Yardi Matrix, and the names of Yardi products and services are trademarks or registered trademarks of Yardi Systems, Inc. in the United States and may be protected as trademarks in other countries. All other product, service, or company names mentioned in this document are claimed as trademarks and trade names by their respective companies.
© 2018 Yardi Systems, Inc. All Rights Reserved.
Contacts
Jeff Adler Vice President & General Manager of Yardi Matrix [email protected] (800) 866-1124 x2403
Jack Kern Director of Research & Publications [email protected] (800) 866-1124 x2444
Paul Fiorilla Associate Director of Research [email protected] (800) 866-1124 x5764