multidimensional balanced efficiency decision model
TRANSCRIPT

J. Technol. Manag. Innov. 2015. Volume 10, Issue 3
ISSN: 0718-2724. (http://jotmi.org)Journal of Technology Management & Innovation © Universidad Alberto Hurtado, Facultad de Economía y Negocios.
Multidimensional Balanced Efficiency Decision Model
Fabio De Felice1, Antonella Petrillo2*
Abstract: In this paper a multicriteria methodological approach, based on Balanced Scorecard (BSC) and Analytic Network Process (ANP), is proposed to evaluate competitiveness performance in luxury sector. A set of specific key performance indicators (KPIs) have been proposed. The contribution of our paper is to present the integration of two methodologies, BSC – a multiple perspective framework for performance assessment – and ANP – a decision-making tool to prioritize multiple performance perspectives and indicators and to generate a unified metric that incor-porates diversified issues for conducting supply chain improvements. The BSC/ANP model is used to prioritize all performances within a luxuryindustry. A real case study is presented.
Keywords: value chain; innovation; luxury; KPIs; BSC; ANP.
Submitted August 26th 2015 / Approved September 30th 2015
Introduction
Efficiency evaluation is an important activity for the survival and growth of any firm. As the old adage goes: “you cannot improve what you cannot measure”. Thus, it has been long recognized that performance measurement and management is critical for the effective and efficient management of any business. This concept is crucial in high value sector such as the luxury business in which the use of performance measurement and management systems is frequently recommended for facilitating strategy implementation and enhancing organizational performance (Davis and Albright, 2004). In fact, as discussed by De Felice and Petrillo (2013a) measurement of organizational performance is a complex issue given that performance is a multifaceted phenomenon whose component elements may have distinct managerial priorities and may even be mutually inconsistent. In particular in the current phase of globalization and market liberalization, competitions among luxury firms are growing. In fact in the luxury industry, demand forecasting is particularly complex: companies operate with a large variety of short life cycles products, deeply influenced by seasonal sales, promotions, weather conditions, advertising and marketing campaigns on top of festivities and socio-economic factors (Diamantopoulos and Kakkos, 2007). Given the complexity of the problem, several researchers promote the use of multiple perspectives and multiple measures of organizational performance (Sainaghi et al., 2013) such as BSC introduced by Kaplan and Norton (2001). The BSC provides an enterprise view of an organization’s overall performance. The BSC translates the mission and strategy of an organization into company goals and from these goals, specific measures can be derived in order to achieve the set targets. BSC integrates financial measures with other key performance indicators around customer perspectives, internal business processes,
and organizational growth, learning, and innovation (Banker et al., 2004). However BSC performance is subjective and cause-effect relationships are not clear. It is necessary to assign non-equal priorities to perspectives and to performance indicators within each perspective. Thus, address the complex issues of a balanced system of performance assessment is not simply. From this point of view several researchers propose integrated frameworks useful to improve BSC method. One of the methods that can address the complex issues of a balanced system of performance assessment is the Analytic Hierarchy Process (AHP), developed by Saaty (1980). In the present paper a model based on the Analytic Network Process (ANP), the generalization of the AHP is presented. ANP is useful in prioritizing decision alternatives and may be the most widely used technique for multi-criteria decision-making (Saaty, 2005).
The contribution of our paper is to present the integration of two methodologies, BSC – a multiple perspective framework for performance assessment – and ANP – a decision-making tool to prioritize multiple performance perspectives and indicators and to generate a unified metric for the ranking of alternatives. Several studies present joint applications of AHP or ANP with BSC. For instance, Bentes et al. (2012) uses AHP to build a decision making hierarchy in order provide a better assessment of the (relative) performance of organizational units within a Brazilian telecommunications company according the four perspectives defined by BSC approach. Viglas et al. (2011) combines BSC and ANP to select a Quality Management Information System for a large Greek retailer. Wu et al. (2010) evaluates the business performance of wealth management banks in Taiwan by applying the AHP and grey relational analysis (GRA) according BSC approach. Huang (2009) proposes an integrated approach for the balanced scorecard tool and knowledge-based
1Department of Civil and Mechanical Engineering, University of Cassino and Southern Lazio, Italy.2 Department of Engineering, University of Naples, Italy. *Corresponding author: [email protected]
92
ISSN: 0718-2724. (http://jotmi.org)Journal of Technology Management & Innovation © Universidad Alberto Hurtado, Facultad de Economía y Negocios.
J. Technol. Manag. Innov. 2015. Volume 10, Issue 3
system using the AHP method. Jovanovic and Krivokapic (2008), use AHP to identify key performance indicators of the perspectives of BSC. Leung et al. (2006) show a BSC framework with the aid of AHP, considering traditional problems in implementation such as the dependence relationships among attributes and the need to use objective and subjective measures. Ravi et al. (2005) propose ANP model in which the dimensions of the reverse logistics for the EOL (End of Life) computers have been taken from the four perspectives of the balanced scorecard. Finally Poveda-Bautista et al. (2012)
propose a methodology, based on ANP and BSC, applies in industrial competitiveness measurement, following the proposal of Ellis et al. (2002), who suggest that the measurement’s indicators depend on the type of industrial sector and the competitiveness level perceived by each sector. Our research on BSC/ANP is different than the previous applications because the ANP model proposed respects the BSC structure model but at the same time allows to measure the weights of the different indicators. Thus, our aim is not to change the BSC model but to improve it in the phase of measurements.
Luxury Industry: State of art and strategy
An explicit definition of the term “luxury” cannot be given due the fact that luxury has always been and still is a sociological phenomenon which is closely related to the political and economic development of a country and, more important, to the morals of a society. However, Dubois et al. (2001) offers six determinants an object has to encompass in order to be perceived as a luxury good (see Table 1)
Table 1. Six determinants of luxury goods.
Determinants Definition
QualityThis determinant refers to all aspects of a product, i. e. materials used are the best of their class, the manufacturing process meets the highest standards of the industry and the accompanying services are excellent.
Relative price levelIt refers to the symbolic or demonstrative function of a good; i. e. the higher the price of a product, the supposedly greater is the wealth of the person who purchases that item. Therefore, luxury goods are characterized by a higher relative price level than goods that are comparable in form and function.
ExclusivityExclusivity refers to a general scarcity of luxury products. The origin of this scarcity can be natural, i. e. natural resources such as diamonds or exotic leathers are scarce and the number of qualified craftsmen to convert these rare resources into a unique piece is limited.
Aaesthetics and polysensualityPolysensuality describes the look, smell, touch and feel of a product or store environment. With regard to aesthetics, a luxury product is often attributed to be tasteful, elegant or fashionable
Brand’s history and traditionA long company history or a prominent personality of the firm’s founder procure the luxury brand with a unique market positioning that cannot be copied or caught up with by other or younger companies. This determinant is closely related to the quality characteristic.
SuperfluousnessIt describes the non-necessity of luxury goods, i. e. the abundance that is incorporated in the material, the way the product is manufactured or even wrapped and, increasingly important, the way the product is displayed and served at the point of sale.
As stated by Wagle (2003) the luxury goods industry is unique in that it is an industry that relies strictly on marketing and promotion to sell products to a specified group of people. The luxury goods industry is very fascinating and the products themselves signify prestige and status. The demand for luxury goods are affected by general economic trends, including changes in disposable personal income, consumer confidence, and consumer spending and in times of economic downturn consumers are likely to be more careful with spending.
Despite the adverse economic cycle of the last few years, luxury goods experienced increasing demand: this is due in part to the increasing social relevance of owning luxury goods, in part to the strong commitment of the luxury companies in branding and communication management (Brun et al., 2008). Worldwide spending in luxury product rose by 13% in 2010 and 10% in 2011 led by Emerging Markets exceeding the previous results recorded before financial market collapsed.
93

ISSN: 0718-2724. (http://jotmi.org)Journal of Technology Management & Innovation © Universidad Alberto Hurtado, Facultad de Economía y Negocios.
J. Technol. Manag. Innov. 2015. Volume 10, Issue 3
In Figure 1 is shown a forecast of the luxury goods market from 2008 to 2018.
Figure 1. Global Luxury Sales and Growth 2008/18 US$ Billion (Source: Fflur - Euromonitor International, 2013).
While in Figure 2 is shown an overview of the luxury market indicating that during the period 2007-2011 big internationally listed groups are confirmed as winners in the global luxury competition over performing market trends and pre-crisis results (PwC, 2012).
Figure 2. An Overview of the Luxury Market (Source: PwC’s analysis public consolidated financial statements, Bloomberg and Merger Market).
94

ISSN: 0718-2724. (http://jotmi.org)Journal of Technology Management & Innovation © Universidad Alberto Hurtado, Facultad de Economía y Negocios.
J. Technol. Manag. Innov. 2015. Volume 10, Issue 3
Emerging markets continue to drive growth (Fflur, 2013). Asia is becoming one of the main markets for the main luxury operators after Europe but developed markets remain largest spenders as is shown in Figure 3.
Figure 3. World Top 5 Luxury Markets Value Sales % share 2013 (Source: Fflur - Euromonitor International, 2013).
Consumers in traditional markets are looking for both product and service quality whilst consumers in emerging markets are still looking for status symbols and social acknowledgement. Today luxury firms need to differentiate themselves at the point of sale by reinventing and restructuring their service offers. The effective and efficient management of luxury holds complexity in various aspects. The question is: What are the main strategies underline performances? The answer is “Value chain integration”. Luxury goods companies keep tight control over all aspect of business – from product design and sourcing of raw materials to manufacturing, marketing, and distribution. Ownership of successive stages of the value chain for the company’s product(s) helps ensure that brand appropriate levels of quality and service ca be maintained, thus protecting brand heritage. As a result, vertical integration is an important driver of M&A activity in the luxury goods sector (Deloitte, 2014). Luxury firms need to tackle this growing complexity by implementing KPI which do measure the performance of organizational processes. Brun and Castelli (2008) highlight the need for a contingent approach in luxury/fashion sector. Definitely, it is necessary define a strategy and that the organizational learning and growth perspective t involves the changes and improvements which the company needs to realize if it is to make its vision come true. A strategy is a set of hypotheses about cause and effect. The measurement system should make the relationships (hypotheses) among objectives (and measures) in the various perspectives explicit, so that they can be managed and validated. This paper aims at conceptualizing and empirically validating a framework based on BSC and ANP that includes quantitative as well as qualitative key performance indicators (KPI) for the effective and
efficient management of luxury stores while adhering to the service standards of the segment.
Theoretical Approach: BSC and ANP
The BSC method proposes to reach the final goal of the organization, the business profitability is assessed from many aspects that can be measured throughout financial and non-financial. The balanced scorecard is a series of financial evaluation indices and non-financial evaluation system. The balanced scorecard has emerged as a decision support tool at the strategic management level. Many companies are adopting the balanced scorecard as the foundation for their strategic management system. Kaplan and Norton (1992) classified a typical BSC into four perspectives as follows: 1) the financial perspectives, 2) the customer perspectives, 3) the internal process perspective, including internal business perspective, and 4) the innovative perspective. In summary the key features of each perspective are:
1. Financial perspective indicates whether a company’s strategy, implementation and execution are contributing to bottom-line improvement. The measurement criteria are usually profit, cash flow, ROI, return on invested capital, and economic value added.
2. Customer perspective provides a way for managers to identify the customer and market segments in which the business unit will compete and the measures of the business unit’s performance. To meet the organizational objectives and
95
ISSN: 0718-2724. (http://jotmi.org)Journal of Technology Management & Innovation © Universidad Alberto Hurtado, Facultad de Economía y Negocios.
J. Technol. Manag. Innov. 2015. Volume 10, Issue 3
customers’ expectations, organizations must identify the key business processes at which they must excel.
3. Internal business perspective, aims to satisfy shareholders and customers by excelling at some business process.
4. Innovation perspective identifies the infrastructure that the organization must build to create long-term improvement (i.e. employee satisfaction, continuity, training and skills, etc. ).
Once the appropriate objectives are identified, the Scorecard guides the organization to develop reasonable performance measures and establishes targets, initiatives and alternatives to meet programmatic goals. According to Kaplan and Norton (1996) the conditions for implementing the balanced scorecard are that companies in a highly dynamic environment have to change their strategy constantly, which, leads to frequently changing the measures in the BSC. Furthermore obstacles to implement the balanced scorecard could be:
· Too few measures (two or three) per Perspective. The organization adopts too many indicators.
· Measures selected for the scorecard do not reflect the organisation’s strategy.
· The development process takes too long.
Definitively, the scorecard is a tool whose purpose is to align the strategy expressed in the actions actually undertaken to the strategy expressed in the plan but the “conventional” BSC does not consolidate the mentioned performance measures so it is useful integrate BSC with Analytic Network Process. ANP provides a general framework to deal with decisions without making assumptions about the independence of higher-level elements from lower level elements. ANP model consists of the control networks, clusters, elements, interrelationship between elements, and interrelationship between clusters.
The ANP feedback approach replaces hierarchies with networks, in which the relationship between levels are not easily represented as higher or lower, dominant or subordinate, direct or indirect. The determination of relative weights in ANP is based on the pairwise comparison conducted with respect to their relative importance towards their control criterion (De Felice and Petrillo, 2013b). The ANP uses 9-point scale for comparison, namely unimportant (1); somewhat important (3); important (5); very important (7); and extremely important (9). The fundamental scale that represents dominance of one element over another is an absolute scale and the priorities derived from it are normalized or idealized to again yield an absolute scale. The result of the comparison is the so-called dominance coefficient aij that represents the relative importance of the component on row (i) over the component on column (j), i.e.,
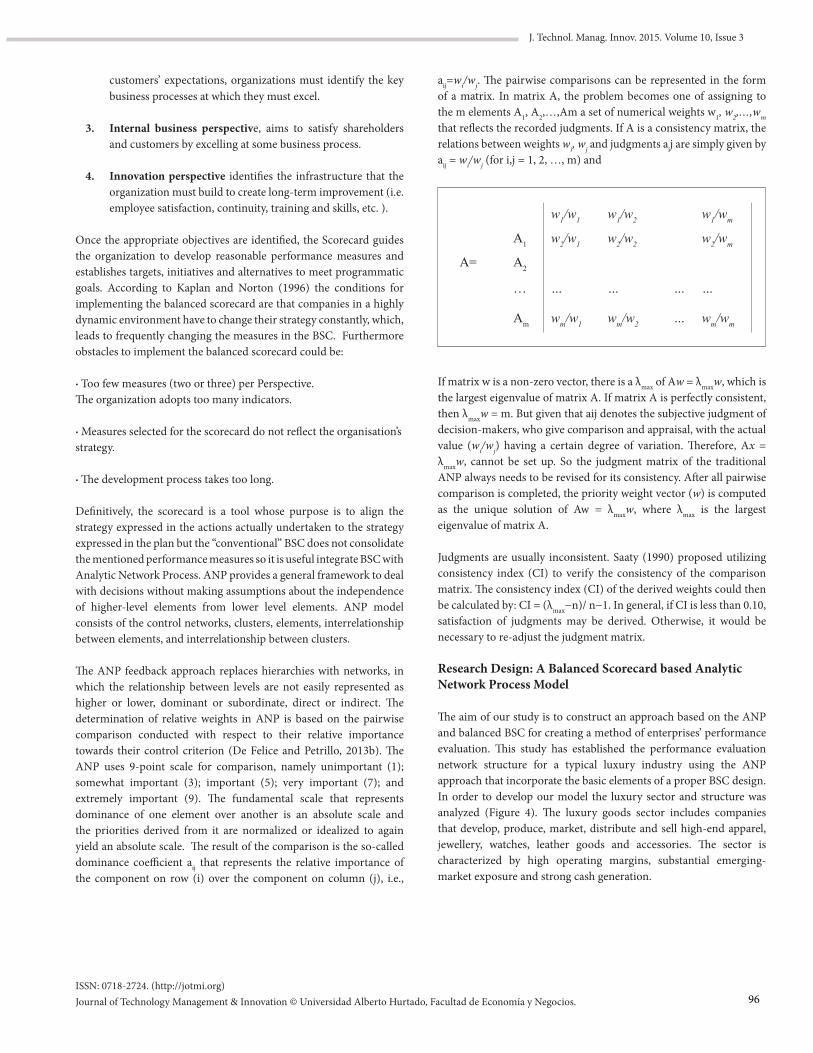
aij=wi/wj. The pairwise comparisons can be represented in the form of a matrix. In matrix A, the problem becomes one of assigning to the m elements A1, A2,…,Am a set of numerical weights w1, w2,…,wm that reflects the recorded judgments. If A is a consistency matrix, the relations between weights wi, wj and judgments aij are simply given by aij = wi/wj (for i,j = 1, 2, …, m) and
w1/w1 w1/w2 w1/wm
A1 w2/w1 w2/w2 w2/wm
A= A2
… … … … …
Am wm/w1 wm/w2 … wm/wm
If matrix w is a non-zero vector, there is a λmax of Aw = λmaxw, which is the largest eigenvalue of matrix A. If matrix A is perfectly consistent, then λmaxw = m. But given that aij denotes the subjective judgment of decision-makers, who give comparison and appraisal, with the actual value (wi/wj) having a certain degree of variation. Therefore, Ax = λmaxw, cannot be set up. So the judgment matrix of the traditional ANP always needs to be revised for its consistency. After all pairwise comparison is completed, the priority weight vector (w) is computed as the unique solution of Aw = λmaxw, where λmax is the largest eigenvalue of matrix A.
Judgments are usually inconsistent. Saaty (1990) proposed utilizing consistency index (CI) to verify the consistency of the comparison matrix. The consistency index (CI) of the derived weights could then be calculated by: CI = (λmax−n)/ n−1. In general, if CI is less than 0.10, satisfaction of judgments may be derived. Otherwise, it would be necessary to re-adjust the judgment matrix.
Research Design: A Balanced Scorecard based Analytic Network Process Model
The aim of our study is to construct an approach based on the ANP and balanced BSC for creating a method of enterprises’ performance evaluation. This study has established the performance evaluation network structure for a typical luxury industry using the ANP approach that incorporate the basic elements of a proper BSC design. In order to develop our model the luxury sector and structure was analyzed (Figure 4). The luxury goods sector includes companies that develop, produce, market, distribute and sell high-end apparel, jewellery, watches, leather goods and accessories. The sector is characterized by high operating margins, substantial emerging-market exposure and strong cash generation.
96

ISSN: 0718-2724. (http://jotmi.org)Journal of Technology Management & Innovation © Universidad Alberto Hurtado, Facultad de Economía y Negocios.
J. Technol. Manag. Innov. 2015. Volume 10, Issue 3
Figure 4. EBIT margin versus asset turnover FY2012 (Source: HSBC estimates 2012).
The construction and validation of this model represents the focus of our research. In particular, the research hypotheses can be expressed as follows:
· H1: Performance evaluation is a relevant issue to investigate as regards companies in the luxury industry, which could obtain competitive advantages by implementing different strategies.
· H2: The strategies to apply depends on three elements: product features, distribution channel and brand.
· H3: BSC and ANP are key factors in the successful implemen- tation of a new methodological approach in luxury sector.
The research is based on the following question “What are the challenges to measure efficiency in the luxury industry?” This research question is divided in the following sub questions:
· Which conditions should the organization fulfil in order to implement the BSC/ANP model?
· To what extent does the engineering company fulfil these conditions?
· What are the obstacles in the implementation of the BSC/ANP model in the organization?
· How is the BSC/ANP model being implemented now?
· What are the benefits in the chosen implementation method?
The model is based on the above consideration and above the consideration that integration between the different company functions, the collaborative planning are the success for each kind of company working in a complex scenario. The qualitative scheme of the methodological approach presented in this paper is shown in Figure 5. The approach to the development the project requires four main phases, namely:
· Phase #1 - As Is Analysis.
· Phase #2 - KPIs Identification.
· Phase #3 - BSC/ANP Model.
· Phase #4 - Results Analysis.
97

ISSN: 0718-2724. (http://jotmi.org)Journal of Technology Management & Innovation © Universidad Alberto Hurtado, Facultad de Economía y Negocios.
J. Technol. Manag. Innov. 2015. Volume 10, Issue 3
In Figure 5 is shown the research design.
The overall performance of a project is significantly affected by the project team composition (De Felice, 2012). A capability is the capacity for a team of resources to perform some task or activity. Thus, an expert team was performed in order to put together a winning strategy that covers all the necessary aspects of the business. The project team encompassed members from different functions involved in the implementation of the model: 1 financial expert, 1 customers expert, 1 business expert, 1 innovation expert, 1 BSC expert, 1 ANP expert and a project leader. Here below the different phases are analyzed.
Phase#1 - AS IS Analysis
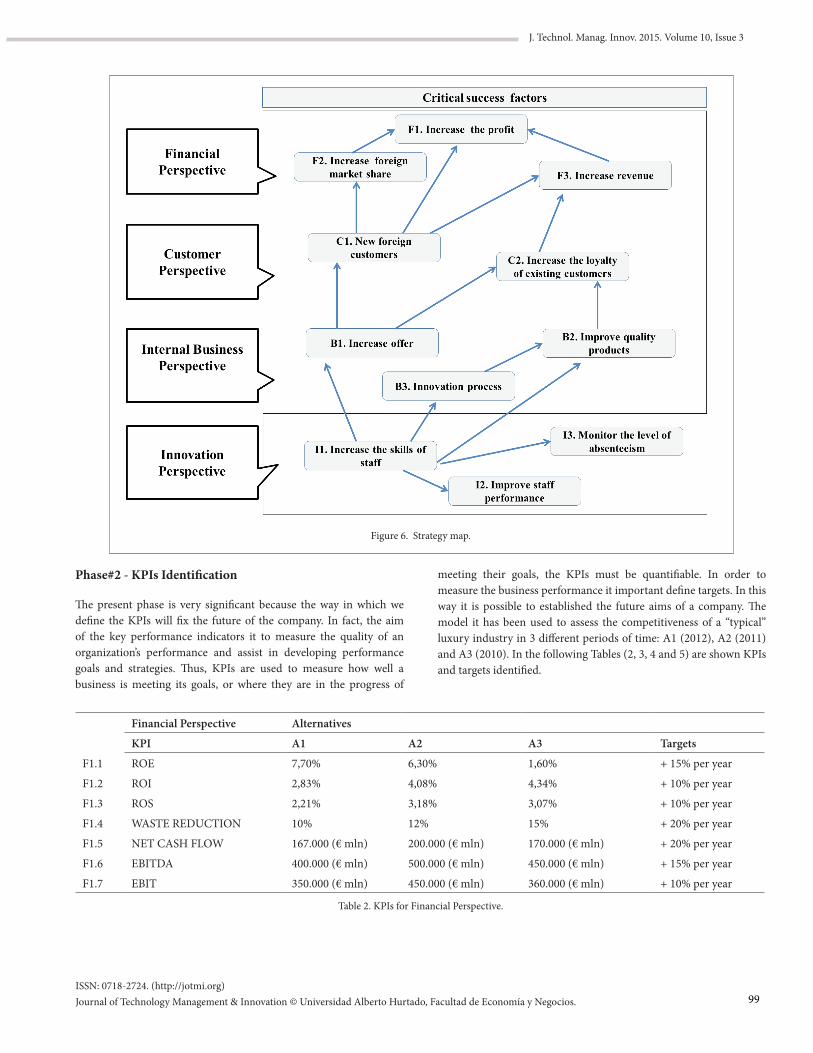
Taking into account the defined process scope of the calibration phase, the purpose of the AS-IS analysis is to understand the current situation and any weaknesses within the processes, as well as to develop first solution ideas. The basis for the analysis is the identification of the strategy map. The selected processes are analyzed in detail, using a standardized analysis approach (see Figure 6).
Figure 5. Proposed Methodology.
98
ISSN: 0718-2724. (http://jotmi.org)Journal of Technology Management & Innovation © Universidad Alberto Hurtado, Facultad de Economía y Negocios.
J. Technol. Manag. Innov. 2015. Volume 10, Issue 3
Phase#2 - KPIs Identification
The present phase is very significant because the way in which we define the KPIs will fix the future of the company. In fact, the aim of the key performance indicators it to measure the quality of an organization’s performance and assist in developing performance goals and strategies. Thus, KPIs are used to measure how well a business is meeting its goals, or where they are in the progress of
Figure 6. Strategy map.
meeting their goals, the KPIs must be quantifiable. In order to measure the business performance it important define targets. In this way it is possible to established the future aims of a company. The model it has been used to assess the competitiveness of a “typical” luxury industry in 3 different periods of time: A1 (2012), A2 (2011) and A3 (2010). In the following Tables (2, 3, 4 and 5) are shown KPIs and targets identified.
Financial Perspective Alternatives
KPI A1 A2 A3 Targets
F1.1 ROE 7,70% 6,30% 1,60% + 15% per year
F1.2 ROI 2,83% 4,08% 4,34% + 10% per year
F1.3 ROS 2,21% 3,18% 3,07% + 10% per year
F1.4 WASTE REDUCTION 10% 12% 15% + 20% per year
F1.5 NET CASH FLOW 167.000 (€ mln) 200.000 (€ mln) 170.000 (€ mln) + 20% per year
F1.6 EBITDA 400.000 (€ mln) 500.000 (€ mln) 450.000 (€ mln) + 15% per year
F1.7 EBIT 350.000 (€ mln) 450.000 (€ mln) 360.000 (€ mln) + 10% per year
Table 2. KPIs for Financial Perspective.
99

ISSN: 0718-2724. (http://jotmi.org)Journal of Technology Management & Innovation © Universidad Alberto Hurtado, Facultad de Economía y Negocios.
J. Technol. Manag. Innov. 2015. Volume 10, Issue 3
Customer Perspective Alternatives
KPI A1 A2 A3 Targets
C1.1 Customer Satisfaction 25% 30% 35% + 20% per year
C1.2 Customer loyalty 70% 80% 60% + 20% per year
C1.3 Customer Profitability 75% 60% 55% + 15% per year
C1.4 Green Product 10% 8% 12% + 10% per year
C1.5 Customer portfolio -0.022 0.015 -0.030 + 15% per year
Table 3. KPIs for Customer Perspective.
Internal Business Perspective Alternatives
KPI A1 A2 A3 Targets
B1.1 Product Recovery 0.15% 0.20% 0.12% + 20% per year
B1.2 Service level 0.80% 0.90% 0.70% + 10% per year
B1.3 Process Innovation 0.25% 0.30% 0.20% + 20% per year
B1.4 Lead Time 1 day 1 day 1 day + 15% per year
B1.5 Time to market 30 days 29 days 28 days + 20% per year
Table 4. KPIs for Internal Business Perspective.
Innovation Perspective Alternatives
KPI A1 A2 A3 Targets
I1.1. Staff satisfaction 0.25% 0.20% 0.30% + 15% per year
I1.2 Productivity 0.12% 0.15% 0.18% + 20% per year
I1.3 Environmental competitiveness 0.10% 0.08% 0.15% + 10% per year
I1.4 Training 10-15 days 15-20 days 15-20 days + 25% per year
Table 5. KPIs for Internal Innovation Perspective.
Phase#3 – BSC/ANP Model
In the present phase BSC/ANP Model is built (Figure 7). Relationships identified with strategy map and indicators were used.
Figure 7. BSC/ANP Model.
100

ISSN: 0718-2724. (http://jotmi.org)Journal of Technology Management & Innovation © Universidad Alberto Hurtado, Facultad de Economía y Negocios.
J. Technol. Manag. Innov. 2015. Volume 10, Issue 3
In the ANP model, the criteria are pairwise-compared, both within and between clusters. The experts team defined the relative weights of each BSC perspective. In Table 6 is shown an example of pairwise comparisons of criteria using the 9-point scale. In order to fill in the comparison matrices experts team responded to questions such as “Is Financial Perspective more important than Customer Perspective? If so, by how much?”. In similar way all comparisons were done. When multiple decision makers are involved, it is necessary to aggregate individual judgments into a single representative judgment for the entire group.
Financial Perspective
Customer Perspective
Internal Business Perspective
Innovation Perspective Weight
Financial Perspective 1 9 2 4 0.531
Customer Perspective 1/9 1 1/5 1/3 0.053
Internal Business Perspective 1/2 5 1 2 0.272
Innovation Perspective 1/4 3 1/2 1 0.142
CI 0.035
Table 6. Pairwise comparisons of criteria
A check of the consistency ratio of each comparison matrix was made. In a few cases, the consistency ratio was above 10% and participants reconvened to reassess pairwise judgments.
Phase #4 - Results Analysis
The results (Table 7) of the prioritization of the 3 alternatives in terms of competitive performance places A2 in the first position with a score of 37.6%, second position for A1 with 34.5%, and third position for A3 with 27.8%. It means that A2 is the periods of time preferred and on which is proper to assess future company’s strategy.
Alternatives Perspective Weight
A1 BSC Perspective 0.345
A2 BSC Perspective 0.376
A3 BSC Perspective 0.278
Table 7. Results obtained for alternatives.
A detailed analysis underlines that regarding “Financial Perspective” global results show that according to the experts the most important criterion is ROI with 20.2% of the weight, closely followed by Waste Reduction (18.85%). Within the “Customer Perspective” the most important criterion is Customer portfolio (30.24%) followed by Customer Satisfaction (25.59%) and by Green Product (22.59%). While for “Internal Business Perspective” the most important criterion is Product Recovery (26.92%). Finally for “Innovation Perspective” the most important criterion is Training (36.68%) followed by Environmental competitiveness (26.21%). The analysis of results,
presented in Figure 8, is useful in order to define the improvement action plans within the whole value chain in different periods of time.
The integrated approach BSC/ANP employed here presented convergent validity, providing a fine-grained picture of performance (through the in-depth discussions among managers) and overall assessment. The interactive and iterative process employed in this study has the additional advantage of enabling managers to apprehend the diverse perspectives of performance assessment and to understand possible tradeoffs.
Figure 8: Results obtained for criterion
101
ISSN: 0718-2724. (http://jotmi.org)Journal of Technology Management & Innovation © Universidad Alberto Hurtado, Facultad de Economía y Negocios.
J. Technol. Manag. Innov. 2015. Volume 10, Issue 3
Conclusions and further research developments
Based on the review of the literature and the findings of the present study we can conclude that it is relevant for any organization to have clear goals and the metrics and their corresponding weights that directly contribute to reach the goals. The ANP model efficiently contributes to define the necessary indicators. The present research shows that a combination of balanced scorecard and ANP approach can provide to the decision maker a more realistic and accurate representation of the problem. This paper have formulated a simple strategy and transformed that into an analytical BSC multicriteria model base on simple assumed cause-and-effect relationships between various performance measures. The results obtained for all the different indicators allow to analyze enterprises’ performance.
The major contribution of this research lies in the development of a comprehensive model, which incorporates diversified issues for conducting value chain improvements in luxury sector. We believe that our modeling process ensures a proper evaluation of this particular problem. In our opinion this tool constitutes a very promising future research line in the field of enterprises’ strategic management assessment. The most obvious advantage of using our model is that it provides a consistent decision making. Future research aims to investigate a more complex BSC/ANP model using several alternatives and considering different relationship among elements in different scenario.
References
Bentes, A.V., Carneiro J., Ferreira da Silva J., Kimura, H. (2012). Multidimensional assessment of organizational performance: Integrating BSC and AHP. Journal of Business Research, 65, 1790–1799.
Brun, A., Caniato, F., Caridi, M., Castelli, C., Miragliotta, G., Ronchi, S., Sianesi, A., Spina, G. (2008). Logistics and supply chain management in luxury fashion retail: Empirical investigation of Italian firms. International Journal of Production Economics, 114, 554–570.
Brun, A., Castelli, C. (2008). Supply chain strategy in the fashion industry: Developing a portfolio model depending on product, retail channel and brand. International Journal of Production Economics, 116, 169–181.
Davis, S., Albright, T. (2004). An investigation of the effect of balanced scorecard implementation on financial performance. Management Accounting Research, 15(2), 135–153.
Diamantopoulos A., Kakkos N. (2007). Managerial assessments of export performance: conceptual framework and empirical illustration. Journal of International Mark, 15(3), 1-31.
Banker R.D., Chang H., Janakiraman S.N., Konstans C. (2004). A balanced scorecard analysis of performance metrics. European Journal of Operational Research, 154, 423–436.
De Felice, F., Petrillo, A. (2013b). Key success factors for organizational innovation in the fashion industry. International Journal of Engineering Business Management, 5, 47-57.
De Felice, F., Petrillo, A. (2013b). Multicriteria approach for process modelling in strategic environmental management planning. International Journal of Simulation and Process Modelling, 8(1), 6-16.
De Felice, F. (2012). Editorial Research and applications of AHP/ANP and MCDA for decision making in manufacturing. International Journal of Production Research, 50(17), 4735–4737.
Deloitte (2014). Global Powers of luxury goods 2014 in the hands of customers, from http://www2.deloitte.com/gr/en/pages/consumer-business/articles/global-powers-of-luxury-goods-2014.html .
Dubois, B. et al. (2001). Consumer Rapport to Luxury – Analyzing Complex and Ambivalent Attitudes. Paris: Les Cahiers de Recherche (HEC).
Ellis S., Elnatha D., Raz T. (2002). Applying benchmarking: an organizational learning perspective. Human System Management, 21(3), 183-191.
Fflur R. (2013). The state of the luxury Market. Euromonitor International.
Belge, A., Rambourg, E., Dargnies, S., (2012). EMEA Equity Research Luxury goods July 2012. HSBC
Huang, H.C. (2009). Designing a knowledge-based system for strategic planning: A balanced scorecard perspective. Expert Systems with Applications, 36, 209–218.
Jovanonic J, Krivokapic Z. (2008). AHP in implementation of Balanced Scorecard. International Journal of Quality Research, 2(1), 59–67.
Kaplan, R., Norton D. (1992). The balanced scorecard: measures that drive performance. Harvard Business Review, 70, 71–79.
Kaplan, R., Norton D., (1996). Using the balanced scorecard as a strategic management system. Harvard business review, 74(1), 75, 1996.
Kaplan, R., Norton, D. (2001). The Strategy-Focused Organization: How Balanced Scorecard Companies Thrive in the New Business Environment, Harvard Business School Press, Boston. Massachusetts.
PricewaterhouseCoopers PwC 2012. Market Vision Luxury Challenges and opportunities in the new luxury world: winners and strategic drivers - https://www.pwc.com/it/it/publications/assets/docs/luxury-market-vision-2012.pdf.
Lee, M.C. (2007). A Method of Performance Evaluation by Using the Analytic Network Process and Balanced Score Car. International
102

ISSN: 0718-2724. (http://jotmi.org)Journal of Technology Management & Innovation © Universidad Alberto Hurtado, Facultad de Economía y Negocios.
J. Technol. Manag. Innov. 2015. Volume 10, Issue 3
Conference on Convergence Information Technology, 21-23 Nov. 2007, pp. 235 – 240.
Leung, L.C., Lam, K.C., Cao D. (2006). Implementing the balanced scorecard using the analytic hierarchy process & the analytic network process. Journal of the Operational Research Society, 57, 682–691.
Poveda-Bautista, R., Baptista D.C., García-Melón, M. (2012). Setting competitiveness indicators using BSC and ANP. International Journal of Production Research, 50(17), 4738-4752.
Ravia; V., Shankara, R., Tiwari, M.K. (2005). Analyzing alternatives in reverse logistics for end-of-life computers: ANP and balanced scorecard approach. Computers & Industrial Engineering, 48, 327–356.
Saaty, T.L. (1980). The Analytic Hierarchy Process. McGraw-Hill, New York.
Saaty, T.L (2005). Theory and Applications of the Analytic Network Process: Decision Making with Benefits, Opportunities, Costs, and Risks. RWS Publications, Pittsburgh, PA.
Saaty, T.L. (1990). How to make a decision: The analytic hierarchy process. European Journal of Operations Research, 48, 9–26.
Sainaghi R., Phillips, P., Corti, V. (2013). Measuring hotel performance: Using a balanced scorecard perspectives’ approach. International Journal of Hospitality Management, 34, 150– 159.
Viglas, K., Fitsilis, P., Kameas, A. (2011). An integrated approach for selecting information systems: a case study. Technology and Investment, 2, 142–153.
Wu C.R., Lin C.T., Tsai P.H. (2010). Evaluating business performance of wealth management banks. European Journal of Operational Research, 207, 971–979.
DRISCOLL, M., Wagle, Y. (2003). Industry Profile: The industry that suits everyone. Standard and Poor’s Industry Surveys. (3 Jul. 2003): 4.pag. Online. S&P. 22 Oct. 2003.
103