multi-subject cst mathematics preparation...multi-subject cst mathematics preparation competency...
TRANSCRIPT

© NYC Teaching Fellows 2014
Multi-Subject CST Mathematics
PreparationCompetency 0002- 2.2 Functions
February 2017

/ 2
Agenda
Introduction to Competency
Content Review and Sample Problems
Additional Practice

/ 3
Performance Expectations
The New York State Grade 7-12 Multi-Subject teacher demonstrates
• Deep knowledge of the structure of algebraic expressions, how algebraic
manipulations are governed by properties of operations and exponents, the
nature of solutions to equations, and reasoning processes for manipulating
expressions and solving equations.
• Skill and accuracy working with expressions and equations and uses algebra to
model and solve mathematical and real-world problems.
• Deep knowledge of the concept of a function and how functions are used to
describe relationships between quantities.
• Knowledge of representing and interpreting functions in various ways, using
functions to model situations, and building new functions from existing functions.
• Understanding of the connections among functions, expressions, equations,
modeling, coordinates, and graphs.
Introduction to Competency 0002- Algebra and Functions
New York State Education Department

/ 4
2.2 Functions
• Applies the concept of a function, identifies the range and domain of a function,
and uses function notation appropriately
• Interprets functions that arise in applications in terms of the context and analyzes
key features of functions (e.g., intercepts, intervals where the function is increasing,
relative maximums or minimums, zeros, asymptotes, end behavior)
• Analyzes functions (e.g., linear, quadratic, square root, piecewise, polynomial,
exponential, logarithmic) using different representations, such as graphs, verbal
descriptions, equivalent algebraic forms, and numeric tables
• Builds a function that models a relationship between two quantities
• Builds new functions from existing functions (e.g., identifies the effect of replacing
f(x) with f(x + k), composes functions, finds inverse functions)
• Constructs and compares linear, quadratic, and exponential models and
distinguishes between those situations (mathematical and real-world) that can be
modeled with linear functions and those that can be modeled with exponential
functions
Introduction to Competency 0002- Function Performance Indicators
New York State Education Department

/ 5
2.2 Functions
• Interprets expressions and parameters in linear, quadratic, or exponential functions
in terms of the context and situation they model
• Understands radian measure and how the unit circle in the coordinate plane
enables the extension of trigonometric functions
• Models periodic phenomena with trigonometric functions
• Proves and applies trigonometric identities
• Demonstrates knowledge of how to analyze and interpret assessment data to
inform and plan instruction that engages and challenges all students to meet or
exceed the NYCCLS related to functions
Introduction to Competency 0002- Function Performance Indicators
New York State Education Department

/ 6
Agenda
Introduction to Competency
Content Review and Sample Problems
Additional Practice

/ 7
A function relates each element of a set with exactly one element of another set.
“Each element” means that every element in x is related to some element in y.
“Exactly one” means that a function is single valued. It will not give back 2 or more
results for the same input. This is a little tricky. Look below for an example.
f(2)≠ 4 𝑎𝑛𝑑 9 f(2)= 4 𝑎𝑛𝑑 𝑓 3 = 4
Give it try! Is this mapping an example of a function?
Functions: Applies the concept of a function
http://www.mathsisfun.com/sets/function.html

/ 8
Solution:
It is a relationship, but it is not a function, for these reasons:
Value "3" in X has no relation in Y
Value "4" in X has no relation in Y
Value "5" is related to more than one value in Y
(But the fact that "6" in Y has no relationship does not matter)
You can also use the vertical line test to determine if a relation is a function.
The vertical line test states that if a
vertical line crosses the graph
in more than one location, the graph
is not a function.
Functions: Applies the concept of a function
http://www.mathsisfun.com/sets/function.html
/ 9
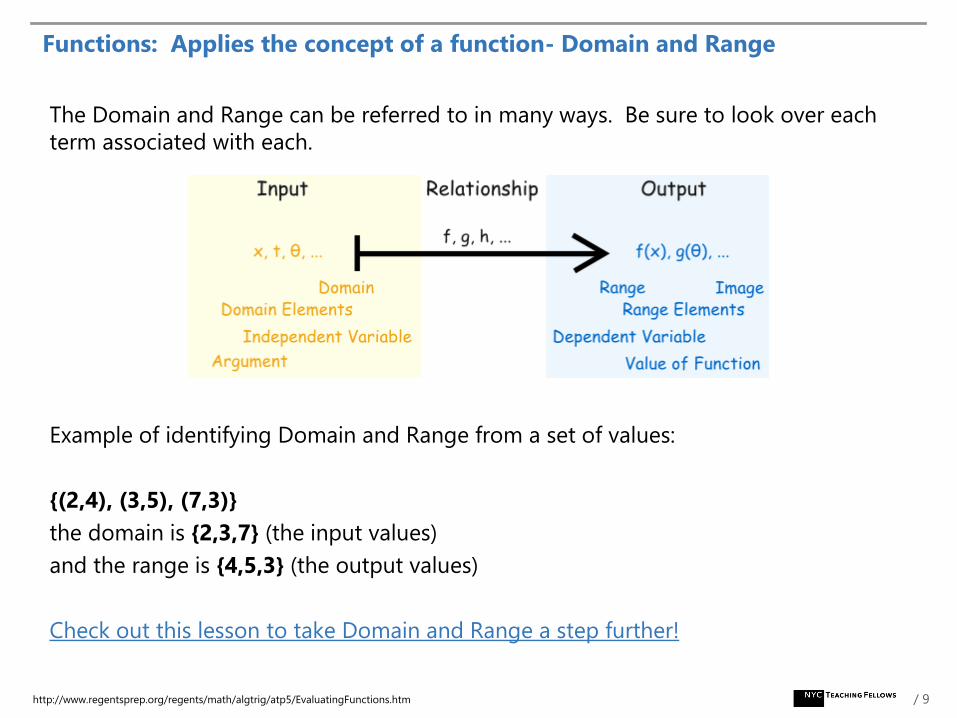
The Domain and Range can be referred to in many ways. Be sure to look over each
term associated with each.
Example of identifying Domain and Range from a set of values:
{(2,4), (3,5), (7,3)}
the domain is {2,3,7} (the input values)
and the range is {4,5,3} (the output values)
Check out this lesson to take Domain and Range a step further!
Functions: Applies the concept of a function- Domain and Range
http://www.regentsprep.org/regents/math/algtrig/atp5/EvaluatingFunctions.htm

/ 10
Traditionally, functions are referred to by the letter name f, but f need not be the
only letter used in function names. The following are but a few of the notations that
may be used to name a function: f (x), g(x), h(a), A(t), ...
Note: The f (x) notation can be thought of as another way of representing the y-
value in a function, especially when graphing. The y-axis is even labeled as the f (x)
axis, when graphing.
Often times, mathematics has a variety of ways to say the same thing.
Examine these notations that are all equivalent:
Check out this video to see how function notation applies to tables and graphs.
Functions: Applies the concept of a function- Function Notation
http://www.regentsprep.org/regents/math/algtrig/atp5/EvaluatingFunctions.htm

/ 11
When evaluating functions written in function notation, follow this idea:
Give it a try!
See here for the solution.
Functions: Applies the concept of a function- Evaluating a function with
function notation

/ 12
Check out the following practice sets and tasks to assess your knowledge of the
concepts revolving around functions:
Domain and Range
Definition of a function
Functions: Applies the concept of a function- Practice

/ 13
Intercepts can be found graphically as well as algebraically.
Graphically:
Algebraically:
When you want the x intercepts (x,0): Set y=0 then solve for x
When you want the y intercepts (0,y): Set x=0 then solve for y
Give it a Try!
Find the intercepts of y = x2 − 4
Functions: Interprets functions that arise in applications in terms of the
context and analyzes key features of functions
www.mathisfun.com

/ 14
Solution:
x intercept: set y=0
0 = x2 − 4
x2 = 4
x = 2 or −2
The points are (2,0) and (−2,0)
y intercept: set x=0
y = 02 − 4
y = −4
The point is (0,-4)
Functions: Interprets functions that arise in applications in terms of the
context and analyzes key features of functions

/ 15
Functions can have "hills and valleys": places where they reach a minimum or
maximum value. It may not be the minimum or maximum for the whole function,
but locally it is. This local point is called either the local minimum or maximum. The
overall minimum and maximum points are called global minimum and maximum.
Calculus can be used to determine the exact maximums and minimums. On the next
few slides, we will explore how to complete these calculations.
Functions: Interprets functions that arise in applications in terms of the
context and analyzes key features of functions – Maximum and Minimum
www.mathisfun.com

/ 16
Functions: Interprets functions that arise in applications in terms of the
context and analyzes key features of functions – Maximum and Minimum
First derivative 𝑓′(𝑥)
Second derivative 𝑓′′(𝑥)
Third derivative 𝑓′′′(𝑥)
• The tangent line to the graph of the function f at the point (a, f(a)) is the line
through the point that has the slope 𝑓′(𝑎)
• The rate of change (velocity) of f at t is 𝑓′(𝑡), and the acceleration is 𝑓′′(𝑥)

/ 17
Functions: Interprets functions that arise in applications in terms of the
context and analyzes key features of functions – Maximum and Minimum
If f is continuous and differentiable, then:
• f is increasing if 𝑓′ 𝑥 > 0
• f is decreasing if 𝑓′ 𝑥 < 0
• f is at a relative maximum or minimum if 𝑓′ 𝑥 = 0
𝑓(𝑐) is an absolute minimum if 𝑓 𝑐 ≤ 𝑓 𝑥 for all x
𝑓(𝑐) is an absolute maximum if 𝑓 𝑐 ≥ 𝑓 𝑥 for all x
Relative minimum and maximum may exist when c is a critical point.
• c is a critical point of f if 𝒇′(𝒄) = 𝟎 or if f is not differentiable at x=c
• Critical points determine points at which 𝒇′ 𝒙 may change signs (from positive to
negative or vice versa).

/ 18
Functions: Interprets functions that arise in applications in terms of the
context and analyzes key features of functions – Maximum and Minimum
If c is a critical point of a function f and f is continuous at c, then:
• If 𝑓′(𝑥) goes from negative to positive as x increases through c, then 𝑓 𝑐 is a
relative minimum.
• If 𝑓′(𝑥) goes from positive to negative as x increases through c, then 𝑓 𝑐 is a
relative maximum.
• Here’s a look at this in action: First Derivative Test

/ 19
Functions: Interprets functions that arise in applications in terms of the
context and analyzes key features of functions – Maximum and Minimum
If 𝑓′′ 𝑐 > 0, then the graph of f is concave upward at 𝑥 = 𝑐
• If, in addition, 𝑓′ 𝑐 = 0, then the graph has a relative minimum at 𝑥 = 𝑐
If 𝑓′′ 𝑐 < 0, then the graph of f is concave downward at 𝑥 = 𝑐
• If, in addition, 𝑓′ 𝑐 = 0, then the graph has a relative maximum at 𝑥 = 𝑐
If 𝑓′′ 𝑐 = 0, then the graph is neither concave up nor concave down at 𝑥 = 𝑐
• This indicates 𝑥 = 𝑐 may be a point of inflection – a place where the concavity
changes from up to down or vice versa
Here’s a look at this in action: Second Derivative Test

/ 20
Watch the following videos and then give it a try!
1. Finding the derivative using the Power Rule
2. Finding minima and maxima using derivatives
3. Additional properties for fun!
Find the first derivative using the Power Rule:
1.𝑑
𝑑𝑥(𝑥3)
2.𝑑
𝑑𝑥(1
𝑥)
Functions: Interprets functions that arise in applications in terms of the
context and analyzes key features of functions – Maximum and Minimum
/ 21
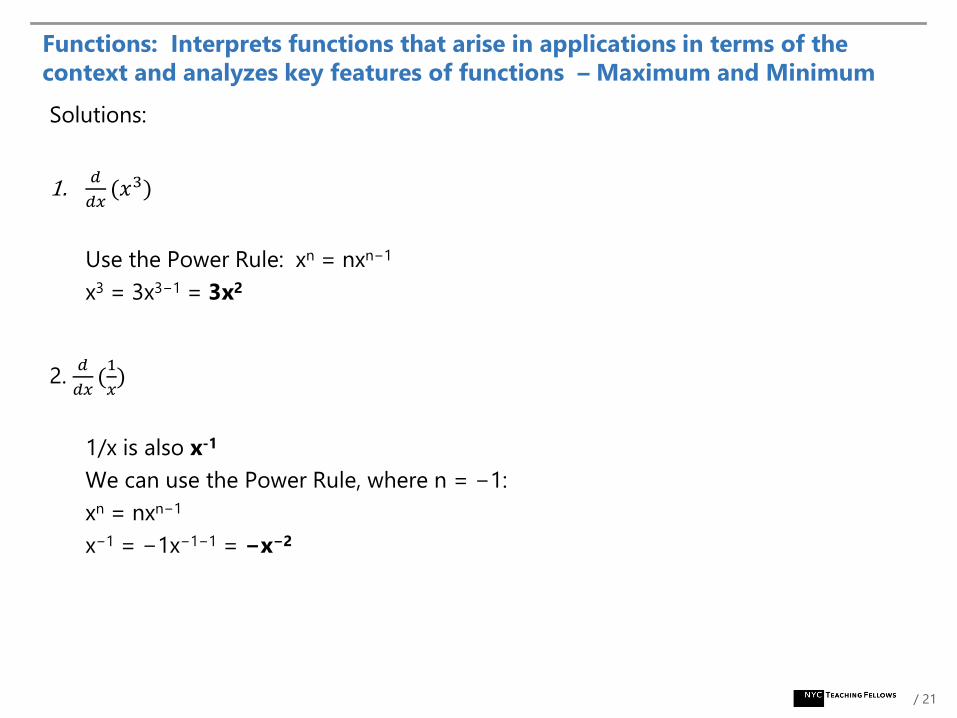
Solutions:
1.𝑑
𝑑𝑥(𝑥3)
Use the Power Rule: xn = nxn−1
x3 = 3x3−1 = 3x2
2. 𝑑
𝑑𝑥(1
𝑥)
1/x is also x-1
We can use the Power Rule, where n = −1:
xn = nxn−1
x−1 = −1x−1−1 = −x−2
Functions: Interprets functions that arise in applications in terms of the
context and analyzes key features of functions – Maximum and Minimum

/ 22
Now try to find the relative min and max using the rules you learned about!
Example: A ball is thrown in the air. Its height at any time t is given by: h = 3 + 14t
− 5t2
What is its maximum height?
Functions: Interprets functions that arise in applications in terms of the
context and analyzes key features of functions – Maximum and Minimum
https://www.mathsisfun.com/calculus/maxima-minima.html

/ 23
Solution:
Using derivatives we can find the slope of that function:
h = 0 + 14 − 5(2t) * this is the derivative
= 14 − 10t
Now find when the slope is zero:
14 − 10t = 0
10t = 14
t = 14 / 10 = 1.4
The slope is zero at t = 1.4 seconds
To find the maximum height, we then plug 1.4 back into the original equation for t
and we get h = 3 + 14(1.4) − 5(1.4)2 so h = 12.8
In the next slide, we will look at how you really know
if this point is the relative min or max.
Functions: Interprets functions that arise in applications in terms of the
context and analyzes key features of functions – Maximum and Minimum
www.mathisfun.com

/ 24
Functions: Interprets functions that arise in applications in terms of the
context and analyzes key features of functions – Maximum and Minimum
If 𝑓′′ 𝑐 > 0, then the graph of f is concave upward at 𝑥 = 𝑐
• If, in addition, 𝑓′ 𝑐 = 0, then the graph has a relative minimum at 𝑥 = 𝑐
If 𝑓′′ 𝑐 < 0, then the graph of f is concave downward at 𝑥 = 𝑐
• If, in addition, 𝑓′ 𝑐 = 0, then the graph has a relative maximum at 𝑥 = 𝑐
If 𝑓′′ 𝑐 = 0, then the graph is neither concave up nor concave down at 𝑥 = 𝑐
• This indicates 𝑥 = 𝑐 may be a point of inflection – a place where the concavity
changes from up to down or vice versa
Here’s a look at this in action: Second Derivative Test

/ 25
Functions: Interprets functions that arise in applications in terms of the
context and analyzes key features of functions – Maximum and Minimum
Below you will find an example of using the second derivative (opposed to a graph) to determine the
local minimums and maximums.
Example: Find the maxima and minima for:
y = 5x3 + 2x2 − 3x
The derivative (slope) is:
y = 15x2 + 4x − 3
Which is quadratic with zeros at:
x = −3/5
x = +1/3
Could they be maxima or minima? (Don't look at the graph yet!)
The second derivative is y'' = 30x + 4
At x = −3/5:
y'' = 30(−3/5) + 4 = −14
it is less than 0, so −3/5 is a local maximum
At x = +1/3:
y'' = 30(+1/3) + 4 = +14
it is greater than 0, so +1/3 is a local minimum
(Now you can look at the graph.)
/ 26
Functions: Interprets functions that arise in applications in terms of the
context and analyzes key features of functions – Maximum and Minimum
Here is a link to some practice problems over the first and second derivative
tests. I should note though, that some of these problems can be a little hard to
follow due to the nature of the problem being online.
First and Second Derivative Test

/ 27
Asymptotes are lines that a curve approaches, as it heads toward infinity. There are
three types of asymptotes:
Functions: Interprets functions that arise in applications in terms of the
context and analyzes key features of functions
https://www.mathsisfun.com/algebra/rational-expression.html
Example: The graph of y=𝑥(𝑥−3)
2(𝑥−1)has:
• A vertical asymptote at x=1
• An oblique asymptote: y=𝑥
2-1
To find the asymptotes: Use the rules of rational functions (algebra section)
Factor: 𝑥(𝑥−3)
2(𝑥−1)
Since x is undefined in the denominator for x=1 there is a vertical asymptote. The oblique asymptote is found by long dividing the original expression (see algebra section for additional support with this concept). Want practice finding asymptotes? Look here.

/ 28
Watch the following video to learn about end behaviors of a function. Within the
video, you will find additional practice problems as well.
End behavior
Functions: Interprets functions that arise in applications in terms of the
context and analyzes key features of functions

/ 29
A linear function makes a straight line and can be written in multiple forms:
1. Slope-intercept form 𝑦 = 𝑚𝑥 + 𝑏 where m= slope and b= y-intercept
2. Standard Form 𝐴𝑥 + 𝐵𝑦 = 𝐶
3. Point-Slope Form 𝑦 − 𝑦1 = 𝑚 𝑥 − 𝑥1
Graphing Practice
Functions: Analyzes functions (e.g., linear, quadratic, square root, piecewise,
polynomial, exponential, logarithmic) using different representations, such
as graphs, verbal descriptions, equivalent algebraic forms, and numeric
tables and builds a function that models a relationship between two
quantities- Linear

/ 30
Linear Functions are represented on a table by a constant change in y and x.
Watch this video to learn more about constructing a linear equation from a table
Test your knowledge of linear functions. Try the problem below!
Functions: Analyzes functions (e.g., linear, quadratic, square root, piecewise,
polynomial, exponential, logarithmic) using different representations, such
as graphs, verbal descriptions, equivalent algebraic forms, and numeric
tables and builds a function that models a relationship between two
quantities- Linear
www.learnzillion.com
/ 31
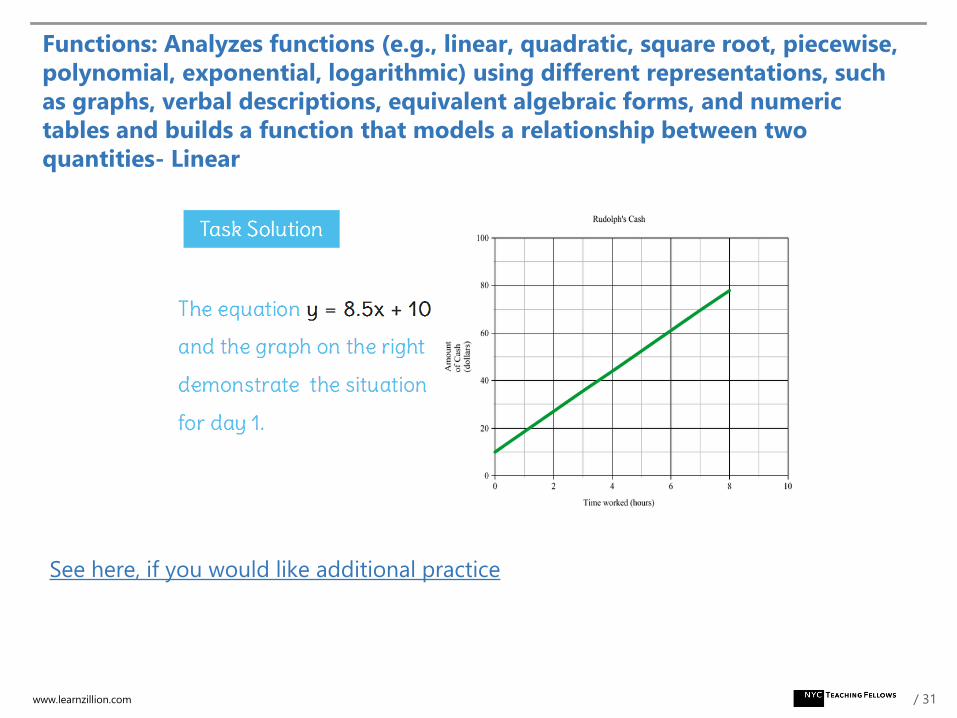
See here, if you would like additional practice
Functions: Analyzes functions (e.g., linear, quadratic, square root, piecewise,
polynomial, exponential, logarithmic) using different representations, such
as graphs, verbal descriptions, equivalent algebraic forms, and numeric
tables and builds a function that models a relationship between two
quantities- Linear
www.learnzillion.com

/ 32
The standard form of a quadratic equation is: 𝐴𝑥2 + 𝑏𝑥 + 𝑐 = 𝑦
If a is positive, the parabola opens upward If a is negative, the parabola
and has a minimum point. The axis of symmetry opens downward and has a
is x = (b)/2a maximum point. The axis of
symmetry is x = (-b)/2a.
See here for Practice Graphing Quadratic Functions
Functions: Analyzes functions (e.g., linear, quadratic, square root, piecewise,
polynomial, exponential, logarithmic) using different representations, such
as graphs, verbal descriptions, equivalent algebraic forms, and numeric
tables and builds a function that models a relationship between two
quantities- Quadratic
http://www.regentsprep.org/regents/math/algebra/AC4/LPara.htm

/ 33
To write quadratic equations from a table, see here. This lesson also reviews ideas
regarding systems of equations (addressed in the Algebra section review)
In this task, you will review how to solve a quadratic equation using the methods of
factoring or completing the square in a real life scenario.
Functions: Analyzes functions (e.g., linear, quadratic, square root, piecewise,
polynomial, exponential, logarithmic) using different representations, such
as graphs, verbal descriptions, equivalent algebraic forms, and numeric
tables and builds a function that models a relationship between two
quantities- Quadratic

/ 34
The square root function or y=a 𝑥 − ℎ +k is modeled by the parent function (prior
to any transformations) as 𝑦 = √𝑥 as seen below:
• Domain is the non-negative real numbers[0, +∞)
• Range is also the Non-Negative Real Numbers: [0, +∞)
• Inverse of the quadratic function
More on Graphing and Tables of the square root function
Functions: Analyzes functions (e.g., linear, quadratic, square root, piecewise,
polynomial, exponential, logarithmic) using different representations, such
as graphs, verbal descriptions, equivalent algebraic forms, and numeric
tables and builds a function that models a relationship between two
quantities- Square Root

/ 35
Try out the following scenario related to the square root function:
Functions: Analyzes functions (e.g., linear, quadratic, square root, piecewise,
polynomial, exponential, logarithmic) using different representations, such
as graphs, verbal descriptions, equivalent algebraic forms, and numeric
tables and builds a function that models a relationship between two
quantities- Square Root
www.learnzillion.com

/ 36
Functions: Analyzes functions (e.g., linear, quadratic, square root, piecewise,
polynomial, exponential, logarithmic) using different representations, such
as graphs, verbal descriptions, equivalent algebraic forms, and numeric
tables and builds a function that models a relationship between two
quantities- Square Root
www.learnzillion.com

/ 37
Piecewise functions include multiple “sub-functions”, with each “sub-function”
applying to a certain interval on the domain.
Example:
Dom(f) = (-∞, 6] or Dom(f) = {x∈ 𝑅 | x ≤ 6}
Watch the following video to learn more about piecewise functions
Functions: Analyzes functions (e.g., linear, quadratic, square root, piecewise,
polynomial, exponential, logarithmic) using different representations, such
as graphs, verbal descriptions, equivalent algebraic forms, and numeric
tables and builds a function that models a relationship between two
quantities- Piecewise
http://www.mathsisfun.com/sets/functions-piecewise.html
X Y
-4 16
-2 4
0 0
1 1
2 6
3 7

/ 38
Try out the following problem on piecewise functions:
Write a piecewise function for the following scenario. Determine the fee for 12 and
20 minutes.
Example: A Doctor's fee is based on the length of time.
Up to 6 minutes costs $50
Over 6 to 15 minutes costs $80
Over 15 minutes costs $80 plus $5 per minute above 15 minutes
Functions: Analyzes functions (e.g., linear, quadratic, square root, piecewise,
polynomial, exponential, logarithmic) using different representations, such
as graphs, verbal descriptions, equivalent algebraic forms, and numeric
tables and builds a function that models a relationship between two
quantities- Piecewise
http://www.mathsisfun.com/sets/functions-piecewise.html

/ 39
Solution:
The fee for 12 minutes is $80.00 and the fee for 20 minutes is $105.00
Now try out these problems associated with graphing piecewise functions
Functions: Analyzes functions (e.g., linear, quadratic, square root, piecewise,
polynomial, exponential, logarithmic) using different representations, such
as graphs, verbal descriptions, equivalent algebraic forms, and numeric
tables and builds a function that models a relationship between two
quantities- Piecewise

/ 40
Exponential functions can be written as y=(𝑖𝑛𝑖𝑡𝑖𝑎𝑙 𝑣𝑎𝑙𝑢𝑒) ∙ (𝑔𝑟𝑜𝑤𝑡ℎ 𝑓𝑎𝑐𝑡𝑜𝑟)𝑥 where x
represents the number of time periods and y represents the amount of the growing quantity.
Example: A certain virus will triple in population each hour in a laboratory. Suppose you initially
have 30 specimens of the virus. Write a two variable equation to model the situation. y=
(30)(3)𝑥
Graphs of Exponential Functions in the form y = a * b(x-h) +k.
where a=1 (initial value) and h/k (horizontal and
vertical shifts) equal zero, have a y intercept of (0,1),
the domain is all real numbers, the range is all
real numbers>0, and the equation of the asymptote is
y=0 (the graph approaches the x axis but never touches
it).
Video on Graphing and Creating Tables for Exponential Functions
Graphing Practice
Examples of Applications
Functions: Analyzes functions (e.g., linear, quadratic, square root, piecewise,
polynomial, exponential, logarithmic) using different representations, such
as graphs, verbal descriptions, equivalent algebraic forms, and numeric
tables and builds a function that models a relationship between two
quantities- Exponential
http://www.regentsprep.org/regents/math/algtrig/atp8b/exponentialFunction.htm

/ 41
The Natural Exponential Function:
Functions: Analyzes functions (e.g., linear, quadratic, square root, piecewise,
polynomial, exponential, logarithmic) using different representations, such
as graphs, verbal descriptions, equivalent algebraic forms, and numeric
tables and builds a function that models a relationship between two
quantities- Exponential
http://www.regentsprep.org/regents/math/algtrig/atp8b/exponentialFunction.htm
The function defined by f (x) = ex is
called the natural exponential
function.
(e is an irrational number,
approximately 2.71828183, named
after the 18th century Swiss
mathematician, Leonhard Euler .
This function is simply a "version" of
where b >1.

/ 42
The Logarithmic Function is defined as f(x) = loga(x) where a is any value greater
than 0, except 1
Example: f(x) = log2(x)
Read about the Logarithmic Function
Video on Graphing and Creating Tables for Logarithmic Functions
Video with Application (also discusses inverse functions highlighted later in the PPT)
Functions: Analyzes functions (e.g., linear, quadratic, square root, piecewise,
polynomial, exponential, logarithmic) using different representations, such
as graphs, verbal descriptions, equivalent algebraic forms, and numeric
tables and builds a function that models a relationship between two
quantities- Logarithmic
http://www.mathsisfun.com/sets/function-logarithmic.html
/ 43
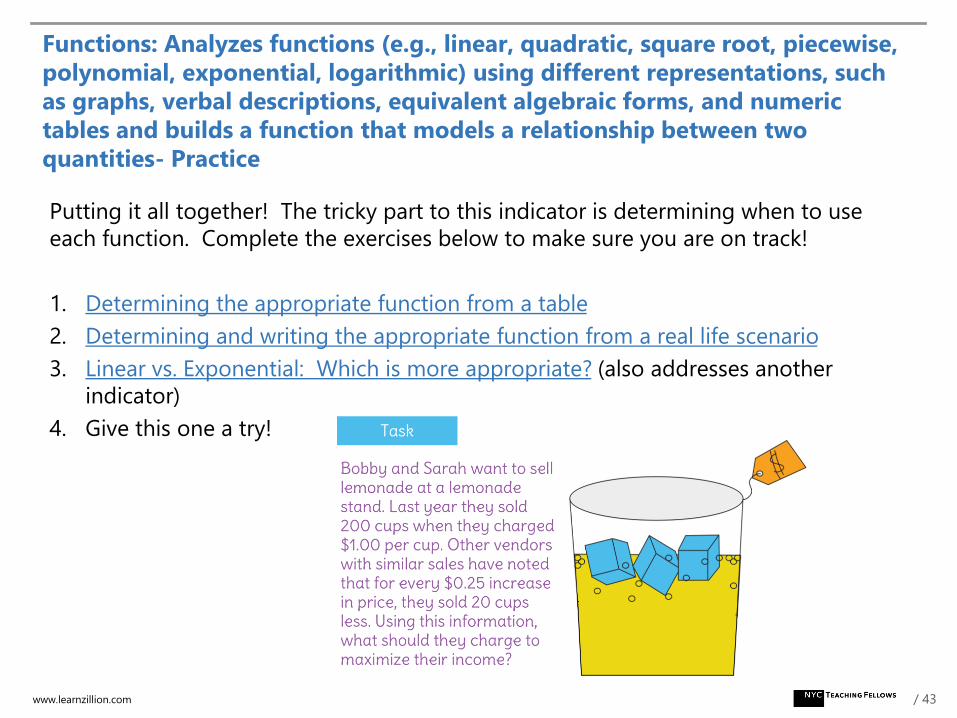
Putting it all together! The tricky part to this indicator is determining when to use
each function. Complete the exercises below to make sure you are on track!
1. Determining the appropriate function from a table
2. Determining and writing the appropriate function from a real life scenario
3. Linear vs. Exponential: Which is more appropriate? (also addresses another
indicator)
4. Give this one a try!
Functions: Analyzes functions (e.g., linear, quadratic, square root, piecewise,
polynomial, exponential, logarithmic) using different representations, such
as graphs, verbal descriptions, equivalent algebraic forms, and numeric
tables and builds a function that models a relationship between two
quantities- Practice
www.learnzillion.com

/ 44
Please see here for other
methods of finding the best price
and additional practice.
Functions: Analyzes functions (e.g., linear, quadratic, square root, piecewise,
polynomial, exponential, logarithmic) using different representations, such
as graphs, verbal descriptions, equivalent algebraic forms, and numeric
tables and builds a function that models a relationship between two
quantities- Practice
www.learnzillion.com

/ 45
Function Transformations:
g(x) = x2 + C moves the graph up g(x) = (x+C)2 moves the graph left or right
note + moves the graph left!
• Try it out! The figure shows the graph of a function f whose domain is the
interval −2≤x≤2. In (i)–(iii), sketch the graph of the given function and compare with the
graph of f. Explain what you see.
o g(x)=f(x)+2
o h(x)=−f(x)
o p(x)=f(x+2)
Check your work here. Additional Resource
Functions: Builds new functions from existing functions (e.g., identifies the
effect of replacing f(x) with f(x + k), composes functions, finds inverse
functions)
www.mathisfun.com

/ 46
Function Composition is applying one function to the results of another:
The result of f() is sent through g()
It is written: (g º f)(x) Please note the circle is not multiplication, instead it
is the symbol for a composition.
Which means: g(f(x))
g(f(x)) and f(g(x)) are not the same thing!
Read here for information and examples of compositions
Try out this problem!
Find g(f(x)) and f(g(x)) if f(x)= 2x+3 and g(x)=𝑥2 Look here for the solution
Additional practice problems
Functions: Builds new functions from existing functions (e.g., identifies the
effect of replacing f(x) with f(x + k), composes functions, finds inverse
functions)
www.mathisfun.com

/ 47
If the graph of a function contains the point (a,b), then the graph of the inverse relation of the
function contains the point (b,a). To graph the inverse of a function, reverse the ordered pairs of
the original function (another words swap the x and y).
Important facts:
The inverse function is denoted by f -1(x).
The inverse may not be a function! Use the horizontal line test to determine if a function has
an inverse function. If ANY horizontal line intersects your original function in ONLY ONE
location, your function has an inverse which is also a function.
• If a function has an inverse function, the reflection of that original function in the identity
line, y = x, will also be a function (it will pass the vertical line test for functions).
• The example below shows the original function, y = x2 , in blue. Its reflection over the identity
line y = x is shown in red is its inverse relation. The red dashed line will not pass the vertical
line test for functions, thus y = x2 does not have an inverse function.
You can see that the inverse relation exists, but it is NOT a function.
Functions: Builds new functions from existing functions (e.g., identifies the
effect of replacing f(x) with f(x + k), composes functions, finds inverse
functions)
http://www.regentsprep.org/regents/math/algtrig/atp8/applesson.htm

/ 48
Try it out! Find the inverse of the following function:
A. B. C. D.
Functions: Builds new functions from existing functions (e.g., identifies the
effect of replacing f(x) with f(x + k), composes functions, finds inverse
functions)
www.ixl.com

/ 49
Solution: C
The graph of a function and its inverse are always reflections of each other in the line
y = x
Explanation as to why the quadratic function is invertible.
Additional Practice
Functions: Builds new functions from existing functions (e.g., identifies the
effect of replacing f(x) with f(x + k), composes functions, finds inverse
functions)
www.ixl.com

/ 50
When distinguishing between a linear and exponential function, keep in mind:
• Exponentials with small growth factors may start off growing very small, where the
change would almost seem insignificant, but eventually they will end up growing
very quickly just like exponentials with large growth factors.
Complete this task for additional practice on this idea
Functions: Constructs and compares linear, quadratic, and exponential
models and distinguishes between those situations (mathematical and real-
world) that can be modeled with linear functions and those that can be
modeled with exponential functions
www.learnzillion.com

/ 51
Constraints impose restrictions on the domain and range of functions. Try out the
following problem to practice this concept.
Functions: Interprets expressions and parameters in linear, quadratic, or
exponential functions in terms of the context and situation they model
www.learnzillion.com

/ 52
Solution:
Additional Practice
Functions: Interprets expressions and parameters in linear, quadratic, or
exponential functions in terms of the context and situation they model
www.learnzillion.com

/ 53
Functions: Understands radian measure and how the unit circle in the
coordinate plane enables the extension of trigonometric functions
Below is the Unit Circle. This Unit Circle holds a wealth of information. Make sure
you can go between radians and degrees.

/ 54
Functions: Understands radian measure and how the unit circle in the
coordinate plane enables the extension of trigonometric functions
• May be worth memorizing, or at least recognizing.
• Notice that if you plug in 30o and π/6, you get the same answer if you remember to switch your calculator from degrees to radians.
• Note: tan(x)= sin(x)/cos(x), cot(x)= 1/tan(x), sec(x)=1/cos(x), and csc(x)=1/sin(x)

/ 55
Where do the values on the unit circle come from?
Watch this video to see how the values are derived.
Look here for more information regarding radians.
Check out this interactive graph to see how the unit circle is connected to trig graphs
Functions: Understands radian measure and how the unit circle in the
coordinate plane enables the extension of trigonometric functions

/ 56
Functions: Models periodic phenomena with trigonometric functions
Notice the key differences between the following graphs
y = sin x
y = cos x
y = tan x

/ 57
Functions: Models periodic phenomena with trigonometric functions
Key Ideas regarding trig functions:
1. The amplitude of a sinusoidal function is one-half of the positive difference between
the maximum and minimum values of a function. Amplitude is the magnitude
(height) of the oscillation (wave) of a sinusoidal function. Sometimes it is referred to
as the "peak from center" of the graph.
2. A periodic function is an oscillating (wave-like) function which repeats a pattern of y-
values at regular intervals. One complete repetition of the pattern is called
a cycle. The period of a function is the horizontal length of one complete cycle. In
functional notation we could say: The period is the smallest value of k in a
function f for which there exists some constant k such that
f (t) = f (t + k) for every number t in the domain of f.
http://www.regentsprep.org/regents/math/algtrig/att7/graphvocab.htm

/ 58
Functions: Models periodic phenomena with trigonometric functions
Key Ideas regarding trig functions:
3. The frequency of a trigonometric function is the number of cycles it
completes in a given interval. This interval is generally radians (or 360º) for
the sine and cosine curves.
4. A sinusoidal curve is the graph of the sine function in trigonometry.
A sinusoid is the name given to any curve that can be written in the form
The example at the right is:
http://www.regentsprep.org/regents/math/algtrig/att7/graphvocab.htm

/ 59
Functions: Models periodic phenomena with trigonometric functions
Key Ideas regarding trig functions:
5. From the sinusoidal equation, the horizontal shift is
obtained by determining the change being made to the x value. The
horizontal shift is C. The vertical shift is D. If the value of B is 1, the
horizontal shift can also be called a phase shift. Remember that the
expression (x - C) from the equation will look like (for example):
• (x - 2) where 2 is a positive value being
subtracted, when the shift is to the right.
• (x + 2) where 2 is a negative value being
subtracted, when the shift is to the left.
Example to the right:
http://www.regentsprep.org/regents/math/algtrig/att7/graphvocab.htm

/ 60
Functions: Models periodic phenomena with trigonometric functions
Key Facts about the trig functions:
1. Y=Sin (x)
amplitude: 1 (height)
period: 2𝜋 (length of one cycle)
domain: 𝑥𝜖𝑅range: -1≤ 𝑦 ≤ 1
2. Y=Cos(x)
amplitude: 1 (height)
period: 2𝜋 (length of one cycle)
domain: 𝑥𝜖𝑅range: -1≤ 𝑦 ≤ 1
3. Y=Tan(x)
amplitude: none
contains vertical asymptotes at x=𝜋
2+ 𝜋𝑘
period: 𝜋
http://www.regentsprep.org/regents/math/algtrig/att7/graphvocab.htm

/ 61
Functions: Models periodic phenomena with trigonometric functions
Additional Graphs to know:
y=csc(x) also known as 1/sin(x)
y = cot(x) also known as 1/tan(x)
y=sec (x) also known as 1/cos(x)
y= sin(𝑥)−1 also known as arcsin(x)
y= cos(𝑥)−1 also known as arccos(x)
y= tan(𝑥)−1 also known as arctan(x)
Don’t forget: To graph trig functions on your calculator you will need to change
the mode to radians!

/ 62
Try it out! Use trigonometric functions to answer the following real life scenario:
The solution can be found here.
You will also find additional practice with applications of trig functions here
Functions: Models periodic phenomena with trigonometric functions
www.learnzillion.com

/ 63
The Pythagorean Identities:
When studying the unit circle, it was observed that a point on the unit circle (the
vertex of the right triangle) can be represented by the coordinates (cos𝜃, 𝑠𝑖𝑛𝜃).Since the legs of the right triangle in the unit circle have the values of s𝑖𝑛𝜃 and cos𝜃,
the Pythagorean Theorem can be used to obtain 𝑠𝑖𝑛2𝜃 +𝑐𝑜𝑠2𝜃=1. This is the key
identity to remember!
From previous slides: These are important facts! cos(x)/sin(x) = cot(x), sin(x)/cos(x)
=tan(x), 1/sin(x)=csc(x) and 1/cos(x) = sec(x)
From this identity the other Pythagorean Identities can
be derived:
Functions: Proves and applies trigonometric identities
http://www.regentsprep.org/regents/math/algtrig/att9/pythagoreanid.htm

/ 64
Additional Trig Identities
Functions: Proves and applies trigonometric identities
http://www.regentsprep.org/regents/math/algtrig/att9/pythagoreanid.htm

/ 65
Try out the problems below.
1.
2.
3.
4. Multiply and express as a monomial.
The solutions can be found here.
Additional Practice can be found here.
Functions: Proves and applies trigonometric identities
http://www.regentsprep.org/regents/math/algtrig/att9/pythagoreanid.htm

/ 66
In addition to simplifying expressions, identities can be used to find various trig
values.
Use the following line to find the other trig values.
Functions: Proves and applies trigonometric identities

/ 67
Agenda
Introduction to Competency
Content Review and Sample Problems
Additional Practice

/ 68
Writing an expression from a table of values:
Use the figure below to answer the question that follows:
Chains of regular polygons can be formed by placing individual polygons side by side. For
example, the figure above shows a chain of four regular hexagons. Which of the following
expressions represents the perimeter of a chain of n regular polygons if each polygon has
s sides of length 1?
A. 𝑛 + 1 𝑠
B. 𝑛 + 2 𝑠 − 2
C. 𝑛 𝑠 − 2 + 2
D. 𝑛𝑠
2+ 2
Additional Practice Problems Functions
New York State Education Department

/ 69
Solution: C
All of the polygons, except the two end polygons, have two shared sides that do not affect
the perimeter. Each of the two end polygons has one shared side that does not affect the
perimeter. The expressions 𝑛 𝑠 − 2 represents a perimeter that accounts for all of the
polygons having two shared sides. To make up for the two unshared sides on the end
polygons, 2 must be added to the expression. Therefore, 𝑛 𝑠 − 2 + 2 represents the
perimeter.
Additional Practice Problems Functions
New York State Education Department

/ 70
Writing an exponential expression:
A deposit of $250.00 is made in an interest-paying savings account. The table shows the
amount of money in the account at the end of each of three equal payment periods. No
money is deposited or withdrawn from the account, and the interest rate remains
constant.
Which of the following expressions could be used to determine the amount of money in
the account after n payment periods?
A. 250 + 0.0175 𝑛
B. 250 + 250 0.0175 𝑛
C. 250 0.0175 𝑛
D. 250 1.0175 𝑛
Additional Practice Problems Functions
New York State Education Department

/ 71
Solution: D
The account pays a constant interest rate at the end of each period. Let r = the interest
rate. Then 250r = 4.38 and r = 0.0175 rounded to the nearest ten-thousandth. The
amount of money in the account at the end of Period 1 is 250 + 250 0.0175 =250 1.0175 .
To facilitate the calculation, let x = 250 1.0175 . Then the amount of money at the end of
Period 2 is x + x 0.0175 = x 1.0175 = 250 1.0175 2 . Continuing the pattern in this way
shows that 250 1.0175 𝑛 is the amount of money in the account after n payment periods.
Additional Practice Problems Functions
New York State Education Department

/ 72
Trigonometry:
Use the graph below to answer the question that follows:
The graph of the partial sum 𝑓 𝑥 = 𝑥 −𝑥3
3!+
𝑥5
5!of the power series σ𝑘=0
∞ (−1)𝑘𝑥2𝑘+1
2𝑘+1 !is shown
above. The graph of f(x) gives a good approximation of which of the following function over the
interval −2 ≤ 𝑥 ≤ 2?
A. sin x
B. cos x
C. tan x
D. csc x
Additional Practice Problems Functions
New York State Education Department

/ 73
Solution: A (Please note: Don’t get caught up with the power series notation). Pay
attention to the characteristics of the trig functions over the interval given.
Of the choices given, the only trigonometric functions that have a root of 0 are sin x and
tan x. The local maximum of 1 on the graph of f(x) occurs at approximately x=1.5. The sine
function has a maximum of 1 at 𝑥 =𝜋
2≈ 1.57, while the tangent function is undefined at
𝑥 =𝜋
2. Therefore, the graph of f(x) gives a good approximation of sin x over the interval
− 2 ≤ 𝑥 ≤ 2. Note that the partial sum given by f(x) is the first three terms in the Taylor
series of sin x centered at x=0.
Additional Practice Problems Functions
New York State Education Department

/ 74
Calculus and Derivatives:
The number of people who become infected with a contagious disease at time t is
represented by 𝑦 = 𝑁(𝑡). Which of the following conditions indicates that the number of
newly infected people is increasing, but at a slower rate than in the previous time period?
A. N′ 𝑡 > 0 and N′′ 𝑡 > 0
B. N′ 𝑡 < 0 and N′′ 𝑡 > 0
C. N′ 𝑡 > 0 and N′′ 𝑡 < 0
D. N′ 𝑡 < 0 and N′′ 𝑡 < 0
Additional Practice Problems Functions
New York State Education Department

/ 75
Solution: C
The first derivative of a function measures the rate of change of the function. Since the
number of newly infected people is increasing, the first derivative, N′ 𝑡 , must be positive.
The second derivative of a function measures the rate of change of the first derivative.
Since the number of newly infected people is increasing at a slower rate, the first
derivative is decreasing. Therefore, the second derivative, N′′ 𝑡 , must be negative.
Additional Practice Problems Functions
New York State Education Department

/ 76
Function Review:
A competitor in an event at a hot-air balloon festival throws a marker down from an
altitude of 200 feet toward a target. The table below shows the relationship between the
height of the marker above the ground and the time since the competitor threw the
marker.
How many seconds after the competitor throws the marker will the marker hit the
ground?
A. 2.0 seconds
B. 2.5 seconds
C. 3.0 seconds
D. 3.5 seconds
Additional Practice Problems Functions
New York State Education Department

/ 77
Solution: B
In the first 0.25 seconds, the marker drops 11 feet. In the next 0.25 seconds, the marker
drops 13 feet. And, in the next 0.25 seconds, the marker drops 15 feet. Continuing this
pattern by extending the table, the marker will hit the ground (height=0) after 2.5
seconds.
Additional Practice Problems Functions
New York State Education Department

/ 78
Tables:
Use the table below to answer the question that follows.
The numbers in the table represent the populations of two small towns, A and B, over a
forty-year period. Which of the following statements is best supported by the data?
A. Town A and Town B are both growing more slowly in the 1990s than in the 1960s.
B. Town A initially grew more slowly than Town B but recently has been growing more
rapidly.
C. Town A and Town B will eventually have equal populations.
D. Town A has consistently grown at a slower rate than Town B.
Additional Practice Problems Functions
New York State Education Department

/ 79
Solution: D
Although the rate of population change in each town has varied between 1960 and 2000,
the percentage increase in population has been greater each ten years in Town B than the
percentage increase in population in Town A. Thus, Town A has consistently grown at a
slower rate than Town B.
Additional Practice Problems Functions
New York State Education Department

/ 80
Models Periodic Phenomena with Trigonometric Functions
The function in the graph above models the employment of country A employment.
The amplitude of the sinusoidal function is _____ million of people employed.
A. 1
B. 11
C. 10
D. 9
E. 5
Additional Practice Problems Functions
New York State Education Department

/ 81
Models Periodic Phenomena with Trigonometric Functions Solution: A
The maximum of the function is 11 million and the midline is 10 million, so the amplitude
of the sinusoidal function is 1 million people.
Additional Practice Problems Functions
New York State Education Department