multi-scale model analysis of boundary layer ozone … · multi-scale model analysis of boundary...
TRANSCRIPT
Atmos. Chem. Phys., 9, 3277–3301, 2009www.atmos-chem-phys.net/9/3277/2009/© Author(s) 2009. This work is distributed underthe Creative Commons Attribution 3.0 License.
AtmosphericChemistry
and Physics
Multi-scale model analysis of boundary layer ozone over East Asia
M. Lin 1, T. Holloway1, T. Oki2, D. G. Streets3, and A. Richter4
1Center for Sustainability and the Global Environment, Nelson Institute for Environmental Studies,University of Wisconsin-Madison, Madison, WI, USA2Institute of Industrial Science, University of Tokyo, Tokyo, Japan3Argonne National Laboratory, Argonne, IL, USA4Institute of Environmental Physics, University of Bremen, Bremen, Germany
Received: 18 August 2008 – Published in Atmos. Chem. Phys. Discuss.: 3 December 2008Revised: 14 May 2009 – Accepted: 14 May 2009 – Published: 20 May 2009
Abstract. This study employs the regional Community Mul-tiscale Air Quality (CMAQ) model to examine seasonal anddiurnal variations of boundary layer ozone (O3) over EastAsia. We evaluate the response of model simulations ofboundary layer O3 to the choice of chemical mechanisms,meteorological fields, boundary conditions, and model res-olutions. Data obtained from surface stations, aircraft mea-surements, and satellites are used to advance understandingof O3 chemistry and mechanisms over East Asia and eval-uate how well the model represents the observed features.Satellite measurements and model simulations of summer-time rainfall are used to assess the impact of the Asian mon-soon on O3 production. Our results suggest that summertimeO3 over Central Eastern China is highly sensitive to cloudcover and monsoonal rainfall over this region. Thus, accu-rate simulation of the East Asia summer monsoon is criti-cal to model analysis of atmospheric chemistry over China.Examination of hourly summertime O3 mixing ratios fromsites in Japan confirms the important role of diurnal boundarylayer fluctuations in controlling ground-level O3. By com-paring five different model configurations with observationsat six sites, the specific mechanisms responsible for modelbehavior are identified and discussed. In particular, verticalmixing, urban chemistry, and dry deposition depending onboundary layer height strongly affect model ability to captureobserved behavior. Central Eastern China appears to be themost sensitive region in our study to the choice of chemicalmechanisms. Evaluation with TRACE-P aircraft measure-ments reveals that neither the CB4 nor the SAPRC99 mech-
Correspondence to:M. Lin([email protected])
anisms consistently capture observed behavior of key pho-tochemical oxidants in springtime. However, our analysisfinds that SAPRC99 performs somewhat better in simulatingmixing ratios of H2O2 (hydrogen peroxide) and PAN (per-oxyacetyl nitrate) at flight altitudes below 1 km. The highlevel of uncertainty associated with O3 production in CentralEastern China poses a major problem for regional air qualitymanagement. This highly polluted, densely populated regionwould greatly benefit from comprehensive air quality moni-toring and the development of model chemical mechanismsappropriate to this unique atmospheric environment.
1 Introduction
Ozone (O3) is a secondary pollutant produced in the tropo-sphere by photochemical oxidation of volatile organic com-pounds (VOCs) and carbon monoxide (CO) in the pres-ence of nitrogen oxides (NOx=NO+NO2). Ozone may alsobe transported from the stratosphere to the troposphere.Ground-level O3 is a major component of urban smog thatposes a significant risk for public health, and O3 through-out the troposphere is an important greenhouse gas (Fish-man et al., 1979). Ozonesonde observations in Japan (Najaand Akimoto, 2004) and Hong Kong (Liu et al., 2002) showthat the seasonal cycle of O3 in the boundary layer has abroad summer minimum at lower latitudes of the Asian Pa-cific Rim, in contrast to summer maximums observed at re-gionally polluted sites in North America and Europe (Jacob,1999). Recent studies over Eastern China report that surfaceO3 exhibits a narrow peak in early summer (May or June)and a sharp drop in July and August, based on measurements
Published by Copernicus Publications on behalf of the European Geosciences Union.
3278 M. Lin et al.: Boundary layer ozone over East Asia
taken in downwind of Beijing (Ding et al., 2008; Wang et al.,2008; Lin et al., 2008c), at three mountaintop sites (Li et al.,2007), and at a rural site near Shanghai (Xu et al., 2008).Previous studies have suggested that the East Asia monsoonis responsible for the observed summer minimum of bound-ary layer O3 along the west Pacific coast (Liu et al., 2002;He et al., 2008, and references therein). However, a dis-tinctly different seasonal pattern of surface O3 with a broadsummertime maximum during May–August is observed atMt. Waliguan (3.8 km above sea level), located on the north-eastern edge of the Tibetan Plateau. Meteorological simu-lations (Ding and Wang, 2006) and regional model analysisfrom tagged emission sources (Ma et al., 2002, 2005) sug-gest that the episodic elevated surface O3 mixing ratios atWaliguan are mostly caused by the downward transport ofstratospheric air, rather than transport of anthropogenic pol-lution from Eastern China (Zhu et al., 2004). Current un-derstanding of the spatial and temporal variations of tropo-spheric O3 in China is far from complete. More detailedmodel analysis is needed to interpret the observed features oftropospheric O3 over this rapidly growing economic region.
Accurate prediction of tropospheric O3 presents a partic-ular challenge in chemical transport models (CTMs) due tothe complex physical and chemical processes occurring fromglobal to local scales. A number of regional CTMs have beenemployed to study episodic chemical transport and transfor-mations of Asian pollutants in springtime (e.g.Carmichaelet al., 2003c; Zhang et al., 2003; Wang et al., 2006), and theseasonal cycle of surface O3 in Eastern China (Li et al., 2007)and Japan (Yamaji et al., 2006). Results from the MICS-Asiaregional model intercomparison study found that O3 predic-tions for July over Central Eastern China differ by∼20 ppbvamong seven regional CTMs (Han et al., 2007). This di-vergence in model estimates suggests that important ques-tions remain on the key mechanisms controlling the O3 bud-get over East Asia. Chemical mechanisms have been foundto substantially impact model predictions of O3 over NorthAmerica, and the effects of NOx and VOCs emissions con-trols vary depending on chemistry (e.g.,Sarwar et al., 2008;Luecken et al., 2007; Arnold and Dennis, 2006). However,the response of local and regional O3 in Asia to choice andimplementation of chemical mechanisms has not been eval-uated yet. Several studies have addressed the significant im-pact of the Asian monsoon on O3 production over EasternChina (He et al., 2008; Wang et al., 2008), but evaluationof how well meteorological models can reproduce monsoonrainfall and its implication on O3 prediction is insufficient.
This study employs the regional Community MultiscaleAir Quality (CMAQ v. 4.6) model (Byun and Ching, 1999;Byun and Schere, 2006) to examine seasonal and diurnalvariations of boundary layer O3 over East Asia. The CMAQmodel is driven by MM5 and by WRF meteorological fields.Chemical boundary conditions for CMAQ are derived fromthe global Model for Ozone and Related Tracers (MOZARTv. 2.4) (Horowitz et al., 2003). This is a contemporary
model set-up, and there are not many results presented yetfor East Asia. The purpose of this paper is to provide afirst step in evaluating the response of model simulationsof local and regional O3 in Asia to the choice of chemi-cal mechanisms, meteorological fields, boundary conditions,and model resolutions. From this analysis, we examine keymechanisms controlling boundary layer O3 over East Asia,discuss the reasons for discrepancies between model resultsand observations, and make recommendations regarding op-timal regional-scale model configurations for future studiesof East Asian O3 prediction. Section2 gives an overviewof observational data and model configurations. Discussionof O3 seasonality is presented in Sect.3. We first examinethe impacts of global pollution inflow, the Asian monsoon,and photochemistry on the seasonal cycle of surface O3 atground-based stations in Siberia, Japan, China, and South-east Asia. Satellite data and model simulations of precipita-tion and tropospheric NO2 columns are used to help interpretseasonal behavior of boundary layer O3. Then, with a fo-cus on the spring and summer seasons, Sect.4 analyzes ma-jor photochemical products using two widely used chemicalschemes and compares model results with aircraft measure-ments. Section5 presents the diurnal variability of summer-time ground-level O3. We examine the impacts of boundarylayer mixing, local chemistry, and dry deposition processeson the formation of ground-level O3.
2 Models and data
2.1 Meteorological fields
We tested the CMAQ model with three sets of meteorolog-ical fields for 2001. Table1 gives horizontal scales, ver-tical layers, large-scale meteorological fields and physicalparameterizations employed for the meteorological simula-tions. CMAQ was initially driven with meteorological fieldsfrom MM5 on an 81×81 km2 primary domain over EastAsia and on a 27×27 km2 nested domain over NortheastAsia (hereafter referred to as MM5-CMAQ) (Fig.1a). Ver-tical layer collapsing was performed to generate eight-layermeteorological fields for CMAQ. Similar configurations ofMM5-CMAQ were successfully employed to study long-range transport of acidifying substances over East Asia, andresults were presented inLin et al. (2008a) for model evalu-ation and inLin et al. (2008b) for estimating source-receptorrelationships. The reader is referred toLin et al. (2008a)for a detailed description of emissions data and its process-ing. To examine if vertical layer collapsing would under-mine model performance for O3 predictions, we employ theWeather Research and Forecasting (WRF) model with highervertical resolution as an alternative meteorological model forCMAQ (hereafter referred to as WRF-CMAQ). The WRF-CMAQ simulation includes 29 vertical layers extending from8 m to 20 km above ground, with eleven layers in the lowest
Atmos. Chem. Phys., 9, 3277–3301, 2009 www.atmos-chem-phys.net/9/3277/2009/
M. Lin et al.: Boundary layer ozone over East Asia 3279
Table 1. Model configurations
Configurations Domain 1 (D1) Domain 2 (D2) Domain 3 (D3)
Meteorology model MM5 MM5 WRFHorizontal resolution 81 km 27 km 27 kmMet. vertical layers 23 (8 in lowest 2 km) 23 (8 in lowest 2 km) 29 (11 in lowest 2 km)Depth of first model layer 73 m 73 m 17 mModel top 100 hPa 100 hPa 50 hPaLand surface model NOAH NOAH NOAHGlobal analysis NCEP/NCAR (2.5×2.5◦, 6 h) NCEP/NCAR FNL (1×1◦, 6 h)Boundary layer scheme MRF MRF YSUMicrophysics REISNER1 REISNER1 WSM-6Longwave radiation Cloud Cloud RRTMCumulus parameterization Grell scheme Grell scheme Kain-Fritsch schemeAnalysis nudging Yes Yes YesMet initializationa Continuous run Continuous run Re-initialize every 5.5 daysCMAQ vertical resolution 8 (5 in lowest 2 km) 8 (5 in lowest 2 km) Same as WRFCMAQ boundary condition MOZART (monthly) CMAQ D1 (hourly) MOZARTb
a Data for initial twelve hours are not used by CMAQ to allow the spin up of clouds and other climate processes.b WRF-CMAQ uses dynamic hourly BC for March, and monthly mean BC for JJA.
2 km. The depth of the first WRF-CMAQ layer is set to17 m. The vertical resolution of WRF-CMAQ should be fineenough to simulate surface inversion and land-surface inter-actions. WRF-CMAQ is run for March and summer months(JJA) only, on a 27×27 km2 domain shown in Fig.1b. BothMM5 and WRF simulations apply three-dimensional gridnudging towards global analysis. The impacts of meteoro-logical fields on O3 predictions are discussed in both Sect.3and5.
2.2 Gas phase chemistry
In the interest of evaluating model sensitivities to photo-chemical schemes, we have tested two widely used chemicalmechanisms, the Carbon Bond IV (CB4) mechanism (Geryet al., 1989) and the Statewide Air Pollution Research Cen-ter (SAPRC99) mechanism (Carter, 2000). The speciationof VOCs to the mechanism-dependent species of CB4 andSAPRC99 is based on a new emission processing model asdescribed inLin et al. (2008a). CB4 is a lumped-structurecondensed mechanism in which organic species are catego-rized according to reactions of similar carbon bonds (C-C,C=C, C-CHO etc.). The CB4 mechanism in CMAQ con-tains 36 species and 93 reactions including 11 photolyticreactions. Compared with CB4, SAPRC99 includes moredetailed organic chemistry, explicit organic peroxy radicals,and more complete organic intermediates, and provides bet-ter representation of peroxides for low NOx conditions. TheSAPRC99 mechanism has assignments for 400 types ofVOCs, and can be used to estimate reactivities for 550 VOCcategories (Carter, 2000). A total of 24 model species areused to represent the reactive organic product species: 11 are
explicit, and 13 represent groups of similar oxidation reac-tivity and emission magnitudes using the lumped moleculeapproach. The SAPRC99 mechanism in CMAQ includes 72species and 214 reactions including 30 photolytic reactions.
2.3 Boundary conditions
Treatment of lateral and top boundary conditions (BCs) ofchemical species is one of the major factors affecting re-gional model results, especially for long-lived species suchas O3, PAN, and CO etc. Most regional models do not ap-ply chemical top BCs, nor does the CMAQ model. Thus, werestrict our comments here to the lateral BCs. CMAQ wasinitially developed for regulatory purposes, where ground-level pollution is of greatest concern, and numerous evalu-ations with ground-based measurements have been carriedout. For most studies focusing on boundary layer pollution,vertical layer collapsing in the upper troposphere is gener-ally performed to alleviate computational costs (e.g.Arnoldand Dennis, 2006; Lin et al., 2008a; Han et al., 2007; Fanet al., 2005). The coarse vertical resolution in the upper tro-posphere might not resolve the tropopause. When realisticO3 profiles derived from global models or ozonesondes areprovided at the model boundaries, O3 in the stratosphere willbe quickly dispersed throughout the very thick CMAQ layerthat straddles the tropopause, resulting in an artificial down-ward transport of O3 into the upper troposphere and further tothe surface. For this problem, we do not interpolate O3 inflowfrom the MOZART global model across the tropopause forthe annual simulation of MM5-CMAQ with only three layersabove 2 km. WRF-CMAQ has adequate vertical resolutionin the upper troposphere and lower stratosphere. Sensitivity
www.atmos-chem-phys.net/9/3277/2009/ Atmos. Chem. Phys., 9, 3277–3301, 2009
3280 M. Lin et al.: Boundary layer ozone over East Asia
Table 2. Ground-based measurement data used in this study.
Name Type LAT LONG HT Periods References(m a.s.l.)
Mondy Remote 51.67 101.00 2000 2001–2007 P. Pochanart, personalcommunication (2009), EANET
Beijing Rural 39–42 115.5–118.5 600 1995–2005a Ding et al.(2008)Mt. Hua Mountain 34.49 110.09 2064 2004–2005Li et al. (2007)Mt. Tai Mountain 36.25 117.10 1533 2004–2005Li et al. (2007)Mt. Huang Mountain 30.13 118.15 1836 2004–2005Li et al. (2007)LinAn Rural 30.30 119.73 132 1999–2001b T. Wang, personal
communication (2009)Pohang Remote 36.00 129.00 – 1995–2000Kim et al. (2006)Rishiri Remote 45.12 141.23 40 2001–2007EANET (2002–2008)Tappi Remote 41.25 141.35 105 2001–2007EANET (2002–2008)Sado-seki Remote 38.25 138.40 110 2001–2007EANET (2002–2008)Happo Remote 36.68 137.80 1850 2001–2007EANET (2002–2008)Ijira Rural 35.57 136.70 140 2001–2007 EANET (2002–2008)Oki Remote 36.28 133.18 90 2001–2007EANET (2002–2008)Yusuhara Remote 32.73 132.98 225 2001–2007EANET (2002–2008)Hedo Remote 26.78 128.23 50 2001–2007EANET (2002–2008)Ogasawara Remote 27.08 142.22 230 2001–2007EANET (2002–2008)Mt. Sto. Tomas Mountain 16.00 120.00 2200 1999–2000Carmichael et al.(2003a)Bhubeneswar Remote 20.25 85.87 24 1999–2001Carmichael et al.(2003a)
a Most MOZAIC data were collected during 1997–1998 and around 2005. No data are available for 2001.b Data in 2001 available for March–May only.
tests with and without stratospheric O3 imported into theWRF-CMAQ domain were carried out, and results are com-pared with observations from a DC-8 flight designated to ex-amine the influence of stratospheric intrusion. Unless men-tioned in the text, other simulations of WRF-CMAQ do notimport stratospheric O3 at the domain boundaries.
In addition to MOZART BC, we have tested several otheroptions, including monthly mean measurement-adjustedMOZART BC and hourly varying BC from the coarseCMAQ simulation. The simulation of MOZART is drivenwith NCEP reanalysis meteorology for 2000–2002. Theevaluation byHolloway et al.(2007) showed that MOZARTtends to overpredict monthly averaged surface O3 over Japan,except in springtime. The overprediction is particularly sig-nificant, up to 40%, in summertime. The summertime over-prediction is likely due to the coarse horizontal scale imple-mented by MOZART, which has limited ability in simulatingcloud cover and thus enhances O3 production due to under-predicted cloud cover. In order to reduce the uncertaintiesintroduced in the import of MOZART-derived BCs, we ad-justed the concentration of O3 at the domain boundaries tocorrect for MOZART bias over Japan as evaluated inHol-loway et al.(2007). The reduction of O3 inflow, which varieson a monthly basis from 0 to 40%, is plotted in Fig.2a. Re-sults of MM5-CMAQ simulations with original and adjustedMOZART BCs are compared in Section3.1. Similar adjust-
ment of MOZART BC is applied for the WRF-CMAQ sim-ulation. Monthly mean BC provides a seasonal perspective,but does not resolve possible episodic signals. The MM5-CMAQ simulation with 27 km resolution uses hourly varyingBC extracted from the 81 km simulation of CMAQ to exam-ine how the temporal variation of BCs can influence predic-tion of O3 variability.
2.4 Observational data
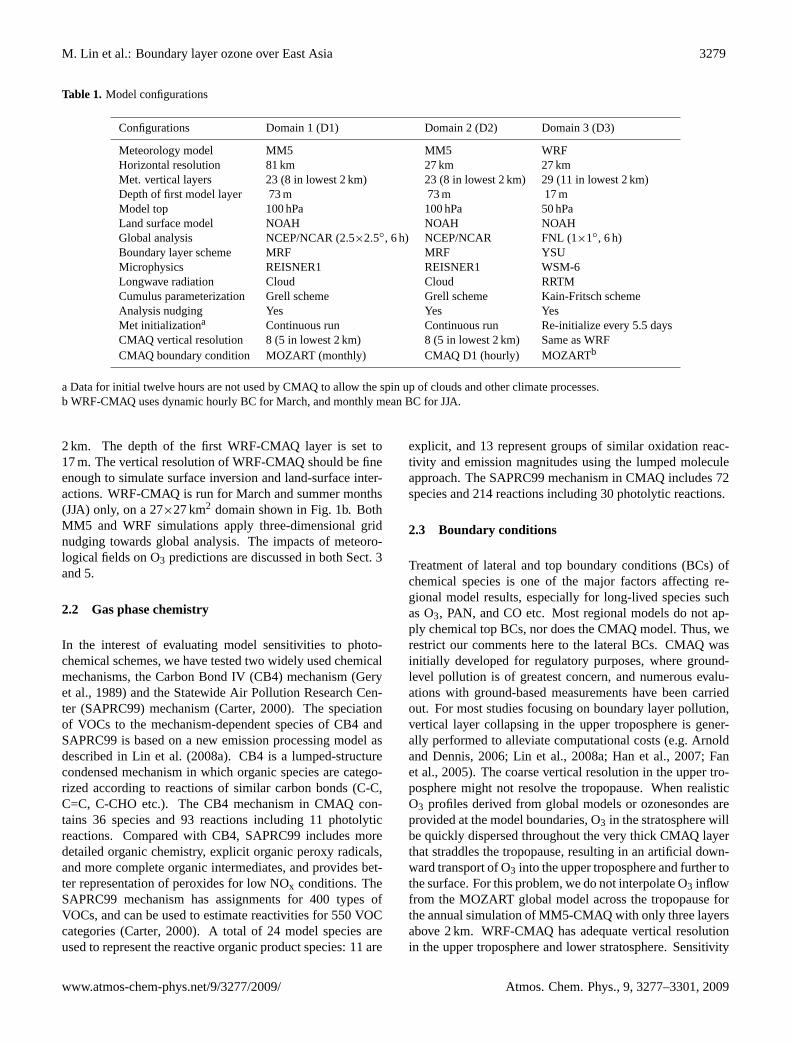
Ground-based measurement data for O3 and NOx in Japanobtained under the EANET (Acid Deposition MonitoringNetwork in Asia) monitoring program (EANET, 2002–2008), were made available for this study. The NASATRACE-P (Transport and Chemical Evolution over the Pa-cific) research campaign from February–April 2001 (Jacobet al., 2003), provides a rich dataset for evaluating modelresults. We use the 5-min merged data sets of the DC-8and P-3B flights to examine the difference between the CB4and SAPRC99 chemical mechanisms in simulating key pho-tochemical products. Figure1 shows locations of ground-based sites and TRACE-P flight paths. Compared withJapan, there are few long-term measurement sites for O3 inother Asian countries. To provide general insights in sea-sonal behavior of surface O3 in China, we compare modelresults with measurements reported in recently published
Atmos. Chem. Phys., 9, 3277–3301, 2009 www.atmos-chem-phys.net/9/3277/2009/
M. Lin et al.: Boundary layer ozone over East Asia 3281LIN M. ET AL.: BOUNDARY LAYER OZONE OVER EAST ASIA X - 47
!"!
#"!
#"!
$""!
$""!
$$"!
$$"!
$%"!
$%"!
$&"!
$&"! $'"!
$"!$"!
%"!%"!
&"!&"!
'"!'"!
Mondy
Beijing
Mt.Hua Mt.Tai
Mt.Huang LinAn
Pohang
Rishiri
Tappi
SadoHappoIjira
Oki
Yusuhara
Hedo
Ogasawara
Mt.Sto.Tomas
Bhubeneswar
!" $ %"&%"'m) *
!) $ )+&)+'m) *
S)T
$""!
$""!
$$"!
$$"!
$%"!
$%"!
$&"!
$&"! $'"!
%"! %"!
&"! &"!
'"! '"!
!, $ )+&)+'m) *
S1T
UiCure 87 !/7"0 7/F,#&<k S)T !!MIB!>X 7/F,#&< O5) ,&7 54Q /6"+0,$"7 1#;@ U+/%&7ID,<"7
F",<%+"F"&; <#;"<9 S1T H?bIB!>X 7/F,#& O5=Q /6"+0,$"7 1#;@ #&;"&<#;$ /C R3x "F#<<#/&<
OF/0"<m2F2m@Q ,&7 ß#U@; T,;@< /C R>:> 5BIe /& !,+-@ J O+"7Q( !,+-@ 4J OD0%"Q( ,&7 /;@"+ ß#U@;<
OD0,-2Q 7%+#&U ;@" *?>BEIV -,FT,#U&
D R A F T May 13, 2009, 5:04pm D R A F T
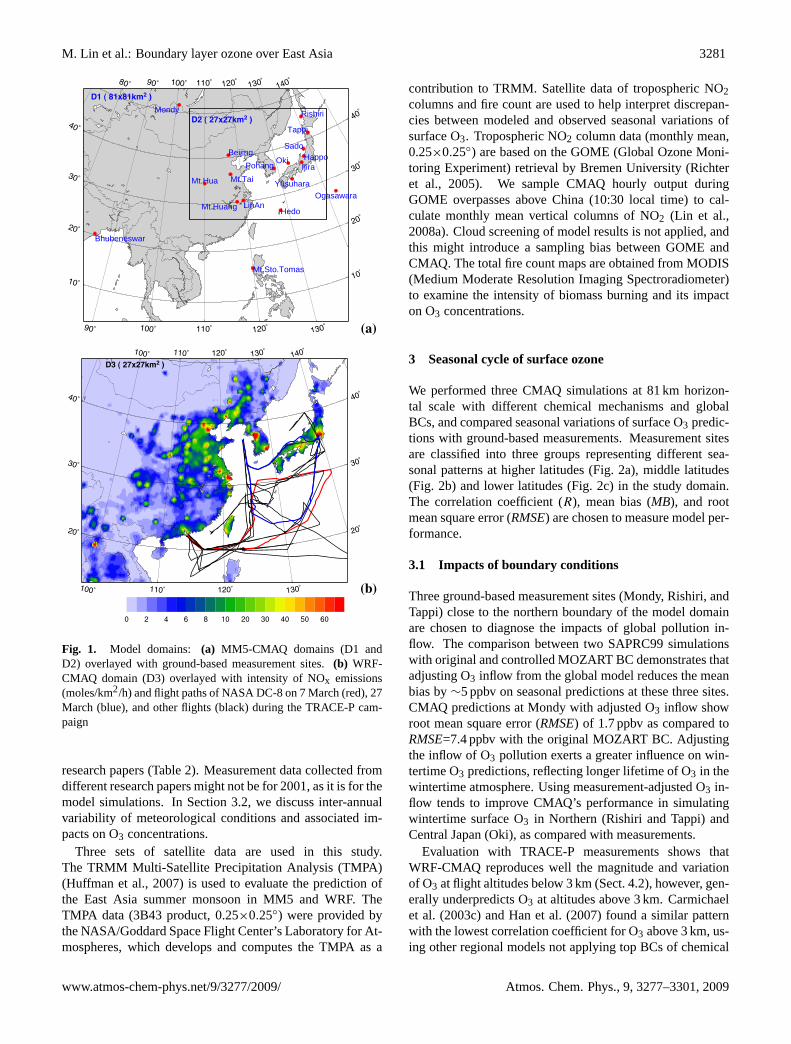
Fig. 1. Model domains: (a) MM5-CMAQ domains (D1 andD2) overlayed with ground-based measurement sites.(b) WRF-CMAQ domain (D3) overlayed with intensity of NOx emissions(moles/km2/h) and flight paths of NASA DC-8 on 7 March (red), 27March (blue), and other flights (black) during the TRACE-P cam-paign
research papers (Table2). Measurement data collected fromdifferent research papers might not be for 2001, as it is for themodel simulations. In Section3.2, we discuss inter-annualvariability of meteorological conditions and associated im-pacts on O3 concentrations.
Three sets of satellite data are used in this study.The TRMM Multi-Satellite Precipitation Analysis (TMPA)(Huffman et al., 2007) is used to evaluate the prediction ofthe East Asia summer monsoon in MM5 and WRF. TheTMPA data (3B43 product, 0.25×0.25◦) were provided bythe NASA/Goddard Space Flight Center’s Laboratory for At-mospheres, which develops and computes the TMPA as a
contribution to TRMM. Satellite data of tropospheric NO2columns and fire count are used to help interpret discrepan-cies between modeled and observed seasonal variations ofsurface O3. Tropospheric NO2 column data (monthly mean,0.25×0.25◦) are based on the GOME (Global Ozone Moni-toring Experiment) retrieval by Bremen University (Richteret al., 2005). We sample CMAQ hourly output duringGOME overpasses above China (10:30 local time) to cal-culate monthly mean vertical columns of NO2 (Lin et al.,2008a). Cloud screening of model results is not applied, andthis might introduce a sampling bias between GOME andCMAQ. The total fire count maps are obtained from MODIS(Medium Moderate Resolution Imaging Spectroradiometer)to examine the intensity of biomass burning and its impacton O3 concentrations.
3 Seasonal cycle of surface ozone
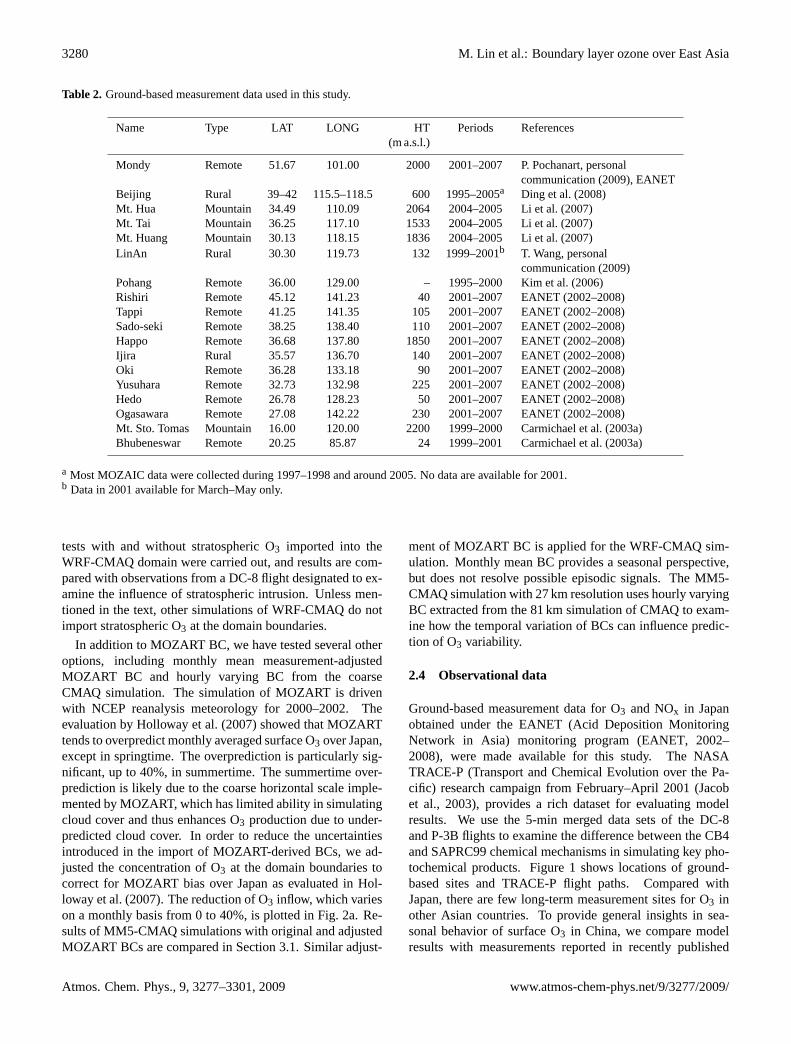
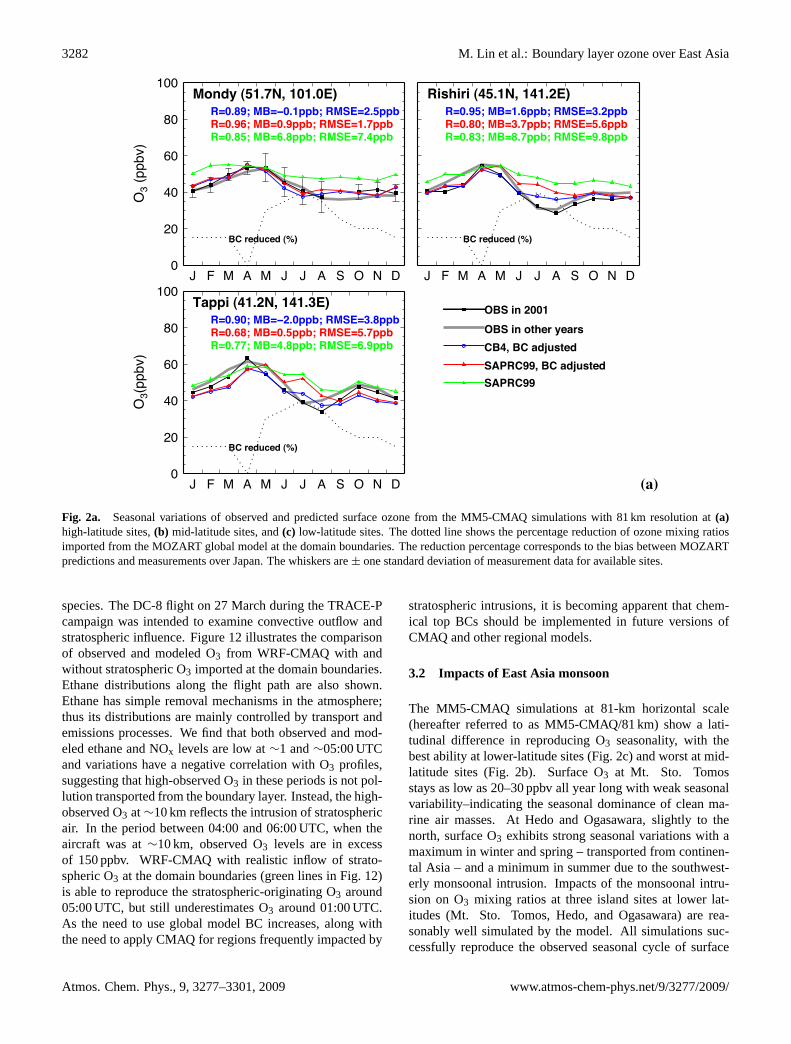
We performed three CMAQ simulations at 81 km horizon-tal scale with different chemical mechanisms and globalBCs, and compared seasonal variations of surface O3 predic-tions with ground-based measurements. Measurement sitesare classified into three groups representing different sea-sonal patterns at higher latitudes (Fig.2a), middle latitudes(Fig. 2b) and lower latitudes (Fig.2c) in the study domain.The correlation coefficient (R), mean bias (MB), and rootmean square error (RMSE) are chosen to measure model per-formance.
3.1 Impacts of boundary conditions
Three ground-based measurement sites (Mondy, Rishiri, andTappi) close to the northern boundary of the model domainare chosen to diagnose the impacts of global pollution in-flow. The comparison between two SAPRC99 simulationswith original and controlled MOZART BC demonstrates thatadjusting O3 inflow from the global model reduces the meanbias by∼5 ppbv on seasonal predictions at these three sites.CMAQ predictions at Mondy with adjusted O3 inflow showroot mean square error (RMSE) of 1.7 ppbv as compared toRMSE=7.4 ppbv with the original MOZART BC. Adjustingthe inflow of O3 pollution exerts a greater influence on win-tertime O3 predictions, reflecting longer lifetime of O3 in thewintertime atmosphere. Using measurement-adjusted O3 in-flow tends to improve CMAQ’s performance in simulatingwintertime surface O3 in Northern (Rishiri and Tappi) andCentral Japan (Oki), as compared with measurements.
Evaluation with TRACE-P measurements shows thatWRF-CMAQ reproduces well the magnitude and variationof O3 at flight altitudes below 3 km (Sect. 4.2), however, gen-erally underpredicts O3 at altitudes above 3 km.Carmichaelet al. (2003c) andHan et al.(2007) found a similar patternwith the lowest correlation coefficient for O3 above 3 km, us-ing other regional models not applying top BCs of chemical
www.atmos-chem-phys.net/9/3277/2009/ Atmos. Chem. Phys., 9, 3277–3301, 2009
3282 M. Lin et al.: Boundary layer ozone over East Asia
X - 48 LIN M. ET AL.: BOUNDARY LAYER OZONE OVER EAST ASIA
"
%"
'"
("
!"
$""
)&*+,,-./
0 1 2 3 2 0 0 3 4 ) 5 6
-. re1u3e1 $4*
5on18 $9":+;< "=":=>*R@=:%AB 5-@!=:"CCDB R5S>@):9CCDR@=:AFB 5-@=:ACCDB R5S>@":+CCDR@=:%9B 5-@F:%CCDB R5S>@+:GCCD
0 1 2 3 2 0 0 3 4 ) 5 6
-. re1u3e1 $4*
RisJiri $G9:";< "G":)>*R@=:A9B 5-@":FCCDB R5S>@,:)CCDR@=:%=B 5-@,:+CCDB R5S>@9:FCCDR@=:%,B 5-@%:+CCDB R5S>@A:%CCD
"
%"
'"
("
!"
$""
)&+,,-./
0 1 2 3 2 0 0 3 4 ) 5 6
-. re1u3e1 $4*
KaCCi $G":);< "G":,>*R@=:A=B 5-@!):=CCDB R5S>@,:%CCDR@=:F%B 5-@=:9CCDB R5S>@9:+CCDR@=:++B 5-@G:%CCDB R5S>@F:ACCD
M-S in )=="M-S in otJer 8ears.-G< -. a1Ouste1SPQR.AA< -. a1Ouste1SPQR.AA
S)TUiCure 9)7 :",</&,0 6,+#,;#/&< /C /D<"+6"7 ,&7 T+"7#-;"7 <%+C,-" /Z/&" C+/F ;@" !!MIB!>X
<#F%0,;#/&< 1#;@ e) 2F +"</0%;#/& ,; S)T @#U@I0,;#;%7" <#;"<( S1T F#7I0,;#;%7" <#;"<( ,&7 S(T 0/1I0,;#;%7"
<#;"<9 *@" 7/;;"7 0#&" <@/1< ;@" T"+-"&;,U" +"7%-;#/& /C /Z/&" F#Y#&U +,;#/< #FT/+;"7 C+/F ;@"
!3i>?* U0/D,0 F/7"0 ,; ;@" 7/F,#& D/%&7,+#"<9 *@" +"7%-;#/& T"+-"&;,U" -/++"<T/&7< ;/ ;@"
D#,< D";1""& !3i>?* T+"7#-;#/&< ,&7 F",<%+"F"&;< /6"+ S,T,&9 *@" 1@#<2"+< ,+" ± /&" <;,&7,+7
7"6#,;#/& /C F",<%+"F"&; 7,;, C/+ ,6,#0,D0" <#;"<9
D R A F T May 13, 2009, 5:04pm D R A F T
Fig. 2a. Seasonal variations of observed and predicted surface ozone from the MM5-CMAQ simulations with 81 km resolution at(a)high-latitude sites,(b) mid-latitude sites, and(c) low-latitude sites. The dotted line shows the percentage reduction of ozone mixing ratiosimported from the MOZART global model at the domain boundaries. The reduction percentage corresponds to the bias between MOZARTpredictions and measurements over Japan. The whiskers are± one standard deviation of measurement data for available sites.
species. The DC-8 flight on 27 March during the TRACE-Pcampaign was intended to examine convective outflow andstratospheric influence. Figure12 illustrates the comparisonof observed and modeled O3 from WRF-CMAQ with andwithout stratospheric O3 imported at the domain boundaries.Ethane distributions along the flight path are also shown.Ethane has simple removal mechanisms in the atmosphere;thus its distributions are mainly controlled by transport andemissions processes. We find that both observed and mod-eled ethane and NOx levels are low at∼1 and∼05:00 UTCand variations have a negative correlation with O3 profiles,suggesting that high-observed O3 in these periods is not pol-lution transported from the boundary layer. Instead, the high-observed O3 at∼10 km reflects the intrusion of stratosphericair. In the period between 04:00 and 06:00 UTC, when theaircraft was at∼10 km, observed O3 levels are in excessof 150 ppbv. WRF-CMAQ with realistic inflow of strato-spheric O3 at the domain boundaries (green lines in Fig.12)is able to reproduce the stratospheric-originating O3 around05:00 UTC, but still underestimates O3 around 01:00 UTC.As the need to use global model BC increases, along withthe need to apply CMAQ for regions frequently impacted by
stratospheric intrusions, it is becoming apparent that chem-ical top BCs should be implemented in future versions ofCMAQ and other regional models.
3.2 Impacts of East Asia monsoon
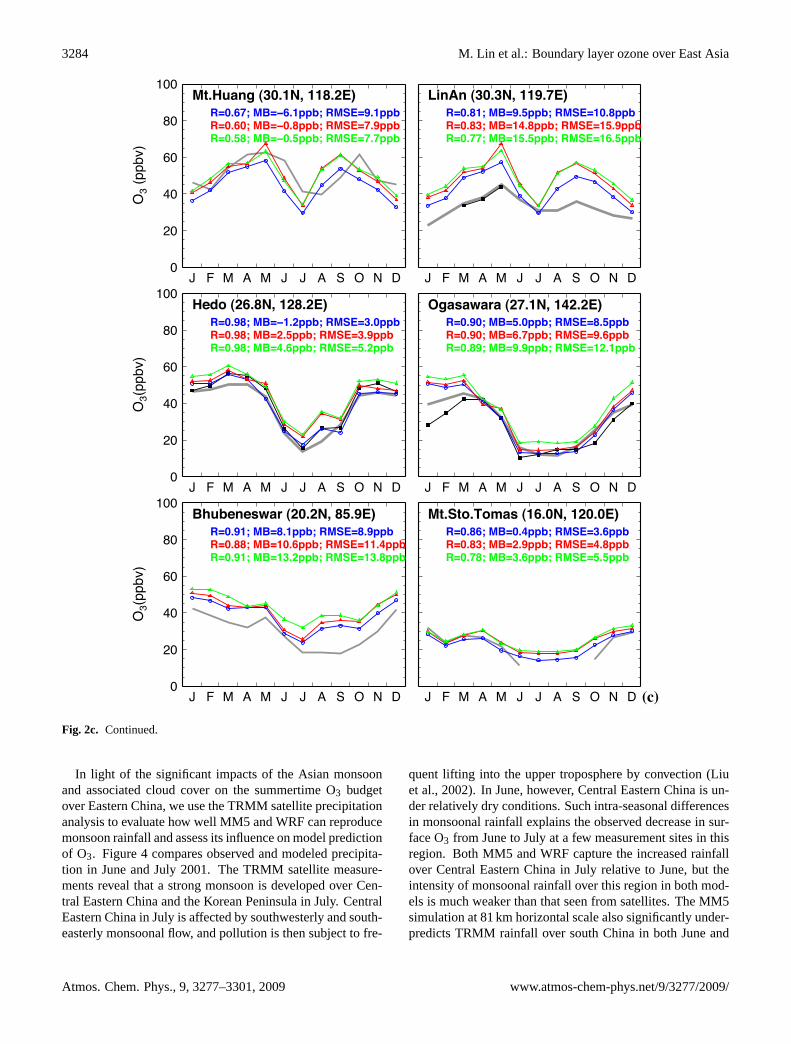
The MM5-CMAQ simulations at 81-km horizontal scale(hereafter referred to as MM5-CMAQ/81 km) show a lati-tudinal difference in reproducing O3 seasonality, with thebest ability at lower-latitude sites (Fig.2c) and worst at mid-latitude sites (Fig.2b). Surface O3 at Mt. Sto. Tomosstays as low as 20–30 ppbv all year long with weak seasonalvariability–indicating the seasonal dominance of clean ma-rine air masses. At Hedo and Ogasawara, slightly to thenorth, surface O3 exhibits strong seasonal variations with amaximum in winter and spring – transported from continen-tal Asia – and a minimum in summer due to the southwest-erly monsoonal intrusion. Impacts of the monsoonal intru-sion on O3 mixing ratios at three island sites at lower lat-itudes (Mt. Sto. Tomos, Hedo, and Ogasawara) are rea-sonably well simulated by the model. All simulations suc-cessfully reproduce the observed seasonal cycle of surface
Atmos. Chem. Phys., 9, 3277–3301, 2009 www.atmos-chem-phys.net/9/3277/2009/
M. Lin et al.: Boundary layer ozone over East Asia 3283LIN M. ET AL.: BOUNDARY LAYER OZONE OVER EAST ASIA X - 49
"
%"
'"
("
!"
$""
)&*+,,-./
0 1 2 3 2 0 0 3 4 ) 5 6
5t:Rua $,G:9;< ""=:">*
7 7 7
R@=:%,B 5-@":9CCDB R5S>@F:"CCDR@=:+AB 5-@+:"CCDB R5S>@"=:9CCDR@=:++B 5-@%:,CCDB R5S>@"=:ACCD
0 1 2 3 2 0 0 3 4 ) 5 6
5t:Kai $,F:);< ""+:">*
77 7
R@=:%,B 5-@!A:"CCDB R5S>@"":+CCDR@=:%"B 5-@!):ACCDB R5S>@A:+CCDR@=:+AB 5-@!):,CCDB R5S>@%:,CCD
"
%"
'"
("
!"
$""
)&+,,-./
0 1 2 3 2 0 0 3 4 ) 5 6
QoJang $,F:=;< ")A:=>*
77
7
R@=:%AB 5-@A:+CCDB R5S>@"=:,CCDR@=:%%B 5-@"G:GCCDB R5S>@"9:"CCDR@=:%+B 5-@"F:ACCDB R5S>@"+:,CCD
0 1 2 3 2 0 0 3 4 ) 5 6
M'i $,F:,;< ",,:)>*
77
7
R@=:%AB 5-@F:GCCDB R5S>@+:GCCDR@=:F+B 5-@"=:%CCDB R5S>@"):%CCDR@=:+,B 5-@"G:,CCDB R5S>@"9:,CCD
S1TUiCure 917 B/&;#&%"79 W0%" -+/<<"< +"T+"<"&; F/7"0 +"<%0;< C+/F ;@" H?bIB!>X <#F%0,;#/& 1#;@
;@" BWA -@"F#<;+$( 1@#-@ #< +%& C/+ !,+-@ ,&7 S%&"h>%U%<; 4KK) /&0$9
D R A F T May 13, 2009, 5:04pm D R A F T
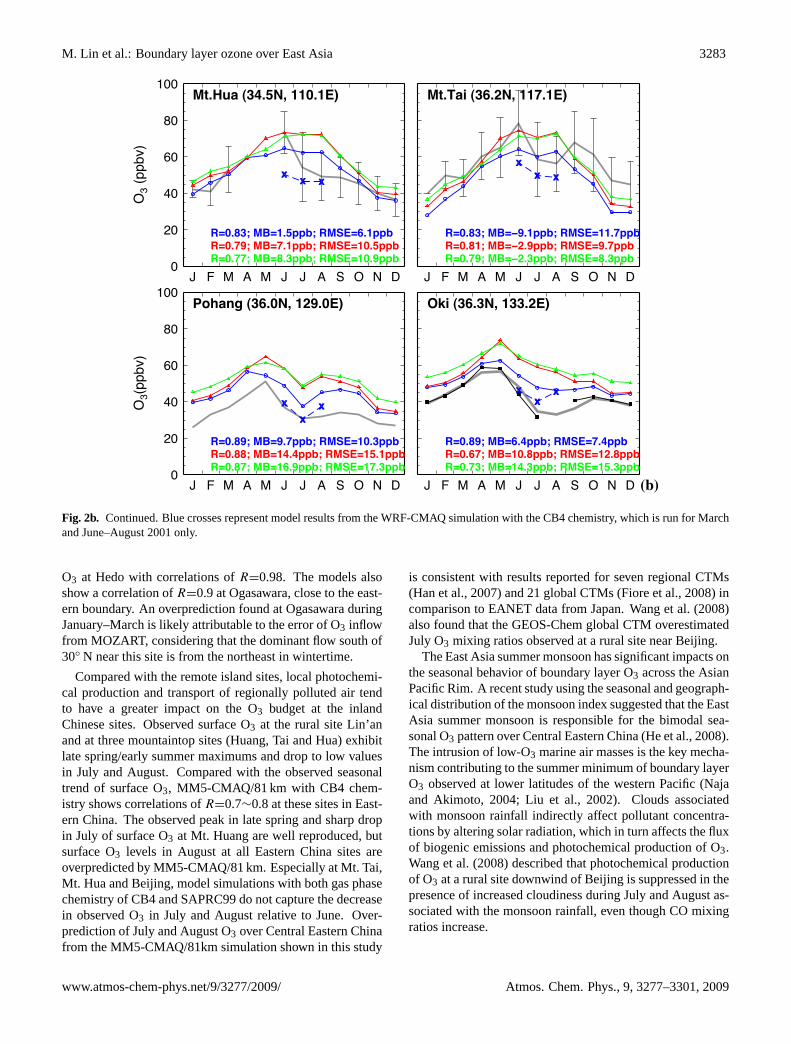
Fig. 2b. Continued. Blue crosses represent model results from the WRF-CMAQ simulation with the CB4 chemistry, which is run for Marchand June–August 2001 only.
O3 at Hedo with correlations ofR=0.98. The models alsoshow a correlation ofR=0.9 at Ogasawara, close to the east-ern boundary. An overprediction found at Ogasawara duringJanuary–March is likely attributable to the error of O3 inflowfrom MOZART, considering that the dominant flow south of30◦ N near this site is from the northeast in wintertime.
Compared with the remote island sites, local photochemi-cal production and transport of regionally polluted air tendto have a greater impact on the O3 budget at the inlandChinese sites. Observed surface O3 at the rural site Lin’anand at three mountaintop sites (Huang, Tai and Hua) exhibitlate spring/early summer maximums and drop to low valuesin July and August. Compared with the observed seasonaltrend of surface O3, MM5-CMAQ/81 km with CB4 chem-istry shows correlations ofR=0.7∼0.8 at these sites in East-ern China. The observed peak in late spring and sharp dropin July of surface O3 at Mt. Huang are well reproduced, butsurface O3 levels in August at all Eastern China sites areoverpredicted by MM5-CMAQ/81 km. Especially at Mt. Tai,Mt. Hua and Beijing, model simulations with both gas phasechemistry of CB4 and SAPRC99 do not capture the decreasein observed O3 in July and August relative to June. Over-prediction of July and August O3 over Central Eastern Chinafrom the MM5-CMAQ/81km simulation shown in this study
is consistent with results reported for seven regional CTMs(Han et al., 2007) and 21 global CTMs (Fiore et al., 2008) incomparison to EANET data from Japan.Wang et al.(2008)also found that the GEOS-Chem global CTM overestimatedJuly O3 mixing ratios observed at a rural site near Beijing.
The East Asia summer monsoon has significant impacts onthe seasonal behavior of boundary layer O3 across the AsianPacific Rim. A recent study using the seasonal and geograph-ical distribution of the monsoon index suggested that the EastAsia summer monsoon is responsible for the bimodal sea-sonal O3 pattern over Central Eastern China (He et al., 2008).The intrusion of low-O3 marine air masses is the key mecha-nism contributing to the summer minimum of boundary layerO3 observed at lower latitudes of the western Pacific (Najaand Akimoto, 2004; Liu et al., 2002). Clouds associatedwith monsoon rainfall indirectly affect pollutant concentra-tions by altering solar radiation, which in turn affects the fluxof biogenic emissions and photochemical production of O3.Wang et al.(2008) described that photochemical productionof O3 at a rural site downwind of Beijing is suppressed in thepresence of increased cloudiness during July and August as-sociated with the monsoon rainfall, even though CO mixingratios increase.
www.atmos-chem-phys.net/9/3277/2009/ Atmos. Chem. Phys., 9, 3277–3301, 2009
3284 M. Lin et al.: Boundary layer ozone over East AsiaX - 50 LIN M. ET AL.: BOUNDARY LAYER OZONE OVER EAST ASIA
"
%"
'"
("
!"
$""
)&*+,,-./
0 1 2 3 2 0 0 3 4 ) 5 6
5t:Ruang $,=:";< ""%:)>*R@=:F+B 5-@!F:"CCDB R5S>@A:"CCDR@=:F=B 5-@!=:%CCDB R5S>@+:ACCDR@=:9%B 5-@!=:9CCDB R5S>@+:+CCD
0 1 2 3 2 0 0 3 4 ) 5 6
TinPn $,=:,;< ""A:+>*R@=:%"B 5-@A:9CCDB R5S>@"=:%CCDR@=:%,B 5-@"G:%CCDB R5S>@"9:ACCDR@=:++B 5-@"9:9CCDB R5S>@"F:9CCD
"
%"
'"
("
!"
$""
)&+,,-./
0 1 2 3 2 0 0 3 4 ) 5 6
Re1o $)F:%;< ")%:)>*R@=:A%B 5-@!":)CCDB R5S>@,:=CCDR@=:A%B 5-@):9CCDB R5S>@,:ACCDR@=:A%B 5-@G:FCCDB R5S>@9:)CCD
0 1 2 3 2 0 0 3 4 ) 5 6
MgasaUara $)+:";< "G):)>*R@=:A=B 5-@9:=CCDB R5S>@%:9CCDR@=:A=B 5-@F:+CCDB R5S>@A:FCCDR@=:%AB 5-@A:ACCDB R5S>@"):"CCD
"
%"
'"
("
!"
$""
)&+,,-./
0 1 2 3 2 0 0 3 4 ) 5 6
-JuDenesUar $)=:);< %9:A>*R@=:A"B 5-@%:"CCDB R5S>@%:ACCDR@=:%%B 5-@"=:FCCDB R5S>@"":GCCDR@=:A"B 5-@",:)CCDB R5S>@",:%CCD
0 1 2 3 2 0 0 3 4 ) 5 6
5t:Sto:Komas $"F:=;< ")=:=>*R@=:%FB 5-@=:GCCDB R5S>@,:FCCDR@=:%,B 5-@):ACCDB R5S>@G:%CCDR@=:+%B 5-@,:FCCDB R5S>@9:9CCD
S(T
UiCure 9(7 B/&;#&%"7
D R A F T May 13, 2009, 5:04pm D R A F T
Fig. 2c. Continued.
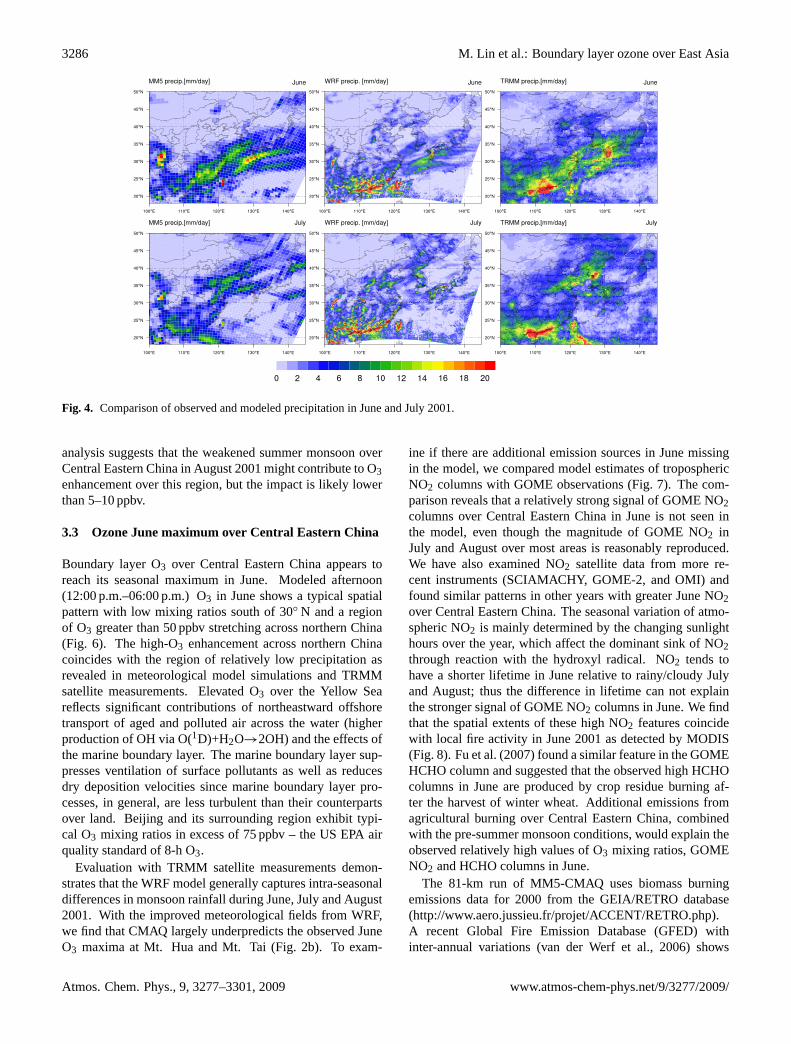
In light of the significant impacts of the Asian monsoonand associated cloud cover on the summertime O3 budgetover Eastern China, we use the TRMM satellite precipitationanalysis to evaluate how well MM5 and WRF can reproducemonsoon rainfall and assess its influence on model predictionof O3. Figure4 compares observed and modeled precipita-tion in June and July 2001. The TRMM satellite measure-ments reveal that a strong monsoon is developed over Cen-tral Eastern China and the Korean Peninsula in July. CentralEastern China in July is affected by southwesterly and south-easterly monsoonal flow, and pollution is then subject to fre-
quent lifting into the upper troposphere by convection (Liuet al., 2002). In June, however, Central Eastern China is un-der relatively dry conditions. Such intra-seasonal differencesin monsoonal rainfall explains the observed decrease in sur-face O3 from June to July at a few measurement sites in thisregion. Both MM5 and WRF capture the increased rainfallover Central Eastern China in July relative to June, but theintensity of monsoonal rainfall over this region in both mod-els is much weaker than that seen from satellites. The MM5simulation at 81 km horizontal scale also significantly under-predicts TRMM rainfall over south China in both June and
Atmos. Chem. Phys., 9, 3277–3301, 2009 www.atmos-chem-phys.net/9/3277/2009/

M. Lin et al.: Boundary layer ozone over East Asia 3285LIN M. ET AL.: BOUNDARY LAYER OZONE OVER EAST ASIA X - 51
"
%"
'"
("
!"
$"")&*+,,-./
0 1 2 3 2 0 0 3 4 ) 5 6
-eiOing $G=:9;< ""+:=>*
R@=:%FB 5-@+:FCCDB R5S>@A:,CCDR@=:%)B 5-@"":GCCDB R5S>@",:+CCD
7 77
M-S< "AA9!)==9!"V%"'mV.-G< )=="!"V%"'mVSPQR.AA< )=="
7 !,V)+'mV.-G< )=="UiCure :7 3D<"+6"7 ,&7 <#F%0,;"7 <",</&,0 -$-0" /C 7,$;#F" OM ,9F9hA T9F9Q /Z/&" /6"+ W"#\#&U9 *@"
1@#<2"+< ,+" ± /&" <;,&7,+7 7"6#,;#/& /C F",<%+"F"&; 7,;,9
D R A F T May 13, 2009, 5:04pm D R A F T
Fig. 3. Observed and simulated seasonal cycle of daytime(05:00 a.m.–04:00 p.m.) ozone over Beijing. The whiskers are±
one standard deviation of measurement data.
July. Relative to MM5, the WRF simulation at 27 km hor-izontal scale reproduces well both the magnitude and spa-tial distribution of TRMM rainfall over South China. Thedistinct difference in simulating monsoonal rainfall betweenMM5 and WRF can be attributed to differences in physicalparameterizations (Table1), model resolution, and the ini-tialization process. The MM5 simulation was initialized withthe NCEP/NCAR reanalysis at the beginning of the study pe-riod and run continuously throughout the year. Consideringthe cumulative errors of meteorological models, we reini-tialize the WRF model every 5.5 days with FNL analysisto maximize the consistency with large-scale observationaldata ingested in FNL. Similar reinitialization processes havebeen applied in other modeling studies (e.g.Tang et al., 2007;Ding and Wang, 2006). The underestimate of monsoonalrainfall in MM5 is primarily due to the cumulative errors of along-term simulation and the inability of the model’s coarse-resolution to simulate cloud cover.
Clouds have significant radiative effects on the photo-chemistry of O3 production near the surface (Lefer et al.,2003; Liu et al., 2006). Transmission of solar radiation isreduced below cloud level, thus photochemical productionof O3 is suppressed in the presence of increased cloudinessassociated with the monsoon rainfall. Monsoon rainfall alsoremoves soluble O3 precursors from the atmosphere. In re-sponse to reduced cloudiness and monsoon rainfall, MM5-CMAQ produces 10–15 ppbv higher O3 over Central East-ern China than WRF-CMAQ. The MM5-CMAQ overesti-mate of surface O3 at inland Chinese sites relates primarilyto the underestimate of monsoonal rainfall and cloud cover,as well as coarse vertical resolution in which strong surface
inversions might not be adequately developed. With the im-proved meteorological fields from WRF, CMAQ simulates a10–20 ppbv decrease in O3 mixing ratios at Mt. Hua and Mt.Tai during June–Augsut, and WRF-CMAQ results with CB4chemistry are even lower than the observed values (Fig.2b).For Beijing, the decrease in O3 mixing ratios in August rela-tive to June is captured by WRF-CMAQ, but the magnitudeof low-observed O3 during July and August is still overpre-dicted (Fig.3). Figure4 shows that WRF predicts less than2 mm/day rainfall in July over the Beijing surrounding re-gion – which is approximately 50% lower than the TRMMsatellite analysis. TRMM estimates 3–5 mm/day rainfall inJuly over Beijing, consistent with rain gauge records reportedin Ding et al. (2008). The unrealistic dry and less cloudyconditions in the model promotes O3 production over thisregion. Our analysis confirms that systematic overpredic-tion of summertime O3 found in both regional and globalCTMs is due to model inability to accurately simulate cloudcover and monsoon rainfall and inadequate representation ofsouthwesterly/southeasterly inflow of marine air masses inthe global meteorological reanalysis data.
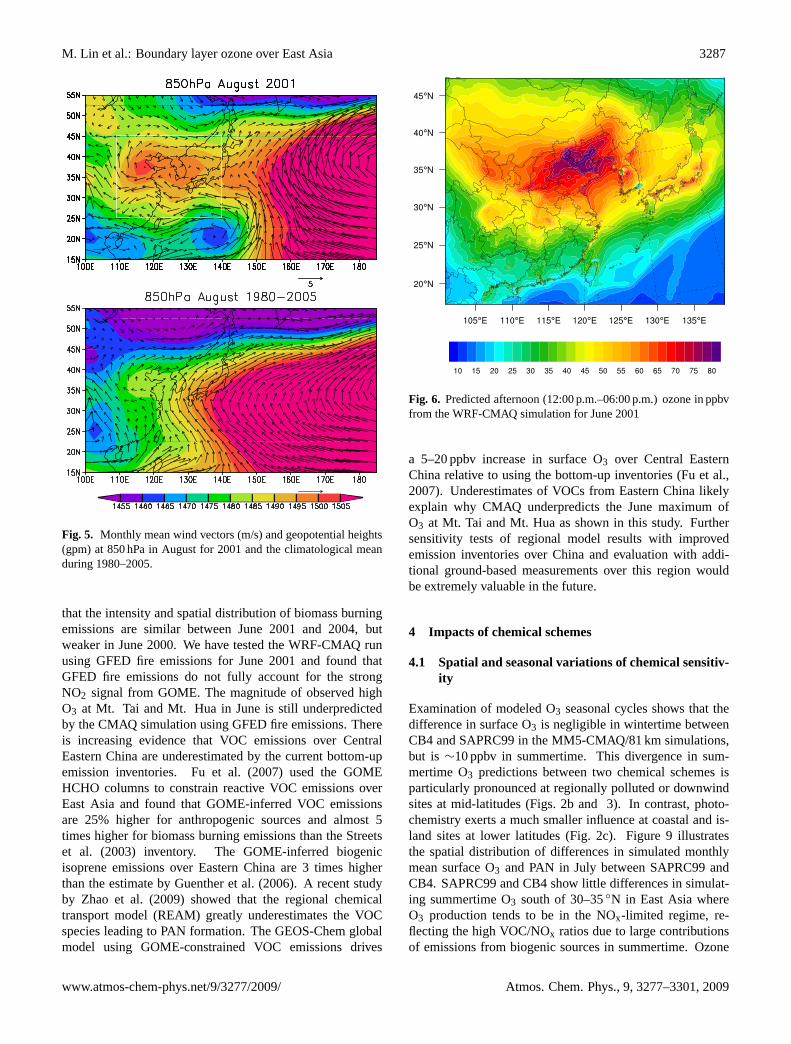
It should be noted that model results are for 2001 whilemeasurement data at three mountaintop sites (Mt. Tai,Mt. Hua, and Mt. Huang) are for March 2004–February 2005(Li et al., 2007), and the MOZAIC aircraft observations forBeijing are the average of data mostly collected during 1997–1998 and around 2005 (Ding et al., 2008). Our analysis ofNCEP/NCAR winds and geopotential heights shows that thegeneral transport pattern in 2001 is similar to the climatol-ogy over 1980–2005 even though a slightly different pat-tern is found in August. Figure5 compares the climatologi-cal pattern of NCEP/NCAR winds and geopotential fields at850 hPa in August for 1980–2005 with those for 2001. TheWestern North Pacific (WNP) anticyclone plays an impor-tant role in the connection between the East Asia summermonsoon and the tropical sea surface temperature anomalies(e.g.Lee et al., 2008), and is characterized by southwesterlyairflow along the east Asian coast. We find that in August2001 the WNP anticyclone moved to the northeast as com-pared with the climatological pattern. 2001 is also foundto be a weak La Nina year. The distributions of geopoten-tial height in Fig.5 indicate that there is a localized highpressure system over Central Eastern China in August 2001.The relatively high geopotential height over Central East-ern China suggests a weakened monsoon in the same region.Supporting this conclusion, TRMM detected that the precip-itation amount over Central Eastern China in August 2001is 2 mm/day on average lower than the climatological mean.Comparison of 2001 O3 measurements and average valuesduring 2001–2007 at the EANET sites shows that the gen-eral pattern of the O3 seasonal cycle did not change for 2001at the Japanese sites (Fig. 2). For August, we find that theHedo site located on Okinawa island recorded 8 ppbv higherO3 in 2001 than the average during 2001–2007, and TRMMdetected 3 mm/day lower precipitation over the island. Our
www.atmos-chem-phys.net/9/3277/2009/ Atmos. Chem. Phys., 9, 3277–3301, 2009
3286 M. Lin et al.: Boundary layer ozone over East AsiaX - 52 LIN M. ET AL.: BOUNDARY LAYER OZONE OVER EAST ASIA
UiCure ;7 B/FT,+#</& /C /D<"+6"7 ,&7 F/7"0"7 T+"-#T#;,;#/& #& S%&" ,&7 S%0$ 4KK)
D R A F T May 13, 2009, 5:04pm D R A F T
Fig. 4. Comparison of observed and modeled precipitation in June and July 2001.
analysis suggests that the weakened summer monsoon overCentral Eastern China in August 2001 might contribute to O3enhancement over this region, but the impact is likely lowerthan 5–10 ppbv.
3.3 Ozone June maximum over Central Eastern China
Boundary layer O3 over Central Eastern China appears toreach its seasonal maximum in June. Modeled afternoon(12:00 p.m.–06:00 p.m.) O3 in June shows a typical spatialpattern with low mixing ratios south of 30◦ N and a regionof O3 greater than 50 ppbv stretching across northern China(Fig. 6). The high-O3 enhancement across northern Chinacoincides with the region of relatively low precipitation asrevealed in meteorological model simulations and TRMMsatellite measurements. Elevated O3 over the Yellow Seareflects significant contributions of northeastward offshoretransport of aged and polluted air across the water (higherproduction of OH via O(1D)+H2O→2OH) and the effects ofthe marine boundary layer. The marine boundary layer sup-presses ventilation of surface pollutants as well as reducesdry deposition velocities since marine boundary layer pro-cesses, in general, are less turbulent than their counterpartsover land. Beijing and its surrounding region exhibit typi-cal O3 mixing ratios in excess of 75 ppbv – the US EPA airquality standard of 8-h O3.
Evaluation with TRMM satellite measurements demon-strates that the WRF model generally captures intra-seasonaldifferences in monsoon rainfall during June, July and August2001. With the improved meteorological fields from WRF,we find that CMAQ largely underpredicts the observed JuneO3 maxima at Mt. Hua and Mt. Tai (Fig.2b). To exam-
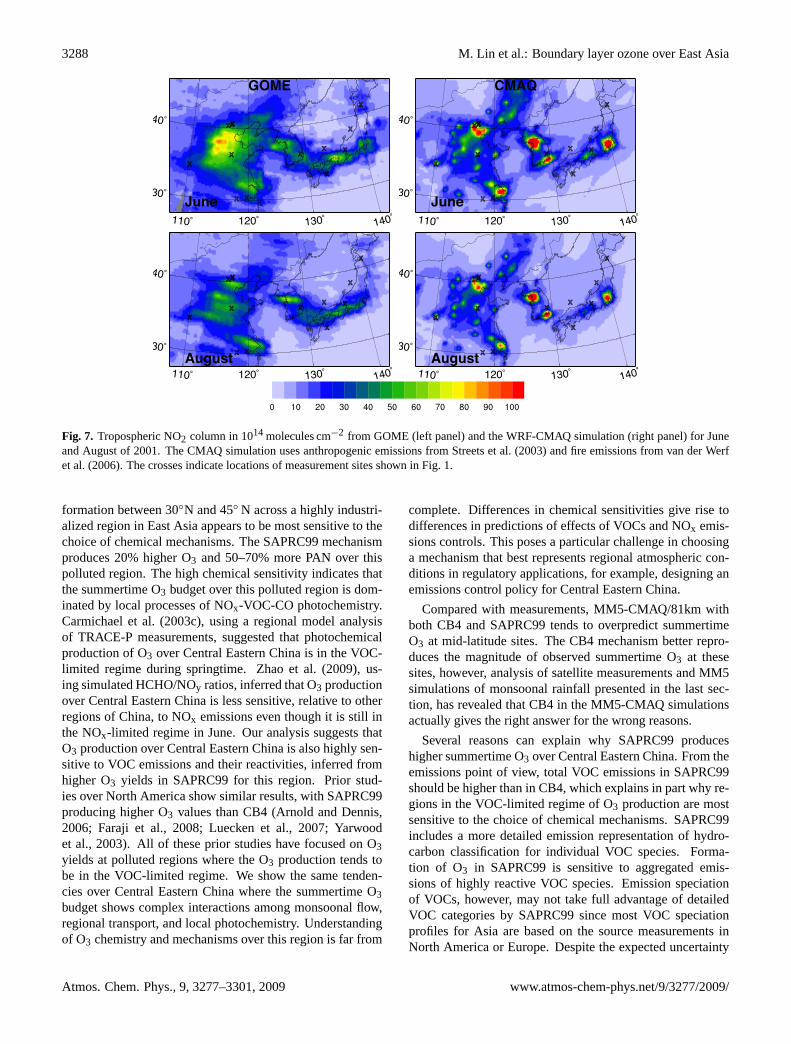
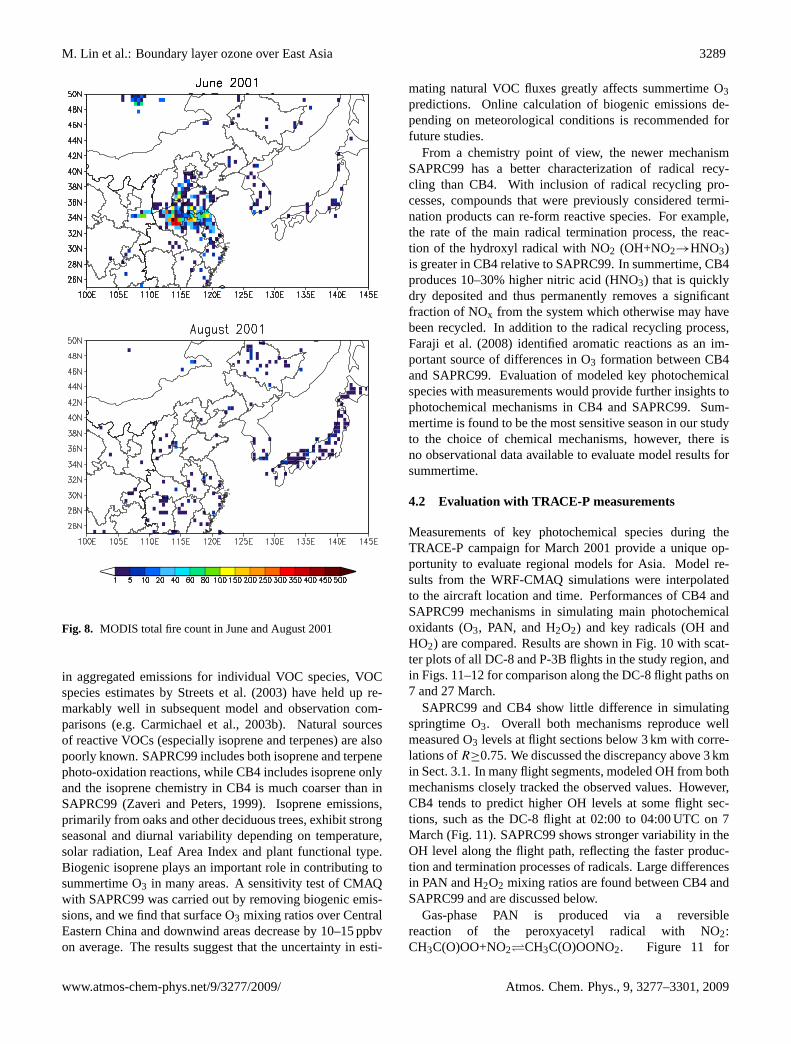
ine if there are additional emission sources in June missingin the model, we compared model estimates of troposphericNO2 columns with GOME observations (Fig.7). The com-parison reveals that a relatively strong signal of GOME NO2columns over Central Eastern China in June is not seen inthe model, even though the magnitude of GOME NO2 inJuly and August over most areas is reasonably reproduced.We have also examined NO2 satellite data from more re-cent instruments (SCIAMACHY, GOME-2, and OMI) andfound similar patterns in other years with greater June NO2over Central Eastern China. The seasonal variation of atmo-spheric NO2 is mainly determined by the changing sunlighthours over the year, which affect the dominant sink of NO2through reaction with the hydroxyl radical. NO2 tends tohave a shorter lifetime in June relative to rainy/cloudy Julyand August; thus the difference in lifetime can not explainthe stronger signal of GOME NO2 columns in June. We findthat the spatial extents of these high NO2 features coincidewith local fire activity in June 2001 as detected by MODIS(Fig.8). Fu et al.(2007) found a similar feature in the GOMEHCHO column and suggested that the observed high HCHOcolumns in June are produced by crop residue burning af-ter the harvest of winter wheat. Additional emissions fromagricultural burning over Central Eastern China, combinedwith the pre-summer monsoon conditions, would explain theobserved relatively high values of O3 mixing ratios, GOMENO2 and HCHO columns in June.
The 81-km run of MM5-CMAQ uses biomass burningemissions data for 2000 from the GEIA/RETRO database(http://www.aero.jussieu.fr/projet/ACCENT/RETRO.php).A recent Global Fire Emission Database (GFED) withinter-annual variations (van der Werf et al., 2006) shows
Atmos. Chem. Phys., 9, 3277–3301, 2009 www.atmos-chem-phys.net/9/3277/2009/
M. Lin et al.: Boundary layer ozone over East Asia 3287
LIN M. ET AL.: BOUNDARY LAYER OZONE OVER EAST ASIA X - 53
UiCure <7 !/&;@0$ F",& 1#&7 6"-;/+< OFm<Q ,&7 U"/T/;"&;#,0 @"#U@;< OUTFQ ,; eMK @V, #& >%U%<; C/+
4KK) ,&7 ;@" -0#F,;/0/U#-,0 F",& 7%+#&U )[eKI4KKM
D R A F T May 13, 2009, 5:04pm D R A F T
Fig. 5. Monthly mean wind vectors (m/s) and geopotential heights(gpm) at 850 hPa in August for 2001 and the climatological meanduring 1980–2005.
that the intensity and spatial distribution of biomass burningemissions are similar between June 2001 and 2004, butweaker in June 2000. We have tested the WRF-CMAQ runusing GFED fire emissions for June 2001 and found thatGFED fire emissions do not fully account for the strongNO2 signal from GOME. The magnitude of observed highO3 at Mt. Tai and Mt. Hua in June is still underpredictedby the CMAQ simulation using GFED fire emissions. Thereis increasing evidence that VOC emissions over CentralEastern China are underestimated by the current bottom-upemission inventories. Fu et al. (2007) used the GOMEHCHO columns to constrain reactive VOC emissions overEast Asia and found that GOME-inferred VOC emissionsare 25% higher for anthropogenic sources and almost 5times higher for biomass burning emissions than theStreetset al. (2003) inventory. The GOME-inferred biogenicisoprene emissions over Eastern China are 3 times higherthan the estimate byGuenther et al.(2006). A recent studyby Zhao et al.(2009) showed that the regional chemicaltransport model (REAM) greatly underestimates the VOCspecies leading to PAN formation. The GEOS-Chem globalmodel using GOME-constrained VOC emissions drives
X - 54 LIN M. ET AL.: BOUNDARY LAYER OZONE OVER EAST ASIA
UiCure =7 V+"7#-;"7 ,C;"+&//& O)4 T9F9hN T9F9Q /Z/&" #& TTD C+/F ;@" H?bIB!>X <#F%0,;#/& C/+
S%&" 4KK)
D R A F T May 13, 2009, 5:04pm D R A F T
Fig. 6. Predicted afternoon (12:00 p.m.–06:00 p.m.) ozone in ppbvfrom the WRF-CMAQ simulation for June 2001
a 5–20 ppbv increase in surface O3 over Central EasternChina relative to using the bottom-up inventories (Fu et al.,2007). Underestimates of VOCs from Eastern China likelyexplain why CMAQ underpredicts the June maximum ofO3 at Mt. Tai and Mt. Hua as shown in this study. Furthersensitivity tests of regional model results with improvedemission inventories over China and evaluation with addi-tional ground-based measurements over this region wouldbe extremely valuable in the future.
4 Impacts of chemical schemes
4.1 Spatial and seasonal variations of chemical sensitiv-ity
Examination of modeled O3 seasonal cycles shows that thedifference in surface O3 is negligible in wintertime betweenCB4 and SAPRC99 in the MM5-CMAQ/81 km simulations,but is ∼10 ppbv in summertime. This divergence in sum-mertime O3 predictions between two chemical schemes isparticularly pronounced at regionally polluted or downwindsites at mid-latitudes (Figs.2b and 3). In contrast, photo-chemistry exerts a much smaller influence at coastal and is-land sites at lower latitudes (Fig.2c). Figure 9 illustratesthe spatial distribution of differences in simulated monthlymean surface O3 and PAN in July between SAPRC99 andCB4. SAPRC99 and CB4 show little differences in simulat-ing summertime O3 south of 30–35◦N in East Asia whereO3 production tends to be in the NOx-limited regime, re-flecting the high VOC/NOx ratios due to large contributionsof emissions from biogenic sources in summertime. Ozone
www.atmos-chem-phys.net/9/3277/2009/ Atmos. Chem. Phys., 9, 3277–3301, 2009
3288 M. Lin et al.: Boundary layer ozone over East Asia
LIN M. ET AL.: BOUNDARY LAYER OZONE OVER EAST ASIA X - 55
$$"! $%"! $&"! $'"!
&"!
'"!
Wune
7
7
77
7
7
7
777
7
7
7
$$"! $%"! $&"! $'"!
&"!
'"!
Pugust
7
7
77
7
7
7
777
7
7
7
XM5>
$$"! $%"! $&"! $'"!
&"!
'"!
Wune
7
7
77
7
7
7
777
7
7
7
$$"! $%"! $&"! $'"!
&"!
'"!
Pugust
7
7
77
7
7
7
777
7
7
7
.5PY
UiCure >7 *+/T/<T@"+#- R32 -/0%F& #& )K14 F/0"-%0"< -F−2 C+/F 83!E O0"C; T,&"0Q ,&7 ;@"
H?bIB!>X <#F%0,;#/& O+#U@; T,&"0Q C/+ S%&" ,&7 >%U%<; /C 4KK)9 *@" B!>X <#F%0,;#/& %<"<
,&;@+/T/U"&#- "F#<<#/&< C+/F :;+"";< "; ,09 a4KK=c ,&7 Þ+" "F#<<#/&< C+/F 6,& 7"+ H"+C "; ,09 a4KKNc9
*@" -+/<<"< #&7#-,;" 0/-,;#/&< /C F",<%+"F"&; <#;"< <@/1& #& b#U9 )9
D R A F T May 13, 2009, 5:04pm D R A F T
Fig. 7. Tropospheric NO2 column in 1014molecules cm−2 from GOME (left panel) and the WRF-CMAQ simulation (right panel) for Juneand August of 2001. The CMAQ simulation uses anthropogenic emissions fromStreets et al.(2003) and fire emissions fromvan der Werfet al.(2006). The crosses indicate locations of measurement sites shown in Fig.1.
formation between 30◦N and 45◦ N across a highly industri-alized region in East Asia appears to be most sensitive to thechoice of chemical mechanisms. The SAPRC99 mechanismproduces 20% higher O3 and 50–70% more PAN over thispolluted region. The high chemical sensitivity indicates thatthe summertime O3 budget over this polluted region is dom-inated by local processes of NOx-VOC-CO photochemistry.Carmichael et al.(2003c), using a regional model analysisof TRACE-P measurements, suggested that photochemicalproduction of O3 over Central Eastern China is in the VOC-limited regime during springtime.Zhao et al.(2009), us-ing simulated HCHO/NOy ratios, inferred that O3 productionover Central Eastern China is less sensitive, relative to otherregions of China, to NOx emissions even though it is still inthe NOx-limited regime in June. Our analysis suggests thatO3 production over Central Eastern China is also highly sen-sitive to VOC emissions and their reactivities, inferred fromhigher O3 yields in SAPRC99 for this region. Prior stud-ies over North America show similar results, with SAPRC99producing higher O3 values than CB4 (Arnold and Dennis,2006; Faraji et al., 2008; Luecken et al., 2007; Yarwoodet al., 2003). All of these prior studies have focused on O3yields at polluted regions where the O3 production tends tobe in the VOC-limited regime. We show the same tenden-cies over Central Eastern China where the summertime O3budget shows complex interactions among monsoonal flow,regional transport, and local photochemistry. Understandingof O3 chemistry and mechanisms over this region is far from
complete. Differences in chemical sensitivities give rise todifferences in predictions of effects of VOCs and NOx emis-sions controls. This poses a particular challenge in choosinga mechanism that best represents regional atmospheric con-ditions in regulatory applications, for example, designing anemissions control policy for Central Eastern China.
Compared with measurements, MM5-CMAQ/81km withboth CB4 and SAPRC99 tends to overpredict summertimeO3 at mid-latitude sites. The CB4 mechanism better repro-duces the magnitude of observed summertime O3 at thesesites, however, analysis of satellite measurements and MM5simulations of monsoonal rainfall presented in the last sec-tion, has revealed that CB4 in the MM5-CMAQ simulationsactually gives the right answer for the wrong reasons.
Several reasons can explain why SAPRC99 produceshigher summertime O3 over Central Eastern China. From theemissions point of view, total VOC emissions in SAPRC99should be higher than in CB4, which explains in part why re-gions in the VOC-limited regime of O3 production are mostsensitive to the choice of chemical mechanisms. SAPRC99includes a more detailed emission representation of hydro-carbon classification for individual VOC species. Forma-tion of O3 in SAPRC99 is sensitive to aggregated emis-sions of highly reactive VOC species. Emission speciationof VOCs, however, may not take full advantage of detailedVOC categories by SAPRC99 since most VOC speciationprofiles for Asia are based on the source measurements inNorth America or Europe. Despite the expected uncertainty
Atmos. Chem. Phys., 9, 3277–3301, 2009 www.atmos-chem-phys.net/9/3277/2009/
M. Lin et al.: Boundary layer ozone over East Asia 3289
X - 56 LIN M. ET AL.: BOUNDARY LAYER OZONE OVER EAST ASIA
UiCure ?7 !35L: ;/;,0 Þ+" -/%&; #& S%&" ,&7 >%U%<; 4KK)
D R A F T May 13, 2009, 5:04pm D R A F T
Fig. 8. MODIS total fire count in June and August 2001
in aggregated emissions for individual VOC species, VOCspecies estimates byStreets et al.(2003) have held up re-markably well in subsequent model and observation com-parisons (e.g.Carmichael et al., 2003b). Natural sourcesof reactive VOCs (especially isoprene and terpenes) are alsopoorly known. SAPRC99 includes both isoprene and terpenephoto-oxidation reactions, while CB4 includes isoprene onlyand the isoprene chemistry in CB4 is much coarser than inSAPRC99 (Zaveri and Peters, 1999). Isoprene emissions,primarily from oaks and other deciduous trees, exhibit strongseasonal and diurnal variability depending on temperature,solar radiation, Leaf Area Index and plant functional type.Biogenic isoprene plays an important role in contributing tosummertime O3 in many areas. A sensitivity test of CMAQwith SAPRC99 was carried out by removing biogenic emis-sions, and we find that surface O3 mixing ratios over CentralEastern China and downwind areas decrease by 10–15 ppbvon average. The results suggest that the uncertainty in esti-
mating natural VOC fluxes greatly affects summertime O3predictions. Online calculation of biogenic emissions de-pending on meteorological conditions is recommended forfuture studies.
From a chemistry point of view, the newer mechanismSAPRC99 has a better characterization of radical recy-cling than CB4. With inclusion of radical recycling pro-cesses, compounds that were previously considered termi-nation products can re-form reactive species. For example,the rate of the main radical termination process, the reac-tion of the hydroxyl radical with NO2 (OH+NO2→HNO3)is greater in CB4 relative to SAPRC99. In summertime, CB4produces 10–30% higher nitric acid (HNO3) that is quicklydry deposited and thus permanently removes a significantfraction of NOx from the system which otherwise may havebeen recycled. In addition to the radical recycling process,Faraji et al.(2008) identified aromatic reactions as an im-portant source of differences in O3 formation between CB4and SAPRC99. Evaluation of modeled key photochemicalspecies with measurements would provide further insights tophotochemical mechanisms in CB4 and SAPRC99. Sum-mertime is found to be the most sensitive season in our studyto the choice of chemical mechanisms, however, there isno observational data available to evaluate model results forsummertime.
4.2 Evaluation with TRACE-P measurements
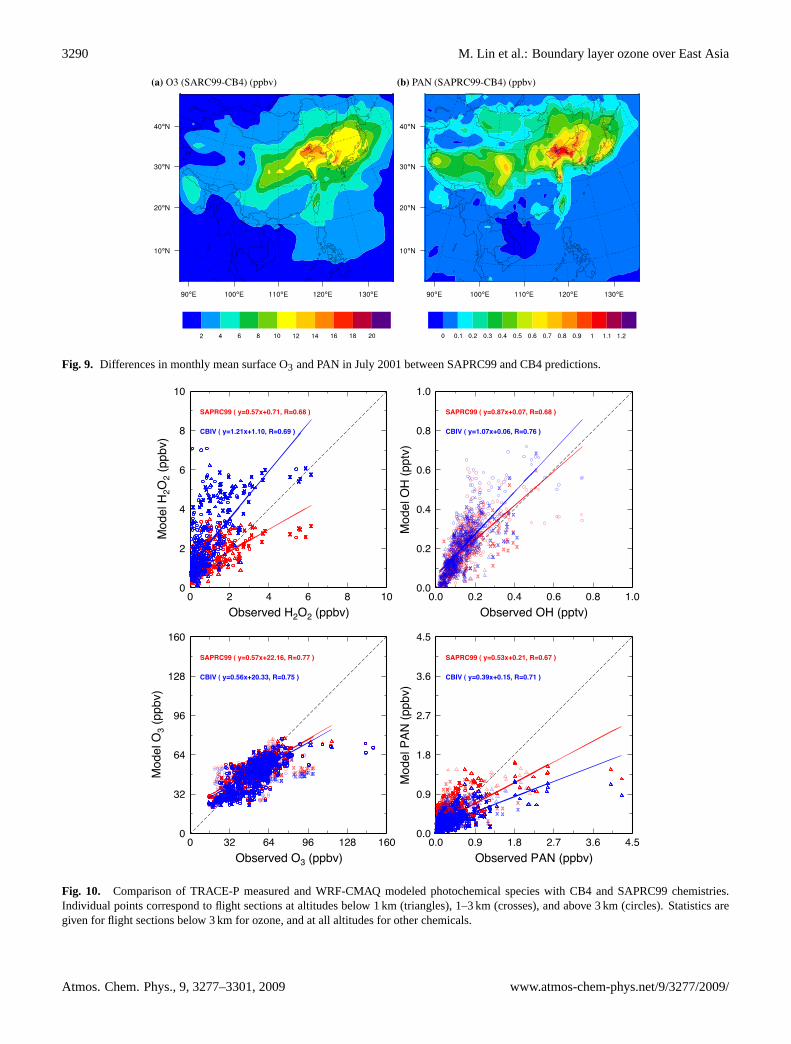
Measurements of key photochemical species during theTRACE-P campaign for March 2001 provide a unique op-portunity to evaluate regional models for Asia. Model re-sults from the WRF-CMAQ simulations were interpolatedto the aircraft location and time. Performances of CB4 andSAPRC99 mechanisms in simulating main photochemicaloxidants (O3, PAN, and H2O2) and key radicals (OH andHO2) are compared. Results are shown in Fig.10 with scat-ter plots of all DC-8 and P-3B flights in the study region, andin Figs.11–12for comparison along the DC-8 flight paths on7 and 27 March.
SAPRC99 and CB4 show little difference in simulatingspringtime O3. Overall both mechanisms reproduce wellmeasured O3 levels at flight sections below 3 km with corre-lations ofR≥0.75. We discussed the discrepancy above 3 kmin Sect. 3.1. In many flight segments, modeled OH from bothmechanisms closely tracked the observed values. However,CB4 tends to predict higher OH levels at some flight sec-tions, such as the DC-8 flight at 02:00 to 04:00 UTC on 7March (Fig.11). SAPRC99 shows stronger variability in theOH level along the flight path, reflecting the faster produc-tion and termination processes of radicals. Large differencesin PAN and H2O2 mixing ratios are found between CB4 andSAPRC99 and are discussed below.
Gas-phase PAN is produced via a reversiblereaction of the peroxyacetyl radical with NO2:CH3C(O)OO+NO2CH3C(O)OONO2. Figure 11 for
www.atmos-chem-phys.net/9/3277/2009/ Atmos. Chem. Phys., 9, 3277–3301, 2009
3290 M. Lin et al.: Boundary layer ozone over East AsiaLIN M. ET AL.: BOUNDARY LAYER OZONE OVER EAST ASIA X - 57
S)T 3= O:>?B[[IBWAQ OTTD6Q S1T V>R O:>V?B[[IBWAQ OTTD6Q
UiCure @7 5#CC"+"&-"< #& F/&;@0$ F",& <%+C,-" 33 ,&7 V>R #& S%0$ 4KK) D";1""& :>V?B[[ ,&7 BWA
T+"7#-;#/&<9
D R A F T May 13, 2009, 5:04pm D R A F T
Fig. 9. Differences in monthly mean surface O3 and PAN in July 2001 between SAPRC99 and CB4 predictions.X - 58 LIN M. ET AL.: BOUNDARY LAYER OZONE OVER EAST ASIA
"
&%
('
#(
$%!
$("
289:;*)
&*+,,-./
" &% (' #( $%! $(")-<:=.:9*)&*+,,-./
77777 777
77777777
7 7 7777 77 7 77777
7
777777 7777 77 7 7777 7 7 77777 7777 777 7 7777
777777 7777777777 77777 7
777 7777 77 7 77
77 77777777 77777 77777 7
7 77 7
777777 7
777777 7 777777777 7777777
7777777
77
777777777
7 7 77777777
77 77 77777777
7 77777
77
7777
777 7 7777
77
77
77777
7 777
7
777
7 77777 7 7
77
7
777777
7 77
7 7777777 777 7
77 77 7 7
77
777 7
7 77
777 7
77
77
77 7 777
77 777 77777777
77 77 77777777
7 77777
77
7777
777 7 7777
77
77
77777
7 777
7
777
7 77777 7 7
77
7
777777
7 77
7 7777777 777 7
77 77 7 7
77
777 7
7 77
777 7
77
77
77 7 777
77 777 77777777
77 77 77777777
7 77777
77
7777
777 7 7777
77
77
77777
7 777
7
777
7 77777 7 7
77
7
777777
7 77
7 7777777 777 7
77 77 7 7
77
777 7
7 77
777 7
77
77
77 7 777
77 777 77777777
77 77 77777777
7 77777
77
7777
777 7 7777
77
77
77777
7 777
7
777
7 77777 7 7
77
7
777777
7 77
7 7777777 777 7
77 77 7 7
77
777 7
7 77
777 7
77
77
77 7 777
77 777 77777777
77 77 77777777
7 77777
77
7777
777 7 7777
77
77
77777
7 777
7
777
7 77777 7 7
77
7
777777
7 77
7 7777777 777 7
77 77 7 7
77
777 7
7 77
777 7
77
77
77 7 777
77 777 77777777
77 77 77777777
7 77777
77
7777
777 7 7777
77
77
77777
7 777
7
777
7 77777 7 7
77
7
777777
7 77
7 7777777 777 7
77 77 7 7
77
777 7
7 77
777 7
77
77
77 7 777
77 777 77777777
77 77 77777777
7 77777
77
7777
777 7 7777
77
77
77777
7 777
7
777
7 77777 7 7
77
7
777777
7 77
7 7777777 777 7
77 77 7 7
77
777 7
7 77
777 7
77
77
77 7 777
77 777 77777777
77 77 77777777
7 77777
77
7777
777 7 7777
77
77
77777
7 777
7
777
7 77777 7 7
77
7
777777
7 77
7 7777777 777 7
77 77 7 7
77
777 7
7 77
777 7
77
77
77 7 777
77 777 77777777
77 77 77777777
7 77777
77
7777
777 7 7777
77
77
77777
7 777
7
777
7 77777 7 7
77
7
777777
7 77
7 7777777 777 7
77 77 7 7
77
777 7
7 77
777 7
77
77
77 7 777
77 777 77777777
77 77 77777777
7 77777
77
7777
777 7 7777
77
77
77777
7 777
7
777
7 77777 7 7
77
7
777777
7 77
7 7777777 777 7
77 77 7 7
77
777 7
7 77
777 7
77
77
77 7 777
77 777
SPQR.AA $ 8@=:9+&Z)):"F< R@=:++ *
77777 777
77777777
7 7 7777 77 7 777777
777777 7777 777 7777
7 7 77777 7777 777 7 7777
77777777777
77777 77777 7
777 777 7 77 7 7
777 777
77777 77777 77777 77 77 7
777777 7
777777 7 777777777 7777777
7777777
77
777777777
7 7 77777777
77 77 77777777
7 77777
77
7777
7777 7777
77
77
7777
77 7
77
7
777
7 77777 7 7
7 77
777777
7 77
7 7777777 777 7
77 7
7 7 7
77
777 7
7 77
777 7
77
77
7 7 7 77777 777 77777777
77 77 77777777
7 77777
77
7777
7777 7777
77
77
7777
77 7
77
7
777
7 77777 7 7
7 77
777777
7 77
7 7777777 777 7
77 7
7 7 7
77
777 7
7 77
777 7
77
77
7 7 7 77777 777 77777777
77 77 77777777
7 77777
77
7777
7777 7777
77
77
7777
77 7
77
7
777
7 77777 7 7
7 77
777777
7 77
7 7777777 777 7
77 7
7 7 7
77
777 7
7 77
777 7
77
77
7 7 7 77777 777 77777777
77 77 77777777
7 77777
77
7777
7777 7777
77
77
7777
77 7
77
7
777
7 77777 7 7
7 77
777777
7 77
7 7777777 777 7
77 7
7 7 7
77
777 7
7 77
777 7
77
77
7 7 7 77777 777 77777777
77 77 77777777
7 77777
77
7777
7777 7777
77
77
7777
77 7
77
7
777
7 77777 7 7
7 77
777777
7 77
7 7777777 777 7
77 7
7 7 7
77
777 7
7 77
777 7
77
77
7 7 7 77777 777 77777777
77 77 77777777
7 77777
77
7777
7777 7777
77
77
7777
77 7
77
7
777
7 77777 7 7
7 77
777777
7 77
7 7777777 777 7
77 7
7 7 7
77
777 7
7 77
777 7
77
77
7 7 7 77777 777 77777777
77 77 77777777
7 77777
77
7777
7777 7777
77
77
7777
77 7
77
7
777
7 77777 7 7
7 77
777777
7 77
7 7777777 777 7
77 7
7 7 7
77
777 7
7 77
777 7
77
77
7 7 7 77777 777 77777777
77 77 77777777
7 77777
77
7777
7777 7777
77
77
7777
77 7
77
7
777
7 77777 7 7
7 77
777777
7 77
7 7777777 777 7
77 7
7 7 7
77
777 7
7 77
777 7
77
77
7 7 7 77777 777 77777777
77 77 77777777
7 77777
77
7777
7777 7777
77
77
7777
77 7
77
7
777
7 77777 7 7
7 77
777777
7 77
7 7777777 777 7
77 7
7 7 7
77
777 7
7 77
777 7
77
77
7 7 7 77777 777 77777777
77 77 77777777
7 77777
77
7777
7777 7777
77
77
7777
77 7
77
7
777
7 77777 7 7
7 77
777777
7 77
7 7777777 777 7
77 7
7 7 7
77
777 7
7 77
777 7
77
77
7 7 7 77777 777
.-[\ $ 8@=:9F&Z)=:,,< R@=:+9 *
">"
">#
$>!
%>?
&>(
'>@
289:;*A35*+,,-./
">" "># $>! %>? &>( '>@)-<:=.:9*A35*+,,-./
7
777777 77
7777777 77 7777
7
77777
7777
777
77
777777777777777777777777
777 7
7777777777777777
77 77
77777
777777
7 777
77
77
77 777777
7
77
7
7 7777
7
777777
77
7
777777
7777
77
7777
7777
7 7
7 7777 7777
77
777
7
77 7
777 7777
7
7777777777
77
77
77 77 77
7
7777 7
77
77
7
777
7
77
77
7
7777777
7 77
77777
77
77777
7
77
77
77
77
77
7
7
77
777
7
7
77
777
7
77 7
777 7777
7
7777777777
77
77
77 77 77
7
7777 7
77
77
7
777
7
77
77
7
7777777
7 77
77777
77
77777
7
77
77
77
77
77
7
7
77
777
7
7
77
777
7
77 7
777 7777
7
7777777777
77
77
77 77 77
7
7777 7
77
77
7
777
7
77
77
7
7777777
7 77
77777
77
77777
7
77
77
77
77
77
7
7
77
777
7
7
77
777
7
77 7
777 7777
7
7777777777
77
77
77 77 77
7
7777 7
77
77
7
777
7
77
77
7
7777777
7 77
77777
77
77777
7
77
77
77
77
77
7
7
77
777
7
7
77
777
7
77 7
777 7777
7
7777777777
77
77
77 77 77
7
7777 7
77
77
7
777
7
77
77
7
7777777
7 77
77777
77
77777
7
77
77
77
77
77
7
7
77
777
7
7
77
777
7
77 7
777 7777
7
7777777777
77
77
77 77 77
7
7777 7
77
77
7
777
7
77
77
7
7777777
7 77
77777
77
77777
7
77
77
77
77
77
7
7
77
777
7
7
77
777
7
77 7
777 7777
7
7777777777
77
77
77 77 77
7
7777 7
77
77
7
777
7
77
77
7
7777777
7 77
77777
77
77777
7
77
77
77
77
77
7
7
77
777
7
7
77
777
7
77 7
777 7777
7
7777777777
77
77
77 77 77
7
7777 7
77
77
7
777
7
77
77
7
7777777
7 77
77777
77
77777
7
77
77
77
77
77
7
7
77
777
7
7
77
777
7
77 7
777 7777
7
7777777777
77
77
77 77 77
7
7777 7
77
77
7
777
7
77
77
7
7777777
7 77
77777
77
77777
7
77
77
77
77
77
7
7
77
777
7
7
77
777
7
77 7
777 7777
7
7777777777
77
77
77 77 77
7
7777 7
77
77
7
777
7
77
77
7
7777777
7 77
77777
77
77777
7
77
77
77
77
77
7
7
77
777
7
7
77
SPQR.AA $ 8@=:9,&Z=:)"< R@=:F+ *
7777777 7
77777777 7
7 7777
7
777777 777777
77
777777777777777777 77777
7777 7
777777777777777777 77
777777
77777
7 777
77
77
77 777777
7
77
7
7 7777
7
7777777 77
777777
7777
7 77777
77777 77 7777 777777777
777 7
777 77 7
7
7
7777777777
77
777
7 77 77
7
7777 77 7777
777
7
7777
7
7777777
7 77
77777
777
7777
777
77
77
7777
7
7
77
777
77
77
777
777 7
777 77 7
7
7
7777777777
77
777
7 77 77
7
7777 77 7777
777
7
7777
7
7777777
7 77
77777
777
7777
777
77
77
7777
7
7
77
777
77
77
777
777 7
777 77 7
7
7
7777777777
77
777
7 77 77
7
7777 77 7777
777
7
7777
7
7777777
7 77
77777
777
7777
777
77
77
7777
7
7
77
777
77
77
777
777 7
777 77 7
7
7
7777777777
77
777
7 77 77
7
7777 77 7777
777
7
7777
7
7777777
7 77
77777
777
7777
777
77
77
7777
7
7
77
777
77
77
777
777 7
777 77 7
7
7
7777777777
77
777
7 77 77
7
7777 77 7777
777
7
7777
7
7777777
7 77
77777
777
7777
777
77
77
7777
7
7
77
777
77
77
777
777 7
777 77 7
7
7
7777777777
77
777
7 77 77
7
7777 77 7777
777
7
7777
7
7777777
7 77
77777
777
7777
777
77
77
7777
7
7
77
777
77
77
777
777 7
777 77 7
7
7
7777777777
77
777
7 77 77
7
7777 77 7777
777
7
7777
7
7777777
7 77
77777
777
7777
777
77
77
7777
7
7
77
777
77
77
777
777 7
777 77 7
7
7
7777777777
77
777
7 77 77
7
7777 77 7777
777
7
7777
7
7777777
7 77
77777
777
7777
777
77
77
7777
7
7
77
777
77
77
777
777 7
777 77 7
7
7
7777777777
77
777
7 77 77
7
7777 77 7777
777
7
7777
7
7777777
7 77
77777
777
7777
777
77
77
7777
7
7
77
777
77
77
777
777 7
777 77 7
7
7
7777777777
77
777
7 77 77
7
7777 77 7777
777
7
7777
7
7777777
7 77
77777
777
7777
777
77
77
7777
7
7
77
777
77
77
.-[\ $ 8@=:,A&Z=:"9< R@=:+" *
"
%
'
(
!
$"
289:;*B%)
%*+,,-./
" % ' ( ! $")-<:=.:9*B%)%*+,,-./
777
77
77 77 77 7
7777
7
77777
7
77
777777777777
7
77
77
77
7
7
7 7
77
77 7 7
777 7
77
7 7
7
777 77777
7
7
777
777777777
77 77
7777 777777
777
77
77 77 77 7
7777
7
77777
7
77
777777777777
7
77
77
77
7
7
7 7
77
77 7 7
777 7
77
7 7
7
777 77777
7
7
777
777777777
77 77
7777 777777
777
77
77 77 77 7
7777
7
77777
7
77
777777777777
7
77
77
77
7
7
7 7
77
77 7 7
777 7
77
7 7
7
777 77777
7
7
777
777777777
77 77
7777 777777
777
77
77 77 77 7
7777
7
77777
7
77
777777777777
7
77
77
77
7
7
7 7
77
77 7 7
777 7
77
7 7
7
777 77777
7
7
777
777777777
77 77
7777 777777
777
77
77 77 77 7
7777
7
77777
7
77
777777777777
7
77
77
77
7
7
7 7
77
77 7 7
777 7
77
7 7
7
777 77777
7
7
777
777777777
77 77
7777 777777
777
77
77 77 77 7
7777
7
77777
7
77
777777777777
7
77
77
77
7
7
7 7
77
77 7 7
777 7
77
7 7
7
777 77777
7
7
777
777777777
77 77
7777 777777
777
77
77 77 77 7
7777
7
77777
7
77
777777777777
7
77
77
77
7
7
7 7
77
77 7 7
777 7
77
7 7
7
777 77777
7
7
777
777777777
77 77
7777 777777
777
77
77 77 77 7
7777
7
77777
7
77
777777777777
7
77
77
77
7
7
7 7
77
77 7 7
777 7
77
7 7
7
777 77777
7
7
777
777777777
77 77
7777 777777
777
77
77 77 77 7
7777
7
77777
7
77
777777777777
7
77
77
77
7
7
7 7
77
77 7 7
777 7
77
7 7
7
777 77777
7
7
777
777777777
77 77
7777 777777
777
77
77 77 77 7
7777
7
77777
7
77
777777777777
7
77
77
77
7
7
7 7
77
77 7 7
777 7
77
7 7
7
777 77777
7
7
777
777777777
77 77
7777 777777
SPQR.AA $ 8@=:9+&Z=:+"< R@=:F% *
777
7
7 7
7
77 777
7
77
7 7
77777
7
7
7
777777777777
7
77
7
7
77
7
7
7 7
77
77 7
7
7 7777
77
7
7
777 77
777
7
7
77
7
77
777777
7
7
7
77
7777 777777
777
7
7 7
7
77 777
7
77
7 7
77777
7
7
7
777777777777
7
77
7
7
77
7
7
7 7
77
77 7
7
7 7777
77
7
7
777 77
777
7
7
77
7
77
777777
7
7
7
77
7777 777777
777
7
7 7
7
77 777
7
77
7 7
77777
7
7
7
777777777777
7
77
7
7
77
7
7
7 7
77
77 7
7
7 7777
77
7
7
777 77
777
7
7
77
7
77
777777
7
7
7
77
7777 777777
777
7
7 7
7
77 777
7
77
7 7
77777
7
7
7
777777777777
7
77
7
7
77
7
7
7 7
77
77 7
7
7 7777
77
7
7
777 77
777
7
7
77
7
77
777777
7
7
7
77
7777 777777
777
7
7 7
7
77 777
7
77
7 7
77777
7
7
7
777777777777
7
77
7
7
77
7
7
7 7
77
77 7
7
7 7777
77
7
7
777 77
777
7
7
77
7
77
777777
7
7
7
77
7777 777777
777
7
7 7
7
77 777
7
77
7 7
77777
7
7
7
777777777777
7
77
7
7
77
7
7
7 7
77
77 7
7
7 7777
77
7
7
777 77
777
7
7
77
7
77
777777
7
7
7
77
7777 777777
777
7
7 7
7
77 777
7
77
7 7
77777
7
7
7
777777777777
7
77
7
7
77
7
7
7 7
77
77 7
7
7 7777
77
7
7
777 77
777
7
7
77
7
77
777777
7
7
7
77
7777 777777
777
7
7 7
7
77 777
7
77
7 7
77777
7
7
7
777777777777
7
77
7
7
77
7
7
7 7
77
77 7
7
7 7777
77
7
7
777 77
777
7
7
77
7
77
777777
7
7
7
77
7777 777777
777
7
7 7
7
77 777
7
77
7 7
77777
7
7
7
777777777777
7
77
7
7
77
7
7
7 7
77
77 7
7
7 7777
77
7
7
777 77
777
7
7
77
7
77
777777
7
7
7
77
7777 777777
777
7
7 7
7
77 777
7
77
7 7
77777
7
7
7
777777777777
7
77
7
7
77
7
7
7 7
77
77 7
7
7 7777
77
7
7
777 77
777
7
7
77
7
77
777777
7
7
7
77
7777 777777
.-[\ $ 8@":)"&Z":"=< R@=:FA *
">"
">%
">'
">(
">!
$>"289:;*)B*+,,C./
">" ">% ">' ">( ">! $>")-<:=.:9*)B*+,,C./
7
77
7
77
777
7
7
77 7 7
7
7777
77777
777777
77 7
77
7
7
7 7777
7
7 7
7
7
777
77
77
7
77
7
77
7
7
7
7777
7
7777 777
7
7
7
777
77777 777
7 7
77
7
7
7
7
7
7
77777
7
7
7
77
7
777
7
77777777
SPQR.AA $ 8@=:%+&Z=:=+< R@=:F% *
7
77
7
77
77
7
7777 7 77
7777 77777
777777
77777
7
7
7 7777
7
7 7
7
7
777
7
7
77
7
77
7
7
77
7
7
7
777
7
77 7
7 777
7
7
7
7
77
77777 777
7 7
77 7
7
7
7
7
7
777777
7
7
77
7
777
7
77777777
.-[\ $ 8@":=+&Z=:=F< R@=:+F *
UiCure 8A7 B/FT,+#</& /C *?>BEIV F",<%+"7 ,&7 H?bIB!>X F/7"0"7 T@/;/-@"F#-,0 <T"-#"<
1#;@ BWA ,&7 :>V?B[[ -@"F#<;+#"<9 L&7#6#7%,0 T/#&;< -/++"<T/&7 ;/ ß#U@; <"-;#/&< ,; ,0;#;%7"< D"0/1
) 2F O;+#,&U0"<Q( )h= 2F O-+/<<"<Q( ,&7 ,D/6" = 2F O-#+-0"<Q9 :;,;#<;#-< ,+" U#6"& C/+ ß#U@; <"-;#/&<
D"0/1 = 2F C/+ /Z/&"( ,&7 ,; ,00 ,0;#;%7"< C/+ /;@"+ -@"F#-,0<9
D R A F T May 13, 2009, 5:04pm D R A F T
Fig. 10. Comparison of TRACE-P measured and WRF-CMAQ modeled photochemical species with CB4 and SAPRC99 chemistries.Individual points correspond to flight sections at altitudes below 1 km (triangles), 1–3 km (crosses), and above 3 km (circles). Statistics aregiven for flight sections below 3 km for ozone, and at all altitudes for other chemicals.
Atmos. Chem. Phys., 9, 3277–3301, 2009 www.atmos-chem-phys.net/9/3277/2009/
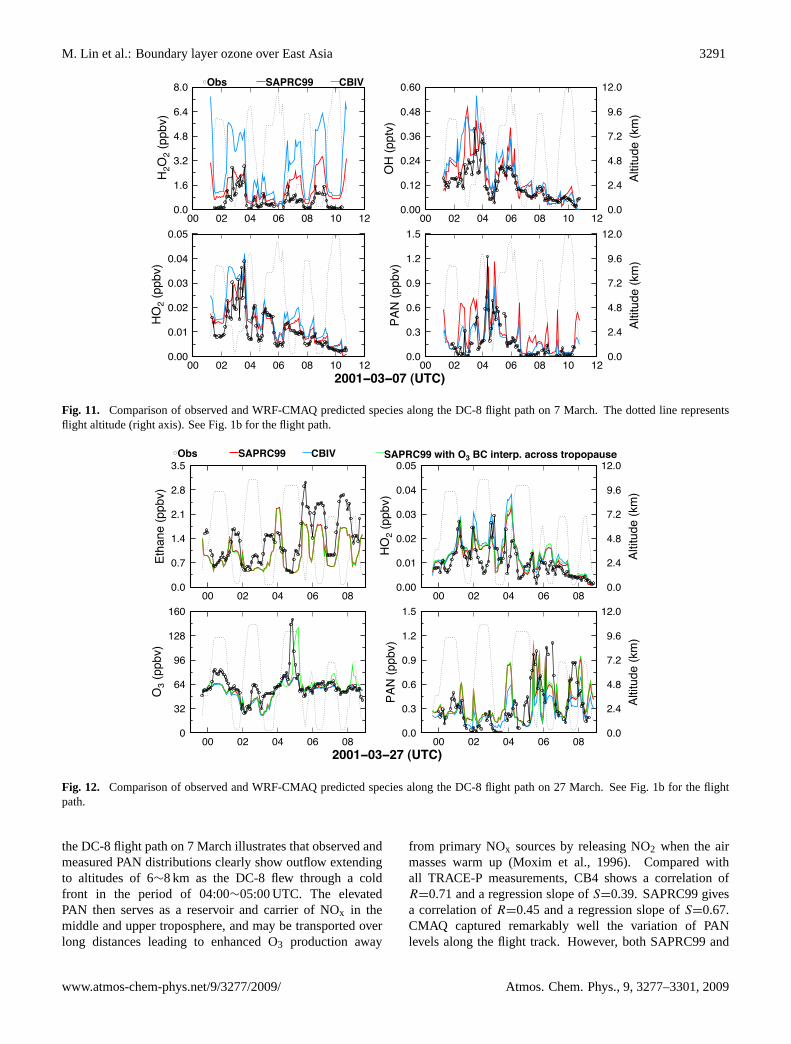
M. Lin et al.: Boundary layer ozone over East Asia 3291LIN M. ET AL.: BOUNDARY LAYER OZONE OVER EAST ASIA X - 59
">""
">"$
">"%
">"&
">"'
">"@
B)%*+,,-./
"" "% "' "( "! $" $%">"
">&
">(
">#
$>%
$>@
A35*+,,-./
"" "% "' "( "! $" $%">"
%>'
'>!
?>%
#>(
$%>"
3;CDCE9:*+FG/
">"
$>(
&>%
'>!
(>'
!>"
B %)%*+,,-./
"" "% "' "( "! $" $%">""
">$%
">%'
">&(
">'!
">("
)B*+,,C./
"" "% "' "( "! $" $%">"
%>'
'>!
?>%
#>(
$%>"
3;CDCE9:*+FG/
MDs SPQR.AA .-[\
)=="!=,!=+ $]K.*
UiCure 887 B/FT,+#</& /C /D<"+6"7 ,&7 H?bIB!>X T+"7#-;"7 <T"-#"< ,0/&U ;@" 5BIe ß#U@; T,;@ /&
!,+-@ J9 *@" 7/;;"7 0#&" +"T+"<"&;< ß#U@; ,0;#;%7" O+#U@; ,Y#<Q9 :"" b#U9)D C/+ ;@" ß#U@; T,;@9
D R A F T May 13, 2009, 5:04pm D R A F T
Fig. 11. Comparison of observed and WRF-CMAQ predicted species along the DC-8 flight path on 7 March. The dotted line representsflight altitude (right axis). See Fig.1b for the flight path.
X - 60 LIN M. ET AL.: BOUNDARY LAYER OZONE OVER EAST ASIA
"
&%
('
#(
$%!
$("
)&*+,,-./
"" "% "' "( "!">"
">&
">(
">#
$>%
$>@
A35*+,,-./
"" "% "' "( "!">"
%>'
'>!
?>%
#>(
$%>"
3;CDCE9:*+FG/
">"
">?
$>'
%>$
%>!
&>@
HCIJK:*+,,-./
"" "% "' "( "!">""
">"$
">"%
">"&
">"'
">"@
B)%*+,,-./
"" "% "' "( "!">"
%>'
'>!
?>%
#>(
$%>"
3;CDCE9:*+FG/
MDs SPQR.AA .-[\ SPQR.AA UitJ M, -. interC: a3ross troCoCause
)=="!=,!)+ $]K.*
UiCure 897 B/FT,+#</& /C /D<"+6"7 ,&7 H?bIB!>X T+"7#-;"7 <T"-#"< ,0/&U ;@" 5BIe ß#U@; T,;@ /&
!,+-@ 4J9 :"" b#U9)D C/+ ;@" ß#U@; T,;@9
D R A F T May 13, 2009, 5:04pm D R A F T
Fig. 12. Comparison of observed and WRF-CMAQ predicted species along the DC-8 flight path on 27 March. See Fig.1b for the flightpath.
the DC-8 flight path on 7 March illustrates that observed andmeasured PAN distributions clearly show outflow extendingto altitudes of 6∼8 km as the DC-8 flew through a coldfront in the period of 04:00∼05:00 UTC. The elevatedPAN then serves as a reservoir and carrier of NOx in themiddle and upper troposphere, and may be transported overlong distances leading to enhanced O3 production away
from primary NOx sources by releasing NO2 when the airmasses warm up (Moxim et al., 1996). Compared withall TRACE-P measurements, CB4 shows a correlation ofR=0.71 and a regression slope ofS=0.39. SAPRC99 givesa correlation ofR=0.45 and a regression slope ofS=0.67.CMAQ captured remarkably well the variation of PANlevels along the flight track. However, both SAPRC99 and
www.atmos-chem-phys.net/9/3277/2009/ Atmos. Chem. Phys., 9, 3277–3301, 2009

3292 M. Lin et al.: Boundary layer ozone over East Asia
CB4 tends to overpredict low-observed PAN (<0.5 ppbv) atflight altitudes near 3 km (Fig.11), likely due to errors inthe thermal decomposition rate of PAN. SAPRC99 showssomewhat better ability to capture high-observed PAN levelsbelow 1 km with mean bias (MB) of −0.05 ppbv in contrastto MB=−0.19 ppbv for CB4. This can be traced back to thedifferent treatment of PAN and its analogues in CB4 andSAPRC99. SAPRC99 considers PAN, peroxy propionylnitrate and other higher alkyl PAN analogues (PAN2), PANanalogues formed from aromatic aldehydes (PBZN), anda PAN analogue formed from methacrolein (MPAN). CB4considers just the PAN. The rate of PAN decompositionis also higher in SAPRC99 even though the rate of PANformation is similar between CB4 and SAPRC99.
Hydrogen peroxide (H2O2) and the hydroperoxide radical(HO2) are photochemical products that serve as precursorsof odd-oxygen as well as reservoirs of odd-hydrogen radi-cals. Comparison with TRACE-P measurements reveals thatCB4 systematically overpredicts H2O2 mixing ratios with aregression slope ofS=1.21 (Fig.10). Examination of ob-served and modeled results along DC-8 flight 7 (Fig.11)found that CB4 and SAPRC99 give similar predictions ataltitudes above 3 km. Below 3 km, however, the overpre-diction of H2O2 in CB4 is up to a factor of 3. The differ-ence in H2O2 and HO2 values are relevant. CMAQ withboth mechanisms tracked the observed HO2 levels remark-ably well, and CB4 tends to produce slightly higher HO2radicals than SAPRC99. Self-reaction of HO2 is the only im-portant gas-phase source of H2O2 in the troposphere. CB4uses a 62% higher conversion rate for HO2 to H2O2 reac-tion than SAPRC99 (Luecken et al., 2007). In consequence,SAPRC99 produces 20–50% less H2O2 in summertime overCentral Eastern China and downwind areas than CB4. Ouranalysis for the sringtime suggests that the conversion ratefor the HO2 to H2O2 reaction is too high in CB4. Previ-ous sensitivity studies over North America have suggestedthat SAPRC99 tends to produce higher radical concentra-tions leading to enhanced O3 production (e.g.Luecken et al.,2007), but our results show that SAPRC99 produces lowerOH and HO2 radicals in springtime compared with CB4.
The analysis of photochemical sensitivity in this study hasdemonstrated that the choice of chemical mechanisms cancause a large difference in simulating key oxidants over EastAsia. Neither the CB4 nor SAPRC99 mechanisms consis-tently capture the observed behavior of PAN and H2O2 inspringtime. Understanding the causes of these differences isneeded to give us more confidence, and a better understand-ing of the uncertainties in current models. Use of detailedmechanisms is necessary for: 1) large releases of precursors,2) reactivity-based alternative simulations, and 3) multi-dayeffects. But model results need to be interpreted with carebecause they may not necessarily be the best representationof the actual processes.
5 Diurnal variation of ground-level ozone
Previous studies examining variations of boundary layer O3over East Asia generally used monthly or daily mean data(e.g.Liu et al., 2002; Yamaji et al., 2006). The present sec-tion of this study uses hourly data to examine the role ofchemistry evolution, vertical mixing and dry deposition pro-cesses on diurnal behavior of ground-level O3. Model resultsof hourly O3 and NOx mixing ratios with five different con-figurations are compared with EANET measurements takenin Japan (Fig. 13).
5.1 Resolution dependence of chemical processes
The difference between CB4 and SAPRC99 is further ex-amined by comparing both 81-km and 27-km simulations ofMM5-CMAQ with hourly measurement data from EANET.Table 3 shows the overall statistics of five model scenar-ios. Comparison of hourly O3 predictions between CB4 andSAPRC99 shows an intriguing feature: with 81 km reso-lution, CB4 systematically improves statistical scores overSAPRC99 in reproducing the magnitude of observed O3, butwith 27 km resolution, SAPRC99 shows a better ability tocapture observed 1-h maximums of O3 mixing ratios. For ex-ample, 9–11 July at Sado-seki and some days at Ijira exhibitthis phenomena. In general, fine-grid predictions show betteragreement against observations than coarse-grid predictionsfor minimum and maximum O3 mixing ratios on observedlow–O3 days. For example, during 17–26 July at Sado-seki,the average difference between the 81-km and 27-km simu-lations of MM5-CMAQ amounts to 40 ppbv. At the Oki siteMM5-CMAQ with 27-km resolution (hereafter referred to asMM5-CMAQ/27 km) presents a correlation ofR=0.42 andRMSE=15 ppbv in contrast toR=0.2 andRMSE=23 ppbv inthe MM5-CMAQ/81,km simulation. Examination of hourlymixing ratios reveals that MM5-CMAQ/81km’s overpredic-tion of monthly mean O3 at Oki (Fig. 2b) is primarily dueto large biases on low-O3 days. Increased spatial resolu-tion improves model results regardless of chemical mecha-nisms. Our results, going from hemispheric-scale (81 km)to regional-scale (27 km), are consistent withArnold andDennis(2006) who show similar improvement from regional(32 km) to urban (8 km and 2 km) scales. Since we are us-ing global model BCs and then downscaling the 81 km re-sults to 27 km, the results indicate the important resolution-dependence of physical and chemical processes.
Overall, higher-resolution simulations show better agree-ment for diurnal variations of O3 mixing ratios, suggestingclear benefits in predicting boundary layer O3 over Asia witha high-resolution regional model. Using hourly varying BCsinstead of monthly mean values is one of the key reasons whythe MM5-CMAQ/27km simulations improve correlations insimulating O3 variations over the MM5-CMAQ/81km sim-ulations. The WRF-CMAQ simulation at 27 km horizontalscale (hereafter referred to as WRF-CMAQ/27 km) gives the
Atmos. Chem. Phys., 9, 3277–3301, 2009 www.atmos-chem-phys.net/9/3277/2009/
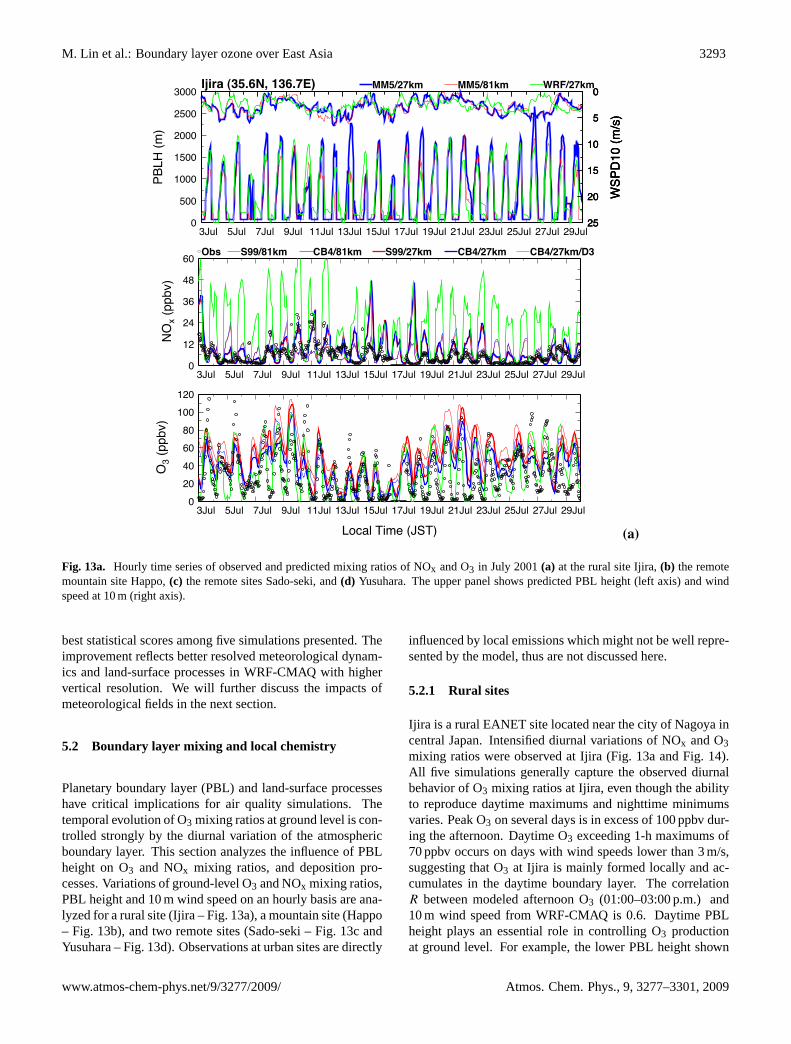
M. Lin et al.: Boundary layer ozone over East Asia 3293LIN M. ET AL.: BOUNDARY LAYER OZONE OVER EAST ASIA X - 61
"%"'"("!"$""$%"
)&*+,,-./
&0E; @0E; ?0E; #0E; $$0E; $&0E; $@0E; $?0E; $#0E; %$0E; %&0E; %@0E; %?0E; %#0E;
L8MJ;*NDG:*+04N/
"
$%
%'
&(
'!
("
5)7*+,,-./
&0E; @0E; ?0E; #0E; $$0E; $&0E; $@0E; $?0E; $#0E; %$0E; %&0E; %@0E; %?0E; %#0E;
MDs SAAV%"'m .-GV%"'m SAAV)+'m .-GV)+'m .-GV)+'mV!,
"
@""
$"""
$@""
%"""
%@""
&"""
AOLB*+G/
&0E; @0E; ?0E; #0E; $$0E; $&0E; $@0E; $?0E; $#0E; %$0E; %&0E; %@0E; %?0E; %#0E;
"
@
$"
$@
%"
%@
P4A6$"*+GQ</
"
@
$"
$@
%"
%@
P4A6$"*+GQ</
"
@
$"
$@
%"
%@
P4A6$"*+GQ</
559V)+'m 559V%"'m ^RFV)+'m[Oira $,9:F;< ",F:+>*
S)TUiCure 8:)7 ./%+0$ ;#F" <"+#"< /C /D<"+6"7 ,&7 T+"7#-;"7 F#Y#&U +,;#/< /C R3x ,&7 33 #& S%0$ 4KK)
S)T ,; ;@" +%+,0 <#;" L\#+,( S1T ;@" +"F/;" F/%&;,#& <#;" .,TT/( S(T ;@" +"F/;" <#;"< :,7/I<"2#( ,&7 SdT
j%<%@,+,9 *@" %TT"+ T,&"0 <@/1< T+"7#-;"7 VW' @"#U@; O0"C; ,Y#<Q ,&7 1#&7 <T""7 ,; )K F O+#U@; ,Y#<Q9
D R A F T May 13, 2009, 5:04pm D R A F T
Fig. 13a. Hourly time series of observed and predicted mixing ratios of NOx and O3 in July 2001(a) at the rural site Ijira,(b) the remotemountain site Happo,(c) the remote sites Sado-seki, and(d) Yusuhara. The upper panel shows predicted PBL height (left axis) and windspeed at 10 m (right axis).
best statistical scores among five simulations presented. Theimprovement reflects better resolved meteorological dynam-ics and land-surface processes in WRF-CMAQ with highervertical resolution. We will further discuss the impacts ofmeteorological fields in the next section.
5.2 Boundary layer mixing and local chemistry
Planetary boundary layer (PBL) and land-surface processeshave critical implications for air quality simulations. Thetemporal evolution of O3 mixing ratios at ground level is con-trolled strongly by the diurnal variation of the atmosphericboundary layer. This section analyzes the influence of PBLheight on O3 and NOx mixing ratios, and deposition pro-cesses. Variations of ground-level O3 and NOx mixing ratios,PBL height and 10 m wind speed on an hourly basis are ana-lyzed for a rural site (Ijira – Fig.13a), a mountain site (Happo– Fig. 13b), and two remote sites (Sado-seki – Fig.13candYusuhara – Fig.13d). Observations at urban sites are directly
influenced by local emissions which might not be well repre-sented by the model, thus are not discussed here.
5.2.1 Rural sites
Ijira is a rural EANET site located near the city of Nagoya incentral Japan. Intensified diurnal variations of NOx and O3mixing ratios were observed at Ijira (Fig.13aand Fig.14).All five simulations generally capture the observed diurnalbehavior of O3 mixing ratios at Ijira, even though the abilityto reproduce daytime maximums and nighttime minimumsvaries. Peak O3 on several days is in excess of 100 ppbv dur-ing the afternoon. Daytime O3 exceeding 1-h maximums of70 ppbv occurs on days with wind speeds lower than 3 m/s,suggesting that O3 at Ijira is mainly formed locally and ac-cumulates in the daytime boundary layer. The correlationR between modeled afternoon O3 (01:00–03:00 p.m.) and10 m wind speed from WRF-CMAQ is 0.6. Daytime PBLheight plays an essential role in controlling O3 productionat ground level. For example, the lower PBL height shown
www.atmos-chem-phys.net/9/3277/2009/ Atmos. Chem. Phys., 9, 3277–3301, 2009

3294 M. Lin et al.: Boundary layer ozone over East AsiaX - 62 LIN M. ET AL.: BOUNDARY LAYER OZONE OVER EAST ASIA
"%"'"("!"$""$%"
)&*+,,-./
&0E; @0E; ?0E; #0E; $$0E; $&0E; $@0E; $?0E; $#0E; %$0E; %&0E; %@0E; %?0E; %#0E;
L8MJ;*NDG:*+04N/
"
@
$"
$@
%"
%@
5)7*+,,-./
&0E; @0E; ?0E; #0E; $$0E; $&0E; $@0E; $?0E; $#0E; %$0E; %&0E; %@0E; %?0E; %#0E;
MDs SAAV%"'m .-GV%"'m SAAV)+'m .-GV)+'m .-GV)+'mV!,
"
@""
$"""
$@""
%"""
%@""
&"""
AOLB*+G/
&0E; @0E; ?0E; #0E; $$0E; $&0E; $@0E; $?0E; $#0E; %$0E; %&0E; %@0E; %?0E; %#0E;
"
@
$"
$@
%"
%@
P4A6$"*+GQ</
"
@
$"
$@
%"
%@
P4A6$"*+GQ</
"
@
$"
$@
%"
%@
P4A6$"*+GQ</
559V)+'m 559V%"'m ^RFV)+'mRaCCo $,F:+;< ",+:%>*
S1T
UiCure 8:17 OB/&;#&%"7Q
D R A F T May 13, 2009, 5:04pm D R A F T
Fig. 13b. Continued.
by the YSU scheme from WRF in part promotes 40 ppbv ofdaytime O3 mixing ratios during 26–27 July even though pre-dicted temperature at Ijira from WRF is slightly lower thanthat from MM5. The decrease in PBL height and wind speed,as well as more concentrated O3 precursors in the surfacelayer, explain why WRF-CMAQ/27 km better reproduces ob-served daytime O3 maximums during 26–27 July than MM5-CMAQ/27km.
The WRF-CMAQ/27 km simulation significantly im-proves nighttime O3 predictions at Ijira. EANET observa-tions represent air pollutants measured a few meters aboveground. Thus WRF-CMAQ, with a 17 m deep of surfacelayer, better represents the observed vertical level. The WRF-CMAQ simulated mixing ratios of O3 at 180 m are alsoshown in Fig.14. The difference in O3 mixing ratios be-tween the 180-m level and 8-m surface level reveals that thevertical gradient in O3 mixing ratios reaches its maximum atnight. After sunrise, ground-level O3 becomes equal to thatat the 180-m level. This profile suggests that the nighttimeaccumulation of NOx in the stable PBL and deposition pro-cesses have significant impacts on ground-level O3 removalat night. Radiative cooling at night leads to the formation of a
stable surface layer near the ground. Above the stable surfacelayer and under the upper-level inversion, the characteristicsof the atmosphere are relatively uniform; this layer is calledthe nocturnal residual layer. If elevated NO emission sourcessuch as tall industrial smokestacks are not present, O3 mixingratios in the residual layer remain high, since deposition andother removal processes that occur near the surface are absentaloft. This can be observed at three remote sites (Fig.13b–13d). At the rural site Ijira, however, relatively high mixingratios of NOx were observed. Thus ground-level O3 mixingratios at Ijira decrease after sunset to very low values at night-time due to NO titration (NO+O3→NO2+O2) and depositionprocesses, and increase dramatically in the morning, reach-ing a maximum value in the afternoon (01:00–02:00 p.m.).The correlation coefficient between O3 and NOx is −0.84for model results and−0.27 for observations. The nega-tive correlation between O3 and NOx suggests that O3 for-mation at rural Ijira is in the VOC-limited regime. We findthat when nighttime O3 is depleted by NOx titration, simu-lated NOx levels at night are much higher in WRF-CMAQthan the observed values at Ijira. The major sink of NOx atnight is reaction with O3 followed by hydrolysis of N2O5 on
Atmos. Chem. Phys., 9, 3277–3301, 2009 www.atmos-chem-phys.net/9/3277/2009/

M. Lin et al.: Boundary layer ozone over East Asia 3295LIN M. ET AL.: BOUNDARY LAYER OZONE OVER EAST ASIA X - 63
"%"'"("!"$""$%"
)&*+,,-./
&0E; @0E; ?0E; #0E; $$0E; $&0E; $@0E; $?0E; $#0E; %$0E; %&0E; %@0E; %?0E; %#0E;
L8MJ;*NDG:*+04N/
"
'
!
$%
$(
%"
5)7*+,,-./
&0E; @0E; ?0E; #0E; $$0E; $&0E; $@0E; $?0E; $#0E; %$0E; %&0E; %@0E; %?0E; %#0E;
MDs SAAV%"'m .-GV%"'m SAAV)+'m .-GV)+'m .-GV)+'mV!,
"
@""
$"""
$@""
%"""
AOLB*+G/
&0E; @0E; ?0E; #0E; $$0E; $&0E; $@0E; $?0E; $#0E; %$0E; %&0E; %@0E; %?0E; %#0E;
"
@
$"
$@
%"
%@
P4A6$"*+GQ</
"
@
$"
$@
%"
%@
P4A6$"*+GQ</
"
@
$"
$@
%"
%@
P4A6$"*+GQ</
559V)+'m 559V%"'m ^RFV)+'mSa1o!se'i $,%:);< ",%:G>*
S(T
UiCure 8:(7 OB/&;#&%"7Q
D R A F T May 13, 2009, 5:04pm D R A F T
Fig. 13c. Continued.
aerosols. Heterogeneous pathways of N2O5 hydrolysis is aweak part of current atmospheric chemistry models. Inade-quate treatment of N2O5 hydrolysis would in part contributeto the overestimate of nighttime NOx levels. Another possi-ble cause is the fact that EANET observed aged air masses atIjira, with most of the emitted NOx converted to other formsby the time that the air masses were sampled.
The large rate of change in nighttime O3 among five modelsimulations clearly illustrates the contribution of NOx emis-sions intensity and deposition processes to O3 destruction atground level. The artificial dilution of NOx emissions in thecoarse horizontal and/or vertical resolution of MM5-CMAQresults in reduced depletion of O3 through NOx titration atnight. The intensity of NOx titration is also influenced byPBL heights and mixing. For example, the difference innighttime O3 levels between MM5-CMAQ/81km and MM5-CMAQ/27 km simulations amounts to 40 ppbv during 2–3July and 21–23 July. During these periods, the MM5/27kmPBL height is∼500 m lower at nighttime, which causes moreNOx to be trapped near the surface and provokes a higher de-pletion of O3 in CMAQ. Impacts of PBL heights on O3 de-pletion at nighttime can also be examined in the sharp vari-
ations of NOx mixing ratios on a few days as highlighted inFig. 14. The correlation between PBL heights and NOx inthe WRF-CMAQ simulation is−0.85. When the PBL heightis substantially lower than 250 m, NOx increases can reach20 ppbv, which causes the rapid depletion of O3 at groundlevel.
The dry deposition flux of O3 differs considerably betweenMM5-CMAQ and WRF-CMAQ (Fig. 14). Higher PBLheight reflects stronger turbulence and thus may increase drydeposition velocities. For example, the YSU scheme in WRFpredicts slightly higher PBL heights at nighttime on 25–26July than the MRF scheme in MM5, which in part con-tributes to the increasing dry deposition flux of O3. Wanget al.(2008) suggested that dry deposition velocity is one ofmajor discrepancies in model simulations for Asia. The pa-rameterization schemes used in current models have been de-veloped and tested using experimental data obtained in NorthAmerica and Europe, while the deposition processes dependlargely on local conditions. Measurements of dry depositionvelocities for major air pollutants in Asia would be extremelyvaluable in the future to improve the parameterizations inmodel applications for Asia. It would also be valuable to
www.atmos-chem-phys.net/9/3277/2009/ Atmos. Chem. Phys., 9, 3277–3301, 2009
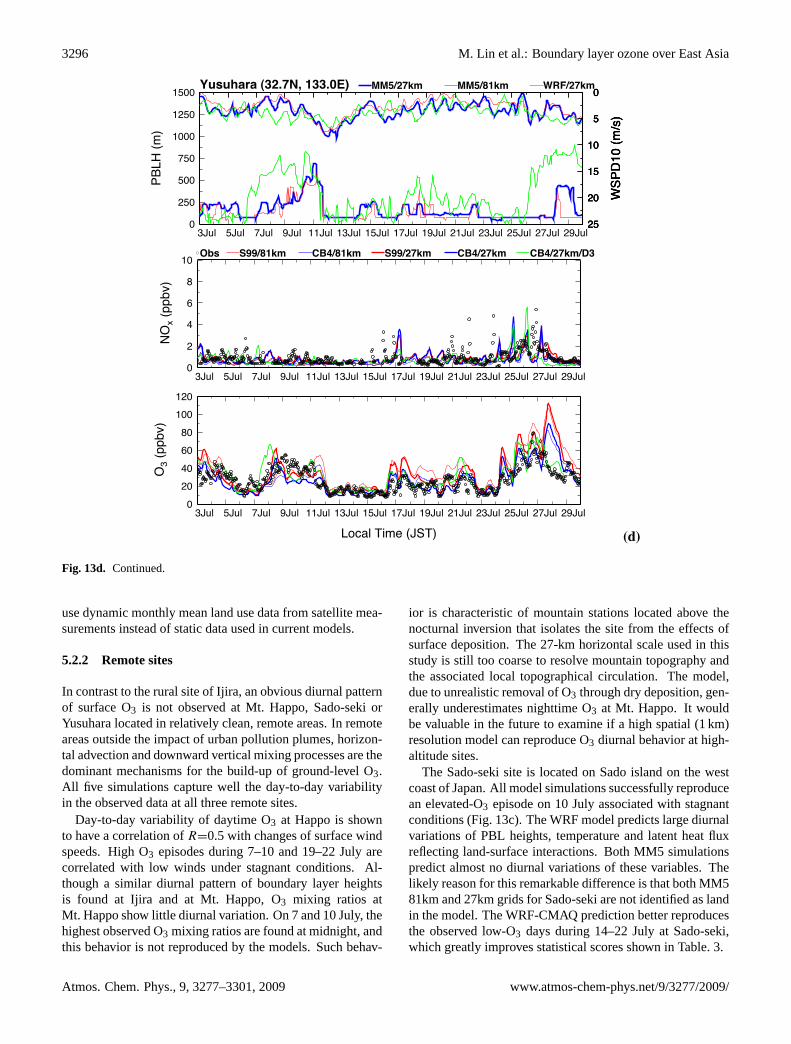
3296 M. Lin et al.: Boundary layer ozone over East AsiaX - 64 LIN M. ET AL.: BOUNDARY LAYER OZONE OVER EAST ASIA
"%"'"("!"$""$%"
)&*+,,-./
&0E; @0E; ?0E; #0E; $$0E; $&0E; $@0E; $?0E; $#0E; %$0E; %&0E; %@0E; %?0E; %#0E;
L8MJ;*NDG:*+04N/
"
%
'
(
!
$"
5)7*+,,-./
&0E; @0E; ?0E; #0E; $$0E; $&0E; $@0E; $?0E; $#0E; %$0E; %&0E; %@0E; %?0E; %#0E;
MDs SAAV%"'m .-GV%"'m SAAV)+'m .-GV)+'m .-GV)+'mV!,
"
%@"
@""
?@"
$"""
$%@"
$@""
AOLB*+G/
&0E; @0E; ?0E; #0E; $$0E; $&0E; $@0E; $?0E; $#0E; %$0E; %&0E; %@0E; %?0E; %#0E;
"
@
$"
$@
%"
%@
P4A6$"*+GQ</
"
@
$"
$@
%"
%@
P4A6$"*+GQ</
"
@
$"
$@
%"
%@
P4A6$"*+GQ</
559V)+'m 559V%"'m ^RFV)+'m`usuJara $,):+;< ",,:=>*
SdT
UiCure 8:d7 O B/&;#&%"7 Q
D R A F T May 13, 2009, 5:04pm D R A F T
Fig. 13d. Continued.
use dynamic monthly mean land use data from satellite mea-surements instead of static data used in current models.
5.2.2 Remote sites
In contrast to the rural site of Ijira, an obvious diurnal patternof surface O3 is not observed at Mt. Happo, Sado-seki orYusuhara located in relatively clean, remote areas. In remoteareas outside the impact of urban pollution plumes, horizon-tal advection and downward vertical mixing processes are thedominant mechanisms for the build-up of ground-level O3.All five simulations capture well the day-to-day variabilityin the observed data at all three remote sites.
Day-to-day variability of daytime O3 at Happo is shownto have a correlation ofR=0.5 with changes of surface windspeeds. High O3 episodes during 7–10 and 19–22 July arecorrelated with low winds under stagnant conditions. Al-though a similar diurnal pattern of boundary layer heightsis found at Ijira and at Mt. Happo, O3 mixing ratios atMt. Happo show little diurnal variation. On 7 and 10 July, thehighest observed O3 mixing ratios are found at midnight, andthis behavior is not reproduced by the models. Such behav-
ior is characteristic of mountain stations located above thenocturnal inversion that isolates the site from the effects ofsurface deposition. The 27-km horizontal scale used in thisstudy is still too coarse to resolve mountain topography andthe associated local topographical circulation. The model,due to unrealistic removal of O3 through dry deposition, gen-erally underestimates nighttime O3 at Mt. Happo. It wouldbe valuable in the future to examine if a high spatial (1 km)resolution model can reproduce O3 diurnal behavior at high-altitude sites.
The Sado-seki site is located on Sado island on the westcoast of Japan. All model simulations successfully reproducean elevated-O3 episode on 10 July associated with stagnantconditions (Fig.13c). The WRF model predicts large diurnalvariations of PBL heights, temperature and latent heat fluxreflecting land-surface interactions. Both MM5 simulationspredict almost no diurnal variations of these variables. Thelikely reason for this remarkable difference is that both MM581km and 27km grids for Sado-seki are not identified as landin the model. The WRF-CMAQ prediction better reproducesthe observed low-O3 days during 14–22 July at Sado-seki,which greatly improves statistical scores shown in Table.3.
Atmos. Chem. Phys., 9, 3277–3301, 2009 www.atmos-chem-phys.net/9/3277/2009/

M. Lin et al.: Boundary layer ozone over East Asia 3297
Table 3. Statistics for hourly mixing ratios of ground-level O3 in July 2001
Sites Statisticsa SAPRC99/81km CB4/81 km SAPRC99/27 km CB4/27 km CB4/27 kmMM5-CMAQ MM5-CMAQ MM5-CMAQ MM5-CMAQ WRF-CMAQ
Tappi R 0.43 0.42 0.41 0.41 0.53MB 9.6 2.5 2.9 −3.3 −1.9RMSE 17.4 11.9 15.4 12.7 11.7
Sado-seki R 0.43 0.45 0.47 0.50 0.56MB 28.3 16.4 17.2 7.3 3.7RMSE 34.7 23.3 22.8 14.8 12
Happo R 0.48 0.48 0.50 0.52 0.58MB 4.5 −5.6 −3.4 −11.5 −9.3RMSE 18.3 16.6 14.8 17.4 16
Ijira R 0.43 0.47 0.51 0.56 0.68MB 27.1 16.5 18.1 3.3 3.3RMSE 38.1 29.6 30 23.9 21.3
Oki R 0.21 0.19 0.43 0.42 0.43MB 27.2 16.6 14.2 5.9 11.1RMSE 32.1 22.6 21.2 14.9 18.2
Yusuhara R 0.64 0.66 0.62 0.62 0.71MB 12.3 4.2 8.2 1.0 5.6RMSE 19 12.2 17.9 13 12.1
a Unit for MB andRMSEis ppbv.
Evolution of the boundary layer at Yusuhara is quite dif-ferent from that at the other three sites (Fig.13d). The PBLheight at Yusuhara remains lower than 500 m, except dur-ing 7–10 and 25–27 July when O3 mixing ratios also exhibithigher values than on other days. The positive correlationbetween ground-level O3 and PBL height indicates the influ-ence of vertical transport of pollutants aloft down into thesurface layer. During 25–27 July, photochemical produc-tion, as indicated by high NOx mixing ratios, partly explainsthe high levels of surface O3 in this period. Four MM5-CMAQ simulations systematically overpredict the observedO3 during 27–28 July, while the WRF-CMAQ prediction re-produces the observed values well. We find that surface windspeed during 27–28 July from WRF is approximately 3 m/shigher than that from MM5, which helps the ventilation ofground-level O3 at Yusuhara from the boundary layer. TheMM5-CMAQ overprediction of O3 during these two days islikely caused by errors in surface winds from MM5.
6 Conclusions
This study employs the CMAQ regional model to examinespatial and temporal variations of boundary layer O3 overEast Asia. We have evaluated the response of model simula-
tions of boundary layer O3 and key photochemical oxidantsto the choice of chemical mechanisms, meteorological fields,boundary conditions, and model resolutions. Although mea-surement data are relatively scarce in Asia, we have usedavailable ground-based measurements, aircraft observationsobtained from the TRACE-P campaign and satellite datato advance understanding of O3 chemistry and mechanismsover East Asia and evaluate how well the model representsthe observed features.
Boundary conditions of long-lived species exert a great in-fluence on regional model output. Global model BCs tend toprovide more realistic spatial and temporal variations of pol-lution inflow, but might introduce bias as well. We demon-strated that a simple measurement correction of BCs fromthe MOZART global model systematically improves CMAQperformance near the domain boundaries. Correcting zonalflux with vertical profiles from ozonesonde stations world-wide is recommended for future studies. Regional modelersshould choose a global chemistry model driven with assimi-lated meteorology. In the future, we would benefit from op-timal global chemistry model results with the assimilation oflarge-scale satellite observations of chemical species. Futuredevelopment in regional models needs to strengthen the cou-pling between global and regional models, in particular, thetreatment of top boundary conditions.
www.atmos-chem-phys.net/9/3277/2009/ Atmos. Chem. Phys., 9, 3277–3301, 2009
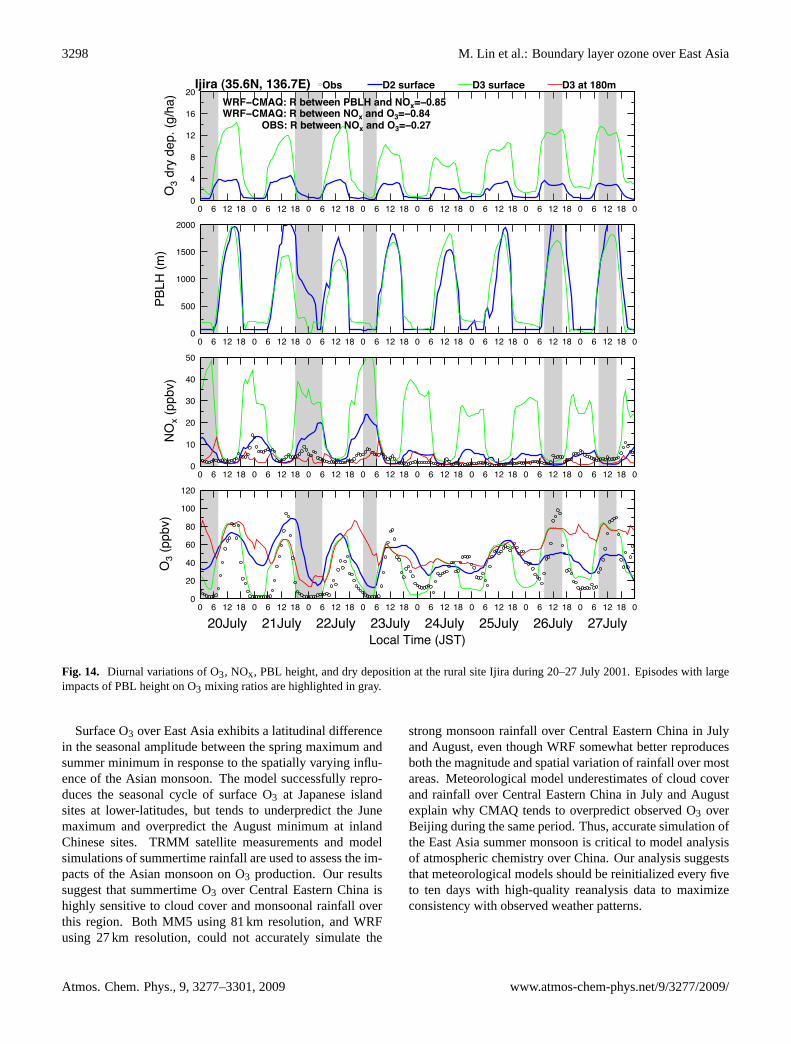
3298 M. Lin et al.: Boundary layer ozone over East AsiaLIN M. ET AL.: BOUNDARY LAYER OZONE OVER EAST ASIA X - 65
"
%"
'"
("
!"
$""
$%"
)&*+,,-./
" ( $% $! " ( $% $! " ( $% $! " ( $% $! " ( $% $! " ( $% $! " ( $% $! " ( $% $! "
%"0E;R %$0E;R %%0E;R %&0E;R %'0E;R %@0E;R %(0E;R %?0E;RL8MJ;*NDG:*+04N/
"
$"
%"
&"
'"
@"
5)7*+,,-./
" ( $% $! " ( $% $! " ( $% $! " ( $% $! " ( $% $! " ( $% $! " ( $% $! " ( $% $! "
"
@""
$"""
$@""
%"""
AOLB*+G/
" ( $% $! " ( $% $! " ( $% $! " ( $% $! " ( $% $! " ( $% $! " ( $% $! " ( $% $! "
"
'
!
$%
$(
%"
)&*9=R*9:,>*+SQIJ/
" ( $% $! " ( $% $! " ( $% $! " ( $% $! " ( $% $! " ( $% $! " ( $% $! " ( $% $! "
^RF!.5PYa R DetUeen Q-TR an1 ;M&@!=:%9^RF!.5PYa R DetUeen ;M& an1 M,@!=:%G
M-Sa R DetUeen ;M& an1 M,@!=:)+
MDs !) surba3e !, surba3e !, at "%=m[Oira $,9:F;< ",F:+>*
UiCure 8;7 5#%+&,0 6,+#,;#/&< /C 33( R3x( VW' @"#U@;( ,&7 7+$ 7"T/<#;#/& ,; ;@" +%+,0 <#;" L\#+, 7%+#&U
S%0$ 4KI4J( 4KK)9 ET#</7"< 1#;@ 0,+U" #FT,-;< /C VW' @"#U@; /& 33 F#Y#&U +,;#/< ,+" @#U@0#U@;"7 #&
U+,$9
D R A F T May 13, 2009, 5:04pm D R A F T
Fig. 14. Diurnal variations of O3, NOx, PBL height, and dry deposition at the rural site Ijira during 20–27 July 2001. Episodes with largeimpacts of PBL height on O3 mixing ratios are highlighted in gray.
Surface O3 over East Asia exhibits a latitudinal differencein the seasonal amplitude between the spring maximum andsummer minimum in response to the spatially varying influ-ence of the Asian monsoon. The model successfully repro-duces the seasonal cycle of surface O3 at Japanese islandsites at lower-latitudes, but tends to underpredict the Junemaximum and overpredict the August minimum at inlandChinese sites. TRMM satellite measurements and modelsimulations of summertime rainfall are used to assess the im-pacts of the Asian monsoon on O3 production. Our resultssuggest that summertime O3 over Central Eastern China ishighly sensitive to cloud cover and monsoonal rainfall overthis region. Both MM5 using 81 km resolution, and WRFusing 27 km resolution, could not accurately simulate the
strong monsoon rainfall over Central Eastern China in Julyand August, even though WRF somewhat better reproducesboth the magnitude and spatial variation of rainfall over mostareas. Meteorological model underestimates of cloud coverand rainfall over Central Eastern China in July and Augustexplain why CMAQ tends to overpredict observed O3 overBeijing during the same period. Thus, accurate simulation ofthe East Asia summer monsoon is critical to model analysisof atmospheric chemistry over China. Our analysis suggeststhat meteorological models should be reinitialized every fiveto ten days with high-quality reanalysis data to maximizeconsistency with observed weather patterns.
Atmos. Chem. Phys., 9, 3277–3301, 2009 www.atmos-chem-phys.net/9/3277/2009/
M. Lin et al.: Boundary layer ozone over East Asia 3299
Examination of hourly summertime O3 mixing ratios fromsites in Japan confirms the important role of diurnal boundarylayer fluctuations in controlling ground-level O3. By com-paring five different model configurations with observationsat six sites, the specific mechanisms responsible for modelbehavior are identified and discussed. In particular, verticalmixing, NOx titration, and dry deposition depending on PBLheight strongly affect model ability to capture observed be-havior. Lower PBL height enhances the build-up of ground-level O3 during daytime, but causes a more complete deple-tion of O3 by NOx titration at night. A large vertical gra-dient of boundary layer O3 is found over rural and urban ar-eas. Our analysis demonstrates clear benefits of using a high-resolution model in evaluating transport and chemical trans-formation of Asian pollutants. The WRF-CMAQ simulationusing 27 km horizontal scale and 29 vertical layers gives thebest statistical scores in evaluating the day-to-day and diurnalvariations of ground-level O3. Future studies should ensurethat model vertical resolution is adequate to resolve near sur-face chemical processes and land-surface interactions. Sur-face layer depth less than 20 m is recommended to better rep-resent measured conditions of ground-based stations.
Central Eastern China appears to be the most sensitiveregion in our study to the choice of chemical mechanisms.Evaluation with TRACE-P aircraft measurements revealsthat neither the CB4 nor the SAPRC99 mechanisms con-sistently capture observed behavior of key photochemicaloxidants in springtime. However, our analysis finds thatSAPRC99 performs somewhat better in simulating mixingratios of H2O2 and PAN at flight altitudes below 1 km. TheCB4 mechanism overpredicts H2O2 by a factor of two, whichis caused by higher self-reaction rates of HO2. SAPRC99predicts 50% higher PAN, because more PAN analoguesand a lower decomposition rate of PAN are considered inSAPRC99 than in CB4. The overall higher load of VOC, ex-plicit organic peroxy radicals, and inclusion of radical recy-cling processes explain why SAPRC99 predicts 10–20 ppbvhigher O3 during summertime for Central Eastern China anddownwind areas. Our findings suggest that future modelstudies over this region should carefully examine chemistrysensitivities, especially in regulatory applications – such asthe design of emission control policies. Between CB4 andSAPRC99, the more detailed SAPRC99 mechanism is sug-gested for future studies examining high-O3 episodes, theimpacts of large releases of precursors, and multi-day effects.
Improvements of regional atmospheric chemistry modelswill require efforts in reducing uncertainty in emissions, me-teorology, photochemistry, and global pollution inflow. Thehigh level of uncertainty associated with O3 production inCentral Eastern China poses a major problem for regionalair quality management. This highly polluted, densely pop-ulated region would greatly benefit from comprehensive airquality monitoring and the development of model chemicalmechanisms appropriate to this unique atmospheric environ-ment.
Acknowledgements.Meiyun Lin and Tracey Holloway weresupported on this work by NASA Grant NNX07AL36G. Theauthors appreciate EANET, Tao Wang and Pakpong Pochanart forproviding surface measurement data in Japan, at Lin’an, and atMondy, respectively. We also thank Louisa Emmons for providingthe MODIS fire count data. We are grateful to co-editor OwenCooper, two anonymous reviewers, Erica Bickford, Scott Spakand Eungul Lee for helpful comments in improving this manuscript.
Edited by: O. Cooper
References
Arnold, J. and Dennis, R. L.: Testing CMAQ chemistry sensitivitiesin base case and emissions control runs at SEARCH and SOS99surface sites in the southeastern US, Atmos. Environ., 40, 5027–5040, doi:10.1016/j.atmosenv.2005.05.055, 2006.
Byun, D. W. and Ching, J. K. S. (Eds.): Science algorithms of theEPA models-3 community multi-scale air quality (CMAQ) mod-eling system, NERL, Research Triangle Park, NC, USA, 1999.
Byun, D. W. and Schere, K. L.: Review of the governing equations,computational algorithms, and other components of the Models-3 Community Multiscale Air Quality (CMAQ) modeling system,Appl. Mech. Rev., 59, 51–77, 2006.
Carmichael, G. R., Ferm, M., and Thongboonchoo, N., et al.:Measurements of sulfur dioxide, ozone and ammonia concen-trations in Asia, Africa, and South America using passive sam-plers, Atmos. Environ., 37, 1293–1308, doi:10.1016/S1352-2310(02)01009-9, 2003a.
Carmichael, G. R., Tang, Y., and Kurata, G., et al.: Evaluatingregional emission estimates using the TRACE-P observations,J. Geophys. Res. 108(D21), 8810, doi:10.1029/2002JD003116,2003b.
Carmichael, G. R., Tang, Y. and Kurata, G. et al.: Regional-scalechemical transport modeling in support of the analysis of obser-vations obtained during the TRACE-P experiment. J. Geophys.Res. 108(D21), 8823, doi:10.1029/2002JD003117, 2003c.
Carter, W.: Implementation of the saprc-99 chemical mechanisminto the models-3 framework. Report to the United States Envi-ronmental Protection Agency, 29 January, 2000.
Ding, A. and Wang, T.: Influence of stratosphere-to-troposphereexchange on the seasonal cycle of surface ozone at MountWaliguan in western China. Geophys. Res. Lett., 33(3), 1–4,doi:10.1029/2005GL024760, 2006.
Ding, A. J., Wang, T., Thouret, V., Cammas, J.-P., Nedelec, P.: Tro-pospheric ozone climatology over Beijing: analysis of aircraftdata from the MOZAIC program, Atmos. Chem. Phys., 8(1), 1–13, 2008.
EANET: Data Report on the Acid Deposition in the East AsianRegion, 2001–2007, available at:http://www.eanet.cc/product.html, Network Center for EANET, 2008.
Fan, J. W., Zhang, R. Y., Li, G. H., Nielsen-Gammon,J., and Li, Z. Q. Simulations of fine particulate matter(PM2.5) in Houston, Texas, J. Geophys. Res., 110, D16203,doi:10.1029/2005JD005805, 2005.
Faraji, M., Kimura, Y., McDonald-Buller, E., and Allen, D.: Com-parison of the carbon bond and SAPRC photochemical mecha-nisms under conditions relevant to southeast texas, Atmos. Env-
www.atmos-chem-phys.net/9/3277/2009/ Atmos. Chem. Phys., 9, 3277–3301, 2009
3300 M. Lin et al.: Boundary layer ozone over East Asia
iron., 42 (23), 5821–5836, doi:10.1016/j.atmosenv.2007.07.048,2008.
Fiore, A. M., Dentener, F. and Wild, O., et al.: Muti-model estimates of intercontinental source-receptor relation-ships for ozone pollution. J. Geophys. Res., 114, D04301,doi:10.1029/2008JD010816, 2008.
Fishman, J., Ramanathan, V., Crutzen, P. J., and Liu, S. C.: Tropo-spheric ozone and climate, Nature 282, 818–820, 1979.
Fu, T.-M., Jacob, D. J., Palmer, P. I., Chance, K., Wang,Y. X., Barletta, B., Blake, D. R., Stanton, J. C., and Pilling,M. J.: Space-based formaldehyde measurements as constraintson volatile organic compound emissions in east and south Asiaand implications for ozone, J. Geophys. Res. 112, D06312,doi:10.1029/2006JD007853, 2007.
Gery, M., Whitten, G. Z., Killus, J. P., and Dodge, M. C.: A photo-chemical kinetics mechanism for urban and regional scale com-puter modeling. J. Geophys. Res. 94 (D10), 12925–12956, 1989.
Guenther, A., Karl, T., Harley, P., Wiedinmyer, C., Palmer, P. I.,and Geron, C.: Estimates of global terrestrial isoprene emissionsusing megan (model of emissions of gases and aerosols from na-ture), Atmos. Chem. Phys., 6(11), 3181–3210, 2006.
Han Z., Sakurai T., and Ueda H. et al.: MICS-Asia II:Model intercomparison and evaluation of ozone and rel-evant species, Atmos. Environ., 42(15), 3491–3509,doi:10.1016/j.atmosenv.2007.07.031, 2007.
He, Y. J., Uno, I., Wang, Z. F., Pochanart, P., Li, J., and Akimoto,H.: Significant impact of the east asia monsoon on ozone sea-sonal behavior in the boundary layer of eastern china and thewest pacific region, Atmos. Chem. Phys., 8(4), 14927–14955,http://www.atmos-chem-phys.net/8/7543/2008/, 2008.
Holloway T., Sakurai, T., and Han, Z., et al. MICS-Asia II: Impactsof global emissions on regional air quality in Asia, Atmos. Env-iron., 42(15), 3543–3561, doi:10.1016/j.atmosenv.2007.10.022,2007.
Horowitz, L. W., Walters, S., Mauzerall, D. L., Emmons, L. K.,Rasch, P. J., Granier, C., Tie, X. X., Lamarque, J. F., Schultz,M. G., Tyndall, G. S., Orlando, J. J., and Brasseur, G. P.: A globalsimulation of tropospheric ozone and related tracers: Descrip-tion and evaluation of MOZART, version 2, J. Geophys. Res.,108(D24), 4784, doi:10.1029/2002JD002853, 2003.
Huffman, G. J., Adler, R. F., Bolvin, D. T., Gu, G., Nelkin, E. J.,Bowman, K. P., Hong, Y., Stocker, E. F., and Wolff, D. B.:The TRMM multi-satellite precipitation analysis: Quasi-global,multi-year, combined-sensor precipitation estimates at fine scale,J. Hydrometeor., 8(1), 38–55, 2007.
Jacob, D. J.: Introduction to Atmospheric Chemistry. PrincetonUniversity Press, Princeton, New Jersey, USA, 231–232, 1999.
Jacob, D. J., Crawford, J. H., Kleb, M. M., Connors, V. S., Bendura,R. J., Raper, J. L., Sachse, G. W., Gille, J. C., Emmons, L., andHeald, C. L.: Transport and Chemical Evolution over the Pacific(TRACE-P) aircraft mission: Design, execution, and first results,J. Geophys. Res. 108(D20), 1–19, doi:10.1029/2002JD003726,2003.
Kim, J., Lee, H., and Lee, S.: The characteristics of troposphericozone seasonality observed from ozone soundings at Pohang,Korea, Environ. Monitor. Assess., 118, 1–12, 2006.
Lee, E., Chase, T. N., and Rajagopalan, B.: Seasonal forcasting ofEast Asian summer monsoon based on oceanic heat sources, Int.J. Climatol., 28, 667–678, 2008.
Lefer, B. L., Shetter, R. E., Hall, S. R., Crawford, J. H., and Olson,J. R. Impact of clouds and aerosols on photolysis frequenciesand photochemistry during TRACE-P: 1. analysis using radia-tive transfer and photochemical box models, J. Geophys. Res.,108(D2), 8821, doi:10.1029/2002JD003171, 2003.
Li, J., Wang, Z., Akimoto, H., Gao, C., Pochanart, P., andWang, X.: Modeling study of ozone seasonal cycle in lowertroposphere over east Asia, J. Geophys. Res., 112, D22S25,doi:10.1029/2006JD008209, 2007.
Lin, M., Oki, T., Holloway, T., Streets, D. G., Bengts-son, M., and Kanae, S.: Long-range transport of acidi-fying substances in East Asia – Part I: Model evaluationand sensitivity studies, Atmos. Environ., 42(24), 5939–5955,doi:10.1016/j.atmosenv.2008.04.008, 2008a.
Lin, M., Oki, T., Bengtsson, M., Kanae, S., Holloway, T., andStreets, D. G.: Long-range transport of acidifying substancesin Asia – Part II: Source-receptor relationships, Atmos. Env-iron., 42(24), 5956–5967, doi:10.1016/j.atmosenv.2008.03.039,2008b.
Lin, W., Xu, X., Zhang, X., Tang, J.: Contributions of pollutantsfrom North China Plain to surface ozone at the ShangdianziGAW station, Atmos. Chem. Phys., 8, 5889–5898, 2008c.
Liu, H., Crawfordi, J. H., and Pierce, R. B. et al.: Radiativeeffect of clouds on tropospheric chemistry in a global three-dimensional chemical transport model, J. Geophys. Res., 111,D20303, doi:10.1029/2005JD006403, 2006.
Liu, H. Y., Jacob, D. J., Chan, L. Y., Oltmans, S. J., Bey, I., Yan-tosca, R. M., Harris, J. M., Duncan, B. N., Martin, R. V. Sourcesof tropospheric ozone along the Asian Pacific Rim: An analysisof ozonesonde observations, J. Geophys. Res. 107(D21), 4573,doi:10.1029/2001JD002005, 2002.
Luecken, D. J., Phillips, S., Sarwar, G., and Jang, C.: Effectsof using the CB05 vs. SAPRC99 vs. CB4 chemical mech-anism on model predictions: Ozone and gas-phase photo-chemical precursor concentrations, Atmos. Environ., 42(23),doi:10.1016/j.atmosenv.2007.08.056, 2007.
Ma, J., Zheng, X., and Xu, X.: Comment on “Why does sur-face ozone peak in summertime at Waliguan?” Zhu, B., Aki-moto, H., and Wang, Z., et al., Geophys. Res. Lett. 32, L01805,doi:10.1029/2004GL021683, 2005.
Ma, J., Zhou, X., and Hauglustaine, D.: Summertime troposphericozone over China simulated with a regional chemical transportmodel, 2. source contributions and budget, J. Geophys. Res.,107(D22), 4612, doi:10.1029/2001JD001355, 2002.
Moxim II, W. J., H. L., and Kasibhatla, P. S.: Simulated globaltropospheric PAN: Its transport and impact on NOx. J. Geophys.Res., 101(D7), 12621–12638., 1996.
Naja, M. and Akimoto, H. :Contribution of regional pollution andlong-range transport to the Asia-Pacific region: Analysis oflong-term ozonesonde data over Japan, J. Geophys. Res., 109,D21306, doi:10.1029/2004JD004687, 2004.
Richter, A., Burrows, J. P., Nuss, H., Granier, C., and Niemeier, U.Increase in tropospheric nitrogen dioxide over China observedfrom space, Nature, 437(7055), 129–132, 2005.
Sarwar, G., Luecken, D., Yarwood, G., Whitten, G., Carter, W.:Impact of an updated carbon bond mechanism on predictionsfrom the community multiscale air quality modeling system: pre-liminary assessment, J. Appl. Meteorol. Climatol., 47(1), 3–14,doi:10.1175/2007JAMC1393.1, 2008.
Atmos. Chem. Phys., 9, 3277–3301, 2009 www.atmos-chem-phys.net/9/3277/2009/
M. Lin et al.: Boundary layer ozone over East Asia 3301
Streets, D. G., Bond, T. C., Carmichael, G. R., Fernandes, S. D.,Fu, Q., He, D., Klimont, Z., Nelson, S. M., Tsai, N. Y., Wang,M. Q., Woo, J. H., and Yarber, K. F.: An inventory of gaseous andprimary aerosol emissions in Asia in the year 2000. J. Geophys.Res., 108(D21), 8809, doi:10.1029/2002JD003093, 2003.
Tang Y. and Carmichael, G. R. and Thongboonchoo, N. et al.: Influ-ence of lateral and top boundary conditions on regional air qual-ity prediction: A multiscale study coupling regional and globalchemical transport models, J. Geophys. Res., 112, D10S18,doi:10.1029/2006JD007515, 2007.
van der Werf, G. R., Randerson, J. T., Giglio, L., Collatz, G. J.,Kasibhatla, P. S., and Arellano, A. F.: Interannual variability inglobal biomass burning emissions from 1997 to 2004, Atmos.Chem. Phys., 6, 3423–3441, 2006,http://www.atmos-chem-phys.net/6/3423/2006/.
Wang, Y., McElroy, M. B., Munger, J. W., Hao, J., Ma, H., Nielsen,C. P., and Chen, Y.: Variations of O3 and CO in summertime ata rural site near beijing, Atmos. Chem. Phys., 8(21), 6355–6363,2008.
Wang, Z., Li, J., Wang, X., Pochanart, P., and Akimoto, H.: Mod-eling of regional high ozone episode observed at two mountainsites (Mt. Tai and Huang) in east China, J. Atmos. Chem., 55,253–272, 2006.
Wang, Z., Xie, F., and Sakurai, T., et al.: MICS-ASIA II: Modelinter-comparison and evaluation of acid deposition. Atmos. Env-iron., 42(15), 3528–3542, doi:10.1016/j.atmosenv.2007.12.071,2008.
Xu, X., Lin, W., Wang, T., Yan, P., Tang, J., Meng, Z., and Wang, Y.:Long-term trend of surface ozone at a regional background sta-tion in eastern China 1991–2006: enhanced variability, Atmos.Chem. Phys., 8(10), 2595–2607, 2008.
Yamaji, K., Ohara, T., Uno, I., Tanimoto, H., Kurokawa, J., andAkimoto, H.: Analysis of the seasonal variation of ozone inthe boundary layer in East Asia using the Community Multi-scale Air Quality model: What controls surface ozone levels overJapan?, Atmos. Environ., 40(10), 1856–1868, 2006.
Yarwood, G., Stoeckenius, T. E., Heiken, J. G., and Dunker, A. M.:Modeling weekday/weekend ozone differences in the Los Ange-les region for 1997, J. Air Waste Manage. Assoc., 53, 864–875,2003.
Zaveri, R. A. and Peters, L. K. A new lumped structure photochem-ical mechanism for large-scale applications, J. Geophys. Res.,104(D23), 30387–30415, 1999.
Zhang M. G., Uno, I., Carmichael, G. R., et al.: Large-scale struc-ture of trace gas and aerosol distributions over the western Pa-cific Ocean during the Transport and Chemical Evolution Overthe Pacific (TRACE-P) experiment, J. Geophys. Res., 108(D21),doi:10.1029/2002JD002946, 2003.
Zhao, C., Wang, Y., and Zeng, T.: East china plains: A “basin” ofozone pollution, Environ. Sci. Technol., 43(6), 1911–1915, 2009.
Zhu, B., Akimoto, H., Wang, Z., Sudo, K., Tang, J., and Uno,I. Why does surface ozone peak in summertime at Waliguan?,Geophys. Res. Lett., 31(17), 1–4, doi:10.1029/2004GL020609,2004.
www.atmos-chem-phys.net/9/3277/2009/ Atmos. Chem. Phys., 9, 3277–3301, 2009