multi-methodological investigation of kunzite, hiddenite, alexandrite, elbaite and topaz, based on...
TRANSCRIPT

ORIGINAL PAPER
Multi-methodological investigation of kunzite, hiddenite,alexandrite, elbaite and topaz, based on laser-induced breakdownspectroscopy and conventional analytical techniquesfor supporting mineralogical characterization
Manuela Rossi • Marcella Dell’Aglio • Alessandro De Giacomo •
Rosalba Gaudiuso • Giorgio Saverio Senesi • Olga De Pascale •
Francesco Capitelli • Fabrizio Nestola • Maria Rosaria Ghiara
Received: 6 May 2013 / Accepted: 27 September 2013
� Springer-Verlag Berlin Heidelberg 2013
Abstract Gem-quality alexandrite, hiddenite and kunzite,
elbaite and topaz minerals were characterized through a
multi-methodological investigation based on EMPA-WDS,
LA-ICP-MS, and laser-induced breakdown spectroscopy
(LIBS). With respect to the others, the latter technique
enables a simultaneous multi-elemental composition
without any sample preparation and the detection of light
elements, such as Li, Be and B. The criteria for the choice
of minerals were: (a) the presence of chromophore ele-
ments in minor contents and/or as traces; (b) the presence
of light lithophile elements (Li, Be and B); (c) different
crystal chemistry complexity. The results show that LIBS
can be employed in mineralogical studies for the identifi-
cation and characterization of minerals, and as a fast
screening method to determine the chemical composition,
including the chromophore and light lithophile elements.
Keywords Laser-induced breakdown spectroscopy �Chemical analysis � Light lithophile elements �Chromophore elements
Introduction
In allochromatic minerals, minor and trace chemical
components are commonly associated with the presence of
color, and, from the gemological point of view, they are
also responsible for the difference between a common
mineral and a gemstone. Metal ions from the first row of
transition elements in the periodic table, especially Ti, V,
Cr, Mn, Fe, and Cu, are the most important causes of color
in oxides and silicate gemstones (Mattson and Rossman
1987a; Fritsch and Rossman 1988). In particular, V3?,
Cr3?, Mn3?, and Cu2? can produce strong colorations
when present at concentrations of tenths of wt%. Color is
due to electronic transitions involving only the electrons in
the d-orbitals. When present by themselves, Fe2?, Fe3?,
and Mn2? must have high concentrations to be able to
cause significant color (Rossman 2009). Instead, interva-
lence charge transfer (IVCT) interactions, involving an
electron exchange between two cations with different
valences (for example, Fe2? and Fe3?, or Fe2? and Ti4?),
are a major source of color in gems and require only a
small amount of the interacting couple to produce intense
color (Mattson and Rossman 1987b; Rossman 2009). For
instance, most tourmaline gems owe their color to Fe2?
(blue tourmalines), Fe3?, Fe2?–Ti4? IVCT (green), Mn3?
M. Rossi (&) � M. R. Ghiara
Department of Earth Sciences, University of Naples ‘‘Federico
II’’, Via Mezzocannone 8, 80134 Naples, Italy
e-mail: [email protected]
M. Dell’Aglio � A. De Giacomo � R. Gaudiuso �G. S. Senesi � O. De Pascale
Institute of Inorganic Methodologies and Plasmas-CNR,
U.O.S Bari, Via Amendola 122/D, 70126 Bari, Italy
A. De Giacomo � R. Gaudiuso
Department of Chemistry, University of Bari, Via Orabona 4,
70126 Bari, Italy
F. Capitelli
Institute of Crystallography-CNR, Via Salaria Km 29.300,
00016 Monterotondo, Rome, Italy
F. Nestola
Department of Geosciences, University of Padua,
Via Gradenigo 6, 35131 Padua, Italy
M. R. Ghiara
Royal Mineralogical Museum, Museum Centre of Natural
and Physical Sciences, University of Naples ‘‘Federico II’’,
Via Mezzocannone 8, 80134 Naples, Italy
123
Phys Chem Minerals
DOI 10.1007/s00269-013-0631-3
(pink), Mn2?–Ti4? IVCT (yellow), or a combination of
these factors (Pezzotta and Laurs 2011). In addition, such
elements can also provide a ‘‘fingerprint’’ for determining
the provenance of the gemstone. The amount of minor and
trace elements that are incorporated will depend on local
geologic conditions, such as temperature, redox conditions,
and, especially, chemistry (Rossman 2009).
It is also well-known that data about trace elements are
essential for modeling processes such as crystal fractionation,
assimilation, or hydrothermal reworking. In particular, small
differences in element partitioning within minerals allow for
the identification of different geological processes. For
instance, during fractionation processes (London 1986, 1992;
Evensen and London 2002), Li and Be are routinely used as
tracers for magmatic processes (Seitz and Woodland 2000).
Li, Be and B are also considered as important geochemical
tracers for fluids (Henley et al. 1984; Fabre et al. 2002;
Hinsberg et al. 2011). The presence of trace and light litho-
phile elements in gemstones can also be used to discriminate
between natural and synthetic samples, as well as to obtain
information on the methodology of synthesis (Schmetzer
1989, 2008; Shigley and McClure 2009).
In this context, the use of different analytical techniques to
characterize and identify the minerals through chemical
analysis plays a crucial role. The minor and trace elements
(including Li, Be and B) are usually determined using dif-
ferent conventional analytical (destructive and micro-
destructive) techniques, such as electron microprobe ana-
lysis–wavelength-dispersive spectrometry (EMPA-WDS),
laser-ablation inductively-coupled plasma mass spectrome-
try (LA-ICP-MS) or secondary ion mass spectrometry
(SIMS), but to obtain a complete quantitative analysis of all
the elements composing the minerals, in many cases the
contemporary use of more than one technique becomes
necessary. The complete characterization of the mineral
sample can then become time-consuming and expensive. A
simple tool for a fast elemental analysis and preliminary
classification of samples would be extremely useful for
planning further analytical strategies, as well as for sup-
porting crystallographic study. In this frame, laser-induced
breakdown spectroscopy (LIBS) can play an important role
(Beesley 2009; De Giacomo et al. 2012). LIBS is the optical
emission spectroscopy of the plasma induced by laser-matter
interaction (Cremers and Radziemski 2006; Miziolek et al.
2006; Hahn and Omenetto 2010). The advantages of LIBS,
from the analytical point of view, were demonstrated in
several fields, including cultural heritage (Giakoumaki et al.
2007; De Giacomo et al. 2008), soils (Capitelli et al. 2002;
Senesi et al. 2009; Dell’Aglio et al. 2011), rocks (Colao et al.
2004; Salle et al. 2006; Lazic et al. 2007; Tucker et al. 2010),
meteorites (Dell’Aglio et al. 2010), minerals (McMillan
et al. 2006; McManus et al. 2008; Death et al. 2009; Diaz
Pace et al. 2011; Breeding et al. 2011), and space exploration
(Knight et al. 2000; Whitehouse et al. 2001; Salle et al.
2005a; Maurice et al. 2012; Wiens et al. 2012). These
advantages are: no sample treatment required; almost com-
plete non-destructiveness (few tens of ng ablated per shot);
possibility of simultaneous determination of all the elements
(including light atoms); fast response and low-cost set-up;
detection limits in the order of or lower than ppm. Moreover,
when trace element quantification is not crucial, analytical
LIBS measurements can be performed without standards,
with the so-called calibration-free methods (Ciucci et al.
1999), which rely on the following two assumptions: (1) that
the laser-ablated material is in a plasma phase in near-equi-
librium conditions; and (2) that the plasma itself has the same
composition as the irradiated sample. The calibration-free
approaches do not enable the same accuracy of classical
methods with calibration curves, but they can provide
valuable preliminary and fast information about the com-
position when matrix-matched standards are not readily
available, as in the case of minerals.
In this work, LIBS in the calibration-free approach was
applied to crystals of alexandrite (BeAl2O4), hiddenite and
kunzite (LiAlSi2O6), elbaite (Na[Li,Al]3Al6[BO3]3-
Si6O18[OH]4) and topaz (Al2SiO4[F,OH]2), in order to test the
feasibility of the technique in mineralogy. LIBS results were
compared with those obtained with conventional character-
ization techniques, i.e. EMPA-WDS and LA-ICP-MS.
Experimental methods
Materials
All the samples are located at the collection of the Royal
Mineralogical Museum (RMM) from the Centro Musei
delle Scienze Naturali, University of Naples Federico II,
Naples (Italy). The alexandrite sample, a variety of
chrysoberyl, is reported in the RMM catalogue from 1885
(catalogue number: c.n. 17843-E6374) and comes from the
Tokowaya River mines in Ekatherinburg, in the Ural
mountains, a historical locality where the first ‘‘alexandrite
gemstone’’ was collected in 1833. As for the two varieties
of spodumenes, the hiddenite specimen (c.n. 24309) was
collected at Stony Point, North Carolina, USA, whereas the
kunzite (c.n. 2229) comes from Teofilo, Otono, Brazil. The
elbaite (c.n. 22255), the tourmaline group minerals
(XY3Z6[T6O18][BO3]3V3W), was collected in Minas Ge-
rais, Brasil. The topaz sample (c.n. C3693-9070) comes
from Aduncilon, Siberia.
Chemistry: conventional analytical techniques
Quantitative chemical analyses of major and minor ele-
ments were performed with an electron microprobe in
Phys Chem Minerals
123

wavelength dispersive mode (EPMA-WDS) Cameca SX50
(IGAG-CNR, Rome), operating at 15 kV and 15 nA with a
beam diameter 10 lm. For topaz, chrysoberyl, spodumene
and tourmaline samples, the following natural and syn-
thetic materials were used as standards: phlogopite for F
(TAP crystal; Ka); wollastonite for Ca (PET; Ka) and Si
(TAP; Ka); jadeite for Na (TAP; Ka); magnetite for Fe
(LIF; Ka); pericline for Mg (TAP; Ka); orthoclase for
K (PET; Ka); corundum for Al (TAP; Ka); Mn (metallic)
for Mn (LIF; Ka); rutile for Ti (PET; Ka). For alexandrite
and spodumene, Cr (metallic) for Cr (PET; Ka) was also
used. The data were corrected using the PAP program
(Pouchou and Pichoir 1991). Analytical measurements are
affected by a relative uncertainty of 1 % for major ele-
ments, and 5 % for minor elements. For hydrated samples,
the H2O concentration was calculated by the stoichiometry
balance. At least ten analysis points were measured for
each sample.
Quantitative chemical analyses of trace elements and Li,
B and Be were carried out at the Institute of Geosciences
and Georesources of CNR in Pavia by LA-ICP-MS, with a
magnetic sector double-focusing mass spectrometer
equipped with a plasma source-type ELEMENT I (Ther-
moFinnigan) and a laser microprobe developed at the
Memorial University of Newfoundland (Canada) with a
wavelength of 266 or 213 nm. The mass spectrometer is a
Model Element II ICP for torch (CD-2), magnet and
magnetic field controller (option ‘‘fast scanning’’). Tiepolo
et al. (2005) indicated that with a spot size of 40 lm, the
agreement between measured and reference values of Li,
Be and B is generally better than 10 % for NIST SRM 612
(utilized in this work). Tiepolo et al. (2003) demonstrated
that the ELEMENT sector-field mass spectrometer, cou-
pled with a 266-nm laser source, allows trace-element
determination on geological samples to a precision and
accuracy generally better than 10 %. Ten-point analyses
for trace elements and Li, B and Be were performed.
LIBS technique
LIBS experimental setup
The experimental setup (Fig. 1) consists of a pulsed
Nd:YAG (Quantasystem, PILS-GIANT) laser operating at
the third harmonic (355 nm), with a repetition rate of
10 Hz and a laser pulse duration of 6 ns. The laser was
focused on the targets with a 20-cm quartz lens. A 7.5-cm
biconvex quartz lens and an optical fiber were used to
collect the plasma emission and to focus a 1:1 image of the
plasma on the spectroscopic system. The latter comprises a
monochromator (Jobin–Yvon TRIAX 550) coupled with an
intensified charge-coupled device (ICCD) (i3000 Jobin–
Yvon) and a pulse generator (Standford DG 535) for the
triggering system of the emission spectra acquisition. A
computer with dedicated software controlled the time
acquisition parameters, i.e. the number of spectra acquisi-
tion, starting delay time, td, and gate width of ICCD
aperture with respect to laser pulse, tg (De Giacomo et al.
2012).
In this work, the emission spectra were acquired with
the following parameters: td = 300 ns, tg = 3 ls, pulse
energy, E = 12 mJ. The laser energy value was chosen so
as to obtain the best compromise between the smallest
possible laser-induced crater and emission spectra with the
best signal-to-noise ratio. An appropriate number of spec-
tral windows (each covering a spectral range of 16 nm)
were chosen based on the emission peaks of the elements to
analyze. Every emission spectrum was acquired after a
number of accumulations and averaged to optimize the
signal-to-noise ratio. The estimated laser spot diameter in
this experiment was around 100 lm and the crater depth
was on the order of a few hundreds of lm. The dimensions
of the analyzed gemstone slabs were in the range of
1–2 mm3 and they were kept fixed during the measure-
ments. In case of smaller samples, the laser beam dimen-
sion can be properly decreased by adjusting the focal
length of the lens or using microscope optics. The conse-
quential irradiance increase can be compensated by
decreasing the laser energy, so as to avoid significant
sample damage.
Theoretical background
When a nanosecond laser pulse is focused on a sample, if
the irradiance is beyond a certain threshold (in the order of
109 W/cm2), a plasma can be induced at the target surface,
which holds the stoichiometry of the original sample. The
ablated material is completely atomized and ionized, and
Fig. 1 LIBS experimental setup
Phys Chem Minerals
123

through the optical emission spectroscopy of laser-induced
plasma (LIP) it is possible to quantify the concentration of
elements contained in the sample (without the element spe-
ciation). Different analytical methodologies can be applied
to retrieve chemical composition from LIP emission spectra:
(1) the classical calibration curve method using matrix-
matched standards (Salle et al. 2005b); (2) the calibration-
free method based on the local thermodynamic equilibrium
(LTE) assumption, which does not require the use of any
standards (Tognoni et al. 2010); and (3) multivariate analy-
ses (Clegg et al. 2009). In this work, a calibration-free
method was applied and, since no preliminary sample
treatment was required and all the data were collected by a
single measurement, it was possible to perform a simulta-
neous multi-elemental quantitative analysis. LIBS analytical
methodology and principles have been widely discussed in
several papers (Cremers and Radziemski 2006; Hahn and
Omenetto 2010; Salle et al. 2006) and in particular, the
analytical procedure used in this work was discussed in De
Giacomo et al. (2007) and in Dell’Aglio et al (2010).
Whereas LIBS can be really accurate when calibration
curves are used, in this paper a calibration-free method was
selected in order to eliminate the need of matrix-matched
standards, as well as to establish a fast and general pro-
cedure for supporting mineralogical analysis. The calibra-
tion-free methodology was first proposed by Ciucci et al.
(1999) and then adapted for different applications by sev-
eral authors. The basic equations are briefly reported in the
following.
After the emission spectra acquisition, elements of the
sample can be qualitatively identified (by the use of atomic
and ionic emission database) and all the intensities of the
selected emission lines (Table 1) are determined. Then, for
each measured emission line, the number density of atoms
N0,a is given by the following equation:
N0;a ¼Iul
4pGhmulAulgu
Z Tð ÞexpEu
kT
� �;
where T is the experimental temperature measured from
Boltzmann plot and all other terms have the usual mean-
ings as described in references by De Giacomo et al. (2007)
and Dell’Aglio et al (2010).
The obtained average values of the number density of
atoms of each element are inserted in the Saha equation
(De Giacomo et al. 2007):
N0;i
N0;a¼ 2
Zi Tð ÞZa Tð ÞN
�1e
mekT
2ph�2
� �3=2
exp �EIon
kT
� �:
where Ne is the electron number density obtained with the
Stark broadening method, N0,i is the number density of
ions, and all other terms have the usual meaning (De
Giacomo et al. 2007). In this way, the ionized fraction of
elements in the plasma can be evaluated and added to N0,a
to determine the total relative element number density,
NiTOT = N0,a ? N0,i, of the species j present in the sample.
If the sample contains n elements, it is possible to deter-
mine NiTOT for each element and then, by applying a nor-
malization procedure, to retrieve the weight percentage of
each element present in the sample. In this normalization,
all the determined values of NjTOT are multiplied by their
atomic weight and the corresponding sum is forced to be
100 in order to get the weight percentage of each element.
As for the oxygen content, which cannot be directly mea-
sured when experiments are performed in air, in this work
it was calculated based on the stoichiometric relation in the
mineral oxide of the detected metal. This approach requires
that the mineral constituents of the sample are known.
However, based on the ratios of the number density of the
element under investigation to that of major constituents
(generally Al or Si), it is possible to also obtain the ele-
mental analysis (except oxygen) for unknown minerals.
Moreover, by operating in a controlled gas background
environment (i.e., a chamber filled with Ar or N2), it is
anyway possible to measure oxygen content with LIBS (see
for example Dell’Aglio et al. 2010).
For mineralogical applications, knowledge of the num-
ber of atoms of a given element is often required, and this
can be determined as well by the number density ratios
mentioned above. All this relies on the assumption of a
direct correlation existing between the measured emission
intensity and the number density of atoms and ions, which
holds only if the plasma is optically thin, i.e., if self-
absorption is negligible. The most intense lines in the
emission spectra are those involving low-energy levels, but
Table 1 Selected spectral lines of the investigated elements
Species Wavelength (nm)
Si I 250.69, 251.43, 251.61, 251.92, 252.41, 252.85, 288.16,
390.55
Al I 305.46, 305.71, 308.21, 309.27, 305.01, 305.90, 306.43,
306.61, 394.40, 396.15
Li I 610.354
B I 249.67, 249.77
Be II 313.04, 313.11
Ca I 422.67, 526.42,526.55
Fe I 370.10, 370.55, 370.92, 371.99, 372.25, 372.76, 373.04,
373.24, 373.33, 373.48, 373.71, 376.38
376.55, 376.72
Mn I 279.82, 280.11, 407.92, 408.29, 408.36
Mg I 285.21, 277.98, 516.73, 517.28, 518.36
Na I 588.99, 589.59, 568.26, 568.82
Ti I 398.97, 521.039
Cr I 520.45, 520.6, 520.84
V I 410.51, 410.97, 411.18, 411.51, 411.64
Phys Chem Minerals
123

Ta
ble
2L
IBS
rela
tiv
eer
rors
,as
wei
gh
tp
erce
nta
ge
(wt%
)o
fea
chel
emen
t,co
mp
ared
wit
hco
rres
po
nd
ent
EM
PA
-WD
San
dL
A-I
CP
-MS
val
ues
(C.T
.)
Ele
men
tsW
eig
ht
per
cen
tag
e(w
t%)
Ale
xan
dri
teH
idd
enit
eK
un
zite
Elb
aite
To
paz
C.T
.L
IBS
C.T
.L
IBS
C.T
.L
IBS
C.T
.L
IBS
C.T
.L
IBS
Si
0.0
30
±0
.00
23
0.1
±0
.33
0±
33
0.0
±0
.32
9±
31
8.1
±0
.21
9±
21
5.3
±0
.11
3±
1
Al
41
.5±
0.4
41
±6
14
.1±
0.1
15
±1
14
.6±
0.1
14
±1
20
.7±
0.2
22
±2
29
.5±
0.3
30
±3
Li
3.6
±0
.4a
2.2
±0
.33
.7±
0.4
a4
.6±
0.7
0.8
8±
0.0
9a
0.3
1±
0.0
6
B3
.0±
0.3
a3
.4±
0.5
Be
7.1
±0
.7a
7±
1
Ca
0.0
09
±0
.00
10
.00
20
±0
.00
01
0.0
01
7±
0.0
00
30
.00
30
±0
.00
02
n.r
.0
.17
2±
0.0
09
0.0
9±
0.0
1
K0
.00
6±
0.0
00
30
.00
70
±0
.00
04
n.d
.0
.00
70
±0
.00
04
n.d
.0
.01
3±
0.0
01
n.d
.0
.00
9±
0.0
01
n.d
.
Fe
1.1
4±
0.0
11
.1±
0.1
0.5
7±
0.0
30
.52
±0
.05
0.0
30
±0
.00
20
.09
6±
0.0
09
1.9
3±
0.0
21
.8±
0.2
0.0
35
±0
.00
20
.01
9±
0.0
02
Mn
0.0
05
0±
0.0
00
30
.01
3±
0.0
01
0.0
74
±0
.00
40
.09
1±
0.0
09
0.8
8±
0.0
40
.34
±0
.03
0.0
23
±0
.00
10
.01
9±
0.0
02
Mg
0.0
07
0±
0.0
00
40
.01
4±
0.0
01
0.0
03
0±
0.0
00
20
.01
2±
0.0
01
0.1
82
±0
.00
90
.22
±0
.03
0.0
05
0±
0.0
00
3n
.r.
Na
0.0
05
±0
.00
03
0.1
11
±0
.00
61
.0±
0.2
0.0
95
±0
.00
50
.14
±0
.02
1.6
8±
0.0
20
.64
±0
.09
0.0
21
±0
.00
1n
.d.
Ti
0.0
25
±0
.00
10
.01
1±
0.0
01
0.0
02
2±
0.0
00
30
.00
50
±0
.00
03
0.0
18
±0
.00
20
.04
0±
0.0
02
0.0
25
±0
.00
40
.01
5±
0.0
01
n.d
.
Cr
0.2
1±
0.0
10
.22
±0
.03
0.1
31
±0
.00
70
.34
±0
.03
V0
.02
3±
0.0
01
a0
.02
2±
0.0
02
Ocalc
50
±7
51
±1
51
±5
50
±5
42
±4
n.d
.=
no
td
etec
ted
;n
.r.
=n
ot
rev
eale
d;
aL
A-I
CP
-MS
dat
a
Phys Chem Minerals
123
they are in turn those most affected by self-absorption. This
observation clearly suggests that the selection of spectral
lines to be used for the analysis plays a crucial role. In this
work, some elements, such as Li and Na, were clearly
detected, but they could not be exactly quantified, because
most of their detectable peaks within the spectral range
covered by our spectrometer were affected by significant
self-absorption.
A final note about the employed calibration-free ana-
lytical method concerns the experimental uncertainty of the
measurements. The relative error on the calculated con-
centrations depends on the analyzed sample and on the
element under investigation, and generally it is around
10–15 %. Exhaustive discussions on relative error in LIBS
measurements with calibration-free methods are reported
by Tognoni et al. (2007) and Dell’Aglio et al (2010). It
should be noted that in the tables where results of the
analysis are reported, the experimental uncertainties of
conventional analytical techniques are expressed in terms
of standard deviation, which estimates the measurement
precision. Instead, since the number of LIBS replica does
not allow the use of standard deviation, in this case data are
given in terms of relative error (Table 2), which estimates
the measurement accuracy.
Results
Mineralogy1
The alexandrite specimen has a size of 3.5 9 2.5 9 2 cm
and is a 6-peak twin made up by three different interpen-
etrating twins, each clearly showing and the cross streaks.
The specimen’s color is deep green in daylight and deep
raspberry red in incandescent light. Besides, under UV
light (365 nm), it usually becomes transparent, while under
short UV frequencies (254 nm) it is opaque.
The mineral is also characterized by a strong pleoch-
roism: in particular, under incandescent light it shows a red
carmine color along the na optical direction, becoming
yellow along nb and green along nc. In daylight, it shows a
purple violet color along the na optical direction, becoming
pale yellow-green along nb and bluish-green along nc. In
the crystals, twinning planes are visible, as well as primary
and secondary fluid and solid inclusions with micrometric
sizes. On the other hand, some iron oxide impurities were
detected very rarely. Spodumene: the hiddenite sample has
a size of 1.5 9 0.5 9 0.7 cm, is transparent and is emerald
green in color. The crystal habit is prismatic elongated on
c, flattened on (100) with deep vertical striations. The
mineral is also characterized by pleochroism, showing a
green color along the na optical direction and pale yellow
along nc. The hiddenite presents a deep green color under
short UV frequencies (254 nm). The crystal also presents
fluid and solid inclusions.
The kunzite sample is transparent and shows a pale pink
color. This crystal is characterized by habit flattened on
(100) and by the presence of a very pronounced cleavage
plane and fracture. It is weakly pleochroic and has a size of
13 9 2.5 9 4 cm.
The elbaite sample is translucent and shows a dark green
color. This crystal is predominantly prismatic and the prism
Table 3 Conventional (EMPA-WDS, LA-ICP-MS) and LIBS anal-
yses carried out on alexandrite sample
Oxides
wt%
EMPA-
WDS
Avg
LIBS
1
LIBS
2
Elements
ppm
LA-ICP-
MSb
Avg
SiO2 0.064 (25) – Li 1.9 (3)
TiO2 0.041 (5) – B 64 (5)
Al2O3 78.39 (25) 77.47 Mg 38 (5)
Cr2O3 0.299 (78) 0.322 Sc 2.4 (2)
FeO 1.47 (10) 1.41 V 79 (3)
BeO 19.70 (20)a 19.43 Mn 1.2 (0)
CaO 0.012 (12) – Co 0.1 (1)
Na2O 0.007 (8) – Ni 2.2 (9)
K2O 0.007 (5) – Zn 2.8 (4)
Tot. 99.995 98.632 Rb 0.1 (0)
Number of ions on the basis of 4 O Zr 0.1 (0)
Si 0.001 – – Nb 0.3 (2)
Al 1.969 1.972 2.000 Ba 0.1 (0)
Cr 0.011 0.012 0.006 Nd 0.1 (0)
Ti 0.001 – – Sm 0.1 (0)
Fe2? 0.026 0.026 0.027 Yb 0.1 (0)
Ca 0.000 – – Hf 0.1 (1)
Na 0.000 – – Ta 4 (1)
K 0.000 – – Pb 0.1 (0)
Be 1.009 1.008 1.060
Octahedral
site
2.008 2.010 2.032
Berillium
site
1.009 1.008 1.060
Standard deviations are given in parentheses. Avg is the meana LA-ICP-MS datab Sr, Y, Cs, La, Ce, Pr, Eu, Gd, Tb, Dy, Ho, Er, Tm, Lu, Th,
U \ 0.1 ppm
1 All the samples were previously subjected to single crystal X-ray
structure investigation: details can be obtained from the Fachinforma-
tionszentrum Karlsruhe ([email protected]), 76344 Eggen-
stein-Leopoldshafen, Germany, (fax: (49) 7247-808-666; e-mail:
[email protected]) by quoting the depository numbers CSD-
426602 (alexandrite), -426603 (hiddenite), -426604 (kunzite),
-426605 (elbaite) and -426606 (topaz). The list of Fo/Fc data is
available from the authors up to 1 year after the publication
has appeared.
Phys Chem Minerals
123

faces are grooved parallel to the c axis. Its dimensions are
5 9 3 cm. The topaz sample is transparent and light green
to pale yellow-colored. The crystal shows short prismatic
morphology and has a size of 2 9 1 9 1 cm. Under UV
light (365 nm), it is yellow.
Chemistry: conventional analytical techniques
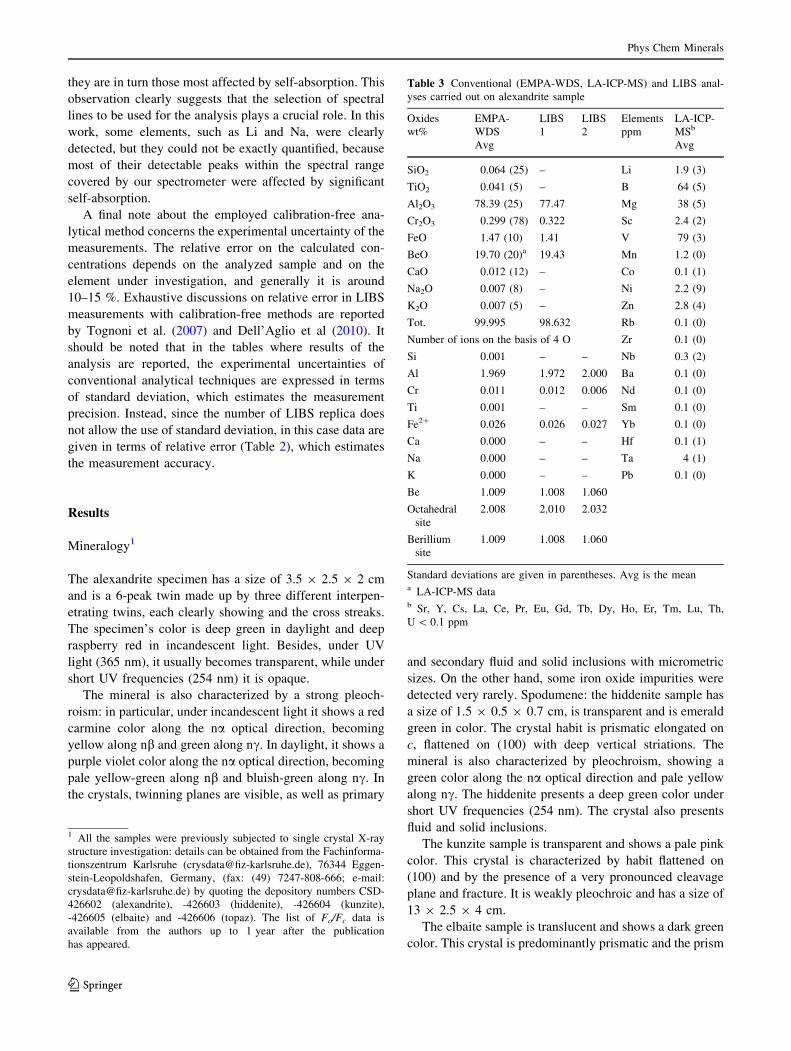
Quantitative chemical analysis (Table 3) of major and
minor elements in alexandrite shows that the average
content of Be is 1.009 atoms per formula unit (apfu), while
Fe2? and Cr3? are, respectively, 0.026 and 0.011 apfu; Ti,
V, and B are detected in traces.
The chemical composition of hiddenite (Table 4) shows
no replacement of Si by Al, and minor substitution of Al by
Fe3? and Cr3?, with tenors, respectively, of 0.0015 and 0.005
apfu, while lower amounts of Fe2?, Na and Mg replace Li.
Moreover, we detected trace elements like V, ranging from
192 up to 248 ppm, and Ti, ranging from 41 up to 60 ppm.
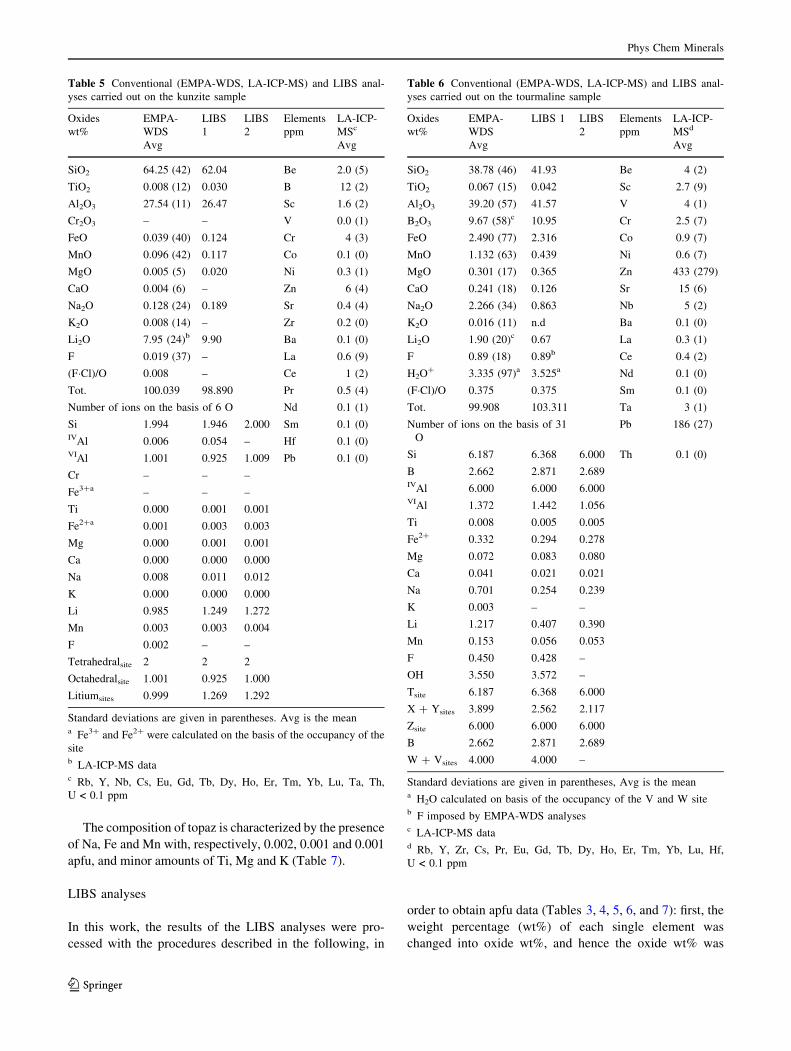
The chemical composition of kunzite (Table 5) shows
very limited replacement of Si by Al (0.006 apfu), and no
replacement of Al by Fe3? and Cr3?. Na, Mn and (minor)
Fe2? replace Li.
The chemical composition of elbaite (Table 6) shows Si
in the tetrahedral site (T site) and B in the B site. As for the
two octahedral sites, we found Al at the Z site and Al, Li,
Fe2?, Mn, and Mg at the Y site. Na, Ca, and K are located
at a [9]-coordinated X-site, with respective concentrations
of 0.701, 0.041 and 0.003 apfu. OH and F are located at the
V and W sites. The trace elements are Zn and Pb, their
content in tourmaline range respectively between 276 and
999 ppm, and between 165 and 233.
Table 4 Conventional (EMPA-
WDS, LA-ICP-MS) and LIBS
analyses carried out on the
hiddenite sample
Standard deviations are given in
parentheses. Avg is the meana Fe3? and Fe2? were
calculated on the basis of the
occupancy of siteb LA-ICP-MS datac Rb, Y, Nb, Cs, Eu, Zr, Gd, Tb,
Dy, Ho, Er, Tm, Yb, Lu, Ta,
Hf < 0.1 ppm
Oxides
wt%
EMPA-WDS
Avg
LIBS 1 LIBS 2 Elements
ppm
LA-ICP-MSc
Avg
SiO2 64.47 (22) 65.18 Be 1.6 (9)
TiO2 0.019 (13) 0.004 B 2.0 (6)
Al2O3 26.74 (16) 28.34 Sc 50 (8)
Cr2O3 0.191 (18) 0.497 V 228 (24)
FeO 0.74 (10) 0.67 Co 0.1 (0.1)
MnO 0.006 (5) 0.017 Ni 0.5 (2)
MgO 0.011 (11) 0.023 Zn 3 (1)
CaO 0.003 (5) 0.002 Sr 0.5 (4)
Na2O 0.150 (31) 1.348 Ba 0.1 (0)
K2O 0.009 (8) – La 0.3 (2)
Li2O 7.79 (30)b 4.74 Ce 0.5 (6)
F 0.005 (10) – Pr 0.1 (1)
(F�Cl)/O 0.002 – Nd 0.2 (2)
Tot. 100.134 100.821 Sm 0.1 (1)
Number of ions on the basis of 6 O Pb 0.1 (0)
Si 2.005 2.021 2.000 Th 0.1 (1)IVAl – – – U 0.1 (1)VIAl 0.980 1.052 1.011
Cr 0.005 0.012 0.011
Fe3?a 0.015 – –
Ti 0.000 0.000 0.000
Fe2?a 0.005 0.018 0.017
Mg 0.001 0.001 0.002
Ca 0.000 0.000 0.000
Na 0.009 0.082 0.082
K 0.000 – –
Li 0.974 0.600 0.589
Mn 0.000 0.000 0.000
F 0.001 – –
Tetrahedralsite 2.005 2.021 2.000
Octahedralsite 1.000 1.065 1.022
Litiumsites 0.990 0.702 0.690
Phys Chem Minerals
123
The composition of topaz is characterized by the presence
of Na, Fe and Mn with, respectively, 0.002, 0.001 and 0.001
apfu, and minor amounts of Ti, Mg and K (Table 7).
LIBS analyses
In this work, the results of the LIBS analyses were pro-
cessed with the procedures described in the following, in
order to obtain apfu data (Tables 3, 4, 5, 6, and 7): first, the
weight percentage (wt%) of each single element was
changed into oxide wt%, and hence the oxide wt% was
Table 5 Conventional (EMPA-WDS, LA-ICP-MS) and LIBS anal-
yses carried out on the kunzite sample
Oxides
wt%
EMPA-
WDS
Avg
LIBS
1
LIBS
2
Elements
ppm
LA-ICP-
MSc
Avg
SiO2 64.25 (42) 62.04 Be 2.0 (5)
TiO2 0.008 (12) 0.030 B 12 (2)
Al2O3 27.54 (11) 26.47 Sc 1.6 (2)
Cr2O3 – – V 0.0 (1)
FeO 0.039 (40) 0.124 Cr 4 (3)
MnO 0.096 (42) 0.117 Co 0.1 (0)
MgO 0.005 (5) 0.020 Ni 0.3 (1)
CaO 0.004 (6) – Zn 6 (4)
Na2O 0.128 (24) 0.189 Sr 0.4 (4)
K2O 0.008 (14) – Zr 0.2 (0)
Li2O 7.95 (24)b 9.90 Ba 0.1 (0)
F 0.019 (37) – La 0.6 (9)
(F�Cl)/O 0.008 – Ce 1 (2)
Tot. 100.039 98.890 Pr 0.5 (4)
Number of ions on the basis of 6 O Nd 0.1 (1)
Si 1.994 1.946 2.000 Sm 0.1 (0)IVAl 0.006 0.054 – Hf 0.1 (0)VIAl 1.001 0.925 1.009 Pb 0.1 (0)
Cr – – –
Fe3?a – – –
Ti 0.000 0.001 0.001
Fe2?a 0.001 0.003 0.003
Mg 0.000 0.001 0.001
Ca 0.000 0.000 0.000
Na 0.008 0.011 0.012
K 0.000 0.000 0.000
Li 0.985 1.249 1.272
Mn 0.003 0.003 0.004
F 0.002 – –
Tetrahedralsite 2 2 2
Octahedralsite 1.001 0.925 1.000
Litiumsites 0.999 1.269 1.292
Standard deviations are given in parentheses. Avg is the meana Fe3? and Fe2? were calculated on the basis of the occupancy of the
siteb LA-ICP-MS datac Rb, Y, Nb, Cs, Eu, Gd, Tb, Dy, Ho, Er, Tm, Yb, Lu, Ta, Th,
U < 0.1 ppm
Table 6 Conventional (EMPA-WDS, LA-ICP-MS) and LIBS anal-
yses carried out on the tourmaline sample
Oxides
wt%
EMPA-
WDS
Avg
LIBS 1 LIBS
2
Elements
ppm
LA-ICP-
MSd
Avg
SiO2 38.78 (46) 41.93 Be 4 (2)
TiO2 0.067 (15) 0.042 Sc 2.7 (9)
Al2O3 39.20 (57) 41.57 V 4 (1)
B2O3 9.67 (58)c 10.95 Cr 2.5 (7)
FeO 2.490 (77) 2.316 Co 0.9 (7)
MnO 1.132 (63) 0.439 Ni 0.6 (7)
MgO 0.301 (17) 0.365 Zn 433 (279)
CaO 0.241 (18) 0.126 Sr 15 (6)
Na2O 2.266 (34) 0.863 Nb 5 (2)
K2O 0.016 (11) n.d Ba 0.1 (0)
Li2O 1.90 (20)c 0.67 La 0.3 (1)
F 0.89 (18) 0.89b Ce 0.4 (2)
H2O? 3.335 (97)a 3.525a Nd 0.1 (0)
(F�Cl)/O 0.375 0.375 Sm 0.1 (0)
Tot. 99.908 103.311 Ta 3 (1)
Number of ions on the basis of 31
O
Pb 186 (27)
Si 6.187 6.368 6.000 Th 0.1 (0)
B 2.662 2.871 2.689IVAl 6.000 6.000 6.000VIAl 1.372 1.442 1.056
Ti 0.008 0.005 0.005
Fe2? 0.332 0.294 0.278
Mg 0.072 0.083 0.080
Ca 0.041 0.021 0.021
Na 0.701 0.254 0.239
K 0.003 – –
Li 1.217 0.407 0.390
Mn 0.153 0.056 0.053
F 0.450 0.428 –
OH 3.550 3.572 –
Tsite 6.187 6.368 6.000
X ? Ysites 3.899 2.562 2.117
Zsite 6.000 6.000 6.000
B 2.662 2.871 2.689
W ? Vsites 4.000 4.000 –
Standard deviations are given in parentheses, Avg is the meana H2O calculated on basis of the occupancy of the V and W siteb F imposed by EMPA-WDS analysesc LA-ICP-MS datad Rb, Y, Zr, Cs, Pr, Eu, Gd, Tb, Dy, Ho, Er, Tm, Yb, Lu, Hf,
U < 0.1 ppm
Phys Chem Minerals
123

routinely processed to obtain the apfu amount. Results
obtained with this procedure are shown in the tables under
the column heading ‘‘LIBS 1’’. Second, the number density
ratios of each element NjTOT, to the number density of the
major element NxTOT (i.e., Al for alexandrite and Si for
other gemstones) were multiplied by the theoretical stoi-
chiometry (X) of the major element constituent, as pro-
posed by De Giacomo et al (2012). These results are shown
in the tables under the column heading ‘‘LIBS 2’’.
For alexandrite, results for the Be content are 1,008 apfu
(LIBS 1) and 1.060 apfu (LIBS 2), while those of Fe2? and
Cr3? are, respectively, 0.026 apfu (LIBS 1), 0.027 apfu
(LIBS 2), and 0.012 apfu (LIBS 1), 0.006 apfu (LIBS 2).
The chemical composition of hiddenite shows no
replacement of Si by Al, and minor substitution of Al by
Cr3?, whose amount is 0.012 apfu (LIBS 1), 0.011 apfu
(LIBS 2). Moreover, there are low amounts of Fe2?, Na and
Mg replacing Li. Some trace elements are also noteworthy,
such as V (220 ppm, LIBS 1), and Ti (22 ppm, LIBS 1).
The chemical composition of kunzite shows a non-
negligible replacement of Si by Al (0.054 apfu), and no
replacement of Al by Fe3? and Cr3?, while Na, Mn and
(minor) Fe2? replace Li.
The chemical composition of tourmaline shows, in the
Y site, Al and Li, whose contents are, respectively, 1.442
apfu (LIBS 1), 1.056 apfu (LIBS 2), and 0.407 apfu (LIBS
Table 7 Conventional (EMPA-
WDS, LA-ICP-MS) and LIBS
analyses carried out on the topaz
sample
Standard deviations are given in
parentheses, Avg is the meana H2O calculated on basis of the
occupancy of the F and OH siteb F imposed by EMPA-WDS
analysesc Lu \ 0.1 ppm
Oxides
wt%
EMPA-WDS
Avg
LIBS 1 LIBS 2 Elements
ppm
LA-ICP-MSc
Avg
SiO2 32.67 (27) 27.81 Li 4 (7)
TiO2 0.025 (23) – Be 9 (16)
Al2O3 55.79 (40) 56.68 B 26 (26)
FeO 0.045 (41) 0.024 Sc 4 (6)
MnO 0.030 (29) 0.025 V 6 (6)
MgO 0.009 (9) – Cr 120 (177)
CaO 0.011 (9) – Co 0.5 (6)
Na2O 0.028 (24) – Ni 4 (4)
K2O 0.011 (10) – Zn 18 (23)
F 14.64 (72) 14.64 (72)b Rb 0.3 (3)
H2O? 2.897a 2.441a Sr 65 (145)
(F�Cl)/O 6.163 6.163 Y 0.2 (2)
Tot. 99.999 95.456 Zr 0.2 (3)
Number of ions on the basis of 6 O Nb 0.3 (3)
Si 0.995 0.892 1.000 Cs 0.1 (2)IVAl 0.005 0.108 0.000 Ba 6 (12)VIAl 1.999 2.035 2.350 La 13 (29)
Ti 0.001 – – Ce 21 (41)
Fe2? 0.001 0.001 0.001 Pr 8 (12)
Mg 0.000 – – Nd 4 (9)
Ca 0.000 – – Sm 0.8 (9)
Na 0.002 – – Eu 0.1 (3)
K 0.000 – – Gd 0.2 (5)
Mn 0.001 0.001 0.007 Tb 0.1 (1)
F 1.410 1.485 – Dy 0.3 (4)
OH 0.589 0.515 – Ho 0.1 (1)
Tetrahedral site 1.000 1.000 1.000 Er 0.3 (4)
Octahedral site 2.004 2.037 2.358 Tm 0.1 (1)
F, OH 1.999 2.000 – Yb 0.5 (9)
Hf 0.1 (1)
Ta 0.1 (1)
Pb 3 (3)
Th 1 (3)
U 5 (9)
Phys Chem Minerals
123
1), 0.390 apfu (LIBS 2), and lesser amounts of Fe2?, Mg
and Mn (Table 6). In the X site, there are Na and Ca,
respectively with concentrations of 0.254 apfu (LIBS 1),
0.239 apfu (LIBS 2), and of 0.021 apfu (LIBS 1), 0.021
apfu (LIBS 2).
The composition of topaz is characterized by the pre-
sence of Mn and Fe, respectively with concentrations of
0.001 apfu (LIBS 1), 0.007 apfu (LIBS 2), and 0.001 apfu
(LIBS 1, LIBS 2).
Discussion
For the alexandrite sample, Cr3? and Fe3? are mainly
responsible for the chromatic change under irradiation with
different light sources (Scalvi et al. 2003). In particular,
Ahn et al. (2009) demonstrated that this ‘‘alexandrite
effect’’ (Weber et al. 2007) is due to Cr3? ions in the
crystal, which replace the Al3? ions within the Al2 sites.
The correct chemical composition of alexandrite is of
primary importance to distinguish the variety of chryso-
beryl under investigation, as well as for crystallographic
analyses. The LIBS 1 data for chromium are in good
agreement with WDS values, but LIBS 2 data show,
rounded to 3 decimals, half the Cr content of LIBS 1 data.
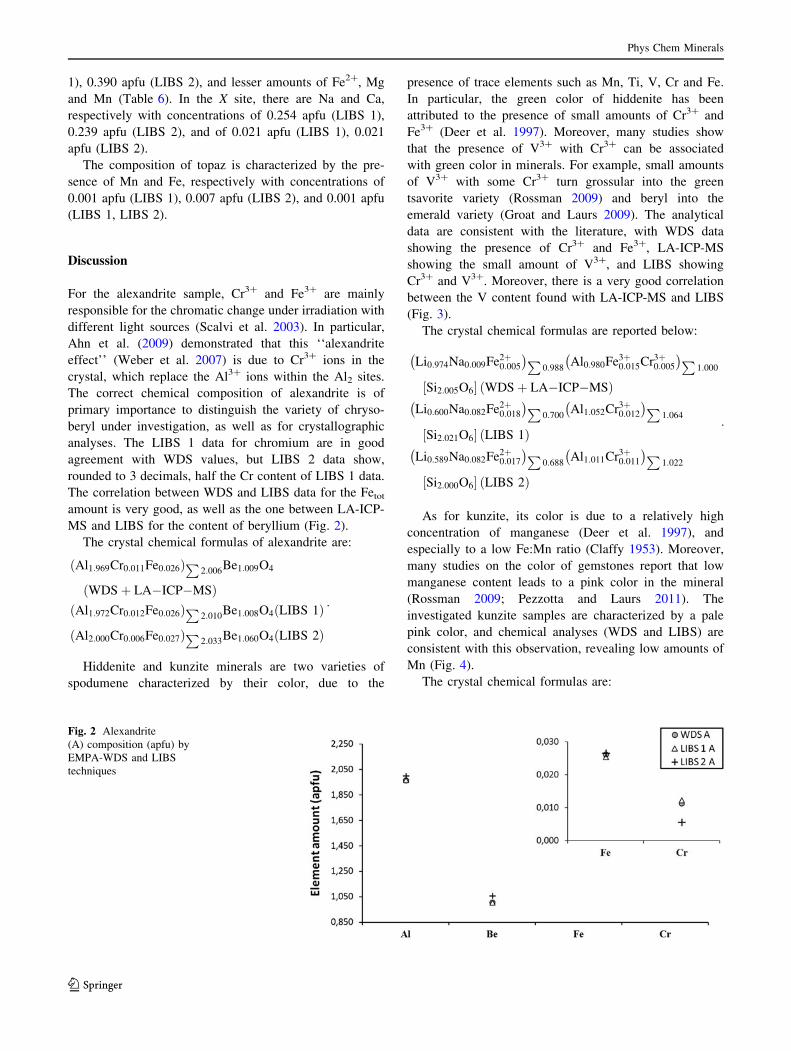
The correlation between WDS and LIBS data for the Fetot
amount is very good, as well as the one between LA-ICP-
MS and LIBS for the content of beryllium (Fig. 2).
The crystal chemical formulas of alexandrite are:
Al1:969Cr0:011Fe0:026ð ÞP2:006
Be1:009O4
WDSþ LA�ICP�MSð ÞAl1:972Cr0:012Fe0:026ð ÞP
2:010Be1:008O4 LIBS 1ð Þ
Al2:000Cr0:006Fe0:027ð ÞP2:033
Be1:060O4 LIBS 2ð Þ
:
Hiddenite and kunzite minerals are two varieties of
spodumene characterized by their color, due to the
presence of trace elements such as Mn, Ti, V, Cr and Fe.
In particular, the green color of hiddenite has been
attributed to the presence of small amounts of Cr3? and
Fe3? (Deer et al. 1997). Moreover, many studies show
that the presence of V3? with Cr3? can be associated
with green color in minerals. For example, small amounts
of V3? with some Cr3? turn grossular into the green
tsavorite variety (Rossman 2009) and beryl into the
emerald variety (Groat and Laurs 2009). The analytical
data are consistent with the literature, with WDS data
showing the presence of Cr3? and Fe3?, LA-ICP-MS
showing the small amount of V3?, and LIBS showing
Cr3? and V3?. Moreover, there is a very good correlation
between the V content found with LA-ICP-MS and LIBS
(Fig. 3).
The crystal chemical formulas are reported below:
Li0:974Na0:009Fe2þ0:005
� �P0:988
Al0:980Fe3þ0:015Cr3þ
0:005
� �P1:000
Si2:005O6½ � WDSþ LA�ICP�MSð ÞLi0:600Na0:082Fe2þ
0:018
� �P0:700
Al1:052Cr3þ0:012
� �P1:064
Si2:021O6½ � LIBS 1ð ÞLi0:589Na0:082Fe2þ
0:017
� �P0:688
Al1:011Cr3þ0:011
� �P1:022
Si2:000O6½ � LIBS 2ð Þ
:
As for kunzite, its color is due to a relatively high
concentration of manganese (Deer et al. 1997), and
especially to a low Fe:Mn ratio (Claffy 1953). Moreover,
many studies on the color of gemstones report that low
manganese content leads to a pink color in the mineral
(Rossman 2009; Pezzotta and Laurs 2011). The
investigated kunzite samples are characterized by a pale
pink color, and chemical analyses (WDS and LIBS) are
consistent with this observation, revealing low amounts of
Mn (Fig. 4).
The crystal chemical formulas are:
Fig. 2 Alexandrite
(A) composition (apfu) by
EMPA-WDS and LIBS
techniques
Phys Chem Minerals
123

Li0:985Na0:008Mn0:003ð ÞP0:996
Al1:001 Si1:994Al0:006O6½ �
WDSþ LA�ICP�MSð ÞLi1:249Na0:011Mn0:003ð ÞP
1:263Al0:925 Si1:946Al0:054O6½ �
LIBS 1ð ÞLi1:272Na0:012Mn0:004ð ÞP
1:288Al1:009 Si2:00O6½ � LIBS 2ð Þ:
Tourmaline is the sample with the most complex crystal
chemistry of the set studied in this work, and its LIBS
analysis can be considered representative of a general
application for the identification of minerals containing
light lithophile elements. Indeed, tourmaline contains
several elements that can occupy a variety of sites in the
mineral structure. According to the chemical classification
Fig. 3 Hiddenite
(H) composition (apfu) by
EMPA-WDS and LIBS
techniques
Fig. 4 Kunzite
(K) composition (apfu) by
EMPA-WDS and LIBS
techniques
Fig. 5 Tourmaline (Tur)
composition (apfu) by EMPA-
WDS and LIBS techniques
Phys Chem Minerals
123

proposed by Henry et al. (2011), and based on WDS and
LA-ICP-MS analyses, the analyzed sample is classified as
an elbaite. This result is confirmed by cell parameters and
by c/a ratio, according to Deer et al (1997). According to
Pezzotta and Laurs (2011), the green color of tourmaline
(included elbaite) is due to Fe2?, Fe3? and to Fe2?-Ti4?
IVTC, whereas the black color is due to high
concentrations of Fe2?, Mn2? and/or Ti4?. The elbaite
analyzed in this work is characterized by a dark green color
and, consistently, the chemical composition shows the
presence of Fe2?, Mn2? and very small amount of Ti4?. The
correlation between WDS ? LA-ICP-MS and LIBS data
for the tourmaline is highly variable, due to the complex
crystal chemistry. In the LIBS 1 data, the F content was
imposed based on WDS analyses and the H2O? content was
established by imposing V3 ? W = 4 (Henry et al. 2011).
The B content obtained with LIBS is in good agreement
with that obtained with LA-ICP-MS (Fig. 5).
The crystal chemical formulas are:
Ca0:041Na0:701ð ÞP0:742
Li1:217Al1:372Fe2þ0:332Mg0:072Ti0:008Mn0:153
� �P3:154
Al6
Si6:187O18ð Þ BO3ð Þ2:662 F0:450OH3:550ð Þ4WDSþ LA�ICP�MSð Þ
Ca0:021Na0:254ð ÞP0:275
Li0:407Al1:442Fe2þ0:294Mg0:083Ti0:005Mn0:056
� �P2:287
Al6
Si6:368O18ð Þ BO3ð Þ2:871 F0:428;OH3:572ð Þ4 LIBS 1ð ÞCa0:021Na0:239ð ÞP
0:260
Li0:390Al1:056Fe2þ0:278Mg0:080Mn0:053
� �P1:857
Al6
Si6O18ð Þ BO3ð Þ2:689 F0:450OH3:550ð Þ4 LIBS 2ð Þ:
The topaz sample is characterized by pale yellow and
pale green colors, and the chemical analyses show the
presence of small amounts of Fe and Mn (Fig. 6). As in the
previous case, after careful evaluation of chemical data
obtained by WDS analyses and by bibliography review
(Deer et al. 1997), in the LIBS 1 procedure we assumed the
F content obtained by the WDS and imposed F ? OH = 2
to establish the H2O? content. In this case, though the
concentration of F in topaz is very high, LIBS 1 is in good
agreement with the WDS data.
Conclusions
In this work, alexandrite, hiddenite, kunzite, elbaite and
topaz were characterized with different conventional ana-
lytical techniques (i.e., EMPA-WDS, LA-ICP-MS) and
with LIBS in the calibration-free mode. In particular, this
study demonstrated that LIBS can be employed in miner-
alogical studies, for minerals with simple and complex
crystal chemistries. The results showed a good agreement
between LIBS, EMPA, and LA-ICP-MS data for major
elements such as Si, Al, Be and B. Promising results were
also achieved for chromophore elements, i.e., Fe, Cr, V,
and Mn. On the other hand, the concentrations found by
LIBS for Li and Na did not agree with those found via
conventional analysis methods, due to self-absorption of
the emission lines of these elements. Thus, further work is
planned to improve the technique on elements whose
quantitative analysis is still not feasible, and to perform the
technique on other minerals. Moreover, using a portable
LIBS instrument, valid and fast in situ analyses could be
performed, which would be particularly important for
outcrop minerals or gemstones located in museums, but
would also represent a suitable choice for applicative lab-
oratories, such as those with a gemological focus.
Acknowledgments We would like to thank M. Serracino (IGAG
CNR, Rome, Italy) and M. Tiepolo (IGG CNR, Pavia, Italy) for their
skillful technical assistance during, respectively, WDS and LA-IPC-
MS analyses, and G. Chita (IC-CNR, Bari, Italy) for preliminary
Fig. 6 Topaz (Tpz)
composition (apfu) by EMPA-
WDS and LIBS techniques
Phys Chem Minerals
123

X-ray data collections. Finally, we would like to gratefully
acknowledge the editor M. Rieder, S. Mills and another anonymous
reviewer for their careful revision of the manuscript.
References
Ahn YK, Seo JG, Park JW (2009) Diffusion of chromium in
chrysoberyl. J Cryst Growth 311:3943–3947
Beesley C (2009) System method for analysis of gemstones, Patent
no.: US7557917
Breeding C, Shen A, Eaton-Magana S, Rossman G, Shigley J,
Gilbertson A (2011) Developments in gemstone analysis tech-
niques and instrumentation during the 2000s. Gems Gemol
46:241–257
Capitelli F, Colao F, Provenzano MR, Fantoni R, Brunetti G, Senesi
N (2002) Determination of heavy metals in soils by laser induced
breakdown spectroscopy. Geoderma 106:45–62
Ciucci A, Corsi M, Palleschi V, Rastelli S, Salvetti A, Tognoni E (1999)
New procedure for quantitative elemental analysis by laser-
induced plasma spectroscopy. Appl Spectrosc 53(8):960–964
Claffy EW (1953) Composition, tenebrescence, and luminescence of
spodumene minerals. Am Miner 38:919–931
Clegg SM, Sklute E, Darby Dyar M, Barefield JE, Wiens RC (2009)
Multivariate analysis of remote laser-induced breakdown spec-
troscopy spectra using partial least squares, principal component
analysis, and related techniques. Spectrochim Acta B 64:79–88
Colao F, Fantoni R, Lazic V, Paolini A, Fabbri F, Ori GG,
Marinangeli L, Baliva A (2004) Investigation of LIBS feasibility
for in situ planetary exploration: an analysis on Martian rock
analogues. Planet Space Sci 52:117–123
Cremers D, Radziemski LJ (2006) Handbook of laser-induced
breakdown spectroscopy. Wiley, New York, pp 99–168
De Giacomo A, Dell’Aglio M, De Pascale O, Longo S, Capitelli M
(2007) Laser induced breakdown spectroscopy on meteorites.
Spectrochim Acta B 62:1606–1611
De Giacomo A, Dell’Aglio M, De Pascale O, Gaudiuso R, Santagata
A, Teghil R (2008) Laser induced breakdown spectroscopy
methodology for the analysis of copper-based-alloys used in
ancient artworks. Spectrochim Acta B 63:585–590
De Giacomo A, Dell’Aglio M, Gaudiuso R, Santagata A, Senesi GS,
Rossi M, Ghiara MR, Capitelli F, De Pascale O (2012) A laser
induced breakdown spectroscopy application based on local
thermodynamic equilibrium assumption for the elemental ana-
lysis of alexandrite gemstone and copper-based alloys. Chem
Phys 398:233–238
Death DL, Cunningham AP, Pollard LJ (2009) Multi-element and
mineralogical analysis of mineral ores using laser induced
breakdown spectroscopy and chemometric analysis. Spectrochim
Acta B 64:1048–1058
Deer WA, Howie RA, Zussman J (1997) Rock-forming minerals, 2nd
edn. Single-chain silicates, vol 2A. Geological Society, London
Dell’Aglio M, Gaudiuso R, Senesi GS, De Giacomo A, Zaccone C,
Miano TM, De Pascale O (2011) Monitoring of Cr, Cu, Pb, V
and Zn in polluted soils by laser induced breakdown spectros-
copy (LIBS). J Environ Monit 13:1422–1426
Dell’Aglio M, De Giacomo A, Gaudiuso R, Pascale O, Senesi GS,
Longo S (2010) Laser induced breakdown spectroscopy appli-
cations to meteorites: chemical analysis and composition
profiles. Geochim Cosmochim Acta 74:7329–7339
Diaz Pace DM, Gabriele NA, Garcimuno M, D’Angelo CA, Bertuccelli
G, Bertuccelli D (2011) Analysis of minerals and rocks by laser-
induced breakdown spectroscopy. Spectrosc Lett 44:399–411
Evensen JM, London D (2002) Experimental silicate mineral/melt
partition coefficients for beryllium and the crustal Be cycle from
migmatite to pegmatite. Geochim Cosmochim Acta
66:2239–2265
Fabre C, Boiron MC, Dubessy J, Chabiron A, Charoy B, Crespo TM
(2002) Advances in lithium analysis in solids by means of laser-
induced breakdown spectroscopy: an exploratory study. Geo-
chim Cosmochim Acta 66:1401–1407
Fritsch E, Rossman GR (1988) An update on color in gems. Part III.
Colors caused by physical optics. Gems Gemol 24:81–103
Giakoumaki A, Melessanaki K, Anglos D (2007) Laser-induced
breakdown spectroscopy (LIBS) in archaeological science—
applications and prospects. Anal Bioanal Chem 387:749–
760
Groat LA, Laurs BM (2009) Gem formation, production, and
exploration: why gem deposits are rare and what is being done
to find them. Elements 7:153–158
Hahn DW, Omenetto N (2010) Laser induced breakdown spectros-
copy (LIBS), Part I: review of basic diagnostics and plasma–
particle interactions: still-challenging issues within the analytical
plasma community. Appl Spectrosc 64:335A–366A
Henley RW, Truesdell AH, Barton PB Jr, Whitney JA (1984) Fluid-
mineral equilibria in hydrothermal systems. Reviews in Eco-
nomic Geology, vol 1. Society of Economic Geologists
Henry DJ, Novak M, Hawthorne FC, Ertl A, Dutrow BL, Uher P,
Pezzotta F (2011) Nomenclature of the tourmaline-supergroup
minerals. Am Miner 96:895–913
Hinsberg VVJ, Henry DJ, Marchall HR (2011) Tourmaline: an ideal
indicator of its host environment. Can Miner 49:1–16
Inorganic Crystal Structure Database: Version 2013-1. Fachinforma-
tionszentrum Karlsruhe, Germany (2013)
Knight AK, Scherbarth NL, Cremers DA, Ferris MJ (2000) Charac-
terization of laser-induced breakdown spectroscopy (LIBS) for
application to space exploration. Appl Spectrosc 54:331–340
Lazic V, Rauschenbach I, Jovicevic S, Jessberger EK, Fantoni R, Di
Fino M (2007) Laser induced breakdown spectroscopy of soils,
rocks and ice at subzero temperatures in simulated martian
conditions. Spectrochim Acta B 62:1546–1556
London D (1986) Holmquistite as a guide to pegmatite rare metal
deposits. Econ Geol 81:704–712
London E (1992) The application of experimental petrology to the
genesis and crystallization of granitic pegmatites. Can Miner
30:499–540
Mattson SM, Rossman GR (1987a) Fe2?–Fe3? interactions in
tourmaline. Phys Chem Miner 14:163–171
Mattson SM, Rossman GR (1987b) Identifying characteristics of
charge transfer transitions in minerals. Phys Chem Miner
14:94–99
Maurice S, Wiens RC, Saccoccio M, Barraclough B, Gasnault O,
Forni O, Mangold N, Baratoux D, Bender S, Berger G, Bernardin
J, Berthe M, Bridges N, Blaney D, Bouye M, Caıs P, Clark B,
Clegg S, Cousin A, Cremers D, Cros A, Deflores L, Derycke C,
Dingler B, Dromart G, Dubois B, Dupieux M, Durand E,
D’Uston L, Fabre C, Faure B, Gaboriaud A, Gharsa T,
Herkenhoff K, Kan E, Kirkland L, Kouach D, Lacour JL,
Langevin Y, Lasue J, Le Mouelic S, Lescure M, Lewin E,
Limonadi D, Manhes G, Mauchien P, McKay C, Meslin PY,
Michel Y, Miller E, Newsom HE, Orttner G, Paillet A, Pares L,
Parot Y, Perez R, Pinet P, Poitrasson F, Quertier B, Salle B,
Sotin C, Sautter V, Seran H, Simmonds JJ, Sirven JB, Stiglich R,
Striebig N, Thocaven JJ, Toplis MJ, Vaniman D (2012) The
ChemCam instrument suite on the Mars Science Laboratory
(MSL) rover: science objectives and mast unit description. Space
Sci Rev 170:95–166
McManus CE, McMillan NJ, Harmon RS, Whitmore RC, De Lucia
FC Jr, Miziolek AW (2008) Use of laser induced breakdown
spectroscopy in the determination of gem provenance. Beryls
Appl Opt 47:72–79
Phys Chem Minerals
123

McMillan NJ, McManus CE, Harmon RS, De Lucia FC Jr, Miziolek
AW (2006) Laser-induced breakdown spectroscopy analysis of
complex silicate minerals—beryl. Anal Bioanal Chem
385:263–271
Miziolek AW, Palleschi V, Schechter I (2006) Laser induced
breakdown spectroscopy: fundamentals and applications. Cam-
bridge University Press, New York, pp 17–27, 370–378
Pezzotta F, Laurs BM (2011) Tourmaline: the kaleidoscopic
gemstone. Elements 7:333–338
Pouchou JL, Pichoir F (1991) Quantitative analysis of homogeneous
or stratified microvolumes applying the model ‘‘PAP’’. In:
Heinrich KFJ, Newbury DE (eds) Electron probe quantitation.
Plenum Press, New York, pp 31–75
Rossman GR (2009) The geochemistry of gems and its relevance to
gemology: different traces, different prices. Elements 5:159–162
Salle B, Cremers DA, Maurice S, Wiens R, Fichet P (2005a)
Evaluation of a compact spectrograph for in situ and stand-off
laser-induced breakdown spectroscopy analyses of geological
samples on Mars missions. Spectrochim Acta B 60:805–815
Salle B, Cremers DA, Maurice S, Wiens RC (2005b) Laser-induced
breakdown spectroscopy for space exploration applications:
influence of the ambient pressure on the calibration curves
prepared from soil and clay samples. Spectrochim Acta B
60:479–490
Salle B, Lacour JL, Mauchien P, Fichet P, Maurice S, Manhes G
(2006) Comparative study of different methodologies for
quantitative rock analysis by laser-induced breakdown spectros-
copy in a simulated Martian atmosphere. Spectrochim Acta B
61:301–313
Scalvi RMF, Li MS, Scalvi LVA (2003) Annealing effects on optical
properties of natural alexandrite. J Phys Condens Mat
15:7437–7443
Schmetzer K (1989) Types of water in natural and synthetic emerald.
Neue Jahrb Miner Monatsh 1:15–26
Schmetzer K (2008) Surface treatment of gemstones, especially
topaz—an update of recent patent literature. J Gemmol 31(1/
2):7–13
Seitz HM, Woodland AB (2000) The distribution of lithium in
peridotitic and pyroxenitic mantle lithologies—an indicator of
magmatic and metasomatic processes. Chem Geol 166:47–64
Senesi GS, Dell’Aglio M, Gaudiuso R, De Giacomo A, Zaccone C,
De Pascale O, Miano TM, Capitelli M (2009) Heavy metal
concentrations in soils as determined by laser-induced break-
down spectroscopy (LIBS), with special emphasis on chromium.
Environ Res 109:413–420
Shigley JE, McClure SF (2009) Laboratory-treated gemstones.
Elements 5:175–178
Tiepolo M, Bottazzi P, Palenzona M, Vannucci R (2003) A laser
probe coupled with ICP-double focusing sector field mass
spectrometer for in situ analysis of geological samples and U-Pb
dating of zircon. Can Min J 41:259–272
Tiepolo M, Zanetti A, Vannucci R (2005) Determination of lithium,
beryllium and boron at trace levels by laser ablation-inductively
coupled plasma-sector field mass spectrometry. Geostand Geo-
anal Res 29(2):211–224
Tognoni E, Cristoforetti G, Legnaioli S, Palleschi V, Salvetti A,
Mueller M, Panne U, Gornushkin I (2007) A numerical study of
expected accuracy and precision in calibration-free laser-induced
breakdown spectroscopy in the assumption of ideal analytical
plasma. Spectrochim Acta B 62:1287–1302
Tognoni E, Cristoforetti G, Legnaioli S, Palleschi V, Salvetti A,
Mueller M, Panne U, Gornushkin I (2010) A numerical study of
expected accuracy and precision in calibration-free laser-induced
breakdown spectroscopy in the assumption of ideal analytical
plasma. Spectrochim Acta B 65:1–14
Tucker JM, Dyar MD, Schaefer MW, Clegg SM, Wiens RC (2010)
Optimization of laser-induced breakdown spectroscopy for rapid
geochemical analysis. Chem Geol 277:137–148
Weber SU, Grodzicki M, Lottermoser W, Redhammer GJ, Tippel G,
Ponahlo J, Amthauer G (2007) 57Fe Mossbauer spectroscopy,
X-ray single-crystal diffractometry, and electronic structure cal-
culations on natural alexandrite. Phys Chem Miner 34:507–515
Whitehouse AI, Young J, Botheroyd IM, Lawson S, Evans CP,
Wright J (2001) Remote material analysis of nuclear power
station steam generator tubes by laser-induced breakdown
spectroscopy. Spectrochim Acta B 56:821–830
Wiens RC, Maurice S, Barraclough B, Saccoccio M, Barkley WC,
Bell JF III, Bender S, Bernardin J, Blaney D, Blank J, Bouye M,
Bridges N, Bultman N, Caıs P, Clanton RC, Clark B, Clegg S,
Cousin A, Cremers D, Cros A, Deflores L, Delapp D, Dingler R,
D’Uston C, Darby Dyar M, Elliott T, Enemark D, Fabre C,
Flores M, Forni O, Gasnault O, Hale T, Hays C, Herkenhoff K,
Kan E, Kirkland L, Kouach D, Landis D, Langevin Y, Lanza N,
Larocca F, Lasue J, Latino J, Limonadi D, Lindensmith C, Little
C, Mauchien P, McKay C, Miller E, Mooney J, Morris RV,
Morrison L, Nelson T, Newsom H, Ollila A, Ott M, Pares L,
Perez R, Poitrasson F, Provost C, Reiter JW, Roberts T, Romero
F, Sautter V, Salazar S, Simmonds JJ, Stiglich R, Storms S,
Striebig N, Thocaven JJ, Trujillo T, Ulibarri M, Vaniman D,
Warner N, Waterbury R, Whitaker R, Witt J, Wong-Swanson B
(2012) The ChemCam instrument suite on the Mars Science
Laboratory (MSL) rover: body unit and combined system tests.
Space Sci Rev 170:167–227
Phys Chem Minerals
123