multi-label classification of satellite images with deep...
TRANSCRIPT

Multi-label Classification of Satellite Images with Deep Learning
Daniel GardnerStanford University
David NicholsStanford University
Abstract
Up-to-date location information of human activity is vi-tally important to scientists and governments working topreserve the Amazon rainforest. We implement a Convolu-tional Neural Network (CNN) model to perform multi-labelclassification of Amazon satellite images. Our model iden-tifies the weather conditions and natural terrain featuresin the images as well as man-made developments such asroads, farming, and logging. We begin by implementing asimple CNN model that achieves a 0.84 F-score. We thenexperiment with three deep CNN architectures that havehad recent success in the ImageNet Challenge and showthat a ResNet-50 model can achieve a 0.91 F-score. Ourmodel’s best performance is achieved via a number of dataaugmentation and ensemble techniques. Our model is par-ticularly effective at identifying illegal mining operations.These models will enable stakeholders to pinpoint wheredeforestation and associated illegal activity is taking placeand craft targeted policy to limit its deleterious effects.
1. IntroductionDeforestation of the Amazon basin has occurred at a
rapid pace over the past four decades. Governments and sci-entists, concerned about consequences ranging from habitatloss to climate change, need a way to monitor where andwhen the deforestation is occurring.
Planet, a satellite imaging company, recently releaseda dataset of more than 100,000 images from the Amazonbasin and sponsored a Kaggle competition involving label-ing the atmosphere and ground features in the images [1].Each image is 256 x 256 pixels and has RGB and near-infrared channels. Notably, these images have at least tentimes greater resolution than any earth image data used pre-viously in tracking deforestation, with each pixel represent-ing only three to five meters. In the past, researchers haverelied on satellite images generated by Landsat, which isjointly managed by NASA and the US Geological Survey.Landsat missions often have multi-year gaps, making thedata only suitable for examining overarching trends of gen-
Figure 1: Clockwise from top left: 1) clear primary agricul-ture habitation road; 2) haze primary agriculture water; 3)cloudy; 4) partly-cloudy primary cultivation slash-burn
eral deforestation. The high-resolution Planet images en-able identification of specific causes of deforestation anddifferentiation of legal and illegal human developments.
We build a model using Convolutional Neural Networks(CNN) to analyze each image and classify it with one ormore of the 17 feature labels. Each image has one of fouratmosphere labels and zero or more of 13 ground labels.By definition, cloudy images have zero ground labels, asnone should be visible. Some ground features are human-related (habitation, slash burn, mining) while others are nat-ural (water, blooming, blow down). More than 90 percent ofimages are labeled “primary”, meaning that they have for-est in them. Six of the other ground labels appear in fewerthan one percent of images, but are often the ones we areparticularly interested in identifying.
1

Approximately 40,000 images have labels, which we di-vide into our training and validation sets. The other 60,000images are used as a test set for creating a submission to theKaggle competition.
We develop a multi-label classification CNN frameworkto work on this problem. A naive approach might be totrain 17 different single-label networks that predict the pres-ence of a particular atmosphere or ground feature. How-ever, multi-label classification has been shown to robustlyaccount for the correlative relationships that exist betweenmultiple features. In the Planet data, this is particularly use-ful, as human developments almost never occur indepen-dently of one another. For example, almost all man-madestructures, no matter how remote, will have a road nearby.
We build our multi-label classifier on top of CNNarchitectures that have performed well in the single-label ImageNet Large-Scale Visual Recognition Chal-lenge (ILSVRC). Namely, we experiment with VGG-16,Inception-v3, and ResNet-50. Our model takes an input im-age, computes a score for each of the 17 features, and thenuses a cutoff threshold to decide which labels to keep.
2. Background/Related WorkThe field of Remote Sensing, which broadly involves
collection of earth data via satellites, has long been in-terested in image classification. The recent explosion inthe availability of massive amount of earth data has led tobreakthroughs in machine learning approaches to analysis.Santos et al [2] proposes a Bag of Words algorithm that an-notates images using correlation representations. Chen etal [3] improves on this result by adding spatial informationinto the BoW model.
Barsi et al [4] utilized neural networks to examine satel-lite data in 2003, and the introduction of CNNs sparkeda renaissance of training to perform remote sensing tasks.Hung et al [5] used CNNs to identify weeds from a UAVcamera, while Hu et al [6] used CNNs to perform remotesensing scene classification, and Chen et al [7] used CNNsto identify vehicles in satellite images.
These papers generally built task-specific models toachieve their best performance, but in 2014 Razavian etal [8] demonstrated that they could use the OverFeat [9]model trained for the ImageNet challenge to generalize ontoother image tasks, including human feature recognition andbird classification. Penatti et al [10] used pretrained modelsfrom ImageNet on the UC Merced aerial image dataset andfound that CNNs outperformed conventional object recog-nition methods but performed worse on remote sensingcolor recognition tasks.
More recently, Castelluccio et al [11] used pretrained thenetworks CaffeNet [12] and GoogLeNet [13] to classify re-mote sensing images for land use policy. To reduce designtime, they used the pretrained weights and built a small re-
Figure 2: Baseline Model structure
fined network on top. In 2016 Karalas et al [14] used deepCNNs for multi-label classification of satellite images withgreat success.
Multi-label classification has been an important prob-lem in image recognition for many years. Early work fromBarnard and Forsyth [15] focused on identifying objects inparticular sub-sections of an image. More recently, Wei etal [16] demonstrated that weights from networks pre-trainedon single-label classification have great success transferringto multi-label classification. Wang et al [17] proposes usingrecurrent neural networks to capture semantic label depen-dency and improve multi-label classification.
3. MethodsWe used Google’s TensorFlow and the open-source neu-
ral network Python package Keras for the majority of ourmodel development. We used R and Excel for data visual-ization and threshold optimization.
Our design steps were as follows: First we developeda basic CNN architecture, then we built three deep CNNmodels with VGG-16 [18], Inception-v3 [19], and ResNet-50 [20], and finally we added on data augmentation and en-semble techniques to the deep CNN models. Each modelinvolves feeding in batches of images and getting scores forthe 17 features out. We use a sigmoid activation function onthe final layer of all of our networks so that each feature hasa score between 0 and 1. We label an image with featuresthat have scores above a certain threshold value (naive andlater optimized).
We experimented with softmax as well but found that itpushed the rare ground labels to near-zero probability.
3.1. Baseline CNN architecture
Our first implementation was a mesh of data explorationcode [21] provided by the Planet Kaggle representative aswell as a simple Keras starter notebook [22] created by an-
2

Figure 3: Deep Model Structure
other user in the competition. It uses two convolutional lay-ers with ReLu activation and max pooling followed by twodense layers. No preprocessing or resizing of the images isrequired, so input images had RGB and Near-IR channels.
3.2. Deep CNN architecture
We proceeded to create a model incorporating deep net-works that performed well on the ImageNet Challenge. Foreach named deep network, we attached a pooling layer andthree dense layers to the end. Keras is invaluable for inte-grating the deep CNN network with our dense layers, as itallows you to import the network structure and downloadthe pre-trained weights of each network. We then explicitlyfreeze the weights in the imported network and train justthe weights in our added-on layers. The pre-trained mod-els require three input channels, so we had to strip off theNear-IR information.
We built models with the following networks:
3.2.1 VGG-16
VGG was originally developed for the ImageNet dataset bythe Visual Geometry Group at the University of Oxford.The highlights of this model are that it utilizes 16 layersand 3 x 3 filters in the convolutional layers. It is designed totake in 224 x 224 images as input.
3.2.2 Inception-v3
Inception-v3 is another ImageNet-optimized model. It isdeveloped by Google and has a strong emphasis on makingscaling to deep networks computationally efficient. It takesin 299 x 299 images.
3.2.3 ResNet-50
ResNet-50 is a model developed by Microsoft Research us-ing a structure that uses residual functions to help add con-siderable stability to deep networks. ResNet won the Im-
ageNet Challenge in 2015, and ResNet-50 is the 50-layerversion of ResNet. It uses 224 x 224 images.
3.3. Implementation
We used the binary cross-entropy loss function and theAdam optimizer. We wrote a custom metric to track the Fscore during training, which was required since the stan-dard scipy F score function cannot be used on tensors.During training, we used Keras callbacks to save modelweights when the model’s performance on tracked metricsimproved. However, this functionality is limited to pre-defined metrics, so we used accuracy to determine whenthe model improved.
The entire 40,000 labeled images could not be loadedall at once, even with 120 GB of memory on ourGoogle Cloud instance. To remedy this, we used Keras’model.fit generator method, which loads batches of imagesfrom a generator and fits the model. The ImageDataGen-erator class allows for easy image resizing to fit the cur-rent model. However, Keras’ image generators do not sup-port multi-label classification, as they currently label im-ages based on the directory they are in (one label for ev-erything in the directory). Instead we used a Keras librarymodification we found on Stack Overflow that passes a labeldictionary into the generator with a length-17 binary arrayvalue for each image, representing its feature labeling [23].With some tweaking, we were able to get this to work forour problem, which paid off later on when we wanted to doquick data augmentation.
This code architecture also made it difficult to perform k-folds cross validation during the training process. We had toseparate our training and validation data (32000-8000 split)and put them in separate folders. Since the data from Planetwas already randomized, we just took the top-numbered8000 files to get our validation set.
4. Experiments
We ran our baseline model and the three deep networkmodels on vanilla data. We then ran our best performingmodel on augmented data and ran a small ensemble model.
4.1. Evaluation
The evaluation metric for each model is average F2score, which is defined for one sample as:
F2 = (1 + 22) · precision · recall(22 · precision) + recall
where Precision = TPTP+FP and Recall = TP
TP+FN .
The F2 score prefers recall to precision, as can be seenin Figure 4. This means we punish false negatives more
3
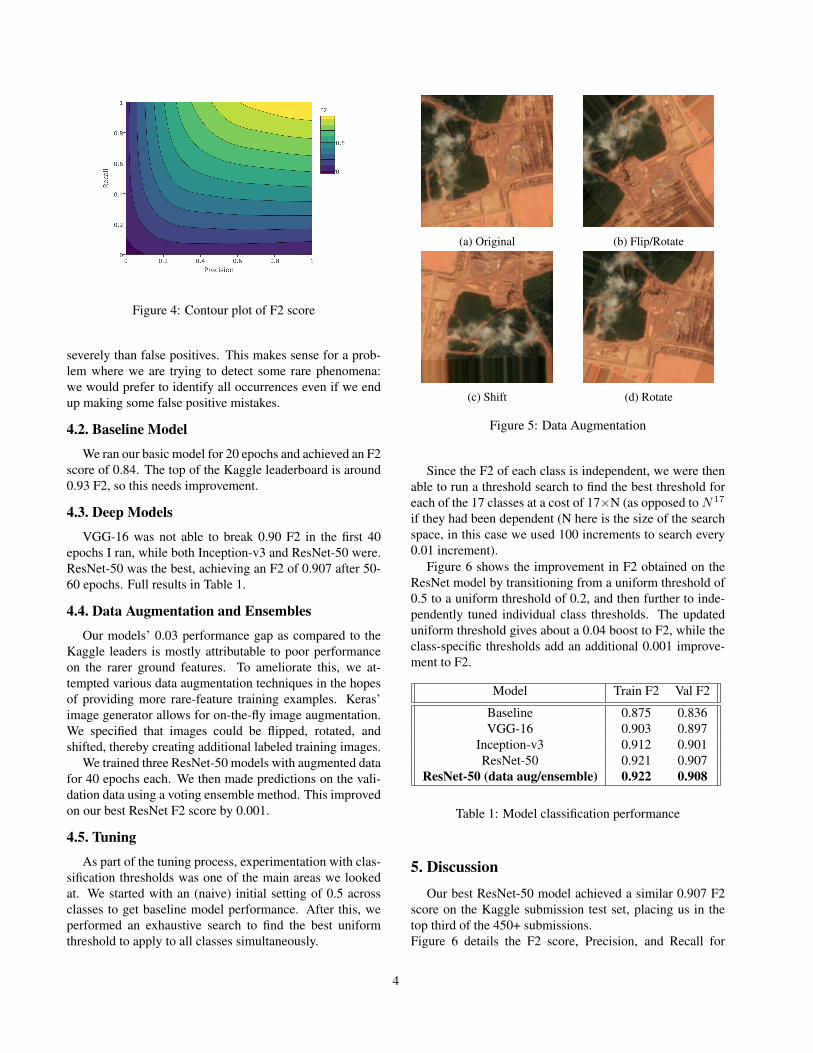
Figure 4: Contour plot of F2 score
severely than false positives. This makes sense for a prob-lem where we are trying to detect some rare phenomena:we would prefer to identify all occurrences even if we endup making some false positive mistakes.
4.2. Baseline Model
We ran our basic model for 20 epochs and achieved an F2score of 0.84. The top of the Kaggle leaderboard is around0.93 F2, so this needs improvement.
4.3. Deep Models
VGG-16 was not able to break 0.90 F2 in the first 40epochs I ran, while both Inception-v3 and ResNet-50 were.ResNet-50 was the best, achieving an F2 of 0.907 after 50-60 epochs. Full results in Table 1.
4.4. Data Augmentation and Ensembles
Our models’ 0.03 performance gap as compared to theKaggle leaders is mostly attributable to poor performanceon the rarer ground features. To ameliorate this, we at-tempted various data augmentation techniques in the hopesof providing more rare-feature training examples. Keras’image generator allows for on-the-fly image augmentation.We specified that images could be flipped, rotated, andshifted, thereby creating additional labeled training images.
We trained three ResNet-50 models with augmented datafor 40 epochs each. We then made predictions on the vali-dation data using a voting ensemble method. This improvedon our best ResNet F2 score by 0.001.
4.5. Tuning
As part of the tuning process, experimentation with clas-sification thresholds was one of the main areas we lookedat. We started with an (naive) initial setting of 0.5 acrossclasses to get baseline model performance. After this, weperformed an exhaustive search to find the best uniformthreshold to apply to all classes simultaneously.
(a) Original (b) Flip/Rotate
(c) Shift (d) Rotate
Figure 5: Data Augmentation
Since the F2 of each class is independent, we were thenable to run a threshold search to find the best threshold foreach of the 17 classes at a cost of 17×N (as opposed to N17
if they had been dependent (N here is the size of the searchspace, in this case we used 100 increments to search every0.01 increment).
Figure 6 shows the improvement in F2 obtained on theResNet model by transitioning from a uniform threshold of0.5 to a uniform threshold of 0.2, and then further to inde-pendently tuned individual class thresholds. The updateduniform threshold gives about a 0.04 boost to F2, while theclass-specific thresholds add an additional 0.001 improve-ment to F2.
Model Train F2 Val F2
Baseline 0.875 0.836VGG-16 0.903 0.897
Inception-v3 0.912 0.901ResNet-50 0.921 0.907
ResNet-50 (data aug/ensemble) 0.922 0.908
Table 1: Model classification performance
5. DiscussionOur best ResNet-50 model achieved a similar 0.907 F2
score on the Kaggle submission test set, placing us in thetop third of the 450+ submissions.Figure 6 details the F2 score, Precision, and Recall for
4

Figure 6: Performance of ResNet model at different threshold levels
each feature, sorted by frequency. Comparing the resultsfrom the baseline model to the best ResNet model shows anacross-the-board improvement.
The baseline model is quite good at predicting primaryand clear labels, which makes sense since the data has themost training examples of these types. The baseline per-forms moderately well on most of the uncommon atmo-sphere and ground features, but gets 0.0 F2 for nearly allof the rare features. This is the key deficiency of the base-line model - by failing to identify the rare labels, it is un-able to pinpoint rare but critical human encroachment thatwe are most interested in. A multi-label classifier attempt-ing to curb deforestation should be able to identify mining,logging, and slash-and-burn activity to be truly effective.
The ResNet model improves in most of these criticalareas. It gets somewhat better (0.310 F2) at identifyingselective logging, which is where expensive wood isremoved rather than general clear cutting. It makes similar
improvements (0.479 F2) to conventional mining, and dra-matic improvements to its identification of artisanal mining(0.770 F2). The model does not show improvements atfinding slash-and-burn.
6. Conclusion
Using deep CNN models designed for the ImageNetChallenge combined with task-specific refining layers pro-duces good results on multi-label classification of satelliteimages. Experimenting with more exotic refining layerswould be an interesting improvement. One idea might beto train new ResNet models, each time focusing on one ofthe rare ground features. Just as our model performed es-pecially well on artisanal mining, it should be possible toachieve similar results with other rare features with properdata augmentation and loss weighting. We could then com-bine the models into an ensemble where if any of them pre-
5

Figure 7: Identifying Illegal Mining
dict a rare feature we would accept that.It is unlikely that the ResNet model can make dramatic
improvement from this point without a re-thinking of its op-timization metric. The accuracy metric used to pick the bestweights simply compares 1s and 0s and determines howmany are correct. Since it uses a simple rounding to la-bel any given feature, all or most images will never haverare features for the accuracy calculation. As such, our op-timizer has a difficult time finding weights to make the ac-curacy go over 0.96. We can use our variable thresholdsto account for this when we make our predictions, but ifthe model hits a ceiling on optimization improvement wewill not be able to identify the remaining four percent ofaccuracy. Some digging into Keras callback saving couldremedy this.
The ResNet’s ability to identify artisanal mines makesit extremely useful to solving the overarching problem ofillegal human activity in the Amazon rainforest. Conven-tional mining operations are defined as those run by a min-ing company and, while certainly destructive, are generallysanctioned by the local or federal government in which theyoperate. Artisanal mines are small scale and, by-in-large,illegal. Because there is no knowledge or oversight aboutwhere they are occurring, there is little to no ability for thelocal government to manage their impact on deforestationin the area. Having a model that can find these mines is adefinite win for those concerned about the destruction of therainforest habitat.
References[1] Kaggle competition. planet: Understand-
ing the amazon from space. [On-line]. Available: https://www.kaggle.com/c/planet-understanding-the-amazon-from-space
[2] J. A. dos Santos, O. A. Penatti, P.-H. Gosselin, A. X.Falcaao, S. Philipp-Foliguet, and R. d. S. Torres, “Ef-ficient and effective hierarchical feature propagation,”
IEEE Journal of Selected Topics in Applied Earth Ob-servations and Remote Sensing, vol. 7, no. 12, pp.4632–4643, 2014.
[3] S. Chen and Y. Tian, “Pyramid of spatial relatonsfor scene-level land use classification,” IEEE Trans-actions on Geoscience and Remote Sensing, vol. 53,no. 4, pp. 1947–1957, 2015.
[4] A. Barsi and C. Heipke, “Artificial neural networks forthe detection of road junctions in aerial images,” Inter-national Archives of Photogrammetry Remote Sensingand Spatial Information Sciences, vol. 34, no. 3/W8,pp. 113–118, 2003.
[5] C. Hung, Z. Xu, and S. Sukkarieh, “Feature learningbased approach for weed classification using high res-olution aerial images from a digital camera mountedon a uav,” Remote Sensing, vol. 6, no. 12, pp. 12 037–12 054, 2014.
[6] F. Hu, G.-S. Xia, J. Hu, and L. Zhang, “Transferringdeep convolutional neural networks for the scene clas-sification of high-resolution remote sensing imagery,”Remote Sensing, vol. 7, no. 11, pp. 14 680–14 707,2015.
[7] X. Chen, S. Xiang, C.-L. Liu, and C.-H. Pan, “Vehicledetection in satellite images by hybrid deep convolu-tional neural networks,” IEEE Geoscience and remotesensing letters, vol. 11, no. 10, pp. 1797–1801, 2014.
[8] A. Sharif Razavian, H. Azizpour, J. Sullivan, andS. Carlsson, “Cnn features off-the-shelf: an astound-ing baseline for recognition,” in Proceedings of theIEEE Conference on Computer Vision and PatternRecognition Workshops, 2014, pp. 806–813.
[9] P. Sermanet, D. Eigen, X. Zhang, M. Mathieu, R. Fer-gus, and Y. LeCun, “Overfeat: Integrated recogni-tion, localization and detection using convolutionalnetworks,” arXiv preprint arXiv:1312.6229, 2013.
[10] O. A. Penatti, K. Nogueira, and J. A. dos Santos, “Dodeep features generalize from everyday objects to re-mote sensing and aerial scenes domains?” in Proceed-ings of the IEEE Conference on Computer Vision andPattern Recognition Workshops, 2015, pp. 44–51.
[11] M. Castelluccio, G. Poggi, C. Sansone, and L. Ver-doliva, “Land use classification in remote sensingimages by convolutional neural networks,” CoRR,vol. abs/1508.00092, 2015. [Online]. Available:http://arxiv.org/abs/1508.00092
[12] Y. Jia, E. Shelhamer, J. Donahue, S. Karayev, J. Long,R. Girshick, S. Guadarrama, and T. Darrell, “Caffe:
6

Convolutional architecture for fast feature embed-ding,” in Proceedings of the 22nd ACM internationalconference on Multimedia. ACM, 2014, pp. 675–678.
[13] C. Szegedy, W. Liu, Y. Jia, P. Sermanet, S. Reed,D. Anguelov, D. Erhan, V. Vanhoucke, and A. Ra-binovich, “Going deeper with convolutions,” in Pro-ceedings of the IEEE Conference on Computer Visionand Pattern Recognition, 2015, pp. 1–9.
[14] K. Karalas, G. Tsagkatakis, M. Zervakis, andP. Tsakalides, “Land classification using remotelysensed data: Going multilabel,” IEEE Transactions onGeoscience and Remote Sensing, vol. 54, no. 6, pp.3548–3563, June 2016.
[15] P. Duygulu, K. Barnard, J. F. de Freitas, and D. A.Forsyth, “Object recognition as machine translation:Learning a lexicon for a fixed image vocabulary,” inEuropean conference on computer vision. Springer,2002, pp. 97–112.
[16] Y. Wei, W. Xia, J. Huang, B. Ni, J. Dong, Y. Zhao,and S. Yan, “Cnn: Single-label to multi-label,” arXivpreprint arXiv:1406.5726, 2014.
[17] J. Wang, Y. Yang, J. Mao, Z. Huang, C. Huang, andW. Xu, “Cnn-rnn: A unified framework for multi-labelimage classification,” in Proceedings of the IEEE Con-ference on Computer Vision and Pattern Recognition,2016, pp. 2285–2294.
[18] K. Simonyan and A. Zisserman, “Very deep convo-lutional networks for large-scale image recognition,”arXiv preprint arXiv:1409.1556, 2014.
[19] C. Szegedy, V. Vanhoucke, S. Ioffe, J. Shlens, andZ. Wojna, “Rethinking the inception architecture forcomputer vision,” in Proceedings of the IEEE Con-ference on Computer Vision and Pattern Recognition,2016, pp. 2818–2826.
[20] K. He, X. Zhang, S. Ren, and J. Sun, “Deep resid-ual learning for image recognition,” in Proceedings ofthe IEEE Conference on Computer Vision and PatternRecognition, 2016, pp. 770–778.
[21] Kaggle competition: Getting started. [On-line]. Available: https://www.kaggle.com/robinkraft/getting-started-with-the-data-now-with-docs
[22] M. Bober-Irizar. Simple keras starter. [On-line]. Available: https://www.kaggle.com/anokas/simple-keras-starter
[23] M. Ganssauge. Keras git hub repository. [Online].Available: https://github.com/tholor/keras/commit/29ceafca3c4792cb480829c5768510e4bdb489c5
7