multi-hazard risk assessment, mapping and land use
TRANSCRIPT
8/3/2019 Multi-Hazard Risk Assessment, Mapping and Land Use
http://slidepdf.com/reader/full/multi-hazard-risk-assessment-mapping-and-land-use 1/13
MULTI-HAZARD RISK ASSESSMENT, MAPPING
AND LAND USE PLANNING
PROMOTION OF ENERGY EFFICIENT
COOKING, HEAT AND HOUSING TECHNOLOGY (PEACH)
N a s i r u d d i n GI S an al y s t -WWF -P ak i s t an
8/3/2019 Multi-Hazard Risk Assessment, Mapping and Land Use
http://slidepdf.com/reader/full/multi-hazard-risk-assessment-mapping-and-land-use 2/13
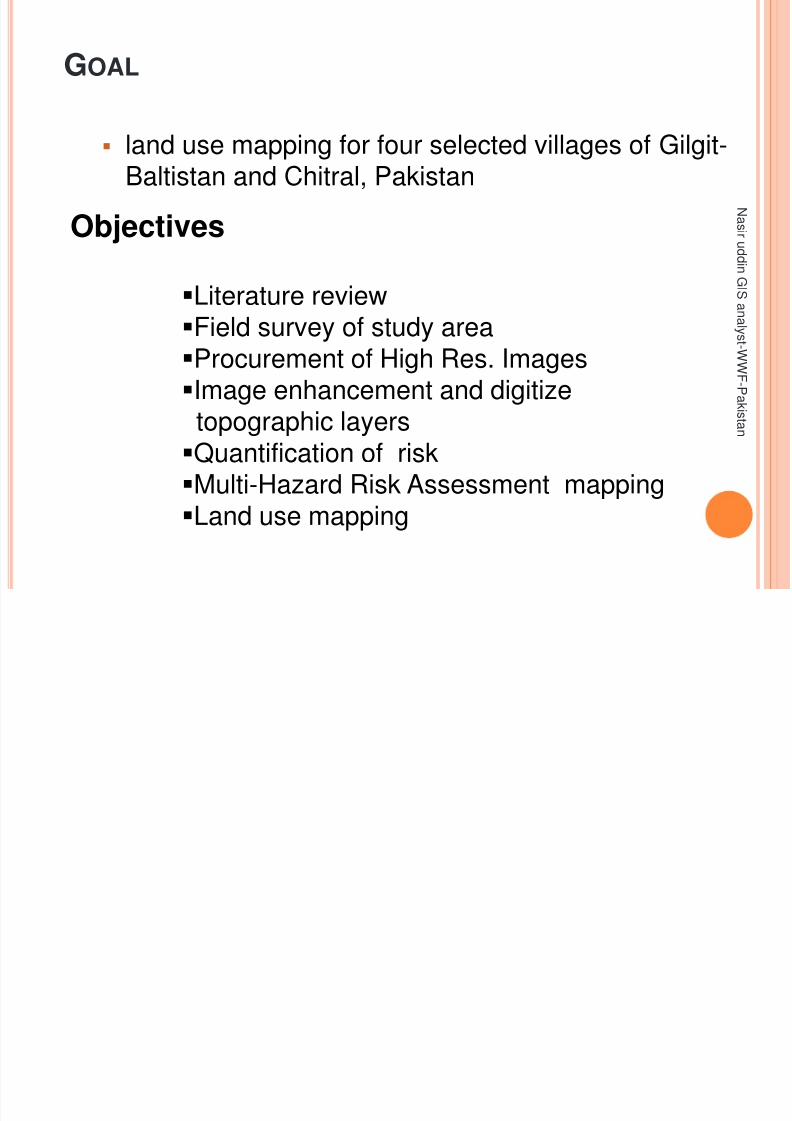
GOAL
land use mapping for four selected villages of Gilgit-Baltistan and Chitral, Pakistan
Objectives
Literature reviewField survey of study areaProcurement of High Res. ImagesImage enhancement and digitize
topographic layersQuantification of riskMulti-Hazard Risk Assessment mappingLand use mapping
N a s i r u d d i n GI S an al y s t -WWF -P a
k i s t an
8/3/2019 Multi-Hazard Risk Assessment, Mapping and Land Use
http://slidepdf.com/reader/full/multi-hazard-risk-assessment-mapping-and-land-use 3/13
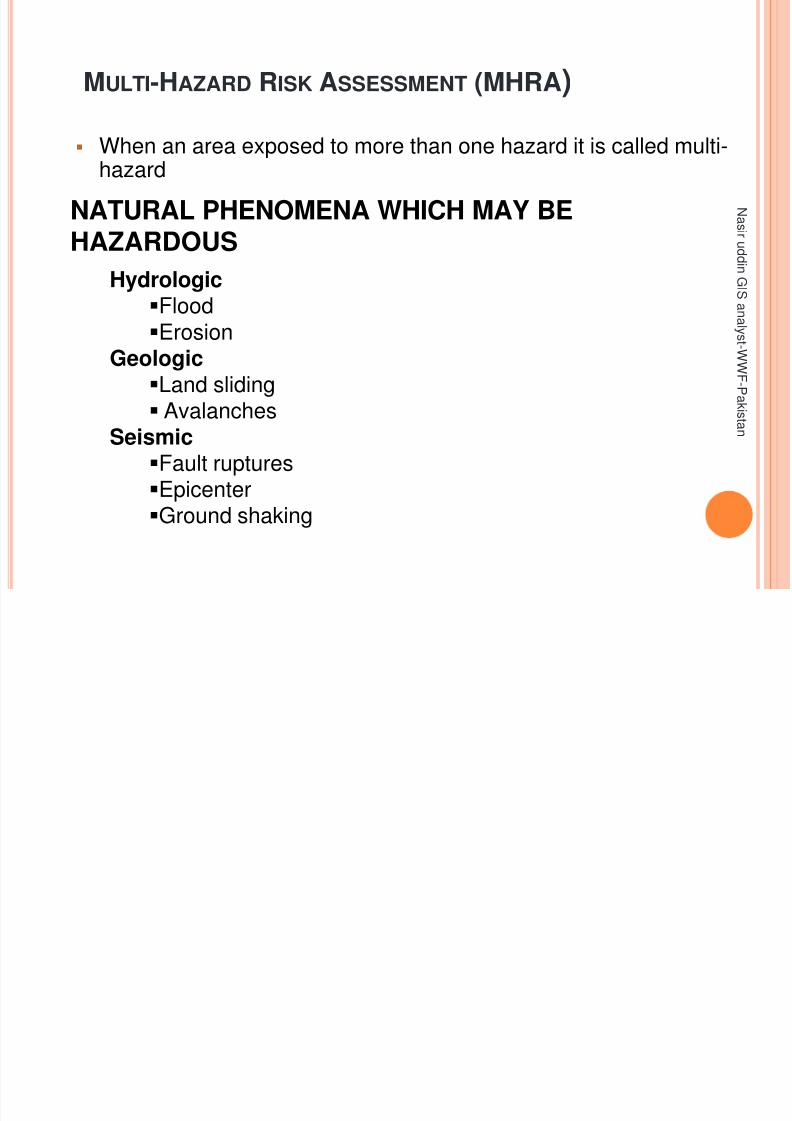
MULTI-HAZARD RISK ASSESSMENT (MHRA)
When an area exposed to more than one hazard it is called multi-hazard
NATURAL PHENOMENA WHICH MAY BEHAZARDOUS
HydrologicFlood
Erosion Geologic
Land sliding
Avalanches
SeismicFault ruptures
Epicenter
Ground shaking
N a s i r u d d i n GI S an al y s t -WWF -P a
k i s t an

8/3/2019 Multi-Hazard Risk Assessment, Mapping and Land Use
http://slidepdf.com/reader/full/multi-hazard-risk-assessment-mapping-and-land-use 4/13
Earthquake Land sliding River floods
Location
EpicenterType of Fault linesSeismic ZoneGeologic formations
InventoriesSlopeGeologic formationsPathType
ChannelFlood wayFlood PlainElevation
Severity
IntensityMagnitudeAccelerationDisplacement
VelocityDisplacement
VolumeVelocityRate of RaiseSlope
Likelihoodof
occurrence
Recurrence intervalHistorical seismicity
EarthquakerecurrenceRainfall patternBank cutting rate
Historical returnperiodFlood recordDesign event
Information Need to Multi-Hazard Study Area
N a s i r u d d i n GI S an al y s t -WWF -P a
k i s t an
8/3/2019 Multi-Hazard Risk Assessment, Mapping and Land Use
http://slidepdf.com/reader/full/multi-hazard-risk-assessment-mapping-and-land-use 5/13
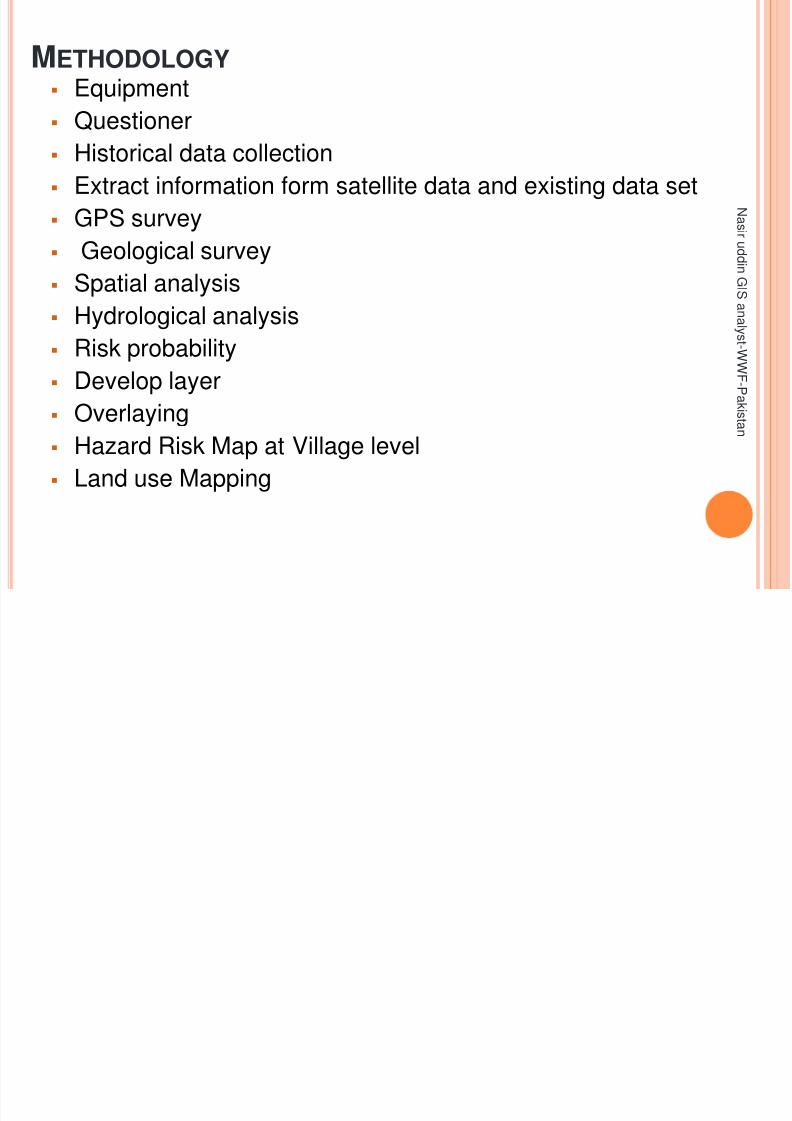
METHODOLOGY Equipment
Questioner
Historical data collection
Extract information form satellite data and existing data set
GPS survey
Geological survey
Spatial analysis
Hydrological analysis
Risk probability
Develop layer
Overlaying Hazard Risk Map at Village level
Land use Mapping
N a s i r u d d i n GI S an al y s t -WWF -P a
k i s t an
8/3/2019 Multi-Hazard Risk Assessment, Mapping and Land Use
http://slidepdf.com/reader/full/multi-hazard-risk-assessment-mapping-and-land-use 6/13
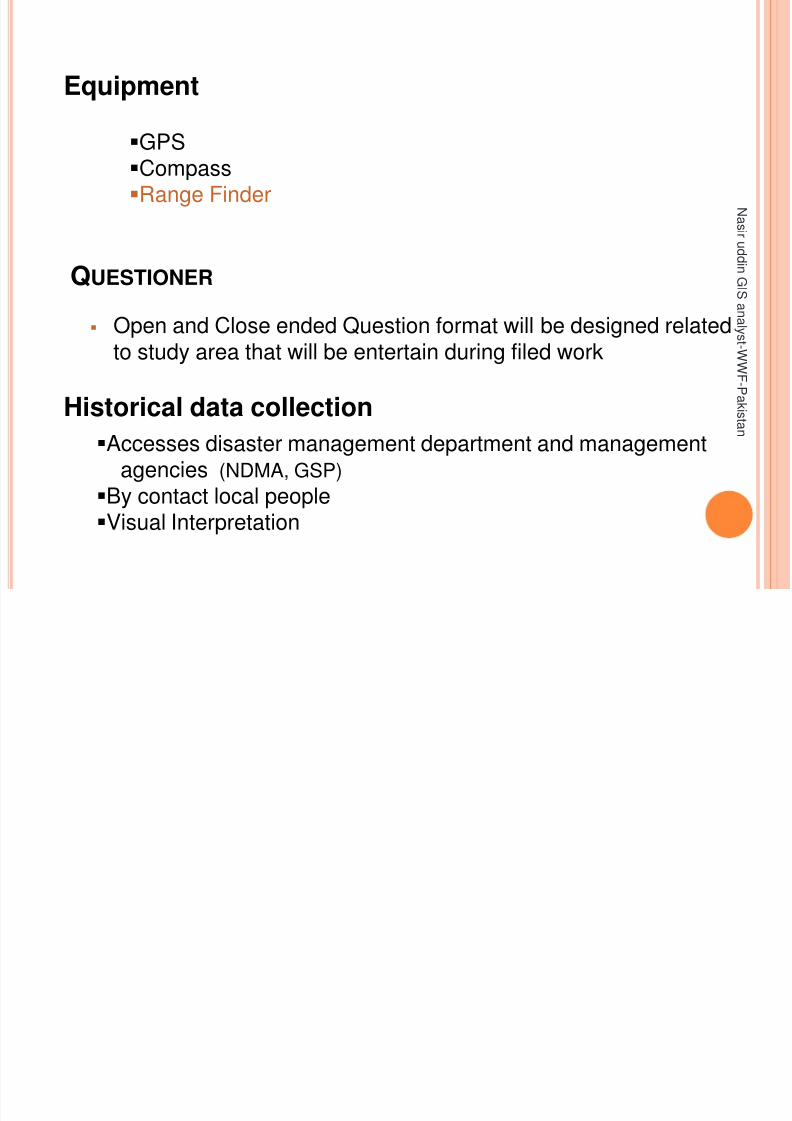
QUESTIONER
Open and Close ended Question format will be designed relatedto study area that will be entertain during filed work
Historical data collectionAccesses disaster management department and management
agencies (NDMA, GSP)
By contact local people
Visual Interpretation
Equipment
GPSCompass
Range Finder N a s i r u d d i n GI S an al y s t -WWF -P a
k i s t an
8/3/2019 Multi-Hazard Risk Assessment, Mapping and Land Use
http://slidepdf.com/reader/full/multi-hazard-risk-assessment-mapping-and-land-use 7/13
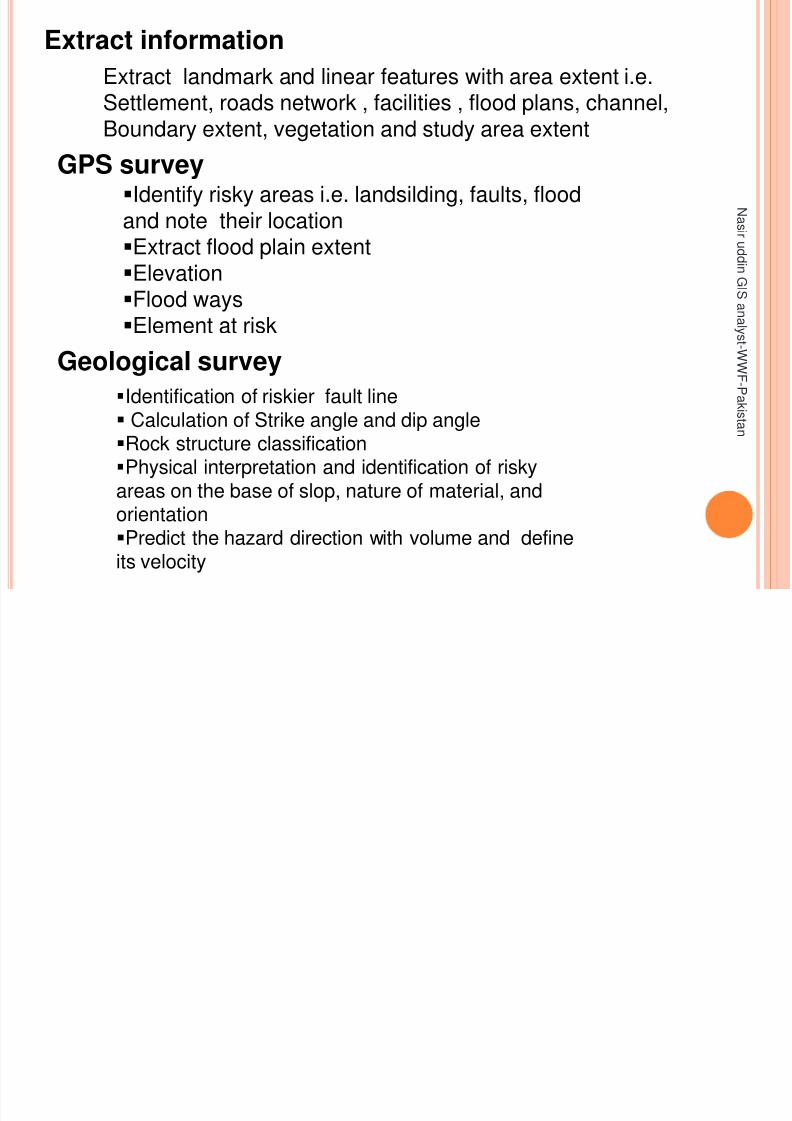
GPS surveyIdentify risky areas i.e. landsilding, faults, floodand note their location
Extract flood plain extent
ElevationFlood ways
Element at risk
Geological survey
Identification of riskier fault line Calculation of Strike angle and dip angleRock structure classificationPhysical interpretation and identification of riskyareas on the base of slop, nature of material, andorientationPredict the hazard direction with volume and defineits velocity
Extract information
Extract landmark and linear features with area extent i.e.Settlement, roads network , facilities , flood plans, channel,
Boundary extent, vegetation and study area extent
N a s i r u d d i n GI S an al y s t -WWF -P ak i s t an
8/3/2019 Multi-Hazard Risk Assessment, Mapping and Land Use
http://slidepdf.com/reader/full/multi-hazard-risk-assessment-mapping-and-land-use 8/13
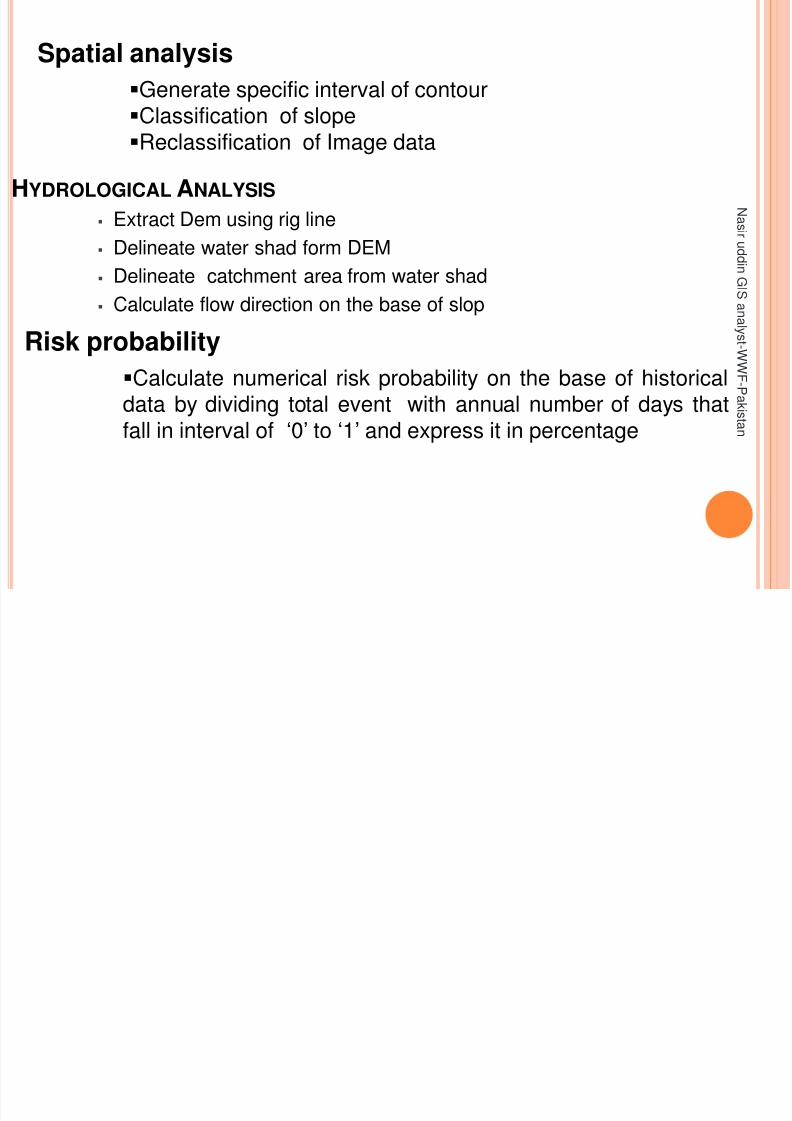
HYDROLOGICAL ANALYSIS Extract Dem using rig line
Delineate water shad form DEM
Delineate catchment area from water shad Calculate flow direction on the base of slop
Spatial analysis
Generate specific interval of contour
Classification of slope
Reclassification of Image data
Risk probability
Calculate numerical risk probability on the base of historical
data by dividing total event with annual number of days thatfall in interval of ‘0’ to ‘1’ and express it in percentage
N a s i r u d d i n GI S an al y s t -WWF -P ak i s t an

8/3/2019 Multi-Hazard Risk Assessment, Mapping and Land Use
http://slidepdf.com/reader/full/multi-hazard-risk-assessment-mapping-and-land-use 9/13
Develop layer
Define datum and projection system
Cerate Layer (Point, Line. Polygon)
Enter attribute data and update all layers
Symbol Earthquake Flood Landslide
Point Epicenter site Flood site Land slide site
Line Faults Flood route,Elevation
Direction of sliding
Polygon Seismic intensityarea
Flood prone area Landslide pronearea
N a s i r u d d i n GI S an al y s t -WWF -P ak i s t an
8/3/2019 Multi-Hazard Risk Assessment, Mapping and Land Use
http://slidepdf.com/reader/full/multi-hazard-risk-assessment-mapping-and-land-use 10/13
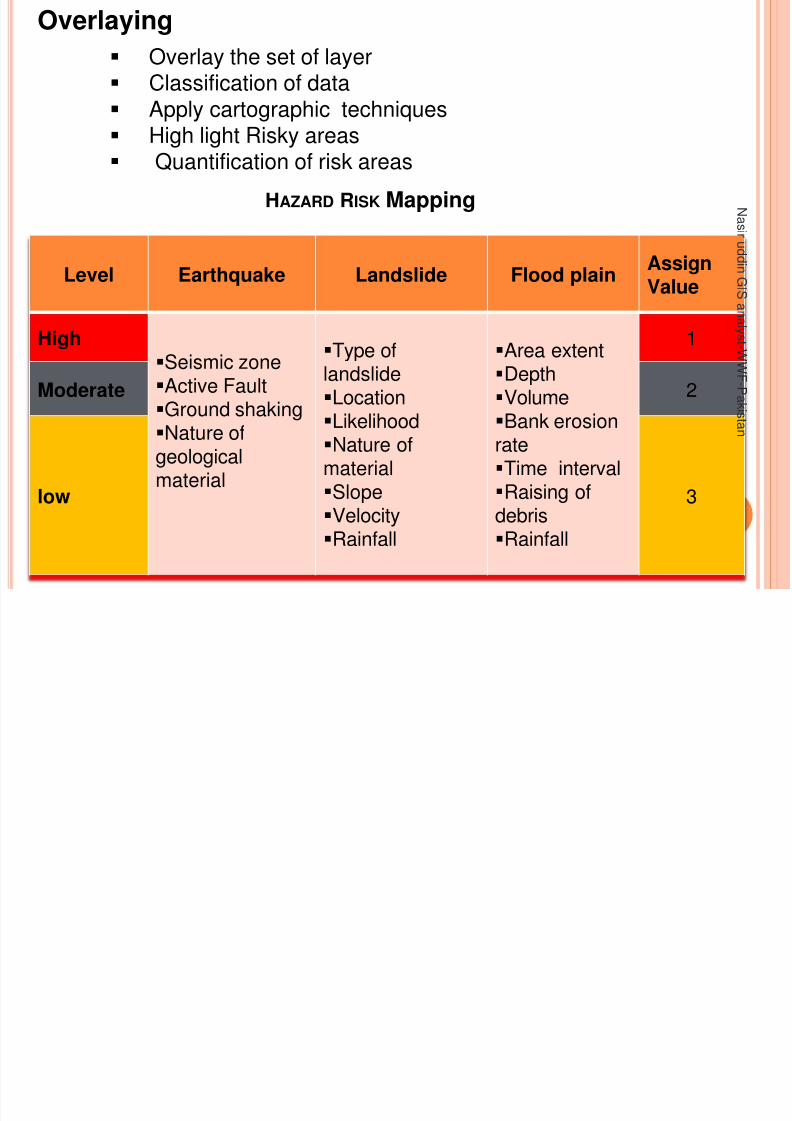
Overlaying
Overlay the set of layer
Classification of data
Apply cartographic techniques
High light Risky areas
Quantification of risk areas
Level Earthquake Landslide Flood plainAssignValue
High
Seismic zoneActive Fault
Ground shakingNature ofgeologicalmaterial
Type oflandslideLocationLikelihoodNature ofmaterialSlopeVelocityRainfall
Area extentDepthVolumeBank erosionrateTime intervalRaising ofdebrisRainfall
1
Moderate 2
low 3
HAZARD RISK Mapping N a s i r u d d i n GI S an al y s t -WWF -P ak i s t an

8/3/2019 Multi-Hazard Risk Assessment, Mapping and Land Use
http://slidepdf.com/reader/full/multi-hazard-risk-assessment-mapping-and-land-use 11/13
HAZARD RISK MAP
N a s i r u d d i n GI S an al y s t -WWF -P ak i s t an

8/3/2019 Multi-Hazard Risk Assessment, Mapping and Land Use
http://slidepdf.com/reader/full/multi-hazard-risk-assessment-mapping-and-land-use 12/13
Land Use Planning
Divide the study area in to zones level
Determine risk level on base of slope, probability of likelihood
event in history, Flood plan extent and depth, land slidingvolume and their vulnerability, terrain model , bank erosion rate,ground shake value and faults pass though an area anddistance form epicenter
For Zone 1:It can be allowed to be usedfor: – Big buildings –
Big factories – Residential areas – Agricultural activities
For Zone 2:It can be allowed to be used for: – Agricultural activities like: rice plantation,
bean plantation, corn plantation, etc.
For Zone 3:In Zone 4 very limited activities can beallowed like: – Fishing activities –
Pumping water for irrigation purposes
N a s i r u d d i n GI S an al y s t -WWF -P ak i s t an

8/3/2019 Multi-Hazard Risk Assessment, Mapping and Land Use
http://slidepdf.com/reader/full/multi-hazard-risk-assessment-mapping-and-land-use 13/13
Thank N a s i r u d d i n GI S an al y s t -WWF -P ak i s t an