multi-body dynamic analysis of float-over …opus.bath.ac.uk/33626/1/sun_ocean_eng_2012.pdf3...
TRANSCRIPT
1
* Manuscript Accepted for publication in Ocean Engineering, 2012
Multi-body dynamic analysis of float-over installations
L. Sun∗a, R. Eatock Taylora,b and Y. S. Chooa
a Centre for Offshore Research & Engineering and Department of Civil & Environmental Engineering, National University of
Singapore, Singapore 117576
b Department of Engineering Science, University of Oxford, Oxford OX1 3PJ, UK
Abstract
The paper investigates the interaction effects due to diffraction by a large volume substructure and an installation barge, during the operation of setting the deck onto the substructure. Linear theory is adopted. The barge motions are constrained by attachments to the fixed substructure, and the effects of the constraints are modeled here by a two-stage hydrodynamic/dynamic analysis. The multi-body diffraction problem is first solved without any constraints between the bodies, and in the second stage the constrained equations of motion are solved. The analysis is validated through comparisons with published results for five interconnected barges. Three configurations of substructure are then investigated for an installation configuration: a non-diffracting steel space framed structure (as a reference case); an array of four large diameter vertical columns mounted on the seabed and a Gravity Based Structure consisting of the same four columns with a subsurface caisson.
Key words: Float-over installations; Multi-body diffraction; Constrained dynamic systems.
1. Introduction
The float-over method has become increasingly popular in the installation of large decks onto offshore platforms (Tahar et al. 2004, Cholley et al. 2009, Cheung 2010), due to its large capacity and cost effectiveness. When the substructure is a steel space frame structure, it has comparatively little effect on the wave field. However, when the dimensions of the substructures are sufficiently large, for example, in the case of a gravity based platform, the influence of diffraction by the substructure should be investigated in the analysis. Furthermore, in float-over installations, horizontal motions of the lifting barge must be small enough to the allow docking legs to be captured in the guide funnels. Lashing lines are adopted in many practical operations (Tahar et al., 2004). The constraint forces applied through the lashing lines are an important issue that should be considered in design.
Other multi-body systems in marine engineering include tower-yoke mooring systems, floating LNG barge-tanker systems, some wave energy converters, etc. Each can generally be defined as a system consisting of multiple floating (or fixed) bodies linked by rigid or flexible constraints. To analyze such a multi-body system involving multi-body wave diffraction/radiation, there are various numerical approaches that can be adopted within the framework of potential flow theory. The first type of approach can be described as a
∗ Corresponding author. Email: [email protected]

2
“two-stage” formulation, in which the hydrodynamics problem is solved first, leading to the wave excitation forces and the hydrodynamic coefficients (added mass and radiation damping) in the frequency domain. Then the equations of motion are formulated, considering the method of connection between the modules, other external forces, etc. The equations of motions can be expressed in the frequency domain or the time domain, depending on the type of problem and the possible importance of nonlinear effects in moorings/constraints. In linear frequency domain analysis, the excitation forces and hydrodynamic coefficients can be used directly. For equations of motions in the time domain, however, the frequency domain results can be transformed into corresponding terms in the time domain, using the convolution approach described by Cummins (1962). Langley (1984) derived the equations of motion in the frequency domain by considering each body as a "super element" in a multi-body system. His method was applied to both SBS and Yoke-CALM designs of offshore mooring terminal. Ó’ Catháin et al. (2008) modeled rigid-body dynamics in the time domain by using the Newton-Euler equations of motion and eliminating degrees of freedom associated with the constraints. They analyzed the responses of a two-body hinged-barge wave-energy system, and validated their numerical results have by using results from wave-tank experiments. Sun et al (2011) developed and validated an implementation of the two-stage approach, using Lagrange multipliers to develop the constraint equations, and showed how the constraint forces may be obtained directly from the solution of the resulting equations. Several techniques for formulating the equations of motion for constrained multiple rigid bodies (without the fluid) can also be found in the book of Shabana (2010). The “two-stage” methods offer great flexibility for systems which have complex constraints or where the linking components require optimization.
In the second type of approach, the mode expansion technique is adopted to solve the whole coupled problem directly (e.g. Newman 1994, Lee and Newman 2000, Taghipour and Moan 2008). For systems involving many constraints or several connected bodies, this direct method would appear to be more efficient than the first approach, because the size of the problem can be reduced significantly compared with the “two-stage” methods. Lee and Newman (2000) used this approach to assess the effects of hydroelasticity on large arrays of hinged structures. Taghipour and Moan (2008) used the same technique to investigate the dynamic response of a multi-body wave energy converter in multi-directional waves.
The above work is based on linear frequency domain models of the hydrodynamics, in some cases using the Cummins convolution to transform to the time domain. Fully time domain models of the hydrodynamics have also been developed to analyze multi-body systems, by using a numerical wave tank (Kral and Kreuzer 1999, Guerber et al. 2010). This allows the investigation of behaviour in large amplitude waves. Kral and Kreuzer (1999) simulated the response of two connected bodies using a two-dimensional numerical wave tank. Such an approach in three dimensions would be computationally very intensive, and is not appropriate in the context of the present investigation.
In this paper, we undertake an analysis of a multi-body system similar to the configuration of a float-over installation, and study the effects of diffraction by the substructure. Under the environmental conditions relevant to installation operations, the incident waves may be assumed to be relatively small, and it is appropriate to use the assumptions of linear potential flow theory. Generally there will be only a small number of modules in system, so the “two-stage” method is adopted in the present investigation. In the next section, the theory used in the hydrodynamic and dynamic analyses is briefly reviewed, based on the method presented by Sun et al (2011). Section 3 analyzes the motions and constraint forces of a five hinged rectangular barge system, as a means of validating the method by comparing with published results based on the mode expansion method. The present method is then applied to a float-over installation configuration in section 4, where the effects of constraints are addressed. Discussion of the results and some conclusions are given in the final section.
2. Theoretical background to the suggested method
Under the assumptions of an incompressible and inviscid fluid with irrotational motion, a scalar velocity potential ( , , , )x y z tΦ that satisfies the Laplace equation can be defined in the fluid domain, i.e.
2 ( , , , ) 0x y z t∇ Φ = . (1)

3
Float-over installations are usually deployed in relative calm sea states, so linear analysis is an appropriate method for describing the interaction problem. For monochromatic incident waves, the velocity potential can then be expressed in complex spatial form as:
i( , , , ) Re[ ( , , ) ]tx y z t x y z e ωφ −Φ = . (2)
Excitation forces on and motions of the rigid bodies in the time domain can be written as
{ } i( ) Re[ ( ) ]tt f e ωω −=F , (3)
{ } i( ) Re[ ( ) ]tt e ωω −=Ξ ξΞ ξΞ ξΞ ξ . (4)
In the above equations, { }( )f ω and { }( )ωξξξξ are frequency dependent vectors which include 6N components
for a system consisting of N bodies.
The equations of motion of the rigid bodies in the absence of any physical connections take the following form in frequency domain:
( ) ( ) ( ) { } { }2 ( ) i ( ) ( ) ( )H H H fω ω ω ω ω ω − + − + + + = M A B B C C ξξξξ . (5)
Here the matrix M is the rigid body mass matrix for the N bodies, while B and C are system damping and stiffness matrices. Matrix HC represents the hydrostatic restoring coefficients. Matrices ( )H ωA and BH
(ω ) are the added mass and damping matrices which can be obtained by solving 6N radiation problems. The wave excitation forces and moments { }( )f ω , hydrodynamic coefficients ( )H ωA and BH
(ω ) are evaluated here
by the computer program DIFFRACT (Eatock Taylor and Chau 1992, Zang et al. 2006, Walker et al. 2008, Sun et al. 2010). This is diffraction/radiation code which solves the three-dimensional wave-structure interaction problem by using a quadratic boundary element method. In the present version of the code, partial discontinuous elements have been adopted to remove the irregular frequencies: as a result, corresponding meshes on the inner free surface are needed. More details of the method used for removing irregular frequencies can be found in the paper of Sun et al. (2008). As mentioned by Matsui and Tamaki (1981), the hydrodynamic coefficients ( )H ωA and BH
(ω ) of the floating bodies may change dramatically due to the
presence of neighboring large dimensional substructures. Furthermore, hydrodynamic forces due to the motion of another body (coupling terms) cannot be neglected in the calculations for multiple floating bodies. These two aspects have been considered in present method.
For simplicity, equation (5) can be written as
[ ]{ } { }K f=ξξξξ . (6)
If there are rigid constraints between some of the degree of freedom in the system of rigid bodies, the constraints can be described by the following equation
[ ]{ } 0=ξD . (7)
Here [ ]D is constraint matrix, which defines the connectivity between the modules in the system.
To consider a constrained floating multi-body system in the wave field, Lagrange multipliers { }λ are
introduced (Shabana 2010, for example, describes the general approach for mechanical systems). The equations of motion can then be rewritten as

4
00
T fξλ
=
K D
D, (8)
where superscript T denotes the transpose. The motions of the rigid bodies { }ξξξξ and the generalized constraint
forces (which are equivalent to the Lagrange multipliers { }λ ) can then be obtained directly by solving
equation (8). Details about the derivation of the above equations and illustration of the advantages of this direct approach can be found in the paper of Sun et al. (2011).
3. Motions and constraint forces in the array of barges
To validate the method of analyzing interconnected bodies, an array consisting of five identical rectangular barge modules in infinite water depth has been investigated. The modules are connected by horizontal hinges, and are excited by regular waves propagating along the longitudinal axis of the array. The details of the barges and the positions of the hinges are shown in Figure 1. The dimensions of each module are length L=300 m, beam B=80 m, and draft T=6 m. This case was investigated by Lee and Newman (2000), who evaluated vertical motions and vertical constraint forces at the hinges by using the mode expansion technique. They obtained results for both rigid and flexible bodies with different stiffness. Their results of rigid bodies are compared here with those obtained using the method discussed above.
Figure 1 Five barges with hinge connections
3.1 Vertical motions at hinges
Figure 2 shows the amplitudes of vertical motion at the hinges per unit incident wave amplitude (RAO). Satisfactory agreement is obtained between the two sets of results. The very slight discrepancies which may be seen are believed to be due to the inaccuracy in reading off the graphs in Lee and Newman (2000). Unfortunately, some data points in the results for hinges 3 and 4 (in the ranges of 14.3s<T<16.0s and 10.3s<T<13.2s respectively) are missing in the published paper (Lee and Newman 2000).
6 9 12 15 18 21 24 27 300.0
0.2
0.4
0.6
0.8
1.0
1.2
1.4
1.6
V
ertic
al M
otio
n
T(s)
Lee & Newman Present
Hinge 1
6 9 12 15 18 21 24 27 300.0
0.2
0.4
0.6
0.8
1.0
1.2
1.4
1.6
Ver
tical
Mot
ion
T(s)
Lee & Newman Present
Hinge 2

5
6 9 12 15 18 21 24 27 300.0
0.2
0.4
0.6
0.8
1.0
1.2
1.4
1.6
Ver
tical
Mot
ion
T(s)
Lee & Newman Present
Hinge 3
6 9 12 15 18 21 24 27 300.0
0.2
0.4
0.6
0.8
1.0
1.2
1.4
1.6
Ver
tical
Mot
ion
T(s)
Lee & Newman Present
Hinge 4
Figure 2 Vertical motions at hinges
3.2 Constraint forces acting on hinges
Comparisons of the vertical constraint forces acting on each hinge are shown in figure 3. These are normalized by 2gAlρ , where ρ is the fluid density, g is the acceleration due to gravity, A the incident wave amplitude,
and 2l is a reference area equal to 1 m2. Good agreement is again obtained, including the pronounced oscillations in the curves for the forces in hinges 3 and 4 at the shorter periods.
6 9 12 15 18 21 24 27 300
500
1000
1500
2000
2500
3000
3500
Ver
tical
Con
stra
ints
For
ce
T(s)
Lee & Newman Present
Hinge 1
6 9 12 15 18 21 24 27 300
500
1000
1500
2000
2500
3000
3500
Ver
tical
Con
stra
ints
For
ce
T(s)
Lee & Newman Present
Hinge 2
6 9 12 15 18 21 24 27 300
500
1000
1500
2000
2500
3000
3500
Ver
tical
Con
stra
ints
For
ce
T(s)
Lee & Newman Present
Hinge 3
6 9 12 15 18 21 24 27 300
500
1000
1500
2000
2500
3000
3500
Ver
tical
Con
stra
ints
For
ce
T(s)
Lee & Newman Present
Hinge 4
Figure 3 Vertical constraint force acting on each hinge
As is evident from Equation (8), all the motions of every module, the displacements and relative angles at every hinge, and the constraint forces acting on every hinge can be obtained directly from the calculations. Both horizontal and vertical constraint forces could be important in the design of the hinges, and these have been

6
plotted in figure 4. In the horizontal forces shown in figure 4(a), it is interesting to see that almost same peak value is obtained for all four hinges at T ≈ 22s (corresponding to an incident wavelength of 755.43m, which is about half the length of the whole array). In longer waves (T > 22s), the horizontal and vertical constraint forces acting on hinges 1 and 4, and hinges 2 and 3, are almost the same, as might be expected in long waves.
6 9 12 15 18 21 24 27 300
150
300
450
600
750
Hor
izon
tal C
onst
rain
ts F
orce
T(s)
Hinge 1 Hinge 2 Hinge 3 Hinge 4
6 9 12 15 18 21 24 27 300
500
1000
1500
2000
2500
3000
3500
Ver
tical
Con
stra
ints
For
ce
T(s)
Hinge 1 Hinge 2 Hinge 3 Hinge 4
Figure 4 Horizontal and vertical constraint forces acting on hinges
4. Dynamic analyses in float-over installations
In float-over installations, the lifting barges and the fixed substructure comprise the multi-body system. In many situations, lashing lines are used in order to limit the horizontal motions of the barge. In the present analyses, the lashing system has been simplified and modeled by ideal rigid bars attached to the substructure; so at the ends of bars in contact with the barge, there are no horizontal motions. The barge can heave freely and have roll and pitch motions. In the following, four cases are considered, in each of which the barge motions are evaluated, and in three of which the constraint forces on the barge are also obtained. The four cases correspond to the following configurations.
1. The lifting barge supporting the deck is freely floating, and located far from any diffracting structure (named ‘Freely floating’ in the following comparisons)
2. The substructure is a slender lattice or jacket structure. During the float-over installation, there are ideal horizontal constraints between barge and substructure (named ‘Lattice’ in the following comparisons). In this case, the substructure has no effect on the wave field, and it is modeled as a rigid structure.
3. The substructure consists of four columns, and there are the same ideal horizontal constraints between barge and substructure (named ‘Columns only’ in the following comparisons). In this and the next configuration, the diffraction effect due to the substructure will be considered. There is thus a two-way interaction, with the scattered and radiated wave field from the barge being diffracted by the substructure; and the scattered field from the substructure being diffracted by the barge. Again, the substructure is taken to be rigid.
4. The substructure consists of four columns supported by a caisson, and the same ideal horizontal constraints are applied between barge and substructure (named ‘Columns + Caisson’ in the following comparisons).
The gravity-based substructure for cases 3 and 4 is the one investigated by Walker et al. (2008). The origin of the coordinates is at the centre of the barge at the mean water level. Details of these two configurations, including the column diameters and spacing are shown in figure 5. The minimum gaps between the four vertical columns and the barge are 2.75m. The height of the rectangular caisson in figure 5(b) is 15m.

7
(a) Case 3 (b) Case 4
Figure 5 Plan view of barge and gravity based substructures (unit: m)
The main dimensions of the barge, and the mass properties of the barge with the deck are shown in table 1. In order to calculate realistic values of roll, it is necessary to account for additional damping due to viscous effects. This additional roll damping is taken to have the value 2.39E9 N·m/(rad/s), which is estimated from the empirical model developed by Tromans (2008). The ideal horizontal constraints provided by the bars are applied in line with the barge deck, which is 3.2m above the mean water level. The water depth is taken as 53.13m.
Table 1 Dimensions and mass properties of barge (with Deck)
Length of barge (L) 190.0 meters
Breadth of barge (B) 38.7 meters Mean draft of barge (T) 9.3 meters Displacement of barge 70,000 tones Coordinates of Centre of gravity (0, 0, 6.0) meters Metacentric height (GM) 2.77 meters Roll radius of gyration (Rxx) 20.0 meters Pitch radius of gyration (Ryy) 48.0 meters Yaw radius of gyration (Rzz) 48.0 meters
In the DIFFRACT hydrodynamic models for cases 3 and 4, the boundary element meshes on the wet body surfaces are shown in figure 6. Two planes of geometric symmetry are adopted to facilitate the calculations, with waves incident from any arbitrary direction. Corresponding meshes on the inner free surface, used here to avoid the occurrence of irregular frequencies, are shown in figure 7. The same meshes on the barge and its inner free surface are adopted for cases 1 and 2. These are designated “Mesh 1” in the following.
(a) Case 3 (b) Case 4
Figure 6 Meshes on the body surfaces
8
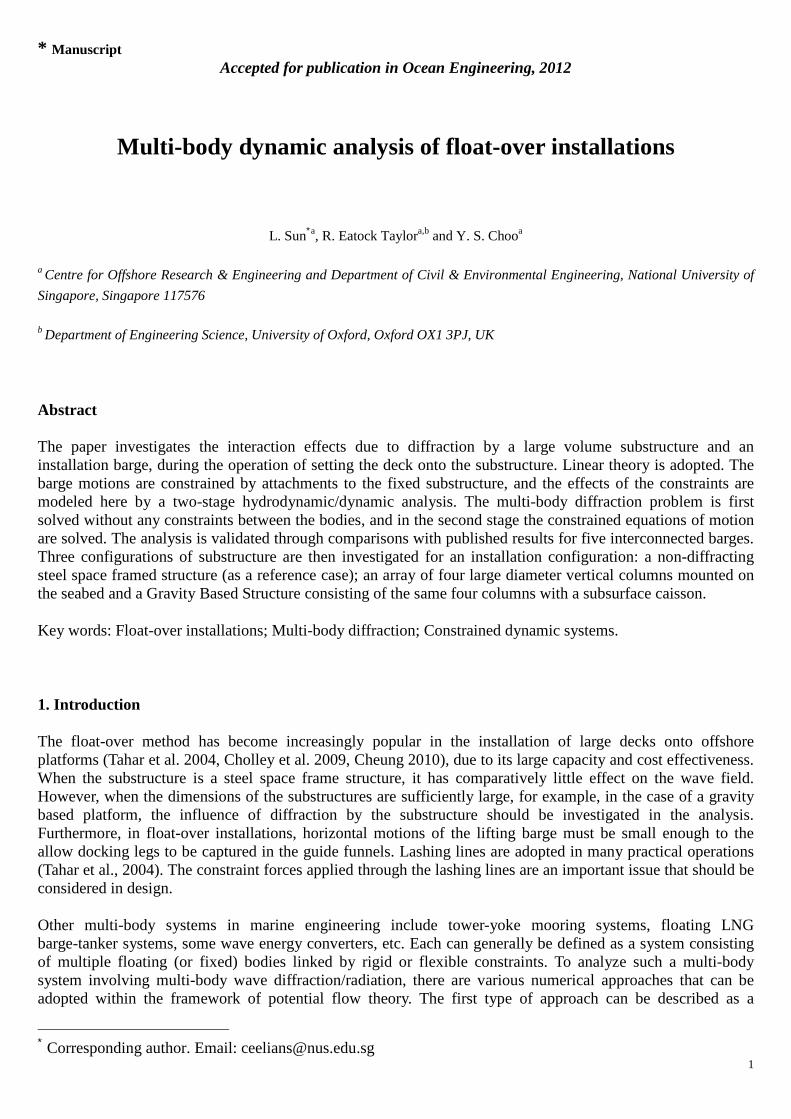
Figure 7 Meshes on the inner free surfaces
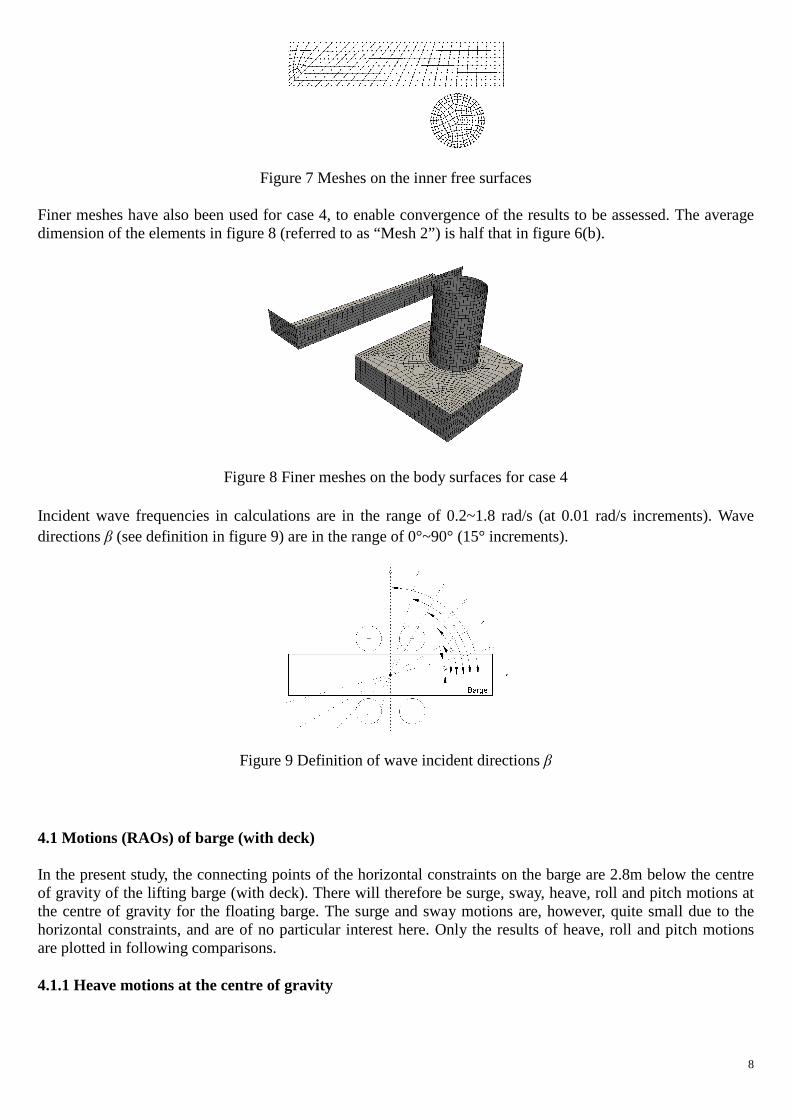
Finer meshes have also been used for case 4, to enable convergence of the results to be assessed. The average dimension of the elements in figure 8 (referred to as “Mesh 2”) is half that in figure 6(b).
Figure 8 Finer meshes on the body surfaces for case 4
Incident wave frequencies in calculations are in the range of 0.2~1.8 rad/s (at 0.01 rad/s increments). Wave directions β (see definition in figure 9) are in the range of 0°~90° (15° increments).
Figure 9 Definition of wave incident directions β
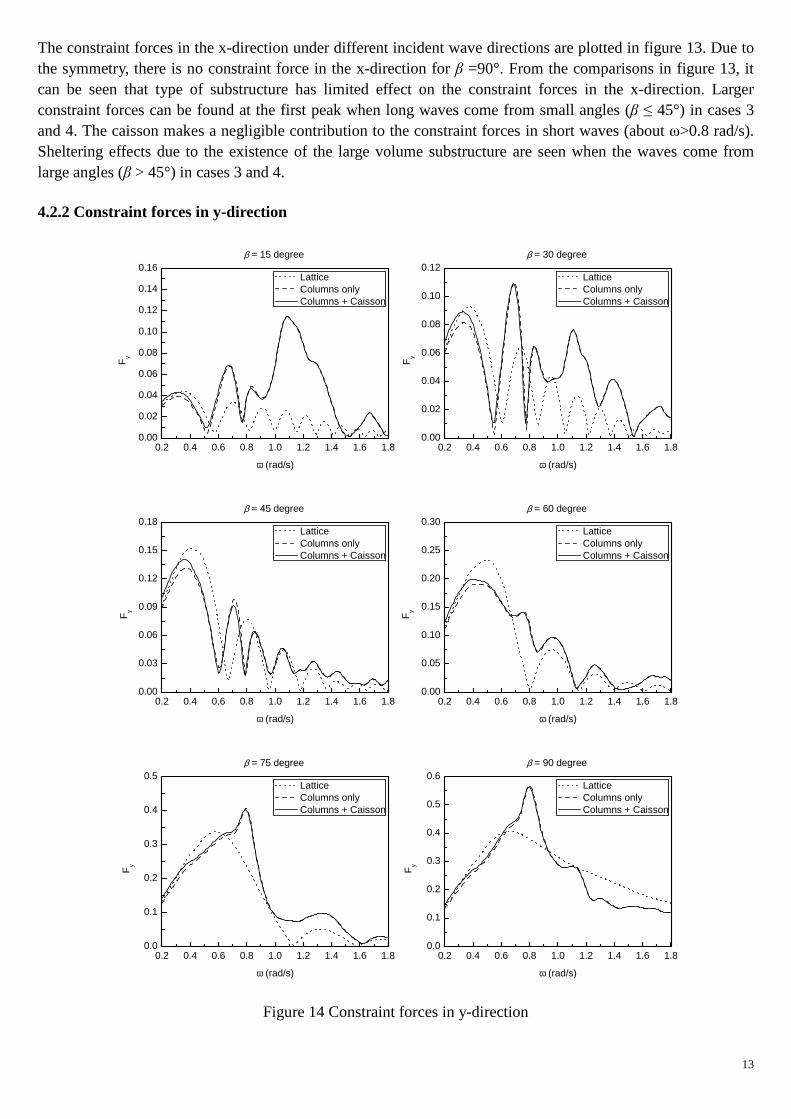
4.1 Motions (RAOs) of barge (with deck)
In the present study, the connecting points of the horizontal constraints on the barge are 2.8m below the centre of gravity of the lifting barge (with deck). There will therefore be surge, sway, heave, roll and pitch motions at the centre of gravity for the floating barge. The surge and sway motions are, however, quite small due to the horizontal constraints, and are of no particular interest here. Only the results of heave, roll and pitch motions are plotted in following comparisons.
4.1.1 Heave motions at the centre of gravity
9
0.2 0.4 0.6 0.8 1.0 1.2 1.4 1.6 1.80.0
0.2
0.4
0.6
0.8
1.0β = 0 degree
Hea
ve
ω (rad/s)
Freely floating Lattice Columns only Columns + Caisson
0.2 0.4 0.6 0.8 1.0 1.2 1.4 1.6 1.80.0
0.2
0.4
0.6
0.8
1.0β = 15 degree
Hea
ve
ω (rad/s)
Freely floating Lattice Columns only Columns + Caisson
0.2 0.4 0.6 0.8 1.0 1.2 1.4 1.6 1.80.0
0.2
0.4
0.6
0.8
1.0β = 30 degree
Hea
ve
ω (rad/s)
Freely floating Lattice Columns only Columns + Caisson
0.2 0.4 0.6 0.8 1.0 1.2 1.4 1.6 1.80.0
0.2
0.4
0.6
0.8
1.0β = 45 degree
Hea
ve
ω (rad/s)
Freely floating Lattice Columns only Columns + Caisson
0.2 0.4 0.6 0.8 1.0 1.2 1.4 1.6 1.80.0
0.2
0.4
0.6
0.8
1.0
1.2
1.4β = 75 degree
Hea
ve
ω (rad/s)
Freely floating Lattice Columns only Columns + Caisson
0.2 0.4 0.6 0.8 1.0 1.2 1.4 1.6 1.80.0
0.2
0.4
0.6
0.8
1.0
1.2
1.4
1.6β = 90 degree
Hea
ve
ω (rad/s)
Freely floating Lattice Columns only Columns + Caisson
Figure 10 Heave motions of barge

10
Heave motions of the barge in the four cases in all the incident directions (0°~90°) are shown in figure 10. It is not surprising that the same heave motions are obtained in cases 1 and 2 because the constraints are only applied in the horizontal directions, and there is no sway-heave coupling because of symmetry. Generally, larger heave motions arise when the diffraction effects of the substructures cannot be ignored, as in cases 3 and 4 over part of the frequency range considered. Noticeable differences at the peak values can be found in the results for β =45°, 60° and 75°; but there are no such large differences in peak values in the beam sea case (β =90°). The large volume substructures cause the peak values to shift to lower frequencies when β = 75° and 90°. From a comparison of the results for cases 3 and 4, it can be seen that the effect of the caisson is relatively small, but not negligible for this particular geometry.
4.1.2 Roll motions
0.2 0.4 0.6 0.8 1.0 1.2 1.4 1.6 1.80.00
0.05
0.10
0.15
0.20
0.25β = 15 degree
Rol
l (de
gree
)
ω (rad/s)
Freely floating Lattice Columns only Columns + Caisson
0.2 0.4 0.6 0.8 1.0 1.2 1.4 1.6 1.80.0
0.1
0.2
0.3
0.4
0.5
0.6β = 30 degree
Rol
l (de
gree
)
ω (rad/s)
Freely floating Lattice Columns only Columns + Caisson
0.2 0.4 0.6 0.8 1.0 1.2 1.4 1.6 1.80.0
0.2
0.4
0.6
0.8
1.0β = 45 degree
Rol
l (de
gree
)
ω (rad/s)
Freely floating Lattice Columns only Columns + Caisson
0.2 0.4 0.6 0.8 1.0 1.2 1.4 1.6 1.80.0
0.2
0.4
0.6
0.8
1.0
1.2
1.4β = 60 degree
Rol
l (de
gree
)
ω (rad/s)
Freely floating Lattice Columns only Columns + Caisson
0.2 0.4 0.6 0.8 1.0 1.2 1.4 1.6 1.80.0
0.4
0.8
1.2
1.6
2.0β = 75 degree
Rol
l (de
gree
)
ω (rad/s)
Freely floating Lattice Columns only Columns + Caisson
0.2 0.4 0.6 0.8 1.0 1.2 1.4 1.6 1.80.0
0.4
0.8
1.2
1.6
2.0β = 90 degree
Rol
l (de
gree
)
ω (rad/s)
Freely floating Lattice Columns only Columns + Caisson
Figure 11 Roll motions of barge

11
Roll motions of the barge in the four cases in the same incident directions are shown in figure 11. Due to the geometrical symmetry, there is no roll motion for β =0°. Although only linear viscous roll damping is considered in the current analysis, some useful observations can be made. Comparing case 1 with the other cases, one can see that the roll motions increase significantly when rigid horizontal constraints applied, especially in case 2, the lattice structure. The peak values of roll motions lie in the range 0.4~0.45 rad/s (corresponding to wave periods of 13.96~15.71 s), which are near to the peak periods of the wave energy spectrum in severe sea states, but probably not relevant for this configuration under operating conditions for the installation. Large roll motions may also introduce appreciable mating forces in float-over installations. Comparing cases 2 and 3, the sheltering effect of the vertical columns reduce the peak values of the roll motions. In case 4, the caisson increases the peak values slightly, compared with case 3 without the caisson.
4.1.3 Pitch motions
0.2 0.4 0.6 0.8 1.0 1.2 1.4 1.6 1.80.0
0.2
0.4
0.6
0.8
1.0β = 0 degree
Pitc
h (d
egre
e)
ω (rad/s)
Freely floating Lattice Columns only Columns + Caisson
0.2 0.4 0.6 0.8 1.0 1.2 1.4 1.6 1.80.0
0.2
0.4
0.6
0.8
1.0β = 15 degree
Pitc
h (d
egre
e)
ω (rad/s)
Freely floating Lattice Columns only Columns + Caisson
0.2 0.4 0.6 0.8 1.0 1.2 1.4 1.6 1.80.0
0.2
0.4
0.6
0.8
1.0β = 30 degree
Pitc
h (d
egre
e)
ω (rad/s)
Freely floating Lattice Columns only Columns + Caisson
0.2 0.4 0.6 0.8 1.0 1.2 1.4 1.6 1.80.0
0.2
0.4
0.6
0.8
1.0β = 45 degree
Pitc
h (d
egre
e)
ω (rad/s)
Freely floating Lattice Columns only Columns + Caisson
0.2 0.4 0.6 0.8 1.0 1.2 1.4 1.6 1.80.0
0.2
0.4
0.6
0.8
1.0
1.2
1.4β = 60 degree
Pitc
h (d
egre
e)
ω (rad/s)
Freely floating Lattice Columns only Columns + Caisson
0.2 0.4 0.6 0.8 1.0 1.2 1.4 1.6 1.80.0
0.2
0.4
0.6
0.8
1.0β = 75 degree
Pitc
h (d
egre
e)
ω (rad/s)
Freely floating Lattice Columns only Columns + Caisson
Figure 12 Pitch motions of barge

12
The corresponding pitch motions of the barge are shown in figure 12. Due to the geometrical symmetry, there is no pitch motion for β =90°. In figure 12, the horizontal constraints are seen to have a slight effect on the pitch motions (comparing cases 1 and 2). In comparisons between case 2 and last two cases, one can observe that the large substructures introduce larger pitch motions in incident wave angles β <45°. Up to ~8% of the contributions are from the vertical columns and ~7% from caisson. Some kind of sheltering effect on the pitch motions by the substructures are found when β >45°, and smaller pitch motions are obtained at the peak frequencies. Maximum pitch motions are found when β =60° in all four cases.
4.2 Constraint forces, moments and excitation forces acting on the barge
The constraint forces and the wave excitation forces in the following comparisons are here non-dimensionalised by ρgALB; the moments of the constraint forces are non-dimensionalised by ρgALBT (where L, B and T are defined in Table 1). Only the last three configurations (cases 2, 3 and 4) are considered.
4.2.1 Constraint forces in x-direction
0.2 0.4 0.6 0.8 1.0 1.2 1.4 1.6 1.80.00
0.02
0.04
0.06
0.08
0.10
0.12β = 0 degree
Fx
ω (rad/s)
Lattice Columns only Columns + Caisson
0.2 0.4 0.6 0.8 1.0 1.2 1.4 1.6 1.80.00
0.02
0.04
0.06
0.08
0.10
0.12β = 15 degree
Fx
ω (rad/s)
Lattice Columns only Columns + Caisson
0.2 0.4 0.6 0.8 1.0 1.2 1.4 1.6 1.80.00
0.02
0.04
0.06
0.08
0.10
0.12β = 30 degree
Fx
ω (rad/s)
Lattice Columns only Columns + Caisson
0.2 0.4 0.6 0.8 1.0 1.2 1.4 1.6 1.80.00
0.02
0.04
0.06
0.08
0.10
0.12β = 45 degree
Fx
ω (rad/s)
Lattice Columns only Columns + Caisson
0.2 0.4 0.6 0.8 1.0 1.2 1.4 1.6 1.80.00
0.02
0.04
0.06
0.08
0.10
0.12β = 60 degree
Fx
ω (rad/s)
Lattice Columns only Columns + Caisson
0.2 0.4 0.6 0.8 1.0 1.2 1.4 1.6 1.80.00
0.02
0.04
0.06
0.08
0.10
0.12β = 75 degree
Fx
ω (rad/s)
Lattice Columns only Columns + Caisson
Figure 13 Constraint forces in x-direction
13
The constraint forces in the x-direction under different incident wave directions are plotted in figure 13. Due to the symmetry, there is no constraint force in the x-direction for β =90°. From the comparisons in figure 13, it can be seen that type of substructure has limited effect on the constraint forces in the x-direction. Larger constraint forces can be found at the first peak when long waves come from small angles (β ≤ 45°) in cases 3 and 4. The caisson makes a negligible contribution to the constraint forces in short waves (about ω>0.8 rad/s). Sheltering effects due to the existence of the large volume substructure are seen when the waves come from large angles (β > 45°) in cases 3 and 4.
4.2.2 Constraint forces in y-direction
0.2 0.4 0.6 0.8 1.0 1.2 1.4 1.6 1.80.00
0.02
0.04
0.06
0.08
0.10
0.12
0.14
0.16β = 15 degree
Fy
ω (rad/s)
Lattice Columns only Columns + Caisson
0.2 0.4 0.6 0.8 1.0 1.2 1.4 1.6 1.80.00
0.02
0.04
0.06
0.08
0.10
0.12β = 30 degree
Fy
ω (rad/s)
Lattice Columns only Columns + Caisson
0.2 0.4 0.6 0.8 1.0 1.2 1.4 1.6 1.80.00
0.03
0.06
0.09
0.12
0.15
0.18β = 45 degree
Fy
ω (rad/s)
Lattice Columns only Columns + Caisson
0.2 0.4 0.6 0.8 1.0 1.2 1.4 1.6 1.80.00
0.05
0.10
0.15
0.20
0.25
0.30β = 60 degree
Fy
ω (rad/s)
Lattice Columns only Columns + Caisson
0.2 0.4 0.6 0.8 1.0 1.2 1.4 1.6 1.80.0
0.1
0.2
0.3
0.4
0.5β = 75 degree
Fy
ω (rad/s)
Lattice Columns only Columns + Caisson
0.2 0.4 0.6 0.8 1.0 1.2 1.4 1.6 1.80.0
0.1
0.2
0.3
0.4
0.5
0.6β = 90 degree
Fy
ω (rad/s)
Lattice Columns only Columns + Caisson
Figure 14 Constraint forces in y-direction

14
The constraint forces in the y-direction under different incident wave directions are plotted in figure 14. There are no constraint forces in the x-direction for β =0° because of symmetry. In cases 3 and 4, larger constraint forces in the y-direction (up to about 4.5 times those in case 2) are found at high frequencies (around ω=1.1 rad/s) when β = 15° and 30°. For these two directions, some peaks in cases 3 and 4 at higher frequencies have exceeded the values of the first peak. This could imply higher requirements for the constraint system in these ranges. These lie in the range of periods from 6s to 9s, which could be excited under operating condition wave spectra. When β = 90° in cases 3 and 4, maximum constraint forces in y-direction are obtained at ω = 0.80 rad/s (a period of 7.85s, when the length of the incident wave is 96.1m which is slightly more than double the distance between the columns). The caisson only has a limited effect in the range of low frequencies, as may be seen by comparing the results for cases 3 and 4.
4.2.3 Wave excitation forces in y-direction
0.2 0.4 0.6 0.8 1.0 1.2 1.4 1.6 1.80.00
0.01
0.02
0.03
0.04
0.05Lattice (β = 15 degree)
Fy
ω (rad/s)
Constraint forces Excitation forces
0.2 0.4 0.6 0.8 1.0 1.2 1.4 1.6 1.80.0
0.1
0.2
0.3
0.4
0.5Lattice (β = 90 degree)
Fy
ω (rad/s)
Constraint forces Excitation forces
0.2 0.4 0.6 0.8 1.0 1.2 1.4 1.6 1.80.00
0.02
0.04
0.06
0.08
0.10
0.12
0.14Columns only (β = 15 degree)
Fy
ω (rad/s)
Constraint forces Excitation forces
0.2 0.4 0.6 0.8 1.0 1.2 1.4 1.6 1.80.0
0.1
0.2
0.3
0.4
0.5
0.6Columns only (β = 90 degree)
Fy
ω (rad/s)
Constraint forces Excitation forces
0.2 0.4 0.6 0.8 1.0 1.2 1.4 1.6 1.80.00
0.02
0.04
0.06
0.08
0.10
0.12
0.14Columns + Caisson (β = 15 degree)
Fy
ω (rad/s)
Constraint forces Excitation forces
0.2 0.4 0.6 0.8 1.0 1.2 1.4 1.6 1.80.0
0.1
0.2
0.3
0.4
0.5
0.6Columns + Caisson (β = 90 degree)
Fy
ω (rad/s)
Constraint forces Excitation forces
Figure 15 Wave excitation forces in y-direction

15
To clarify further the results of for constraint forces in y-direction in figure 14, they are plotted together with the wave excitation forces acting on the lifting barge in figure 15 (only the wave directions β =15° and 90° are considered here). From the comparisons, it can be seen that the wave excitation forces in the y-direction completely dominate the behavior of the constraint forces. Other contributions are from the forces due to the motions of barge, including the inertia forces due to the quite small sway motions, and radiation forces due to the sway and roll motions. One may deduce from the comparisons of cases 2, 3 and 4 in figure 14 that diffraction by the substructures significantly increases the constraint forces in the y-direction in cases 3 and 4 in beam seas, over the frequency range 0.7 to 0.9 rad/s
4.2.4 Moments of constraint forces about z-axis
0.2 0.4 0.6 0.8 1.0 1.2 1.4 1.6 1.80.0
0.1
0.2
0.3
0.4
0.5
0.6β = 15 degree
Mz
ω (rad/s)
Lattice Columns only Columns + Caisson
0.2 0.4 0.6 0.8 1.0 1.2 1.4 1.6 1.80.0
0.2
0.4
0.6
0.8
1.0
1.2β = 30 degree
Mz
ω (rad/s)
Lattice Columns only Columns + Caisson
0.2 0.4 0.6 0.8 1.0 1.2 1.4 1.6 1.80.0
0.4
0.8
1.2
1.6β = 45 degree
Mz
ω (rad/s)
Lattice Columns only Columns + Caisson
0.2 0.4 0.6 0.8 1.0 1.2 1.4 1.6 1.80.0
0.3
0.6
0.9
1.2
1.5
1.8β = 60 degree
Mz
ω (rad/s)
Lattice Columns only Columns + Caisson
0.2 0.4 0.6 0.8 1.0 1.2 1.4 1.6 1.80.0
0.3
0.6
0.9
1.2
1.5
1.8β = 75 degree
Mz
ω (rad/s)
Lattice Columns only Columns + Caisson
Figure 16 Moments of constraint forces about z-axis
Since the yaw motion is also constrained, it is useful to show the moment of the constraint forces about the

16
z-axis; these are given in figure 16. Because of symmetry, these moments are zero when β =0° and 90°. From comparisons in figure 16, it can be seen the type of substructure has most influence on theses moments when β < 45°; but generally, the differences between three cases are fairly limited over the whole range of angles and frequencies.
4.3 Convergence study
In order to demonstrate convergence, a typical example of the wave excitation forces for β = 45° for the most complex configuration, case 4, is plotted in figure 17, based on ”Mesh 1” in figure 6(b) and ”Mesh 2” in figure 8. In the boundary element computations of hydrodynamic results, converged results at higher frequencies are generally more difficult to obtain than at lower frequencies, due to the smaller ratio of the wavelength to the dimensions of the elements. Hence only the computed wave excitation forces at high frequencies (1.7~1.8 rad/s) are shown in figure 17 (corresponding to the right hand end of the plots for β = 45° in figures 13 and 14). Comparisons between the two sets of results are satisfactory, suggesting that converged results have been obtained in the above analyses.
1.70 1.72 1.74 1.76 1.78 1.800.000
0.002
0.004
0.006
0.008Excitation forces ( β = 45 degree)
Fx
ω (rad/s)
Mesh 1 Mesh 2
1.70 1.72 1.74 1.76 1.78 1.800.000
0.004
0.008
0.012
0.016Excitation forces ( β = 45 degree)
Fy
ω (rad/s)
Mesh 1 Mesh 2
Figure 17 Excitation forces on barge based on two sets of meshes
4.4 Surface elevations in beam sea
From the above results, it is interesting to note the large wave excitation forces and constraint forces in the y-direction obtained in beam seas in cases 3 and 4 (see results for β = 90° in figure 15). To further investigate this, the behaviour of the free surface elevation has been analysed. Figure 18 shows the free surface magnifications at the mid length of the barge - corresponding to the points having horizontal coordinates (0, -19.35) and (0, 19.35) as seen in figure 5. From the comparisons of results on the upwave side of the barge, figure18a, it can be seen there are relatively small differences between cases 1 and 2, due to the different responses (sway and roll motions) of the barge. Appreciable differences, however, are found between the results of case 2 and cases 3 and 4. The predicted peak magnifications of the incident wave elevation in cases 3 and 4 are as high as 6.48 and 6.36 at ω=0.82 rad/s. These large surface elevations reflect the effects of diffraction by the substructures. In cases 2, 3 and 4, the heave motions of the barge for β = 90° are comparable (see the corresponding results in figure 10), and the sway motions are quite small. It would therefore appear that the diffracted waves from the substructures dominate the large run-up at the upwave mid point (0, -19.35). Furthermore, comparison of the peak frequencies of the wave excitation forces in cases 3 and 4 (which are seen to be at ω=0.80 rad/s in figure 15), indicates a clear connection between the peak wave excitation forces and the peak surface elevations in cases 3 and 4. The surface elevations at the downwave mid point (0, 19.35), however, plotted in figure 18b, do not show such magnifications and connections with the constraint forces.

17
0.2 0.4 0.6 0.8 1.0 1.2 1.4 1.6 1.80
1
2
3
4
5
6
7Middle point on the front wall (0, -19.35)
η/A
ω (rad/s)
Freely floating Lattice Columns only Columns + Caisson
0.2 0.4 0.6 0.8 1.0 1.2 1.4 1.6 1.80.0
0.5
1.0
1.5
2.0
2.5
3.0Middle point on the back wall (0, 19.35)
η/A
ω (rad/s)
Freely floating Lattice Columns only Columns + Caisson
Figure 18 Surface magnifications at the mid points of barge
Further details of the free surface elevation magnifications in beam seas along the upwave (y=-19.35m) and downwave (y=19.35m) sides at the peak frequency ω=0.82 are shown in figure 19 (one half of the barge length is shown, because of symmetry). From the comparisons between results of cases 3 and 4, it can be confirmed that the caisson has a quite limited influence on the elevations in these short wave. The diffraction effect of the vertical columns dominates the difference between cases 3 and 4 on the one hand, and the other two cases on the other, especially diffraction of waves by the two front columns. The biggest differences of the elevations are found at the central part of the upwave side, which indicates that the diffraction effect of the substructures is the strongest at this region where the scattered waves from the two adjacent columns reinforce each other. The surface elevations at the ends of the barge, however, are quite similar in all four cases.
0 20 40 60 80 1000
1
2
3
4
5
6
7
Column
Front wall (ω = 0.82 rad/s)
η/A
x (m)
Freely floating Lattice Columns only Columns + Caisson
Caisson
0 20 40 60 80 1000.0
0.5
1.0
1.5
2.0
2.5Back wall (ω = 0.82 rad/s)
η/A
x (m)
Freely floating Lattice Columns only Columns + Caisson
Column
Caisson
Figure 19 Surface magnifications along the front and back wall of barge (ω=0.82 rad/s)
5 Conclusions
A two stage approach, solving first for the unconstrained hydrodynamics and then formulating the constrained equations of motion, has been applied to the dynamic analysis of coupled multi-body systems in marine engineering. Two types of system are considered in present paper. One, a validation case, concerns an array of five hinge-connected rectangular barge modules, which can be regarded as a simplified Mobile Offshore Base. Results of the vertical motions (RAOs) and vertical shear forces are compared with those given by Lee and Newman (2000), and good agreement is obtained.
The second type of system is that of a lifting barge (with deck) and substructures, associated with float-over installations. Both jacket type and gravity based substructures are considered in the analyses undertaken here.
18
Although the lashing system has been simplified as ideal rigid constraints in the present calculation, some useful insight has been revealed, particularly concerning the effects of wave diffraction by the substructures. The horizontal constraints introduce larger roll motions of the lifting barge, which may also produce appreciable changes to the mating forces during the installation operations. It has been found that large volume gravity based substructures can cause increased transverse forces on the barge in waves at or close to the beam sea condition, as a result of the waves scattered by the columns providing a reinforcing effect. This has been shown to be linked to large magnifications in the local wave elevation at the midship position on the upwave side of the barge, with the possible implication of significant surface splashing. It has also been found that the heave motions of the barge can be substantially increased by the same effects of diffraction over certain frequency ranges and wave directions.
Acknowledgements
We acknowledge the support of The Lloyd’s Register Educational Trust towards the research and development programme in National University of Singapore (NUS). Provision of facilities by the NUS Computer Centre is gratefully acknowledged.
References
Cheung, L. Y., 2010. Catamaran gantry crane for engineering-procurement-construction- installation contract. The IES Journal
Part A: Civil & Structural Engineering, 3(4), 257-266.
Cholley, J.-M., Delage, B., Cahay, M., 2009. Float-over at high air gap design and issues. In: Proceedings of the ASME 28th
International Conference on Ocean, Offshore and Arctic Engineering (OMAE-2009), Honolulu, Hawaii, U.S.A., May 31 - June
5, 2009, Paper no. OMAE 2009-79119.
Cummins, W. E., 1962. The impulse response function and ship motions. Report 1661, Department of the Navy, David Taylor
Model Basin, Washington.
Eatock Taylor, R. and Chau, F. P., 1992. Wave diffraction theory – some developments in linear and non-linear theory.
Transactions of ASME, Journal of Offshore Mechanics and Arctic Engineering, 114, 185-194.
Guerber, E., Benoit, M., Grilli, S.T., Buvat, C., 2010. Modeling of fully nonlinear wave interactions with moving submerged
structures. In: Proceedings of the 20th International Offshore and Polar Engineering Conference (ISOPE-2010), Beijing, China,
June 20-25, 2010.
Kral, R. and Kreuzer, E., 1999. Multi-body systems and fluid-structure interactions with application to floating structures.
Multibody System Dynamics, 3, 65-83.
Langley, R. S., 1984. Random dynamic analysis of multi-body offshore structures. Ocean Engineering, 11, 381-401.
Lee, C.-H. and Newman, J. N., 2000. An assessment of hydroelasticity for very large hinged vessels. Journal of Fluids and
Structures, 14, 957-970.
Matsui, T., Tamaki, T., 1981. Hydrodynamic interaction between groups of vertical axisymmetric bodies floating in waves. In:
Proceeding of International Symposium on Hydrodynamics in Ocean Engineering, Trondheim, Norway, August 24-28, 1981,
Vol. 2, 817-836.

19
Newman, J. N., 1994. Wave effects on deformable bodies. Applied Ocean Research, 16, 47-59.
Ó’Catháin, M., Leira, B. J., Ringwood, J. V. and Gilloteaux, J.-C., 2008. A modelling methodology for multi-body systems with
application to wave-energy devices. Ocean Engineering, 35, 1381-1387.
Shabana, A. A., 2010. Computational dynamics (3rd ed). Chichester: Wiley.
Sun, L., Eatock Taylor, R. and Choo, Y.S., 2011. Responses of interconnected floating bodies. The IES Journal Part A: Civil &
Structural Engineering, 4(3), 143-156.
Sun L, Eatock Taylor R. and Taylor P. H., 2010. First- and second-order analysis of resonant waves between adjacent barges.
Journal of Fluids and Structures, 26(6), 954-978.
Sun, L., Teng, B., Liu, C. F., 2008. Removing irregular frequencies by a partial discontinuous higher order boundary element
method. Ocean Engineering, 35, 920-930.
Taghipour, R.and Moan, T., 2008. Efficient frequency-domain analysis of dynamic response for the multi-body wave energy
converter in multi-directional waves. In: Proceedings of 18th Offshore and Polar Engineering Conference (ISOPE-2008),
Vancouver, Canada, July 6-11, 2008.
Tahar, A., Halkyard, J., Steen, A. and Finn, L., 2004. Float over installation method – numerical and model test data. In:
Proceedings of 23rd International Conference on Offshore Mechanics and Arctic Engineering (OMAE-2004), Vancouver,
Canada, June 20-25, 2004, Paper no. OMAE 2004-51069.
Tromans, P.S., 2008. Roll damping of turret-moored vessels. Report D-5.2a (0)-OWE, EU Safe Offload Project.
Walker, D. A. G., Eatock Taylor, R., Taylor, P. H. and Zang, J., 2008. Wave diffraction and near-trapping by a multi-column
gravity based structure. Ocean Engineering, 35, 201-229.
Zang, J., Gibson, R., Taylor, P. H., Eatock Taylor, R. and Swan, C., 2006. Second order wave diffraction around a fixed
ship-shaped body in unidirectional steep waves. Transactions of ASME, Journal of Offshore Mechanics and Arctic Engineering,
128, 89-99.