mtom chapter 2: measuring performance in operations and
TRANSCRIPT

MTOM C2 IM
1
MTOM Chapter 2: Measuring Performance in Operations and Value Chains
Discussion Questions
1. What types of performance measurements might be used to evaluate a fraternity or student organization?
Metrics might include attendance at key events, total membership each academic term, gains and losses in membership, fundraising amounts, operations costs, number of professional or social events held each term, grade point average of members, number of intramural sporting events participated in, number of guest speakers, student (member) satisfaction, projects completed on time and on budget, and so on.
2. Select an organization you are familiar with or have an interest in and write a short two-page paper describing key performance metrics in that industry and firm using the format of Exhibit 2.1.
Students will develop some interesting tables for different industries and firms of interest to them. A few questions you might pose during discussion of this question are as follows:
What criteria are missing? Explain Does the measurement support our mission? Will the measurement be used to manage change? Is it important to our customers? Is it effective in measuring performance? (Is it actionable?) Actionable measures
provide the basis for decisions at the level at which they are applied—the value chain, organization, process, department, workstation, job, and service encounter. They should be meaningful to the user, timely, and reflect how the organization generates value to customers.)
Is it effective in forecasting results? Is it easy to understand/simple? Is the data easy/cost-efficient to collect? (How would the data be collected?
Who would do it? How long would it take? What would the cost be?) Does the measurement have validity, integrity, and timeliness? Does the measurement have an owner? (Who will ensure that the data do get
collected, analyzed, and disseminated as needed?)
Good performance measures are actionable. Actionable measures provide the basis for decisions at the level at which they are applied—the value chain, organization, process, department, workstation, job, and service encounter. They should be meaningful to the user, timely, and reflect how the organization generates value to customers.

MTOM C2 IM
2
3. Discuss some analytical or graphical approaches that organizations can use for analyzing performance data based on your experience and previous coursework.
These methods might include simple charts that you would find in Microsoft Excel, such as bar charts, scatter plots, pie charts, and line charts for time series data. Other approaches would be basic statistical techniques such as frequency distributions and histograms, basic statistical measures such as means and standard deviations, statistical process control charts, Pareto (ABC) analysis, regression and correlation analysis, and so on.
4. Under which perspective of the balanced scorecard would you classify each of the following measurements?
a. On-time delivery to customers (customer perspective) b. Time to develop the next generation of products (innovation and
learning perspective) c. Manufacturing yield (internal perspective) d. Engineering efficiency (internal perspective) e. Quarterly sales growth (customer perspective if units; financial
perspective if dollars) f. Percent of products that equal 70 percent of sales (innovation and learning
perspective) g. Cash flow (financial perspective) h. Number of customer partnerships (customer, perspective) i. Increase in market share (customer perspective) j. Unit cost of products (financial perspective)
Arguments can be made for other perspectives. Some measures may not clearly fall into a particular category; however, what is more important is that the organization takes a broad view of the most important measures across the enterprise, rather than just focusing on financial results.
5. When the value of a loyal customer (VLC) market segment is high, should these customers be given premium goods and services for premium prices? If the VLC is low, should they be given less service? Explain.
This question can trigger significant differences in student opinions. For example, should banking customers with average bank deposits of over $100,000 have to stand in the same teller line as a bank customer with average bank deposits of $1,000? That is, should the bank set up a premium service channel for premium customers? In the early 1990s when a New York bank set up a separate bank teller window (and line) for customers with bank deposits over $100,000, the outcry from other bank customers resulted in the bank closing the premium teller window for premium customers three days after it opened. Yet, hotels have VIP and loyal customer suites and floors, airlines give premium customers first choice at airline seats and flights plus VIP lounges and first class

MTOM C2 IM
3
services, some automobile dealerships give free loaner cars to their top customers while not offering these extra services to less valuable customers, and so on. The reality is that when a small percentage of customers (say 20%) account for a large percentage of total revenue (say 65%) it is profitable to segment markets based on the value of a loyal customer or customers, and provide premium service for A customers.
Problems and Activities
(Note: an asterisk denotes problems for which an Excel spreadsheet template on the CourseMate Web site may be used.)
1. Interview managers at a local company to identify the key business measures (financial, market, supplier, employee, process, information, innovation, etc.) for that company. What quality indicators does that company measure? What cause and effect (interlinking) performance relationships would be of interest to the organization?
It is always interesting to see what organizations really measure. In many cases, don’t be surprised to see simply a heavy emphasis on financial results without a “balanced scorecard” as such. Quality indicators are often the traditional ones (defects, yield). Many smaller companies don’t measure the cost of quality or customer satisfaction. Does the firm measure time, product and service quality, or what? Highlight OM metrics and issues. This question can be used to generate discussion on what should be measured and why (a good lead in to ideas of strategy in the next chapter). For small firms all performance measurement is sometimes done by observation of the owner(s). So make sure the size of the firm is identified upfront.
2. Each day, a FedEx competitor processes approximately 70,000 shipments. Suppose that they use the same Service Quality Index as FedEx and identified the following numbers of errors during a 5-day week (see the “FedEx: Measuring Service Performance” box). These values are hypothetical and do not reflect any real company’s actual performance.
Complaints reopened: 125 Damaged packages: 18 International: 102 Invoice adjustments: 282 Late pickup stops: 209 Lost packages: 2 Missed proof of delivery: 26 Right date late: 751 Traces: 115 Wrong day late: 15

MTOM C2 IM
4
Compute the Service Quality Indicator by finding the weighted sum of errors as a percentage of total shipments. How might such an index be used in other organizations such as a hotel or automobile service facility?
MTOM Chapter 2 Problem #2 Fed Ex Problem
Number of Shipments/Day 70,000
Total Number of Shipments 350,000
Over 5 Days Percent of Number of Weighted
Weight Total Weight Errors Average Errors
Complaints Reopen 3 0.079 125 9.87
Damaged Pkgs 10 0.263 18 4.74
International 1 0.026 102 2.68
Invoice Adjustments 1 0.026 282 7.42
Late Pickup Stops 3 0.079 209 16.50
Lost Packages 10 0.263 2 0.53
Missed Proof of Delivery 1 0.026 26 0.68
Right Date Late 1 0.026 751 19.76
Traces 3 0.079 115 9.08
Wrong Day Late 5 0.132 15 1.97
Total 38 1 1645 73.24
Wt Average Percent of Total Shipments 0.000209248* 0.020924812+
Service Quality Indicator (SQI) 99.979^
*73.24/350,000 = 0.000209248 +0.000209248*100 = 0.020924812 ^100-0.020924812 = 99.979
Over this 5-day period FE delivery performance was almost perfect on a percent basis, yet 1,645 customers experienced some type of service upset. You might point out that the U.S. Postal Service has good performance too (not as good as above) and that the huge volumes hide the number of impacts on customers.
3. Research and write a short paper on how some organization applies the five dimensions of service quality.
SERVQUAL was originally measured on 10 aspects of service quality: reliability, responsiveness, competence, access, courtesy, communication, credibility, security, understanding the customer and tangibles (background -- using factor analysis). It measures the gap between customer expectations and experience. By the early nineties the authors had refined (combined) the SERVQUAL model to the useful acronym RATER (these five dimensions are in the chapter):
▪ Reliability

MTOM C2 IM
5
▪ Assurance ▪ Tangibles ▪ Empathy, and ▪ Responsiveness
If students search SEVQUAL and/or the GAP model (in OM4 C15) they will find many applications. The SERVQUAL has been tested in banking, credit cards, repair and maintenance, and long distance telephone service. Hospitals, for example, (see web reference below) have also used these five measures of service quality to measure their performance.
http://www.ncbi.nlm.nih.gov/pmc/articles/PMC1069855/pdf/hsresearch00075-0070.pdf
4. A major airline is attempting to evaluate the effect of recent changes it has made in scheduling flights between New York City and Los Angeles. Data available are shown below.
Number of Number of Flights Passengers
Month prior to schedule change 16 8,795 Month after schedule change 27 15,653
Using passengers per flight as a productivity indicator, comment on the apparent effect of the schedule change.
Computing passengers per flight, we obtain (after rounding)
Month prior to schedule change: 8795/16 = 550 Month after schedule change: 15,563/27 = 576
Productivity increased by 4.7 percent (26/550) after the schedule change. This could be due to more convenient flight times, better schedules or some other intervening variable. Here the productivity metric is output per flight. Other possible productivity indicators for airlines might include flights/labor dollar, passengers/labor dollar, total passenger revenue/total cost of all flights, total number of passengers/total cost of all flights.
5. Revenue or costs per passenger mile are two key performance measures in the airline industry. Research their use in this industry and prepare a one-page paper summarizing how they are used and why they are so important. These two metrics drive profitability in the airline industry. Few industries have so few and simple summary metrics yet they are very powerful. Southwest Airlines, for example, normally has the widest gap between these two metrics, and therefore, generates profits, while older airlines such as United often have costs per passenger mile equal to or higher than revenue per passenger mile. Your students will find many interesting ways to use these productivity metrics for this industry. Your

MTOM C2 IM
6
students will also discover energy and labor costs are huge components of total airline costs.
6. A hamburger factory produces 60,000 hamburgers each week. The equipment used costs $10,000 and will remain productive for 4 years. The labor cost per year is $13,500.
a. What is the productivity measure of “units of output per dollar of input” averaged over the four-year period?
Productivity = total units produced divided by the total labor cost plus total equipment cost = 60,000(52)(4)/[13,500(4)+10,000] = 195 hamburgers/dollar
b. We have the option of $13,000 equipment, with an operating life of 5 years. It would reduce labor costs to $11,000 per year. Should we consider purchasing this equipment (using productivity arguments alone)?
For the expensive machine, productivity = 60,000(52)(5)/[11,000(5) + 13,000] = 229.4 hamburgers/dollar input. Because the productivity of the expensive machine is higher, it would be a good investment based on this single criterion.
7. A fast-food restaurant has a drive-through window and during peak lunch times can handle a maximum of 50 cars per hour with one person taking orders, assembling them, and acting as cashier. The average sale per order is $9.00. A proposal has been made to add two workers and divide the tasks among the three. One will take orders, the second will assemble them, and the third will act as cashier. With this system it is estimated that 70 cars per hour can be serviced. Use productivity arguments to recommend whether or not to change the current system.
Productivity = revenue/labor dollar
For system 1, productivity = 50($9.00)/x = 450/x For system 2, productivity = 70($9.00)/3x = 210/x
where x is the prevailing minimum wage. With the additional two workers, productivity drops by more than on-half (i.e., too much labor for system 2). Thus, it is not advisable to change the current system (i.e., keep system 1). System #2 simply uses too much labor.
8. A key hospital outcome measure of clinical performance is length of stay (LOS); that is, the number of days a patient is hospitalized. For patients at one hospital with acute myocardial infarction (heart attack), the length of stay over the past four years has consistently decreased. The hospital also has data for various treatment options such as the percentage of patients who received aspirin upon arrival and cardiac

MTOM C2 IM
7
medication for Left Ventricular Systolic Dysfunction (LVSD). The data are shown below:
Year Average LOS Aspirin on arrival LVSD medication 2007 4.35 days 95% 89% 2008 4.33 days 98% 93%
2009 4.12 days 99% 96% 2010 4.15 days 100% 98%
Illustrate the interlinking relationships by constructing scatter using Excel showing the LOS as a function of the other variables. What do these models tell you?
The charts below show that as the percentage of aspirin on arrival and LVSD medications increase, the average LOS decreases, suggesting that these interventions reduce hospitalization which is good. Instructors might wish to illustrate how to add a trendline to a scatter chart (right click the data series and choose Add Trendline).
1009998979695
4.40
4.35
4.30
4.25
4.20
4.15
4.10
Aspirin
LO
S
Scatterplot of LOS vs Aspirin

MTOM C2 IM
8
9896949290
4.40
4.35
4.30
4.25
4.20
4.15
4.10
LVSD
LO
S
Scatterplot of LOS vs LVSD
Descriptive Statistics: LOS, Aspirin, LVSD
Variable Mean SE Mean StDev Minimum Median Maximum LOS 4.2375 0.0596 0.1193 4.1200 4.2400 4.3500 Aspirin 98.00 1.08 2.16 95.00 98.50 100.00 LVSD 94.00 1.96 3.92 89.00 94.50 98.00
Correlations: LOS, Aspirin, LVSD
LOS Aspirin Aspirin -0.815 0.185 LVSD -0.885 0.985 0.115 0.015 Cell Contents: Pearson correlation P-Value
9. Customers call a call center to make room reservations for a small chain of 42 motels located throughout the southwestern part of the United States. Business analytics is used to determine how and if the following performance metrics are related: time by quarter, average time on hold (seconds) before a customer reaches a company customer service representative, percent of time the customer inquiry is solved the first time (called first pass quality) and customer satisfaction with the overall call center experience.
Average Percent Solved Overall Customer Quarter Hold Time First Time Satisfaction Percent Q1 22 seconds 89% 96%
MTOM C2 IM
9
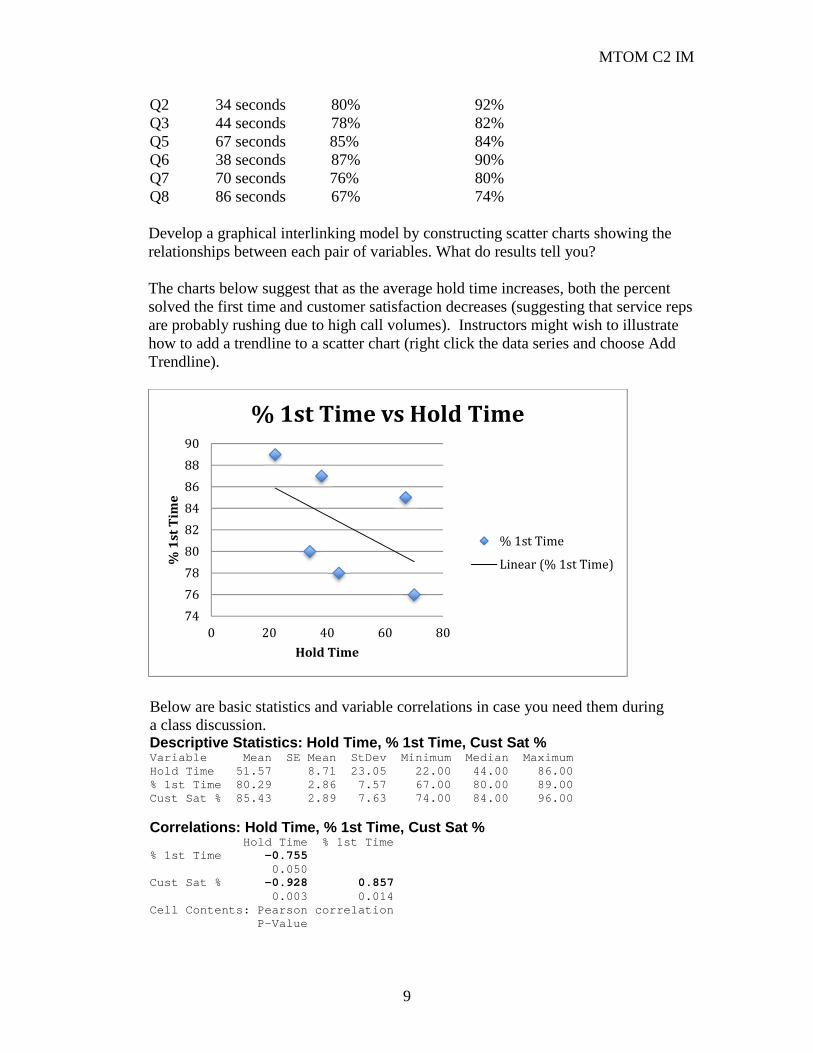
Q2 34 seconds 80% 92% Q3 44 seconds 78% 82% Q5 67 seconds 85% 84% Q6 38 seconds 87% 90% Q7 70 seconds 76% 80% Q8 86 seconds 67% 74%
Develop a graphical interlinking model by constructing scatter charts showing the relationships between each pair of variables. What do results tell you?
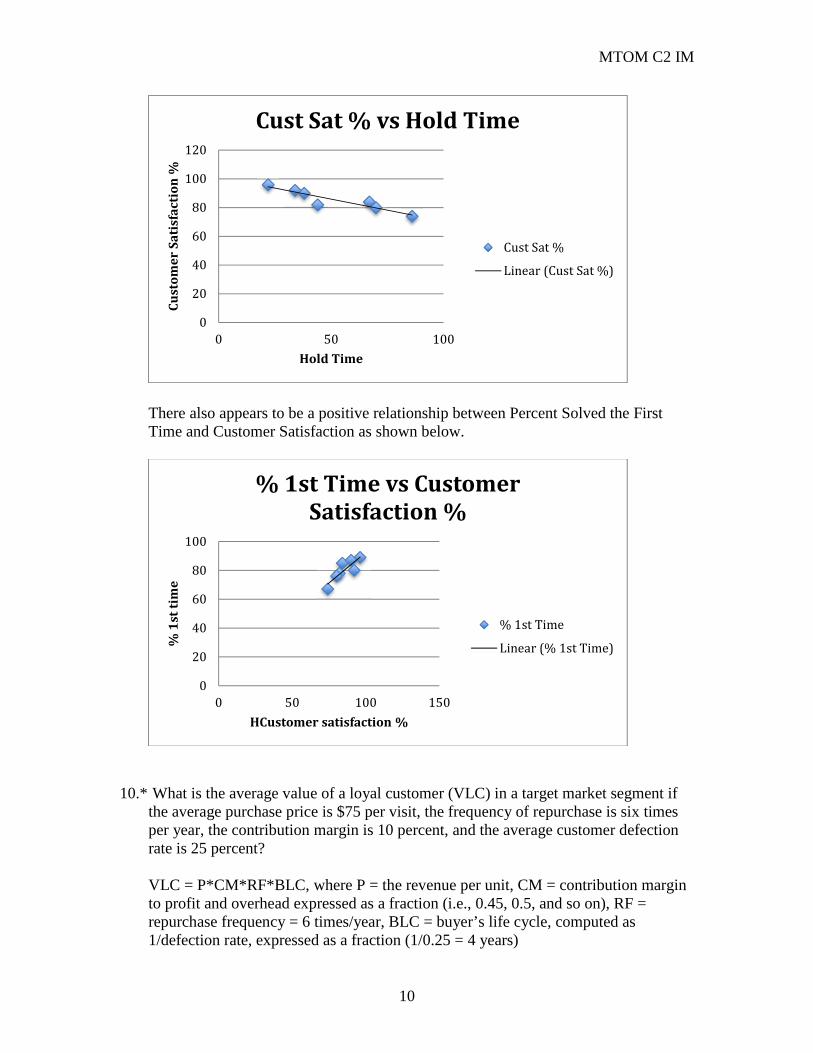
The charts below suggest that as the average hold time increases, both the percent solved the first time and customer satisfaction decreases (suggesting that service reps are probably rushing due to high call volumes). Instructors might wish to illustrate how to add a trendline to a scatter chart (right click the data series and choose Add Trendline).
Below are basic statistics and variable correlations in case you need them during a class discussion. Descriptive Statistics: Hold Time, % 1st Time, Cust Sat % Variable Mean SE Mean StDev Minimum Median Maximum Hold Time 51.57 8.71 23.05 22.00 44.00 86.00 % 1st Time 80.29 2.86 7.57 67.00 80.00 89.00 Cust Sat % 85.43 2.89 7.63 74.00 84.00 96.00
Correlations: Hold Time, % 1st Time, Cust Sat % Hold Time % 1st Time % 1st Time -0.755 0.050 Cust Sat % -0.928 0.857 0.003 0.014 Cell Contents: Pearson correlation P-Value
74
76
78
80
82
84
86
88
90
0 20 40 60 80
% 1
st T
ime
Hold Time
% 1st Time vs Hold Time
% 1st Time
Linear (% 1st Time)
MTOM C2 IM
10
There also appears to be a positive relationship between Percent Solved the First Time and Customer Satisfaction as shown below.
10.* What is the average value of a loyal customer (VLC) in a target market segment if the average purchase price is $75 per visit, the frequency of repurchase is six times per year, the contribution margin is 10 percent, and the average customer defection rate is 25 percent?
VLC = P*CM*RF*BLC, where P = the revenue per unit, CM = contribution margin to profit and overhead expressed as a fraction (i.e., 0.45, 0.5, and so on), RF = repurchase frequency = 6 times/year, BLC = buyer’s life cycle, computed as 1/defection rate, expressed as a fraction (1/0.25 = 4 years)
0
20
40
60
80
100
120
0 50 100
Cu
sto
me
r S
ati
sfa
ctio
n %
Hold Time
Cust Sat % vs Hold Time
Cust Sat %
Linear (Cust Sat %)
0
20
40
60
80
100
0 50 100 150
% 1
st t
ime
HCustomer satisfaction %
% 1st Time vs Customer Satisfaction %
% 1st Time
Linear (% 1st Time)
MTOM C2 IM
11
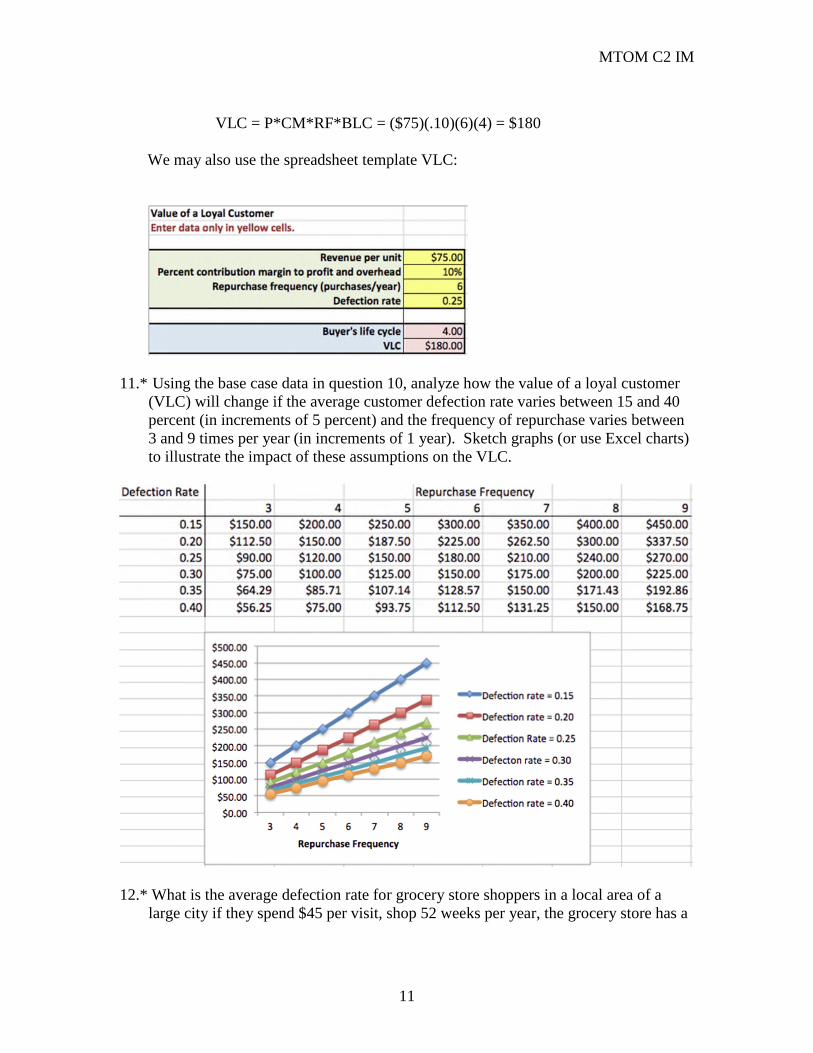
VLC = P*CM*RF*BLC = ($75)(.10)(6)(4) = $180
We may also use the spreadsheet template VLC:
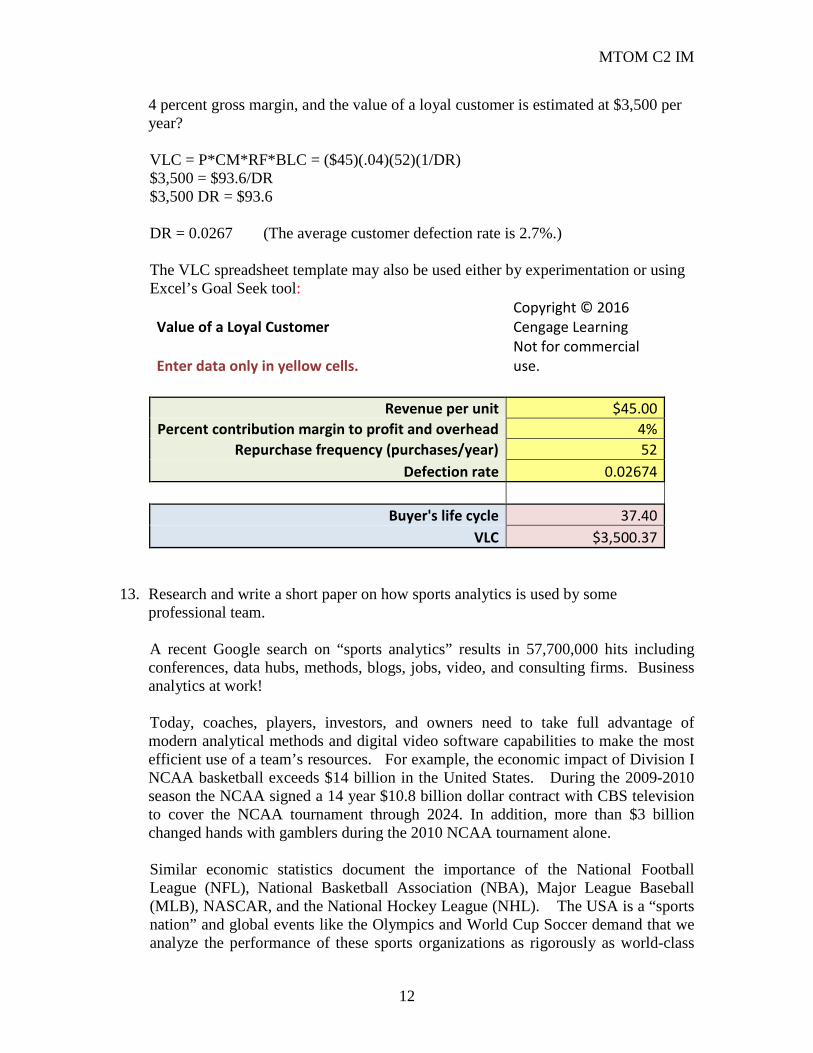
11.* Using the base case data in question 10, analyze how the value of a loyal customer (VLC) will change if the average customer defection rate varies between 15 and 40 percent (in increments of 5 percent) and the frequency of repurchase varies between 3 and 9 times per year (in increments of 1 year). Sketch graphs (or use Excel charts) to illustrate the impact of these assumptions on the VLC.
12.* What is the average defection rate for grocery store shoppers in a local area of a large city if they spend $45 per visit, shop 52 weeks per year, the grocery store has a
MTOM C2 IM
12
4 percent gross margin, and the value of a loyal customer is estimated at $3,500 per year?
VLC = P*CM*RF*BLC = ($45)(.04)(52)(1/DR) $3,500 = $93.6/DR $3,500 DR = $93.6
DR = 0.0267 (The average customer defection rate is 2.7%.)
The VLC spreadsheet template may also be used either by experimentation or using Excel’s Goal Seek tool:
Value of a Loyal Customer Copyright © 2016 Cengage Learning
Enter data only in yellow cells. Not for commercial use.
Revenue per unit $45.00
Percent contribution margin to profit and overhead 4%
Repurchase frequency (purchases/year) 52
Defection rate 0.02674
Buyer's life cycle 37.40
VLC $3,500.37
13. Research and write a short paper on how sports analytics is used by some professional team.
A recent Google search on “sports analytics” results in 57,700,000 hits including conferences, data hubs, methods, blogs, jobs, video, and consulting firms. Business analytics at work!
Today, coaches, players, investors, and owners need to take full advantage of modern analytical methods and digital video software capabilities to make the most efficient use of a team’s resources. For example, the economic impact of Division I NCAA basketball exceeds $14 billion in the United States. During the 2009-2010 season the NCAA signed a 14 year $10.8 billion dollar contract with CBS television to cover the NCAA tournament through 2024. In addition, more than $3 billion changed hands with gamblers during the 2010 NCAA tournament alone.
Similar economic statistics document the importance of the National Football League (NFL), National Basketball Association (NBA), Major League Baseball (MLB), NASCAR, and the National Hockey League (NHL). The USA is a “sports nation” and global events like the Olympics and World Cup Soccer demand that we analyze the performance of these sports organizations as rigorously as world-class

MTOM C2 IM
13
corporations analyze their goods, services, processes, people, and supply chains.
14. Go to the Baldrige Web site and find the links to the most recent award recipients. Review one of the application summaries and describe the types of performance measures that these companies use.
The Baldrige application summaries are excellent sources of information to learn about best practices. Categories 4 and 7 provide good examples of the types of measures that leading companies use. Instructors might also wish to ask students to compare measures used by small versus large companies, manufacturing versus service, and differences with not-for-profit education and health care sectors
15. The balanced scorecard was originally developed by Arthur M. Schneiderman at Analog Devices. Visit his Web site, www.schneiderman.com, and read the articles to answer the following questions:
a. How was the first balanced scorecard developed? (Click The Scorecard link under the Contents link. Find “ADI: The First Balanced Scorecard)
b. What steps should an organization follow to build a good balanced scorecard? (Find “How to Build a Balanced Scorecard”)
c. Why do balanced scorecards fail? (Find “Why Balanced Scorecards Fail”)
This Web site provides interesting history about the balanced scorecard and a host of other information developed by Mr. Schneiderman, including numerous articles on the subject.
Case Teaching Notes: Rapido Burrito
Overview Rapido Burrito is a small regional chain of quick service restaurants. Rather than wait in a cafeteria style line, customers check boxes for their choice of ingredients, sauce, and so on paper menus at their table. The food is prepared quickly and then delivered to the tables. Lately, one of the store managers has been hearing customer complaints, such as: “The tortillas are too thin”; “The food is not hot”; “Everytime I get a burrito it seems to be a different size”; and “I got the wrong ingredients on my burrito.” Many complaints were submitted through the corporate website. The district manager was most concerned with the comments about the consistency of size. One of the staff designed a customer survey using the questions in Exhibit 2.9, based on a 5-point Likert scale [5 = excellent, or strongly agree; 1 = poor or strongly disagree] for the first 10 questions. The last two questions were coded as a 1, 2, 3, or 4. They administered the questionnaire to 25 random customers. The restaurant also gathered data on the weights of 50 samples of 3 burritos (a total of 150). (Both the survey data and weight data are available on spreadsheet Rapido Burrito Case Data.)

MTOM C2 IM
14
Exhibit 2.9 Customer Survey Questions
1. Was the menu easy to read? 2. Was order prepared correctly? 3. Was the food tasty? 4. Was the food served hot? 5. Were employees courteous and polite? 6. Was the restaurant clean? 7. In your opinion, did you receive a good value for the price you paid? 8. What was your level of satisfaction? 9. How likely are you to dine with us again? 10. How likely are you to recommend us to your friends/family? 11. How often do you eat at Sizzleking? 12. First time, less than once/month, 1-3 times a month, weekly? 13. What was the main ingredient in your burrito: chicken, beef, pork, beans?
Case Questions and Analysis
1. What conclusions do you reach when you calculate descriptive statistics for the answers to each of the survey questions in the database?
Portions of the spreadsheet Rapido Burrito Case Soln.xlsx are shown below. A frequency count of the 25 customers who were surveyed is evenly divided, from first timers to those who eat there weekly. The survey averages show that customers were most satisfied with the menu and
order preparation. Courtesy of employees, restaurant cleanliness, and value for price hovered around a 4. Tastiness of the food and overall satisfaction averaged around 3.8 for all respondents. Respondents were less enthusiastic about the food being served hot at 3.60. The likelihood of the customer dining again is only 3.56. The standard deviations for all of the questions appear to be close to equal for the
menu, order preparation, employee courtesy, restaurant cleanliness, and overall satisfaction.
There was much more variation in the answers to the questions about food served hot, value vs. price, and likelihood to dine again and to recommend the restaurant to friends.
Customer survey responses Avg Std. dev.
Menu was easy to read 4.64 0.70
Order was prepared correctly 4.28 0.74
Food was tasty 3.84 0.94
Food was served hot 3.60 1.38
Employees were courteous and polite
4.04 0.61
Restaurant was clean 4.04 0.79

MTOM C2 IM
15
Value for price paid 3.92 1.19
Overall satisfaction 3.80 0.87
Likely to dine with us again? 3.56 1.08
Likely to recommend us to friends? 3.44 1.23
2. If you average the responses to the first seven questions by customer, how closely are those averages correlated to the satisfaction score? Include a scatter chart in your analysis.
The first graph is overall satisfaction versus the average score on the first seven survey questions. The second graph is the survey question scores (a) likely to dine with us again versus (b) the overall satisfaction score. The second graph is for your information only and was not asked in the case assignment questions.
The average responses to the first seven questions by customers, are well correlated with their satisfaction scores. The R2 = 0.869, which indicates a fairly close correlation [correlation coefficient = √0.869 = 0.932] between the average score and the overall satisfaction score, can be visualized on the scatter chart, below.
The likelihood of “the customer dining again” at Rapido Burrito can be predicted by using the “satisfaction score” and regression analysis by customer. The likelihood of customer’s dining again is moderately correlated to the satisfaction score. The R2 = 0.625, which does not indicate an extremely close correlation between the average score and the overall satisfaction score, as seen on the scatter chart, below.
0.0
1.0
2.0
3.0
4.0
5.0
6.0
0 2 4 6
Av
era
ge
sco
re
Overall satisfaction
Overall satisfaction Line Fit Plot
Average score
Predicted Average score

MTOM C2 IM
16
3. Analyze the data on burrito weights using descriptive statistical measures such as the mean and standard deviation, and tools such as a frequency distribution and histogram. What do your results tell you about the consistency of the food servings?
The descriptive statistics for burrito weights show that the mean �̅ = 1.100 and standard deviation, s = 0.048. The frequency distribution and histogram show that the sample is somewhat normal in shape. The range and standard deviation show that the food servings are somewhat variable. The range is 0.24, or ¼ pound difference between the lowest and highest values. This could be due to the nature of the burrito product, where the customer specifies ingredients, which add more or less weight to the burrito.
Conclusion: The burrito weight analysis indicates a good approximation of a normal distribution with fairly consistent weights. The intervening variable is the “degree of customization for each customer.”
Descriptive Statistics Bin Frequency
1.25 0
Mean 1.100 1.30 3
Standard Error 0.004 1.35 9
Median 1.100 1.40 16
Mode 1.090 1.45 17
Standard Deviation 0.048 1.50 34
Sample Variance 0.002 1.55 22
Kurtosis -0.293 1.60 23
Skewness -0.138 1.65 11
0
1
2
3
4
5
6
0 2 4 6
Ov
era
ll s
ati
sfa
ctio
n
Likely to dine with us again?
Likely to dine with us again? Line Fit Plot
Overall satisfaction
Predicted Overall satisfaction

MTOM C2 IM
17
Range 0.240 1.70 7
Minimum 0.960 1.75 6
Maximum 1.200 1.80 1
Sum 165.040 1.85 1
Count 150.000 More 0
Confidence Level (95.0 percent) 1.200
4. What recommendations for decision-making and improvement can you make to the store manager?
Recommendations for improvement include:
a. Work to ensure that food is served hot (low average score of 3.60) b. Develop a panel to do taste testing of various existing and new products (average
scores are 3.84 for food was tasty and 3.92 for value for price paid). c. Provide incentives for repeat customers, such as discounts for people who eat there
three times, six times, nine times, etc. (since likely to dine with us again average score is 3.56 and likely to recommend us to friends average score is 3.44).
d. Consider job design and work method ways to ensure that exact weighs of ingredients can be measured and assembled in the burritos. That is, how can we continuously improve our job, equipment, and process designs to reduce variability?
Any average customer survey score below 4.0 is an opportunity for improvement and should be investigated!
Original Two RB Data Sets
Rapido Burrito
Customer Survey Results (1st Eight Customers Only)
0
5
10
15
20
25
30
35
40
0.95 0.98 1.01 1.04 1.07 1.1 1.13 1.16 1.19 1.22 1.25
Fre
qu
en
cy
Bin
Histogram
Frequency

MTOM C2 IM
18
Customer survey responses Customer Number
1 2 3 4 5 6 7 8
Menu was easy to read 4 3 5 4 5 5 5 5
Order was prepared correctly 4 4 5 3 4 5 5 5
Food was tasty 5 3 4 3 4 5 4 3
Food was served hot 4 2 3 1 5 5 3 4
Employees were courteous and polite
5 4 4 3 4 5 4 4
Restaurant was clean 5 5 4 3 4 5 4 4
Value for price paid 5 4 3 2 5 5 3 3
Overall satisfaction 4 3 4 3 4 5 4 4
Likely to dine with us again? 4 3 3 2 4 5 3 3
Likely to recommend us to friends?
4 2 3 2 4 5 3 3
How often do you eat at Sizzlegrill? First time, less than once/month, 1-3 times a month, weekly, [1,2,3,4]
3 2 1 1 4 1 2 3
What was the main ingredient: chicken, beef, pork, beans [1,2,3,4]
1 1 3 4 1 1 2 2
Second Set of Data on Burrito Weights (1st 10 observations only)
Weights of Burritos (Pounds)
Sample Number
1 1.43 1.40 1.84
2 1.43 1.68 1.50
3 1.34 1.29 1.62
4 1.34 1.62 1.61
5 1.66 1.46 1.57
6 1.60 1.53 1.65
7 1.35 1.31 1.46
8 1.63 1.71 1.55
9 1.47 1.50 1.59
10 1.54 1.72 1.40
Both data sets are in Rapido Burrito Case Data.xlsx

MindTap for Operations and Supply Chain Management
COLLIER/EVANS
2
Measuring Performance in Operations and Value Chains
Copyright ©2019 Cengage Learning. All Rights Reserved. May not be scanned, copied or duplicated, or posted to a publicly accessible website, in whole or in part.

LEARNING OUTCOMES
1 Describe the types of measures used for decision making
2 Explain the use of analytics in operations management and how internal and external measures are related
3 Explain how to design a good performance measurement system
4 Describe four models of organizational performance

3Copyright ©2019 Cengage Learning. All Rights Reserved. May not be scanned, copied or duplicated, or posted to a publicly accessible website, in whole or in part. CH2
MeasurementLO 2-1
• Act of quantifying the performance of:• Organizational units and goods and services
• Processes, people, and other business activities
• Provides a scorecard of performance
• Helps identify performance gaps
• Makes accomplishments visible to workforce, stock market, and other stakeholders

Exhibit 2.1 Scope of Business and Operations Performance Measurement
LO 2-1
Performance Measurement Category
Typical Organizational-Level Performance Measures
Typical Operational- level performance measures
Financial Revenue and profit,Return on assetsEarning per share
Labor and material costsCost of quality Budget variance
Customer and market Customer satisfactionCustomer retention Market Share
Customer claims and complaintsType of warrant failure/upsetSales forecast accuracy
Quality Customer ratings of goods and services Product recalls
Defects/unit or error/opportunityService representative courtesy
Time SpeedReliability
Flow processing or cycle time Percent of time meeting promised due date
Flexibility Design flexibilityVolume flexibility
Number of engineering changes Assembly-line changeover time
Innovation and learning New product development ratesEmployee satisfaction Employee turnover
Number of patent applications Number of improvement suggestions implemented Percent of workers trained on statistical process control
Productivity and operational efficiency
Labor productivity Equipment utilization
Manufacturing yieldOrder fulfillment time
Sustainability Environmental and regulatory compliance Product-related litigation Financial audits
Toxic waste discharge rateWorkplace safety violationsPercent of employees with emergency preparedness training

5Copyright ©2019 Cengage Learning. All Rights Reserved. May not be scanned, copied or duplicated, or posted to a publicly accessible website, in whole or in part. CH2
Customer-Satisfaction Measurement System
LO 2-1
• Provides a company with customer ratings of specific goods and service features
• Indicates the relationship between customer ratings and a customer’s likely future buying behavior
6Copyright ©2019 Cengage Learning. All Rights Reserved. May not be scanned, copied or duplicated, or posted to a publicly accessible website, in whole or in part. CH2
Quality, Part 1LO 2-1
• Measures the degree to which the output of a process meets customer requirements• Goods quality: Physical performance and
characteristics of a good
• Service quality
- Consistently meeting or exceeding customer expectations and service-delivery system performance for services

7Copyright ©2019 Cengage Learning. All Rights Reserved. May not be scanned, copied or duplicated, or posted to a publicly accessible website, in whole or in part. CH2
Quality, Part 2LO 2-1
• Assessed by measuring:
- Tangibles
- Reliability
- Responsiveness
- Assurance
- Empathy
• Affected by errors made during service encounters• Service failures/upsets: Errors in service creation
and delivery
8Copyright ©2019 Cengage Learning. All Rights Reserved. May not be scanned, copied or duplicated, or posted to a publicly accessible website, in whole or in part. CH2
TimeLO 2-1
• Performance measures• Speed of performing a task
- Measured by processing time and queue/wait time
• Variability of processes
- Measured using standard deviation or mean absolute deviation

9Copyright ©2019 Cengage Learning. All Rights Reserved. May not be scanned, copied or duplicated, or posted to a publicly accessible website, in whole or in part. CH2
FlexibilityLO 2-1
• Ability to adapt quickly and effectively to changing requirements• Goods and service design flexibility
- Ability to develop a wide range of customized goods or services to meet different or changing customer needs
• Volume flexibility: Ability to respond quickly to changes in the volume and type of demand
10Copyright ©2019 Cengage Learning. All Rights Reserved. May not be scanned, copied or duplicated, or posted to a publicly accessible website, in whole or in part. CH2
Innovation and LearningLO 2-1

11Copyright ©2019 Cengage Learning. All Rights Reserved. May not be scanned, copied or duplicated, or posted to a publicly accessible website, in whole or in part. CH2
Productivity and Operational Efficiency
LO 2-1

12Copyright ©2019 Cengage Learning. All Rights Reserved. May not be scanned, copied or duplicated, or posted to a publicly accessible website, in whole or in part. CH2
Triple bottom line (TBL or 3BL), Part 1LO 2-1
• Measurement of sustainability related to:• Environmental factors
- Energy consumption, recycling, resource conservation activities, air emissions, solid and hazardous waste rates, etc.
• Social factors
- Consumer and workplace safety, community relations, and corporate ethics and governance
13Copyright ©2019 Cengage Learning. All Rights Reserved. May not be scanned, copied or duplicated, or posted to a publicly accessible website, in whole or in part. CH2
Triple bottom line (TBL or 3BL), Part 2LO 2-1
• Economic factors
- Auditing, regulatory compliance, sanctions, donations, fines, etc.
14Copyright ©2019 Cengage Learning. All Rights Reserved. May not be scanned, copied or duplicated, or posted to a publicly accessible website, in whole or in part. CH2
Business AnalyticsLO 2-2
• Helps operations managers analyze data effectively and make better decisions• Applications
- Visualizing data to examine performance trends
- Calculating basic statistical measures
- Comparing results relative to other business units, competitors, or best-in-class benchmarks
- Using correlation and regression analysis

15Copyright ©2019 Cengage Learning. All Rights Reserved. May not be scanned, copied or duplicated, or posted to a publicly accessible website, in whole or in part. CH2
InterlinkingLO 2-2
• Quantitative modeling of cause-and-effect relationships between external and internal performance criteria
• Helps quantify performance relationships between all parts of a value chain

Exhibit 2.3 Interlinking Internal and External Performance Measures
LO 2-2
17Copyright ©2019 Cengage Learning. All Rights Reserved. May not be scanned, copied or duplicated, or posted to a publicly accessible website, in whole or in part. CH2
Value of a Loyal Customer (VLC)LO 2-2
• Quantifies total revenues or profits each target market customer generates over a buyer’s life cycle• Total market value - Multiplying VLC by the
absolute number of customers gained or lost

18Copyright ©2019 Cengage Learning. All Rights Reserved. May not be scanned, copied or duplicated, or posted to a publicly accessible website, in whole or in part. CH2
Actionable MeasuresLO 2-3
• Provide the basis for decisions at the level at which they are applied• Levels include value chain, organization,
process, department, workstation, job, and service encounters

19Copyright ©2019 Cengage Learning. All Rights Reserved. May not be scanned, copied or duplicated, or posted to a publicly accessible website, in whole or in part. CH2
Models of Organizational Performance
LO 2-4

20Copyright ©2019 Cengage Learning. All Rights Reserved. May not be scanned, copied or duplicated, or posted to a publicly accessible website, in whole or in part. CH2
Baldrige Performance Excellence Framework
LO 2-4
• Helps in the process of self-assessment to understand an organization’s strengths and weaknesses• Self-assessment:
- Helps improve quality, productivity, and overall competitiveness
- Encourages development of high-performance management practices

Exhibit 2.5 Baldrige Model of Organizational Performance
LO 2-4
22Copyright ©2019 Cengage Learning. All Rights Reserved. May not be scanned, copied or duplicated, or posted to a publicly accessible website, in whole or in part. CH2
Balanced Scorecard Model, Part 1LO 2-4
• Translates strategies into measures that uniquely communicate an organization’s vision
• Performance perspectives• Financial - Measures value provided to
shareholders
• Customer - Focuses on customer needs and satisfaction and market share and its growth

23Copyright ©2019 Cengage Learning. All Rights Reserved. May not be scanned, copied or duplicated, or posted to a publicly accessible website, in whole or in part. CH2
Balanced Scorecard Model, Part 2LO 2-4
• Innovation and learning
- Emphasizes people and infrastructure
• Internal
- Focuses attention on the performance of key internal processes that drive a business
24Copyright ©2019 Cengage Learning. All Rights Reserved. May not be scanned, copied or duplicated, or posted to a publicly accessible website, in whole or in part. CH2
Value Chain ModelLO 2-4
• Evaluates performance throughout the value chain by identifying measures associated with:• Suppliers
• Inputs
• Value creation processes
• Goods and service outputs and outcomes
• Customers and market segments
• Supporting and general management processes

25Copyright ©2019 Cengage Learning. All Rights Reserved. May not be scanned, copied or duplicated, or posted to a publicly accessible website, in whole or in part. CH2
Service-Profit Chain Model, Part 1LO 2-4
• States that employees create customer value and drive profitability through a service-delivery system
• Based on a set of cause-and-effect linkages between internal and external performance • Helps define key performance measurements on
which service-based firms should focus

Exhibit 2.8 Service-Profit Chain Model, Part 2
LO 2-4

KEY TERMS, Part 1
• Measurement• Customer-satisfaction measurement
system• Quality• Goods quality• Service quality• Service failures/upsets• Processing time• Queue/wait time• Flexibility

KEY TERMS, Part 2
• Goods and service design flexibility• Volume flexibility• Innovation• Learning• Productivity• Operational efficiency• Triple bottom line (TBL or 3BL)• Interlinking• Value of a loyal customer (VLC)• Actionable measures

SUMMARY
• Applications of business analytics help managers with effective decisions
• Interlinking helps quantify performance relationships between all parts of a value chain
• VLC helps understand operational decisions on revenue and customer retention
• Four models of organizational performance help in designing, monitoring, and evaluating performance