msx sd-wan monitoring guide - tpx
TRANSCRIPT

MSx SD-WANMonitoring Guidefor Velocloud

The MSx SD-WAN service includes powerful reporting capabilities which are accessible via the Orchestrator. The Orchestrator provides deep insight into how your WAN service is performing and provides business intelligence on your usage. You can view the top applications (i.e. Office 365, web browsing, Salesforce, AWS, etc.) that are consuming your bandwidth as well as who your top users are within your environment.
The TPx team will provide you with the URL and credentials to access the portal, if you did not receive a login, please contact your
Project Manager or Project Engineer.
Two-factor authentication is enabled in this screen.
Network OverviewThe Network Overview feature helps to monitor networks by checking the Edge and Link (activated Edge) status summary. Clicking Monitor > Network Overview in the navigation panel opens the Network Overview screen, which provides a visual summary about the enterprises running SD-WAN Edge devices, Non VMware SD-WAN Sites, profiles, segments, software versions, and their system configuration time and run time statuses. Green=Connected; Amber=Degraded; Red=Down.
The Network Overview screen (previous page) presents the overall summary information about a network in dashboard sections. These statistics include the following information about the Edges and Links:
n Total number of Edges
n Total number of Edge Hubs
n Total number of Links
n Total number of Hub Links
n Count of Edges/Edge Hubs (Connected, Degraded, and Down)
n Count of Link/Hub Links (Stable, Unstable, and Down)
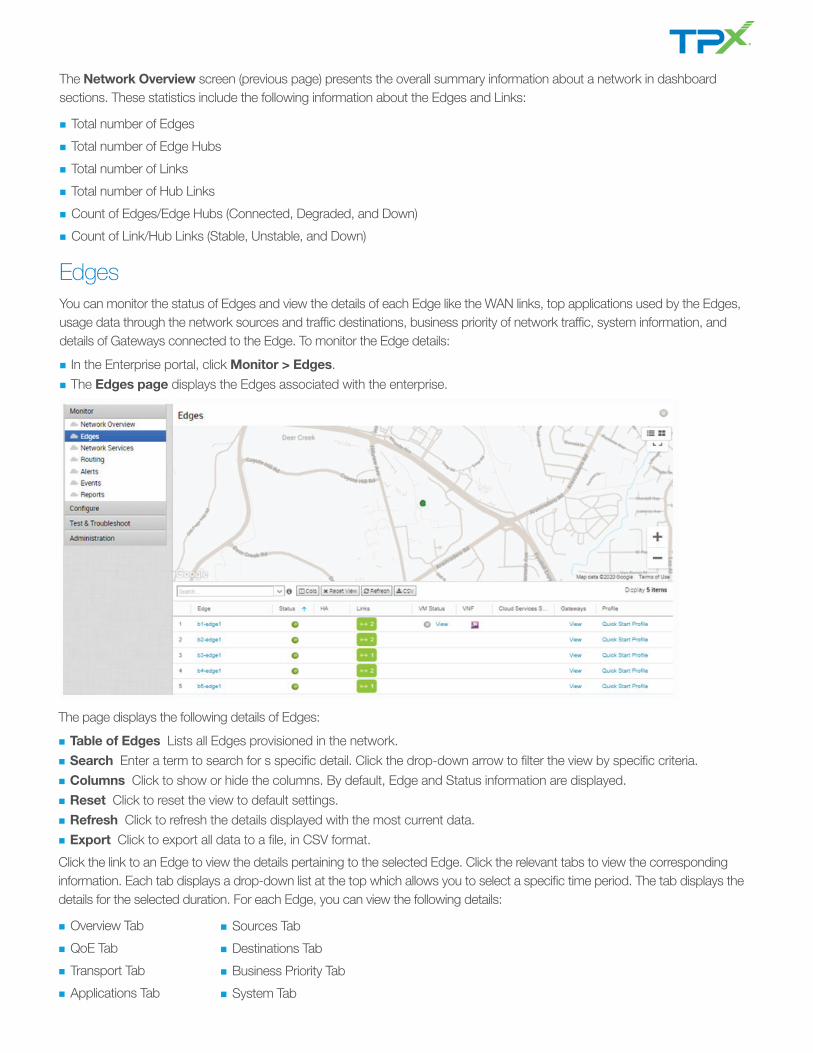
EdgesYou can monitor the status of Edges and view the details of each Edge like the WAN links, top applications used by the Edges, usage data through the network sources and traffic destinations, business priority of network traffic, system information, and details of Gateways connected to the Edge. To monitor the Edge details:
n In the Enterprise portal, click Monitor > Edges.
n The Edges page displays the Edges associated with the enterprise.
The page displays the following details of Edges:
n Table of Edges Lists all Edges provisioned in the network.
n Search Enter a term to search for s specific detail. Click the drop-down arrow to filter the view by specific criteria.
n Columns Click to show or hide the columns. By default, Edge and Status information are displayed.
n Reset Click to reset the view to default settings.
n Refresh Click to refresh the details displayed with the most current data.
n Export Click to export all data to a file, in CSV format.
Click the link to an Edge to view the details pertaining to the selected Edge. Click the relevant tabs to view the corresponding information. Each tab displays a drop-down list at the top which allows you to select a specific time period. The tab displays the details for the selected duration. For each Edge, you can view the following details:
n Overview Tab
n QoE Tab
n Transport Tab
n Applications Tab
n Sources Tab
n Destinations Tab
n Business Priority Tab
n System Tab

Edges > OverviewThe Overview tab of an Edge in the monitoring dashboard displays the details of WAN links along with bandwidth consumption and network usage. To view the information of an Edge:
n In the Enterprise portal, click Monitor > Edges.
n Click the link to an Edge and the Overview tab is displayed by default.
The Overview tab displays the details of links with status and the bandwidth consumption.
You can choose to view the Edge information live by selecting the Stay in live mode checkbox in the upper right. When this
mode is enabled, live monitoring of the Edge happens and the data in the page is updated whenever there is a change. Llive
mode is automatically moved to offline mode after a period of time to reduce the network load.
The Links Status section displays the details of Links, Link Status, WAN Interface, Throughput, Bandwidth and Signal.
The Top Consumers section displays graphical representation of bandwidth and network usage of the following:
Applications, Categories, Operating Systems, Sources, and Destinations of the Edges. Click View Details in each panel to
navigate to the corresponding tab and view more details.
Hover the mouse on the graphs to view more details.

Edges > QoEThe VMware SD-WAN Quality of Experience (QoE) tab shows the VeloCloud Quality Score (VQS) for different applications. The VQS rates an application’s quality of experience that a network can deliver for a period of time.
Click the Monitor > Edges > QoE tab to view the following details:
n In the Enterprise portal, click Monitor > Edges.
n Click the link to an Edge and the Overview tab is displayed by default.
Traffic Type
There are three different traffic types that you can monitor (Voice, Video, and Transactional) in the QoE tab. You can hover over a WAN network link, or the aggregate link to display a summary of Latency, Jitter, and Packet Loss.
VeloCloud Quality Score
The VeloCloud Quality Score (VQS) rates an application’s quality of experience that a network can deliver for a given time frame.
Some examples of applications are: video, voice, and transactional. QoE rating options are shown in the table below:
Rating Color Rating Option Definition
Green Good All metrics are better than the objective thresholds. Application SLA met/exceeded.
Yellow Fair Some or all metrics are between the objective and maximum values. Application SLA is partially met.
Red Poor Some or all metrics have reached or exceeded the maximum value. Application SLA is not met.
QoE Examples
The following images (next page) show examples of QoE with before and after voice traffic scenario problems and how VMware SD-WAN solved them. The red numbers in the following images represent the scenario numbers in the associated table.
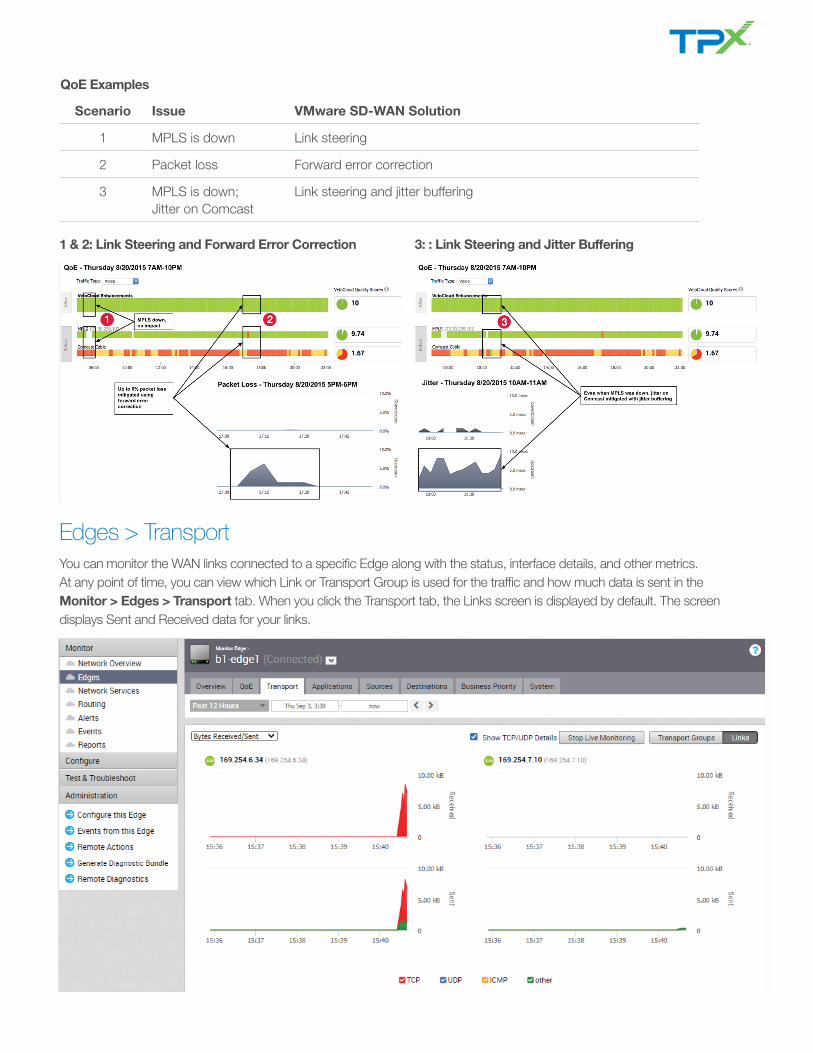
Scenario Issue VMware SD-WAN Solution
1 MPLS is down Link steering
2 Packet loss Forward error correction
3 MPLS is down; Jitter on Comcast
Link steering and jitter buffering
1 & 2: Link Steering and Forward Error Correction 3: : Link Steering and Jitter Buffering
Edges > TransportYou can monitor the WAN links connected to a specific Edge along with the status, interface details, and other metrics. At any point of time, you can view which Link or Transport Group is used for the traffic and how much data is sent in the Monitor > Edges > Transport tab. When you click the Transport tab, the Links screen is displayed by default. The screen displays Sent and Received data for your links.
QoE Examples

The links associated with an Edge are displayed in at the bottom of the screen under the Link column, along with the status for Cloud and VPN, WAN Interface, Application details, and details of Bytes. Hover the mouse on the graphs to view more details.
By default the Scale Y-axis evenly checkbox is enabled. This option synchronizes the Y-axis between the charts. If required, you can disable this option.
Choose the metrics from the drop-down to view the details related to the selected parameter. The bottom panel displays the details of the selected metrics for the links or the transport groups. Click the arrow prior to the link name or the transport group to view the break-up details. To view drill-down reports with more details, click the links displayed in the metrics column.
The image on the right shows a detailed report of transport groups with top applications:
Edges > ApplicationsYou can monitor the network usage of applications or application categories used by a specific Edge. Click the Monitor > Edges > Applications tab. At the top of the page, you can choose a specific time period to view the details of applications used for the selected duration. Click Categories to view similar applications grouped into categories. Hover the mouse on the graphs to view more details.

Choose the metrics from the drop-down to view the details related to the selected parameter. By default the Scale Y-axis evenly checkbox is enabled. This option synchronizes the Y-axis between the charts. If required, you can disable this option.
The bottom panel displays the details of the selected metrics for the applications or categories. To view drill-down reports with more details, click the links displayed in the metrics column. The following image on the right shows a detailed report of top applications.
Edges > SourcesYou can monitor the network usage of devices and operating systems for a specific Edge. Click Monitor > Edges > Sources.
At the top of the page, you can choose a specific time period to view the details of clients used for the selected duration. Click Operating Systems to view the report based on the Operating Systems used in the devices. Choose the metrics from the drop-down to view the details related to the selected parameter.By default the Scale Y-axis evenly checkbox is enabled. This option synchronizes the Y-axis between the charts. If required, you can disable this option. Hover the mouse on the graphs to view more details.
The bottom panel displays the details of the selected metrics for the devices or operating systems. To view drill-down reports with more details, click the links displayed in the metrics column. The right image shows a detailed report of top clients.
Click the arrows displayed next to Top Applications to navigate to the Applications tab.
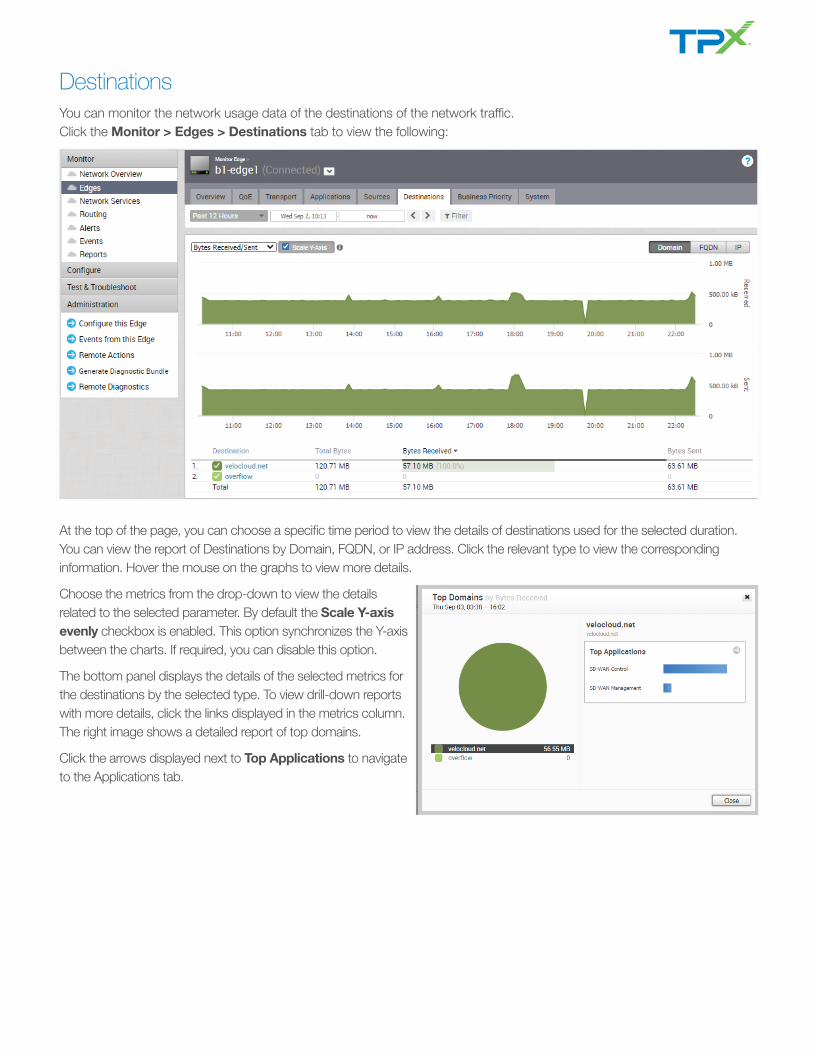
Destinations You can monitor the network usage data of the destinations of the network traffic. Click the Monitor > Edges > Destinations tab to view the following:
At the top of the page, you can choose a specific time period to view the details of destinations used for the selected duration. You can view the report of Destinations by Domain, FQDN, or IP address. Click the relevant type to view the corresponding information. Hover the mouse on the graphs to view more details.
Choose the metrics from the drop-down to view the details related to the selected parameter. By default the Scale Y-axis evenly checkbox is enabled. This option synchronizes the Y-axis between the charts. If required, you can disable this option.
The bottom panel displays the details of the selected metrics for the destinations by the selected type. To view drill-down reports with more details, click the links displayed in the metrics column. The right image shows a detailed report of top domains.
Click the arrows displayed next to Top Applications to navigate to the Applications tab.
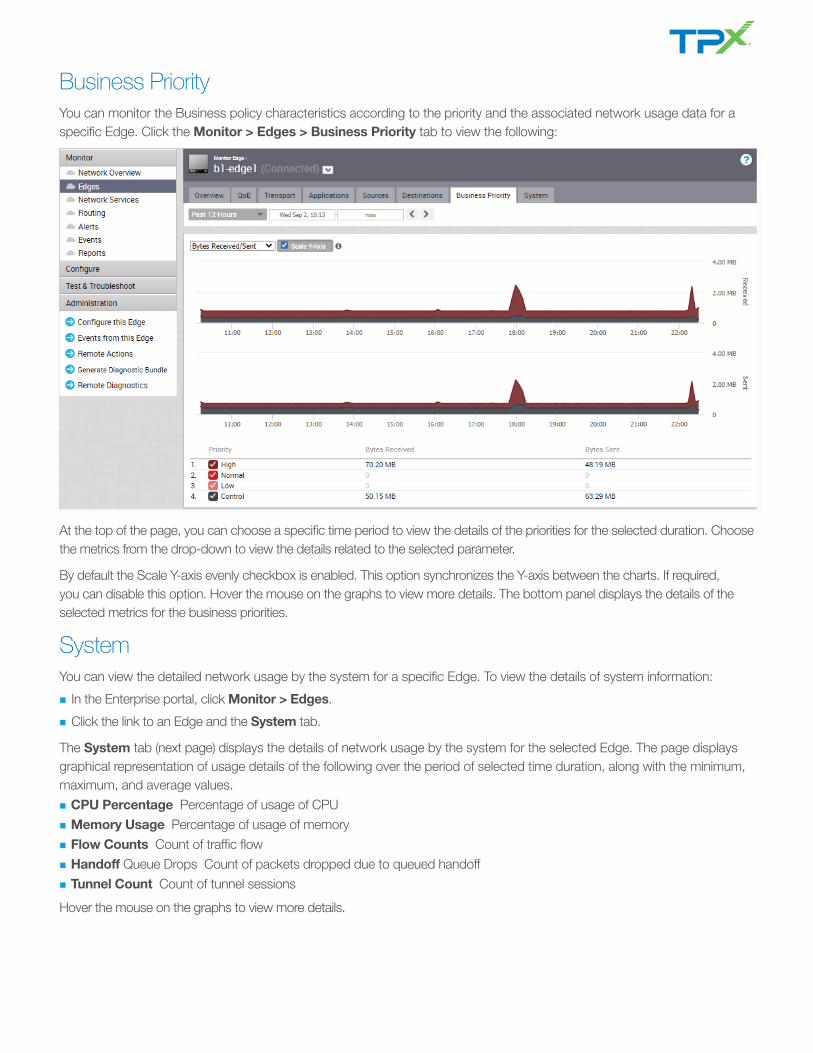
Business PriorityYou can monitor the Business policy characteristics according to the priority and the associated network usage data for a specific Edge. Click the Monitor > Edges > Business Priority tab to view the following:
At the top of the page, you can choose a specific time period to view the details of the priorities for the selected duration. Choose the metrics from the drop-down to view the details related to the selected parameter.
By default the Scale Y-axis evenly checkbox is enabled. This option synchronizes the Y-axis between the charts. If required, you can disable this option. Hover the mouse on the graphs to view more details. The bottom panel displays the details of the selected metrics for the business priorities.
SystemYou can view the detailed network usage by the system for a specific Edge. To view the details of system information:
n In the Enterprise portal, click Monitor > Edges.
n Click the link to an Edge and the System tab.
The System tab (next page) displays the details of network usage by the system for the selected Edge. The page displays graphical representation of usage details of the following over the period of selected time duration, along with the minimum, maximum, and average values.
n CPU Percentage Percentage of usage of CPU
n Memory Usage Percentage of usage of memory
n Flow Counts Count of traffic flow
n Handoff Queue Drops Count of packets dropped due to queued handoff
n Tunnel Count Count of tunnel sessions
Hover the mouse on the graphs to view more details.
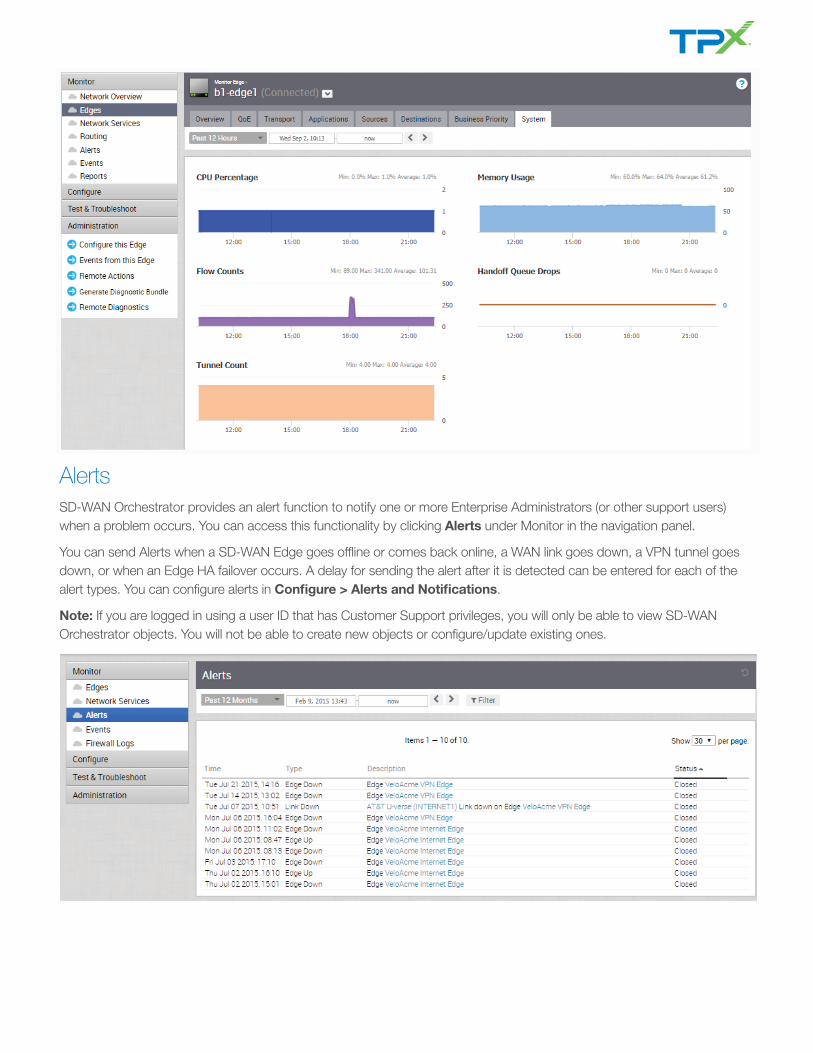
AlertsSD-WAN Orchestrator provides an alert function to notify one or more Enterprise Administrators (or other support users) when a problem occurs. You can access this functionality by clicking Alerts under Monitor in the navigation panel.
You can send Alerts when a SD-WAN Edge goes offline or comes back online, a WAN link goes down, a VPN tunnel goes down, or when an Edge HA failover occurs. A delay for sending the alert after it is detected can be entered for each of the alert types. You can configure alerts in Configure > Alerts and Notifications.
Note: If you are logged in using a user ID that has Customer Support privileges, you will only be able to view SD-WAN Orchestrator objects. You will not be able to create new objects or configure/update existing ones.
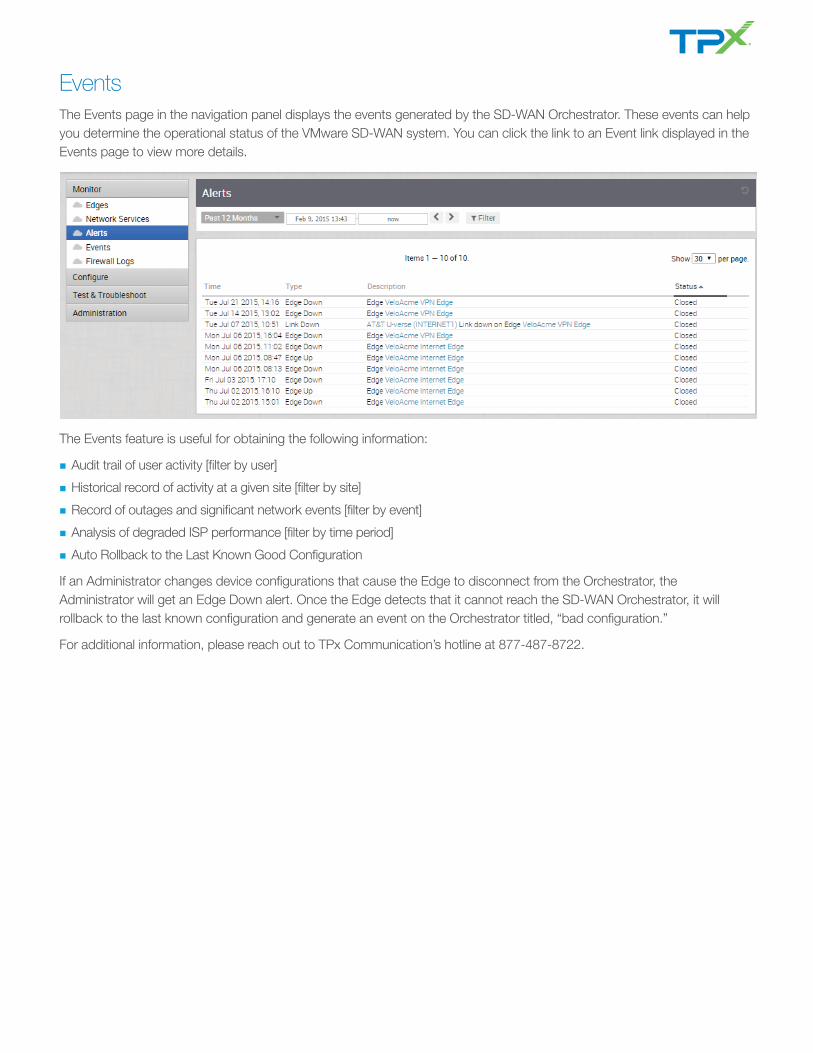
EventsThe Events page in the navigation panel displays the events generated by the SD-WAN Orchestrator. These events can help you determine the operational status of the VMware SD-WAN system. You can click the link to an Event link displayed in the Events page to view more details.
The Events feature is useful for obtaining the following information:
n Audit trail of user activity [filter by user]
n Historical record of activity at a given site [filter by site]
n Record of outages and significant network events [filter by event]
n Analysis of degraded ISP performance [filter by time period]
n Auto Rollback to the Last Known Good Configuration
If an Administrator changes device configurations that cause the Edge to disconnect from the Orchestrator, the Administrator will get an Edge Down alert. Once the Edge detects that it cannot reach the SD-WAN Orchestrator, it will rollback to the last known configuration and generate an event on the Orchestrator titled, “bad configuration.”
For additional information, please reach out to TPx Communication’s hotline at 877-487-8722.