msci inc. reports fourth quarter and fiscal year 2010
TRANSCRIPT

www.msci.com
1 of 22
MSCI Inc. Reports Fourth Quarter and Fiscal Year 2010 Financial Results
New York – January 13, 2011 – MSCI Inc. (NYSE: MSCI), a leading global provider of investment decision support
tools, including indices, portfolio risk and performance analytics and corporate governance services, today announced results for the fourth quarter and fiscal year ended November 30, 2010. For comparative purposes, selected results excluding the impact of acquisitions are presented, as are pro forma results as if MSCI had acquired RiskMetrics Group, Inc. (“RiskMetrics”) on December 1, 2008.
(Note: Percentage changes are referenced to the comparable period in fiscal year 2009, unless otherwise noted.)
Operating revenues increased 79.6% to $213.3 million in fourth quarter 2010 and 49.7% to $662.9 million for fiscal year 2010.
Compared to pro forma 2009, revenues grew by 9.2% to $213.3 million in fourth quarter 2010. Pro forma fiscal year 2010 revenues rose 9.4% to $816.4 million.
Net income increased by 23.4% to $30.3 million in fourth quarter 2010. For fiscal year 2010, net income increased by 12.7% to $92.2 million. Diluted EPS for fourth quarter 2010 rose 4.2% to $0.25. For fiscal year 2010, Diluted EPS rose 1.3% to $0.81.
Adjusted EBITDA (defined below) grew by 66.7% to $98.9 million with an Adjusted EBITDA margin of 46.4% for fourth quarter 2010 and for fiscal year 2010 grew by 43.0% to $307.6 million with a margin of 46.4%.
Compared to pro forma fourth quarter 2009, Adjusted EBITDA grew by 16.9% to $98.9 million and the Adjusted EBITDA margin expanded to 46.4% from 43.3%. Pro forma fiscal year 2010 Adjusted EBITDA rose 14.1% to $356.6 million and the Adjusted EBITDA margin expanded to 43.7% from 41.9%.
Fourth quarter 2010 Adjusted EPS (defined below) rose 16.1% to $0.36 and 20.5% to $1.35 for fiscal year 2010.
Henry A. Fernandez, Chairman and CEO, said, “We delivered a strong fourth quarter 2010, aided by strong demand for our equity indices and our risk management analytics products. Our pro forma revenues grew by 9.2% and our pro forma Adjusted EBITDA grew by 16.9%. Our Adjusted EPS grew by 16.1%.
“Fiscal year 2010 was an important year for MSCI. By acquiring RiskMetrics and Measurisk, we have enhanced our position as a leading provider of risk management and reporting solutions for our institutional investor clients. In addition, we continued to strengthen MSCI’s standing as a leading provider of benchmark equity indices to global active and passive investors. We are focused on completing our integration process and continuing to invest in our businesses. These investments should enable MSCI to take advantage of the long-term trends driving our business and contribute to our revenue growth over the next three to five years,” added Mr. Fernandez.

www.msci.com
2 of 22
Table 1: MSCI Inc. Selected Financial Information (unaudited)
Summary of Results for Fiscal Fourth Quarter 2010 compared to Fiscal Fourth Quarter 2009
Operating Revenues – See Table 4 Total operating revenues for the three months ended November 30, 2010 (fourth quarter 2010) increased $94.5 million, or 79.6%, to $213.3 million compared to $118.8 million for the three months ended November 30, 2009. The biggest drivers of revenue growth were the acquisitions of RiskMetrics and Measurisk which took place on June 1, 2010 and July 30, 2010, respectively, and which together contributed revenues of $78.6 million to growth in the fourth quarter. Total subscription revenues rose $83.0 million, or 88.5%, to $176.8 million while asset-based fees increased $5.5 million, or 23.9%, to $28.3 million. Non-recurring revenues increased $6.1 million to $8.2 million.
Excluding the impact of the acquisitions of RiskMetrics and Measurisk, total operating revenues grew by $15.9 million, or 13.4%, to $134.7 million, subscription revenues grew $7.9 million, or 8.4%, to $101.7 million in fourth quarter 2010 and non-recurring revenues increased $2.5 million to $4.7 million.
By segment, Performance and Risk revenues rose $66.2 million, or 55.8%, to $185.0 million. The Performance and Risk segment is comprised of index and ESG (defined below) products, risk management analytics, portfolio management analytics, and energy and commodity analytics. Revenues for the Governance segment were $28.3 million.
Index and ESG products: Our index and ESG products primarily consist of index subscriptions, equity index asset based fees products and environmental, social and governance (“ESG”) products. Revenues related to
Index and ESG products increased $19.9 million, or 27.8%, to $91.2 million. Index and ESG subscription revenue grew by $12.7 million, or 26.2%, to $61.1 million. The inclusion of ESG products contributed revenue growth of $4.7 million. Non-recurring index and ESG products revenue rose to $4.9 million from $2.1 million.
Excluding the impact of the RiskMetrics acquisition, index and ESG subscription revenue grew by $8.1 million, or 16.7%, driven by higher revenues from MSCI’s core benchmark indices and higher usage fees. Non-recurring revenues were $4.5 million, up from $2.1 million in fourth quarter 2009.
Change from Change from
November 30, November 30,
In thousands, except per share data 2010 2009 2009 2010 2009 2009
Operating revenues 213,318$ 118,790$ 79.6% 662,901$ 442,948$ 49.7%
Operating expenses 142,598 75,034 90.0% 456,778 291,956 56.5%
Net income 30,266 24,535 23.4% 92,170 81,801 12.7%
% Margin 14.2% 20.7% 13.9% 18.5%
Diluted EPS 0.25$ 0.24$ 4.2% 0.81$ 0.80$ 1.3%
Adjusted EPS1 0.36 0.31 16.1% 1.35 1.12 20.5%
Adjusted EBITDA2 98,914$ 59,343$ 66.7% 307,603$ 215,155$ 43.0%
% Margin 46.4% 50.0% 46.4% 48.6%
November 30,
2 Net
Income before interest income, interest expense, other expense (income), provision for income taxes, depreciation, amortization, non- recurring
stock- based compensation, and third party transaction expenses associated with the acquisition of RiskMetrics. See Table 15 titled "Reconciliation
of Adjusted EBITDA to Net Income" and information about the use of non- GAAP financial information provided under "Notes Regarding the Use of
Non- GAAP Financial Measures.”
November 30,
Three Months Ended Fiscal Year Ended
1 Per share net income before after- tax impact of amortization of intangibles, non- recurring stock- based compensation, third party transaction
expenses associated with the acquisition of RiskMetrics and debt repayment expenses. See Table 17 titled "Reconciliation of Adjusted Net Income
and Adjusted EPS to Net Income and EPS" and information about the use of non- GAAP financial information provided under "Notes Regarding the
Use of Non- GAAP Financial Measures.”

www.msci.com
3 of 22
Revenues attributable to equity index asset based fees rose $7.2 million, or 31.4%, to $30.0 million. The increase in equity index asset-based fees was driven primarily by an increase in ETF asset-based fees. The average value of assets in ETFs linked to MSCI equity indices increased 38.7% to $300.7 billion for fourth quarter 2010 compared to $216.8 billion for fourth quarter 2009. As of November 30, 2010, the value of assets in ETFs linked to MSCI equity indices was $311.0 billion, representing an increase of $76.8 billion, or 32.8%, from $234.2 billion as of November 30, 2009 and $52.3 billion, or 20.2%, from $258.7 billion as of August 31, 2010. We estimate that the $52.3 billion sequential increase was attributable to $28.2 billion of net asset appreciation and cash inflows of $24.1 billion in fourth quarter 2010. The three MSCI indices with the largest amount of ETF assets linked to them as of November 30, 2010 were the MSCI Emerging Markets, EAFE (an index of stocks in developed markets outside North America), and U.S. Broad Market indices. The assets linked to these indices were $102.7 billion, $39.4 billion, and $15.6 billion, respectively. Asset-based fees also include $1.7 million of non-recurring revenue in fourth quarter 2010.
Risk management analytics: Our risk management analytics products offer a consistent risk assessment framework for managing and monitoring investments in a variety of asset classes and are based on our proprietary integrated fundamental multi-factor risk models, value-at-risk methodologies and asset valuation models. Revenues related to risk management analytics increased $47.3 million, or 444.9%, to $58.0 million. The acquisitions of RiskMetrics and Measurisk added $45.8 million, or 430.1%, to growth in the fourth quarter.
Excluding the impact of the acquisitions, risk management analytics revenues grew by $1.6 million, or 14.8%. Increased revenues from the BarraOne product were the biggest driver of this growth.
Portfolio management analytics: Our portfolio management analytics products consist of analytics tools for equity and fixed income portfolio management. Revenues related to portfolio management analytics decreased by
$0.9 million, or 2.8%, to $31.0 million. Declines in software and analytics revenues more than offset a modest increase in revenues from the licensing of models.
Energy and commodity analytics: Our energy and commodity analytics products consist of software applications which help users value and model physical assets and derivatives across a number of market segments including energy and commodity assets. Revenues from energy and commodity analytics products
declined slightly by $0.1 million, or 1.4%, to $4.9 million. Growth in options analytics was more than offset by a decline in portfolio products revenues.
Governance: Our governance products consist of corporate governance products and services, including proxy research, recommendation and voting services for asset owners and asset managers as well as governance advisory and compensation services for corporations. It also includes forensic accounting research as well as class action
monitoring and claims filing services to aid institutional investors in the recovery of funds from securities litigation, all of which were acquired as part of our acquisition of RiskMetrics. Governance revenues were $28.3 million in fourth quarter 2010.
Operating Expenses – See Table 6
Total operating expense increased $67.6 million, or 90.0%, to $142.6 million in fourth quarter 2010 compared to fourth quarter 2009. The acquisitions added $65.1 million to operating expenses. Restructuring costs related to the ongoing integration of RiskMetrics contributed $1.9 million to operating expenses.
Compensation costs: Total compensation costs rose $36.9 million, or 81.0%, to $82.4 million in fourth quarter 2010. The increase in compensation largely reflects an increase in headcount, most of which was due to the acquisition of RiskMetrics. Excluding non-recurring stock-based compensation expense of $4.0 million, total compensation costs rose $39.1 million, or 99.5%, to $78.4 million.
Non-recurring stock-based compensation expenses for fourth quarter 2010 consisted of $1.9 million related to the founders grants awarded to certain employees at the time of the Company’s initial public offering (“IPO”) and $2.1 million related to the performance awards granted to certain employees in connection with the acquisition of

www.msci.com
4 of 22
RiskMetrics. The aggregate value of the performance awards of approximately $15.9 million is being amortized through 2012 and the aggregate value of the founders grants of approximately $68.0 million is being amortized through 2011. As a result of the vesting of portions of the founders grants, the related expense decreased $4.3 million, or 69.0%, to $1.9 million. In fourth quarter 2010, $1.6 million and $2.4 million of costs related to non-recurring stock-based compensation were recorded in cost of services and selling, general and administrative expense (“SG&A”), respectively.
Non-compensation costs excluding depreciation and amortization: Total non-compensation operating expenses excluding depreciation and amortization and restructuring costs rose $15.9 million, or 78.7%, to $36.0 million in fourth quarter 2010. The acquisition of RiskMetrics was the biggest driver behind the increase.
Cost of services: Total cost of services expenses rose by $36.9 million, or 114.6%, to $69.1 million. Within costs of services, compensation expenses increased by $27.6 million, or 120.3%, and non-compensation expenses increased by $9.4 million, or 100.5%. In both cases, the biggest driver behind the increase was the acquisition of RiskMetrics.
Selling, general and administrative expense (SG&A): Total SG&A expense rose $15.8 million, or 47.2%, to $49.3 million. Within SG&A, compensation expenses increased by $9.3 million, or 41.1%, and non-compensation expenses increased by $6.5 million, or 60.0%. In both cases, the biggest driver behind the increase was the acquisition of RiskMetrics.
Amortization of intangibles: Amortization of intangibles expense totaled $16.7 million compared to $6.3 million in fourth quarter 2009. The $10.4 million increase consisted of $12.4 million of increased amortization associated with the acquisitions of RiskMetrics and Measurisk, partially offset by a $2.0 million decline in amortization of intangible assets related to the acquisition of Barra.
Adjusted EBITDA – See Table 15
Adjusted EBITDA, which excludes among other things the impact of non-recurring stock-based compensation, was $98.9 million, an increase of $39.6 million, or 66.7% from fourth quarter 2009. Adjusted EBITDA margin declined to 46.4% from 50.0% as a result of the dilutive impact of the acquisition of the lower margin RiskMetrics.
By segment, Adjusted EBITDA for the Performance and Risk segment increased $31.2 million, or 52.6%, to $90.6 million from fourth quarter 2009. Adjusted EBITDA margin for this segment fell to 48.9% from 50.0% in fourth quarter 2009. Adjusted EBITDA for the Governance segment was $8.4 million and the Adjusted EBITDA margin was 29.6%.
See Table 15 titled “Reconciliation of Adjusted EBITDA to Net Income” and “Notes Regarding the Use of Non-GAAP Financial Measures” below.
Other Expense (Income), Net
Other expense (income), net for fourth quarter 2010 was $19.6 million, an increase of $15.5 million from fourth quarter 2009. Interest expense rose $13.0 million as a result of the increased levels of indebtedness incurred in
connection with the acquisition of RiskMetrics. The remaining $2.5 million increase primarily reflects $2.4 million of increased foreign exchange losses recognized during fourth quarter 2010.
Provision for Income Taxes
The provision for income tax expense was $20.8 million for fourth quarter 2010, an increase of $5.7 million, or 37.7%, compared to $15.1 million for the same period in 2009. The effective tax rate was 40.7% for fourth quarter 2010 compared to 38.1% for fourth quarter 2009. The fourth quarter 2010 effective tax rate excluding the impact of transaction costs would have been 39.9%.

www.msci.com
5 of 22
Net Income and Earnings per Share - See Table 17
Net income increased $5.7 million, or 23.4%, to $30.3 million for fourth quarter 2010. The net income margin decreased to 14.2% from 20.7% as a result of the impact of the acquisition of the lower margin RiskMetrics business as well as the additional amortization of intangibles, restructuring costs, and higher interest expense related to the same acquisition. Diluted EPS increased 4.2% to $0.25.
Adjusted net income, which excludes the after-tax impact of amortization of intangibles, non-recurring stock-based compensation expense, and restructuring costs totaling $14.1 million, rose $12.0 million, or 37.3%, to $44.3 million. Adjusted EPS, which excludes the after-tax, per share impact of amortization of intangibles, non-recurring stock-based compensation expense, and restructuring costs totaling $0.11, rose 16.1% to $0.36.
See table 17 titled “Reconciliation of Adjusted Net Income and Adjusted EPS to Net Income and EPS.”
Summary of Results for Fiscal Year 2010 compared to Fiscal Year 2009
Operating Revenues – See Table 5 Total operating revenues for fiscal year 2010 increased $220.0 million, or 49.7%, to $662.9 million compared to $442.9 million for fiscal year 2009. The acquisitions of RiskMetrics and Measurisk added revenues of $156.7 million in fiscal year 2010. Total subscription revenue rose $175.6 million, or 48.5%, to $537.8 million, while asset-based fees rose $32.1 million, or 44.6%, to $104.1 million. Total non-recurring revenues increased $12.2 million, or 138.1%, to $21.0 million.
Excluding the impact of the acquisitions, total operating revenues grew by $63.2 million, or 14.3%, subscription revenues grew by $26.5 million, or 7.3%, and non-recurring revenues grew by $4.6 million, or 52.2%, from fiscal year 2009. Excluding the impact of the acquisitions, index and ESG products and risk management analytics revenues grew 23.3% and 21.2%, respectively, in fiscal year 2010. Portfolio management analytics revenues declined 4.7% and Energy and other commodity analytics revenues rose 4.5%.
By segment, Performance and Risk revenues rose $161.4 million, or 36.4%, to $604.3 million for fiscal year 2010. Governance revenues were $58.6 million.
Operating Expenses – See Table 7
Total operating expenses increased $164.8 million, or 56.5%, to $456.8 million in fiscal year 2010 compared to fiscal year 2009. Operating expenses included third party transaction expenses related to the acquisition of RiskMetrics of $21.2 million and restructuring costs of $8.9 million. Excluding these expenses, total operating expenses would have risen by $134.7 million, or 46.1%. The $134.7 million increase reflects increases of $80.0 million, or 67.4%, in cost of services and $33.3 million, or 24.5%, in SG&A expense.
Adjusted EBITDA – See Table 15
Adjusted EBITDA was $307.6 million, an increase of $92.4 million, or 43.0%, from fiscal year 2009. Adjusted EBITDA margin fell to 46.4% from 48.6%.
By segment, Adjusted EBITDA for the Performance and Risk segment increased $76.5 million, or 35.5%, to $291.6 million from fiscal year 2009. Adjusted EBITDA margin fell to 48.3% from 48.6% in fiscal year 2009. Adjusted EBITDA for the Governance segment was $16.0 million and the Adjusted EBITDA Margin was 27.2%.
See Table 15 titled “Reconciliation of Adjusted EBITDA to Net Income” and “Notes Regarding the Use of Non-GAAP Financial Measures” below.

www.msci.com
6 of 22
Other Expense (Income), Net
Other expense (income), net for fiscal year 2010 was $52.6 million, an increase of $33.4 million from fiscal year 2009.
Approximately $31.7 million of increased interest expense resulted from the $1,275.0 million term loan we assumed as part of our acquisition of RiskMetrics and interest expense recognized during fiscal year 2010 associated with the accelerated amortization of deferred financing and debt discount costs as a result of our termination of our former term loans. In addition, the increase in other expense (income) reflects $2.6 million of increased foreign exchange losses partially offset by $1.0 million of increased miscellaneous non-operating income.
Provision for Income Taxes
The provision for income tax expense was $61.3 million for fiscal year 2010, an increase of $11.4 million, or 22.8%, compared to $49.9 million for fiscal year 2009. Our effective tax rate for fiscal year 2010 was 40.0% compared to 37.9% for fiscal year 2009. The fiscal year 2010 effective tax rate includes the impact of the acquisition-related transaction costs, some of which were not tax deductible, which increased our effective tax rate by 2.6%.
Net Income and Earnings per Share – See Table 17
Net income increased $10.4 million, or 12.7%, to $92.2 million and the net income margin decreased to 13.9% from 18.5%. Diluted EPS rose by 1.3% to $0.81 from $0.80.
Adjusted net income, which excludes the after-tax impact of amortization of intangibles, non-recurring stock-based compensation expense, transaction expenses, debt repayment expenses, and restructuring costs totaling $62.2 million, rose $40.1 million, or 35.1%, to $154.3 million. Adjusted EPS, which excludes the after-tax, per share impact of amortization of intangibles, non-recurring stock-based compensation expense, transaction expenses, debt repayment expenses, and restructuring costs totaling $0.54, rose 20.5% to $1.35 in fiscal year 2010.
See table 17 titled “Reconciliation of Adjusted Net Income and Adjusted EPS to Net Income and EPS.”
Summary of Results for Pro Forma Fourth Quarter 2010 compared to Pro Forma Fourth Quarter 2009
Operating Revenues – See Table 9
Compared to pro forma fourth quarter 2009, total operating revenues increased $18.1 million, or 9.2%, to $213.3 million. By segment, Performance and Risk revenues rose $22.1 million, or 13.6%, to $185.0 million. Governance revenue trends are described further below. Subscription revenues rose by $12.2 million, or 7.4%, to $176.8 million and non-recurring revenues increased $0.4 million to $8.2 million. Index and ESG products: Compared to pro forma fourth quarter 2009, total index and ESG revenues rose $15.4 million, or 20.2%, to $91.2 million. Index and ESG subscription revenues rose by $8.2 million, or 15.5%, to $61.1 million from $53.0 million. The strong growth was driven by higher revenues from MSCI’s core benchmark indices and higher usage fees. Revenues from asset-based fees increased $7.2 million, or 31.4%, to $30.0 million, compared to pro forma fourth quarter 2009. Non-recurring Index and ESG products revenues rose by $2.2 million to $4.9 million.
Risk management analytics: Compared to pro forma fourth quarter 2009, risk management analytics revenues rose $7.8 million, or 15.4% to $58.0 million, driven by growth in revenues from both BarraOne and RiskManager products. The acquisition of Measurisk contributed $3.3 million, or 6.6%, to growth in the fourth quarter.
Governance: Compared to pro forma fourth quarter 2009, governance revenues declined $4.1 million, or 12.6%, to $28.3 million. Because a higher proportion of non-recurring revenues in this segment are recognized in December,

www.msci.com
7 of 22
which are included in the pro forma fourth quarter 2009 figure but excluded from that of 2010, the pro forma comparison for the fourth quarter results in a seasonal mismatch that impacted the comparison by $1.2 million. Excluding this timing difference, revenues fell by $2.9 million, or 9.4%.
After adjusting for differences in seasonality, the 9.4% fall in revenues was led by a decline of 12.3% in proxy research and voting revenues offset, in part, by a 1.8% increase in revenues from our corporate compensation advisory business. Revenues from forensic accounting services also declined. Non-recurring revenues were $2.8 million in fourth quarter 2010 versus $4.4 million in the pro forma fourth quarter 2009.
The acquisition of RiskMetrics did not impact the revenues attributable to the asset-based fees sub-category of index and ESG products, portfolio management analytics and energy and commodity analytics and comparisons for these products are not presented. Comparisons to fourth quarter 2009 revenues comparisons are discussed in the Summary of Results for Fiscal Fourth Quarter 2010 compared to Fiscal Fourth Quarter 2009 above.
Operating Expenses – See Table 10
Compared to pro forma fourth quarter 2009, total operating expenses excluding restructuring costs fell $0.1 million to $140.2 million.
Compensation costs: Compared to pro forma fourth quarter 2009, compensation costs excluding non-recurring stock-based compensation expense rose $3.4 million, or 4.5%, to $78.4 million. The increase in compensation costs reflects higher headcount and an increase in overall compensation. Compensation costs benefited from a reduction in the full year bonus accrual, which had a $1.5 million impact on fourth quarter 2010. Total non-recurring stock-based compensation expense fell by $2.2 million, or 35.6%, to $4.0 million.
Non-compensation costs excluding depreciation and amortization: Compared to pro forma fourth quarter 2009, total non-compensation costs excluding depreciation and amortization as well as restructuring costs increased $0.3 million, or 0.9%, to $36.0 million. Higher outside professional and travel and entertainment expenses more than offset lower taxes and license fees.
Cost of services: Compared to pro forma fourth quarter 2009, total cost of services rose $0.6 million, or 0.8%, to
$69.1 million. Compensation expenses excluding non-recurring stock-based compensation expense rose $1.6 million, or 3.3%, to $48.8 million. Non-compensation expenses fell by $0.5 million, or 2.7%, to $18.7 million, driven by lower market data costs.
Selling, general and administrative expense (SG&A): Compared to pro forma fourth quarter 2009, total SG&A expense rose $0.9 million, or 1.9%, to $49.3 million. Within SG&A, compensation expenses excluding non-recurring stock-based compensation rose $1.8 million, or 6.6%, to $29.5 million. Non-compensation expenses rose $0.8 million, or 5.1%, to $17.4 million. The increase in non-compensation expenses was driven primarily by higher outside professional and travel and entertainment expenses.
Adjusted EBITDA – See Table 16
Compared to pro forma fourth quarter 2009, Adjusted EBITDA increased $14.3 million, or 16.9%, to $98.9 million and the margin expanded to 46.4% from 43.3%. Performance and Risk segment Adjusted EBITDA grew by $14.5 million, or 19.1%, to $90.6 million and the margin increased to 48.9% from 46.7%. Governance Adjusted EBITDA fell by $0.2 million, or 2.7%, to $8.4 million and the margin increased to 29.6% from 26.5%.
See Table 16 titled “Reconciliation of Pro Forma Adjusted EBITDA to Pro Forma Net Income” and “Notes Regarding the Use of Non-GAAP Financial Measures” below.

www.msci.com
8 of 22
Summary of Results for Pro Forma Fiscal Year 2010 compared to Pro Forma Fiscal Year 2009
Operating Revenues – See Table 9 Total operating revenues for the pro forma fiscal year 2010 compared to pro forma fiscal year 2009 rose $70.1 million, or 9.4%, to $816.4 million. Subscription revenue rose $35.7 million, or 5.6%, to $679.0 million, driven by growth in index and ESG subscriptions and risk management analytics, which more than offset declines from portfolio management analytics and governance. Asset-based fees rose $32.1 million, or 44.6%, to $104.1 million. Non-recurring revenues increased by $2.3 million, or 7.4%, to $33.4 million, as higher non-recurring index and ESG subscription revenues offset declines in non-recurring governance and risk management analytics revenues. The acquisition of Measurisk contributed $4.4 million, or 0.6%, to growth for fiscal year 2010.
The acquisition of RiskMetrics did not impact the revenues attributable to the asset-based fees sub-category of index and ESG products, portfolio management analytics and energy and commodity analytics and comparisons for these products are not presented. Comparisons to fiscal year 2009 revenues are discussed in the Summary of Results for Fiscal Year 2010 compared to Fiscal Year 2009 above.
By segment, Performance and Risk revenues rose $79.3 million, or 12.9%, to $693.2 million. Governance revenues declined $9.2 million, or 6.9%, to $123.2 million.
Operating Expenses – See Table 10 Compared to pro forma fiscal year 2009, total operating expense for pro forma fiscal year 2010 increased $13.4 million, or 2.4%, to $567.3 million.
Total compensation expense excluding non-recurring stock-based compensation increased $20.8 million, or 7.0%, to $319.1 million. Non-compensation costs excluding depreciation and amortization and restructuring costs rose $5.3 million, or 3.9%, to $140.7 million.
Compared to pro forma fiscal year 2009, total cost of services for pro forma fiscal year 2010 rose $14.0 million, or 5.4%, to $272.9 million. The growth was driven by an increase of $12.9 million, or 7.0%, in compensation excluding non-recurring stock-based compensation expense and a $5.8 million, or 8.9%, increase in non-compensation expenses.
Total SG&A declined $2.1 million, or 1.1%, to $199.3 million in fiscal year 2010. The decline was driven by a reduction of $9.6 million, or 55.3%, in non-recurring stock-based compensation and a decrease of $0.5 million, or 0.7%, in non-compensation expenses partially offset by an increase of $7.9 million, or 7.0%, in compensation excluding non-recurring stock-based compensation expense.
Adjusted EBITDA – See Table 16
Compared to pro forma fiscal year 2009, pro forma fiscal year Adjusted EBITDA increased $44.0 million, or 14.1%, to $356.6 million and the margin expanded to 43.7% from 41.9%.
By segment, Performance and Risk Adjusted EBITDA rose $45.1 million, or 16.1%, to $324.3 million. The margin expanded to 46.8% from 45.5%. Governance Adjusted EBITDA declined $1.1 million, or 3.2%, to $32.3 million and the margin rose to 26.2% from 25.2%.
See Table 16 titled “Reconciliation of Pro Forma Adjusted EBITDA to Pro Forma Net Income” and “Notes Regarding the Use of Non-GAAP Financial Measures” below.

www.msci.com
9 of 22
Conference Call Information
Investors will have the opportunity to listen to MSCI Inc.'s senior management review fourth quarter 2010 results on Thursday, January 13, 2011 at 11:00 am Eastern Time. To hear the live event, visit the investor relations section of
MSCI's website, http://ir.msci.com/events.cfm, or dial 1-877-312-9206 within the United States. International callers
dial 1-408-774-4001.
An audio recording of the conference call will be available on our website approximately two hours after the conclusion of the live event and will be accessible through January 20, 2011. To listen to the recording, visit
http://ir.msci.com/events.cfm, or dial 1-800-642-1687 (passcode: 33768957) within the United States. International
callers dial 1-706-645-9291 (passcode: 33768957).
About MSCI Inc.
MSCI Inc. is a leading provider of investment decision support tools to investors globally, including asset managers,
banks, hedge funds and pension funds. MSCI products and services include indices, portfolio risk and performance
analytics, and governance tools.
The company’s flagship product offerings are: the MSCI indices which include over 120,000 daily indices covering more than 70 countries; Barra portfolio risk and performance analytics covering global equity and fixed income markets; RiskMetrics market and credit risk analytics; ISS governance research and outsourced proxy voting and reporting services; FEA valuation models and risk management software for the energy and commodities markets; and CFRA forensic accounting risk research, legal/regulatory risk assessment, and due-diligence. MSCI is headquartered in New York, with research and commercial offices around the world. MSCI#IR
For further information on MSCI Inc. or our products please visit www.msci.com.
MSCI Inc. Contact:
Edings Thibault, MSCI, New York + 1.866.447.7874
For media inquiries please contact:
Kenny Suarez | Patrick Clifford, Abernathy MacGregor, New York + 1.212.371.5999
Sally Todd | Kristy Fitzpatrick, MHP Communications, London + 44.20.3128.8100
Forward-Looking Statements
This release contains forward-looking statements. These statements relate to future events or to future financial performance and involve known and unknown risks, uncertainties and other factors that may cause our actual results, levels of activity, performance, or achievements to be materially different from any future results, levels of activity, performance, or achievements expressed or implied by these forward-looking statements. In some cases, you can identify forward-looking statements by the use of words such as “may,” “could,” “expect,” “intend,” “plan,” “seek,” “anticipate,” “believe,” “estimate,” “predict,” “potential,” or “continue” or the negative of these terms or other comparable terminology. You should not place undue reliance on forward-looking statements because they involve known and unknown risks, uncertainties and other factors that are, in some cases, beyond our control and that could materially affect actual results, levels of activity, performance, or achievements.
www.msci.com
10 of 22
Other factors that could materially affect actual results, levels of activity, performance or achievements can be found in MSCI's Annual Report on Form 10-K for the fiscal year ended November 30, 2009 and filed with the Securities and Exchange Commission (SEC) on January 29, 2010, and in quarterly reports on Form 10-Q and current reports on Form 8-K filed with the SEC. If any of these risks or uncertainties materialize, or if our underlying assumptions prove to be incorrect, actual results may vary significantly from what we projected. Any forward-looking statement in this release reflects our current views with respect to future events and is subject to these and other risks, uncertainties and assumptions relating to our operations, results of operations, growth strategy and liquidity. We assume no obligation to publicly update or revise these forward-looking statements for any reason, whether as a result of new information, future events, or otherwise.
Notes Regarding the Use of Non-GAAP Financial Measures
MSCI has presented supplemental non-GAAP financial measures as part of this earnings release. A reconciliation is provided below that reconciles each non-GAAP financial measure with the most comparable GAAP measure. The presentation of non-GAAP financial measures should not be considered as alternative measures for the most directly comparable GAAP financial measures. These measures are used by management to monitor the financial performance of the business, inform business decision making and forecast future results.
Adjusted EBITDA is defined as net income before provision for income taxes, other net expense and income, depreciation and amortization, non-recurring stock-based compensation expense, restructuring costs, and third party transaction costs related to the acquisition of RiskMetrics.
Adjusted net income and Adjusted EPS are defined as net income and EPS, respectively, before provision for non-recurring stock-based compensation expenses, amortization of intangible assets, third party transaction costs related to the acquisition of RiskMetrics, restructuring costs, and the accelerated interest expense resulting from the termination of an interest rate swap and the accelerated amortization of deferred financing and debt discount costs (debt repayment expenses), as well as for any related tax effects.
We believe that adjustments related to transaction costs and debt repayment expenses are useful to management and investors because it allows for an evaluation of MSCI’s underlying operating performance by excluding the costs incurred in connection with the acquisition of RiskMetrics. Additionally, we believe that adjusting for non-recurring stock-based compensation expenses and the amortization of intangible assets may help investors compare our performance to that of other companies in our industry as we do not believe that other companies in our industry have as significant a portion of their operating expenses represented by one-time non-recurring stock-based compensation expenses and amortization of intangible assets. We believe that the non-GAAP financial measures presented in this earnings release facilitate meaningful period-to-period comparisons and provide a baseline for the evaluation of future results.
Adjusted EBITDA, Adjusted net income and Adjusted EPS are not defined in the same manner by all companies and may not be comparable to other similarly titled measures of other companies.

www.msci.com
11 of 22
Table 2: MSCI Inc. Consolidated Statement of Income (unaudited)
Table 3: MSCI Inc. Selected Balance Sheet Items (unaudited)
August 31,
In thousands, except per share data 2010 2009 2010 2010 2009
Operating revenues 213,318$ 118,790$ 202,733$ 662,901$ 442,948$
Operating expenses
Cost of services 69,131 32,214 69,741 198,626 118,665
Selling, general and administrative 49,300 33,487 63,306 190,244 135,780
Restructuring costs 1,943 - 6,953 8,896 -
Amortization of intangible assets 16,694 6,268 16,350 41,599 25,554
Depreciation and amortization of property, 5,530 3,065 4,934 17,413 11,957
equipment, and leasehold improvements
Total operating expenses 142,598$ 75,034$ 161,284$ 456,778$ 291,956$
Operating income 70,720 43,756 41,449 206,123 150,992
Interest income (128) (339) (114) (993) (1,053)
Interest expense 17,495 4,513 20,415 51,337 19,683
Other expense (income) 2,274 (71) 524 2,288 641
Other expense, net 19,641$ 4,103$ 20,825$ 52,632$ 19,271$
Income before income taxes 51,079 39,653 20,624 153,491 131,721
Provision for income taxes 20,813 15,118 10,305 61,321 49,920
Net income 30,266$ 24,535$ 10,319$ 92,170$ 81,801$
Earnings per basic common share 0.25$ 0.24$ 0.09$ 0.82$ 0.80$
Earnings per diluted common share 0.25$ 0.24$ 0.08$ 0.81$ 0.80$
Weighted average shares outstanding used
in computing earnings per share
Basic 119,309 101,383 118,339 112,074 100,607
Diluted 121,172 101,952 120,341 113,357 100,860
Three Months Ended Fiscal Year Ended
November 30,November 30,
November 30, November 30,
In thousands 2010 2009
Cash and cash equivalents 226,575$ 176,024$
Short-term investments 73,891 295,304
Trade receivables, net of allow ances 147,662 77,180
Deferred revenue 271,300$ 152,944$
Current maturities of long-term debt 54,916 42,088
Long-term debt, net of current maturities 1,207,881 337,622
As of

www.msci.com
12 of 22
Table 4: Fourth Quarter 2010 Operating Revenues by Product Category
Table 5: Fiscal Year 2010 Operating Revenues by Product Category
August 31, November 30, August 31,
In thousands 2010 2009 2010 2009 2010
Index and ESG products
Subscriptions 61,143$ 48,454$ 58,984$ 26.2% 3.7%
Asset-based fees 30,045 22,874 25,134 31.4% 19.5%
Index and ESG products total 91,188 71,328 84,118 27.8% 8.4%
Risk management analytics 57,980 10,640 54,593 444.9% 6.2%
Portfolio management analytics 30,993 31,883 30,424 (2.8%) 1.9%
Energy and commodity analytics 4,871 4,939 3,290 (1.4%) 48.0%
Total Performance and Risk revenues 185,032$ 118,790$ 172,425$ 55.8% 7.3%
Total Governance revenues 28,286 - 30,308 n/m (6.7%)
Total operating revenues 213,318$ 118,790$ 202,733$ 79.6% 5.2%
Subscriptions 176,791$ 93,770$ 171,384$ 88.5% 3.2%
Asset-based fees 28,330 22,874 25,134 23.9% 12.7%
Non-recurring revenues 8,197 2,146 6,215 282.0% 31.9%
Total operating revenues 213,318$ 118,790$ 202,733$ 79.6% 5.2%
Three Months Ended Change from
November 30,
In thousands 2010 2009 Change
Index and ESG products
Subscriptions 224,600$ 188,531$ 19.1%
Asset-based fees 105,799 71,966 47.0%
Index and ESG products total 330,399 260,497 26.8%
Risk management analytics 134,521 37,656 257.2%
Portfolio management analytics 123,159 129,270 (4.7%)
Energy and commodity analytics 16,228 15,525 4.5%
Total Performance and Risk revenues 604,307$ 442,948$ 36.4%
Total Governance revenues 58,594 - n/m
Total operating revenues 662,901$ 442,948$ 49.7%
Subscriptions 537,768$ 362,140$ 48.5%
Asset-based fees 104,084 71,966 44.6%
Non-recurring revenues 21,049 8,842 138.1%
Total operating revenues 662,901$ 442,948$ 49.7%
November 30,
Fiscal Year Ended

www.msci.com
13 of 22
Table 6: Additional Fourth Quarter 2010 Operating Expense Detail
August 31, November 30, August 31,
In thousands 2010 2009 2010 2009 2010
Cost of services
Compensation 48,849$ 20,800$ 50,313$ 134.8% (2.9%)
Non-Recurring Stock Based Comp 1,617 2,103 1,624 (23.1%) (0.4%)
Total Compensation 50,466$ 22,903$ 51,937$ 120.3% (2.8%)
Non-Compensation 18,665 9,311 17,804 100.5% 4.8%
Total cost of services 69,131$ 32,214$ 69,741$ 114.6% (0.9%)
Selling, general and administrative
Compensation 29,508 18,473 30,280 59.7% (2.5%)
Non-Recurring Stock Based Comp 2,410 4,151 2,603 (41.9%) (7.4%)
Total Compensation 31,918$ 22,624$ 32,883$ 41.1% (2.9%)
Transaction expenses - - 13,692 - -
Non-compensation excl. transaction expenses 17,382 10,863 16,731 60.0% 3.9%
Total selling, general and administrative 49,300$ 33,487$ 63,306$ 47.2% (22.1%)
Restructuring costs 1,943 - 6,953 n/m (72.1%)
Amortization of intangible assets 16,694 6,268 16,350 166.4% 2.1%
Depreciation and amortization 5,530 3,065 4,934 80.4% 12.1%
Total operating expenses 142,598$ 75,034$ 161,284$ 90.0% (11.6%)
In thousands
Total non-recurring stock based comp 4,027$ 6,254$ 4,227$ (35.6%) (4.7%)
Compensation excluding non-recurring comp 78,357 39,273 80,593 99.5% (2.8%)
Transaction expenses - - 13,692 - -
Non-compensation excluding transaction expenses 36,047 20,174 34,535 78.7% 4.4%
Restructuring charges 1,943 - 6,953 n/m (72.1%)
Amortization of intangible assets 16,694 6,268 16,350 166.4% 2.1%
Depreciation and amortization 5,530 3,065 4,934 80.4% 12.1%
Total operating expenses 142,598$ 75,034$ 161,284$ 90.0% (11.6%)
November 30,
Three Months Ended Change from

www.msci.com
14 of 22
Table 7: Additional Fiscal Year 2010 Operating Expense Detail
In thousands 2010 2009 $ Change % Change
Cost of services
Compensation 142,485$ 78,317$ 64,168 81.9%
Non-Recurring Stock Based Comp 4,639 9,355 (4,716) (50.4%)
Total Compensation 147,124$ 87,672$ 59,452 67.8%
Non-compensation 51,502 30,993 20,508 66.2%
Total cost of services 198,626$ 118,665$ 79,961 67.4%
Selling, general and administrative
Compensation 102,144 75,501 26,643 35.3%
Non-Recurring Stock Based Comp 7,727 17,297 (9,571) (55.3%)
Total Compensation 109,871$ 92,798$ 17,072 18.4%
Transaction expenses 21,206 - 21,206 n/m
Non-compensation excl. transaction expenses 59,167 42,982 16,185 37.7%
Total selling, general and administrative 190,244$ 135,780$ 54,464 40.1%
Restructuring costs 8,896 - 8,896 n/m
Amortization of intangible assets 41,599 25,554 16,045 62.8%
Depreciation and amortization 17,413 11,957 5,456 45.6%
Total operating expenses 456,778$ 291,956$ 164,822 56.5%
In thousands $ Change % Change
Total non-recurring stock based comp 12,366$ 26,652$ (14,287) (53.6%)
Compensation excluding non-recurring comp 244,629 153,818 90,811 59.0%
Transaction expenses 21,206 - 21,206 n/m
Non-compensation excluding transaction expenses 110,669 73,975 36,693 49.6%
Restructuring charges 8,896 - 8,896 n/m
Amortization of intangible assets 41,599 25,554 16,045 62.8%
Depreciation and amortization 17,413 11,957 5,456 45.6%
Total operating expenses 456,778$ 291,956$ 164,822 56.5%
November 30,
Fiscal Year Ended
www.msci.com
15 of 22
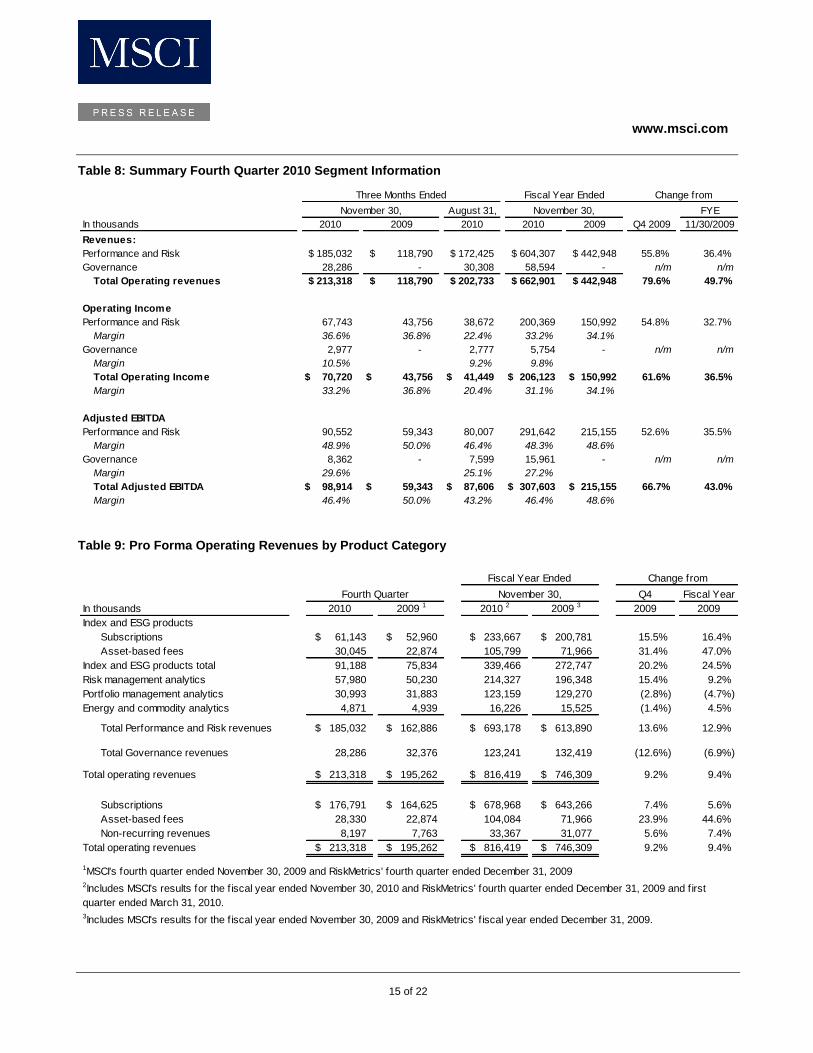
Table 8: Summary Fourth Quarter 2010 Segment Information
Table 9: Pro Forma Operating Revenues by Product Category
August 31, FYE
In thousands 2010 2009 2010 2010 2009 Q4 2009 11/30/2009
Revenues:
Performance and Risk 185,032$ 118,790$ 172,425$ 604,307$ 442,948$ 55.8% 36.4%
Governance 28,286 - 30,308 58,594 - n/m n/m
Total Operating revenues 213,318$ 118,790$ 202,733$ 662,901$ 442,948$ 79.6% 49.7%
Operating Income
Performance and Risk 67,743 43,756 38,672 200,369 150,992 54.8% 32.7%
Margin 36.6% 36.8% 22.4% 33.2% 34.1%
Governance 2,977 - 2,777 5,754 - n/m n/m
Margin 10.5% 9.2% 9.8%
Total Operating Income 70,720$ 43,756$ 41,449$ 206,123$ 150,992$ 61.6% 36.5%
Margin 33.2% 36.8% 20.4% 31.1% 34.1%
Adjusted EBITDA
Performance and Risk 90,552 59,343 80,007 291,642 215,155 52.6% 35.5%
Margin 48.9% 50.0% 46.4% 48.3% 48.6%
Governance 8,362 - 7,599 15,961 - n/m n/m
Margin 29.6% 25.1% 27.2%
Total Adjusted EBITDA 98,914$ 59,343$ 87,606$ 307,603$ 215,155$ 66.7% 43.0%
Margin 46.4% 50.0% 43.2% 46.4% 48.6%
November 30, November 30,
Fiscal Year Ended Change fromThree Months Ended
Q4 Fiscal Year
In thousands 2010 2009 1 2010 2 2009 3 2009 2009
Index and ESG products
Subscriptions 61,143$ 52,960$ 233,667$ 200,781$ 15.5% 16.4%
Asset-based fees 30,045 22,874 105,799 71,966 31.4% 47.0%
Index and ESG products total 91,188 75,834 339,466 272,747 20.2% 24.5%
Risk management analytics 57,980 50,230 214,327 196,348 15.4% 9.2%
Portfolio management analytics 30,993 31,883 123,159 129,270 (2.8%) (4.7%)
Energy and commodity analytics 4,871 4,939 16,226 15,525 (1.4%) 4.5%
Total Performance and Risk revenues 185,032$ 162,886$ 693,178$ 613,890$ 13.6% 12.9%
Total Governance revenues 28,286 32,376 123,241 132,419 (12.6%) (6.9%)
Total operating revenues 213,318$ 195,262$ 816,419$ 746,309$ 9.2% 9.4%
Subscriptions 176,791$ 164,625$ 678,968$ 643,266$ 7.4% 5.6%
Asset-based fees 28,330 22,874 104,084 71,966 23.9% 44.6%
Non-recurring revenues 8,197 7,763 33,367 31,077 5.6% 7.4%
Total operating revenues 213,318$ 195,262$ 816,419$ 746,309$ 9.2% 9.4%
Change from
2Includes MSCI's results for the f iscal year ended November 30, 2010 and RiskMetrics' fourth quarter ended December 31, 2009 and first
quarter ended March 31, 2010.
Fourth Quarter
Fiscal Year Ended
November 30,
1MSCI's fourth quarter ended November 30, 2009 and RiskMetrics' fourth quarter ended December 31, 2009
3Includes MSCI's results for the f iscal year ended November 30, 2009 and RiskMetrics' f iscal year ended December 31, 2009.

www.msci.com
16 of 22
Table 10: Pro Forma Operating Expense Detail
Q4 Fiscal Year
In thousands 2010 2009 1 2010 2 2009 3 2009 2009
Cost of services
Compensation 48,849$ 47,277$ 197,417$ 184,523$ 3.3% 7.0%
Non-Recurring Stock Based Comp 1,617 2,103 4,639 9,355 (23.1%) (50.4%)
Total Compensation 50,466$ 49,380$ 202,056$ 193,878$ 2.2% 4.2%
Non-compensation 18,665 19,181 70,883 65,077 (2.7%) 8.9%
Total cost of services 69,131$ 68,561$ 272,939$ 258,955$ 0.8% 5.4%
Selling, general and administrative
Compensation 29,508 27,675 121,722 113,805 6.6% 7.0%
Non-Recurring Stock Based Comp 2,410 4,151 7,727 17,297 (41.9%) (55.3%)
Total Compensation 31,918$ 31,826$ 129,449$ 131,102$ 0.3% (1.3%)
Transaction expenses - - - - - -
Non-compensation excl. transaction expenses 17,382 16,535 69,841 70,323 5.1% (0.7%)
Total selling, general and administrative 49,300$ 48,361$ 199,290$ 201,425$ 1.9% (1.1%)
Restructuring costs 1,943 - 8,896 - n/m n/m
Amortization of intangible assets 16,230 18,171 64,477 73,164 (10.7%) (11.9%)
Depreciation and amortization 5,530 5,161 21,660 20,306 7.2% 6.7%
Total operating expenses 142,134$ 140,254$ 567,262$ 553,850$ 1.3% 2.4%
In thousands
Total non-recurring stock based comp 4,027$ 6,254$ 12,366$ 26,652$ (35.6%) (53.6%)
Compensation excluding non-recurring comp 78,357 74,952 319,139 298,328 4.5% 7.0%
Transaction expenses - - - - - -
Non-compensation excluding transaction expenses 36,047 35,716 140,724 135,400 0.9% 3.9%
Restructuring charges 1,943 - 8,896 - n/m n/m
Amortization of intangible assets 16,230 18,171 64,477 73,164 (10.7%) (11.9%)
Depreciation and amortization 5,530 5,161 21,660 20,306 7.2% 6.7%
Total operating expenses 142,134$ 140,254$ 567,262$ 553,850$ 1.3% 2.4%
3Includes MSCI's results for the f iscal year ended November 30, 2009 and RiskMetrics' f iscal year ended December 31, 2009.
November 30,Fourth Quarter
Fiscal Year Ended Change from
2Includes MSCI's results for the f iscal year ended November 30, 2010 and RiskMetrics' fourth quarter ended December 31, 2009 and first
quarter ended March 31, 2010.
1MSCI's fourth quarter ended November 30, 2009 and RiskMetrics' fourth quarter ended December 31, 2009

www.msci.com
17 of 22
Table 11: Pro Forma Summary Segment
Q4 Fiscal Year
In thousands 2010 2009 1 2010 2 2009 3 2009 2009
Revenues:
Performance and Risk 185,032$ 162,886$ 693,178$ 613,890$ 13.6% 12.9%
Governance 28,286 32,376 123,241 132,419 (12.6%) (6.9%)
Total Operating revenues 213,318$ 195,262$ 816,419$ 746,309$ 9.2% 9.4%
Operating Income
Performance and Risk 68,177 50,781 235,883 176,421 34.3% 33.7%
Margin 36.8% 31.2% 34.0% 28.7%
Governance 3,007 4,227 13,274 16,038 (28.9%) (17.2%)
Margin 10.6% 2.2% 10.8% 2.1%
Total Operating Income 71,184$ 55,008$ 249,157$ 192,459$ 29.4% 29.5%
Margin 33.4% 28.2% 30.5% 25.8%
Adjusted EBITDA
Performance and Risk 90,552 76,004 324,283 279,230 19.1% 16.1%
Margin 48.9% 46.7% 46.8% 45.5%
Governance 8,362 8,590 32,273 33,351 (2.7%) (3.2%)
Margin 29.6% 26.5% 26.2% 25.2%
Total Adjusted EBITDA 98,914$ 84,594$ 356,556$ 312,581$ 16.9% 14.1%
Margin 46.4% 43.3% 43.7% 41.9%
Fourth Quarter1 November 30,
3Includes MSCI's results for the f iscal year ended November 30, 2009 and RiskMetrics' f iscal year ended December 31, 2009.
1MSCI's fourth quarter ended November 30, 2009 and RiskMetrics' fourth quarter ended December 31, 2009
2Includes MSCI's results for the f iscal year ended November 30, 2010 and RiskMetrics' fourth quarter ended December 31, 2009 and first
quarter ended March 31, 2010.
Fiscal Year Ended Change from

www.msci.com
18 of 22
Table 12: Key Operating Metrics1
August November August
Dollars in thousands 2010 2009 2010 2009 2010
Run Rates 2
Index and ESG products
Subscriptions 235,370$ 202,785$ 224,496$ 16.1% 4.8%
Asset-based fees 114,233 95,201 100,577 20.0% 13.6%
Index and ESG products total 349,603 297,986 325,073 17.3% 7.5%
Risk management analytics 235,422 197,997 224,581 18.9% 4.8%
Portfolio management analytics 117,256 122,192 121,795 (4.0%) (3.7%)
Energy and commodity analytics 15,330 15,365 15,254 (0.2%) 0.5%
Total Performance and Risk Run Rate 717,611$ 633,540$ 686,703$ 13.3% 4.5%
Governance Run Rate 105,534 111,841 105,735 (5.6%) (0.2%)
Total Run Rate 823,145$ 745,381$ 792,438$ 10.4% 3.9%
Subscription total 708,912 650,180 691,861 9.0% 2.5%
Asset-based fees total 114,233 95,201 100,577 20.0% 13.6%
Total Run Rate 823,145$ 745,381$ 792,438$ 10.4% 3.9%
Subscription Run Rate by region
% Americas 53% 51% 53%
% non-Americas 47% 49% 47%
Subscription Run Rate by client type
% Asset Management 56% 57% 57%
% Banking & Trading 16% 16% 15%
% Alternative Invt Mgmt 11% 10% 12%
% Asset Ow ners & Consultants 9% 9% 9%
% Corporate 2% 2% 2%
% Others 5% 5% 5%
New Recurring Sales 37,284$ 27,757$ 34,556$ 34.3% 7.9%
Subscription Cancellations (25,525) (28,640) (19,113) (10.9%) 33.5%
Net New Recurring Subscription Sales 11,759$ (883)$ 15,443$ n/m (23.9%)
Non-recurring sales 11,147 8,500 6,575 31.1% 69.5%
Employees 2,077 2,043 2,063 1.7% 0.7%
% Employees by location
High Cost Centers 70% 77% 72%
Low Cost Centers 30% 23% 28%
As of or For the Quarter Ended Change from
November
1 MSCI Inc. in August and November 2010 quarters and for combined legacy MSCI and RiskMetrics results in prior periods. Includes addition
of $13.2 million in risk management analytics run rate as a result of Measurisk LLC acquisition, which was completed on July 31, 2010.2 The run rate at a particular point in time represents the forward- looking fees for the next 12 months from all subscriptions and investment
product licenses we currently provide to our c lients under renewable contracts assuming all contracts that come up for renewal are
renewed and assuming then- current exchange rates. For any subscription or license whose fees are linked to an investment product’s
assets or trading volume, the run rate calculation reflects an annualization of the most recent periodic fee earned under such license or
subscription. The run rate does not include fees associated with “ one- time” and other non- recurring transactions. In addition, we remove
from the run rate the fees associated with any subscription or investment product license agreement with respect to which we have
received a notice of termination or non- renewal during the period and we have determined that such notice evidences the client's final
decision to terminate or not renew the applicable subscription or agreement, even though the notice is not effective until a later date.

www.msci.com
19 of 22
Table 13: Supplemental Operating Metrics
February May August November February May August November FY 2009 FY 2010
New Recurring Subscription Sales $24,711 $21,254 $23,469 $27,757 $30,273 $34,280 $34,556 $37,284 $97,191 $136,393
Subscription Cancellations (22,692) (23,712) (28,690) (28,640) (22,434) (17,495) (19,113) (25,525) (103,734) (84,567)
Net New Recurring Subscription Sales $2,019 ($2,457) ($5,221) ($883) $7,839 $16,785 $15,443 $11,759 ($6,543) $51,826
February May August November February May August November FY 2009 FY 2010
Aggregate Retention Rate 1
Index and ESG products 93.8% 92.8% 90.5% 88.5% 93.8% 92.4% 90.9% 92.1% 91.4% 92.3%
Risk management analytics 85.5% 79.5% 80.4% 80.2% 81.5% 91.3% 89.7% 85.4% 81.4% 87.4%
Portfolio management analytics 86.5% 82.2% 69.1% 77.7% 92.3% 84.6% 83.7% 69.1% 78.9% 82.4%
Energy & commodity analytics 90.5% 91.3% 84.5% 88.5% 85.5% 80.5% 90.5% 83.4% 88.7% 85.0%
Total Performance and Risk 88.8% 85.0% 81.0% 82.5% 88.7% 89.9% 88.8% 84.2% 84.3% 88.0%
Total Governance 73.0% 84.6% 85.4% 78.7% 74.2% 86.0% 86.4% 86.3% 80.4% 83.3%
Total Aggregate Retention Rate 85.6% 85.1% 81.9% 82.0% 86.2% 89.2% 88.4% 84.6% 83.7% 87.2%
Core Retention Rate 2
Index and ESG products 94.0% 93.1% 91.2% 89.1% 94.5% 92.9% 91.2% 92.4% 91.9% 92.7%
Risk management analytics 85.5% 81.4% 81.0% 81.2% 82.9% 92.3% 92.0% 85.4% 82.3% 88.5%
Portfolio management analytics 87.8% 83.7% 70.5% 78.4% 94.3% 86.3% 86.8% 71.2% 80.1% 84.7%
Energy & commodity analytics 90.6% 91.3% 84.5% 89.9% 85.5% 80.5% 90.5% 83.4% 89.1% 85.0%
Total Performance and Risk 89.2% 86.3% 81.8% 83.4% 89.9% 90.8% 90.5% 84.8% 85.2% 88.9%
Total Governance 73.0% 84.6% 85.4% 78.7% 74.2% 86.0% 86.4% 86.3% 80.4% 83.3%
Total Core Retention Rate 85.9% 86.1% 82.6% 82.6% 87.2% 90.0% 89.8% 85.0% 84.3% 88.1%
1The quarterly Aggregate Retention Rates are calculated by annualizing the cancellations for which we have received a notice of termination or non- renewal during the
quarter and we have determined that such notice evidences the client’s final decision to terminate or not renew the applicable subscription or agreement, even though
such notice is not effective until a later date. This annualized cancellation figure is then divided by the subscription Run Rate at the beginning of the year to calculate a
cancellation rate. This cancellation rate is then subtracted from 100% to derive the annualized Retention Rate for the quarter. The Aggregate Retention Rate is
computed on a product- by- product basis. Therefore, if a c lient reduces the number of products to which it subscribes or switches between our products, we treat it as a
cancellation. In addition, we treat any reduction in fees resulting from renegotiated contracts as a cancellation in the calculation to the extent of the reduction.
Aggregate Retention Rates are generally higher during the first three fiscal quarters and lower in the fourth fiscal quarter. For the calculation of the Core Retention Rate
the same methodology is used except the amount of cancellations in the quarter is reduced by the amount of product swaps.2Our Core Retention Rate is calculated similarly to our Aggregate Retention Rate except that the Core Retention Rate does not treat switches between our products as a
cancellation.
Aggregate & Core Retention Rates
2009 2010
Recurring Subscription Sales & Subscription Cancellations
2009 2010
www.msci.com
20 of 22
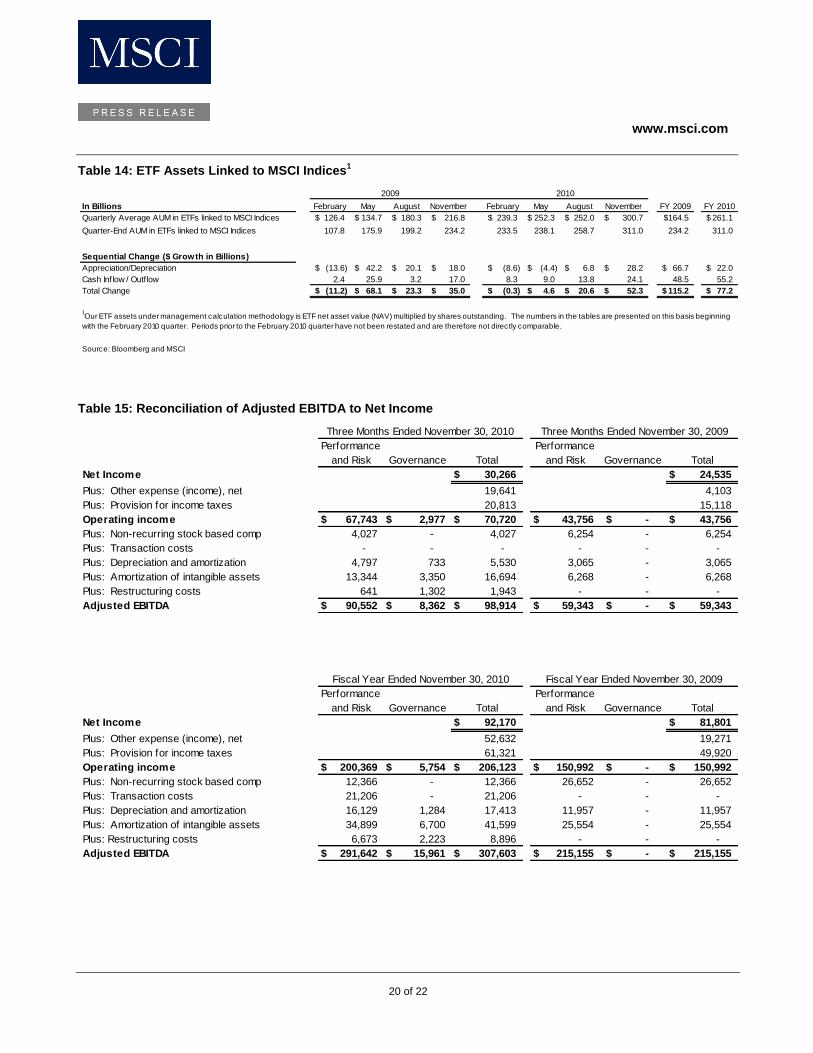
Table 14: ETF Assets Linked to MSCI Indices1
Table 15: Reconciliation of Adjusted EBITDA to Net Income
In Billions February May August November February May August November FY 2009 FY 2010
Quarterly Average AUM in ETFs linked to MSCI Indices 126.4$ 134.7$ 180.3$ 216.8$ 239.3$ 252.3$ 252.0$ 300.7$ 164.5$ 261.1$
Quarter-End AUM in ETFs linked to MSCI Indices 107.8 175.9 199.2 234.2 233.5 238.1 258.7 311.0 234.2 311.0
Sequential Change ($ Growth in Billions)
Appreciation/Depreciation (13.6)$ 42.2$ 20.1$ 18.0$ (8.6)$ (4.4)$ 6.8$ 28.2$ 66.7$ 22.0$
Cash Inflow / Outflow 2.4 25.9 3.2 17.0 8.3 9.0 13.8 24.1 48.5 55.2
Total Change (11.2)$ 68.1$ 23.3$ 35.0$ (0.3)$ 4.6$ 20.6$ 52.3$ 115.2$ 77.2$
Source: Bloomberg and MSCI
2010
1Our ETF assets under management calculation methodology is ETF net asset value (NAV) multiplied by shares outstanding. The numbers in the tables are presented on this basis beginning
with the February 2010 quarter. Periods prior to the February 2010 quarter have not been restated and are therefore not directly comparable.
2009
Performance
and Risk Governance Total
Performance
and Risk Governance Total
Net Income 30,266$ 24,535$
Plus: Other expense (income), net 19,641 4,103
Plus: Provision for income taxes 20,813 15,118
Operating income 67,743$ 2,977$ 70,720$ 43,756$ -$ 43,756$
Plus: Non-recurring stock based comp 4,027 - 4,027 6,254 - 6,254
Plus: Transaction costs - - - - - -
Plus: Depreciation and amortization 4,797 733 5,530 3,065 - 3,065
Plus: Amortization of intangible assets 13,344 3,350 16,694 6,268 - 6,268
Plus: Restructuring costs 641 1,302 1,943 - - -
Adjusted EBITDA 90,552$ 8,362$ 98,914$ 59,343$ -$ 59,343$
Performance
and Risk Governance Total
Performance
and Risk Governance Total
Net Income 92,170$ 81,801$
Plus: Other expense (income), net 52,632 19,271
Plus: Provision for income taxes 61,321 49,920
Operating income 200,369$ 5,754$ 206,123$ 150,992$ -$ 150,992$
Plus: Non-recurring stock based comp 12,366 - 12,366 26,652 - 26,652
Plus: Transaction costs 21,206 - 21,206 - - -
Plus: Depreciation and amortization 16,129 1,284 17,413 11,957 - 11,957
Plus: Amortization of intangible assets 34,899 6,700 41,599 25,554 - 25,554
Plus: Restructuring costs 6,673 2,223 8,896 - - -
Adjusted EBITDA 291,642$ 15,961$ 307,603$ 215,155$ -$ 215,155$
Fiscal Year Ended November 30, 2010 Fiscal Year Ended November 30, 2009
Three Months Ended November 30, 2010 Three Months Ended November 30, 2009

www.msci.com
21 of 22
Table 16: Reconciliation of Pro Forma Adjusted EBITDA to Pro Forma Net Income
Performance
and Risk Governance Total
Performance
and Risk Governance Total
Net Income 30,557$ 23,703$
Plus: Other expense (income), net 19,340 17,553
Plus: Provision for income taxes 21,287 13,752
Operating income 68,177$ 3,007$ 71,184$ 50,781$ 4,227$ 55,008$
Plus: Non-recurring stock based comp 4,027 - 4,027 6,254 - 6,254
Plus: Transaction costs - - - - - -
Plus: Depreciation and amortization 4,797 733 5,530 4,148 1,013 5,161
Plus: Amortization of intangible assets 12,910 3,320 16,230 14,821 3,350 18,171
Plus: Restructuring costs 641 1,302 1,943 - - -
Adjusted EBITDA 90,552$ 8,362$ 98,914$ 76,004$ 8,590$ 84,594$
Performance
and Risk Governance Total
Performance
and Risk Governance Total
Net Income 110,831$ 79,852$
Plus: Other expense (income), net 71,430 67,744
Plus: Provision for income taxes 66,896 44,863
Operating income 235,883$ 13,274$ 249,157$ 176,421$ 16,038$ 192,459$
Plus: Non-recurring stock based comp 12,366 - 12,366 26,652 - 26,652
Plus: Transaction costs - - - - - -
Plus: Depreciation and amortization 18,224 3,436 21,660 16,393 3,913 20,306
Plus: Amortization of intangible assets 51,137 13,340 64,477 59,764 13,400 73,164
Plus: Restructuring costs 6,673 2,223 8,896 - - -
Adjusted EBITDA 324,283$ 32,273$ 356,556$ 279,230$ 33,351$ 312,581$
Fiscal Year Ended November 30, 2010 Fiscal Year Ended November 30, 2009
Three Months Ended November 30, 2010 Three Months Ended November 30, 2009

www.msci.com
22 of 22
Table 17: Reconciliation of Adjusted Net Income and Adjusted EPS to Net Income and EPS
August 31,
2010 2009 2010 2010 2009
GAAP - Net income 30,266$ 24,535$ 10,319$ 92,170$ 81,801$
Plus: Non-recurring stock based comp 4,027 6,254 4,227 12,366 26,652
Plus: Amortization of intangible assets 16,694 6,268 16,350 41,599 25,554
Plus: Transaction costs1 - - 14,526 22,040 -
Plus: Debt repayment expenses - - 1,994 8,274 -
Plus: Restructuring costs 1,943$ - 6,953 8,896$ -
Less: Income tax effect2 (8,610) (4,771) (13,880) (31,015) (19,786)
Adjusted net income 44,320$ 32,286$ 40,489$ 154,330$ 114,221$
GAAP - EPS 0.25$ 0.24$ 0.08$ 0.81$ 0.80$
Plus: Non-recurring stock based comp 0.03 0.06 0.03 0.11 0.26
Plus: Amortization of intangible assets 0.14 0.06 0.13 0.36 0.25
Plus: Transaction costs1 0.00 0.00 0.12 0.19 0.00
Plus: Debt repayment expenses 0.00 0.00 0.02 0.07 0.00
Plus: Restructuring costs 0.02 0.00 0.06 0.08 0.00
Less: Income tax effect2 (0.08) (0.05) (0.11) (0.27) (0.19)
Adjusted EPS 0.36$ 0.31$ 0.33$ 1.35$ 1.12$
1For the third quarter of 2010, includes $13.7 million in third party transaction expense included in SG&A expense and $0.8 million of expense included in interest expense. For the fiscal
year 2010, includes $21.2 million in third party transaction expense included in SG&A expense and $0.8 million of expense included in interest expense2For the purposes of calculating Adjusted EPS, non-recurring stock based compensation, amortization of intangible assets, debt repayment expenses, and restructuring costs are
assumed to be taxed at the effective tax rate excluding transaction costs. For the fourth quarter and fiscal year 2010, the rates are 39.9% and 37.4%, respectively. For the fourth quarter
and fiscal year 2009, the rates are 38.1% and 37.9%, respectively.
Three Months Ended
November 30,
Fiscal Year Ended
November 30,