ms amlin ag - bermuda monetary authority full filings class 4/ms amlin ag...provision of insurance...
TRANSCRIPT

MS Amlin AG2016 Annual Report


MS Amlin AG 2016 Annual Report 1
2 Directors, officers and advisors
3 Directors’ report
4 Statement of directors’ responsibilities
5 Report of the auditor to the Board of Directors of MS Amlin AG
6 Statement of profit or loss
7 Statement of other comprehensive income
8 Statement of changes in equity
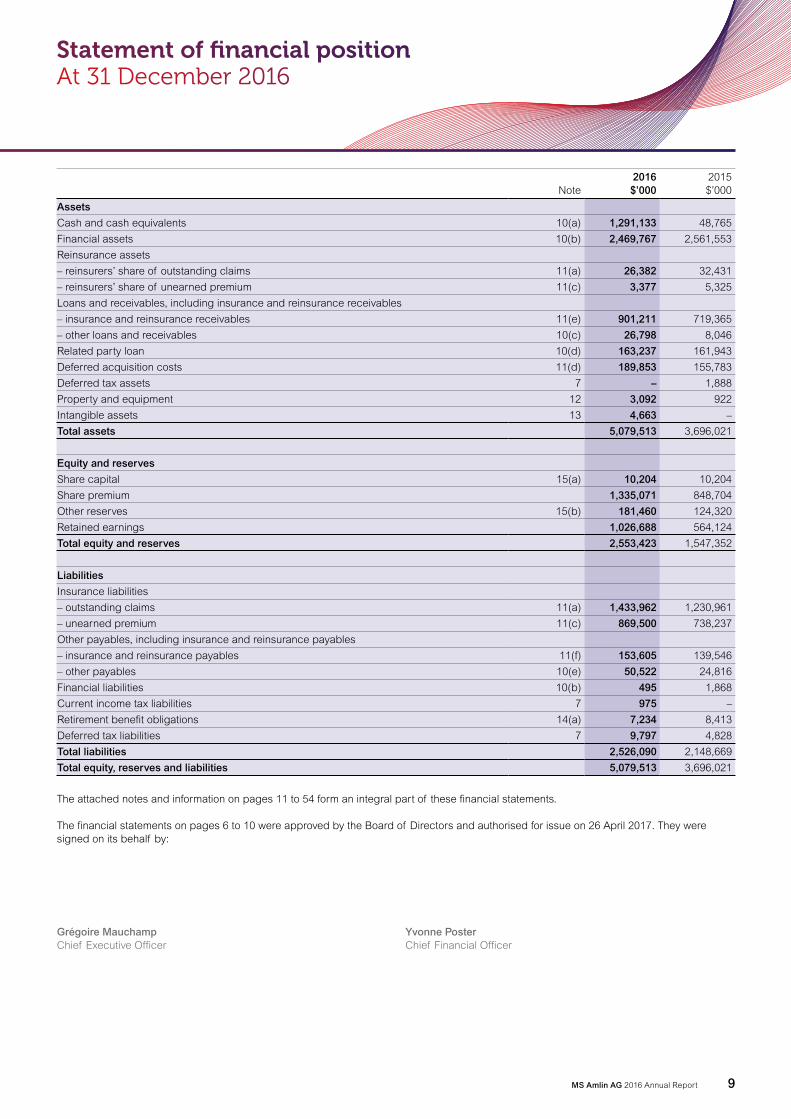
9 Statement of financial position
10 Statement of cash flows
11–54 Notes to the financial statements
Contents

MS Amlin AG 2016 Annual Report2
Directors, officers and advisors
Directors
Supervisory BoardR AdamM Albers (Chairman)M BurkeR HextallS Materne
Executive BoardC BieriP da Camino Soligo (Chief Risk Officer)G Mauchamp (Chief Executive Officer and Chairman)Y Poster (Chief Financial Officer)R Wyatt
SecretaryN Hornsey (appointed 19 September 2016)J Mansell (resigned 23 June 2016)
Registered officeKirchenweg 58008 ZurichSwitzerland
AuditorsPricewaterhouseCoopers AG (to 8 June 2016)Birchstrasse 160CH-8050 Zurich Switzerland
KPMG AG (from 8 June 2016)Badenerstrasse 170 CH-8004 ZurichSwitzerland

MS Amlin AG 2016 Annual Report 3
Directors’ report For the year ended 31 December 2016
The Directors present the annual report and the audited financial statements for the year ended 31 December 2016 of MS Amlin AG (the Company). The Company is a wholly owned subsidiary of MS Amlin plc (the Parent) whose parent is Mitsui Sumitomo Insurance Company, Limited (MSI), a wholly owned subsidiary of MS&AD Insurance Group Holdings, Inc.
On 31 December 2016 as part of a reorganisation within the Parent, MS Amlin plc sold 100% of its interest in the issued share capital and voting rights of MS Frontier Reinsurance Limited (MSFR) to the Company, in exchange for one share in the Company immediately before a legal merger was effected between MSFR and the Company. The merged entity will continue to operate under the legal name MS Amlin AG.
The Company is incorporated in Switzerland and operates in Zurich with branches in Bermuda and Labuan, and a wholly owned subsidiary in Singapore, MS Frontier Modeling Research Pte Ltd (MSFMR).
The Company is supervised by the Swiss Financial Market Supervisory Authority (FINMA), while its branches are under the supervision of the Bermuda Monetary Authority (BMA), and the Labuan Financial Services Authority (LFSA) respectively.
Business review and principal activities Through the Bermuda branch, the Company carries out reinsurance business principally on a geographically spread catastrophe and property account. In addition, Syndicate 2001 (the Syndicate), a Lloyd’s Syndicate managed within the MS Amlin group, has placed a number of reinsurance contracts with the Company. The reinsurance contracts are:
• a number of proportional treaty and excess of loss contracts covering cessions of various classes of business; and
• a whole account quota share which covers a specific cession from all classes of business written by the Syndicate, including marine, non marine, aviation and UK commercial on a global basis.
The operation in Zurich was set up to write European non-life reinsurance and mainly targets small and mid-sized insurance companies. It offers comprehensive reinsurance solutions over all non-life classes and products.
The operation in Labuan carries out reinsurance business principally made up of excess of loss and proportional business geographically located in East and South East Asia.
The subsidiary in Singapore carried out activities relating to the provision of insurance research services and risk management services.
Results and dividendsThe profit for the Company for the year ended 31 December 2016 amounted to $46.1 million, full details of which are set out in the statement of profit or loss on page 6 and the related notes.
On 25 April 2016 the Directors recommended for approval by the shareholders at the Annual General Meeting held on the same date the payment of a $173.9 million dividend. The dividend payment was approved by the shareholders and was paid in two shared payments of $172.4 million on 28 April 2016 and $1.5 million on 29 April 2016.
DirectorsThe Directors who served during 2016 were:
Supervisory BoardR AdamM AlbersM BurkeR HextallS Materne
Executive BoardC BieriP da Camino SoligoG MauchampY PosterR Wyatt
At the Annual General Meeting on 26 April 2017, all members of the Supervisory Board will be standing for re-election each for a term of one year.
The 2-Tier Board system came into effect on 9 November 2016.
AuditorsThe auditors for the year ended 31 December 2016 were PricewaterhouseCoopers AG (to 8 June 2016) and KPMG AG (from 8 June 2016).
By Order of the Board of Directors
N HornseySecretary

MS Amlin AG 2016 Annual Report4
The Directors are responsible for preparing the financial statements in accordance with applicable law and regulations in Switzerland. In addition to the preparation of financial statements in accordance with Swiss Company Law, the Directors have elected to prepare these financial statements in accordance with International Financial Reporting Standards (IFRS) for each financial year.
International Accounting Standard 1 ‘Presentation of Financial Statements’ requires that financial statements present fairly for each financial year the Company’s financial position, financial performance and cash flows. This requires the faithful representation of the effects of transactions, other events and conditions in accordance with the definitions and recognition criteria for assets, liabilities, income and expenses set out in the International Accounting Standards Board’s ‘Framework for the preparation and presentation of financial statements’. In virtually all circumstances, a fair presentation will be achieved by compliance with all applicable IFRS. However, Directors are also required to:
• properly select and apply accounting policies; and
• state whether applicable IFRS, as adopted, have been followed, subject to any material departures disclosed and explained in the financial statements.
The Directors are responsible for keeping proper accounting records that disclose with reasonable accuracy at any time the financial position of the Company and enable them to ensure that the financial statements comply with the applicable laws. They are also responsible for safeguarding assets of the Company and hence for taking reasonable steps for the prevention and detection of fraud and other irregularities.
Statement of Directors’ responsibilities

MS Amlin AG 2016 Annual Report 5
On your instructions, we have audited the financial statements of MS Amlin AG, which comprise the statement of profit or loss, statement of other comprehensive income, statement of changes in equity, statement of financial position, statement of cash flows, and notes to the financial statements (pages 6 to 54), for the year ended 31 December 2016.
Board of Directors’ ResponsibilityThe Board of Directors is responsible for the preparation and fair presentation of the financial statements in accordance with the International Financial Reporting Standards (IFRS). This responsibility includes designing, implementing and maintaining an internal control system relevant to the preparation and fair presentation of financial statements that are free from material misstatement, whether due to fraud or error. The Board of Directors is further responsible for selecting and applying appropriate accounting policies and making accounting estimates that are reasonable in the circumstances.
Auditor’s ResponsibilityOur responsibility is to express an opinion on these financial statements based on our audit. We conducted our audit in accordance with Swiss Auditing Standards as well as the International Standards on Auditing. Those standards require that we plan and perform the audit to obtain reasonable assurance whether the financial statements are free from material misstatement.
An audit involves performing procedures to obtain audit evidence about the amounts and disclosures in the financial statements. The procedures selected depend on the auditor’s judgment, including the assessment of the risks of material misstatement of the financial statements, whether due to fraud or error. In making those risk assessments, the auditor considers the internal control system relevant to the entity’s preparation of the financial statements in order to design audit procedures that are appropriate in the circumstances, but not for the purpose of expressing an opinion on the effectiveness of the entity’s internal control system.
An audit also includes evaluating the appropriateness of the accounting policies used and the reasonableness of accounting estimates made, as well as evaluating the overall presentation of the financial statements. We believe that the audit evidence we have obtained is sufficient and appropriate to provide a basis for our audit opinion.
OpinionIn our opinion, the financial statements for the year ended 31 December 2016 give a true and fair view of the financial position, the results of operations and the cash flows in accordance with the International Financial Reporting Standards (IFRS).
KPMG AG
Bill Schiller Sabrina KesslerLicensed Audit expert Licensed Audit expertAuditor in charge
Zürich, 26 April 2017
Report of the auditor To the Board of Directors of MS Amlin AG

MS Amlin AG 2016 Annual Report6
Statement of profit or lossFor the year ended 31 December 2016
Notes2016$’000
2015$’000
Gross earned premium 4(a) 1,276,525 1,220,263
Reinsurance premium ceded 4(a) (86,530) (102,937)
Net earned premium 4(a) 1,189,995 1,117,326
Net investment return 5 25,410 29,980
Total income 1,215,405 1,147,306
Insurance claims and claims settlement expenses 4(b) (816,107) (645,901)
Insurance claims and claims settlement expenses recoverable from reinsurers 4(b) 133 14,017
Net insurance claims 4(b) (815,974) (631,884)
Expenses for the acquisition of insurance contracts 6(a) (234,663) (221,245)
Other operating expenses 6(b) (107,968) (75,701)
Total expenses (342,631) (296,946)
Results of operating activities 56,800 218,476
Finance costs 6(e) (2,067) (1,670)
Profit before tax 6(f) 54,733 216,806
Tax 7 (8,632) (2,517)
Profit for the year 46,101 214,289
The attached notes and information on pages 11 to 54 form an integral part of these financial statements.
All activities relate to continuing operations.

MS Amlin AG 2016 Annual Report 7
Statement of other comprehensive income For the year ended 31 December 2016
Notes2016$’000
2015$’000
Profit for the year 46,101 214,289
Items that will not be reclassified to profit or loss
Defined benefit pension fund gains/(losses) 14(a) 1,683 (2,269)
(Income)/Deferred tax relating to items that will not be reclassified 7 (356) 480
1,327 (1,789)
Items that may be reclassified subsequently to profit or loss
Foreign exchange losses on translation of the Zurich operation (3,298) (8,030)
Other comprehensive expense for the year, net of tax (1,971) (9,819)
Total comprehensive income for the year 44,130 204,470
The attached notes and information on pages 11 to 54 form an integral part of these financial statements.
All activities relate to continuing operations.

MS Amlin AG 2016 Annual Report8
Statement of changes in equityFor the year ended 31 December 2016
For the year ended 31 December 2016 Note
Share capital$’000
Share premium
$’000
Other reserves
$’000
Retained earnings
$’000
Total equity and reserves
$’000
At 1 January 2016 10,204 848,704 124,320 564,124 1,547,352
Profit for the year – – – 46,101 46,101
Other comprehensive expenses for the year – – (1,971) – (1,971)
Total comprehensive (expense)/income for the year – – (1,971) 46,101 44,130
Employee share option scheme:
– share based payment reserve 6(d)/14(b) – – 888 – 888
Dividend paid 9 – – – (173,894) (173,894)
Business acquisitions under common control 3 – 486,367 58,223 590,357 1,134,947
Transactions with the owner of the Company for the year – 486,367 59,111 416,463 961,941
At 31 December 2016 10,204 1,335,071 181,460 1,026,688 2,553,423
For the year ended 31 December 2015 Note
Share capital$’000
Share premium
$’000
Other reserves
$’000
Retained earnings
$’000
Total equity and reserves
$’000
At 1 January 2015 10,204 848,704 133,203 575,607 1,567,718
Profit for the year – – – 214,289 214,289
Other comprehensive expenses for the year – – (9,819) – (9,819)
Total comprehensive (expense)/income for the year – – (9,819) 214,289 204,470
Employee share option scheme:
– share based payment reserve 6(d)/14(b) – – 936 – 936
Dividend paid 9 – – – (225,772) (225,772)
Transactions with the owner of the Company for the year – – 936 (225,772) (224,836)
At 31 December 2015 10,204 848,704 124,320 564,124 1,547,352
A detailed breakdown of other reserves is provided in note 15(b).
The attached notes and information on pages 11 to 54 form an integral part of these financial statements.
MS Amlin AG 2016 Annual Report 9
Statement of financial position At 31 December 2016
Note2016$’000
2015$’000
Assets
Cash and cash equivalents 10(a) 1,291,133 48,765
Financial assets 10(b) 2,469,767 2,561,553
Reinsurance assets
– reinsurers’ share of outstanding claims 11(a) 26,382 32,431
– reinsurers’ share of unearned premium 11(c) 3,377 5,325
Loans and receivables, including insurance and reinsurance receivables
– insurance and reinsurance receivables 11(e) 901,211 719,365
– other loans and receivables 10(c) 26,798 8,046
Related party loan 10(d) 163,237 161,943
Deferred acquisition costs 11(d) 189,853 155,783
Deferred tax assets 7 – 1,888
Property and equipment 12 3,092 922
Intangible assets 13 4,663 –
Total assets 5,079,513 3,696,021
Equity and reserves
Share capital 15(a) 10,204 10,204
Share premium 1,335,071 848,704
Other reserves 15(b) 181,460 124,320
Retained earnings 1,026,688 564,124
Total equity and reserves 2,553,423 1,547,352
Liabilities
Insurance liabilities
– outstanding claims 11(a) 1,433,962 1,230,961
– unearned premium 11(c) 869,500 738,237
Other payables, including insurance and reinsurance payables
– insurance and reinsurance payables 11(f) 153,605 139,546
– other payables 10(e) 50,522 24,816
Financial liabilities 10(b) 495 1,868
Current income tax liabilities 7 975 –
Retirement benefit obligations 14(a) 7,234 8,413
Deferred tax liabilities 7 9,797 4,828
Total liabilities 2,526,090 2,148,669
Total equity, reserves and liabilities 5,079,513 3,696,021
The attached notes and information on pages 11 to 54 form an integral part of these financial statements.
The financial statements on pages 6 to 10 were approved by the Board of Directors and authorised for issue on 26 April 2017. They were signed on its behalf by:
Grégoire Mauchamp Yvonne PosterChief Executive Officer Chief Financial Officer

MS Amlin AG 2016 Annual Report10
Statement of cash flowsFor the year ended 31 December 2016
Note2016$’000
2015$’000
Profit before tax 54,733 216,806
Adjustments:
Depreciation charge 12/6(f) 871 990
Finance costs 6(e) 2,067 1,670
Interest income 5 (8,724) (8,471)
Dividend income 5 (18,394) (18,461)
Losses/(Gains) on investments realised and unrealised 5 1,708 (3,048)
Other non-cash movements (2,762) (9,820)
Movement in operating assets and liabilities:
Net sales/(purchases) of financial investments 10(b) 14,780 (91,712)
Foreign exchange losses on investments 10(b) 75,310 63,491
(Increase)/decrease in other loans and receivables (17,953) 10,472
Increase in insurance and reinsurance contract assets (114,404) (213,125)
Increase in insurance and reinsurance contract liabilities 195,077 246,247
Increase/(decrease) in other payables 16,556 (8,343)
Cash (used in)/generated from operations 198,865 186,696
Interest received 8,724 8,246
Dividends received 18,394 18,461
Income taxes paid (2,008) (1,600)
Net cash outflows/inflows from operating activities 223,975 211,803
Cash flows from investing activities
Acquisition of subsidiary, net of cash acquired 3 1,196,967 –
Purchase of property and equipment 12 (2,113) (317)
Net cash outflows from investing activities 1,194,854 (317)
Cash flows from financing activities
Dividend paid 9 (173,894) (225,772)
Net cash outflows from financing activities (173,894) (225,772)
Net increase/(decrease) in cash and cash equivalents 1,244,935 (14,286)
Cash and cash equivalents at beginning of year 48,765 63,916
Effect of exchange rate changes on cash and cash equivalents (2,567) (865)
Cash and cash equivalents at end of year 10(a) 1,291,133 48,765
The Company includes cash flows from purchase and disposal of financial assets in its operating cash flows as these transactions are generated by the cash flows associated with the origination and settlement of insurance contract liabilities or capital requirements to support underwriting.
The attached notes and information on pages 11 to 54 form an integral part of these financial statements.

MS Amlin AG 2016 Annual Report 11
Notes to the financial statementsFor the year ended 31 December 2016
1. Summary of significant accounting policies and critical accounting judgements and estimatesMS Amlin AG (the Company) is incorporated in Switzerland and operates in Zurich with branches in Bermuda and Labuan.
The Company is a wholly owned subsidiary of MS Amlin plc (the Parent).
The basis of preparation and significant accounting policies adopted in the preparation of the Company’s financial statements are set out below.
1.1 Basis of preparationThese financial statements are prepared in accordance with International Financial Reporting Standards (IFRSs) and interpretations issued by the IFRS Interpretation Committee (IFRICs), as adopted for use in the European Union (EU).
The financial statements have been prepared on the historical cost basis except for cash and cash equivalents, financial assets and financial liabilities, share options, and pension assets, which are measured at their fair value.
Except where otherwise stated, all figures included in the financial statements are presented in thousands of US dollars shown as $’000 rounded to the nearest $1,000.
The accounting policies adopted in preparing these financial statements are consistent with those followed in the preparation of the Company’s annual financial statements for the year ended 31 December 2015, unless otherwise stated.
In accordance with IFRS 4 ‘Insurance Contracts’, the Company has applied existing accounting practices for insurance contracts, modified as appropriate, to comply with the IFRS framework and applicable standards.
1.2 Going concernNote 2 describes capital management needs and policies, note 11(g) covers underwriting risk, and note 10(i) covers market, liquidity, and credit risk which may affect the financial position of the Company.
After making enquiries, the Directors have a reasonable expectation that the Company has adequate resources to continue in operational existence for the foreseeable future. Accordingly, they continue to adopt the going concern basis in preparing these financial statements.
1.3 Adoption of new and revised standards(a) New standards, amendments to published standards and interpretations effective on or after 1 January 2016The Company has adopted the following new standards and amendments for the first time for their annual reporting period commencing 1 January 2016:
Amendment to IAS 16,’Property, plant and equipment’, Clarification of Acceptable Methods of Depreciation and AmortisationThis is a limited-scope amendment to IAS 16 to clarify that the use of revenue-based methods to calculate depreciation is not appropriate because revenue generated by an activity that includes the use of an asset generally reflects factors other than the consumption of the economic benefits embodied in the asset. The amendment has been endorsed by the EU and is effective from 1 January 2016.
The amendment above does not have any material impact on the Company’s financial statements.
Annual Improvements 2012-2014 CycleThe International Accounting Standards Board (IASB) uses the annual improvements process to make necessary, but non-urgent, amendments to IFRSs that will not be included as part of a major project. The amendments clarify existing guidance and do not give rise to significant changes in existing accounting practice. These improvements have been endorsed by the EU and are effective from 1 January 2016.
• IFRS 5 Non-current Assets Held for Sale and Discontinued Operations: Changes in methods of disposal
This amendment clarifies the treatment when reclassifying the method of disposal of items held for sale and items held for distribution. This clarification does not impact the Company’s financial statements.
• IFRS 7 Financial Instruments: Disclosures: Servicing contracts and applicability of the amendments to IFRS 7 to condensed interim financial statements
This clarifies how an entity should apply the guidance in paragraph 42C of IFRS 7 to a servicing contract to decide whether a servicing contract is ‘continuing involvement’ for the purposes of applying the disclosure requirements in paragraphs 42E–42H of IFRS 7. It also clarifies that the additional disclosure required by the amendments to IFRS 7 Disclosure–Offsetting Financial Assets and Financial Liabilities is not specifically required for all interim periods. However, the additional disclosure is required to be given in condensed interim financial statements that are prepared in accordance with IAS 34 Interim Financial Reporting when its inclusion would be required by the requirements of IAS 34. These clarifications do not impact the Company’s financial statements.
• IAS 19 Employee Benefits: Discount rate: regional market issue
This clarifies that the high quality corporate bonds used to estimate the discount rate for post-employment benefit obligations should be denominated in the same currency as the liability. Consequently, the IASB proposes to clarify that the depth of the market for high quality corporate bonds should be assessed at the currency level. This clarification does not impact the Company’s financial statements.
• IAS 34 Interim Financial Reporting: Disclosure of information ‘elsewhere in the interim financial report’
This clarifies the meaning of disclosure of information ‘elsewhere in the interim financial report’ and requires the inclusion of a cross-reference from the interim financial statements to the location of this information. This clarification does not impact the Company’s financial statements.

MS Amlin AG 2016 Annual Report12
Notes to the financial statementsFor the year ended 31 December 2016 continued
1. Summary of significant accounting policies and critical accounting judgements and estimates continued
1.3 Adoption of new and revised standards continuedAmendments to IAS 1,’Presentation of financial statements’ disclosure initiative (effective 1 January 2016)The narrow-focus amendments clarify, rather than significantly change, existing IAS 1 requirements. The amendments have been endorsed by the EU and are effective from 1 January 2016. These amendments have not impacted the financial statements of the Company.
(b) Standards, amendments to published standards and interpretations early adopted by the CompanyThe Company did not early adopt any new or amended IFRSs for the year ended 31 December 2016.
Standards, amendments to published standards and interpretations issued that are expected to have a material impact on the Company, but not yet effective up to the date of issuance of the Company’s financial statements are listed below. The Company intends to adopt these standards when they become effective.
(c) Standards, amendments to published standards and interpretations that are not yet effective and have not been early adopted by the Company IFRS 9, ‘Financial instruments’ In July 2014, the IASB issued the final version of IFRS 9, bringing together the classification and measurement, impairment and hedge accounting phases of the IASB’s project to replace IAS 39 ‘Financial Instruments: Recognition and Measurement’ and all previous versions of IFRS 9.
The final standard has a mandatory effective date of 1 January 2018 with early adoption permitted1, however the IASB have issued ‘Applying IFRS 9 Financial Instruments with IFRS 4 Insurance Contracts Amendments to IFRS 4’ that permits but does not require entities that predominantly issue insurance contracts the option to:
• defer the effective date of IFRS 9 Financial Instruments until 2021 (the ‘deferral approach’); or
• remove from profit or loss and instead present in other comprehensive income some of the additional accounting mismatches and temporary volatility that could occur before the new insurance contracts Standard is implemented (the ‘overlay approach’).
The adoption of IFRS 9 will have an effect on the classification and measurement and impairment model applied to the Company’s financial instruments. An assessment is on-going to quantify the impact of these changes. In due course the Company will decide which approach, from the above, to adopt. Consideration will also be given to the interaction with emerging requirements and expected timetable of the IASB’s insurance contracts project in addressing the Company’s classification and measurement approach. IFRS 9 has been endorsed by the EU, however ‘Applying IFRS 9 Financial Instruments with IFRS 4 Insurance Contracts Amendments to IFRS 4’ has not yet been endorsed by the EU.
IFRS 15, ‘Revenue from Contracts with Customers’In May 2014, the IASB issued IFRS 15 Revenue from Contracts with Customers with an effective date of 1 January 2017. In September 2015, an amendment was issued for the effective date to be deferred to annual periods beginning on or after 1 January 2018 with early adoption permitted1. This standard has been endorsed by the EU, however, in April 2016 the IASB published some clarifications to IFRS 15 which have not yet been endorsed by the EU.
The underlying principle is that an entity will recognise revenue to depict the transfer of goods or services to customers at an amount that the entity expects to be entitled to in exchange for those goods or services, based on the satisfaction of performance objectives.
Adoption of this standard replaces existing revenue recognition guidance applied by the Company, IAS 18 ‘Revenue’. It is not expected to have a material impact on the earned income of the Company.
IFRS 16, ‘Leases’In January 2016, the IASB issued IFRS 16 Leases with an effective date of accounting periods beginning on or after 1 January 2019. This new standard replaces IAS 17 Leases.
IFRS 16 eliminates the classification of leases as either operating leases or finance leases as is required by IAS 17 and, instead, introduces a single lessee accounting model. Applying that model, a lessee is required to recognise:
• assets and liabilities for all leases with a term of more than 12 months, unless the underlying asset is of low value; and
• depreciation of lease assets separately from interest on lease liabilities in the income statement.
The adoption of IFRS 16 will have a material effect on the Company as leased assets will be grossed up on the statement of financial position along with a corresponding liability. Depreciation on the leased asset and interest charge on the liability will also be accounted for through the profit or loss account. The EU has not yet endorsed this standard.
IFRIC Interpretation 22 ‘Foreign Currency Transactions and Advance Consideration’On 8 December 2016 the IASB issued IFRIC Interpretation 22 which addresses how to determine the date of the transaction for the purpose of determining the spot exchange rate used to translate the asset, expense or income (or part of it) on initial recognition that relates to, and is recognised on the derecognition of, a non-monetary prepayment asset or a non-monetary deferred income liability. This Interpretation is effective for accounting periods beginning on or after 1 January 2018 and has not yet been endorsed by the EU.
1.4 Critical accounting judgements and key sources of estimation uncertaintyThe preparation of financial statements requires the use of estimates and assumptions that affect the reported amounts of assets and liabilities. Although these estimates are based on management’s best knowledge of current events and actions, actual results may ultimately differ from those estimates. The table below provides an overview of the areas that involved a higher degree of judgement or complexity, and of items which are more likely to be materially adjusted due to estimates and assumptions turning out to be different to estimates.
Note:1. Subject to EU endorsement

MS Amlin AG 2016 Annual Report 13
Critical accounting judgement Nature of judgement Section
Product classification
Assessment of the significance of insurance risk passed (c)
Significant accounting estimates Note
Estimation of unpaid insurance claim reserves and expenses (a)
Estimation of premium income (b)
Fair value of Level 3 financial investments (d)
Intangible assets – recognition and impairment (e)
Recognition of deferred tax provisions (f)
Retirement benefit obligations – recognition (g)
(a) Insurance contract liabilitiesThe most significant estimate made in the financial statements relates to unpaid insurance claim reserves and related loss adjustment expenses of the Company.
Unpaid claims reserves are estimated on an undiscounted basis. Provisions are subject to a detailed quarterly review where forecast future cash flows and existing amounts provided are reviewed and reassessed. Any changes to the amounts held are adjusted through the statement of profit or loss.
The Company applies an actuarial-led reserving process, based on an actuarial best estimate plus an explicit management margin, which reflects the risk premium relating to the uncertainty of the actual level of claims incurred. Using an actuarial-led reserving process enhances the judgement about the profile of risk over the coverage period applied to certain classes of business. Consequently, changes in the estimate of claims should be considered in conjunction with the impact on earned premium.
Although it is possible that claims could develop and exceed the reserves carried, there is a reasonable chance of release of reserves from one year to the next. The estimated provision for the total level of claims incurred changes as more information becomes known about the actual losses for which the initial provisions were set up. The change in claims costs for prior period insurance claims represents the claims development of earlier reported years incurred in the current accounting period.
The carrying value of the Company’s net outstanding claims reserves at 31 December 2016 is $1,434.0 million (2015: $1,231.0 million). In 2016, there has been a net negative development of $6.6 million (2015: $14.3 million positive) for the Company. Note 11(i) provides further details of the method the Company applies in estimating insurance contract liabilities.
(b) Insurance contract premiumGross written premium is recognised on insurance contracts incepting during the financial year and includes an estimate of the total premium expected to be received under each contract. Adjustments to estimates from previous years are included in the reported premium.
With over supply of capital, particularly in the reinsurance market, clients have increasingly requested multi-year placements of their reinsurance programme. A number of contracts include cancellation clauses which can be enforced by the client. Judgement is therefore required to be applied in calculating the estimated total premium at the inception of these contracts.
The Company has recognised estimated premium income (EPI) for the current year and a positive adjustment for prior years totalling $523.9 million and $5.3 million respectively (2015: $500.6 million and $14.8 million).
The calculation of EPI is inherently subjective and attained through a combination of underwriters’ best estimates at a policy level and actuarial techniques at a portfolio level, based on observable historical trends. These estimates are reviewed on a quarterly basis by underwriters and independently assessed by the actuarial and finance teams.
If the estimation of EPI had been 10% lower than management’s estimates at 31 December 2016, the Company’s result on underwriting activities would decrease by $8.2 million (2015: $24.7 million) and net assets would decrease by $7.4 million (2015: $24.5 million).
The estimation of earned premium uses judgement about the profile of risk over the coverage period of reinsurance contracts. Premium is recognised as earned over the policy contract period. The earned element is calculated separately for each contract on a basis where the premium is apportioned over the period of risk. Some classes of business may be exposed to a seasonal pattern to the incidence of claims. Where this is the case, the earnings profile of the related premium is aligned.
(c) Product classificationInsurance contracts are defined as those containing significant insurance risk if, and only if, an insurance event could cause the insurer to make significant additional payments in any scenario, excluding scenarios that lack commercial substance, at the inception of the contract.
Contracts entered into by the Company with reinsurers under which the Company is compensated for losses on contracts issued by the Company and that meet the classification requirements for insurance contracts are classified as reinsurance contracts held. Insurance contracts underwritten by the Company under which the contract holder is another insurer (inwards reinsurance) are included within insurance contracts.
The significance of insurance risk is dependent on both the probability of an insured event and the magnitude of its potential effect. Any contracts not considered to be insurance contracts under IFRS 4 are classified as financial instruments in accordance with IAS 39.
Based on the current assessment, all of the products underwritten by the Company are insurance contracts within the scope of IFRS 4, ‘Insurance contracts’. Certain risk transfer contracts held by the Company, for example catastrophe linked instruments, do not meet the definition of an insurance contract and are therefore accounted for as financial instruments in accordance with IAS 39.

MS Amlin AG 2016 Annual Report14
Notes to the financial statementsFor the year ended 31 December 2016 continued
1. Summary of significant accounting policies and critical accounting judgements and estimates continued
1.4 Critical accounting judgements and key sources of estimation uncertainty continued(d) Financial assets and financial liabilitiesDepending on the methods and assumptions used (for example, in the fair valuation of Level 2 and Level 3 financial assets), the fair valuation of financial assets and financial liabilities can be subject to estimation uncertainty. Details of these methods and assumptions are described in note 10(g). The carrying values of the Company’s financial assets and financial liabilities at 31 December 2016 are $3,546.0 million (2015: $2,561.6 million) and $0.5 million (2015: $1.9 million), respectively. These include $280.7 million (2015: $251.8 million) of Level 3 investments, principally comprising property funds.
(e) Intangible assetsIntangible assets are recognised on internally developed computer software which relates to costs directly attributable to the development of an IT platform in MS Frontier Reinsurance Limited which was acquired during the year by the Company (note 3).
The assumptions made by management on initial recognition and valuation of intangible assets, together with the performance of impairment tests, are subject to estimation uncertainty. The results of the impairment test may result in the value of the intangible being impaired in the current period
The carrying value of the Company’s intangible assets at 31 December 2016 is $4.7 million (2015: $nil) (note 13).
(f) Tax Uncertainties exist with respect to the interpretation of complex tax regulations and the amount and timing of future taxable income. The wide range of international business relationships and the long-term nature and complexity of existing contractual agreements could necessitate future adjustments to tax income and expense already recorded. The Company establishes provisions, based on reasonable estimates, for possible consequences of audits by the tax authorities of the respective countries in which it operates. The amount of such provisions is based on various factors, such as experience of previous tax audits and differing interpretations of tax regulations by the Company and the responsible tax authority.
Deferred tax assets are recognised for all unused tax losses to the extent that it is probable that taxable profit will be available against which the losses can be utilised. Significant management judgement is required to determine the amount of deferred tax assets that can be recognised, based upon the likely timing and the level of future taxable profits, together with future tax planning strategies.
The carrying value at the reporting date of the deferred tax asset is $nil (2015: $1.9 million), and of the deferred tax liability is $9.8 million (2015: $4.8 million). Further analysis is included in note 7.
(g) Retirement benefit obligationsThe Company operates a defined benefit scheme in Zurich. The amounts included in these financial statements are sensitive to changes in the assumptions used to derive the value of the scheme assets and liabilities.
A gain of $1.7 million (2015: loss of $2.3 million) has been recognised in other comprehensive income and an expense of $1.9 million (2015: $0.3 million) has been recognised in the statement of profit or loss. Note 14(a) provides further details on the Company’s retirement benefit obligations. At 31 December 2016, the Company recognised a liability of $7.2 million (2015: $8.4 million) in respect of its defined benefit plan.
1.5 Significant accounting policies(a) Insurance contracts liabilitiesClaims paid are defined as those claims transactions settled up to the reporting date including external claims settlement expenses allocated to those transactions.
Unpaid claims reserves are made for known or anticipated liabilities under insurance contracts which have not been settled up to the reporting date. Included within the provision is an allowance for the future costs of settling those claims. This is estimated based on past experience and current expectations of future cost levels.
The unpaid claims reserves also include, where necessary, a reserve for unexpired risks where, at the reporting date, the estimated costs of future claims and related deferred acquisition costs are expected to exceed the unearned premium provision.
(b) Reinsurance recoveriesThe benefits to which the Company is entitled under its reinsurance contracts held are recognised as reinsurance assets. These assets consist of short-term balances due from reinsurers, as well as longer term receivables that are dependent on the expected claims and benefits arising under the related reinsured insurance contracts. Amounts recoverable from or due to reinsurers are measured consistently with the amounts associated with the reinsured insurance contracts and in accordance with the terms of each reinsurance contract.
Where there is objective evidence that a reinsurance asset is impaired, the Company reduces the carrying amount of the reinsurance asset to its recoverable amount and recognises that impairment loss in the statement of profit or loss.
(c) Insurance contracts premiumGross written premium comprise premium on insurance contracts incepting during the financial year together with adjustments to premium written in previous accounting periods. Premium is disclosed before the deduction of brokerage and taxes or duties levied on them.
The proportion of gross written premium, gross of commission or acquisition costs payable, attributable to periods after the reporting date is deferred as a provision for unearned premium. The change in this provision is taken to profit or loss in order that revenue is recognised over the period of the risk.

MS Amlin AG 2016 Annual Report 15
Embedded derivatives with risks and characteristics which are not closely related to the host contract, and where the combined instrument is not measured at fair value with changes in fair value recognised in the statement of profit or loss, are separated from the host contract and measured at fair value.
(h) Intangible assetsCosts directly attributable to internally developed computer software are capitalised and recognised as intangible by the Company.
Costs are recognised as intangible assets where they can be identified separately and measured reliably and it is probable that they will be recovered by directly related future economic benefits. Intangible assets are reviewed for impairment losses at each reporting date or whenever events or changes in circumstances indicate that the carrying amount may not be recoverable. These intangible assets are carried at cost less accumulated amortisation and impairment losses. Amortisation is recognised in line with the consumption of the benefits based on the estimated useful economic life of the assets, which is estimated to be between 3 and 15 years, and is charged to other operating expenses in the statement of profit or loss.
(i) TaxIncome tax expense represents the sum of the current tax and deferred tax.The current tax is based on taxable profit for the year. Taxable profit differs from net profit as reported in the statement of profit or loss because it excludes items of income or expense that are taxable or deductible in other years or that are never taxable or deductible. The Company’s liability for current tax is calculated using tax rates that have been enacted or substantively enacted by the reporting date.
Deferred tax is recognised on differences between the carrying amounts of assets and liabilities in the financial statements and the corresponding tax bases used in the computation of taxable profit and is accounted for using the liability method. Deferred tax liabilities are generally recognised for all taxable temporary differences and deferred tax assets are recognised to the extent that it is probable that taxable profits will be available against which deductible temporary differences can be utilised.
The carrying amount of deferred tax assets is reviewed at each reporting date and reduced to the extent that it is no longer probable that sufficient taxable profits will be available to allow all or part of the asset to be recovered.
Deferred tax is calculated at the substantively enacted tax rates that are expected to apply in the year when the liability is settled or the asset is realised. Deferred tax is charged or credited to the statement of profit or loss, except when it relates to items charged or credited directly to other comprehensive income or equity, in which case the deferred tax is also charged or credited to other comprehensive income or equity, respectively.
(j) Employee benefitsi. Retirement Benefit PlanThe Company operates a defined contribution scheme in Bermuda and Labuan. Its Zurich pension scheme is classified as a defined benefit scheme in accordance with IAS 19.
Pension contributions to the defined contribution plan are charged to the statement of profit or loss when due.
Premium is recognised as earned over the policy contract period. The earned element is calculated separately for each contract on a basis where the premium is apportioned over the period of the risk. Some classes of business such as US hurricane and West Pacific Typhoon may be exposed to a seasonal pattern to the incidence of claims. Where this is the case, the earnings profile of the related premium is aligned.
(d) Reinsurance premium cededReinsurance premium ceded comprise premium on reinsurance arrangements bought which incept during the financial year, together with adjustments to premiums ceded in previous accounting years. The proportion of reinsurance premium ceded attributable to periods after the reporting date is deferred as reinsurers’ share of unearned premium. Reinsurance premium ceded is earned over the policy contract period in accordance with the terms of the reinsurance contract.
(e) Acquisition costsAcquisition costs comprise brokerage, ceding commissions and Federal Excise Tax (FET) incurred on insurance contracts written during the financial year. They are incurred on the same basis as the earned proportions of the premium they relate to. Deferred acquisition costs are amortised over the period in which the related revenues are earned. Deferred acquisition costs are reviewed at the end of each reporting year and are impaired where they are no longer considered to be recoverable out of future margins in the related revenues.
(f) Financial assetsThe Company classifies its financial investments at fair value through profit or loss (FVPL). Management determines the classification of its financial assets at initial recognition. This classification requires all fair value changes to be recognised immediately within the investment return line in the statement of profit or loss. Within the FVPL category, fixed income securities, equity securities, property funds and certain derivatives are classified as ‘trading’ as the Company buys with the intention to resell.
All other assets at FVPL are classified as ‘other than trading’ within the FVPL category as they are managed and their performance is evaluated on a FVPL basis.
Purchases and sales of investments are recognised on the trade date, which is the date the Company commits to purchase or sell the assets. These are initially recognised at fair value, and are subsequently re-measured at fair value. Transaction costs are recognised directly in the statement of profit or loss when incurred. Changes in the fair value of investments are included in the statement of profit or loss in the year in which they arise. The uncertainty around valuation is discussed further in note 9(i).
(g) Derivative financial instrumentsDerivative financial instruments primarily include currency swaps, interest rate futures, catastrophe linked instruments and other financial instruments that derive their value mainly from underlying interest rates, foreign exchange rates or catastrophe risk. Derivatives are initially recognised at fair value on the date on which a derivative contract is entered into. They are subsequently measured at fair value, with their fair values obtained from quoted market prices or, where these are not available, by using valuation techniques such as discounted cash flow models or option pricing models. Changes in the fair value of derivative instruments are recognised immediately in the statement of profit or loss.

MS Amlin AG 2016 Annual Report16
Notes to the financial statementsFor the year ended 31 December 2016 continued
1. Summary of significant accounting policies and critical accounting judgements and estimates continued
1.5 Significant accounting policies continuedThe defined benefit obligation and associated pension costs are calculated annually by independent actuaries using the projected unit credit method. This method sees each period of service as giving rise to an additional unit of benefit entitlement, and measures each unit separately to build up the final liability. The cost of providing these benefits is charged to the statement of profit or loss to spread the pension cost over the service lives of employees. Remeasurements of defined benefit plans comprise actuarial gains and losses arising from experience adjustments and changes in actuarial assumptions, the return on plan assets (excluding net interest) and the effect of the asset ceiling (if any) and are recognised in the year during which they arise.
The liability recognised in the statement of financial position in respect of defined benefit pension plans is the fair value of plan assets less the present value of the defined benefit obligation at the reporting date, together with adjustments for restrictions on the recognition of a defined benefit asset due to an asset ceiling. The present value of the defined benefit obligation is determined by discounting the estimated future cash outflows using discounted rates set on the basis of the yield of high quality debt instruments (AA rated or equivalent) issued by blue chip companies, with maturities consistent with those of the defined benefit obligations. The fair value of the plan assets reflects the benefits that accrue under the insurance policy taken out to meet its obligations.
ii. Equity compensation plans (equity settled)Employees of the Company participated in a number of executive and employee share schemes operated by the Parent prior to its acquisition by Mitsui Sumitomo Insurance Company, Limited on 1 February 2016. Following the sanctioning by the High Court of Justice of the scheme of arrangement, all existing equity settled share schemes ceased on 28 January 2016, with the exception of the employee Sharesave schemes which ceased on 28 July 2016.
Options issued are accounted for using the fair value method where the cost for providing equity compensation is based on the fair value of the share option or award at the date of the grant. The fair value is calculated using an option pricing model and the corresponding expense is recognised in the statement of profit or loss over the vesting period. The accrual for this charge is recognised in equity shareholder’s funds.
iii. Other benefitsOther employee incentive schemes and long-term service awards, including the Capital Builder Plan and sabbatical leave, are recognised when they accrue to employees. A provision is made for the estimated liability for long-service leave as a result of services rendered by employees up to the reporting date.
(k) Foreign currency translationThe Company presents its financial statements in US dollars as the majority of the Company’s net assets, liabilities and income are in US dollars. There are also revenue streams in sterling, euro, and various other currencies. The Company conducts business in a range of economic environments, although these are primarily the United States of America, the United Kingdom, and continental Europe. The Company’s functional currency is the US dollar.
Transactions denominated in foreign currencies are translated using the exchange rates prevailing at the dates of the transactions. Monetary assets and liabilities are translated at the rates of exchange at the reporting date. Non-monetary assets and liabilities are translated at the rate prevailing in the year in which the asset or liability first arose, or where such items are revalued, at the latest valuation date. Exchange differences are recognised within other operating expenses.
The results and financial position of the Zurich operation whose functional currency is the euro are translated into US dollars as follows:
• Assets and liabilities for each statement of financial position presented are translated at the closing exchange rate at the reporting date;
• Income and expenses for each statement of profit or loss presented are translated at the exchange rates at the date of each transaction, or a practical approximation to these rates; and
• All resulting exchange differences are recognised in other comprehensive income.
Details of the principal exchange rates used are included in note 8(a).
(l) Other accounting policiesi. Investment returnDividends and any related tax credits are recognised as income on the date that the related listed investments are marked ex-dividend. Other investment income and interest receivable, expenses and interest payable are recognised on an accruals basis.
ii. Property and equipmentProperty and equipment are stated at historical cost less accumulated depreciation and provision for impairment where appropriate. Cost includes the original purchase price of the asset and the costs attributable to bringing the asset to its working condition for its intended use. Depreciation is calculated on the straight line method to write down the cost of such assets to their residual values over their estimated useful lives as follows:
Computer equipment 33% per annumFurniture, fixtures and leasehold improvements 20% per annum
The carrying values of property and equipment are reviewed for impairment when events or changes in circumstance indicate that the carrying value may be impaired. If any such condition exists, the recoverable amount of the asset is estimated in order to determine the extent of impairment and the difference is charged to the statement of profit or loss.
Gains and losses on disposal of property and equipment are determined by reference to their carrying amount and are recorded in the statement of profit or loss. Repairs and renewals are charged to the statement of profit or loss when the expenditure is incurred.

MS Amlin AG 2016 Annual Report 17
FINMA supervision is composed of various qualitative assessments, governance requirements and minimum solvency levels. The European Commission recognised the Swiss insurance supervision system as equivalent to the Solvency II Directive. This decision entered into force in October 2015. The Company provides regulatory solvency reporting to FINMA under the rules of the Swiss Solvency Test (SST). The SST is based on an economic view and required capital is derived from an internal capital model.
The Company’s SST model is to a large extent the same as the Parent’s Solvency II model, which has been approved by the UK Prudential Regulation Authority (PRA) in 2015 and is currently pending pre-approval after the acquisition of MS Amlin plc by Mitsui Sumitomo Insurance Company Limited (MSI) on February 1, 2016. The SST model had a temporary approval from FINMA until 31 December 2015, which was extended in 2016 and 2017.
For the year ended 31 December 2016, the Company calculated an SST ratio of 212%. The minimum ratio for the SST is set at 100%. The Company is expected to exceed the minimum ratios for the year ending 31 December 2017.
The European Commission recognised in November 2015 Bermuda’s prudential framework as equivalent to the Solvency II Directive. This decision came into force on 24 March 2016 and the equivalence decision will be applied retroactively to 1 January 2016.
Under BMA regulations, the Company is licensed as a Class IV insurer and the minimum solvency margin is the greater of $100 million, 50% of net premiums written in the current financial year, 15% of claims reserves and the Enhanced Capital Requirement (ECR).
The ECR is calculated on an annual basis through either the Bermuda Solvency Capital Requirement (BSCR) model or an approved internal model. In addition, as a Class IV insurer, the Company is required to maintain a minimum liquidity ratio such that the value of ‘relevant assets’ is not less than 75% of its ‘relevant liabilities’. The Company calculated an ECR of $669.9 million for the year ended 31 December 2015, and is expected to have an ECR for the year ending 31 December 2016 that exceeds the minimum requirements.
Under LFSA regulations, the Company is licensed as a general reinsurer and the minimum solvency requirement is the greater of a surplus of assets over liabilities of MYR10 million ($2.2 million) unimpaired by losses or 20% of net premium income of the preceding year ($3.6 million).
The LFSA has the discretion to impose higher capital requirements to commensurate with the Labuan Licensed Entities (LE) business activities and risk exposures, based on the LFSA’s supervisory assessment of the LE concerned.
For trading purposes, the Company believes that it is necessary to hold at least $1 billion of capital, which is currently in excess of the minimum required by FINMA, BMA, and LFSA.
iii. Loans and receivablesLoans and receivables are initially recognised at fair value and subsequently measured at amortised cost using an effective interest rate. Appropriate allowances for estimated irrecoverable amounts are recognised in the statement of profit or loss when there is evidence that the asset is impaired. These are reversed when the triggering event that caused the impairment is reversed.
iv. Finance costsFinance costs comprise commissions charged for the utilisation of letters of credit. These costs are charged to the statement of profit or loss as finance costs as incurred. Fees paid for the arrangement of letter of credit facilities are charged to finance costs over the life of the facility.
v. Cash and cash equivalentsCash and cash equivalents are carried in the statement of financial position at fair value. For the purposes of the statement of cash flows, cash and cash equivalents comprise cash on hand, deposits held on call with banks and other short-term, highly liquid investments which are believed to be subject to insignificant risk of change in fair value.
vi. LeasesLeases are classified as finance leases whenever the terms of the lease transfer substantially all the risks and rewards incidental to ownership to the Company as the lessee. The Company holds no finance leases. All other leases are classified as operating leases.
Rentals payable under operating leases (after taking into account incentives received from the lessor) are charged to the statement of profit or loss on a straight line basis over the period of the lease, which is representative of the time pattern of the Company’s benefit.
vii. Dividend distributionFinal dividend distribution to the Company’s shareholder is recognised as a liability in the Company’s financial statements in the year in which the dividends are approved by the Company’s shareholder.
viii. Other payablesOther payables are initially recognised at fair value and subsequently measured at amortised cost. They represent liabilities to pay for goods or services that have been received or supplied in the normal course of business, invoiced by the supplier before the year end, but for which payment has not yet been made.
2. CapitalThe capital structure of the Company comprises of issued capital, reserves, and retained earnings as disclosed in the statement of changes in equity and in notes 15(a) and (b).
During the current and prior financial years, the Company complied with all externally imposed capital requirements to which it is subject.
The Company is domiciled in Switzerland and supervised by the Swiss Financial Market Authority (FINMA). Its branches in Bermuda and Labuan are under supervision of the Bermuda Monetary Authority (BMA), and the Labuan Financial Services Authority (LFSA).

MS Amlin AG 2016 Annual Report18
Notes to the financial statementsFor the year ended 31 December 2016 continued
3. Merger and acquisitions
Acquisition of subsidiariesOn 31 December 2016, as part of a reorganisation within the Parent, MS Amlin Plc sold 100% of its interest in the issued share capital and voting rights of MS Frontier Reinsurance Limited (“MSFR”) to the Company, in exchange for a share in the Company immediately before a legal merger was effected between MSFR and the Company. The merged entity will continue to operate under the legal name MS Amlin AG. MSFR is a reinsurer incorporated in Bermuda licensed to write general insurance business.
Acquisition accountingThe Company has applied its accounting policy to use merger accounting for transactions involving businesses under common control. Therefore, no goodwill has been recognised on acquisition of MSFR. Consequently a merger reserve arises on the difference between the fair value of consideration and carrying value of net assets acquired after deduction of retained earnings. The results of MSFR and its subsidiary have been included in the Company’s results from the date of acquisition 31 December 2016.
Acquired net assets and considerationAs part of the business combination under common control above, net assets were acquired at their IFRS carrying values after alignment of accounting policies. These are set out in the table below.
MSFR $m
Assets
Cash and cash equivalents 1,197.0
Financial investments 1.4
Reinsurance assets 10.9
Deferred tax assets –
Deferred acquisition costs 9.0
Other assets 80.1
Total assets 1,298.4
Liabilities
Insurance liabilities 147.9
Deferred tax liabilities –
Other liabilities 15.5
Total liabilities 163.4
Net assets 1,135.0
Retained earnings and reserves acquired 590.4
Merger reserve arising on acquisition 58.2
Fair value of consideration 486.4
4. Underwriting activities
a) Net earned premium
Note2016$’000
2015$’000
Gross earned premium
Gross written premium 11(c) 1,362,589 1,437,964
Change in unearned premium (86,064) (217,701)
1,276,525 1,220,263
Reinsurance premium ceded
Reinsurance premium payable 11(c) (83,653) (104,073)
Change in reinsurers’ share of unearned premium (2,877) 1,136
(86,530) (102,937)
1,189,995 1,117,326
MS Amlin AG 2016 Annual Report 19
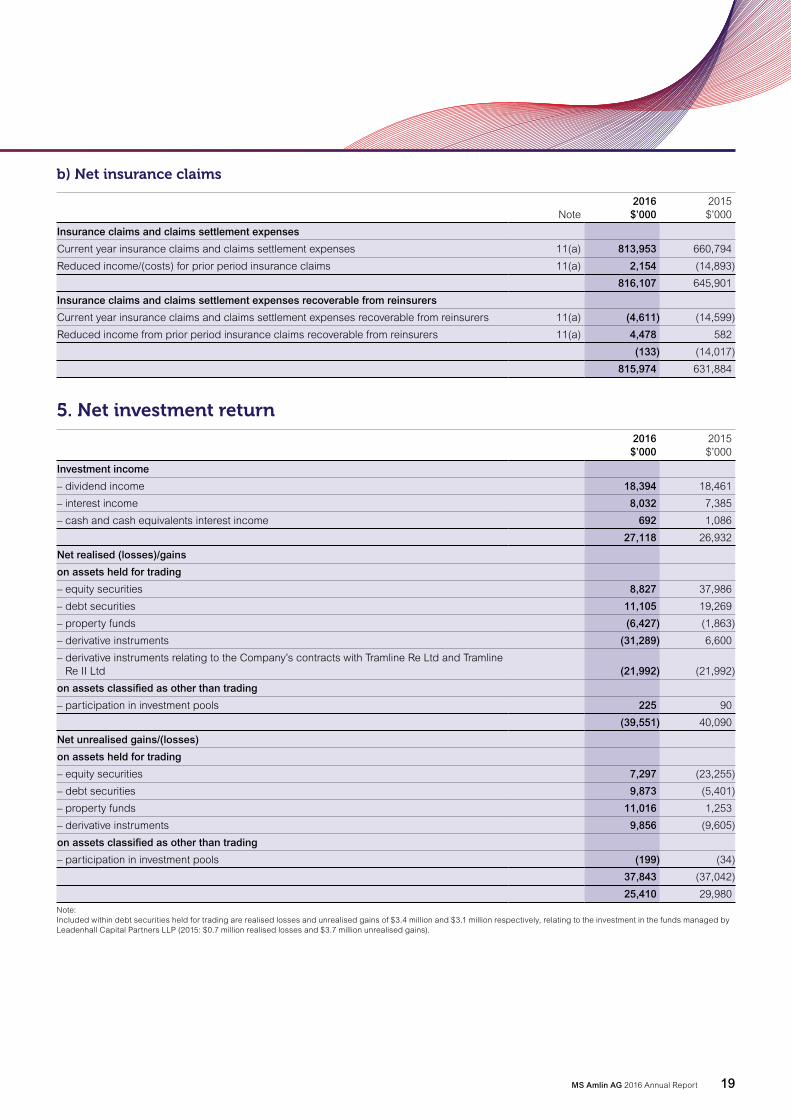
b) Net insurance claims
Note2016$’000
2015$’000
Insurance claims and claims settlement expenses
Current year insurance claims and claims settlement expenses 11(a) 813,953 660,794
Reduced income/(costs) for prior period insurance claims 11(a) 2,154 (14,893)
816,107 645,901
Insurance claims and claims settlement expenses recoverable from reinsurers
Current year insurance claims and claims settlement expenses recoverable from reinsurers 11(a) (4,611) (14,599)
Reduced income from prior period insurance claims recoverable from reinsurers 11(a) 4,478 582
(133) (14,017)
815,974 631,884
5. Net investment return 2016$’000
2015$’000
Investment income
– dividend income 18,394 18,461
– interest income 8,032 7,385
– cash and cash equivalents interest income 692 1,086
27,118 26,932
Net realised (losses)/gains
on assets held for trading
– equity securities 8,827 37,986
– debt securities 11,105 19,269
– property funds (6,427) (1,863)
– derivative instruments (31,289) 6,600
– derivative instruments relating to the Company’s contracts with Tramline Re Ltd and Tramline Re II Ltd (21,992) (21,992)
on assets classified as other than trading
– participation in investment pools 225 90
(39,551) 40,090
Net unrealised gains/(losses)
on assets held for trading
– equity securities 7,297 (23,255)
– debt securities 9,873 (5,401)
– property funds 11,016 1,253
– derivative instruments 9,856 (9,605)
on assets classified as other than trading
– participation in investment pools (199) (34)
37,843 (37,042)
25,410 29,980
Note: Included within debt securities held for trading are realised losses and unrealised gains of $3.4 million and $3.1 million respectively, relating to the investment in the funds managed by Leadenhall Capital Partners LLP (2015: $0.7 million realised losses and $3.7 million unrealised gains).

MS Amlin AG 2016 Annual Report20
Notes to the financial statementsFor the year ended 31 December 2016 continued
6. Expenses
a) Expenses for the acquisition of insurance contracts
Note2016$’000
2015$’000
Expenses for the acquisition of insurance contracts deferred during the year 11(d) 261,271 283,439
Changes in deferred expenses for the acquisition of insurance contracts (26,608) (62,194)
234,663 221,245
b) Other operating expenses
2016$’000
2015$’000
Administrative expenses 88,976 77,650
Foreign exchange (losses)/gains 6(f) 18,992 (1,949)
107,968 75,701
c) Employee benefit expenses The average number of persons employed by the Company including Directors was:
2016 2015
Senior underwriters 35 26
Other underwriters 11 7
Underwriting support 28 19
Claims staff 14 9
Claims support 3 3
Operational 62 33
Operational support 17 14
170 111
2016 2015
By location
Zurich 58 55
Bermuda 86 56
Labuan 26 –
170 111
The aggregate payroll costs incurred by the Company are analysed as follows:
Note2016$’000
2015$’000
Wages and salaries 19,740 19,571
Employee incentive and related social security costs 8,796 9,253
Equity settled share options and awards granted to Directors and employees 6(d) 888 936
Pension costs 14 2,723 1,069
Other 2,905 1,974
35,052 32,803

MS Amlin AG 2016 Annual Report 21
d) Long-term employee incentive schemesDuring the year ended 31 December 2016, the Parent operated a number of long-term employee incentive schemes in which employees of the Company participated. The plans that the Parent operated were MS Amlin’s Executive Share Option Schemes, Long Term Incentive Plan, Share Incentive Plan and Save As You Earn Plans. A summary of the plans in which the Company’s employees participated are set out below.
MS Amlin Long Term Incentive Plan (LTIP)Awards were usually made in the form of nil share options to be satisfied by MS Amlin plc shares and were made each year at the discretion of the MS Amlin plc Remuneration Committee. Awards were based on seniority with no individual receiving awards over shares having a market value on grant in excess of 100% of annual base salary.
Save As You Earn The Parent offered Save As You Earn options to Company employees in certain jurisdictions. The plan was adopted in 2008 and had a ten year life for new grants. Prior to this a similar scheme was also in place. An offer was made under the new plan in September 2015. Save As You Earn offers were open to all Company employees who have been employed for more than a specified number of months at each grant date. Exercises are not subject to any performance conditions.
Share Incentive Plan (SIP)Since 2007, the Parent had also operated and approved an all employee SIP allowing offers of free shares at no cost to Company employees.
The total cost recognised in the statement of profit or loss for these schemes amounted to $0.9 million (2015: $0.9 million).
i) Equity settled share-based payment schemesAt 1 February 2016 all ordinary shares in the Parent were acquired by MSI. Following the sanctioning by the High Court of Justice of the scheme of arrangement, all existing equity settled schemes (excluding employee Sharesave schemes) ceased on 28 January 2016. The employee Sharesave schemes ceased on 28 July 2016.
Share optionsA summary of the status and the changes to shares under option during the year were as follows (per share information is stated in UK pence):
Number of shares
2016
Weighted average
exercise price per share
(pence)
Number of shares
2015
Weighted average
exercise price per share
(pence)
Outstanding at 1 January 193,256 331 179,905 307
Granted during the year – – 35,777 404
Exercised during the year 113,561 310 (20,023) 252
Forfeited during the year 79,695 360 (2,403) 312
Total shares outstanding at 31 December – – 193,256 331
Total shares exercisable at 31 December – – 14,521 313
The weighted average share price at the date of exercise for share options exercised during the year was 670 pence (2015: 507 pence).
The following table summarises information about options outstanding at the end of the year:
Number of outstanding
shares under option
2016
Weighted average
remaining contractual life
(years)
Number of outstanding
shares under option 2015
Weighted average
remaining contractual life
(years)
£2.47-£2.93 – – 39,443 1.4
£2.94-£3.55 – – 118,036 2.3
£3.56-£4.04 – – 35,777 3.4

MS Amlin AG 2016 Annual Report22
Notes to the financial statementsFor the year ended 31 December 2016 continued
6. Expenses continued
d) Long-term employee incentive schemes continuedShare awardsAt 31 December 2016, the total awards of shares committed to be met under these schemes are summarised below:
Number of shares under
conditional award
2016 Vesting period
Number of shares under
conditional award2015 Vesting period
LTIP grants – – 567,274 2016 to 2017
PSP grants – – 552,303 2016 to 2020
SIP grants – – 148,909 2016 to 2018
Modifications to share-based payment arrangementsThere were no modifications to share-based payment arrangements in 2016.
Fair value of options and awardsAt 31 December 2016, the weighted average fair values of options and awards granted during the year were nil pence per option and nil pence per award respectively (2015: 141.72 pence and 181.68 pence, respectively).
The ‘Black Scholes’ option pricing model has been used to determine the fair value of the option grants and share awards listed above.
The assumptions used in the model are as follows:
2016 2015
Weighted average share price on grant (pence) – 433.64
Weighted average exercise price (pence) – 329.20
Expected volatility – 30.00%
Expected life (years) – 3.00-5.25
Risk free rate of return – 1.00%-3.00%
Expected dividend yield – 5.50%-7.00%
VolatilityThe volatility of the Parent’s share price is calculated as a normalised standard deviation of the log of the daily return on the share price. In estimating 30% volatility, the volatility of return for six months, one year and three year intervals are considered. As a guide to the reasonableness of the volatility estimate similar calculations are performed on a selection of the Parent’s peer group.
Interest rateThe risk free interest rate is consistent with government bond yields.
Dividend yieldThe assumptions are consistent with the Parent’s dividend yield for each relevant valuation year.
Staff turnoverThe option pricing calculations are split by staffing grades as staff turnover is higher for more junior grades. Furthermore, historical evidence suggests that senior employees tend to hold their options for longer whereas more junior levels within the organisation appear to exercise earlier. In addition, senior employees hold a larger proportion of the options but represent a smaller group of individuals.
Market conditionsThe Parent issues options that include targets for its performance against a number of market and non-market conditions. Failure to meet these targets can reduce the number of options exercisable. In some circumstances no options may be exercised. Assumptions are made about the likelihood of meeting the market and non-market conditions based on the outlook at the time of each option grant.

MS Amlin AG 2016 Annual Report 23
ii) Cash-settled share-based payment schemesCapital Builder PlanThe Company rewards senior underwriters through payments under the Capital Builder Plan (the Plan) if they achieve performance below the target loss ratio for their class(es) of business or business area over the five-year period of each award under the Plan. Under the scheme rules, the Company has the option to settle the awarded bonus in the shares of the Company or as a cash payment.
Provision for payments of an award under the Plan is calculated every year where actual profits exceed the target profit on a cumulative basis over the performance period to date under the Plan. The rate of accrual for each five-year performance period is determined at the start of the period, reflecting the share of the excess return payable and committed under the terms of the Plan.
Under this approach, the services received and the related liability are recognised as the services are rendered, in that the liability at any point in time for the Plan reflects the level of actual performance by underwriters in relation to the target.
The carrying amount of the liability under the Plan at 31 December 2016 is $0.9 million (2015: $1.5 million) and is recorded in other payables.
e) Finance costs
2016$’000
2015$’000
Letter of credit costs 2,067 1,670
f) Profit before taxProfit before tax is stated after charging the following amounts:
Note2016$’000
2015$’000
Depreciation 12 871 990
Operating lease expenditure 17(b) 770 931
Foreign exchange losses/(gains) 6(b) 18,992 (1,949)
Fees paid to the Company’s auditors in respect of the financial year are set out below:
2016£’000
2015£’000
Audit of the Company’s annual financial statements 482 425
Other services 4 3
Total fees 486 428

MS Amlin AG 2016 Annual Report24
Notes to the financial statementsFor the year ended 31 December 2016 continued
7. Tax The corporation tax rate for profits earned in Bermuda is currently nil% (2015: nil%). The combined corporate tax rate which is applicable to profits arising for the Zurich operation only, of Swiss cantonal and federal taxes, is rounded to 21.2% (2015: 21.2%).
On 31 December 2016 the legal merger between the Company and MSFR was completed. For Swiss tax purposes, the merger resulted in a gain which is tax exempt to the extent there are no tax losses available. As the Company has carry forward losses at federal level available the merger gain was first offset against the brought forward losses, thereby extinguishing these tax losses brought forward. The merger gain was also offset against current year tax losses. On this basis, the deferred tax asset in relation to the current year and brought forward tax losses has been written off, resulting in a higher deferred tax charge. For 2015, a deferred tax asset of $4.3 million was recognised in relation to federal tax losses.
A cantonal level deferred tax asset is recognized on the deferred costs for the current year to the extent they can be directly linked to deferred taxable gains compensating sufficiently for them. The current year deferred tax charge (2015: charge) arising principally from temporary timing differences amounted to $1.9 million (2015: $0.8 million).
In 2016, the Company incurred $2.1 million (2015 $1.7 million) of non-recoverable withholding taxes on investment income.
Deferred taxes of $0.4 million (2015 $0.5 million) have been charged (2015: credited) to other comprehensive income in respect of the defined benefit pension fund gains (2015: losses).
A current tax liability of $1.0 million (2015: $nil) is recognized on the 2016 profits of the newly acquired Swiss branch of MSFR. It is made up of a cantonal level tax of $0.6 million and a federal tax of $0.4 million.
The deferred tax liability of $9.8 million (2015: $4.8 million) reflects temporary timing differences which may crystalize in the future. Deferred tax has been provided for at the expected local tax rate for the period when the temporary timing differences are expected to reverse.
8. Foreign Exchange
a) Principal exchange ratesThe principal exchange rates used in translating foreign currency assets, liabilities, income and expenditure in the production of these financial statements were:
Average rate Year end rate
2016 2015 2016 2015
Sterling 0.74 0.65 0.81 0.68
Euro 0.90 0.90 0.95 0.92
New Zealand dollar 1.44 1.44 1.44 1.46
Australian dollar 1.35 1.33 1.38 1.37
Japanese yen 108.89 121.06 116.84 120.32
b) Foreign exchange riskThe exposures to translation, revaluation and asset liability currency matching risk combine to form the Company’s overall exposure to foreign exchange risk. The Company’s reporting and functional currency is US dollar. The Company holds asset and liability balances in major base currencies of US dollars, sterling, euro, New Zealand dollars, and Japanese yen.
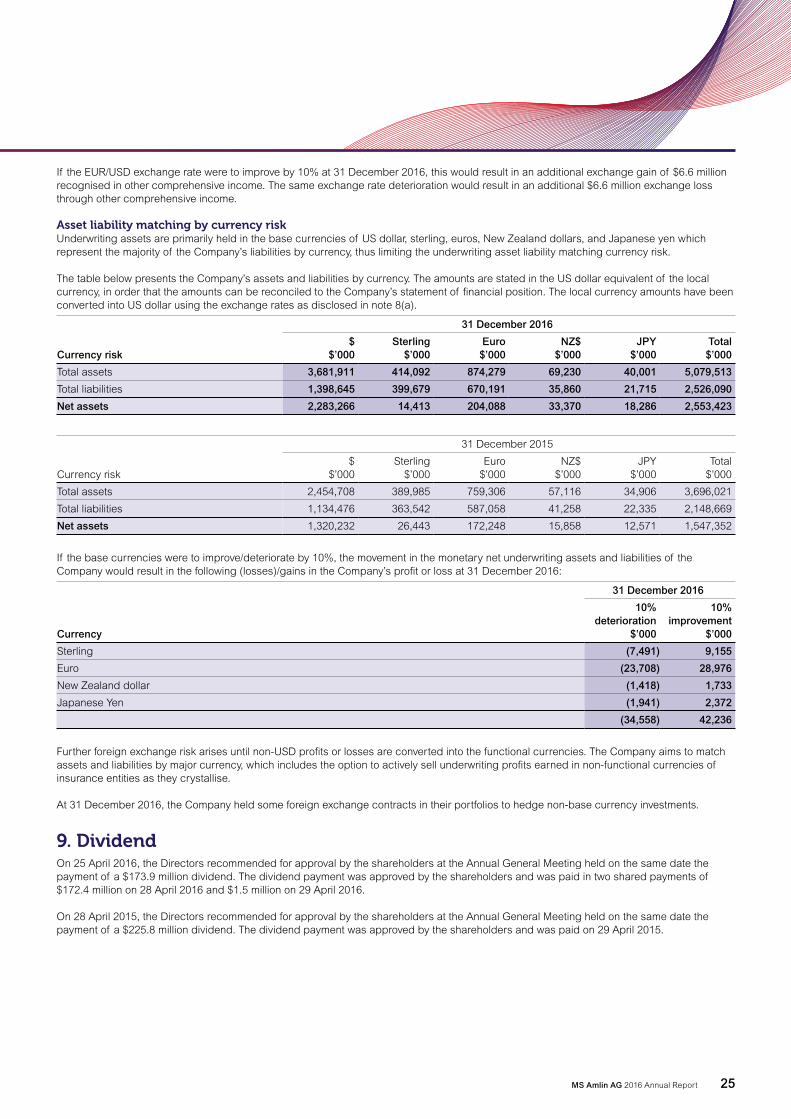
Translation riskForeign exchange translation risk arises when business is written in non-functional currencies. These transactions are translated into the functional currencies at the prevailing spot rate at the inception date of the premium. Consequently, there is exposure to currency movements between the inception date and the date the premium is received. Claims incurred in non-functional currencies are recorded at the prevailing spot rate on the date of the loss event (or suitable equivalent) and then translated back from the functional currency at the time a claim is to be settled; therefore the Company is exposed to exchange rate risk between the date the claim is made and the date of settlement.
Revaluation riskThe Company is subject to revaluation risk as a result of the translation into the Company’s US dollar reporting currency of the statement of financial position of the Zurich operation whose functional currency is the euro. Foreign exchange gains and losses on the translation of the Zurich operation are recognised in other comprehensive income in accordance with IAS 21 ‘The effects of changes in foreign exchange rates’. The loss recognised in other comprehensive income for the year ended 31 December 2016 was $3.3 million (2015: loss $8.0 million). This reflects the movement in the EUR rate from 0.92 at the start of the year to 0.95 at the balance sheet date.
MS Amlin AG 2016 Annual Report 25
If the EUR/USD exchange rate were to improve by 10% at 31 December 2016, this would result in an additional exchange gain of $6.6 million recognised in other comprehensive income. The same exchange rate deterioration would result in an additional $6.6 million exchange loss through other comprehensive income.
Asset liability matching by currency riskUnderwriting assets are primarily held in the base currencies of US dollar, sterling, euros, New Zealand dollars, and Japanese yen which represent the majority of the Company’s liabilities by currency, thus limiting the underwriting asset liability matching currency risk.
The table below presents the Company’s assets and liabilities by currency. The amounts are stated in the US dollar equivalent of the local currency, in order that the amounts can be reconciled to the Company’s statement of financial position. The local currency amounts have been converted into US dollar using the exchange rates as disclosed in note 8(a).
Currency risk
31 December 2016
$ $’000
Sterling $’000
Euro $’000
NZ$ $’000
JPY $’000
Total $’000
Total assets 3,681,911 414,092 874,279 69,230 40,001 5,079,513
Total liabilities 1,398,645 399,679 670,191 35,860 21,715 2,526,090
Net assets 2,283,266 14,413 204,088 33,370 18,286 2,553,423
Currency risk
31 December 2015
$ $’000
Sterling $’000
Euro $’000
NZ$ $’000
JPY $’000
Total $’000
Total assets 2,454,708 389,985 759,306 57,116 34,906 3,696,021
Total liabilities 1,134,476 363,542 587,058 41,258 22,335 2,148,669
Net assets 1,320,232 26,443 172,248 15,858 12,571 1,547,352
If the base currencies were to improve/deteriorate by 10%, the movement in the monetary net underwriting assets and liabilities of the Company would result in the following (losses)/gains in the Company’s profit or loss at 31 December 2016:
Currency
31 December 2016
10% deterioration
$’000
10% improvement
$’000
Sterling (7,491) 9,155
Euro (23,708) 28,976
New Zealand dollar (1,418) 1,733
Japanese Yen (1,941) 2,372
(34,558) 42,236
Further foreign exchange risk arises until non-USD profits or losses are converted into the functional currencies. The Company aims to match assets and liabilities by major currency, which includes the option to actively sell underwriting profits earned in non-functional currencies of insurance entities as they crystallise.
At 31 December 2016, the Company held some foreign exchange contracts in their portfolios to hedge non-base currency investments.
9. DividendOn 25 April 2016, the Directors recommended for approval by the shareholders at the Annual General Meeting held on the same date the payment of a $173.9 million dividend. The dividend payment was approved by the shareholders and was paid in two shared payments of $172.4 million on 28 April 2016 and $1.5 million on 29 April 2016.
On 28 April 2015, the Directors recommended for approval by the shareholders at the Annual General Meeting held on the same date the payment of a $225.8 million dividend. The dividend payment was approved by the shareholders and was paid on 29 April 2015.

MS Amlin AG 2016 Annual Report26
Notes to the financial statementsFor the year ended 31 December 2016 continued
10. Financial assets and liabilities
a) Cash and cash equivalents
2016$’000
2015$’000
Cash and cash in hand 214,713 48,765
Short-term deposits and other highly liquid investments 1,076,420 –
1,291,133 48,765
Cash and cash equivalents represent cash at bank and in hand, short-term bank deposits, and money market funds which represent highly liquid investments.
b) Net financial investments
At valuation 2016$’000
At valuation 2015$’000
At cost 2016$’000
At cost 2015$’000
Assets
Financial assets held for trading at fair value through profit or loss
Shares and other variable yield securities 378,972 370,373 356,571 355,269
Debt and other fixed income securities 1,623,820 1,757,716 1,576,886 1,719,972
Property funds 279,408 250,709 272,638 254,955
Derivative instruments 12,892 3,710 – –
Other financial assets at fair value through profit or loss
Participation in investment pools 117,731 143,819 117,869 143,774
Deposit with credit institutions 56,944 35,226 56,944 35,226
Total financial assets 2,469,767 2,561,553 2,380,908 2,509,196
Liabilities
Financial liabilities held for trading at fair value through profit or less
Derivative instruments (495) (1,868) – –
Total financial liabilities (495) (1,868) – –
Net financial assets 2,469,272 2,559,685 2,380,908 2,509,196
Debt and other fixed income securities include pooled funds, investing in bonds and other fixed income securities. The valuation of these funds is $1,101.9 million (2015: $1,488.8 million). Participation in investment pools includes units held in money market funds.
The reconciliation of opening and closing net financial investments is as follows:
2016$’000
2015$’000
At 1 January 2,559,685 2,528,416
Acquisition through business combination 1,385 –
Foreign exchange losses (75,310) (63,491)
Net (sales)/purchases (14,780) 91,712
Net realised (losses)/gains on assets held for trading or other than trading (39,551) 40,090
Net unrealised gains/(losses) on assets held for trading or other than trading 37,843 (37,042)
At 31 December 2,469,272 2,559,685

MS Amlin AG 2016 Annual Report 27
c) Other loans and receivables
Note2016$’000
2015$’000
Other receivables 24,121 6,190
Prepayments and other accrued income 2,663 1,754
Intercompany debtors 18(a) 14 102
26,798 8,046
Other receivables comprise principally of amounts receivable for financial investments sold. Other loans and receivables are expected to be current.
The carrying amounts disclosed above are reasonably approximate to the fair value at the reporting date.
d) Related party loanIn February 2014, the Company agreed to refinance and extend the $161.0 million unsecured loan facility that was originally entered into in November 2011 with the Parent. The loan facility expires on 31 October 2018; interest is payable at 2% above the US$ London Interbank three month Offered Rate; and the commitment fee amounts to 35% of 1.5% of the unutilised portion of the commitment.
On 20 February 2014, the amount of $161.0 million was advanced to the Parent and the loan and interest of $163.2 million remains outstanding at 31 December 2016 (2015: $161.9 million).
e) Other payables
Note2016$’000
2015$’000
Accrued expenses and deferred income 18,669 15,733
Other liabilities 6,155 1,205
Social security and other tax payables 1,577 661
Intercompany creditors 18(a) 24,121 7,217
50,522 24,816
The current and non-current portions are expected to be as follows:
2016$’000
2015$’000
Current portion 48,936 22,360
Non-current portion 1,586 2,456
50,522 24,816
Other liabilities comprise principally of amounts payable for financial investments purchased, collateral repayable on derivative contracts and other sundry payables.
The carrying amounts disclosed above are reasonably approximate to the fair value at the reporting date.
f) BorrowingsThe Company has three Letter of Credit (“LOC”) facilities of $250.0 million (2015: $280.0 million), $60.0 million (2015: $nil million), and NZ$75.0 million (2015: NZ$75.0 million). The $250.0 million facility is secured by a registered charge over a portfolio of assets managed by Fiera Capital with BNP Paribas as custodian. The $60.0 million facility is secured by time deposits held at Barclays Bank. The NZ$75.0 million is secured by time deposits held at National Australia Bank. As at 31 December 2016, $254.3 million of the LOC’s were issued (2015: $261.1 million). The total value of restricted assets as at 31 December 2016 was $302.0 million (2015: $282.8 million).

MS Amlin AG 2016 Annual Report28
Notes to the financial statementsFor the year ended 31 December 2016 continued
10. Financial assets and liabilities continued
g) Fair value hierarchyi) Fair value methodologyFor financial instruments carried at fair value the Company has categorised the measurement basis into a fair value hierarchy as follows:
Level 1 – Quoted prices (unadjusted) in active markets for identical assets or liabilities. An active market is one in which transactions for the asset occurs with sufficient frequency and volume to provide readily and regularly available quoted prices.
Level 2 – Inputs to a valuation model other than quoted prices included within Level 1 that are observable for the asset or liability either directly (i.e. as prices) or indirectly (i.e. derived from prices).
Level 3 – Inputs to a valuation model for the asset that are not based on observable market data (unobservable inputs) and are significant to the overall fair value measurement. Unobservable inputs may have been used to measure fair value to the extent that observable inputs are not available, thereby allowing for situations in which there is little, if any, market activity for the asset at the measurement date (or market information for the inputs to any valuation models). As such, unobservable inputs reflect the assumptions which it considers market participants would use in pricing the asset.
There were no changes to the valuation techniques during the year.
Shares and other variable yield securitiesListed equities traded on a primary exchange in an active market are classified as Level 1.
Debt and other fixed income securities The fair value is based upon quotes from pricing services where available. These pricing services derive prices based on an average of quotes provided by brokers. Where multiple quotes are not available, the fair value is based upon evaluated pricing services, which typically use proprietary cash flow models and incorporate observable market inputs, such as credit spreads, benchmark quotes, and other trade data. If such services do not provide coverage of the asset, then fair value is determined manually using indicative broker quotes, which are corroborated by recent market transactions in similar or identical assets.
Where there is an active market for these assets and their fair value is the unadjusted quoted market price, these are classified as Level 1. This is typically the case for government bonds. Level 1 also includes bond funds, where fair value is based upon quoted market prices. Where the market is inactive or the price is adjusted, but significant market observable inputs have been used by the pricing sources, then these are considered to be Level 2. This is typically the case for government agency debt, corporate debt, mortgage and asset backed securities, and catastrophe bonds. Certain assets, for which prices or other market inputs are unobservable, are classified as Level 3.
Property fundsThe Company’s property fund portfolios are valued using the most recent net asset value provided by the fund managers. The net asset values, which may be a quarter in arrears, are determined by the fund managers using proprietary cash flow models. In such cases, adjustments may be made to bring the net asset value to a more current valuation. The inputs into that valuation, such as discount rates, are primarily unobservable and, as such, these assets are classified as Level 3. Where an investment is made into a new property fund the transaction price is considered to be the fair value if it is the most recent price available.
Participation in investment poolsThese are units held in money market funds and the value is based upon unadjusted, quoted and executable prices provided by the fund manager and these are classified as Level 1.
DerivativesListed derivative contracts, such as futures, that are actively traded are valued using quoted prices from the relevant exchange and are classified as Level 1. Over-the-counter currency options are valued by the counterparty using quantitative models with multiple market inputs such as foreign exchange rate volatility. The market inputs are observable and the valuation can be validated through external sources. These are classified as Level 2. The Company’s risk transfer contracts with Tramline Re II Ltd have been classified as a derivative instrument. The valuation of these instruments is based on forecast cash flow models which contain principally unobservable market inputs, and as such are classified as Level 3.

MS Amlin AG 2016 Annual Report 29
ii) Net financial investments by fair value grouping
Fair value hierarchy Fair value hierarchy
Level 1$’000
Level 2$’000
Level 3$’000
Total2016$’000
Level 1$’000
Level 2$’000
Level 3$’000
Total2015$’000
Assets
Financial assets held for trading at fair value through profit or loss
Shares and other variable yield securities 378,972 – – 378,972 370,373 – – 370,373
Debt and other fixed income securities 1,519,487 104,333 – 1,623,820 1,646,180 111,536 – 1,757,716
Property funds – – 279,408 279,408 – – 250,709 250,709
Derivative instruments – 11,582 1,310 12,892 – 2,650 1,060 3,710
Other financial assets at fair value through profit or loss
Participation in investment pools 117,731 – – 117,731 143,819 – – 143,819
Deposits with credit institutions 56,944 – – 56,944 35,226 – – 35,226
Total financial assets 2,073,134 115,915 280,718 2,469,767 2,195,598 114,186 251,769 2,561,553
Liabilities
Financial liabilities held for trading at fair value through profit or loss
Derivative instruments – (495) – (495) – (1,868) – (1,868)
Total liabilities – (495) – (495) – (1,868) – (1,868)
Net financial assets 2,073,134 115,420 280,718 2,469,272 2,195,598 112,318 251,769 2,559,685
The table above excludes the Company’s holdings of cash and cash equivalents of $1,291.1 million (2015: $48.8 million). These are measured at fair value and are categorized as Level 1.
The table also excludes the Company’s other loans and receivables and other payables (note 10(c) and note 10(e), respectively) which are carried at amounts that approximate to the fair value and are categorised as Level 3 in the fair value hierarchy. This includes the Company’s commitments, as detailed in note 17.
The majority of the Company’s investments are valued based on quoted market information or other observable market data. The Company holds 11.4% (2015: 9.8%) of its net financial investments at fair value based on estimates and recorded as Level 3 investments. Where estimates are used, these are based on a combination of independent third party evidence and internally developed models, calibrated to market observable data where possible. While such valuations are sensitive to estimates, it is believed that changing one or more of the assumptions to reasonably possible alternative assumptions might result in a higher or lower fair value measurement, though this is unlikely to be significant.
iii) Transfers between levels of the fair value hierarchyThe Company’s policy is to recognise transfers into and transfers out of fair value hierarchy levels at the end of the relevant reporting period during which the transfers are deemed to have occurred.
There has been no transfer between Levels 1, 2 and 3 during the year or in the comparative reporting year.

MS Amlin AG 2016 Annual Report30
Notes to the financial statementsFor the year ended 31 December 2016 continued
10. Financial assets and liabilities continued
g) Fair value hierarchy continuedThe table below analyses the movements in assets and liabilities classified as Level 3 investments during 2016.
Property funds$’000
Derivative instruments
$’000Total$’000
At 1 January 2016 250,709 1,060 251,769
Total net gains/(losses) recognised in investment return in the statement of profit or loss 9,752 (21,992) (12,240)
Purchases 24,110 – 24,110
Settlements – 22,242 22,242
Foreign exchange losses (5,163) – (5,163)
At 31 December 2016 279,408 1,310 280,718
Total net unrealised gains or losses for the year recognised in investment return in profit or loss for assets and liabilities held at the end of the reporting year (20,872)
Property funds$’000
Derivative instruments
$’000Total
$’000
At 1 January 2015 184,487 92 184,579
Total net gains/(losses) recognised in investment return in profit or loss 9,827 (21,992) (12,165)
Purchases 66,832 – 66,832
Settlements – 22,960 22,960
Foreign exchange losses (10,437) – (10,437)
At 31 December 2015 250,709 1,060 251,769
Total net unrealised gains or losses for the year recognised in investment return in profit or loss for assets and liabilities held at the end of the reporting year 8,349
h) Financial risk management The following section describes the Company’s investment risk management from a quantitative and qualitative perspective.
The Company has two main categories of assets:
• Underwriting assets – premium received and held to meet future insurance claims.
• Capital assets – capital required by the regulators to support the underwriting business plus working capital and surplus funds. These assets do not have specific current liabilities attached to them.
Investment governanceThe Company manages its investments in accordance with the investment governance framework set by the Company’s Board of Directors. This framework determines investment governance and the investment risk tolerance. It is reviewed on a regular basis to ensure that the Board of Directors’ fiduciary and regulatory responsibilities are being met. Day to day management of the investments is delegated to members of the Company’s executive who are advised by the Parent’s Chief Investment Officer.
Risk toleranceInvestment risk tolerance is set by the Supervisory Board. The investment process is driven from the risk tolerance which is determined by reference to factors such as the underwriting cycle. In a hard underwriting market capital preservation is paramount in order to support the insurance business and, therefore, the risk tolerance for the capital assets will be low. Conversely, the risk tolerance for the underwriting assets under these circumstances will be relatively high due to the strong cash flows. In a soft underwriting market the opposite applies.
Investment risk is monitored using a market-recognised third-party model and is independently reviewed by the Parent’s risk function. Risk reports are regularly reviewed by the Supervisory Board.

MS Amlin AG 2016 Annual Report 31
Strategic asset allocationThe strategic asset allocation is set according to the Company’s risk tolerance and liabilities. The strategic asset allocation for capital assets is set by using a Value at Risk (VaR1) model, to determine the optimum asset allocation for the current risk tolerance which ensures that appropriate solvency levels are maintained. The expected timescale for future cash flows in each currency is calculated; the average of these forms the basis of the asset liability duration management. Tactical ranges around these strategic asset allocations provide flexibility to ensure that an appropriate risk/reward balance is maintained in changing investment markets.
Investment managementInvestments are run on a multi-asset, multi-manager basis. Exposure to the asset classes is achieved using physical holdings of the asset class or derivative instruments, on a segregated or pooled basis2. Manager selection is based on a range of criteria that leads to the expectation that they will add value to the funds over the medium to long-term. The managers have discretion to manage the funds on a day-to-day basis within investment guidelines or prospectuses applicable to their funds that ensure that they comply with the investment governance frameworks. The managers’ performance, compliance and risk are monitored on an ongoing basis.
The funds under management with each manager are shown below:
31 December 2016 31 December 2015
$’000 % $’000 %
Segregated funds
Aberdeen Fund Management Ltd 275,730 7.9 273,657 10.6
Artemis Investment Management LLP 228,190 6.5 217,983 8.5
Barclays Bank plc 17 – 35,673 1.4
Bank of NT Butterfield & Son Ltd – – 20,220 0.8
CBRE Global Collective Investors (UK) Ltd 201,678 5.8 164,340 6.4
Fiera Capital Corporation (Formerly Union Bank of Switzerland) 250,071 7.1 – –
Insight Investment Management (Global) Ltd 111,801 3.2 176,333 6.8
Townsend Company Europe Ltd 89,072 2.5 95,503 3.7
Veritas Asset Management LLP 184,779 5.3 172,588 6.7
HSBC Asset Management 5,768 0.2 1,143 0.1
Pooled vehicles – liquidity funds
BlackRock Investment Management (UK) Ltd 295 – 26,450 1.0
BNP Paribas 1,972 0.1 – –
Goldman Sachs Asset Management, L.P. 1,076,000 30.5 – –
Goldman Sachs Asset Management International – – 14,833 0.6
HSBC Global Asset Management (France) 76,892 2.2 65,454 2.4
National Australia Bank 13,658 0.4 – –
Pooled vehicles – bonds and Libor Plus funds
Bluebay Asset Management LLP 147,063 4.2 234,055 9.1
Goldman Sachs Asset Management International 235,901 6.7 313,012 12.1
H20 AM LLP 240,316 6.9 326,946 12.7
PIMCO Global Advisers (Ireland) Ltd 140,599 4.0 204,942 8.0
Wellington Management International Ltd 126,265 3.6 131,674 5.1
Pooled vehicles – insurance linked securities
Leadenhall Capital Partners LLP 99,950 2.9 101,848 4.0
At 31 December 3,506,017 100.0 2,576,654 100.0
Note: The table above excludes $1.5 million ( 2015: $1.2 million ) other liquid investment and $11.1 million (2015: $0.8 million unrealised gains) unrealised gains accruing to a series of foreign exchange contracts placed on behalf of the Company to hedge portfolio currency exposures.
Notes:1. VaR is a statistical measure, which calculates the possible loss over a year, in normal market conditions. As VaR estimates are based on historical market data this should not be
viewed as an absolute gauge of the level of risk to the investments.2. Segregated funds are managed separately for the Company. Pooled funds are collective investment vehicles in which the Company and other investors purchase units.

MS Amlin AG 2016 Annual Report32
Notes to the financial statementsFor the year ended 31 December 2016 continued
10. Financial assets and liabilities continued
h) Financial risk management continuedAsset allocationThe total value of investments in the following tables is reconciled to note 10(b) financial assets and liabilities as follows:
2016$’000
2015$’000
Net financial investments per note 10(b) 2,469,272 2,559,685
Assets /(liabilities) shown separately in the notes to the accounts:
Accrued income 1,262 1,019
Net unsettled receivables for investments sold 2,069 1,595
Cash funds held by financial institutions 1,045,702 23,040
Margin and collateral and derivatives not analysed in the investment asset allocation tables (2,801) (2,250)
Other 114 (6,838)
Total investments in asset allocation tables below 3,515,618 2,576,251
The asset allocation of the Company’s investments is set out below.
31 December 2016 31 December 2015
Underwriting assets$’000
Capital assets$’000
Total assets$’000
Total%
Underwriting assets$’000
Capital assets$’000
Total assets$’000
Total%
Global equities – 379,235 379,235 10.8 – 370,657 370,657 14.4
Bonds
Government securities 523,385 – 523,385 14.9 259,485 – 259,485 10.1
Asset backed securities – – – – 256 – 256 –
Mortgage backed securities – Prime – – – – 9,460 – 9,460 0.4
Pooled vehicles 733,847 368,053 1,101,900 31.4 1,034,610 454,201 1,488,811 57.8
1,257,232 368,053 1,625,285 46.3 1,303,811 454,201 1,758,012 68.3
Property funds – 279,408 279,408 7.9 – 250,709 250,709 9.7
Other liquid investments
Liquidity funds and other liquid investments 842,019 389,671 1,231,690 35.0 167,489 29,384 196,873 7.6
2,099,251 1,416,367 3,515,618 100.0 1,471,300 1,104,951 2,576,251 100.0
Pooled vehicles held are represented by 31.1% government/agency bonds (2015: 31.9%), 29.4% corporate bonds (2015: 26.0%), 10.3% mortgage backed and asset backed securities (2015: 9.9%), 9.0% insurance linked securities (2015: 6.9%), 1.4% equities (2015: 0.2%), and 18.8% other liquid investments (2015: 25.1%).

MS Amlin AG 2016 Annual Report 33
The industry and geographical splits were as follows:
Industry
31 December 2016 31 December 2015
Global equities
%Total
%
Global equities
%Total
%
Oil & gas 2.3 2.3 7.0 7.0
Basic materials 4.3 4.3 4.4 4.4
Industrials 12.7 12.7 19.3 19.3
Consumer goods & services 17.1 17.1 15.5 15.5
Healthcare 24.0 24.0 18.7 18.7
Miscellaneous 2.0 2.0 1.9 1.9
Government guaranteed – – 0.8 0.8
Telecommunications 10.0 10.0 7.4 7.4
Utilities 1.2 1.2 5.0 5.0
Financials 16.9 16.9 10.1 10.1
Technology 9.5 9.5 9.9 9.9
100.0 100.0 100.0 100.0
Note: The table above excludes government bonds and pooled vehicles.
Region
31 December 2016 31 December 2015
Bonds%
Global equities
%Total
%Bonds
%
Global equities
%Total
%
United Kingdom 4.9 8.5 5.7 2.0 6.0 3.9
United States and Canada 71.9 57.4 68.9 78.0 54.0 65.7
Europe (excluding United Kingdom) 13.7 16.6 14.2 20.0 21.0 20.5
Far East 6.6 11.9 7.7 – 14.0 7.5
Emerging markets 2.9 5.6 3.5 – 5.0 2.4
100.0 100.0 100.0 100.0 100.0 100.0
Note: The table above includes all bond and equity investments, but excludes pooled vehicles.
i) Market risk Market risk concerns the risks associated with valuation, interest rates, liquidity and counterparty credit. Foreign exchange risk is described in note 8(b).
Valuation riskWhere possible, the Company’s assets are marked to market at bid price. Prices are supplied by the Company’s custodian whose pricing processes are covered by their published annual controls reports. In accordance with their pricing policy, prices are sourced from market recognised pricing vendor sources. These pricing sources use closing trades, or where more appropriate in illiquid markets, pricing models. These models typically use broker quotes or other independent valuation techniques such as discounted cash flow models using observable or unobservable market inputs.
The Company has an established control framework with respect to fair value measurement which ensures the valuation of financial assets and financial liabilities meets the requirements of IFRS. As part of this process the Company reviews the valuation policies of its custodians along with the evidence provided by the custodians to support fair value measurement. The prices are also reconciled to the fund managers’ records to check for reasonableness.
As an additional level of governance over pricing, the Company validates the prices provided by pricing vendor sources against information obtained from Bloomberg where available. A review of stale prices was also conducted at 31 December 2016; though the impact of stale prices on the Company’s investment valuation is considered immaterial. Further details on the fair value measurement of financial assets and financial liabilities are included in note 10(g).
The valuation of investments is sensitive to equity risk. The impact on profit before tax of a 1% improvement/deterioration in the total market value of shares and other variable yield securities would be a $3.8 million gain/loss (2015: $3.7 million). Sensitivities in relation to other risks are considered in the following pages and note 8(b).
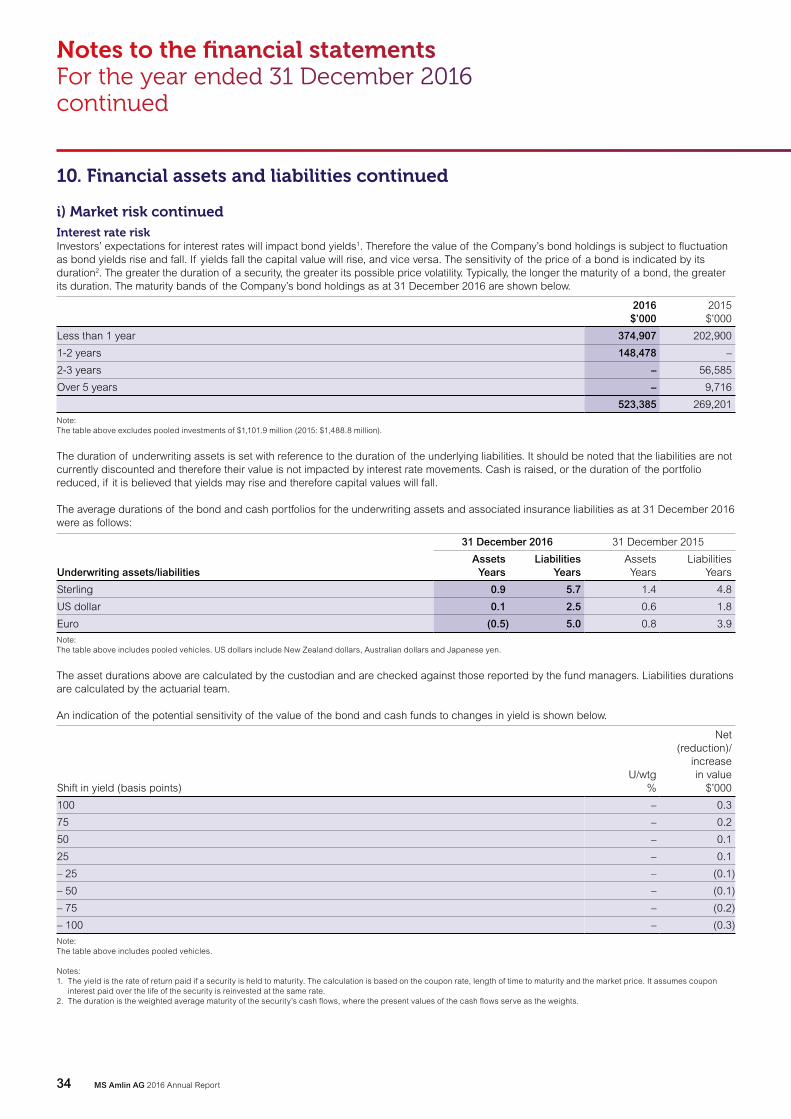
MS Amlin AG 2016 Annual Report34
Notes to the financial statementsFor the year ended 31 December 2016 continued
10. Financial assets and liabilities continued
i) Market risk continued Interest rate riskInvestors’ expectations for interest rates will impact bond yields1. Therefore the value of the Company’s bond holdings is subject to fluctuation as bond yields rise and fall. If yields fall the capital value will rise, and vice versa. The sensitivity of the price of a bond is indicated by its duration2. The greater the duration of a security, the greater its possible price volatility. Typically, the longer the maturity of a bond, the greater its duration. The maturity bands of the Company’s bond holdings as at 31 December 2016 are shown below.
2016$’000
2015$’000
Less than 1 year 374,907 202,900
1-2 years 148,478 –
2-3 years – 56,585
Over 5 years – 9,716
523,385 269,201
Note: The table above excludes pooled investments of $1,101.9 million (2015: $1,488.8 million).
The duration of underwriting assets is set with reference to the duration of the underlying liabilities. It should be noted that the liabilities are not currently discounted and therefore their value is not impacted by interest rate movements. Cash is raised, or the duration of the portfolio reduced, if it is believed that yields may rise and therefore capital values will fall.
The average durations of the bond and cash portfolios for the underwriting assets and associated insurance liabilities as at 31 December 2016 were as follows:
Underwriting assets/liabilities
31 December 2016 31 December 2015
Assets Years
Liabilities Years
Assets Years
Liabilities Years
Sterling 0.9 5.7 1.4 4.8
US dollar 0.1 2.5 0.6 1.8
Euro (0.5) 5.0 0.8 3.9
Note: The table above includes pooled vehicles. US dollars include New Zealand dollars, Australian dollars and Japanese yen.
The asset durations above are calculated by the custodian and are checked against those reported by the fund managers. Liabilities durations are calculated by the actuarial team.
An indication of the potential sensitivity of the value of the bond and cash funds to changes in yield is shown below.
Shift in yield (basis points)U/wtg
%
Net (reduction)/
increase in value
$’000
100 – 0.3
75 – 0.2
50 – 0.1
25 – 0.1
– 25 – (0.1)
– 50 – (0.1)
– 75 – (0.2)
– 100 – (0.3)
Note: The table above includes pooled vehicles.
Notes:1. The yield is the rate of return paid if a security is held to maturity. The calculation is based on the coupon rate, length of time to maturity and the market price. It assumes coupon
interest paid over the life of the security is reinvested at the same rate.2. The duration is the weighted average maturity of the security’s cash flows, where the present values of the cash flows serve as the weights.

MS Amlin AG 2016 Annual Report 35
Liquidity riskIt is important that the Company can pay its obligations as they fall due. Levels of cash are therefore managed on a daily basis and buffers of liquid assets are held in excess of the immediate requirements. This is to reduce the risk of being forced sellers of any of the Company’s assets, which may result in realising prices below fair value, especially in periods of below normal investment market liquidity.
The Company funds its insurance liabilities with a portfolio of cash and debt securities exposed to market risk. The following table indicates the contractual timing of cash flows arising from financial investments, as of 31 December 2016:
31 December 2016Financial assets
Contractual cash flows (undiscounted)
Carrying amount
$’000
No stated maturity
$’0000-1 yr$’000
1-3 yrs$’000
3-5 yrs$’000
>5 yrs$’000
Shares and other variable yield securities 379,235 – – – – 379,235
Debt and other fixed income securities 1,101,899 374,907 148,479 – – 1,625,285
Property funds 279,408 – – – – 279,408
Liquidity funds and other liquid investments 1,216,631 15,059 – – – 1,231,690
Total 2,977,173 389,966 148,479 – – 3,515,618
Insurance liabilities
Expected cash flows (undiscounted)
Carrying amount
$’000
No stated maturity
$’0000-1 yr$’000
1-3 yrs$’000
3-5 yrs$’000
>5 yrs$’000
Outstanding claims – 696,869 386,129 164,735 186,229 1,433,962
Less reinsurers’ share of outstanding claims – (23,735) (973) (1,674) – (26,382)
Total – 673,134 385,156 163,061 186,229 1,407,580
Difference in contractual cash flows 2,977,173 (283,168) (236,677) (163,061) (186,229) 2,108,038
31 December 2015Financial assets
Contractual cash flows (undiscounted)
Carrying amount
$’000
No stated maturity
$’0000-1 yr$’000
1-3 yrs$’000
3-5 yrs$’000
>5 yrs$’000
Shares and other variable yield securities 370,657 – – – – 370,657
Debt and other fixed income securities 1,488,811 202,900 56,585 – 9,716 1,758,012
Property funds 250,709 – – – – 250,709
Liquidity funds and other liquid investments 194,173 2,700 – – – 196,873
Total 2,304,350 205,600 56,585 – 9,716 2,576,251
Insurance liabilities
Expected cash flows (undiscounted)
Carrying amount
$’000
No stated maturity
$’0000-1 yr$’000
1-3 yrs$’000
3-5 yrs$’000
>5 yrs$’000
Outstanding claims – 588,519 387,736 80,972 173,734 1,230,961
Less reinsurers’ share of outstanding claims – (15,563) (16,868) – – (32,431)
Total – 572,956 370,868 80,972 173,734 1,198,530
Difference in contractual cash flows 2,304,350 (367,356) (314,283) (80,972) (164,018) 1,377,721
Liquidity, in the event of a major disaster, is tested regularly using internal cash flow forecasts and realistic disaster scenarios. If a major insurance event occurs the investment strategy is reviewed to ensure that sufficient liquidity is also available in the assets.
A breakdown of the current and non-current portions of the other non-derivative financial liabilities is available in notes 10(e) and 11(f).

MS Amlin AG 2016 Annual Report36
Notes to the financial statementsFor the year ended 31 December 2016 continued
10. Financial assets and liabilities continued
i) Market risk continuedCredit risk Credit risk is the risk that the Company becomes exposed to a loss if a specific counterparty fails to perform its contractual obligations in a timely manner, impacting the Company’s ability to meet its claims as they fall due. Credit risk can also arise from underlying causes that have an impact upon the creditworthiness of all counterparties of a particular description or geographical location. The Company’s credit risk is mitigated by the collateral received from counterparties, details of which are given in note 10(k). The Company is exposed to credit risk in its investment portfolio and with its premium and reinsurance receivables. The table below shows the breakdown at 31 December 2016 of the exposure of the bond portfolio, liquidity funds and reinsurance receivables by credit quality1.
31 December 2016
Debt securities1
$’000 %
Liquidity funds$’000 %
Insurance and
reinsurancereceivables2
$’000 %
Reinsurers’ share of
outstanding claims$’000 %
AAA 523,385 32.3 117,747 9.6 – – – –
AA 564,249 34.7 4,384 0.4 – – 2,032 7.7
A 334,879 20.6 1,109,559 90.0 – – 15,294 58.0
BBB 102,822 6.3 – – – – – –
Other 99,950 6.1 – – 901,211 100.0 9,056 34.3
1,625,285 100.0 1,231,690 100.0 901,211 100.0 26,382 100.0
31 December 2015
Debt securities1
$’000 %
Liquidity funds$’000 %
Insurance and
reinsurancereceivables
$’000 %
Reinsurers’ share of
outstanding claims$’000 %
AAA 260,765 14.9 158,079 80.3 – – – –
AA 751,306 42.7 34,506 17.5 – – 4,335 13.4
A 637,847 36.3 4,288 2.2 (4,992) (0.7) 3,413 10.5
BBB 480 – – – – – – –
Other 107,614 6.1 – – 724,357 100.7 24,683 76.1
1,758,012 100.0 196,873 100.0 719,365 100.0 32,431 100.0
Notes:1. Credit ratings on debt securities are State Street composite ratings based on Standard & Poor’s, Moody’s and Fitch, depending on which agency/agencies rate each bond.2. Other insurance and reinsurance receivables includes premium receivable from policyholders and intermediaries that are not rated.
i. Insurance and reinsuranceThe table includes premium receivables, representing amounts due from policyholders. The quality of these receivables is not graded, but based on historical experience there is limited default risk relating to these amounts. Premium credit risk is managed through a number of controls that include broker approval, annual financial review and internal rating of brokers and regular monitoring of premium settlement performance.
Also included are reinsurance receivables which represent the amounts due at 31 December 2016, as well as amounts expected to be recovered on unpaid outstanding claims (including IBNR) in respect of earned risks. These are stated net of provisions for impairment. The credit risk in respect of reinsurance receivables including reinsurers’ share of outstanding claims, is primarily managed by review and approval of reinsurance security by the Parent’s Reinsurance Security Committee, prior to the purchase of the reinsurance contract. Guidelines are set, and monitored, that restrict the purchase of reinsurance security based on the Parent’s own ratings for each reinsurer and Standard & Poor’s ratings. The Company holds collateral from certain reinsurers including those that are non-rated as security against potential default. The details of reinsurance collaterals held and placed with third party trust funds are provided in note 10(k). At 31 December 2016, the Company held collateral of $3.3 million (2015: $15.3 million). The impact on profit before tax of a 1% variation in reinsurance assets would be $0.3 million (2015: $0.3 million). The details of overdue reinsurance assets and insurance receivables are provided in notes 11(a) and 11(e).

MS Amlin AG 2016 Annual Report 37
ii. InvestmentsAs well as failure of a counterparty to perform its contractual obligations, the price of government and corporate bond holdings will be affected by investors’ perception of a borrower’s creditworthiness. Credit risk within the investment funds is managed through restrictions on the exposures by credit rating, as determined by the rating agencies, and by holding diversified portfolios. No bonds held at 31 December 2016 were subject to downgrades during the year (2015: nil).
The Company’s largest non-government counterparty as at 31 December 2016 has an A rating. The investment held with this counterparty was valued at $30.9 million (2015: $48.7 million) at 31 December 2016 and comprises $17.9 million of liquid funds (2015: $46.0 million), $4.8 million of equities (2015: $nil), and $8.2 million of corporate bonds (2015: $2.7 million).
j) Offsetting financial assets and financial liabilitiesThe majority of the Company’s derivative transactions with respect to currency forwards are subject to International Derivatives Swaps and Derivatives Association (ISDA) master netting agreements. Transactions under such agreements meet the criteria for offsetting in the Company’s statement of financial position. The Company’s listed futures are transacted under Global Principal Clearing agreements and are not subject to offsetting in the statement of financial position. In addition, the Company and its counterparties do not intend to settle on a net basis or to realise the assets and the liabilities simultaneously.
The disclosure provided in the tables below include derivatives that are set off in the Company’s statement of financial position.
Financial assets subject to offsetting, enforceable master netting arrangements and similar agreements
31 December 2016
Gross amounts of recognised financial assets
$’000
Gross amounts of recognised financial liabilities
set off in the statement of financial position
$’000
Net amounts of financial assets presented
in the statement of financial position
$’000
Derivative instruments held for trading 300,729 (289,147) 11,582
31 December 2015
Gross amounts of recognised financial assets
$’000
Gross amounts of recognised financial liabilities
set off in the statement of financial position
$’000
Net amounts of financial assets presented
in the statement of financial position
$’000
Derivative instruments held for trading 295,514 (292,864) 2,650
Financial liabilities subject to offsetting, enforceable master netting arrangements and similar agreements:
31 December 2016
Gross amounts of recognised financial assets
$’000
Gross amounts of recognised financial liabilities
set off in the statement of financial position
$’000
Net amounts of financial assets presented
in the statement of financial position
$’000
Derivative instruments held for trading 289,642 (289,147) 495
31 December 2015
Gross amounts of recognised financial assets
$’000
Gross amounts of recognised financial liabilities
set off in the statement of financial position
$’000
Net amounts of financial assets presented
in the statement of financial position
$’000
Derivative instruments held for trading 294,732 (292,864) 1,868

MS Amlin AG 2016 Annual Report38
Notes to the financial statementsFor the year ended 31 December 2016 continued
10. Financial assets and liabilities continued
k) Restricted funds held/placed by the CompanyAt 31 December 2016, the Company holds restricted funds in the form of letter of credit (LOC) collaterals, initial margin calls on derivative financial instruments, and collateral received from reinsurance counterparties.
Trust fundsAt 31 December 2016, cash and cash equivalents with a fair value of $40.8 million (2015: $nil) have been deposited in trust by the Company for the benefit of U.S. ceding companies. These funds are held in trust by a U.S. based bank.
LOC facilitiesAt 31 December 2016, $302.0 million (2015: $282.8 million) of assets are restricted for use by the Company. These assets are collateral for the LOC facilities drawn at the end of the year. Details are included in note 10(f).
Derivative margins and collateralDerivative instruments traded by the Company give rise to collateral being placed with, or received from, external counterparties. At 31 December 2016 included in other receivables is $9.0 million (2015: $0.3 million) margins and collateral pledged in relation to listed futures margins.
Reinsurance collateral receivedCollateral of GBP £341 million (2015: GBP £300 million) is held in third party trust funds by the Parent relating to the 2016 year retrocession programme which jointly protects Syndicate 2001 and the Company. Furthermore, collateral of $3.3 million (2015: $15.3 million) is held in a third party trust fund as a guarantee against reinsurance counterparties for the Company. At 31 December 2016 $3.3 million (2015: $15.1 million) of the funds are placed in trust by counterparties related to specific reinsurance assets.
Collateral held in third party trust funds is not recognised as assets pertaining to the Company but is available for immediate drawdown in the event of a default.
Funds withheld as premium/claim depositsAt 31 December 2016, the Company had net funds of $55.0 million (2015: $23.4 million) placed as claim deposits and net $25.5 million (2015: $12.9 million) premium deposits placed with/receivable from external brokers. These funds are held by external brokers. In addition a further $76.1 million (2015: $71.3 million) has been placed into pledged accounts to collateralise against losses due to reinsurance cedants.

MS Amlin AG 2016 Annual Report 39
11. Insurance liabilities and reinsurance assets
a) Net outstanding claims
Outstanding claims Note
2016 2015
Insurance liabilities
$’000
Reinsurers’ share$’000
Net liabilities$’000
Insurance liabilities
$’000
Reinsurers’ share$’000
Net liabilities$’000
At 1 January 1,230,961 32,431 1,198,530 1,192,816 43,603 1,149,213
Claims incurred during the current year 4(b) 813,953 4,611 809,342 660,794 14,599 646,195
Movements arising from prior year claims 4(b) 2,154 (4,478) 6,632 (14,893) (582) (14,311)
816,107 133 815,974 645,901 14,017 631,884
Acquisition through business combination 100,397 10,057 90,340 – – –
Claims paid during the year (555,289) (15,747) (539,542) (547,589) (21,732) (525,857)
Reinsurance to close (RITC) and commutations (110,718) – (110,718) – – –
Exchange adjustments (47,496) (492) (47,004) (60,167) (3,457) (56,710)
At 31 December 1,433,962 26,382 1,407,580 1,230,961 32,431 1,198,530
Further information on the calculation of outstanding claims and the risks associated with them is provided in the risk disclosures in notes 11(g) and 11(i).
During 2016 the whole account quota share for 2012 and 2013 was settled by a Reinsurance to Close transaction (RITC) and the outstanding insurance contract liabilities were settled for a payment of $110.7 million. There were no balances commuted in 2015.
Outstanding claims are further analysed between notified outstanding claims and incurred but not reported claims below:
Outstanding claims
2016 2015
Insurance liabilities
$’000
Reinsurers’ share$’000
Net liabilities$’000
Insurance liabilities
$’000
Reinsurers’ share$’000
Net liabilities$’000
Notified outstanding claims 765,025 19,558 745,467 706,698 23,574 683,124
Claims incurred but not reported 668,937 6,824 662,113 524,263 8,857 515,406
1,433,962 26,382 1,407,580 1,230,961 32,431 1,198,530
The current and non-current portions for outstanding claims are expected to be as follows:
Outstanding claims
2016 2015
Insurance liabilities
$’000
Reinsurers’ share$’000
Net liabilities$’000
Insurance liabilities
$’000
Reinsurers’ share$’000
Net liabilities$’000
Current portion 689,387 23,802 665,585 575,234 15,562 559,672
Non-current portion 744,575 2,580 741,995 655,727 16,869 638,858
1,433,962 26,382 1,407,580 1,230,961 32,431 1,198,530
The Company assesses its reinsurers’ share of outstanding claims for impairment on a quarterly basis by reviewing counterparty payment history and credit grades provided by rating agencies. The credit ratings of the Company’s reinsurers share of outstanding claims are shown in note 10(i).
As at 31 December, 2016 there were no reinsurance assets greater than three months overdue (2015: $nil) and no provision for impairment (2015: $nil). The Company holds collateral of $3.3 million (2015: $15.3 million) in relation to reinsurance assets. Details are included in note 10(k).

MS Amlin AG 2016 Annual Report40
Notes to the financial statementsFor the year ended 31 December 2016 continued
11. Insurance liabilities and reinsurance assets continued
b) Claims developmentThe tables below illustrate the development of the estimates of ultimate cumulative claims for the Company after the end of the underwriting year, illustrating how amounts estimated have changed from the first estimates made. Non-US dollar balances have been converted using 2016 exchange rates to aid comparability.
Underwriting yearGross basis
2007$’000
2008$’000
2009$’000
2010$’000
2011$’000
2012$’000
2013$’000
2014$’000
2015$’000
2016$’000
Current ultimate gross written premium 498,332 593,907 728,528 767,253 1,052,384 1,188,970 1,260,648 1,487,487 1,568,106 1,485,175
Current gross earned premium 498,332 593,907 728,528 767,253 1,052,129 1,187,329 1,256,674 1,461,033 1,396,022 928,217
Estimate of cumulative claims at end of underwriting year 201,205 382,435 272,491 407,300 662,493 576,172 621,398 756,402 750,055 862,460
One year later 164,759 326,105 253,423 708,701 647,143 492,907 639,823 722,304 794,226
Two years later 145,619 336,176 245,171 729,553 632,933 518,948 615,622 720,267
Three years later 144,821 331,671 237,199 713,474 640,145 523,389 613,118
Four years later 139,630 332,204 235,107 722,249 635,355 530,811
Five years later 146,351 330,321 234,577 717,286 631,135
Six years later 142,743 332,461 240,914 732,598
Seven years later 143,677 329,190 239,590
Eight years later 145,690 332,458
Nine years later 145,935
Cumulative payments 87,078 261,665 152,144 597,425 466,631 286,499 342,640 340,153 248,998 44,788
Estimated balance to pay 58,857 70,793 87,446 135,173 164,504 244,312 270,478 380,114 545,228 817,672
Underwriting year Net basis
2007$’000
2008$’000
2009$’000
2010$’000
2011$’000
2012$’000
2013$’000
2014$’000
2015$’000
2016$’000
Estimate of cumulative claims at end of underwriting year 201,205 382,435 272,491 407,300 623,605 557,625 592,174 738,140 741,854 862,224
One year later 164,759 326,105 253,423 659,933 610,411 477,148 609,704 705,440 768,072
Two years later 145,619 336,176 244,066 685,931 593,359 503,591 585,959 702,972
Three years later 144,821 331,671 236,195 670,169 602,258 507,064 584,564
Four years later 139,630 332,204 234,122 680,100 599,334 515,107
Five years later 146,351 330,321 233,655 673,100 595,119
Six years later 142,743 332,461 240,293 688,419
Seven years later 143,677 329,190 238,969
Eight years later 145,690 332,458
Nine years later 145,935
Cumulative payments 87,078 261,665 151,523 553,338 430,615 272,247 316,655 326,364 233,532 44,755
Estimated balance to pay 58,857 70,793 87,446 135,081 164,504 242,860 267,909 376,608 534,540 817,469
Total$’000
Net claims reserve (strengthen)/release (245) (3,268) 1,324 (15,319) 4,215 (8,043) 1,395 2,468 (26,218) (43,691)
The Company’s net aggregate reserve deterioration from prior years amounted to $6.6 million (2015: releases $14.3 million). In part, this arises from the Company’s reserving philosophy which aims to make the most recent years, with the greatest uncertainty of result, prudently reserved leaving a potential for subsequent release.
This differs from the $43.7 million deterioration in reserves stated in the claims development table above because:
• The table is on an underwriting year basis and the surpluses in this narrative are on an annually accounted basis.
• The table excludes any net aggregate reserves release from 2006 and prior years.

MS Amlin AG 2016 Annual Report 41
c) Net unearned premiumUnearned premiums are further analysed between earned and ceded premium below:
Unearned premium Note
2016 2015
Insurance liabilities
$’000
Reinsurers’ share$’000
Net liabilities$’000
Insurance liabilities
$’000
Reinsurers’ share$’000
Net liabilities$’000
At 1 January 738,237 5,325 732,912 548,588 5,590 542,998
Acquisition through business combination 47,531 837 46,694 – – –
Premiums written during the year 4(a) 1,362,589 83,653 1,278,936 1,437,964 104,073 1,333,891
Premiums earned during the year 4(a) (1,276,525) (86,530) (1,189,995) (1,220,263) (102,937) (1,117,326)
Exchange adjustments (2,332) 92 (2,424) (28,052) (1,401) (26,651)
At 31 December 869,500 3,377 866,123 738,237 5,325 732,912
The current and non-current portions for unearned premium reserves are expected to be as follows:
Unearned premium
2016 2015
Insurance liabilities
$’000
Reinsurers’ share$’000
Net liabilities$’000
Insurance liabilities
$’000
Reinsurers’ share$’000
Net liabilities$’000
Current portion 645,342 3,377 641,965 589,812 5,325 584,487
Non-current portion 224,158 – 224,158 148,425 – 148,425
869,500 3,377 866,123 738,237 5,325 732,912
d) Deferred acquisition costsThe reconciliation of opening and closing deferred acquisition costs is as follows:
Note2016$’000
2015$’000
At 1 January 155,783 99,361
Expenses for the acquisition of insurance contracts deferred during the year 6(a) 261,271 283,439
Amortisation 6(a) (234,663) (221,245)
Other movements 7,462 (5,772)
At 31 December 189,853 155,783
The current and non-current portions are expected to be as follows:
2016$’000
2015$’000
Current portion 133,998 113,865
Non-current portion 55,855 41,918
189,853 155,783

MS Amlin AG 2016 Annual Report42
Notes to the financial statementsFor the year ended 31 December 2016 continued
11. Insurance liabilities and reinsurance assets continued
e) Insurance and reinsurance receivables
2016$’000
2015$’000
Receivables arising from reinsurance contracts 901,211 719,365
The current and non-current portions are expected to be as follows:
2016$’000
2015$’000
Current portion 839,406 654,179
Non-current portion 61,805 65,186
901,211 719,365
Receivables arising from reinsurance contracts are comprised principally of amounts recoverable from reinsurers in respect of paid claims and premium receivables on inward reinsurance business, including reinstatement premium. The carrying amounts disclosed above are reasonably approximate to the fair value at the reporting date.
The Company assesses its insurance and reinsurance receivables for impairment on a quarterly basis by reviewing counterparty payment history and for circumstances which may give rise to a dispute or default, alongside credit grades provided by rating agencies. The credit ratings of the Company’s insurance and reinsurance receivables are shown in note 10(i).
At 31 December 2016 insurance and reinsurance receivables at a nominal value of $18.4 million (2015: $2.9 million) were greater than three months overdue and provided for on the basis of credit rating to the value of $89.5 million (2015: $nil).
The carrying amounts disclosed above are reasonably approximate to the fair value at the reporting date.
The ageing analysis of insurance and reinsurance receivables overdue, before impairment provision, is as follows:
2016$’000
2015$’000
Not overdue or less than 3 months 882,737 716,394
3 to 6 months 3,886 2,054
6 to 9 months 10,732 704
Greater than 9 months 3,765 119
901,120 719,271
Movements on the Company’s provision for impairment of receivables arising from contract holders and agents are as follows:
2016$’000
2015$’000
At 1 January 94 –
Increase in the provision – 94
Release of unused provision (3) –
At 31 December 91 94
f) Insurance and reinsurance payables
2016$’000
2015$’000
Insurance and reinsurance payables 153,605 139,546
Insurance and reinsurance payables are expected to be settled currently.
The carrying amounts disclosed above are reasonably approximate to the fair value at the reporting date.
Insurance payables are comprised principally of premium payable for reinsurance and claims payable.

MS Amlin AG 2016 Annual Report 43
g) Underwriting riskThe Company accepts underwriting risk in a range of classes of business. The bias of the Company’s portfolio is towards short-tail property and accident risk but liability coverage is also underwritten. The Company operates across regional and national boundaries to provide a global service.
In underwriting reinsurance policies the Company’s underwriters use their skill and knowledge to assess each risk. Exposure information and data on past claims experience is used to evaluate the likely claims cost and therefore the premium that should be sufficient (across a portfolio of risks) to cover claims costs, expenses, and to produce an acceptable profit. However, due to the nature of insurance risk, there is no guarantee that the premium charged will be sufficient to cover claim costs. This shortfall may originate either from insufficient premium being calculated and charged or may result from an unexpected, or unprecedented, high level of claims.
A number of controls are deployed to limit the amount of insurance exposure underwritten. Each year a business plan is prepared and agreed by the Board of Directors. The plan is used to monitor the amount of premium income, and exposure, to be written in total and for each class of business. Progress against this plan is monitored during the year.
Apart from the international motor liability portfolio, which has unlimited liability, all policies have a per loss limit which caps the size of any individual claim. For larger sum insured risks, facultative reinsurance coverage may be purchased. The Company operates line guides that determine the maximum liability per policy that can be written for each class (on a gross or net of facultative reinsurance basis) by each underwriter. These limits can be exceeded in exceptional circumstances with the approval of senior management.
The Company is also exposed to catastrophe losses which may impact many risks in a single event. Reinsurance is purchased to limit the impact of loss aggregation from such events. These reinsurance arrangements are described in note 11(h).
The insurance policies underwritten by the Company are reviewed on an individual risk, or contract, basis and through review of portfolio performance. Claims arising are reserved upon notification. Each quarter the entire portfolio of business is subject to a reserving process whereby levels of paid and outstanding (advised but not paid) claims are reviewed. Potential future claims are assessed with a provision for incurred but not reported (IBNR) claims being made. Whilst a detailed and disciplined exercise is carried out to provide for claims notified, it is possible that known claims could develop and exceed the reserves carried.
Furthermore, there is increased uncertainty in establishing an accurate provision for IBNR claims and there is a possibility that claims may arise which, in aggregate, exceed the reserve provision established. This is partly mitigated by the reserving policy adopted by the Company which is to carry reserves in excess of mean actuarial best estimate.
The review of claims arising may result in underwriters adjusting pricing levels to cater for an unexpectedly higher trend of claims advices or payments. However, this may not be possible in a competitive market and underwriters may respond either by accepting business with lower expected profit margins or declining to renew policies and thus reducing income. Also, there is a portfolio of risks already underwritten which cannot be re-priced until renewal at the end of the policy period.
The Company is exposed to the impact of large catastrophe events such as windstorms, earthquakes or terrorist incidents. Exposure to such events is controlled and measured through loss modelling. It is possible that a catastrophe event could exceed the maximum expected event loss. This is particularly the case for the direct property proportion of the loss exposure where models are used to calculate a damage factor representing the amount of damage expected to exposed aggregate insured values from a particular scenario. Errors, or incorrect assumptions, in the damage factor calculation can result in incurred catastrophe event claims higher, or lower, than predicted due to unforeseen circumstances, inadequacies in data, or shortcomings in the models used.
As explained in note 11(h), reinsurance is purchased to protect against the impact of any individual or series of severe catastrophes. However, the price and availability of such cover is variable and the amount of loss retained by the Company may therefore also increase or reduce. The Company will alter its insurance and reinsurance exposures to take account of the change in reinsurance availability and cost, capital levels and profitability in order to remain within the risk appetite guidelines.
Section A below describes the reinsurance portfolio written by the Company and the associated risks of such business. Section B summaries the business written within each group of reinsurance portfolios.
A. (i) PropertyCatastrophe reinsurance protects insurance companies against losses, such as windstorm or earthquake which may impact more than one risk written by the client. The catastrophe excess of loss portfolio is a key part of the reinsurance risk written by the Company.
These programmes are placed on a layered or excess of loss basis. Territorial exposures, from a number of programmes, are carefully recorded and analysed through loss simulations or realistic disaster scenarios but represent significant loss exposure to natural or man-made catastrophes.
Aggregate excess of loss programmes are also written providing protection in response to multiple loss events.

MS Amlin AG 2016 Annual Report44
Notes to the financial statementsFor the year ended 31 December 2016 continued
11. Insurance liabilities and reinsurance assets continued
g) Underwriting risk continuedPer risk property reinsurance is also written on an excess of loss basis but covers loss or damage to any single risk within the reinsured’s portfolio. This portfolio protects insureds against large individual property losses, and will also be affected by large catastrophe losses.
Proportional property reinsurance covers a proportionate share of a reinsured’s portfolio of business subject to payment of commission and/or profit commission. Proportional property business is normally written with an occurrence limit.
The Company’s portfolio of property reinsurance business is written with the aim of achieving territorial diversification. However, as experienced in 2011, a single or series of severe catastrophes to major economic zones in Europe, Japan, Australasia or the US is likely to result in a loss to the portfolio prior to retrocessional reinsurance. For each operating division, overall catastrophe loss limits are applied in relation to specific scenarios as an allocation of total Company tolerances.
A. (ii) CasualtyThe US casualty reinsurance account provides cover for reinsureds in respect of legal liability arising from insureds’ activities and actions or for incidents occurring on insureds’ properties. The portfolio is written on both an excess of loss and proportional basis but most underlying policies are on a claims notified basis (responding to all claims made during a defined period). The portfolio includes specialist general casualty, professional indemnity, medical malpractice and errors and omissions cover. Small amounts of directors’ and officers’ liability and automobile liability are also written.
US Workers Compensation Act /casualty clash excess of loss business may be impacted by large catastrophic events such as an earthquake.
International liability reinsurance business is mainly general third party liability protecting companies against significant public or products liability claims, written on a proportional or excess of loss basis. The liability account also includes some professional liability reinsurance.
The construction and engineering portfolio provides liability and property reinsurance cover for construction projects which may be of several years’ duration.
A. (iii) MotorMotor reinsurance is written on a proportional and excess of loss basis. This portfolio is at risk from increases in frequency or severity of motor accident claims and bodily injury or third party property claims payments which may take several years to settle. Unlimited and limited motor business is written. Whilst the original premium and the investment income generated are expected to be more than sufficient to meet such claims, there is no guarantee that this will be the case, particularly due to inflation or superimposed inflation resulting from changes to court awards. The aim is to diversify the portfolio across several territories in order to reduce the impact of a single legal jurisdiction revising its claims policy.
A. (iv) Personal accidentPersonal accident reinsurance is written on a worldwide basis. Such business could be impacted by a single or series of accidents due to high value insured individuals or from a multiple death and injury event, such as an air crash or natural catastrophe.
A. (v) MarineThe Company’s portfolio of marine excess of loss reinsurance protects insurers against losses to their direct portfolios of business on a worldwide basis. This will include offshore energy business, specie and other static risks written in reinsured companies’ marine portfolios. The marine account, in particular, is exposed to catastrophe losses as well as large individual risk losses.
A. (vi) Special risksThe special risks reinsurance account is predominantly made up of terrorism excess of loss and nuclear reinsurance emanating from all parts of the world and is written without specific excess of loss reinsurance protection. The portfolio also includes short-term trade credit and contingency business as well as trade credit reinsurance which protect reinsureds against the non-payment of monies or goods or services due from trade partners locally or overseas. Mortgage Indemnity business is also written in the special risk account.

MS Amlin AG 2016 Annual Report 45
B. Business written and, maximum and average line sizes The table below summarises the business written, in both gross written premium and line size, across the reinsurance portfolios of the Company.
The following points apply to the table:
• The Bermuda branch gross written premiums do not include business ceded by the Parent’s subsidiaries discussed in note 18.
• Gross written premium is stated gross of acquisition costs and excludes adjustments in respect of prior periods.
At 31 December 2016
BermudaGross written
premium$million
ZurichGross written
premium$million
BermudaMaximum
line size$million
ZurichMaximum
line size$million
BermudaAverage line size$million
ZurichAverage line size$million
(i) Property – reinsurance
Catastrophe reinsurance (per programme) 228 48 75 38 8 6
Per risk property reinsurance (per programme) 44 24 26 32 3 3
Proportional reinsurance 167 90 30 38 3 3
Engineering – 62 – 26 – 5
(ii) Casualty – reinsurance
Casualty 138 66 15 – 2 –
Liability – – – 26 – 2
(iii) Motor – reinsurance
Motor – 143 – Unlimited – Unlimited
(vi) Personal accident – reinsurance
Accident and Health 3 – – – – –
Personal accident – 11 15 26 5 2
(v) Marine – reinsurance
Marine (per programme) 2 11 75 26 14 2
(vi) Special risks – reinsurance
Special risks 114 11 26 32 9 6
Surety – 3 – 3 – 2
Total treaty reinsurance 696 469
At 31 December 2015
BermudaGross written
premium$’000
ZurichGross written
premium$’000
BermudaMaximum
line size$’000
ZurichMaximum
line size$’000
BermudaAverage line size
$’000
ZurichAverage line size
$’000
(i) Property – reinsurance
Catastrophe reinsurance (per programme) 227 47 75 38 8 5
Per risk property reinsurance (per programme) 54 21 26 32 3 3
Proportional reinsurance 182 96 30 38 2 3
Engineering – 54 – 26 – 5
(ii) Casualty – reinsurance
Casualty 69 – 15 – 2 –
Liability – 38 – 26 – 2
(iii) Motor – reinsurance
Motor – 93 – Unlimited – Unlimited
(vi) Personal accident – reinsurance
Personal accident – 5 15 26 5 2
(v) Marine – reinsurance
Marine (per programme) 3 9 75 26 9 2
(vi) Special risks – reinsurance
Special risks 143 8 26 32 8 5
Surety – 2 – 3 – 2
Total treaty reinsurance 678 373

MS Amlin AG 2016 Annual Report46
Notes to the financial statementsFor the year ended 31 December 2016 continued
11. Insurance liabilities and reinsurance assets continued
h) Reinsurance and other risk mitigation arrangementsThe Company purchases proportional and excess of loss reinsurances to protect its portfolio from severe frequency or size of losses. The structure of these programmes and type of protection sought will vary from year to year depending on the availability and price of cover. The Company also purchases proportional reinsurance to supplement line size and to reduce exposure on individual risks.
The combined claims from several policies which may aggregate in a single catastrophe event are protected by catastrophe cover.
A separate retrocessional excess of loss programme is purchased by the Parent to protect the excess of loss reinsurance portfolio written by the Company against catastrophe events. With effect from 1 January 2017, the programme deductible for all territories and perils is $50.0 million for first and second losses (other than Florida which is protected excess of $75.0 million and the UK and Europe which are protected excess of $100.0 million). Aggregate protection has been renewed to provide lower level cover in the event of multiple losses to the portfolio.
Excess of loss protection is also purchased to protect the motor treaty reinsurance account.
In July 2013, the Company acquired coverage for US and Canadian earthquake perils of up to $75.0 million from a Bermudian special purpose insurer, Tramline Re II Ltd, which in turn placed a catastrophe bond into the capital markets. This transaction provides the Company with fully collateralised protection over a four year period from 1 July 2013 and is in addition to the protection the Company purchases through the traditional reinsurance marketplace. The bond provides protection against a remote catastrophic event for the Company.
In December 2014, the Company acquired coverage for US hurricane, US earthquake and European windstorm perils of up to $200.0 million from Tramline Re II Ltd, which in turn placed a second catastrophe bond into the capital markets. This transaction replaces the coverage provided by Tramline Re Ltd (which expired on 31 December 2014) and provides the Company with fully collateralised protection over a four year period from 1 January 2015. This is in addition to the protection the Company purchases through the traditional reinsurance marketplace. The bond provides significant protection against remote but substantial catastrophe events for the Company.
There is no guarantee that reinsurance coverage will be available to meet all potential loss circumstances as, for very severe catastrophe losses, it is possible that the full extent of the cover bought is not sufficient. Any loss amount which exceeds the programme would be retained by the Company. It is also possible that a dispute could arise with a reinsurer which reduces the recovery made. The reinsurance programme is bought to cover the expected claims arising on the original portfolio. However, it is possible for there to be a mismatch, or a gap in cover, which would result in a higher than expected retained loss.
Many parts of the programme also have limited reinstatements and therefore the number of claims which may be recovered from second or subsequent major losses is limited. It is possible for the reinsurance programme to be exhausted by a series of losses in one annual period and it may not be possible to purchase additional reinsurance at all or for an acceptable price. This would result in the Company bearing higher losses from further events occurring. It should also be noted that the renewal date of the reinsurance programmes does not necessarily correspond to that of the business written. Where business is not protected by risk attaching reinsurance (which provides coverage for the duration of all the policies written) this reinsurance protection could expire resulting in an increase in possible loss retained by the Company if renewal of the programme is not achieved.
Realistic Disaster Scenario (RDS) analysisThe Company has a defined event risk tolerance which determines the maximum net loss that the Company intends to limit its exposure with respect to major modelled catastrophe event scenarios. Currently, these are $449 million for US windstorm multi-zone, $375 million for European Windstorm, and $244 million for US Earthquake.
These scenarios are extraordinary events – with an occurrence probability of less than 1 in 100 years estimated for the natural peril or elemental losses. The risk tolerance policy recognises that there may be circumstances in which the net event limit could be exceeded. Such circumstances include changes in rates of exchange, non-renewal or delay in renewal of reinsurance protection, reinsurance security failure, or regulatory and legal requirements which increase original claims levels.
A detailed analysis of catastrophe exposures is carried out every quarter and measured against risk tolerance. The following assumptions and procedures are used in the process:
• The data used reflects the information supplied to the Company by insureds and ceding companies. This may prove to be incomplete, inaccurate or could develop during the policy period;
• The exposures are modelled using a mixture of stochastic models and underwriter input to arrive at ‘damage factors’ – these factors are then applied to the assumed aggregate exposure to produce gross loss estimates. The damage factors may prove to be inadequate;
• The reinsurance programme, as purchased, is applied – a provision for reinsurer counterparty failure is included but may prove to be inadequate; and
• Reinstatement premiums both payable and receivable are included.

MS Amlin AG 2016 Annual Report 47
There is no guarantee that the assumptions and techniques deployed in calculating these event loss estimate figures are accurate.
Furthermore there could also be a loss which exceeds these figures. The likelihood of such a catastrophe is considered to be remote, but the most severe scenarios modelled are simulated events and these simulations could prove to be unreliable.
i) Claims reserving and IBNRInsurance liabilities and reinsurance assets: Calculation of incurred but not reported (IBNR) and claims developmentThe Company adopts a rigorous process in the calculation of an adequate provision for insurance claim liabilities. The overriding aim is to establish reserves which are expected to be at least adequate and that there is consistency from year to year. Therefore, the reserves are set at a level above the mean actuarial ‘best estimate’ position. However, there is a risk that, due to unforeseen circumstances, the reserves carried are not sufficient to meet insurance claim liabilities reported in future years on policy periods which have expired.
Process and methodologyThe reserving process commences with the proper recording and reporting of claims information which consists of booked premiums and paid and notified or outstanding claims. Information on claims is received directly from brokers and policyholders. Claims records are maintained for each policy and class. For outstanding claims, a case reserve is established based on the views of underwriting management and claims managers. This reserve is expected to be sufficient to meet the claim payment when it is finally determined. For some classes of business, particularly liability business, settlement may be several years after the initial notification of the claim.
To assist with the process of determining the reserves triangulation statistics for each class are produced which show the historical development of booked premium, as well as paid and incurred losses, for each underwriting year. In all cases, the different potential development of each class of business is fully recognised. The development period varies by class, by method of acceptance and is also determined by the deductible of each policy written. For casualty business, the policy form will determine whether claims can be made on a claims made (as advised) or as a losses occurring (determined by date of loss) basis. This has a significant impact on the reporting period in which claims can be notified.
IBNRTo establish a provision for IBNR claims, the actuarial teams use their experience and knowledge of the classes of business to estimate the potential future development of the incurred claims for each class for every underwriting year. This is known as the “best estimate”. In setting the IBNR provision, estimates are made for the ultimate premium and ultimate gross claims value for each underwriting year. Allowance is then made for anticipated reinsurance recoveries to reach a net claim position. Reinsurance recoveries are calculated for outstanding and IBNR claims, sometimes through the use of historical recovery rates or statistical projections, and provisions are made as appropriate for bad debt or possible disputes. The component of ultimate IBNR provision estimates and reinsurance recoveries that relates to future events occurring to the existing portfolio is removed in order to reflect generally accepted accounting practice.
Meetings are initially held in which underwriters and actuaries discuss the initial proposed estimates and revise them if it is felt necessary. At the next round of meetings, local management discuss reserving issues with the actuaries and underwriters and challenges the proposed estimates. At this meeting, local management proposes the ‘margin’ for risk to be added to the best estimate, assisted by diagnostics produced from the internal model. The margin is proposed on a net of reinsurance basis only. Further meetings are then held at which further review and challenge is provided, led by the Parent’s risk function.
Areas of uncertaintyThe reserves established can be more or less than adequate to meet eventual claims arising. The level of uncertainty varies significantly from class to class but can arise from inadequate case reserves for known large losses and catastrophes, or from inadequate provision for IBNR claims. The impact on profit before tax of a 1% improvement/deterioration in the total net claims reserves would be $14.1 million gain/loss (2015: $12.0 million).
Property catastrophe claims, such as earthquake or hurricane losses can take several months, or years, to develop as adjusters visit damaged property and agree claim valuations. Until all the claims are settled it requires an analysis of the area damaged, contracts exposed and the use of models to simulate the losses against the portfolio of exposure in order to arrive at an estimate of the ultimate loss to the Company. There is uncertainty over the adequacy of information and modelling of major losses for a period that can range from several months to a number of years after a catastrophe loss. Account should also be taken of factors which may influence the size of claims such as increased inflation or a change in law.
The long tail liability classes represent the most difficult classes to project because often claims are notified and settled several years after the expiry of the policy concerned. This is particularly the case for liability business written on a losses occurring basis. The use of historical development data is fundamental to reserving these classes.
The allocation of IBNR to the reinsurance programme is an uncertain exercise as there is limited knowledge of the size or number of future claims advices. The assumption over future reinsurance recoveries may be incorrect and unforeseen disputes could arise which would reduce recoveries made.

MS Amlin AG 2016 Annual Report48
Notes to the financial statementsFor the year ended 31 December 2016 continued
12. Property and equipment
NoteMotor vehicles
$’000
Computer equipment
$’000
Fixtures, fittings and
leasehold improvements
$’000Total$’000
Cost
At 1 January 2016 – 5,337 3,898 9,235
Acquisitions through business combination 341 1,107 730 2,178
Additions – 149 1,964 2,113
Foreign exchange gains – (18) (121) (139)
At 31 December 2016 341 6,575 6,471 13,387
Accumulated depreciation
At 1 January 2016 – 4,949 3,364 8,313
Acquisitions through business combination 163 390 639 1,192
Charge for the year 6(f) – 236 635 871
Foreign exchange losses – (18) (63) (81)
At 31 December 2016 163 5,557 4,575 10,295
Net book value
At 31 December 2016 178 1,018 1,896 3,092
At 1 January 2016 – 388 534 922
NoteMotor vehicles
$’000
Computer equipment
$’000
Fixtures, fittings and
leasehold improvements
$’000Total
$’000
Cost
At 1 January 2015 – 5,135 4,033 9,168
Additions – 264 53 317
Foreign exchange gains – (62) (188) (250)
At 31 December 2015 – 5,337 3,898 9,235
Accumulated depreciation
At 1 January 2015 – 4,735 2,770 7,505
Charge for the year 6(f) – 258 732 990
Foreign exchange losses – (44) (138) (182)
At 31 December 2015 – 4,949 3,364 8,313
Net book value
At 31 December 2015 – 388 534 922
At 1 January 2015 – 400 1,263 1,663
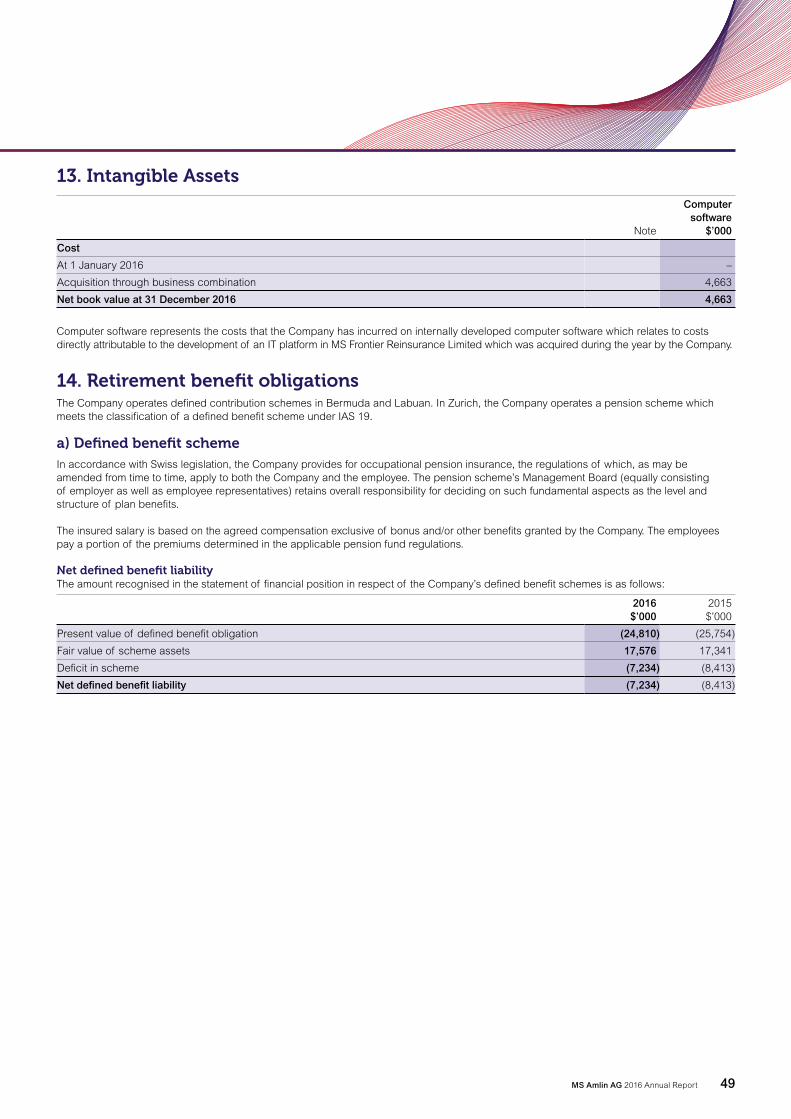
MS Amlin AG 2016 Annual Report 49
13. Intangible Assets
Note
Computer software
$’000
Cost
At 1 January 2016 –
Acquisition through business combination 4,663
Net book value at 31 December 2016 4,663
Computer software represents the costs that the Company has incurred on internally developed computer software which relates to costs directly attributable to the development of an IT platform in MS Frontier Reinsurance Limited which was acquired during the year by the Company.
14. Retirement benefit obligations The Company operates defined contribution schemes in Bermuda and Labuan. In Zurich, the Company operates a pension scheme which meets the classification of a defined benefit scheme under IAS 19.
a) Defined benefit schemeIn accordance with Swiss legislation, the Company provides for occupational pension insurance, the regulations of which, as may be amended from time to time, apply to both the Company and the employee. The pension scheme’s Management Board (equally consisting of employer as well as employee representatives) retains overall responsibility for deciding on such fundamental aspects as the level and structure of plan benefits.
The insured salary is based on the agreed compensation exclusive of bonus and/or other benefits granted by the Company. The employees pay a portion of the premiums determined in the applicable pension fund regulations.
Net defined benefit liabilityThe amount recognised in the statement of financial position in respect of the Company’s defined benefit schemes is as follows:
2016$’000
2015$’000
Present value of defined benefit obligation (24,810) (25,754)
Fair value of scheme assets 17,576 17,341
Deficit in scheme (7,234) (8,413)
Net defined benefit liability (7,234) (8,413)

MS Amlin AG 2016 Annual Report50
Notes to the financial statementsFor the year ended 31 December 2016 continued
14. Retirement benefit obligations continued
a) Defined benefit scheme continuedThe movement in the net defined benefit liability is as follows:
Present value of obligation
$’000
Fair value of scheme
assets$’000
Net defined benefit liability
$’000
At 1 January 2016 (25,754) 17,341 (8,413)
Interest (expense)/income (192) 136 (56)
Current service cost (1,866) – (1,866)
Past service cost – – –
Administration expenses 41 (41) –
(Charged)/credited to statement of profit or loss (2,017) 95 (1,922)
Re-measurements:
Actuarial gains and losses arising from :
– changes in financial assumptions 153 – 153
– other actuarial gains/(losses) 570 – 570
Return on plan assets, excluding amounts included in interest (expense)/income – 18 18
Charged to statement of other comprehensive income 1,665 18 1,683
Exchange differences 367 (335) 32
Participant contributions (667) 667 –
Benefits paid 1,596 (1,596) –
Employer contributions – 1,386 1,386
At 31 December 2016 (24,810) 17,576 (7,234)
Present value of obligation
$’000
Fair value of scheme
assets$’000
Net defined benefit liability
$’000
At 1 January 2015 (21,531) 14,170 (7,361)
Interest (expense)/income (221) 154 (67)
Current service cost (1,699) – (1,699)
Past service cost 1,502 – 1,502
Administration expenses 42 (42) –
(Charged)/credited to statement of profit or loss (376) 112 (264)
Re-measurements:
Actuarial gains and losses arising from :
– changes in financial assumptions (885) – (885)
– other actuarial gains/(losses) (1,438) – (1,438)
Return on plan assets, excluding amounts included in interest (expense)/income – 54 54
Charged to statement of other comprehensive income (2,323) 54 (2,269)
Exchange differences 74 80 154
Participant contributions (633) 633 –
Benefits paid (965) 965 –
Employer contributions – 1,327 1,327
At 31 December 2015 (25,754) 17,341 (8,413)
Funding arrangements Funding arrangements are in accordance with the related insurance arrangements and regulations described above.

MS Amlin AG 2016 Annual Report 51
Risks to which the Company is exposed through its defined benefit schemesThe defined benefit scheme exposes the Company to the following risks:
• Changes in bond yields – The discount rate used in calculating the present value of the defined benefit obligation is based upon the yield of high quality debt instruments issued by blue chip companies, with maturities consistent with those of the defined benefit obligations. A decrease in bond yields is likely to increase the defined benefit obligation.
• Inflation risk – The defined benefit obligation is linked to inflation and therefore should the inflation rate increase, there will be an increase in the plan obligation.
• Life expectancy – The present value of the defined benefit obligation is calculated based on certain mortality assumptions as stated below. An increase in the life expectancy of the plan participants will result in an increase in the defined benefit obligation.
• Risk of insurer default – if the insurer is unable to meet its obligations, or if the contract is cancelled by either party; it will fall to the Company to provide the benefits to members in accordance with the relevant scheme assets.
Significant actuarial assumptionsThe significant actuarial assumptions used as at 31 December 2016 and 2015 were:
2016%pa
2015%pa
Discount rate for pension benefits 0.8 0.8
Price inflation – Consumer Price Index (CPI) 1.0 1.3
Expected salary increases – general 2.0 2.3
The mortality assumptions used in the 31 December 2016 and 2015 valuation included the following life expectancies:
Life expectancy (years) at age 60 for a member currently:
2016 2015
Male Female Male Female
Aged 60 27.2 29.5 26.5 29.1
Aged 45 28.7 30.9 27.8 30.4
Significant actuarial assumptions – sensitivitiesThe table below shows the impact on the defined benefit obligation that a change in certain key assumptions would have:
Assumption change2016$’000
2015$’000
(Increase)/decrease in discount rate by 0.25% 0.7/(0.8) (0.8)/1.0
(Decrease)/increase in inflation rate by 0.25% (0.1)/0.1 (0.2)/0.3
(Decrease)/increase in life expectancy by one year (0.4)/(0.4) (0.4)/(0.4)
The above sensitivities of the significant actuarial assumptions have been calculated by changing each assumption in turn whilst all remaining assumptions are held constant. The limitation of this sensitivity analysis is that in practice assumptions may be correlated and therefore are unlikely to change in isolation.
Analysis of scheme assetsThe analysis of the scheme assets by asset class are not provided as the investment decisions are at the discretion of the third parties to whom the Company has ceded investment risk under the insurance policies taken out to meet their obligations.
Maturity profile of the defined benefit obligationsThe weighted average duration of the defined benefit obligation is 18.0 years (2015: 18.0 years).

MS Amlin AG 2016 Annual Report52
Notes to the financial statementsFor the year ended 31 December 2016 continued
14. Retirement benefit obligations continued
a) Defined benefit scheme continuedThe expected maturity analysis of the undiscounted pension benefits is as follows:
2016$’000
2015$’000
Less than a year 1,036 1,022
Between 1-2 years 1,044 1,044
Between 2-5 years 3,276 3,197
Over 5 years 53,000 58,978
Total 58,356 64,241
Expected contributionsThe effect of the defined benefit plans on the Company’s future cash flows as a result of the expected contributions for the year ending 31 December 2017 are as follows:
2016$’000
2015$’000
Contributions from the Company 1,248 1,363
Contributions from plan participants 583 631
Total contributions to the schemes 1,831 1,994
b) Stakeholder defined contribution schemesThe defined contribution scheme operated by the Company is a stakeholder arrangement. The total contributions to the schemes for the year ended 31 December 2016 are $0.8 million (2015: $0.8 million).
15. Capital and reserves
a) Share capital
2016Number
2016$’000
2015Number
2015$’000
Authorised and issued share capital
At 1 January issued shares of CHF1 each. 10,000,000 10,204 10,000,000 10,204
Ordinary shares of 1 CHF each issues in the year 1 – – –
At 31 December issued shares of CHF1 each. 10,000,001 10,204 10,000,000 10,204
The Company issued 1 share on 31 December 2016 for $486.4 million for the acquisition of MSFR.

MS Amlin AG 2016 Annual Report 53
b) Other reservesAll items of other comprehensive income in 2016 and 2015 are charged to ‘Other reserves’. Other reserves are as follows:
2016$’000
2015$’000
Defined benefit reserve (7,687) (9,370)
Foreign operations translation reserve (18,302) (15,004)
Employee share option reserve 4,813 3,925
Capital reserve 142,857 142,857
Merger reserve 58,223 –
Tax relating to other reserves 1,556 1,912
181,460 124,320
The nature and purpose of each reserve within equity is shown below:
Reserve Nature and purpose
Defined benefit reserve Records remeasurements of defined benefit plans which includes actuarial gains and losses arising from experience adjustments and changes in actuarial assumptions, the return on plan assets (excluding net interest) and the effect of the asset ceiling, where appropriate.
Foreign operations translation reserve Records all foreign currency differences arising from the translation of the net investment in foreign operations.
Employee share option reserve Records the equity settled share based payment plans
Capital reserve Records the reserve amount of CHF 140.0 million (2015: CHF 140.0 million) which the company has agreed with FINMA will not be distributed or reduced.
Merger reserve Records the amounts arising on consolidating acquisitions under merger accounting principles for businesses under common control
Tax relating to other reserves Records tax component relating to the other reserves above
16. Contingent liabilitiesThe Company has no material contingent liabilities at 31 December 2016 (2015: $nil).
17. Commitments
a) Capital commitmentsThe Company has made a commitment to subscribe to property funds at 31 December 2016 of $14.5 million (2015: $nil) in the normal course of investment activities.
b) Operating lease commitmentsThe Company leases various offices, as a lessee, under operating lease agreements. The Company is required to give notice for the termination of these agreements. The lease expenditure charged to the statement of profit or loss during the year is $0.8 million (2015: $0.9 million), as disclosed in note 6(f).
The future aggregate minimum lease payments under the non-cancellable portion of the Group’s operating leases are as follows:
2016$’000
2015$’000
No later than 1 year 2,843 1,481
Later than 1 year and no later than 5 years 8,672 2,326
11,515 3,807

MS Amlin AG 2016 Annual Report54
18. Related party transactions The following transactions were carried out with related parties:
a) Transactions and balances with related partiesi) Funds managed by Leadenhall Capital Partners LLPLeadenhall Capital Partners LLP (LCP), a partnership controlled by MS Amlin Corporate Services Ltd. which is a related MS Amlin plc Group company, is an investment fund manager wholly focused on managing insurance linked investment portfolios for institutional investors. The total funds under management at 31 December 2016 were $99.9 million (2015: $101.8 million).
ii) Transactions by the Funds managed by Leadenhall Capital Partners LLPAt 31 December 2016, funds managed by LCP held $12.8 million (2015: $10.4 million) of the catastrophe bonds issued by Tramline Re II Ltd.
Details of the Company’s transactions with Tramline Re II Ltd can be found in note 11(h).
The Company participates in fronting arrangements whereby they write inwards reinsurance contracts which are 100% reinsured by Horseshoe Re Limited on behalf of its segregated accounts. Funds managed by LCP have invested within these segregated accounts. During the year, the Company wrote $0.1 million (2015: $1.9 million) of gross premium and received $0.1 million (2015: $0.5 million) of commission through this arrangement. At 31 December 2016, $0.1 million (2015: $3.5 million) was net payable (2015: net receivable) to Horseshoe Re, of which $1.3 million (2015: $4.6 million) was reinsurers’ share of insurance liabilities, and $1.4 million (2015: $1.1) was reinsurance payables.
iii) Reinsurance contractsDuring 2016 and 2015, there were a number of reinsurance arrangements entered into in the normal course of trade with various subsidiaries of the Parent. The amount of net written premium from these contracts during the year ended 31 December 2016 was $335.9 million (2015: $391.4 million). The Company recorded a profit before tax of $45.8 million (2015: $104.7 million) on these reinsurance contracts.
At 31 December balances included in these financial statements with respect to these reinsurance contracts include:
2016$’000
2015$’000
Insurance receivables 251,266 254,289
Outstanding claims (318,096) (341,501)
Insurance and reinsurance payables (110,024) (114,659)
As discussed in note 11(h), in 2013 and 2015 the Company acquired coverage of up to $275.0 million (2015: $275.0 million) for certain catastrophe losses. From 1 January 2016, the Company has provided protection to Syndicate 2001 for $160.4 million (2015 $160.4 million) for the same catastrophe risks.
iv) OtherDuring the year, the Company was charged $35.6 million (2015: $26.7 million) for services provided by Amlin Corporate Services Limited (ACS). These services were purchased at cost. At 31 December 2016 $13.7 million (2015: $2.0 million) was payable in relation to these services. In December 2016, a number of initial margin calls in relation to derivative positions were triggered. At 31 December 2016, an amount of $10.4 million was payable to the Parent (2015: $5.2 million receivable by the Company).
As discussed in note 10(h), the Company’s exposure to asset classes is achieved using physical and derivative instruments. The derivative strategy is managed through collateral and other agreements with the Parent. The collateral and unrealised losses as of 31 December 2016 amounted to $1.2 (2015: $1.7) and $9.0 million (2015: $0.3 million), respectively. The collateral is included in other receivables and the unrealised loss is included in other payables.
As discussed in note 10(d), in December 2011 the Company entered into an unsecured loan facility of $161.0 million with the Parent.
b) Compensation of key management personnelKey management personnel are those Directors and senior managers responsible for planning and control of the activities of the Company. Key management comprises 5 Executive Directors and employees and 5 Non-Executive Directors (2015: three and three, respectively). Compensation during the year to key management personnel amounted to $7.6 million (2015: $4.8 million) all of which is short term employee benefits.
19. Events after the reporting periodNo significant events have been identified between the date of the statement of financial position and the date on which the financial statements were authorised.
Notes to the financial statementsFor the year ended 31 December 2016 continued

MS Amlin AG 2016 Annual Report 55
Designed and produced by Gather www.gather.london

www.msamlin.com