mrsks - rab revised, privatizations ahead · mrsks rab revised, privatizations ahead after the...
TRANSCRIPT
In accordance with US SEC Regulation AC, important US regulatory disclosures and analyst certification can be found on the last page of this report.
research@sberbank�cib.ru, www.sberbank�cib.ru
INVESTMENT RESEARCHRUSSIA | UTILITIES
NOVEMBER 2012
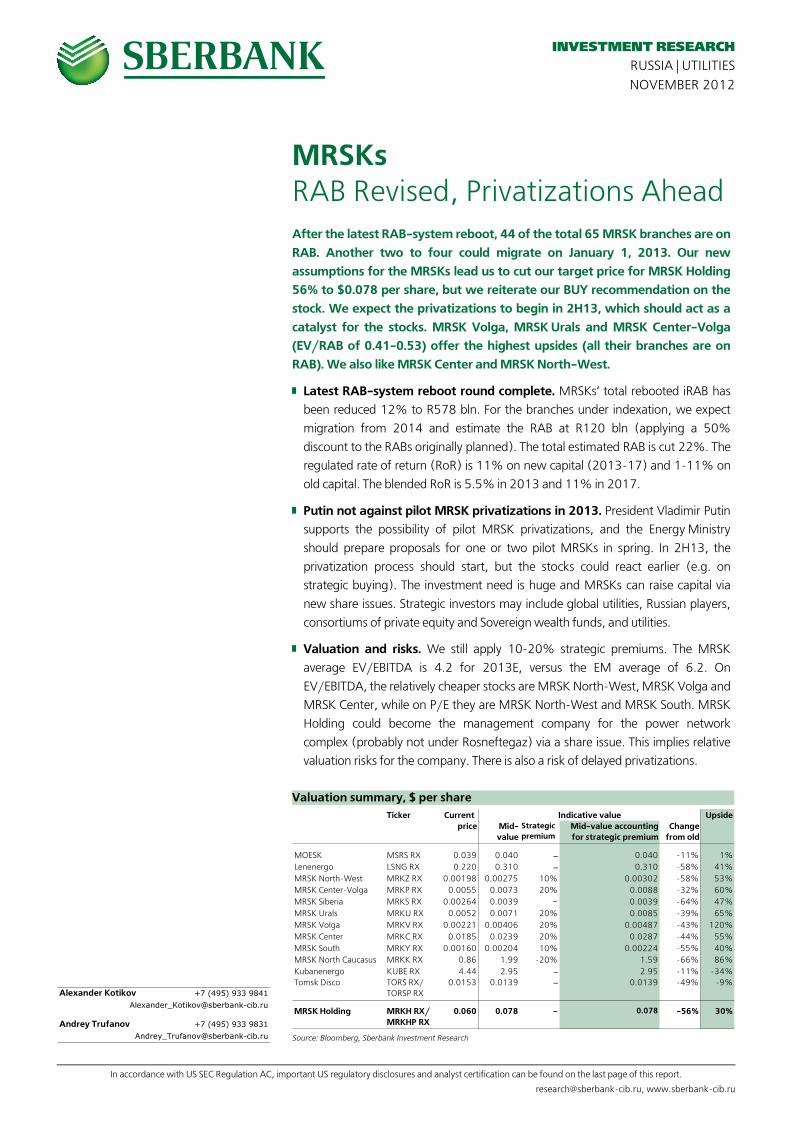
MRSKsRAB Revised, Privatizations AheadAfter the latest RAB�system reboot, 44 of the total 65 MRSK branches are on RAB. Another two to four could migrate on January 1, 2013. Our new assumptions for the MRSKs lead us to cut our target price for MRSK Holding 56% to $0.078 per share, but we reiterate our BUY recommendation on the stock. We expect the privatizations to begin in 2H13, which should act as a catalyst for the stocks. MRSK Volga, MRSK Urals and MRSK Center�Volga (EV/RAB of 0.41�0.53) offer the highest upsides (all their branches are on RAB). We also like MRSK Center and MRSK North�West.
█ Latest RAB�system reboot round complete. MRSKs’ total rebooted iRAB has
been reduced 12% to R578 bln. For the branches under indexation, we expect
migration from 2014 and estimate the RAB at R120 bln (applying a 50%
discount to the RABs originally planned). The total estimated RAB is cut 22%. The
regulated rate of return (RoR) is 11% on new capital (2013�17) and 1�11% on
old capital. The blended RoR is 5.5% in 2013 and 11% in 2017.
█ Putin not against pilot MRSK privatizations in 2013. President Vladimir Putin
supports the possibility of pilot MRSK privatizations, and the Energy Ministry
should prepare proposals for one or two pilot MRSKs in spring. In 2H13, the
privatization process should start, but the stocks could react earlier (e.g. on
strategic buying). The investment need is huge and MRSKs can raise capital via
new share issues. Strategic investors may include global utilities, Russian players,
consortiums of private equity and Sovereign wealth funds, and utilities.
█ Valuation and risks. We still apply 10�20% strategic premiums. The MRSK
average EV/EBITDA is 4.2 for 2013E, versus the EM average of 6.2. On
EV/EBITDA, the relatively cheaper stocks are MRSK North�West, MRSK Volga and
MRSK Center, while on P/E they are MRSK North�West and MRSK South. MRSK
Holding could become the management company for the power network
complex (probably not under Rosneftegaz) via a share issue. This implies relative
valuation risks for the company. There is also a risk of delayed privatizations.
Valuation summary, $ per share
Ticker Current Upsideprice Mid�
value Strategic premium
Mid�value accounting for strategic premium
Change from old
MOESK MSRS RX 0.039 0.040 – 0.040 �11% 1%Lenenergo LSNG RX 0.220 0.310 – 0.310 �58% 41%MRSK North�West MRKZ RX 0.00198 0.00275 10% 0.00302 �58% 53%MRSK Center�Volga MRKP RX 0.0055 0.0073 20% 0.0088 �32% 60%MRSK Siberia MRKS RX 0.00264 0.0039 – 0.0039 �64% 47%MRSK Urals MRKU RX 0.0052 0.0071 20% 0.0085 �39% 65%MRSK Volga MRKV RX 0.00221 0.00406 20% 0.00487 �43% 120%MRSK Center MRKC RX 0.0185 0.0239 20% 0.0287 �44% 55%MRSK South MRKY RX 0.00160 0.00204 10% 0.00224 �55% 40%MRSK North Caucasus MRKK RX 0.86 1.99 �20% 1.59 �66% 86%Kubanenergo KUBE RX 4.44 2.95 – 2.95 �11% �34%Tomsk Disco TORS RX/
TORSP RX0.0153 0.0139 – 0.0139 �49% �9%
MRSK Holding MRKH RX/MRKHP RX
0.060 0.078 – 0.078 �56% 30%
Indicative value
Source: Bloomberg, Sberbank Investment Research
Alexander Kotikov +7 (495) 933 [email protected]
Andrey Trufanov +7 (495) 933 [email protected]

NOVEMBER 2012 MRSKS – RAB REVISED, PRIVATIZATIONS AHEAD
2 SBERBANK INVESTMENT RESEARCH
PAGE INTENTIONALLY LEFT BLANK

MRSKS – RAB REVISED, PRIVATIZATIONS AHEAD NOVEMBER 2012
SBERBANK INVESTMENT RESEARCH 3
Contents
Latest RAB System Reboot Completed.............................................................................................. 4
RAB system reboot process ......................................................................................................... 4
Regulated RoR ............................................................................................................................ 6
MRSK branches on indexation .................................................................................................... 9
RAB for remaining branches possible from 2014 ...................................................................... 11
Implied revenue growth and MRSK Holding’s key financials ..................................................... 11
MRSK Privatizations Could Start in 2H13 ....................................................................................... 13
“Last mile” problem .................................................................................................................. 13
Other issues .............................................................................................................................. 13
Privatizations ............................................................................................................................ 13
Possible strategic investors ........................................................................................................ 14
MRSK Holding – the Management Company? ............................................................................... 16
Valuation ....................................................................................................................................... 17
Assumptions ............................................................................................................................. 17
Risks ......................................................................................................................................... 17
DCF models .............................................................................................................................. 18
Valuation results ....................................................................................................................... 18
MRSK Holding SOTP ................................................................................................................. 19
MRSK Holding upcoming new share issue ................................................................................ 20
Peer group ................................................................................................................................ 21
Company Data Profiles ................................................................................................................... 23
MRSK Holding .......................................................................................................................... 24
MRSK Center ............................................................................................................................ 25
MRSK Center�Volga .................................................................................................................. 26
MRSK North Caucasus .............................................................................................................. 27
MRSK North�West .................................................................................................................... 28
MRSK Siberia ............................................................................................................................ 29
MRSK South.............................................................................................................................. 30
MRSK Urals ............................................................................................................................... 31
MRSK Volga ............................................................................................................................. 32
MOESK ..................................................................................................................................... 33
Lenenergo ................................................................................................................................ 34
NOVEMBER 2012 MRSKS – RAB REVISED, PRIVATIZATIONS AHEAD
4 SBERBANK INVESTMENT RESEARCH
Latest RAB System Reboot Completed
RAB system reboot process
The latest round of RAB system reboot has been completed, with 44 MRSK branches out of a total of
65 moved onto RAB regulation from November 1. The total aggregate rebooted iRAB level for the 44
branches with RAB approved has been cut by 12%. We expect a few more branches to migrate from
January 1, 2013. For now, 21 branches are operating under the long�term indexation method.
MRSK Holding RAB system reboot progress in 2012
No ofbranches
Rebooted as of July 1 31Rebooted in July (Lenenergo – two branches) 2Rebooted as of November 1 11Total under RAB from November 1 44
Under long�term indexation method as of November 1 21
Source: MRSK Holding, Sberbank Investment Research
█ RAB system reboot from July 1. In accordance with government resolution No 1178, regional
energy commissions determined or revised regulatory parameters for some MRSK branches by
June 1. After reconciling these with the Federal Tariff Service (FTS), the new parameters came into
force on July 1. There were 31 branches under RAB as of July 1.
█ RAB system reboot from November 1. Branches that were operating under RAB in 1H12 but
did not go through the June�July RAB system reboot switched to long�term indexation from July
1. Their regulatory parameters were subject to revision by October 15. Those whose
RAB parameters were reconciled by the FTS migrated back to RAB on November 1. The others
continued operating under long�term indexation.
█ Tariffs. The branches that moved to RAB regulation from November 1 therefore migrated to new
tariffs from November 1. The next tariff hike is due on July 1, 2013.
SEVERAL MRSKS HAVE MOVED ENTIRELY TO RAB
The companies now entirely on RAB since the reboot are MRSK Center�Volga, MRSK Volga,
MRSK Urals (with the exception of subsidiary Ekaterinburg Power Network Company, or EESK),
MOESK and Lenenergo. Although RAB was cut considerably in some cases, it was better to reboot the
system now and have viable tariff growth in the future to ensure that the RAB system survives over the
long term. Moreover, under RAB regulation, the cost�cutting incentive is retained, unlike under the
indexation method. Hence we prefer MRSKs that are fully or almost fully under RAB. These companies
will probably also entail more comfort for strategic investors as potential privatization targets.

MRSKS – RAB REVISED, PRIVATIZATIONS AHEAD NOVEMBER 2012
SBERBANK INVESTMENT RESEARCH 5
iRAB levels for MRSKs (aggregate for branches where RAB has been rebooted), R mln
2012 iRAB(rebooted)
Change No of branches with RABparameters rebooted
MOESK 182,495 1% 2 out of 2Lenenergo 72,224 �8% 2 out of 2MRSK Center 66,566 �22% 8 out of 11MRKS Center�Volga 77,119 �7% 9 out of 9MRSK North Caucasus 16,400 0% 4 out of 7MRSK North�West 21,739 �5% 4 out of 7MRSK Siberia 9,430 �6% 1 out of 9*
MRSK South 22,523 0% 3 out of 4MRSK Urals 40,816 �30% 3 out of 3**
MRSK Volga 48,297 �37% 7 out of 7Tyumenenergo – – 0 out of 1Kubanenergo 20,643 0% 1 out of 1Tomsk Disco – – 0 out of 1Yantarenergo *** – – 0 out of 1Total approved 578,254 �12% 44 out of 65
* including Tuvaenergo, 98.96% owned by MRSK Siberia
** not accounting for the stake in Kurganenergo, swapped for a stake in Lenenergo; also, not including EESK (91.04% owned by MRSK Urals), which we expect to migrate to RAB from January 2013
*** 100% subsidiary of MRSK Holding
Source: Companies, FTS, Interfax, Sberbank Investment Research
█ MRSK Center�Volga. The FTS reconciled RAB migration for all nine branches, so MRSK
Center�Volga is on RAB as of November 1. The average RAB cut for MRSK Center�Volga from
iRABs approved earlier was only 7.5%.
█ MRSK Volga. MRSK Volga’s total RAB was cut by 37% (the most considerable cut among the
MRSKs), but the company is now completely on RAB, which is positive, in our view, and valuable
in the longer term.
█ MRSK Urals. We had feared that Chelyabenergo would not migrate to RAB, but the FTS reconciled
RAB parameters for it, so all three of MRSK Urals’ branches are now on RAB, though the total RAB
was reduced by 30% on average. We still expect RAB migration for MRSK Urals’ subsidiary EESK
from January 1, 2013 (estimated at 10% of our total RAB forecast for MRSK Urals).
█ MRSK Center. The FTS reconciled RAB parameters for Voronezhenergo, so eight of MRSK Center’s
11 branches are now on RAB. Lipetskenergo is on long�term indexation but it may be moved to RAB
from January 1, 2013 (estimated at 6% of our total RAB forecast for MRSK Center), and the
company plans to submit the relevant documents to ensure this. The other two branches
(constituting 12% of MRSK Center’s total estimated RAB) remain on indexation.
█ MOESK. The FTS reconciled RAB parameters for MOESK (Moscow and Moscow Region) and
hence it is fully on RAB. Its aggregate rebooted RAB of R182.5 bln (by far the largest of all the
MRSKs) is flat versus the original iRAB level.
█ MRSK North�West. The RAB was cut by a modest 5% for the four branches (out of seven) that
have undergone a reboot. This represents around two thirds of our total RAB forecast for
MRSK North�West. Kolenergo could be transferred to RAB from January 1, 2013 (11% of the
total estimated RAB) and Arkhenergo could migrate from July 1, 2013 (9%), which would take
the total RAB approved to 87% of the total estimated RAB.
█ MRSK South. Three out of MRSK South’s four branches are on RAB, representing 77% of the
company’s total estimated RAB. Only Volgogradenergo has still to be transferred; this could
happen from January 1, 2013.
NOVEMBER 2012 MRSKS – RAB REVISED, PRIVATIZATIONS AHEAD
6 SBERBANK INVESTMENT RESEARCH
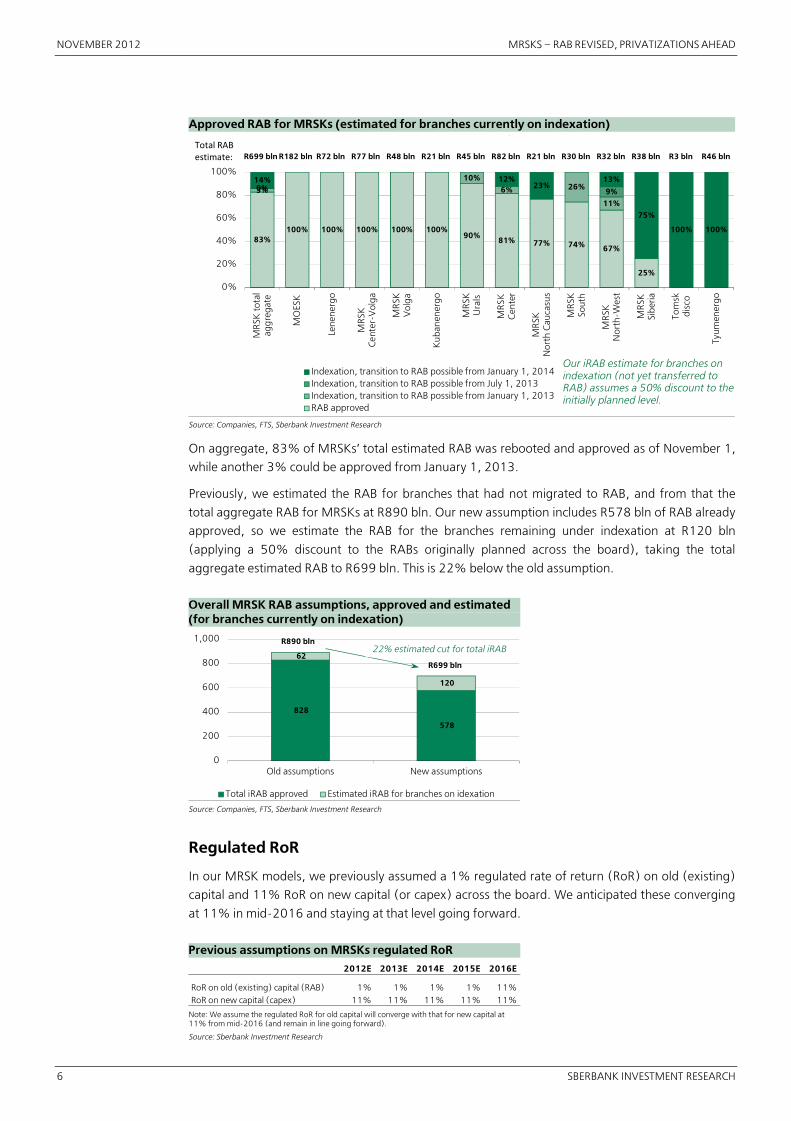
Approved RAB for MRSKs (estimated for branches currently on indexation)
83%100% 100% 100% 100% 100%
90%81% 77% 74% 67%
25%
3%
10%6% 26%
11%
0% 9%14% 12%
23%13%
75%
100% 100%
0%
20%
40%
60%
80%
100%
MR
SK to
tal
aggr
egat
e
MO
ESK
Lene
nerg
o
MR
SKC
ente
r�V
olga
MR
SKV
olga
Kub
anen
ergo
MR
SKU
rals
MR
SKC
ente
r
MR
SKN
orth
Cau
casu
s
MR
SKSo
uth
MR
SKN
orth
�Wes
t
MR
SKSi
beria
Tom
skdi
sco
Tyum
ener
go
Indexation, transition to RAB possible from January 1, 2014Indexation, transition to RAB possible from July 1, 2013Indexation, transition to RAB possible from January 1, 2013RAB approved
R699 blnTotal RABestimate: R182 bln R72 bln R77 bln R3 bln R46 blnR48 bln R21 bln R45 bln R82 bln R21 bln R30 bln R32 bln R38 bln
Source: Companies, FTS, Sberbank Investment Research
On aggregate, 83% of MRSKs’ total estimated RAB was rebooted and approved as of November 1,
while another 3% could be approved from January 1, 2013.
Previously, we estimated the RAB for branches that had not migrated to RAB, and from that the
total aggregate RAB for MRSKs at R890 bln. Our new assumption includes R578 bln of RAB already
approved, so we estimate the RAB for the branches remaining under indexation at R120 bln
(applying a 50% discount to the RABs originally planned across the board), taking the total
aggregate estimated RAB to R699 bln. This is 22% below the old assumption.
Overall MRSK RAB assumptions, approved and estimated (for branches currently on indexation)
828
578
62
120
0
200
400
600
800
1,000
Old assumptions New assumptions
Total iRAB approved Estimated iRAB for branches on idexation
22% estimated cut for total iRABR890 bln
R699 bln
Source: Companies, FTS, Sberbank Investment Research
Regulated RoR
In our MRSK models, we previously assumed a 1% regulated rate of return (RoR) on old (existing)
capital and 11% RoR on new capital (or capex) across the board. We anticipated these converging
at 11% in mid�2016 and staying at that level going forward.
Previous assumptions on MRSKs regulated RoR
2012E 2013E 2014E 2015E 2016E
RoR on old (existing) capital (RAB) 1% 1% 1% 1% 11%RoR on new capital (capex) 11% 11% 11% 11% 11%
Note: We assume the regulated RoR for old capital will converge with that for new capital at 11% from mid�2016 (and remain in line going forward).
Source: Sberbank Investment Research
Our iRAB estimate for branches on indexation (not yet transferred to RAB) assumes a 50% discount to the initially planned level.
MRSKS – RAB REVISED, PRIVATIZATIONS AHEAD NOVEMBER 2012
SBERBANK INVESTMENT RESEARCH 7
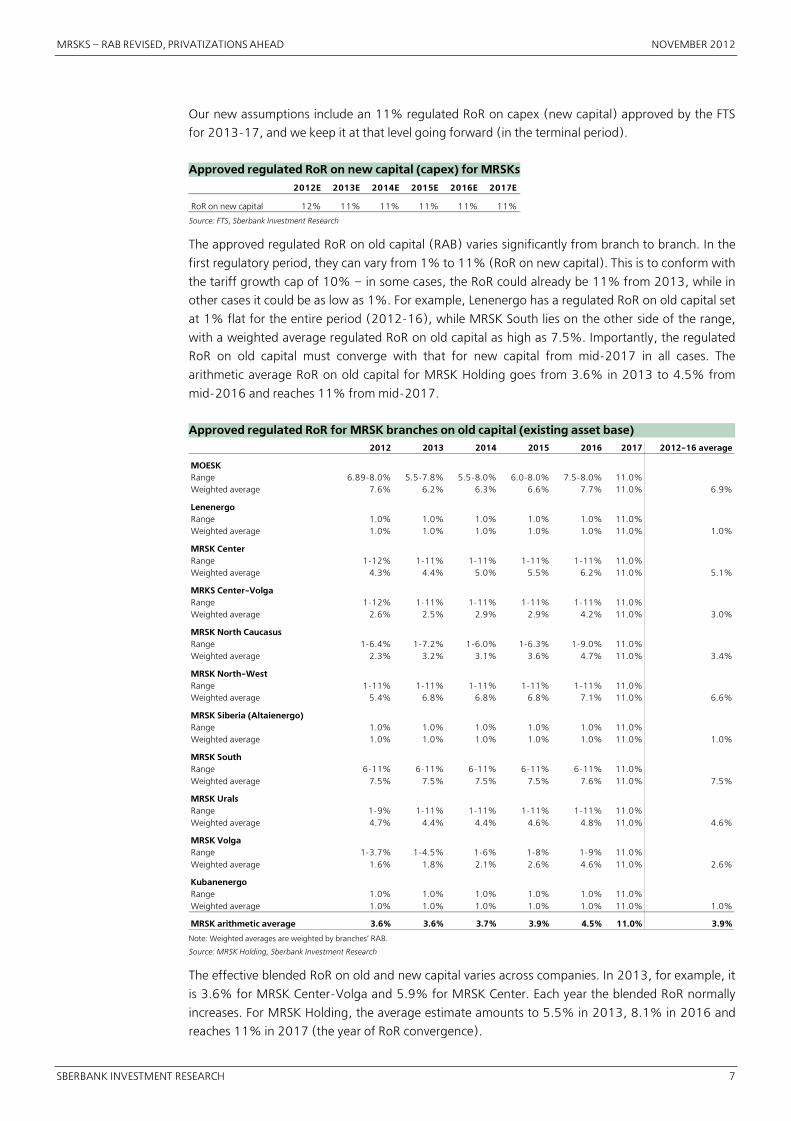
Our new assumptions include an 11% regulated RoR on capex (new capital) approved by the FTS
for 2013�17, and we keep it at that level going forward (in the terminal period).
Approved regulated RoR on new capital (capex) for MRSKs
2012E 2013E 2014E 2015E 2016E 2017E
RoR on new capital 12% 11% 11% 11% 11% 11%
Source: FTS, Sberbank Investment Research
The approved regulated RoR on old capital (RAB) varies significantly from branch to branch. In the
first regulatory period, they can vary from 1% to 11% (RoR on new capital). This is to conform with
the tariff growth cap of 10% – in some cases, the RoR could already be 11% from 2013, while in
other cases it could be as low as 1%. For example, Lenenergo has a regulated RoR on old capital set
at 1% flat for the entire period (2012�16), while MRSK South lies on the other side of the range,
with a weighted average regulated RoR on old capital as high as 7.5%. Importantly, the regulated
RoR on old capital must converge with that for new capital from mid�2017 in all cases. The
arithmetic average RoR on old capital for MRSK Holding goes from 3.6% in 2013 to 4.5% from
mid�2016 and reaches 11% from mid�2017.
Approved regulated RoR for MRSK branches on old capital (existing asset base)
2012 2013 2014 2015 2016 2017 2012�16 average
MOESKRange 6.89�8.0% 5.5�7.8% 5.5�8.0% 6.0�8.0% 7.5�8.0% 11.0%Weighted average 7.6% 6.2% 6.3% 6.6% 7.7% 11.0% 6.9%
LenenergoRange 1.0% 1.0% 1.0% 1.0% 1.0% 11.0%Weighted average 1.0% 1.0% 1.0% 1.0% 1.0% 11.0% 1.0%
MRSK CenterRange 1�12% 1�11% 1�11% 1�11% 1�11% 11.0%Weighted average 4.3% 4.4% 5.0% 5.5% 6.2% 11.0% 5.1%
MRKS Center�VolgaRange 1�12% 1�11% 1�11% 1�11% 1�11% 11.0%Weighted average 2.6% 2.5% 2.9% 2.9% 4.2% 11.0% 3.0%
MRSK North CaucasusRange 1�6.4% 1�7.2% 1�6.0% 1�6.3% 1�9.0% 11.0%Weighted average 2.3% 3.2% 3.1% 3.6% 4.7% 11.0% 3.4%
MRSK North�WestRange 1�11% 1�11% 1�11% 1�11% 1�11% 11.0%Weighted average 5.4% 6.8% 6.8% 6.8% 7.1% 11.0% 6.6%
MRSK Siberia (Altaienergo)Range 1.0% 1.0% 1.0% 1.0% 1.0% 11.0%Weighted average 1.0% 1.0% 1.0% 1.0% 1.0% 11.0% 1.0%
MRSK SouthRange 6�11% 6�11% 6�11% 6�11% 6�11% 11.0%Weighted average 7.5% 7.5% 7.5% 7.5% 7.6% 11.0% 7.5%
MRSK UralsRange 1�9% 1�11% 1�11% 1�11% 1�11% 11.0%Weighted average 4.7% 4.4% 4.4% 4.6% 4.8% 11.0% 4.6%
MRSK VolgaRange 1�3.7% 1�4.5% 1�6% 1�8% 1�9% 11.0%Weighted average 1.6% 1.8% 2.1% 2.6% 4.6% 11.0% 2.6%
KubanenergoRange 1.0% 1.0% 1.0% 1.0% 1.0% 11.0%Weighted average 1.0% 1.0% 1.0% 1.0% 1.0% 11.0% 1.0%
MRSK arithmetic average 3.6% 3.6% 3.7% 3.9% 4.5% 11.0% 3.9%
Note: Weighted averages are weighted by branches’ RAB.
Source: MRSK Holding, Sberbank Investment Research
The effective blended RoR on old and new capital varies across companies. In 2013, for example, it
is 3.6% for MRSK Center�Volga and 5.9% for MRSK Center. Each year the blended RoR normally
increases. For MRSK Holding, the average estimate amounts to 5.5% in 2013, 8.1% in 2016 and
reaches 11% in 2017 (the year of RoR convergence).
NOVEMBER 2012 MRSKS – RAB REVISED, PRIVATIZATIONS AHEAD
8 SBERBANK INVESTMENT RESEARCH
Total estimated weighted average effective RoR (on old and new capital) for MRSKs
2012E 2013E 2014E 2015E 2016E 2017E
MOESK 7.7% 7.1% 7.7% 8.5% 9.4% 11.0%Lenenergo 1.1% 3.4% 4.6% 6.0% 6.8% 11.0%MRSK North�West 5.4% 7.8% 8.1% 8.6% 9.1% 11.0%MRSK Center�Volga 3.0% 3.6% 4.6% 5.6% 7.3% 11.0%MRSK Siberia 1.0% 3.7% 2.8% 3.7% 4.6% 11.0%MRSK Urals 5.7% 5.0% 5.7% 6.5% 7.3% 11.0%MRSK Volga 2.9% 4.4% 5.6% 6.6% 8.2% 11.0%MRSK Center 4.5% 5.9% 6.9% 8.1% 9.1% 11.0%MRSK South 7.5% 7.9% 8.2% 8.7% 9.2% 11.0%MRSK North Caucasus 2.3% 3.4% 4.5% 6.0% 7.2% 11.0%Kubanenergo 1.5% 4.8% 7.0% 7.3% 7.7% 11.0%MRSK Holding average 4.7% 5.5% 6.1% 7.1% 8.1% 11.0%
Note: Assuming that branches not currently under RAB will be transferred to RAB from 2014, with a RoR on old capital of 1% in 2013�16.
Source: Sberbank Investment Research
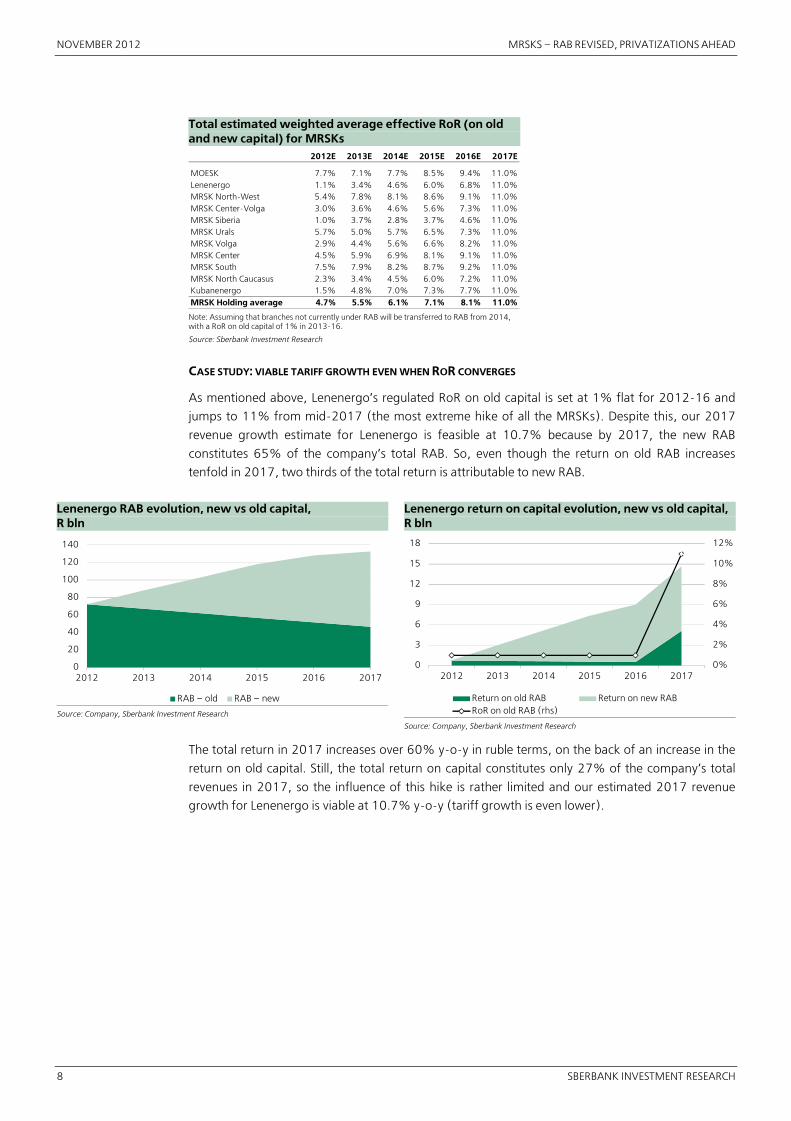
CASE STUDY: VIABLE TARIFF GROWTH EVEN WHEN ROR CONVERGES
As mentioned above, Lenenergo’s regulated RoR on old capital is set at 1% flat for 2012�16 and
jumps to 11% from mid�2017 (the most extreme hike of all the MRSKs). Despite this, our 2017
revenue growth estimate for Lenenergo is feasible at 10.7% because by 2017, the new RAB
constitutes 65% of the company’s total RAB. So, even though the return on old RAB increases
tenfold in 2017, two thirds of the total return is attributable to new RAB.
Lenenergo RAB evolution, new vs old capital, R bln
0
20
40
60
80
100
120
140
2012 2013 2014 2015 2016 2017
RAB – old RAB – new
Source: Company, Sberbank Investment Research
Lenenergo return on capital evolution, new vs old capital, R bln
0%
2%
4%
6%
8%
10%
12%
0
3
6
9
12
15
18
2012 2013 2014 2015 2016 2017
Return on old RAB Return on new RABRoR on old RAB (rhs)
Source: Company, Sberbank Investment Research
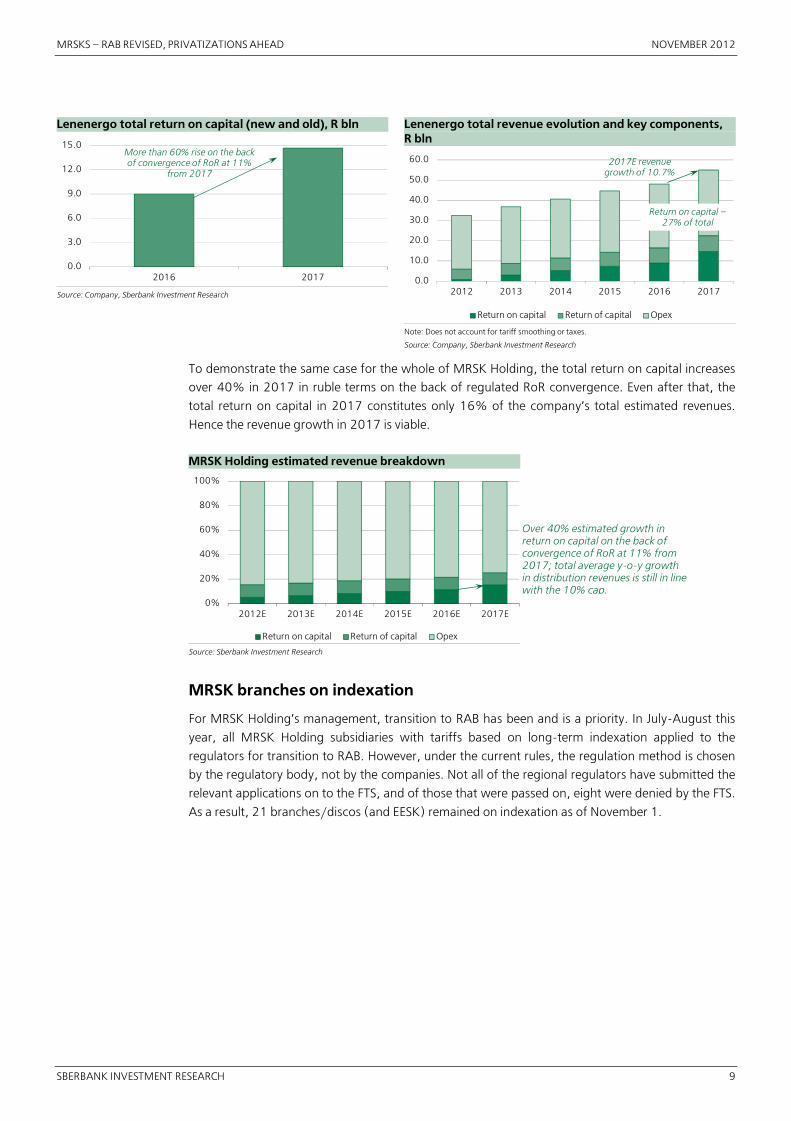
The total return in 2017 increases over 60% y�o�y in ruble terms, on the back of an increase in the
return on old capital. Still, the total return on capital constitutes only 27% of the company’s total
revenues in 2017, so the influence of this hike is rather limited and our estimated 2017 revenue
growth for Lenenergo is viable at 10.7% y�o�y (tariff growth is even lower).
MRSKS – RAB REVISED, PRIVATIZATIONS AHEAD NOVEMBER 2012
SBERBANK INVESTMENT RESEARCH 9
Lenenergo total return on capital (new and old), R bln
0.0
3.0
6.0
9.0
12.0
15.0
2016 2017
More than 60% rise on the back of convergence of RoR at 11%
from 2017
Source: Company, Sberbank Investment Research
Lenenergo total revenue evolution and key components, R bln
0.0
10.0
20.0
30.0
40.0
50.0
60.0
2012 2013 2014 2015 2016 2017
Return on capital Return of capital Opex
Return on capital –27% of total
2017E revenue growth of 10.7%
Note: Does not account for tariff smoothing or taxes.
Source: Company, Sberbank Investment Research
To demonstrate the same case for the whole of MRSK Holding, the total return on capital increases
over 40% in 2017 in ruble terms on the back of regulated RoR convergence. Even after that, the
total return on capital in 2017 constitutes only 16% of the company’s total estimated revenues.
Hence the revenue growth in 2017 is viable.
MRSK Holding estimated revenue breakdown
0%
20%
40%
60%
80%
100%
2012E 2013E 2014E 2015E 2016E 2017E
Return on capital Return of capital Opex
Source: Sberbank Investment Research
MRSK branches on indexation
For MRSK Holding’s management, transition to RAB has been and is a priority. In July�August this
year, all MRSK Holding subsidiaries with tariffs based on long�term indexation applied to the
regulators for transition to RAB. However, under the current rules, the regulation method is chosen
by the regulatory body, not by the companies. Not all of the regional regulators have submitted the
relevant applications on to the FTS, and of those that were passed on, eight were denied by the FTS.
As a result, 21 branches/discos (and EESK) remained on indexation as of November 1.
Over 40% estimated growth in return on capital on the back of convergence of RoR at 11% from 2017; total average y�o�y growth in distribution revenues is still in line with the 10% cap.

NOVEMBER 2012 MRSKS – RAB REVISED, PRIVATIZATIONS AHEAD
10 SBERBANK INVESTMENT RESEARCH
On long�term indexation method, not transferred to RAB regulation
MRSK Possible/assumed dateof transition to RAB
Dagestan MRSK North CaucasusChechnya (Nurenergo/Chechenenergo) MRSK Holding (MRSK North Caucasus)Arkhangelsk MRSK North�West July 1, 2013Murmansk (Kolenergo) MRSK North�West January 1, 2013Komi MRSK North�WestVolgograd MRSK South January 1, 2013Buryatia MRSK SiberiaKuzbass MRSK SiberiaKaliningrad (Yanterenergo) MRSK HoldingEkaterinburg Network Company (EESK)* MRSK Urals January 1, 2013
Ingushenergo MRSK North CaucasusBryanskenergo MRSK CenterLipetskenergo MRSK Center January 1, 2013Tverenergo MRSK CenterGAES MRSK SiberiaKrasnoyarskenergo MRSK SiberiaOmskenergo MRSK SiberiaKhakassenergo MRSK SiberiaChitaenergo MRSK SiberiaTuvaenergo** MRSK SiberiaTyumenenergo TyumenenergoTomsk Disco Tomsk Disco
Bra
nche
s on
inde
xatio
n be
fore
R
AB
sys
tem
reb
oot
Bra
nche
s m
oved
to in
dexa
tion
from
RA
B
duri
ng R
AB
sys
tem
reb
oot
* EESK is 91.04% owned by MRSK Urals
** 98.96% owned by MRSK Siberia
Source: MRSK Holding, Sberbank Investment Research
Still, under the current legislation, migration to RAB is possible from the beginning of a new
long�term regulatory period, as well as during the period. The companies expect another two to
four discos to migrate to RAB from January 1, 2013. However, for this to happen, amendments to
electricity sector pricing principles need to be made (in terms of transition criteria). A relevant draft
resolution has already been prepared and will be submitted to the government soon.
Also, importantly, for branches that switched from RAB to indexation as a result of the RAB system
revision, the original RABs have been kept (not cut or canceled), and the possibility of migration to
RAB from the next regulatory period or during the current one remains (on condition that the strict
cap on tariff growth is lifted).
CASE STUDY: TVERENERGO
In some cases, to conform with the 10% tariff growth, branches’ original RABs would have to be
cut by more than 50%. A case study of Tverenergo (an MRSK Center branch) shows the two
alternatives – operating under RAB regulation (with an 11% regulated RoR from 2013) and under
long�term indexation. The restricting criterion is 10% tariff growth in 2013�17. Under this
scenario, to comply with the tariff cap, Tverenergo’s original RAB would have to be cut by 52%.
This is one reason why long�term indexation might have been chosen instead (should the company
switch back to RAB in the future, the original RAB would remain intact).

MRSKS – RAB REVISED, PRIVATIZATIONS AHEAD NOVEMBER 2012
SBERBANK INVESTMENT RESEARCH 11
Tverenergo RAB regulation vs indexation to conform to 10% tariff growth, R bln
2012 2013 2014 2015 2016 2017 2012 2013 2014 2015 2016 2017
Calculation of indexation coefficientControllable expenses 1.8 1.9 2.0 2.0 2.1 2.2 1.9 2.0 2.1 2.1 2.2 2.3Non�controllable expenses 5.2 5.7 6.2 6.9 7.6 8.3 6.3 7.0 7.9 8.9 9.9 11.2
Depreciation – – – – – – 0.4 0.5 0.5 0.5 0.6 0.6Financing of investments from the profit – – – – – – 0.2 0.2 0.2 0.3 0.5 0.5
Return of capital 0.8 0.8 0.9 1.0 1.0 1.1 – – – – – –Return on capital 0.7 0.7 0.8 1.0 1.1 1.3 – – – – – –Total required revenue (total pot) 8.2 9.0 9.9 11.0 12.1 13.4 8.2 9.0 9.9 11.0 12.2 13.5Tariff growth 10% 10% 10% 10% 10% 10% 10% 10% 10% 10%EBIT (revenue net of expenses) 0.4 0.5 0.8 1.1 1.4 1.8 – – – – – –
Regulated RoR* 12% 11% 11% 11% 11% 11%Required RAB cut 52%
RAB regulation Long�term indexation
* on both old and new capital, as it will enter the second regulatory period (it was transferred to RAB from January 1, 2009)
Source: MRSK Center, Sberbank Investment Research
As the example above shows, under long�term indexation, revenues are set at such a level to barely
cover expenses (including depreciation and financing of investments from profits), i.e. EBIT
amounts to zero.
RAB for remaining branches possible from 2014
The government is developing a new electricity market model, according to Deputy Prime Minister
Arkady Dvorkovich. The current model is inefficient, and the new one should facilitate sufficient
investment in the generation and power network sectors. Preparations for the new market rules are
expected to be completed by year end. The plan will then be discussed with market participants and
experts. A decision on the market model will be made in 1H13. The new rules will be introduced in
2014. The RAB system will then be introduced en masse, as the current market model is reportedly
unable to attract investment.
We treat Dvorkovich’s statement as an indication that the remaining MRSK branches could migrate to
RAB during 2013 and be on RAB regulation from 2014. In our models, we assume that branches that
did not migrate to RAB during the reboot in 2012 and that are currently operating under long�term
indexation will be transferred to RAB from 2014. We assume the regulated RoR on old capital will be
1% across the board in 2013�16 and converge with that for new capital of 11% from 2017. We set
RAB levels for these branches at the originally planned levels minus a 50% discount, based on the
Tverenergo example above (this is a conservative/realistic assumption, in our view).
Implied revenue growth and MRSK Holding’s key financials
In our financial estimates, we have been targeting feasible (i.e. not too high) growth in MRSKs’ total
required revenues. For 2012, tariff growth should be no more than 6% y�o�y (11% from July 1),
and then no more than 10% per year in 2013�15, based on the Economics Ministry’s proposal
from September 2012. Our revenue forecasts for 2012 even decrease in some cases due to a
decline in the cost of electricity for compensation of losses (a non�controllable expense),
recalculation of the tariff “pot” within a region, the switch of some branches to indexation following
the RAB system reboot, missed profits due to the “last�mile” problem, and other reasons.
MRSK Holding’s total revenues drop 7% in 2012 in our model. In 2013�15, our projected revenue
growth for MRSKs ranges between 3% and 12%, which is also feasible, as implied tariff growth is
even lower than revenue growth and should still be within the 10% cap even at the high end of our
range. The forecast consolidated revenue growth for MRSK Holding is just 6% in 2013�16 and then
reaches 9% in 2017 (when the regulated RoR on old capital converges with that for new capital),
which is also feasible.

NOVEMBER 2012 MRSKS – RAB REVISED, PRIVATIZATIONS AHEAD
12 SBERBANK INVESTMENT RESEARCH
New implied revenue growth, ruble terms
2012E 2013E 2014E 2015E 2016E 2017E
MOESK �12% 4% 7% 9% 8% 9%Lenenergo 0% 11% 9% 11% 11% 11%MRSK North�West �7% 10% 7% 6% 6% 8%MRSK Center�Volga �8% 5% 6% 6% 7% 10%MRSK Siberia �12% 6% 10% 6% 6% 11%MRSK Urals �10% 5% 6% 6% 6% 9%MRSK Volga �6% 8% 6% 7% 7% 10%MRSK Center �11% 9% 7% 7% 7% 8%MRSK South 3% 6% 5% 6% 6% 8%MRSK North Caucasus 9% 7% 6% 8% 8% 14%Kubanenergo 2% 8% 9% 3% 3% 6%Tomsk Disco �15% 5% 7% 6% 6% 7%MRSK Holding �8% 6% 6% 6% 6% 9%
Source: Sberbank Investment Research
As a result of all these amendments to our assumptions, our implied top�line CAGR for the whole
period (2012�17) is 7% for MRSK Holding. We cut our EBITDA forecasts for MRSK Holding by
16�43% in 2013�16. We now expect MRSK Holding’s EBITDA to fall 15% in 2012 and slide a
further 5% in 2013. EBITDA demonstrates accelerating growth from 2014 until 2017 (16�27%
per year) driven by increasing return on capital, return of capital (due to asset commissioning) and
further expected migration to RAB from 2014 for the remaining branches still on indexation. The
total EBITDA CAGR for MRSK Holding is 14% in 2012�17.
MRSK Holding key financial assumptions, $ mln
2012E 2013E 2014E 2015E 2016E 2017E CAGR 2012E�17E
NewRevenues 18,337 18,718 19,818 21,016 22,330 24,414 –EBITDA 3,037 2,781 3,340 3,903 4,514 5,718 –Net income 454 216 338 470 657 1,168 –
Old –Revenues 21,380 23,219 25,321 27,880 32,574 – –EBITDA 3,092 3,375 3,997 4,901 7,884 – –Net income 275 259 357 604 1,903 – –
Difference, new vs oldRevenues �14% �19% �22% �25% �31% – –EBITDA �2% �18% �16% �20% �43% – –Net income 65% �17% �5% �22% �65% – –
Growth under new assumptions (ruble terms)Revenues �8% 6% 6% 6% 6% 9% 7%EBITDA �15% �5% 20% 17% 16% 27% 14%Net income �38% �51% 57% 39% 40% 78% 22%
Source: Sberbank Investment Research
MRSKS – RAB REVISED, PRIVATIZATIONS AHEAD NOVEMBER 2012
SBERBANK INVESTMENT RESEARCH 13
MRSK Privatizations Could Start in 2H13
In mid�October, Energy Minister Alexander Novak stated that President Vladimir Putin supported
the possibility of pilot MRSK privatizations, but no final decisions had been made. The
Energy Ministry has been instructed to prepare relevant proposals for the pilots (one or two MRSKs)
and these should be ready in a few months (after the heating/winter period). Thus, the
privatization process may start in 2013, attracting private capital into the segment. However, there
are several problems in the power network segment that first need to be resolved.
“Last mile” problem
First of all, cross�subsidization and the “last mile” issue need to be addressed. Individual solutions
have been developed for 19 regions, Novak stated in a Vedomosti interview in mid�November. The
liquidation will occur via distributing the cross�subsidization burden three ways: part will be taken
on by power network companies, which will have to cut their investment programs; part will
continue to be paid by large consumers; and the remainder will be left with other consumers
(including households). Based on this mechanism, it will be possible to get rid of the “last mile” in
some regions in one year, while in other regions, it will take three years. Some regions will also
require special attention, according to the energy minister.
Other issues
The second most important goal is to make sure that tariffs depend on the reliability and quality of
service provided. A third issue is benchmarking versus the best companies, Novak added – not only
with state discos on the market, but also with private providers. The regulator can then enforce
monitoring, determine the best among the group and set tariffs in a way to force cost�cutting at
less�efficient companies.
Privatizations
The state could use funds from the planned privatization of MRSK Holding subsidiaries to finance
infrastructure construction in order to reduce prices for economy�class housing, Interfax reported in
mid�November. Prime Minister Dmitri Medvedev reportedly said that infrastructure companies such
as MRSK Holding and Gazprom need to be involved in the program, and that it is important to
attract debt and perhaps think about using proceeds from the MRSK privatizations. We treat this
statement as a further indication that preparations for the MRSK privatizations are in progress.
Which MRSKs might be privatized is unknown, but Novak has said that the pilots should not be
strategically important or problematic. Based on this statement, we believe that those in the
strategic centers (MOESK and Lenenergo) are unlikely to be in that first pack, nor companies in
problematic regions, such as MRSK North Caucasus. We think the government is more likely to start
with MRSKs that have fully transferred to RAB. So, MRSK Center�Volga, MRSK Volga, MRSK Urals
(all their branches are on RAB regulation following the recent RAB system reboot) and MRSK Center
(eight of its 11 branches are on RAB and Lipetskenergo could migrate from January 1, 2013) are
the most likely candidates to be the first discos up for privatization, we believe.
A second round could include MRSK South (three of its four branches are on RAB, and Volgogradenergo
could migrate from January 1, 2013) and MRSK North�West (four of its seven branches are on RAB, and
Kolenergo and Arkhenergo may migrate from January 1 and July 1, 2013, respectively).
NOVEMBER 2012 MRSKS – RAB REVISED, PRIVATIZATIONS AHEAD
14 SBERBANK INVESTMENT RESEARCH
MRSK PRIVATIZATIONS VIA NEW SHARE ISSUES
Concerning the MRSK privatization mechanism itself, the Energy Ministry considers privatizing MRSKs
via new share issues as feasible. New share issues would be conducted to attract strategic investors,
and the proposal is that the proceeds would stay with the company to be used for investment, Novak
has said. Funds must be raised to renovate the power networks. This mechanism would be the same as
that used during the genco privatizations, which were successful, so MRSK privatizations should be a
relatively easy sell politically for the government. As we understand, MRSK Holding’s existing stakes in
MRSKs could also be sold along with new shares, so large stakes will probably be on offer.
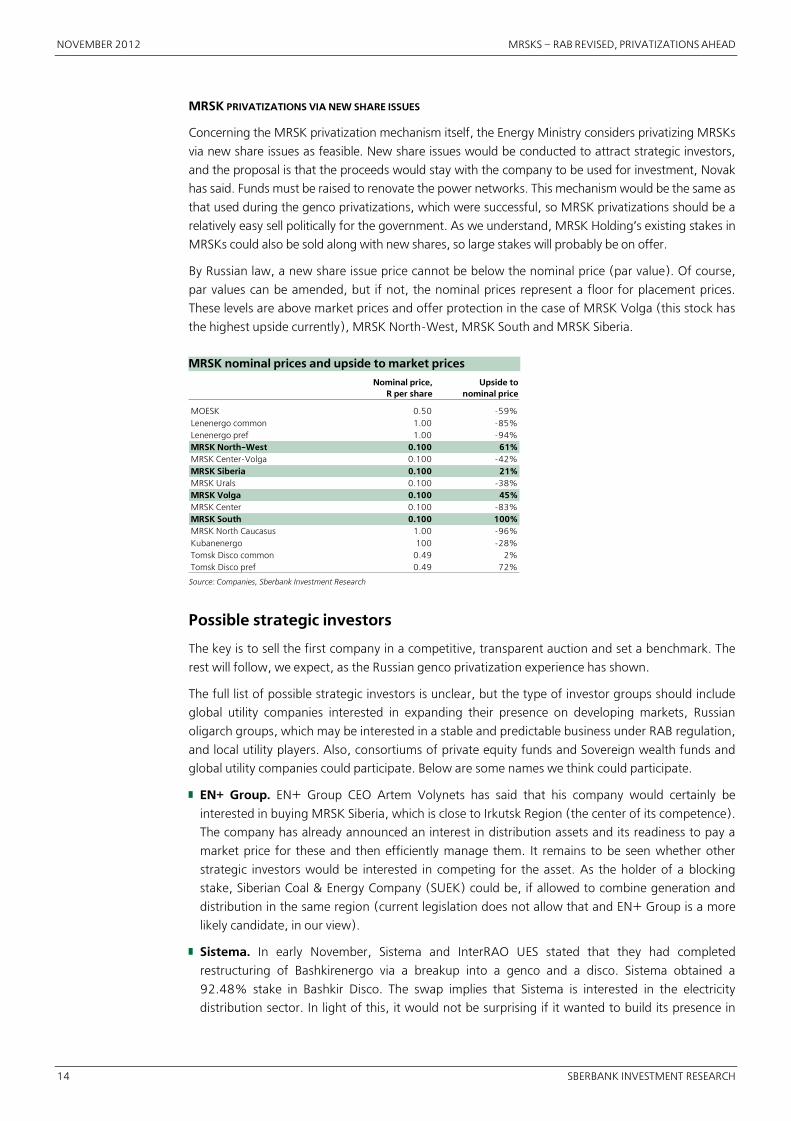
By Russian law, a new share issue price cannot be below the nominal price (par value). Of course,
par values can be amended, but if not, the nominal prices represent a floor for placement prices.
These levels are above market prices and offer protection in the case of MRSK Volga (this stock has
the highest upside currently), MRSK North�West, MRSK South and MRSK Siberia.
MRSK nominal prices and upside to market prices
Nominal price,R per share
Upside tonominal price
MOESK 0.50 �59%Lenenergo common 1.00 �85%Lenenergo pref 1.00 �94%MRSK North�West 0.100 61%MRSK Center�Volga 0.100 �42%MRSK Siberia 0.100 21%MRSK Urals 0.100 �38%MRSK Volga 0.100 45%MRSK Center 0.100 �83%MRSK South 0.100 100%MRSK North Caucasus 1.00 �96%Kubanenergo 100 �28%Tomsk Disco common 0.49 2%Tomsk Disco pref 0.49 72%
Source: Companies, Sberbank Investment Research
Possible strategic investors
The key is to sell the first company in a competitive, transparent auction and set a benchmark. The
rest will follow, we expect, as the Russian genco privatization experience has shown.
The full list of possible strategic investors is unclear, but the type of investor groups should include
global utility companies interested in expanding their presence on developing markets, Russian
oligarch groups, which may be interested in a stable and predictable business under RAB regulation,
and local utility players. Also, consortiums of private equity funds and Sovereign wealth funds and
global utility companies could participate. Below are some names we think could participate.
█ EN+ Group. EN+ Group CEO Artem Volynets has said that his company would certainly be
interested in buying MRSK Siberia, which is close to Irkutsk Region (the center of its competence).
The company has already announced an interest in distribution assets and its readiness to pay a
market price for these and then efficiently manage them. It remains to be seen whether other
strategic investors would be interested in competing for the asset. As the holder of a blocking
stake, Siberian Coal & Energy Company (SUEK) could be, if allowed to combine generation and
distribution in the same region (current legislation does not allow that and EN+ Group is a more
likely candidate, in our view).
█ Sistema. In early November, Sistema and InterRAO UES stated that they had completed
restructuring of Bashkirenergo via a breakup into a genco and a disco. Sistema obtained a
92.48% stake in Bashkir Disco. The swap implies that Sistema is interested in the electricity
distribution sector. In light of this, it would not be surprising if it wanted to build its presence in
MRSKS – RAB REVISED, PRIVATIZATIONS AHEAD NOVEMBER 2012
SBERBANK INVESTMENT RESEARCH 15
the segment by consolidating an MRSK. The most logical path would be to buy one geographically
close to Bashkir Disco – either MRSK Urals or MRSK Volga (maybe even MRSK Center�Volga).
█ Enel. The company has international expertise in managing power network assets and we would not
be surprised if it were interested in buying an MRSK. As Enel OGK�5 has power plants in the South IES
and Urals IES, Enel would probably not be interested in (or be able to) buy MRSKs in those regions.
█ EDF. The company has taken Tomsk Disco under management, and we believe it might be
interested in buying it at a later stage. The French company may also be interested in acquiring
one or several MRSKs once the privatization process starts.
█ E.ON and Fortum. It is unclear whether E.ON and Fortum, large investors in Russian electricity
generation, would be interested in participating in MRSK privatizations, but this cannot be ruled
out. At end October, E.ON Russia CEO Maxim Shirokov announced that the management is
planning to devise a 5y strategy by year end and approve it by end 1Q13. The strategy deals with
four areas, and the distribution segment was not mentioned in this context. Still, it is possible that
it may at least review the possibility of participating in the privatization process. Fortum has exited
Lenenergo and is concentrated on generation, so it is probably not very likely to take part, at least
not in the first privatization rounds.
█ Gazprom Energoholding. As of now, Russian legislation does not allow companies to combine
electricity generation and distribution in the same hands. Still, we would not rule out the
possibility of Gazprom Energoholding participating in MRSK privatizations in regions where it has
no, or limited, presence in the generation segment.

NOVEMBER 2012 MRSKS – RAB REVISED, PRIVATIZATIONS AHEAD
16 SBERBANK INVESTMENT RESEARCH
MRSK Holding – the Management Company?
Novak has said that a draft presidential decree on the creation of a unified management company
for the power network complex, including MRSK Holding, has been submitted to the
Presidential Administration and is in the final stage of reconciliation. In fact, the documents are close
to being signed, as they have purportedly been reconciled already. No exact details on the timing
have been provided. In addition to the issue of creating a management company, the decree will
also contain provisions on raising efficiency in the power network complex, tariff issues,
cross�subsidization, the “last�mile” problem, and the consolidation of territorial discos, among other
things. The aim is to manage the complex more efficiently.
In an interview with Vedomosti in November, Novak said that the management company should be
based on MRSK Holding, an already existing legal “shell”. It would make no sense to create a new
one. The state will contribute to MRSK Holding’s capital via a new share issue, Novak stated (the
swap ratio for shares in the management company will be based on an independent appraisal).
MRSKs will stay independent operationally. The top management issue is currently being reviewed,
and we expect Oleg Budargin, currently chairman of the management board, to head the new
structure (the management company). Following consolidation, MRSK Holding could be renamed
Russian Networks, Vedomosti has reported.
The final decision on the configuration of the power network complex remains with
President Vladimir Putin. If MRSK Holding ends up being the management company, this implies the
risk of relative valuation for MRSK Holding minority shareholders (its new share issue for
consolidation would have to be very substantial). The placement price for MRSK Holding’s other
share issue upcoming soon is R2.16 per share, as a reference.
In mid�October, Putin said amendments to the management structure in the power network
segment should account for’ minority shareholders’ interests and be viewed positively by investors.
Minority stakes in the charters (including that of MRSK Holding) are significant. Securing
shareholder rights is an important condition for attracting new investment. A conscious approach
toward any possible structural changes in the sector should be followed, based on the companies’
work in previous years. Efficiency and competitiveness of the power network segment needs to be
raised via reducing capex per unit, implementing energy�efficiency programs, and cutting electricity
losses, he concluded. Putin's statement about minority shareholders’ interests may indicate a greater
possibility of a reasonable decision and that the consolidation terms will, hopefully, be fair.
It seems that the management company will not be under the Rosneftegaz umbrella (the
government has opposed the latter’s involvement in the power network space), though a final
decision has yet to be announced. If not, we would expect a positive market reaction, as this would
make MRSK privatizations more likely. We continue to expect the privatization process to start in
2H13, with pilots to be announced in spring.
MRSKS – RAB REVISED, PRIVATIZATIONS AHEAD NOVEMBER 2012
SBERBANK INVESTMENT RESEARCH 17
Valuation
Assumptions
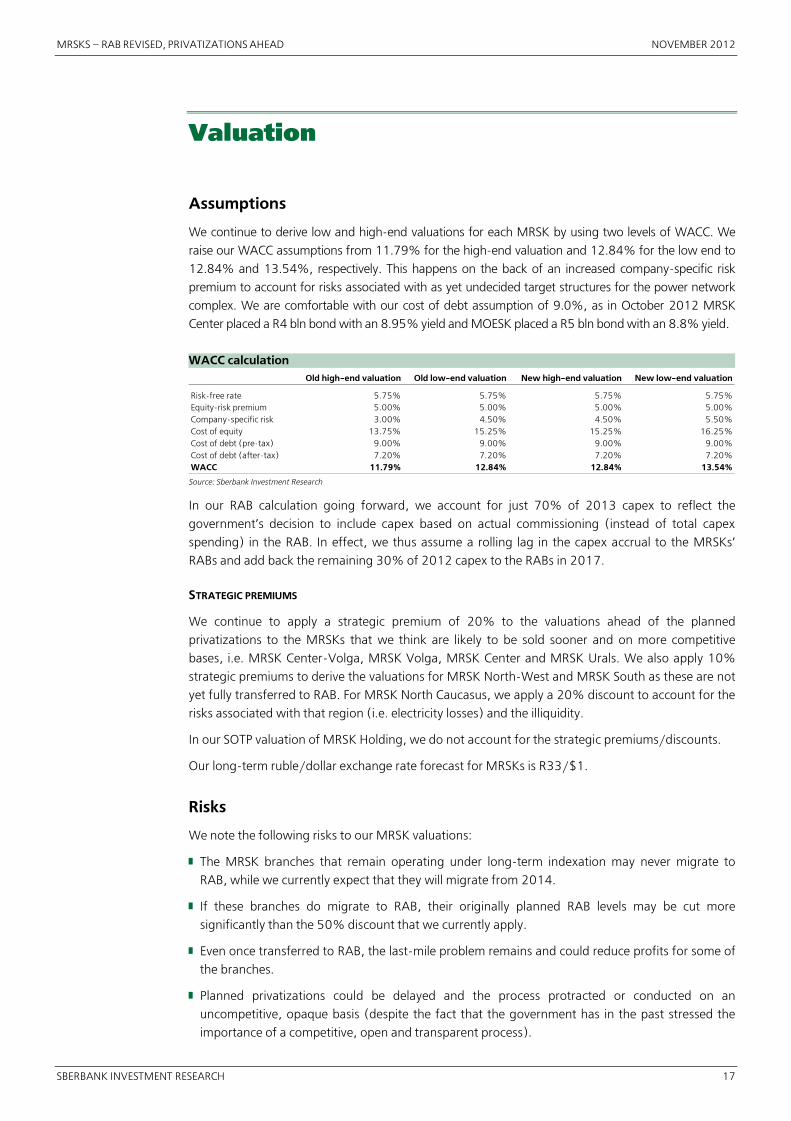
We continue to derive low and high�end valuations for each MRSK by using two levels of WACC. We
raise our WACC assumptions from 11.79% for the high�end valuation and 12.84% for the low end to
12.84% and 13.54%, respectively. This happens on the back of an increased company�specific risk
premium to account for risks associated with as yet undecided target structures for the power network
complex. We are comfortable with our cost of debt assumption of 9.0%, as in October 2012 MRSK
Center placed a R4 bln bond with an 8.95% yield and MOESK placed a R5 bln bond with an 8.8% yield.
WACC calculation
Old high�end valuation Old low�end valuation New high�end valuation New low�end valuation
Risk�free rate 5.75% 5.75% 5.75% 5.75%Equity�risk premium 5.00% 5.00% 5.00% 5.00%Company�specific risk 3.00% 4.50% 4.50% 5.50%Cost of equity 13.75% 15.25% 15.25% 16.25%Cost of debt (pre�tax) 9.00% 9.00% 9.00% 9.00%Cost of debt (after�tax) 7.20% 7.20% 7.20% 7.20%WACC 11.79% 12.84% 12.84% 13.54%
Source: Sberbank Investment Research
In our RAB calculation going forward, we account for just 70% of 2013 capex to reflect the
government’s decision to include capex based on actual commissioning (instead of total capex
spending) in the RAB. In effect, we thus assume a rolling lag in the capex accrual to the MRSKs’
RABs and add back the remaining 30% of 2012 capex to the RABs in 2017.
STRATEGIC PREMIUMS
We continue to apply a strategic premium of 20% to the valuations ahead of the planned
privatizations to the MRSKs that we think are likely to be sold sooner and on more competitive
bases, i.e. MRSK Center�Volga, MRSK Volga, MRSK Center and MRSK Urals. We also apply 10%
strategic premiums to derive the valuations for MRSK North�West and MRSK South as these are not
yet fully transferred to RAB. For MRSK North Caucasus, we apply a 20% discount to account for the
risks associated with that region (i.e. electricity losses) and the illiquidity.
In our SOTP valuation of MRSK Holding, we do not account for the strategic premiums/discounts.
Our long�term ruble/dollar exchange rate forecast for MRSKs is R33/$1.
Risks
We note the following risks to our MRSK valuations:
█ The MRSK branches that remain operating under long�term indexation may never migrate to
RAB, while we currently expect that they will migrate from 2014.
█ If these branches do migrate to RAB, their originally planned RAB levels may be cut more
significantly than the 50% discount that we currently apply.
█ Even once transferred to RAB, the last�mile problem remains and could reduce profits for some of
the branches.
█ Planned privatizations could be delayed and the process protracted or conducted on an
uncompetitive, opaque basis (despite the fact that the government has in the past stressed the
importance of a competitive, open and transparent process).

NOVEMBER 2012 MRSKS – RAB REVISED, PRIVATIZATIONS AHEAD
18 SBERBANK INVESTMENT RESEARCH
DCF models
Our explicit forecast period runs until 2017. Plugging in our assumptions, as well as our WACCs of
12.84% and 13.54%, we derive our high and low�end target enterprise and equity values. We then
apply the strategic premiums to the mid�values in the cases mentioned above.
In our MRSK Urals valuation, we no longer include the 49% stake in Kurganenergo. In November, the
company completed a transaction, whereby it gave up this stake and obtained a stake in Lenenergo (a
7.15% stake in commons and 8.46% stake in the charter capital) and cash consideration of R800 mln.
This stake is included in our MRSK Urals valuation at the current market price.
Valuation results
We derive indicative ranges for each company with our valuation method discussed above.
Comparing the mid�values of these ranges with our previous values (keeping the same strategic
premiums), we downgrade our valuations for all the companies, and MRSK Holding as a result (by
56% for the latter).
MRSK Volga, MRSK Urals and MRSK Center�Volga currently offer the highest upside. Among less
liquid names, MRSK North Caucasus offers the most. MRSK Volga is among the least expensive
companies on EV/iRAB at 0.41, and MRSK North�West also looks attractive with EV/expected iRAB
of 0.42. The MRSK average expected EV/RAB is 0.50 (excluding the outlier Kubanenergo, driven
by the expected tender offer at R157.8 per share).
Thus, in the power network segment, we continue to like MRSK Volga, MRSK Center�Volga,
MRSK Urals and MRSK Center as the foremost plays on potential privatizations, especially now that
the RAB�system reboot is complete and MRSK Volga, MRSK Center�Volga and MRSK Urals are fully
on RAB (though MRSK Urals’ subsidiary EESK has yet to migrate). MRSK Center is over 80% on
RAB, we estimate. In the second group, we like MRSK North�West and MRSK South. We believe
that the government will probably strive for EV/RABs approaching 1.0 at the privatizations and
expect the possible privatizations to start in 2H13.
Valuation summary
Ticker Currentprice
Mcap$ mln
Netdebt
EV/exp.RAB
IV mid�value,accounting for
Upside
$ per share $ mln***** (2013)* Low end High end Mid�value strategic premiums
MOESK MSRS RX 0.039 1,911 1,309 0.58 0.036 0.043 0.040 0.040 �11% 1%Lenenergo** LSNG RX 0.220 421 650 0.49 0.269 0.351 0.310 0.310 �58% 41%MRSK North�West MRKZ RX 0.0020 190 225 0.42 0.00252 0.00297 0.00275 0.00302 �58% 53%MRSK Center�Volga MRKP RX 0.0055 619 627 0.53 0.0068 0.0079 0.0073 0.0088 �32% 60%MRSK Siberia MRKS RX 0.00264 251 196 0.39 0.0032 0.0046 0.0039 0.0039 �64% 47%MRSK Urals MRKU RX 0.0052 452 168 0.45 0.0067 0.0075 0.0071 0.0085 �39% 65%MRSK Volga MRKV RX 0.00221 394 200 0.41 0.0038 0.0043 0.0041 0.0049 �43% 120%MRSK Center MRKC RX 0.0185 783 697 0.60 0.0222 0.0257 0.0239 0.0287 �44% 55%MRSK South MRKY RX 0.00160 80 522 0.65 0.00150 0.00257 0.00204 0.00224 �55% 40%MRSK North Caucasus*** MRKK RX 0.86 132 90 0.34 1.68 2.29 1.99 1.59 �66% 86%Kubanenergo**** KUBE RX 4.44 1,120 270 2.22 2.85 3.04 2.95 2.95 �11% �34%Tomsk Disco TORS RX/
TORSP RX0.0153 67 (13) 0.66 0.0132 0.0147 0.0139 0.0139 �49% �9%
Average (excl. Kubanenergo) 0.50
MRSK Holding MRKH RX/MRKHP RX
0.060 3,637 2,579 0.50 – – 0.078 – �56% 30%
Indicative value,$ per share
Change vs old
* iRABs including the estimated iRAB yet to be received for MRSK North�West, MRSK Siberia, MRSK Urals, MRSK Center, MRSK South, MRSK North Caucasus, Tomsk Disco and Tyumenenergo
** number of shares, market cap and MRSK Holding’s estimated stake after the upcoming new share issue (assuming only MRSK Holding and St Petersburg city participates, with MRSK Holding contributing R2,500 mln in cash at the current market price of R6.7 per share); MRSK Holding stake before that issue is 49.36% of the charter capital
*** number of shares, market cap and MRSK Holding’s estimated stake after the upcoming new share issue (assuming only MRSK Holding participates, contributing R2,544 mln in cash at the market price of R25.81 per share); MRSK Holding stake before that issue is 81.14%
**** number of shares, market cap and MRSK Holding’s estimated stake after the upcoming new share issue (assuming MRSK Holding participates, contributing R15,590 mln in cash at the market price of R142.46 per share); MRSK Holding stake before that issue is 82.08% (including the stake held by 100%�owned Tyumenenergo).
***** net debt as of September 30, 2012. For MRSK Holding, the sum of its cash (on the holding level) and the equity�adjusted net debt of MRSKs.
Source: Companies, Bloomberg, Sberbank Investment Research
MRSKS – RAB REVISED, PRIVATIZATIONS AHEAD NOVEMBER 2012
SBERBANK INVESTMENT RESEARCH 19
MRSK Holding SOTP
As before, our target price for MRSK Holding is based on the mid�value of our indicative ranges for
the equity of its subsidiaries, adjusted for MRSK Holding’s stakes. In the SOTP valuation we do not
account for the strategic premiums/discounts applied to some of the separate MRSKs and do not
apply any holding discount.
█ Deal with Neft�Aktiv. We account for the deal with Neft�Aktiv, as a result of which the latter
obtained in April almost 1,589 mln new shares of MRSK Holding (an almost 3.2% stake) via
MRSK Holding’s placement. In exchange, Tyumenenergo (MRSK Holding’s 100% owned
subsidiary) obtained Neft�Aktiv’s stakes in Kubanenergo and Tomsk Disco in November. That new
share issue (a total of 4.9 bln shares) has been registered and is included in the share count for
MRSK Holding. MRSK Holding’s total stake in Tomsk Disco commons is 85.5% (77.9% in the
total charter capital) after the deal.
█ Kubanenergo. MRSK Holding’s stake in Kubanenergo before the upcoming new share issue is
82.08% (including the stake held by 100% owned Tyumenenergo). We assume the holding will
be the only participant, and its stake will increase to 89.9% after the issue.
█ Lenenergo. The holding’s stake in Lenenergo before the upcoming new share issue is 49.36%.
We assume the holding and the city of St Petersburg will be the only ones to participate and
MRSK Holding’s stake will increase to 54.8% after the issue.
█ MRSK North Caucasus. Finally, we assume the holding will be the only one to participate in the
upcoming new share issue of MRSK North Caucasus and its stake will increase to 93.2% from the
current 81.14%.
We also add MRSK Holding’s net cash position (on the holding level) and account for the number of
shares after the upcoming R20.634 bln new share issue. This SOTP valuation returns a new target
price of $0.078 per share, implying a 56% downgrade from our previous target price of $0.175
per share. With 29% upside, we reiterate our BUY recommendation on the stock.

NOVEMBER 2012 MRSKS – RAB REVISED, PRIVATIZATIONS AHEAD
20 SBERBANK INVESTMENT RESEARCH
MRSK Holding SOTP valuation
Exp. RAB MRSK Fundamental 2013, $ bln* Low
endHigh end
Mid�value Holdingstake
equity value of the stake, $ mln
MOESK 5.5 1,541 1,862 1,702 50.9% 866Lenenergo** 2.2 422 554 488 54.8% 267MRSK North�West 1.0 213 252 232 55.4% 129MRSK Center�Volga 2.3 674 788 731 50.4% 369MRSK Siberia 1.1 261 380 320 52.9% 169MRSK Urals 1.4 514 583 549 51.5% 283MRSK Volga 1.5 603 677 640 67.6% 433MRSK Center 2.5 824 961 892 50.2% 448MRSK South 0.9 66 114 90 51.7% 46MRSK North Caucasus*** 0.6 225 311 268 93.2% 249Kubanenergo**** 0.6 634 680 657 89.9% 590Tomsk Disco***** 0.1 50 57 53 77.9% 42Tyumenenergo 1.4 164 343 253 100.0% 253Total aggregate 21.2MRSK Holding (equity adjusted) 12.4 4,145
MRSK Holding net cash 469MRSK Holding target equity value 4,613
Common Preferred Total
No of shares 57,424 2,075 59,500Target price, $ per share 0.078
Fundamental equity value, $ mln
* iRABs including the estimated iRAB yet to be received for MRSK North�West, MRSK Siberia, MRSK Urals, MRSK Center, MRSK South, MRSK North Caucasus, Tomsk Disco and Tyumenenergo
** number of shares, market cap and MRSK Holding’s estimated stake post the upcoming new share issue (assuming only MRSK Holding and the city of St Petersburg will participate, with MRSK Holding contributing R2,500 mln in cash at the current market price of R6.7 per share); MRSK Holding stake before that issue is 49.36% in the charter capital
*** number of shares, market cap and MRSK Holding’s estimated stake post the upcoming new share issue (assuming only MRSK Holding will participate, contributing R2,544 mln in cash at the market price of R25.81 per share); MRSK Holding stake before that issue is 81.14%
**** number of shares, market cap and MRSK Holding’s estimated stake post the upcoming new share issue (assuming only MRSK Holding will participate, contributing R15,590 mln in cash at the market price of R142.46 per share); MRSK Holding stake before that issue is 82.08% (including the stake held by 100%�owned Tyumenenergo)
***** this is MRSK Holding’s total stake (including the stake held by 100%�owned Tyumenenergo) post the deal with Neft�Aktiv
Note: MRSK Holding’s number of shares post the ongoing new share issue, assuming that R20.634 bln commons will be placed in favor of the state (from federal budget) at R2.16 per share and that nothing will be bought by minorities. The cash is then passed on down to the three subsidiaries.
Source: Companies, MRSK Holding, Sberbank Investment Research estimates
MRSK Holding upcoming new share issue
MRSK Holding’s BoD held a meeting in mid�October at which it set the new issue price at R2.16 per
share (the 2m weighted average market price) and recommended that shareholders approve the
placement of 16.885 bln new shares. On November 13, an MRSK Holding EGM approved the new
share issue at R2.16 per share (the record date was October 8). The purpose of the issue is to
finance federal investment projects in Leningrad Region (cable network renovation) and the
North Caucasus (a program aimed at electricity loss reduction), as well as projects related to the
2014 Winter Olympic Games in Sochi.
The new share issue price is above the current market price and might be considered a near�term
target for the stock. According to a recent company presentation, the volume should be at least
R20.634 bln, or circa 9.55 bln shares (funds from the federal budget to be invested in
MRSK Holding and consequently passed on to its subsidiaries). This means the charter capital
should increase 19% or more depending on realization of preemptive rights by minority
shareholders. We account for the new share issue of R20.634 bln but pass that cash on from MRSK
Holding down to the relevant subsidiaries, i.e. Lenenergo, MRSK North Caucasus and Kubanenergo.
We have yet to see whether assets constructed using budget funds will be included in the
subsidiaries’ RAB.
MRSKS – RAB REVISED, PRIVATIZATIONS AHEAD NOVEMBER 2012
SBERBANK INVESTMENT RESEARCH 21
Peer group
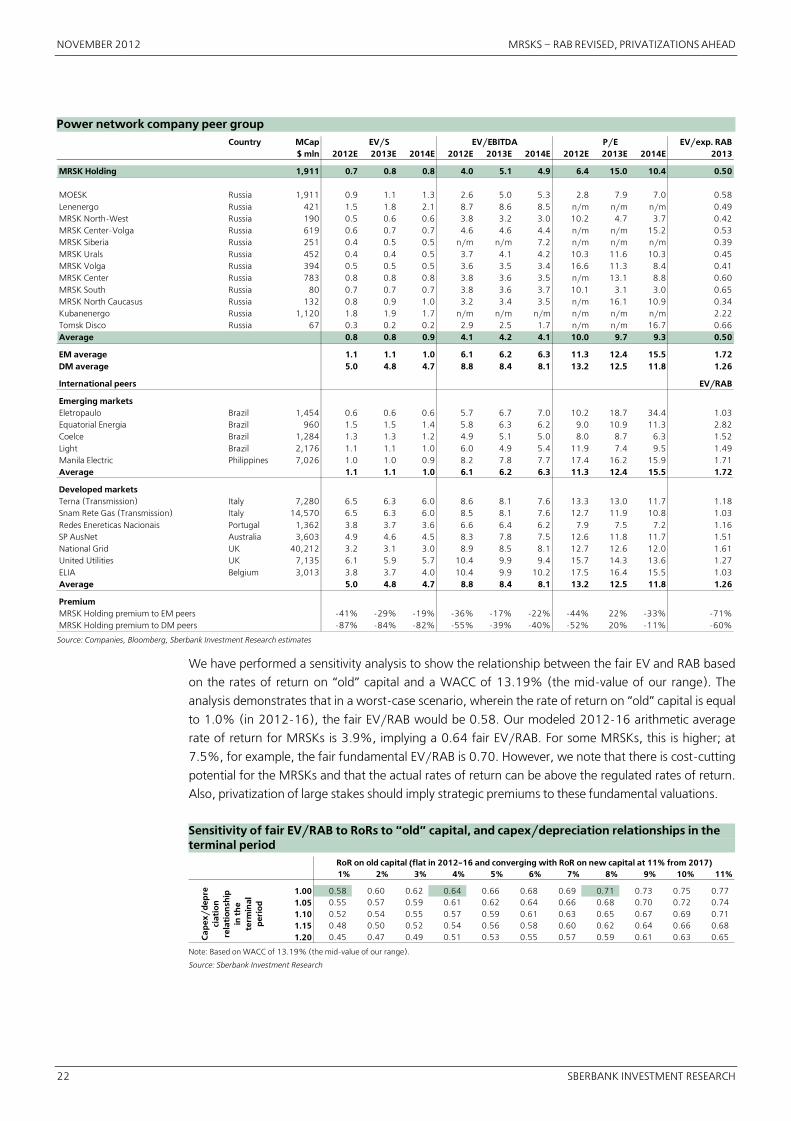
One of the key multiples to watch for MRSKs is EV/RAB. All the companies in our international peer
group trade at an EV/RAB of above 1.00 (the lowest at 1.03). EM and DM averages stand at 1.72
(1.44 excluding an outlier) and 1.26, respectively. At an average estimated EV/expected RAB of
0.50 for MRSKs and 0.41 for MRSK Volga, for example, these stocks look undervalued.
In the future, MRSKs may also trade above 1.00 fundamentally, if the long�term rate of return will
be above their WACC. However, this is not the case yet, as their current blended (for new and old
capital) regulated rates of return are below their WACCs and some regulatory risks still remain (i.e.
not all the branches have been transferred to RAB).
MRSKs also look undervalued on EV/EBITDA, some quite significantly. We note that the 2013
multiples are impacted by low rates of returns on “old” capital and rising debt to finance capex
programs that affect financials and thus EV/EBITDA and P/E multiples to different degrees (P/Es are
even negative in a few cases). The average 2013E and 2014E EV/EBITDA for the MRSKs are 4.2
and 4.1, respectively, while MRSK Holding’s are 5.1 and 4.9, versus the EM averages of 6.2 and
6.3. The 2013E and 2014E P/E are a respective 15.2 and 10.5, versus the EM averages of 12.4
and 15.5.
In terms of the separate MRSKs, on EV/EBITDA the relatively cheaper stocks are MRSK North�West,
MRSK Volga and MRSK Center, while on P/E they are MRSK North�West and MRSK South.
NOVEMBER 2012 MRSKS – RAB REVISED, PRIVATIZATIONS AHEAD
22 SBERBANK INVESTMENT RESEARCH
Power network company peer group
Country MCap EV/exp. RAB$ mln 2012E 2013E 2014E 2012E 2013E 2014E 2012E 2013E 2014E 2013
MRSK Holding 1,911 0.7 0.8 0.8 4.0 5.1 4.9 6.4 15.0 10.4 0.50
MOESK Russia 1,911 0.9 1.1 1.3 2.6 5.0 5.3 2.8 7.9 7.0 0.58Lenenergo Russia 421 1.5 1.8 2.1 8.7 8.6 8.5 n/m n/m n/m 0.49MRSK North�West Russia 190 0.5 0.6 0.6 3.8 3.2 3.0 10.2 4.7 3.7 0.42MRSK Center�Volga Russia 619 0.6 0.7 0.7 4.6 4.6 4.4 n/m n/m 15.2 0.53MRSK Siberia Russia 251 0.4 0.5 0.5 n/m n/m 7.2 n/m n/m n/m 0.39MRSK Urals Russia 452 0.4 0.4 0.5 3.7 4.1 4.2 10.3 11.6 10.3 0.45MRSK Volga Russia 394 0.5 0.5 0.5 3.6 3.5 3.4 16.6 11.3 8.4 0.41MRSK Center Russia 783 0.8 0.8 0.8 3.8 3.6 3.5 n/m 13.1 8.8 0.60MRSK South Russia 80 0.7 0.7 0.7 3.8 3.6 3.7 10.1 3.1 3.0 0.65MRSK North Caucasus Russia 132 0.8 0.9 1.0 3.2 3.4 3.5 n/m 16.1 10.9 0.34Kubanenergo Russia 1,120 1.8 1.9 1.7 n/m n/m n/m n/m n/m n/m 2.22Tomsk Disco Russia 67 0.3 0.2 0.2 2.9 2.5 1.7 n/m n/m 16.7 0.66Average 0.8 0.8 0.9 4.1 4.2 4.1 10.0 9.7 9.3 0.50
EM average 1.1 1.1 1.0 6.1 6.2 6.3 11.3 12.4 15.5 1.72DM average 5.0 4.8 4.7 8.8 8.4 8.1 13.2 12.5 11.8 1.26
International peers EV/RAB
Emerging marketsEletropaulo Brazil 1,454 0.6 0.6 0.6 5.7 6.7 7.0 10.2 18.7 34.4 1.03Equatorial Energia Brazil 960 1.5 1.5 1.4 5.8 6.3 6.2 9.0 10.9 11.3 2.82Coelce Brazil 1,284 1.3 1.3 1.2 4.9 5.1 5.0 8.0 8.7 6.3 1.52Light Brazil 2,176 1.1 1.1 1.0 6.0 4.9 5.4 11.9 7.4 9.5 1.49Manila Electric Philippines 7,026 1.0 1.0 0.9 8.2 7.8 7.7 17.4 16.2 15.9 1.71Average 1.1 1.1 1.0 6.1 6.2 6.3 11.3 12.4 15.5 1.72
Developed marketsTerna (Transmission) Italy 7,280 6.5 6.3 6.0 8.6 8.1 7.6 13.3 13.0 11.7 1.18Snam Rete Gas (Transmission) Italy 14,570 6.5 6.3 6.0 8.5 8.1 7.6 12.7 11.9 10.8 1.03Redes Enereticas Nacionais Portugal 1,362 3.8 3.7 3.6 6.6 6.4 6.2 7.9 7.5 7.2 1.16SP AusNet Australia 3,603 4.9 4.6 4.5 8.3 7.8 7.5 12.6 11.8 11.7 1.51National Grid UK 40,212 3.2 3.1 3.0 8.9 8.5 8.1 12.7 12.6 12.0 1.61United Utilities UK 7,135 6.1 5.9 5.7 10.4 9.9 9.4 15.7 14.3 13.6 1.27ELIA Belgium 3,013 3.8 3.7 4.0 10.4 9.9 10.2 17.5 16.4 15.5 1.03Average 5.0 4.8 4.7 8.8 8.4 8.1 13.2 12.5 11.8 1.26
PremiumMRSK Holding premium to EM peers �41% �29% �19% �36% �17% �22% �44% 22% �33% �71%MRSK Holding premium to DM peers �87% �84% �82% �55% �39% �40% �52% 20% �11% �60%
EV/S EV/EBITDA P/E
Source: Companies, Bloomberg, Sberbank Investment Research estimates
We have performed a sensitivity analysis to show the relationship between the fair EV and RAB based
on the rates of return on “old” capital and a WACC of 13.19% (the mid�value of our range). The
analysis demonstrates that in a worst�case scenario, wherein the rate of return on “old” capital is equal
to 1.0% (in 2012�16), the fair EV/RAB would be 0.58. Our modeled 2012�16 arithmetic average
rate of return for MRSKs is 3.9%, implying a 0.64 fair EV/RAB. For some MRSKs, this is higher; at
7.5%, for example, the fair fundamental EV/RAB is 0.70. However, we note that there is cost�cutting
potential for the MRSKs and that the actual rates of return can be above the regulated rates of return.
Also, privatization of large stakes should imply strategic premiums to these fundamental valuations.
Sensitivity of fair EV/RAB to RoRs to “old” capital, and capex/depreciation relationships in the terminal period
1% 2% 3% 4% 5% 6% 7% 8% 9% 10% 11%
1.00 0.58 0.60 0.62 0.64 0.66 0.68 0.69 0.71 0.73 0.75 0.77 1.05 0.55 0.57 0.59 0.61 0.62 0.64 0.66 0.68 0.70 0.72 0.74 1.10 0.52 0.54 0.55 0.57 0.59 0.61 0.63 0.65 0.67 0.69 0.71 1.15 0.48 0.50 0.52 0.54 0.56 0.58 0.60 0.62 0.64 0.66 0.68 1.20 0.45 0.47 0.49 0.51 0.53 0.55 0.57 0.59 0.61 0.63 0.65 C
apex
/d
epre
ciat
ion
re
lati
onsh
ip
in t
he
term
inal
p
erio
d
RoR on old capital (flat in 2012�16 and converging with RoR on new capital at 11% from 2017)
Note: Based on WACC of 13.19% (the mid�value of our range).
Source: Sberbank Investment Research

MRSKS – RAB REVISED, PRIVATIZATIONS AHEAD NOVEMBER 2012
SBERBANK INVESTMENT RESEARCH 23
Company Data Profiles
NOVEMBER 2012 MRSKS – RAB REVISED, PRIVATIZATIONS AHEAD
24 SBERBANK INVESTMENT RESEARCH
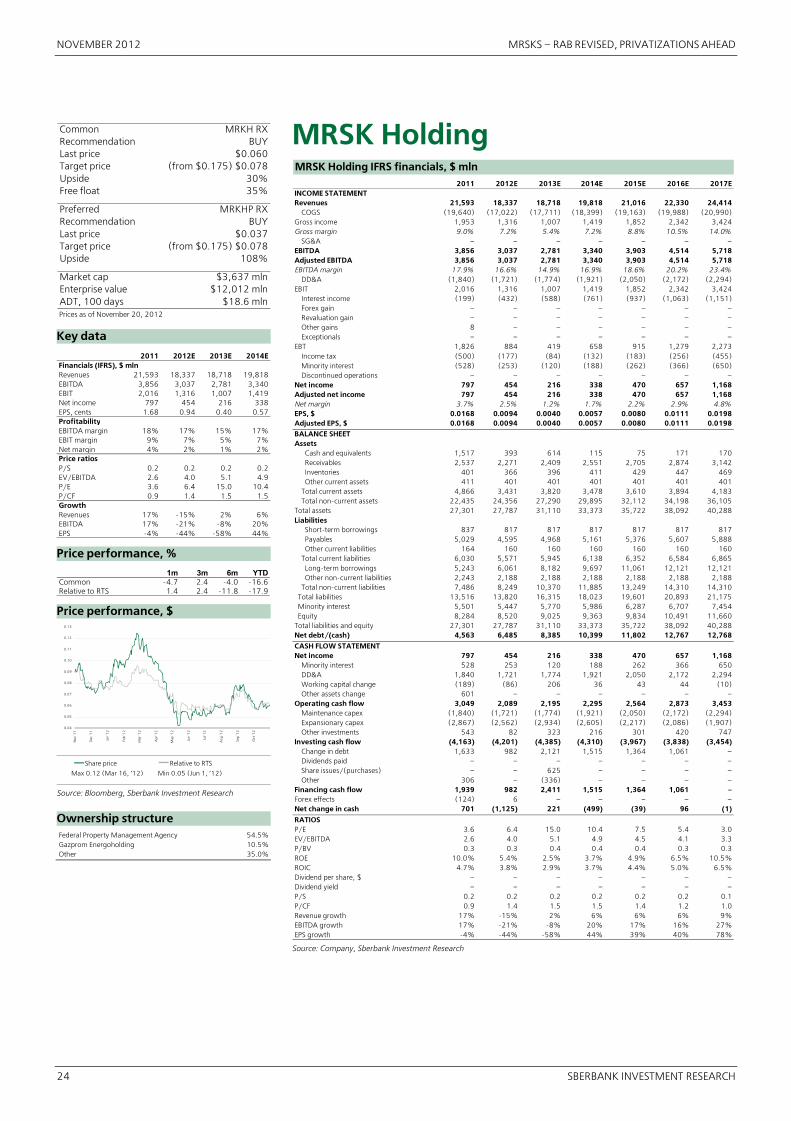
Common MRKH RXRecommendation BUYLast price $0.060Target price (from $0.175) $0.078Upside 30%Free float 35%
Preferred MRKHP RXRecommendation BUYLast price $0.037Target price (from $0.175) $0.078Upside 108%
Market cap $3,637 mlnEnterprise value $12,012 mlnADT, 100 days $18.6 mlnPrices as of November 20, 2012
Key data
2011 2012E 2013E 2014EFinancials (IFRS), $ mlnRevenues 21,593 18,337 18,718 19,818EBITDA 3,856 3,037 2,781 3,340EBIT 2,016 1,316 1,007 1,419Net income 797 454 216 338EPS, cents 1.68 0.94 0.40 0.57ProfitabilityEBITDA margin 18% 17% 15% 17%EBIT margin 9% 7% 5% 7%Net margin 4% 2% 1% 2%Price ratiosP/S 0.2 0.2 0.2 0.2EV/EBITDA 2.6 4.0 5.1 4.9P/E 3.6 6.4 15.0 10.4P/CF 0.9 1.4 1.5 1.5GrowthRevenues 17% �15% 2% 6%EBITDA 17% �21% �8% 20%EPS �4% �44% �58% 44%
Price performance, %
1m 3m 6m YTDCommon �4.7 2.4 �4.0 �16.6Relative to RTS 1.4 2.4 �11.8 �17.9 Price performance, $
0.04
0.05
0.06
0.07
0.08
0.09
0.10
0.11
0.12
0.13
No
v '1
1
Dec
'11
Jan
'12
Feb
'12
Mar
'12
Ap
r '1
2
May
'12
Jun
'12
Jul '
12
Au
g '1
2
Sep
'12
Oct
'12
Share price Relative to RTS
Max 0.12 (Mar 16, ’12) Min 0.05 (Jun 1, ’12)
Source: Bloomberg, Sberbank Investment Research
Ownership structure Federal Property Management Agency 54.5%Gazprom Energoholding 10.5%Other 35.0%
MRSK HoldingMRSK Holding IFRS financials, $ mln 2011 2012E 2013E 2014E 2015E 2016E 2017EINCOME STATEMENTRevenues 21,593 18,337 18,718 19,818 21,016 22,330 24,414 COGS (19,640) (17,022) (17,711) (18,399) (19,163) (19,988) (20,990)Gross income 1,953 1,316 1,007 1,419 1,852 2,342 3,424Gross margin 9.0% 7.2% 5.4% 7.2% 8.8% 10.5% 14.0% SG&A – – – – – – –EBITDA 3,856 3,037 2,781 3,340 3,903 4,514 5,718Adjusted EBITDA 3,856 3,037 2,781 3,340 3,903 4,514 5,718EBITDA margin 17.9% 16.6% 14.9% 16.9% 18.6% 20.2% 23.4% DD&A (1,840) (1,721) (1,774) (1,921) (2,050) (2,172) (2,294)EBIT 2,016 1,316 1,007 1,419 1,852 2,342 3,424 Interest income (199) (432) (588) (761) (937) (1,063) (1,151) Forex gain – – – – – – – Revaluation gain – – – – – – – Other gains 8 – – – – – – Exceptionals – – – – – – –EBT 1,826 884 419 658 915 1,279 2,273 Income tax (500) (177) (84) (132) (183) (256) (455) Minority interest (528) (253) (120) (188) (262) (366) (650) Discontinued operations – – – – – – –Net income 797 454 216 338 470 657 1,168Adjusted net income 797 454 216 338 470 657 1,168Net margin 3.7% 2.5% 1.2% 1.7% 2.2% 2.9% 4.8%EPS, $ 0.0168 0.0094 0.0040 0.0057 0.0080 0.0111 0.0198Adjusted EPS, $ 0.0168 0.0094 0.0040 0.0057 0.0080 0.0111 0.0198BALANCE SHEETAssets Cash and equivalents 1,517 393 614 115 75 171 170 Receivables 2,537 2,271 2,409 2,551 2,705 2,874 3,142 Inventories 401 366 396 411 429 447 469 Other current assets 411 401 401 401 401 401 401 Total current assets 4,866 3,431 3,820 3,478 3,610 3,894 4,183 Total non�current assets 22,435 24,356 27,290 29,895 32,112 34,198 36,105Total assets 27,301 27,787 31,110 33,373 35,722 38,092 40,288Liabilities Short�term borrowings 837 817 817 817 817 817 817 Payables 5,029 4,595 4,968 5,161 5,376 5,607 5,888 Other current liabilities 164 160 160 160 160 160 160 Total current liabilities 6,030 5,571 5,945 6,138 6,352 6,584 6,865 Long�term borrowings 5,243 6,061 8,182 9,697 11,061 12,121 12,121 Other non�current liabilities 2,243 2,188 2,188 2,188 2,188 2,188 2,188 Total non�current liabilities 7,486 8,249 10,370 11,885 13,249 14,310 14,310 Total liabilities 13,516 13,820 16,315 18,023 19,601 20,893 21,175 Minority interest 5,501 5,447 5,770 5,986 6,287 6,707 7,454 Equity 8,284 8,520 9,025 9,363 9,834 10,491 11,660Total liabilities and equity 27,301 27,787 31,110 33,373 35,722 38,092 40,288Net debt/(cash) 4,563 6,485 8,385 10,399 11,802 12,767 12,768CASH FLOW STATEMENTNet income 797 454 216 338 470 657 1,168 Minority interest 528 253 120 188 262 366 650 DD&A 1,840 1,721 1,774 1,921 2,050 2,172 2,294 Working capital change (189) (86) 206 36 43 44 (10) Other assets change 601 – – – – – –Operating cash flow 3,049 2,089 2,195 2,295 2,564 2,873 3,453 Maintenance capex (1,840) (1,721) (1,774) (1,921) (2,050) (2,172) (2,294) Expansionary capex (2,867) (2,562) (2,934) (2,605) (2,217) (2,086) (1,907) Other investments 543 82 323 216 301 420 747Investing cash flow (4,163) (4,201) (4,385) (4,310) (3,967) (3,838) (3,454) Change in debt 1,633 982 2,121 1,515 1,364 1,061 – Dividends paid – – – – – – – Share issues/(purchases) – – 625 – – – – Other 306 – (336) – – – –Financing cash flow 1,939 982 2,411 1,515 1,364 1,061 –Forex effects (124) 6 – – – – –Net change in cash 701 (1,125) 221 (499) (39) 96 (1)
RATIOSP/E 3.6 6.4 15.0 10.4 7.5 5.4 3.0EV/EBITDA 2.6 4.0 5.1 4.9 4.5 4.1 3.3P/BV 0.3 0.3 0.4 0.4 0.4 0.3 0.3ROE 10.0% 5.4% 2.5% 3.7% 4.9% 6.5% 10.5%ROIC 4.7% 3.8% 2.9% 3.7% 4.4% 5.0% 6.5%Dividend per share, $ – – – – – – –Dividend yield – – – – – – –P/S 0.2 0.2 0.2 0.2 0.2 0.2 0.1P/CF 0.9 1.4 1.5 1.5 1.4 1.2 1.0Revenue growth 17% �15% 2% 6% 6% 6% 9%EBITDA growth 17% �21% �8% 20% 17% 16% 27%EPS growth �4% �44% �58% 44% 39% 40% 78%
Source: Company, Sberbank Investment Research

MRSKS – RAB REVISED, PRIVATIZATIONS AHEAD NOVEMBER 2012
SBERBANK INVESTMENT RESEARCH 25
Common MRKC RXLast price $0.0185Spread 0.6%Indicative range $0.0266�0.0308Upside* 55%Shares outstanding 42,218 mlnFree float 28% ($223 mln)
Market cap $783 mlnEnterprise value $1,499 mln* based on mid�value of indicative range
Prices as of November 20, 2012
Key data 2011 2012E 2013E 2014EFinancials (IFRS), $ mlnRevenues 2,349 1,941 2,027 2,164EBITDA 518 396 445 500EBIT 304 93 140 185Net income 188 32 60 89EPS, cents 0.45 0.08 0.14 0.21ProfitabilityEBITDA margin 22% 20% 22% 23%EBIT margin 13% 5% 7% 9%Net margin 8% 2% 3% 4%Price ratiosP/S 0.3 0.4 0.4 0.4EV/EBITDA 2.6 3.8 3.6 3.5P/E 4.2 24.6 13.1 8.8P/CF 1.8 2.2 2.2 2.0GrowthRevenues 18% �17% 4% 7%EBITDA 22% �24% 12% 12%EPS 12% �83% 88% 49%
Price performance, % 1m 3m 6m YTD
Common �7.6 9.5 0.1 �2.8Relative to RTS �1.6 9.5 �8.0 �4.3
Price performance, $
0.012
0.014
0.016
0.018
0.020
0.022
0.024
0.026
0.028
0.030
No
v '1
1
Jan
'12
Mar
'12
May
'12
Jul '
12
Sep
'12
No
v '1
2
Share price Relative to RTS
Max 0.0265 (Mar 27, ’12) Min 0.0134 (Jun 1, ’12)
Source: Bloomberg, Sberbank Investment Research
Ownership structure MRSK Holding 50.2%Genhold 15.4%Immenso Enterprises 3.2%Energosoyuz Holdings 2.7%Other 28.5%
MRSK CenterMRSK Center IFRS financials, $ mln 2011 2012E 2013E 2014E 2015E 2016E 2017EINCOME STATEMENTRevenues 2,349 1,941 2,027 2,164 2,319 2,480 2,687 COGS (2,078) (1,847) (1,888) (1,978) (2,083) (2,191) (2,307)Gross income 271 93 140 185 236 289 380Gross margin 11.6% 4.8% 6.9% 8.6% 10.2% 11.7% 14.1% SG&A – – – – – – –EBITDA 518 396 445 500 566 636 744Adjusted EBITDA 518 396 445 500 566 636 744EBITDA margin 22.0% 20.4% 22.0% 23.1% 24.4% 25.6% 27.7% DD&A (214) (303) (305) (315) (330) (347) (364)EBIT 304 93 140 185 236 289 380 Interest income (53) (54) (65) (74) (87) (100) (109) Forex gain – – – – – – – Revaluation gain – – – – – – – Other gains – – – – – – – Exceptionals – – – – – – –EBT 251 40 75 111 149 189 271 Income tax (63) (8) (15) (22) (30) (38) (54) Minority interest (0) – – – – – – Discontinued operations – – – – – – –Net income 188 32 60 89 120 151 217Adjusted net income 188 32 60 89 120 151 217Net margin 8.0% 1.6% 3.0% 4.1% 5.2% 6.1% 8.1%EPS, $ 0.00446 0.00076 0.00142 0.00211 0.00283 0.00358 0.00513Adjusted EPS, $ 0.00446 0.00076 0.00142 0.00211 0.00283 0.00358 0.00513BALANCE SHEETAssets Cash and equivalents 82 46 35 48 18 36 101 Receivables 261 227 247 264 282 302 327 Inventories 45 42 45 47 49 52 55 Other current assets 14 14 14 14 14 14 14 Total current assets 403 330 341 372 363 404 498 Total non�current assets 1,983 2,137 2,293 2,514 2,779 3,026 3,256Total assets 2,386 2,467 2,633 2,887 3,142 3,430 3,753Liabilities Short�term borrowings 36 35 35 35 35 35 35 Payables 263 247 262 275 289 304 321 Other current liabilities 52 51 51 51 51 51 51 Total current liabilities 352 333 348 361 375 390 407 Long�term borrowings 623 727 818 970 1,091 1,212 1,303 Other non�current liabilities 213 207 207 207 207 207 207 Total non�current liabilities 836 935 1,026 1,177 1,298 1,420 1,510 Total liabilities 1,188 1,268 1,374 1,538 1,674 1,810 1,917 Minority interest 0 0 0 0 0 0 0 Equity 1,198 1,199 1,259 1,348 1,468 1,619 1,836Total liabilities and equity 2,386 2,467 2,633 2,887 3,142 3,430 3,753Net debt/(cash) 577 716 819 957 1,109 1,212 1,237CASH FLOW STATEMENTNet income 188 32 60 89 120 151 217 Minority interest 0 – – – – – – DD&A 214 303 305 315 330 347 364 Working capital change 13 20 (7) (6) (7) (7) (12) Other assets change 21 – – – – – –Operating cash flow 436 354 358 398 443 491 569 Maintenance capex (214) (303) (305) (315) (330) (347) (364) Expansionary capex (354) (211) (155) (222) (264) (247) (230) Other investments 39 – – – – – –Investing cash flow (529) (513) (461) (536) (594) (594) (594) Change in debt 214 124 91 152 121 121 91 Dividends paid (20) – – – – – – Share issues/(purchases) – – – – – – – Other (21) – – – – – –Financing cash flow 174 124 91 152 121 121 91Forex effects (8) (1) – – – – –Net change in cash 74 (36) (11) 13 (30) 18 66RATIOSP/E 4.2 24.6 13.1 8.8 6.5 5.2 3.6EV/EBITDA 2.6 3.8 3.6 3.5 3.3 3.1 2.7P/BV 0.7 0.7 0.6 0.6 0.5 0.5 0.4ROE 16.4% 2.7% 4.9% 6.8% 8.5% 9.8% 12.5%ROIC 12.3% 3.8% 5.3% 6.3% 7.3% 8.1% 9.6%Dividend per share, $ 0.00047 – – – – – –Dividend yield 2.5% – – – – – –P/S 0.3 0.4 0.4 0.4 0.3 0.3 0.3P/CF 1.8 2.2 2.2 2.0 1.8 1.6 1.4Revenue growth 18% �17% 4% 7% 7% 7% 8%EBITDA growth 22% �24% 12% 12% 13% 12% 17%EPS growth 12% �83% 88% 49% 34% 27% 43%
Source: Company, Sberbank Investment Research
NOVEMBER 2012 MRSKS – RAB REVISED, PRIVATIZATIONS AHEAD
26 SBERBANK INVESTMENT RESEARCH
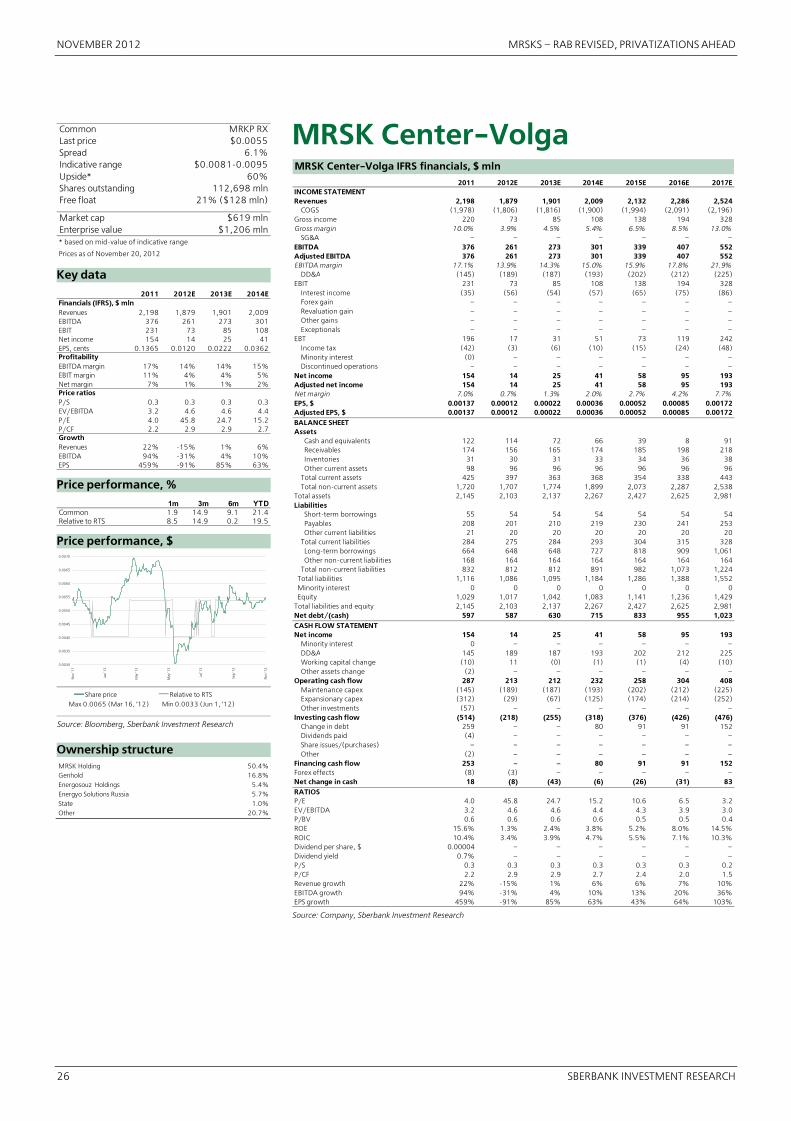
Common MRKP RXLast price $0.0055Spread 6.1%Indicative range $0.0081�0.0095Upside* 60%Shares outstanding 112,698 mlnFree float 21% ($128 mln)
Market cap $619 mlnEnterprise value $1,206 mln* based on mid�value of indicative range
Prices as of November 20, 2012
Key data 2011 2012E 2013E 2014EFinancials (IFRS), $ mlnRevenues 2,198 1,879 1,901 2,009EBITDA 376 261 273 301EBIT 231 73 85 108Net income 154 14 25 41EPS, cents 0.1365 0.0120 0.0222 0.0362ProfitabilityEBITDA margin 17% 14% 14% 15%EBIT margin 11% 4% 4% 5%Net margin 7% 1% 1% 2%Price ratiosP/S 0.3 0.3 0.3 0.3EV/EBITDA 3.2 4.6 4.6 4.4P/E 4.0 45.8 24.7 15.2P/CF 2.2 2.9 2.9 2.7GrowthRevenues 22% �15% 1% 6%EBITDA 94% �31% 4% 10%EPS 459% �91% 85% 63%
Price performance, % 1m 3m 6m YTD
Common 1.9 14.9 9.1 21.4Relative to RTS 8.5 14.9 0.2 19.5
Price performance, $
0.0030
0.0035
0.0040
0.0045
0.0050
0.0055
0.0060
0.0065
0.0070
No
v '1
1
Jan
'12
Mar
'12
May
'12
Jul '
12
Sep
'12
No
v '1
2
Share price Relative to RTS
Max 0.0065 (Mar 16, ’12) Min 0.0033 (Jun 1, ’12)
Source: Bloomberg, Sberbank Investment Research
Ownership structure MRSK Holding 50.4%Genhold 16.8%Energosouz Holdings 5.4%Energyo Solutions Russia 5.7%State 1.0%Other 20.7%
MRSK Center�Volga MRSK Center�Volga IFRS financials, $ mln 2011 2012E 2013E 2014E 2015E 2016E 2017EINCOME STATEMENTRevenues 2,198 1,879 1,901 2,009 2,132 2,286 2,524 COGS (1,978) (1,806) (1,816) (1,900) (1,994) (2,091) (2,196)Gross income 220 73 85 108 138 194 328Gross margin 10.0% 3.9% 4.5% 5.4% 6.5% 8.5% 13.0% SG&A – – – – – – –EBITDA 376 261 273 301 339 407 552Adjusted EBITDA 376 261 273 301 339 407 552EBITDA margin 17.1% 13.9% 14.3% 15.0% 15.9% 17.8% 21.9% DD&A (145) (189) (187) (193) (202) (212) (225)EBIT 231 73 85 108 138 194 328 Interest income (35) (56) (54) (57) (65) (75) (86) Forex gain – – – – – – – Revaluation gain – – – – – – – Other gains – – – – – – – Exceptionals – – – – – – –EBT 196 17 31 51 73 119 242 Income tax (42) (3) (6) (10) (15) (24) (48) Minority interest (0) – – – – – – Discontinued operations – – – – – – –Net income 154 14 25 41 58 95 193Adjusted net income 154 14 25 41 58 95 193Net margin 7.0% 0.7% 1.3% 2.0% 2.7% 4.2% 7.7%EPS, $ 0.00137 0.00012 0.00022 0.00036 0.00052 0.00085 0.00172Adjusted EPS, $ 0.00137 0.00012 0.00022 0.00036 0.00052 0.00085 0.00172BALANCE SHEETAssets Cash and equivalents 122 114 72 66 39 8 91 Receivables 174 156 165 174 185 198 218 Inventories 31 30 31 33 34 36 38 Other current assets 98 96 96 96 96 96 96 Total current assets 425 397 363 368 354 338 443 Total non�current assets 1,720 1,707 1,774 1,899 2,073 2,287 2,538Total assets 2,145 2,103 2,137 2,267 2,427 2,625 2,981Liabilities Short�term borrowings 55 54 54 54 54 54 54 Payables 208 201 210 219 230 241 253 Other current liabilities 21 20 20 20 20 20 20 Total current liabilities 284 275 284 293 304 315 328 Long�term borrowings 664 648 648 727 818 909 1,061 Other non�current liabilities 168 164 164 164 164 164 164 Total non�current liabilities 832 812 812 891 982 1,073 1,224 Total liabilities 1,116 1,086 1,095 1,184 1,286 1,388 1,552 Minority interest 0 0 0 0 0 0 0 Equity 1,029 1,017 1,042 1,083 1,141 1,236 1,429Total liabilities and equity 2,145 2,103 2,137 2,267 2,427 2,625 2,981Net debt/(cash) 597 587 630 715 833 955 1,023CASH FLOW STATEMENTNet income 154 14 25 41 58 95 193 Minority interest 0 – – – – – – DD&A 145 189 187 193 202 212 225 Working capital change (10) 11 (0) (1) (1) (4) (10) Other assets change (2) – – – – – –Operating cash flow 287 213 212 232 258 304 408 Maintenance capex (145) (189) (187) (193) (202) (212) (225) Expansionary capex (312) (29) (67) (125) (174) (214) (252) Other investments (57) – – – – – –Investing cash flow (514) (218) (255) (318) (376) (426) (476) Change in debt 259 – – 80 91 91 152 Dividends paid (4) – – – – – – Share issues/(purchases) – – – – – – – Other (2) – – – – – –Financing cash flow 253 – – 80 91 91 152Forex effects (8) (3) – – – – –Net change in cash 18 (8) (43) (6) (26) (31) 83RATIOSP/E 4.0 45.8 24.7 15.2 10.6 6.5 3.2EV/EBITDA 3.2 4.6 4.6 4.4 4.3 3.9 3.0P/BV 0.6 0.6 0.6 0.6 0.5 0.5 0.4ROE 15.6% 1.3% 2.4% 3.8% 5.2% 8.0% 14.5%ROIC 10.4% 3.4% 3.9% 4.7% 5.5% 7.1% 10.3%Dividend per share, $ 0.00004 – – – – – –Dividend yield 0.7% – – – – – –P/S 0.3 0.3 0.3 0.3 0.3 0.3 0.2P/CF 2.2 2.9 2.9 2.7 2.4 2.0 1.5Revenue growth 22% �15% 1% 6% 6% 7% 10%EBITDA growth 94% �31% 4% 10% 13% 20% 36%EPS growth 459% �91% 85% 63% 43% 64% 103%
Source: Company, Sberbank Investment Research
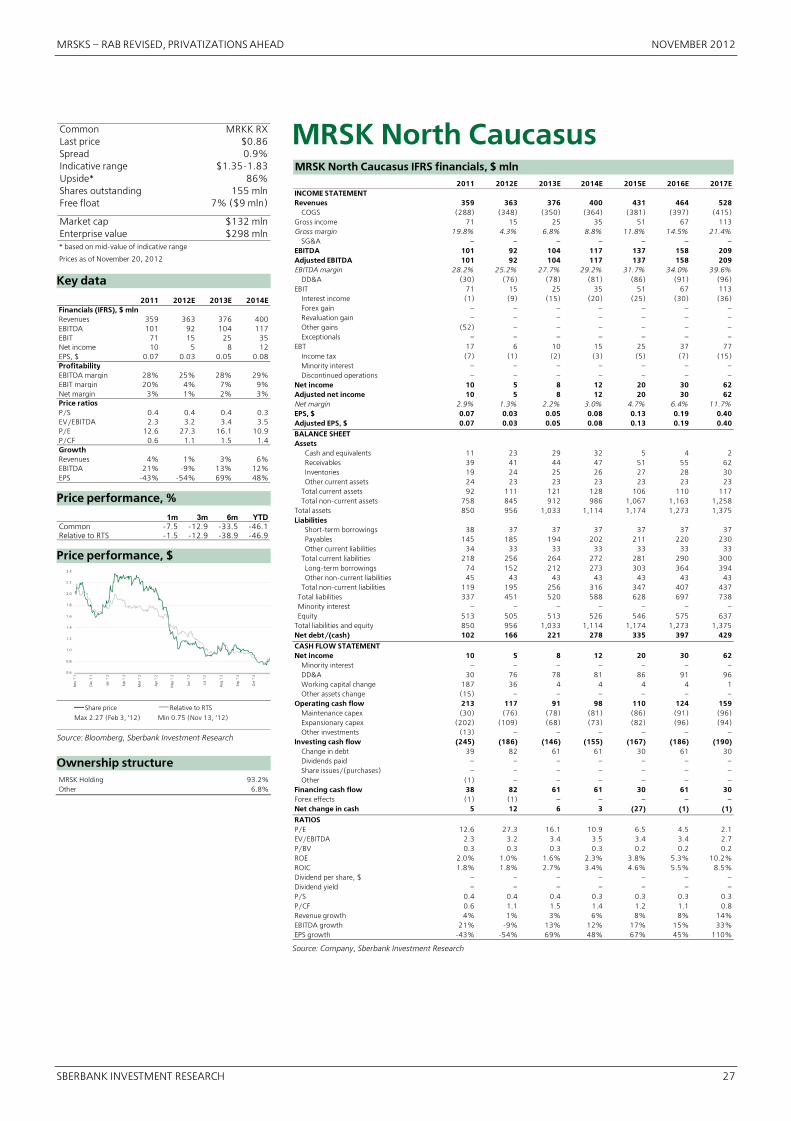
MRSKS – RAB REVISED, PRIVATIZATIONS AHEAD NOVEMBER 2012
SBERBANK INVESTMENT RESEARCH 27
Common MRKK RXLast price $0.86Spread 0.9%Indicative range $1.35�1.83Upside* 86%Shares outstanding 155 mlnFree float 7% ($9 mln)
Market cap $132 mlnEnterprise value $298 mln* based on mid�value of indicative range
Prices as of November 20, 2012
Key data
2011 2012E 2013E 2014EFinancials (IFRS), $ mlnRevenues 359 363 376 400EBITDA 101 92 104 117EBIT 71 15 25 35Net income 10 5 8 12EPS, $ 0.07 0.03 0.05 0.08ProfitabilityEBITDA margin 28% 25% 28% 29%EBIT margin 20% 4% 7% 9%Net margin 3% 1% 2% 3%Price ratiosP/S 0.4 0.4 0.4 0.3EV/EBITDA 2.3 3.2 3.4 3.5P/E 12.6 27.3 16.1 10.9P/CF 0.6 1.1 1.5 1.4GrowthRevenues 4% 1% 3% 6%EBITDA 21% �9% 13% 12%EPS �43% �54% 69% 48%
Price performance, %
1m 3m 6m YTDCommon �7.5 �12.9 �33.5 �46.1Relative to RTS �1.5 �12.9 �38.9 �46.9 Price performance, $
0.6
0.8
1.0
1.2
1.4
1.6
1.8
2.0
2.2
2.4
No
v '1
1
Dec
'11
Jan
'12
Feb
'12
Mar
'12
Ap
r '1
2
May
'12
Jun
'12
Jul '
12
Au
g '1
2
Sep
'12
Oct
'12
Share price Relative to RTS
Max 2.27 (Feb 3, ’12) Min 0.75 (Nov 13, ’12)
Source: Bloomberg, Sberbank Investment Research
Ownership structure MRSK Holding 93.2%Other 6.8%
MRSK North Caucasus MRSK North Caucasus IFRS financials, $ mln 2011 2012E 2013E 2014E 2015E 2016E 2017EINCOME STATEMENTRevenues 359 363 376 400 431 464 528 COGS (288) (348) (350) (364) (381) (397) (415)Gross income 71 15 25 35 51 67 113Gross margin 19.8% 4.3% 6.8% 8.8% 11.8% 14.5% 21.4% SG&A – – – – – – –EBITDA 101 92 104 117 137 158 209Adjusted EBITDA 101 92 104 117 137 158 209EBITDA margin 28.2% 25.2% 27.7% 29.2% 31.7% 34.0% 39.6% DD&A (30) (76) (78) (81) (86) (91) (96)EBIT 71 15 25 35 51 67 113 Interest income (1) (9) (15) (20) (25) (30) (36) Forex gain – – – – – – – Revaluation gain – – – – – – – Other gains (52) – – – – – – Exceptionals – – – – – – –EBT 17 6 10 15 25 37 77 Income tax (7) (1) (2) (3) (5) (7) (15) Minority interest – – – – – – – Discontinued operations – – – – – – –Net income 10 5 8 12 20 30 62Adjusted net income 10 5 8 12 20 30 62Net margin 2.9% 1.3% 2.2% 3.0% 4.7% 6.4% 11.7%EPS, $ 0.07 0.03 0.05 0.08 0.13 0.19 0.40Adjusted EPS, $ 0.07 0.03 0.05 0.08 0.13 0.19 0.40BALANCE SHEETAssets Cash and equivalents 11 23 29 32 5 4 2 Receivables 39 41 44 47 51 55 62 Inventories 19 24 25 26 27 28 30 Other current assets 24 23 23 23 23 23 23 Total current assets 92 111 121 128 106 110 117 Total non�current assets 758 845 912 986 1,067 1,163 1,258Total assets 850 956 1,033 1,114 1,174 1,273 1,375Liabilities Short�term borrowings 38 37 37 37 37 37 37 Payables 145 185 194 202 211 220 230 Other current liabilities 34 33 33 33 33 33 33 Total current liabilities 218 256 264 272 281 290 300 Long�term borrowings 74 152 212 273 303 364 394 Other non�current liabilities 45 43 43 43 43 43 43 Total non�current liabilities 119 195 256 316 347 407 437 Total liabilities 337 451 520 588 628 697 738 Minority interest – – – – – – – Equity 513 505 513 526 546 575 637Total liabilities and equity 850 956 1,033 1,114 1,174 1,273 1,375Net debt/(cash) 102 166 221 278 335 397 429CASH FLOW STATEMENTNet income 10 5 8 12 20 30 62 Minority interest – – – – – – – DD&A 30 76 78 81 86 91 96 Working capital change 187 36 4 4 4 4 1 Other assets change (15) – – – – – –Operating cash flow 213 117 91 98 110 124 159 Maintenance capex (30) (76) (78) (81) (86) (91) (96) Expansionary capex (202) (109) (68) (73) (82) (96) (94) Other investments (13) – – – – – –Investing cash flow (245) (186) (146) (155) (167) (186) (190) Change in debt 39 82 61 61 30 61 30 Dividends paid – – – – – – – Share issues/(purchases) – – – – – – – Other (1) – – – – – –Financing cash flow 38 82 61 61 30 61 30Forex effects (1) (1) – – – – –Net change in cash 5 12 6 3 (27) (1) (1)
RATIOSP/E 12.6 27.3 16.1 10.9 6.5 4.5 2.1EV/EBITDA 2.3 3.2 3.4 3.5 3.4 3.4 2.7P/BV 0.3 0.3 0.3 0.3 0.2 0.2 0.2ROE 2.0% 1.0% 1.6% 2.3% 3.8% 5.3% 10.2%ROIC 1.8% 1.8% 2.7% 3.4% 4.6% 5.5% 8.5%Dividend per share, $ – – – – – – –Dividend yield – – – – – – –P/S 0.4 0.4 0.4 0.3 0.3 0.3 0.3P/CF 0.6 1.1 1.5 1.4 1.2 1.1 0.8Revenue growth 4% 1% 3% 6% 8% 8% 14%EBITDA growth 21% �9% 13% 12% 17% 15% 33%EPS growth �43% �54% 69% 48% 67% 45% 110%
Source: Company, Sberbank Investment Research
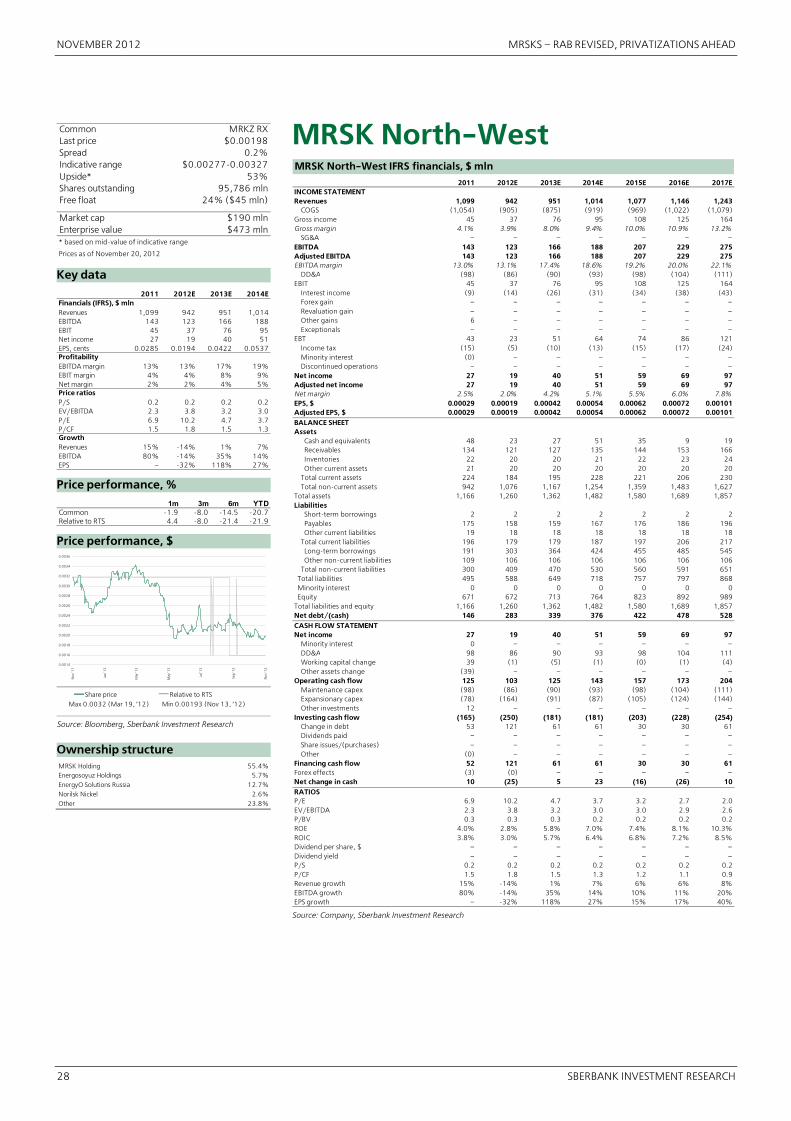
NOVEMBER 2012 MRSKS – RAB REVISED, PRIVATIZATIONS AHEAD
28 SBERBANK INVESTMENT RESEARCH
Common MRKZ RXLast price $0.00198Spread 0.2%Indicative range $0.00277�0.00327Upside* 53%Shares outstanding 95,786 mlnFree float 24% ($45 mln)
Market cap $190 mlnEnterprise value $473 mln* based on mid�value of indicative range
Prices as of November 20, 2012
Key data 2011 2012E 2013E 2014EFinancials (IFRS), $ mlnRevenues 1,099 942 951 1,014EBITDA 143 123 166 188EBIT 45 37 76 95Net income 27 19 40 51EPS, cents 0.0285 0.0194 0.0422 0.0537ProfitabilityEBITDA margin 13% 13% 17% 19%EBIT margin 4% 4% 8% 9%Net margin 2% 2% 4% 5%Price ratiosP/S 0.2 0.2 0.2 0.2EV/EBITDA 2.3 3.8 3.2 3.0P/E 6.9 10.2 4.7 3.7P/CF 1.5 1.8 1.5 1.3GrowthRevenues 15% �14% 1% 7%EBITDA 80% �14% 35% 14%EPS – �32% 118% 27%
Price performance, % 1m 3m 6m YTD
Common �1.9 �8.0 �14.5 �20.7Relative to RTS 4.4 �8.0 �21.4 �21.9
Price performance, $
0.0014
0.0016
0.0018
0.0020
0.0022
0.0024
0.0026
0.0028
0.0030
0.0032
0.0034
0.0036
No
v '1
1
Jan
'12
Mar
'12
May
'12
Jul '
12
Sep
'12
No
v '1
2
Share price Relative to RTS
Max 0.0032 (Mar 19, ’12) Min 0.00193 (Nov 13, ’12)
Source: Bloomberg, Sberbank Investment Research
Ownership structure MRSK Holding 55.4%Energosoyuz Holdings 5.7%EnergyO Solutions Russia 12.7%Norilsk Nickel 2.6%Other 23.8%
MRSK North�WestMRSK North�West IFRS financials, $ mln 2011 2012E 2013E 2014E 2015E 2016E 2017EINCOME STATEMENTRevenues 1,099 942 951 1,014 1,077 1,146 1,243 COGS (1,054) (905) (875) (919) (969) (1,022) (1,079)Gross income 45 37 76 95 108 125 164Gross margin 4.1% 3.9% 8.0% 9.4% 10.0% 10.9% 13.2% SG&A – – – – – – –EBITDA 143 123 166 188 207 229 275Adjusted EBITDA 143 123 166 188 207 229 275EBITDA margin 13.0% 13.1% 17.4% 18.6% 19.2% 20.0% 22.1% DD&A (98) (86) (90) (93) (98) (104) (111)EBIT 45 37 76 95 108 125 164 Interest income (9) (14) (26) (31) (34) (38) (43) Forex gain – – – – – – – Revaluation gain – – – – – – – Other gains 6 – – – – – – Exceptionals – – – – – – –EBT 43 23 51 64 74 86 121 Income tax (15) (5) (10) (13) (15) (17) (24) Minority interest (0) – – – – – – Discontinued operations – – – – – – –Net income 27 19 40 51 59 69 97Adjusted net income 27 19 40 51 59 69 97Net margin 2.5% 2.0% 4.2% 5.1% 5.5% 6.0% 7.8%EPS, $ 0.00029 0.00019 0.00042 0.00054 0.00062 0.00072 0.00101Adjusted EPS, $ 0.00029 0.00019 0.00042 0.00054 0.00062 0.00072 0.00101BALANCE SHEETAssets Cash and equivalents 48 23 27 51 35 9 19 Receivables 134 121 127 135 144 153 166 Inventories 22 20 20 21 22 23 24 Other current assets 21 20 20 20 20 20 20 Total current assets 224 184 195 228 221 206 230 Total non�current assets 942 1,076 1,167 1,254 1,359 1,483 1,627Total assets 1,166 1,260 1,362 1,482 1,580 1,689 1,857Liabilities Short�term borrowings 2 2 2 2 2 2 2 Payables 175 158 159 167 176 186 196 Other current liabilities 19 18 18 18 18 18 18 Total current liabilities 196 179 179 187 197 206 217 Long�term borrowings 191 303 364 424 455 485 545 Other non�current liabilities 109 106 106 106 106 106 106 Total non�current liabilities 300 409 470 530 560 591 651 Total liabilities 495 588 649 718 757 797 868 Minority interest 0 0 0 0 0 0 0 Equity 671 672 713 764 823 892 989Total liabilities and equity 1,166 1,260 1,362 1,482 1,580 1,689 1,857Net debt/(cash) 146 283 339 376 422 478 528CASH FLOW STATEMENTNet income 27 19 40 51 59 69 97 Minority interest 0 – – – – – – DD&A 98 86 90 93 98 104 111 Working capital change 39 (1) (5) (1) (0) (1) (4) Other assets change (39) – – – – – –Operating cash flow 125 103 125 143 157 173 204 Maintenance capex (98) (86) (90) (93) (98) (104) (111) Expansionary capex (78) (164) (91) (87) (105) (124) (144) Other investments 12 – – – – – –Investing cash flow (165) (250) (181) (181) (203) (228) (254) Change in debt 53 121 61 61 30 30 61 Dividends paid – – – – – – – Share issues/(purchases) – – – – – – – Other (0) – – – – – –Financing cash flow 52 121 61 61 30 30 61Forex effects (3) (0) – – – – –Net change in cash 10 (25) 5 23 (16) (26) 10RATIOSP/E 6.9 10.2 4.7 3.7 3.2 2.7 2.0EV/EBITDA 2.3 3.8 3.2 3.0 3.0 2.9 2.6P/BV 0.3 0.3 0.3 0.2 0.2 0.2 0.2ROE 4.0% 2.8% 5.8% 7.0% 7.4% 8.1% 10.3%ROIC 3.8% 3.0% 5.7% 6.4% 6.8% 7.2% 8.5%Dividend per share, $ – – – – – – –Dividend yield – – – – – – –P/S 0.2 0.2 0.2 0.2 0.2 0.2 0.2P/CF 1.5 1.8 1.5 1.3 1.2 1.1 0.9Revenue growth 15% �14% 1% 7% 6% 6% 8%EBITDA growth 80% �14% 35% 14% 10% 11% 20%EPS growth – �32% 118% 27% 15% 17% 40%
Source: Company, Sberbank Investment Research
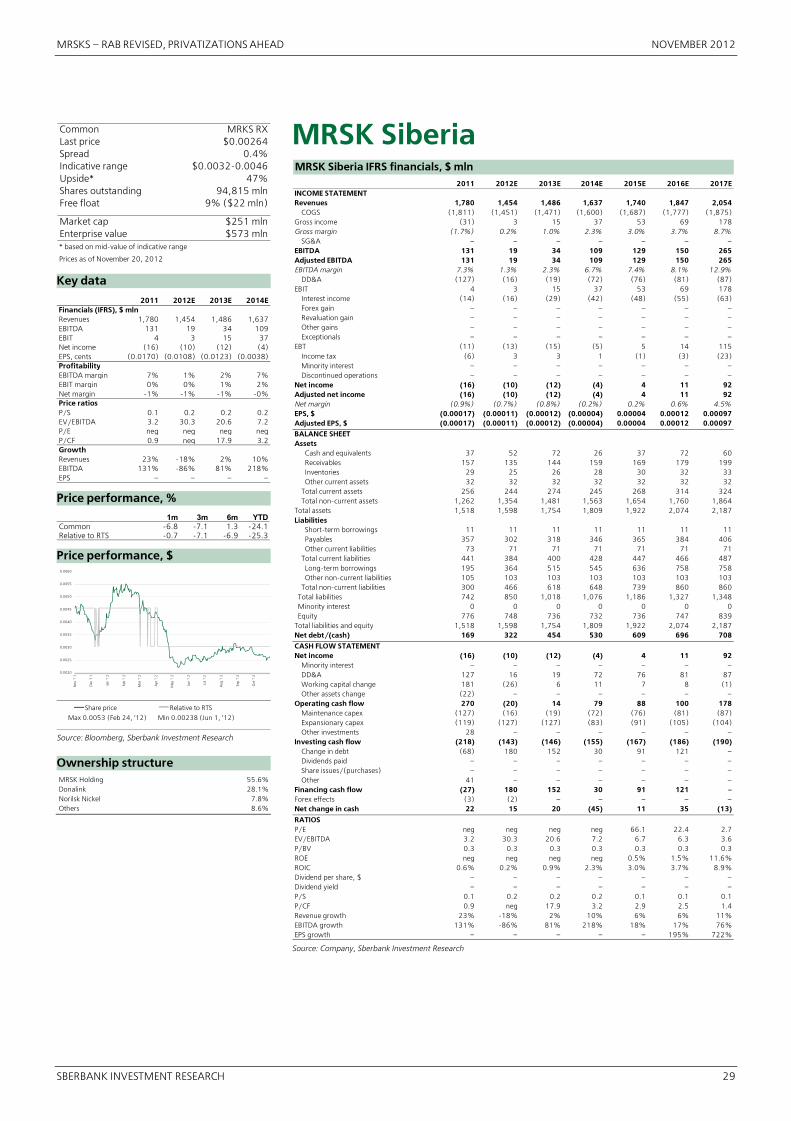
MRSKS – RAB REVISED, PRIVATIZATIONS AHEAD NOVEMBER 2012
SBERBANK INVESTMENT RESEARCH 29
Common MRKS RXLast price $0.00264Spread 0.4%Indicative range $0.0032�0.0046Upside* 47%Shares outstanding 94,815 mlnFree float 9% ($22 mln)
Market cap $251 mlnEnterprise value $573 mln* based on mid�value of indicative range
Prices as of November 20, 2012
Key data
2011 2012E 2013E 2014EFinancials (IFRS), $ mlnRevenues 1,780 1,454 1,486 1,637EBITDA 131 19 34 109EBIT 4 3 15 37Net income (16) (10) (12) (4)EPS, cents (0.0170) (0.0108) (0.0123) (0.0038)ProfitabilityEBITDA margin 7% 1% 2% 7%EBIT margin 0% 0% 1% 2%Net margin �1% �1% �1% �0%Price ratiosP/S 0.1 0.2 0.2 0.2EV/EBITDA 3.2 30.3 20.6 7.2P/E neg neg neg negP/CF 0.9 neg 17.9 3.2GrowthRevenues 23% �18% 2% 10%EBITDA 131% �86% 81% 218%EPS – – – –
Price performance, %
1m 3m 6m YTDCommon �6.8 �7.1 1.3 �24.1Relative to RTS �0.7 �7.1 �6.9 �25.3 Price performance, $
0.0020
0.0025
0.0030
0.0035
0.0040
0.0045
0.0050
0.0055
0.0060
No
v '1
1
Dec
'11
Jan
'12
Feb
'12
Mar
'12
Ap
r '1
2
May
'12
Jun
'12
Jul '
12
Au
g '1
2
Sep
'12
Oct
'12
Share price Relative to RTS
Max 0.0053 (Feb 24, ’12) Min 0.00238 (Jun 1, ’12)
Source: Bloomberg, Sberbank Investment Research
Ownership structure MRSK Holding 55.6%Donalink 28.1%Norilsk Nickel 7.8%Others 8.6%
MRSK SiberiaMRSK Siberia IFRS financials, $ mln 2011 2012E 2013E 2014E 2015E 2016E 2017EINCOME STATEMENTRevenues 1,780 1,454 1,486 1,637 1,740 1,847 2,054 COGS (1,811) (1,451) (1,471) (1,600) (1,687) (1,777) (1,875)Gross income (31) 3 15 37 53 69 178Gross margin (1.7%) 0.2% 1.0% 2.3% 3.0% 3.7% 8.7% SG&A – – – – – – –EBITDA 131 19 34 109 129 150 265Adjusted EBITDA 131 19 34 109 129 150 265EBITDA margin 7.3% 1.3% 2.3% 6.7% 7.4% 8.1% 12.9% DD&A (127) (16) (19) (72) (76) (81) (87)EBIT 4 3 15 37 53 69 178 Interest income (14) (16) (29) (42) (48) (55) (63) Forex gain – – – – – – – Revaluation gain – – – – – – – Other gains – – – – – – – Exceptionals – – – – – – –EBT (11) (13) (15) (5) 5 14 115 Income tax (6) 3 3 1 (1) (3) (23) Minority interest – – – – – – – Discontinued operations – – – – – – –Net income (16) (10) (12) (4) 4 11 92Adjusted net income (16) (10) (12) (4) 4 11 92Net margin (0.9%) (0.7%) (0.8%) (0.2%) 0.2% 0.6% 4.5%EPS, $ (0.00017) (0.00011) (0.00012) (0.00004) 0.00004 0.00012 0.00097Adjusted EPS, $ (0.00017) (0.00011) (0.00012) (0.00004) 0.00004 0.00012 0.00097BALANCE SHEETAssets Cash and equivalents 37 52 72 26 37 72 60 Receivables 157 135 144 159 169 179 199 Inventories 29 25 26 28 30 32 33 Other current assets 32 32 32 32 32 32 32 Total current assets 256 244 274 245 268 314 324 Total non�current assets 1,262 1,354 1,481 1,563 1,654 1,760 1,864Total assets 1,518 1,598 1,754 1,809 1,922 2,074 2,187Liabilities Short�term borrowings 11 11 11 11 11 11 11 Payables 357 302 318 346 365 384 406 Other current liabilities 73 71 71 71 71 71 71 Total current liabilities 441 384 400 428 447 466 487 Long�term borrowings 195 364 515 545 636 758 758 Other non�current liabilities 105 103 103 103 103 103 103 Total non�current liabilities 300 466 618 648 739 860 860 Total liabilities 742 850 1,018 1,076 1,186 1,327 1,348 Minority interest 0 0 0 0 0 0 0 Equity 776 748 736 732 736 747 839Total liabilities and equity 1,518 1,598 1,754 1,809 1,922 2,074 2,187Net debt/(cash) 169 322 454 530 609 696 708CASH FLOW STATEMENTNet income (16) (10) (12) (4) 4 11 92 Minority interest – – – – – – – DD&A 127 16 19 72 76 81 87 Working capital change 181 (26) 6 11 7 8 (1) Other assets change (22) – – – – – –Operating cash flow 270 (20) 14 79 88 100 178 Maintenance capex (127) (16) (19) (72) (76) (81) (87) Expansionary capex (119) (127) (127) (83) (91) (105) (104) Other investments 28 – – – – – –Investing cash flow (218) (143) (146) (155) (167) (186) (190) Change in debt (68) 180 152 30 91 121 – Dividends paid – – – – – – – Share issues/(purchases) – – – – – – – Other 41 – – – – – –Financing cash flow (27) 180 152 30 91 121 –Forex effects (3) (2) – – – – –Net change in cash 22 15 20 (45) 11 35 (13)
RATIOSP/E neg neg neg neg 66.1 22.4 2.7EV/EBITDA 3.2 30.3 20.6 7.2 6.7 6.3 3.6P/BV 0.3 0.3 0.3 0.3 0.3 0.3 0.3ROE neg neg neg neg 0.5% 1.5% 11.6%ROIC 0.6% 0.2% 0.9% 2.3% 3.0% 3.7% 8.9%Dividend per share, $ – – – – – – –Dividend yield – – – – – – –P/S 0.1 0.2 0.2 0.2 0.1 0.1 0.1P/CF 0.9 neg 17.9 3.2 2.9 2.5 1.4Revenue growth 23% �18% 2% 10% 6% 6% 11%EBITDA growth 131% �86% 81% 218% 18% 17% 76%EPS growth – – – – – 195% 722%
Source: Company, Sberbank Investment Research

NOVEMBER 2012 MRSKS – RAB REVISED, PRIVATIZATIONS AHEAD
30 SBERBANK INVESTMENT RESEARCH
Common MRKY RXLast price $0.00160Spread 0.4%Indicative range $0.00165�0.00283Upside* 40%Shares outstanding 49,811 mlnFree float 32% ($26 mln)
Market cap $80 mlnEnterprise value $538 mln* based on mid�value of indicative range
Prices as of November 20, 2012
Key data 2011 2012E 2013E 2014EFinancials (IFRS), $ mlnRevenues 829 787 806 846EBITDA 195 140 161 168EBIT 120 53 74 79Net income 4 8 26 26EPS, cents 0.0080 0.0158 0.0523 0.0525ProfitabilityEBITDA margin 24% 18% 20% 20%EBIT margin 15% 7% 9% 9%Net margin 0% 1% 3% 3%Price ratiosP/S 0.1 0.1 0.1 0.1EV/EBITDA 2.8 3.8 3.6 3.7P/E 20.0 10.1 3.1 3.0P/CF 0.9 0.7 0.8 0.7GrowthRevenues 15% �5% 2% 5%EBITDA 43% �28% 15% 4%EPS – 98% 231% 0%
Price performance, % 1m 3m 6m YTD
Common �4.3 �6.0 �4.6 �22.8Relative to RTS 1.9 �6.0 �12.4 �24.0
Price performance, $
0.0012
0.0014
0.0016
0.0018
0.0020
0.0022
0.0024
0.0026
0.0028
0.0030
No
v '1
1
Jan
'12
Mar
'12
May
'12
Jul '
12
Sep
'12
No
v '1
2
Share price Relative to RTS
Max 0.00275 (Feb 3, ’12) Min 0.00154 (Jun 4, ’12)
Source: Bloomberg, Sberbank Investment Research
Ownership structure MRSK Holding 51.7%Lancrenan Investments 9.3%Protsvetanie Holdings 6.9%State 0.1%Others 32.1%
MRSK SouthMRSK South IFRS financials, $ mln 2011 2012E 2013E 2014E 2015E 2016E 2017EINCOME STATEMENTRevenues 829 787 806 846 897 951 1,027 COGS (683) (734) (732) (768) (808) (851) (897)Gross income 146 53 74 79 89 100 130Gross margin 17.6% 6.8% 9.2% 9.3% 9.9% 10.5% 12.7% SG&A (26) – – – – – –EBITDA 195 140 161 168 183 199 234Adjusted EBITDA 195 140 161 168 183 199 234EBITDA margin 23.5% 17.8% 20.0% 19.9% 20.4% 20.9% 22.8% DD&A (75) (87) (87) (89) (94) (99) (104)EBIT 120 53 74 79 89 100 130 Interest income (50) (43) (42) (46) (50) (54) (60) Forex gain – – – – – – – Revaluation gain – – – – – – – Other gains (54) – – – – – – Exceptionals – – – – – – –EBT 16 10 33 33 39 46 70 Income tax (12) (2) (7) (7) (8) (9) (14) Minority interest – – – – – – – Discontinued operations – – – – – – –Net income 4 8 26 26 31 37 56Adjusted net income 4 8 26 26 31 37 56Net margin 0.5% 1.0% 3.2% 3.1% 3.5% 3.9% 5.5%EPS, $ 0.00008 0.00016 0.00052 0.00053 0.00063 0.00074 0.00113Adjusted EPS, $ 0.00008 0.00016 0.00052 0.00053 0.00063 0.00074 0.00113BALANCE SHEETAssets Cash and equivalents 44 45 92 45 24 20 51 Receivables 277 278 296 310 329 349 376 Inventories 33 37 39 41 43 45 48 Other current assets 5 5 5 5 5 5 5 Total current assets 359 365 431 401 401 419 480 Total non�current assets 940 937 993 1,059 1,131 1,222 1,321Total assets 1,300 1,302 1,424 1,460 1,532 1,641 1,801Liabilities Short�term borrowings 78 77 77 77 77 77 77 Payables 168 190 197 207 218 229 242 Other current liabilities 8 8 8 8 8 8 8 Total current liabilities 255 275 282 291 302 314 326 Long�term borrowings 437 426 515 515 545 606 697 Other non�current liabilities 94 92 92 92 92 92 92 Total non�current liabilities 531 518 607 607 637 698 789 Total liabilities 785 793 889 898 940 1,012 1,115 Minority interest – – – – – – – Equity 514 509 535 562 593 630 686Total liabilities and equity 1,300 1,302 1,424 1,460 1,532 1,641 1,801Net debt/(cash) 471 458 500 547 598 662 722CASH FLOW STATEMENTNet income 4 8 26 26 31 37 56 Minority interest – – – – – – – DD&A 75 87 87 89 94 99 104 Working capital change (40) 15 (12) (7) (10) (10) (18) Other assets change 47 – – – – – –Operating cash flow 85 109 100 109 115 125 142 Maintenance capex (75) (87) (87) (89) (94) (99) (104) Expansionary capex (80) (21) (55) (66) (73) (91) (98) Other investments 17 – – – – – –Investing cash flow (137) (107) (142) (156) (166) (190) (202) Change in debt 82 – 89 – 30 61 91 Dividends paid – – – – – – – Share issues/(purchases) – – – – – – – Other 12 – – – – – –Financing cash flow 94 – 89 – 30 61 91Forex effects (9) (1) – – – – –Net change in cash 33 1 48 (47) (21) (4) 31RATIOSP/E 20.0 10.1 3.1 3.0 2.5 2.2 1.4EV/EBITDA 2.8 3.8 3.6 3.7 3.7 3.7 3.4P/BV 0.2 0.2 0.1 0.1 0.1 0.1 0.1ROE 0.8% 1.5% 5.0% 4.8% 5.4% 6.0% 8.5%ROIC 1.6% 4.2% 5.3% 5.4% 5.8% 6.1% 7.1%Dividend per share, $ – – – – – – –Dividend yield – – – – – – –P/S 0.1 0.1 0.1 0.1 0.1 0.1 0.1P/CF 0.9 0.7 0.8 0.7 0.7 0.6 0.6Revenue growth 15% �5% 2% 5% 6% 6% 8%EBITDA growth 43% �28% 15% 4% 9% 9% 18%EPS growth – 98% 231% 0% 20% 18% 53%
Source: Company, Sberbank Investment Research
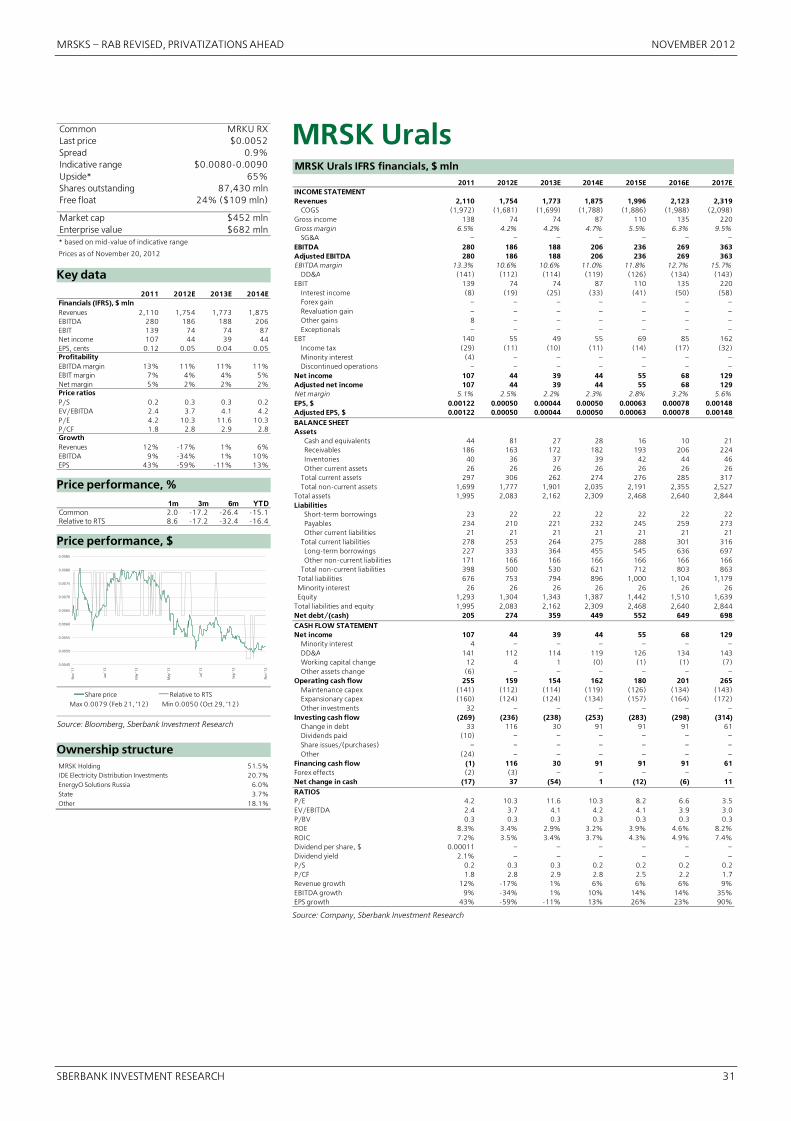
MRSKS – RAB REVISED, PRIVATIZATIONS AHEAD NOVEMBER 2012
SBERBANK INVESTMENT RESEARCH 31
Common MRKU RXLast price $0.0052Spread 0.9%Indicative range $0.0080�0.0090Upside* 65%Shares outstanding 87,430 mlnFree float 24% ($109 mln)
Market cap $452 mlnEnterprise value $682 mln* based on mid�value of indicative range
Prices as of November 20, 2012
Key data 2011 2012E 2013E 2014EFinancials (IFRS), $ mlnRevenues 2,110 1,754 1,773 1,875EBITDA 280 186 188 206EBIT 139 74 74 87Net income 107 44 39 44EPS, cents 0.12 0.05 0.04 0.05ProfitabilityEBITDA margin 13% 11% 11% 11%EBIT margin 7% 4% 4% 5%Net margin 5% 2% 2% 2%Price ratiosP/S 0.2 0.3 0.3 0.2EV/EBITDA 2.4 3.7 4.1 4.2P/E 4.2 10.3 11.6 10.3P/CF 1.8 2.8 2.9 2.8GrowthRevenues 12% �17% 1% 6%EBITDA 9% �34% 1% 10%EPS 43% �59% �11% 13%
Price performance, % 1m 3m 6m YTD
Common 2.0 �17.2 �26.4 �15.1Relative to RTS 8.6 �17.2 �32.4 �16.4
Price performance, $
0.0045
0.0050
0.0055
0.0060
0.0065
0.0070
0.0075
0.0080
0.0085
No
v '1
1
Jan
'12
Mar
'12
May
'12
Jul '
12
Sep
'12
No
v '1
2
Share price Relative to RTS
Max 0.0079 (Feb 21, ’12) Min 0.0050 (Oct 29, ’12)
Source: Bloomberg, Sberbank Investment Research
Ownership structure MRSK Holding 51.5%IDE Electricity Distribution Investments 20.7%EnergyO Solutions Russia 6.0%State 3.7%Other 18.1%
MRSK UralsMRSK Urals IFRS financials, $ mln 2011 2012E 2013E 2014E 2015E 2016E 2017EINCOME STATEMENTRevenues 2,110 1,754 1,773 1,875 1,996 2,123 2,319 COGS (1,972) (1,681) (1,699) (1,788) (1,886) (1,988) (2,098)Gross income 138 74 74 87 110 135 220Gross margin 6.5% 4.2% 4.2% 4.7% 5.5% 6.3% 9.5% SG&A – – – – – – –EBITDA 280 186 188 206 236 269 363Adjusted EBITDA 280 186 188 206 236 269 363EBITDA margin 13.3% 10.6% 10.6% 11.0% 11.8% 12.7% 15.7% DD&A (141) (112) (114) (119) (126) (134) (143)EBIT 139 74 74 87 110 135 220 Interest income (8) (19) (25) (33) (41) (50) (58) Forex gain – – – – – – – Revaluation gain – – – – – – – Other gains 8 – – – – – – Exceptionals – – – – – – –EBT 140 55 49 55 69 85 162 Income tax (29) (11) (10) (11) (14) (17) (32) Minority interest (4) – – – – – – Discontinued operations – – – – – – –Net income 107 44 39 44 55 68 129Adjusted net income 107 44 39 44 55 68 129Net margin 5.1% 2.5% 2.2% 2.3% 2.8% 3.2% 5.6%EPS, $ 0.00122 0.00050 0.00044 0.00050 0.00063 0.00078 0.00148Adjusted EPS, $ 0.00122 0.00050 0.00044 0.00050 0.00063 0.00078 0.00148BALANCE SHEETAssets Cash and equivalents 44 81 27 28 16 10 21 Receivables 186 163 172 182 193 206 224 Inventories 40 36 37 39 42 44 46 Other current assets 26 26 26 26 26 26 26 Total current assets 297 306 262 274 276 285 317 Total non�current assets 1,699 1,777 1,901 2,035 2,191 2,355 2,527Total assets 1,995 2,083 2,162 2,309 2,468 2,640 2,844Liabilities Short�term borrowings 23 22 22 22 22 22 22 Payables 234 210 221 232 245 259 273 Other current liabilities 21 21 21 21 21 21 21 Total current liabilities 278 253 264 275 288 301 316 Long�term borrowings 227 333 364 455 545 636 697 Other non�current liabilities 171 166 166 166 166 166 166 Total non�current liabilities 398 500 530 621 712 803 863 Total liabilities 676 753 794 896 1,000 1,104 1,179 Minority interest 26 26 26 26 26 26 26 Equity 1,293 1,304 1,343 1,387 1,442 1,510 1,639Total liabilities and equity 1,995 2,083 2,162 2,309 2,468 2,640 2,844Net debt/(cash) 205 274 359 449 552 649 698CASH FLOW STATEMENTNet income 107 44 39 44 55 68 129 Minority interest 4 – – – – – – DD&A 141 112 114 119 126 134 143 Working capital change 12 4 1 (0) (1) (1) (7) Other assets change (6) – – – – – –Operating cash flow 255 159 154 162 180 201 265 Maintenance capex (141) (112) (114) (119) (126) (134) (143) Expansionary capex (160) (124) (124) (134) (157) (164) (172) Other investments 32 – – – – – –Investing cash flow (269) (236) (238) (253) (283) (298) (314) Change in debt 33 116 30 91 91 91 61 Dividends paid (10) – – – – – – Share issues/(purchases) – – – – – – – Other (24) – – – – – –Financing cash flow (1) 116 30 91 91 91 61Forex effects (2) (3) – – – – –Net change in cash (17) 37 (54) 1 (12) (6) 11RATIOSP/E 4.2 10.3 11.6 10.3 8.2 6.6 3.5EV/EBITDA 2.4 3.7 4.1 4.2 4.1 3.9 3.0P/BV 0.3 0.3 0.3 0.3 0.3 0.3 0.3ROE 8.3% 3.4% 2.9% 3.2% 3.9% 4.6% 8.2%ROIC 7.2% 3.5% 3.4% 3.7% 4.3% 4.9% 7.4%Dividend per share, $ 0.00011 – – – – – –Dividend yield 2.1% – – – – – –P/S 0.2 0.3 0.3 0.2 0.2 0.2 0.2P/CF 1.8 2.8 2.9 2.8 2.5 2.2 1.7Revenue growth 12% �17% 1% 6% 6% 6% 9%EBITDA growth 9% �34% 1% 10% 14% 14% 35%EPS growth 43% �59% �11% 13% 26% 23% 90%
Source: Company, Sberbank Investment Research

NOVEMBER 2012 MRSKS – RAB REVISED, PRIVATIZATIONS AHEAD
32 SBERBANK INVESTMENT RESEARCH
Common MRKV RXLast price $0.00221Spread 0.9%Indicative range $0.0046�0.0051Upside* 120%Shares outstanding 178,578 mlnFree float 21% ($82 mln)
Market cap $394 mlnEnterprise value $704 mln* based on mid�value of indicative range
Prices as of November 20, 2012
Key data 2011 2012E 2013E 2014EFinancials (IFRS), $ mlnRevenues 1,634 1,426 1,476 1,567EBITDA 193 193 225 251EBIT 82 44 73 94Net income 60 24 35 47EPS, cents 0.0336 0.0133 0.0196 0.0262ProfitabilityEBITDA margin 12% 14% 15% 16%EBIT margin 5% 3% 5% 6%Net margin 4% 2% 2% 3%Price ratiosP/S 0.2 0.3 0.3 0.3EV/EBITDA 2.8 3.6 3.5 3.4P/E 6.6 16.6 11.3 8.4P/CF 1.9 2.3 2.1 1.9GrowthRevenues 26% �13% 3% 6%EBITDA 47% �0% 17% 12%EPS 220% �60% 47% 34%
Price performance, % 1m 3m 6m YTD
Common �7.8 9.7 �1.6 �22.5Relative to RTS �1.8 9.7 �9.6 �23.7
Price performance, $
0.0010
0.0015
0.0020
0.0025
0.0030
0.0035
0.0040
0.0045
No
v '1
1
Jan
'12
Mar
'12
May
'12
Jul '
12
Sep
'12
No
v '1
2
Share price Relative to RTS
Max 0.0040 (Mar 15, ’12) Min 0.00170 (Jun 1, ’12)
Source: Bloomberg, Sberbank Investment Research
Ownership structure MRSK Holding 67.6%EnergyO Solutions Russia 11.1%State 0.5%Other 20.7%
MRSK VolgaMRSK Volga IFRS financials, $ mln 2011 2012E 2013E 2014E 2015E 2016E 2017EINCOME STATEMENTRevenues 1,634 1,426 1,476 1,567 1,669 1,790 1,972 COGS (1,557) (1,382) (1,403) (1,473) (1,551) (1,633) (1,724)Gross income 78 44 73 94 118 157 248Gross margin 4.8% 3.1% 4.9% 6.0% 7.1% 8.8% 12.6% SG&A – – – – – – –EBITDA 193 193 225 251 283 331 435Adjusted EBITDA 193 193 225 251 283 331 435EBITDA margin 11.8% 13.5% 15.2% 16.0% 16.9% 18.5% 22.0% DD&A (111) (148) (152) (157) (165) (174) (187)EBIT 82 44 73 94 118 157 248 Interest income (9) (15) (29) (35) (40) (48) (64) Forex gain – – – – – – – Revaluation gain – – – – – – – Other gains – – – – – – – Exceptionals – – – – – – –EBT 73 30 44 59 77 110 184 Income tax (13) (6) (9) (12) (15) (22) (37) Minority interest – – – – – – – Discontinued operations – – – – – – –Net income 60 24 35 47 62 88 147Adjusted net income 60 24 35 47 62 88 147Net margin 3.7% 1.7% 2.4% 3.0% 3.7% 4.9% 7.5%EPS, $ 0.00034 0.00013 0.00020 0.00026 0.00035 0.00049 0.00082Adjusted EPS, $ 0.00034 0.00013 0.00020 0.00026 0.00035 0.00049 0.00082BALANCE SHEETAssets Cash and equivalents 63 117 41 9 20 20 85 Receivables 115 106 114 121 129 138 152 Inventories 30 28 30 31 33 35 37 Other current assets 46 44 44 44 44 44 44 Total current assets 253 296 229 205 227 238 319 Total non�current assets 993 1,149 1,262 1,373 1,516 1,786 1,835Total assets 1,246 1,445 1,491 1,578 1,742 2,024 2,154Liabilities Short�term borrowings 2 2 2 2 2 2 2 Payables 206 193 203 213 225 236 250 Other current liabilities 11 11 11 11 11 11 11 Total current liabilities 219 206 216 227 238 250 263 Long�term borrowings 215 424 424 455 545 727 697 Other non�current liabilities 83 81 81 81 81 81 81 Total non�current liabilities 298 506 506 536 627 809 778 Total liabilities 518 711 722 763 865 1,058 1,041 Minority interest – – – – – – – Equity 729 734 769 816 878 965 1,113Total liabilities and equity 1,246 1,445 1,491 1,578 1,742 2,024 2,154Net debt/(cash) 155 309 386 448 527 709 614CASH FLOW STATEMENTNet income 60 24 35 47 62 88 147 Minority interest – – – – – – – DD&A 111 148 152 157 165 174 187 Working capital change 59 (1) 1 2 2 1 (3) Other assets change (25) – – – – – –Operating cash flow 206 172 188 206 229 262 331 Maintenance capex (111) (148) (152) (157) (165) (174) (187) Expansionary capex (154) (187) (113) (111) (143) (270) (49) Other investments 22 – – – – – –Investing cash flow (244) (336) (265) (268) (308) (444) (236) Change in debt 58 223 – 30 91 182 (30) Dividends paid – – – – – – – Share issues/(purchases) – – – – – – – Other (2) – – – – – –Financing cash flow 56 223 – 30 91 182 (30)Forex effects (4) (4) – – – – –Net change in cash 14 55 (77) (32) 12 0 65RATIOSP/E 6.6 16.6 11.3 8.4 6.4 4.5 2.7EV/EBITDA 2.8 3.6 3.5 3.4 3.3 3.3 2.3P/BV 0.5 0.5 0.5 0.5 0.4 0.4 0.4ROE 8.3% 3.2% 4.7% 5.9% 7.3% 9.5% 14.2%ROIC 7.1% 3.1% 4.9% 5.9% 6.6% 7.4% 10.9%Dividend per share, $ – – – – – – –Dividend yield – – – – – – –P/S 0.2 0.3 0.3 0.3 0.2 0.2 0.2P/CF 1.9 2.3 2.1 1.9 1.7 1.5 1.2Revenue growth 26% �13% 3% 6% 7% 7% 10%EBITDA growth 47% �0% 17% 12% 13% 17% 31%EPS growth 220% �60% 47% 34% 32% 42% 67%
Source: Company, Sberbank Investment Research
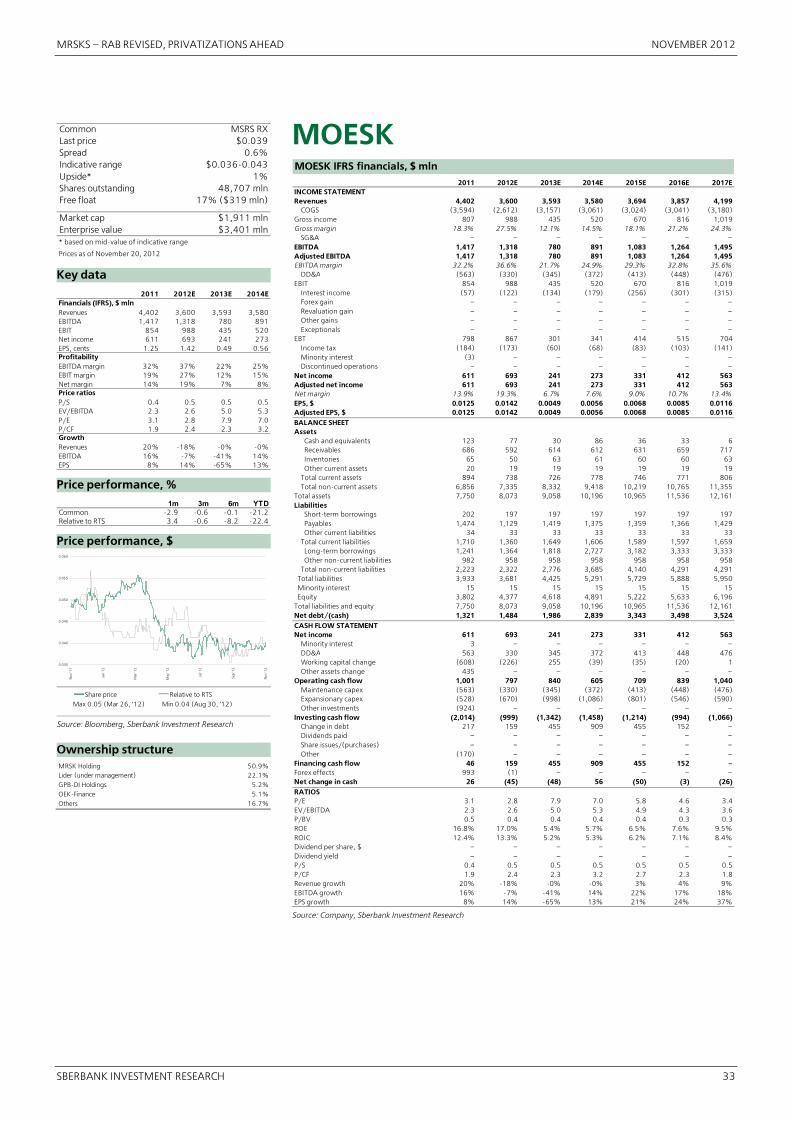
MRSKS – RAB REVISED, PRIVATIZATIONS AHEAD NOVEMBER 2012
SBERBANK INVESTMENT RESEARCH 33
Common MSRS RXLast price $0.039Spread 0.6%Indicative range $0.036�0.043Upside* 1%Shares outstanding 48,707 mlnFree float 17% ($319 mln)
Market cap $1,911 mlnEnterprise value $3,401 mln* based on mid�value of indicative range
Prices as of November 20, 2012
Key data 2011 2012E 2013E 2014EFinancials (IFRS), $ mlnRevenues 4,402 3,600 3,593 3,580EBITDA 1,417 1,318 780 891EBIT 854 988 435 520Net income 611 693 241 273EPS, cents 1.25 1.42 0.49 0.56ProfitabilityEBITDA margin 32% 37% 22% 25%EBIT margin 19% 27% 12% 15%Net margin 14% 19% 7% 8%Price ratiosP/S 0.4 0.5 0.5 0.5EV/EBITDA 2.3 2.6 5.0 5.3P/E 3.1 2.8 7.9 7.0P/CF 1.9 2.4 2.3 3.2GrowthRevenues 20% �18% �0% �0%EBITDA 16% �7% �41% 14%EPS 8% 14% �65% 13%
Price performance, % 1m 3m 6m YTD
Common �2.9 �0.6 �0.1 �21.2Relative to RTS 3.4 �0.6 �8.2 �22.4
Price performance, $
0.035
0.040
0.045
0.050
0.055
0.060
No
v '1
1
Jan
'12
Mar
'12
May
'12
Jul '
12
Sep
'12
No
v '1
2
Share price Relative to RTS
Max 0.05 (Mar 26, ’12) Min 0.04 (Aug 30, ’12)
Source: Bloomberg, Sberbank Investment Research
Ownership structure MRSK Holding 50.9%Lider (under management) 22.1%GPB�DI Holdings 5.2%OEK�Finance 5.1%Others 16.7%
MOESKMOESK IFRS financials, $ mln 2011 2012E 2013E 2014E 2015E 2016E 2017EINCOME STATEMENTRevenues 4,402 3,600 3,593 3,580 3,694 3,857 4,199 COGS (3,594) (2,612) (3,157) (3,061) (3,024) (3,041) (3,180)Gross income 807 988 435 520 670 816 1,019Gross margin 18.3% 27.5% 12.1% 14.5% 18.1% 21.2% 24.3% SG&A – – – – – – –EBITDA 1,417 1,318 780 891 1,083 1,264 1,495Adjusted EBITDA 1,417 1,318 780 891 1,083 1,264 1,495EBITDA margin 32.2% 36.6% 21.7% 24.9% 29.3% 32.8% 35.6% DD&A (563) (330) (345) (372) (413) (448) (476)EBIT 854 988 435 520 670 816 1,019 Interest income (57) (122) (134) (179) (256) (301) (315) Forex gain – – – – – – – Revaluation gain – – – – – – – Other gains – – – – – – – Exceptionals – – – – – – –EBT 798 867 301 341 414 515 704 Income tax (184) (173) (60) (68) (83) (103) (141) Minority interest (3) – – – – – – Discontinued operations – – – – – – –Net income 611 693 241 273 331 412 563Adjusted net income 611 693 241 273 331 412 563Net margin 13.9% 19.3% 6.7% 7.6% 9.0% 10.7% 13.4%EPS, $ 0.0125 0.0142 0.0049 0.0056 0.0068 0.0085 0.0116Adjusted EPS, $ 0.0125 0.0142 0.0049 0.0056 0.0068 0.0085 0.0116BALANCE SHEETAssets Cash and equivalents 123 77 30 86 36 33 6 Receivables 686 592 614 612 631 659 717 Inventories 65 50 63 61 60 60 63 Other current assets 20 19 19 19 19 19 19 Total current assets 894 738 726 778 746 771 806 Total non�current assets 6,856 7,335 8,332 9,418 10,219 10,765 11,355Total assets 7,750 8,073 9,058 10,196 10,965 11,536 12,161Liabilities Short�term borrowings 202 197 197 197 197 197 197 Payables 1,474 1,129 1,419 1,375 1,359 1,366 1,429 Other current liabilities 34 33 33 33 33 33 33 Total current liabilities 1,710 1,360 1,649 1,606 1,589 1,597 1,659 Long�term borrowings 1,241 1,364 1,818 2,727 3,182 3,333 3,333 Other non�current liabilities 982 958 958 958 958 958 958 Total non�current liabilities 2,223 2,322 2,776 3,685 4,140 4,291 4,291 Total liabilities 3,933 3,681 4,425 5,291 5,729 5,888 5,950 Minority interest 15 15 15 15 15 15 15 Equity 3,802 4,377 4,618 4,891 5,222 5,633 6,196Total liabilities and equity 7,750 8,073 9,058 10,196 10,965 11,536 12,161Net debt/(cash) 1,321 1,484 1,986 2,839 3,343 3,498 3,524CASH FLOW STATEMENTNet income 611 693 241 273 331 412 563 Minority interest 3 – – – – – – DD&A 563 330 345 372 413 448 476 Working capital change (608) (226) 255 (39) (35) (20) 1 Other assets change 435 – – – – – –Operating cash flow 1,001 797 840 605 709 839 1,040 Maintenance capex (563) (330) (345) (372) (413) (448) (476) Expansionary capex (528) (670) (998) (1,086) (801) (546) (590) Other investments (924) – – – – – –Investing cash flow (2,014) (999) (1,342) (1,458) (1,214) (994) (1,066) Change in debt 217 159 455 909 455 152 – Dividends paid – – – – – – – Share issues/(purchases) – – – – – – – Other (170) – – – – – –Financing cash flow 46 159 455 909 455 152 –Forex effects 993 (1) – – – – –Net change in cash 26 (45) (48) 56 (50) (3) (26)RATIOSP/E 3.1 2.8 7.9 7.0 5.8 4.6 3.4EV/EBITDA 2.3 2.6 5.0 5.3 4.9 4.3 3.6P/BV 0.5 0.4 0.4 0.4 0.4 0.3 0.3ROE 16.8% 17.0% 5.4% 5.7% 6.5% 7.6% 9.5%ROIC 12.4% 13.3% 5.2% 5.3% 6.2% 7.1% 8.4%Dividend per share, $ – – – – – – –Dividend yield – – – – – – –P/S 0.4 0.5 0.5 0.5 0.5 0.5 0.5P/CF 1.9 2.4 2.3 3.2 2.7 2.3 1.8Revenue growth 20% �18% �0% �0% 3% 4% 9%EBITDA growth 16% �7% �41% 14% 22% 17% 18%EPS growth 8% 14% �65% 13% 21% 24% 37%
Source: Company, Sberbank Investment Research

NOVEMBER 2012 MRSKS – RAB REVISED, PRIVATIZATIONS AHEAD
34 SBERBANK INVESTMENT RESEARCH
Common LSNG RXLast price $0.220Spread 1.7%Indicative range $0.269�0.351Upside* 41%Shares outstanding 1,685 mlnFree float 6% ($23 mln)
Preferred LSNGP RXLast price $0.55Spread 1.4%Indicative range $0.269�0.351Upside* �44%Shares outstanding 93.26 mln
Market cap $421 mlnEnterprise value $1,541 mln* based on mid�value of indicative range
Prices as of November 20, 2012
Key data 2011 2012E 2013E 2014EFinancials (IFRS), $ mlnRevenues 1,098 1,015 1,087 1,189EBITDA 194 177 233 291EBIT 26 15 59 104Net income (32) (36) (34) (30)EPS, cents (1.84) (2.04) (1.94) (1.72)ProfitabilityEBITDA margin 18% 17% 21% 24%EBIT margin 2% 1% 5% 9%Net margin �3% �4% �3% �3%Price ratiosP/S 0.4 0.4 0.4 0.4EV/EBITDA 5.4 8.7 8.6 8.5P/E neg neg neg negP/CF 1.4 3.0 2.5 2.3GrowthRevenues 17% �7% 7% 9%EBITDA �49% �9% 31% 25%EPS – – – –
Price performance, % 1m 3m 6m YTD
Common �2.6 12.4 �5.2 �28.7Relative to RTS 3.7 12.4 �12.9 �29.8
Price performance, $
0.15
0.20
0.25
0.30
0.35
0.40
No
v '1
1
Jan
'12
Mar
'12
May
'12
Jul '
12
Sep
'12
No
v '1
2
Share price Relative to RTS
Max 0.39 (Nov 22, ’11) Min 0.18 (Sep 5, ’12)
Source: Bloomberg, Sberbank Investment Research
Ownership structure MRSK Holding 54.8%St Petersburg government 27.2%IDE Electricity Distribution Investments 5.8%Rusenergo Fund 2.9%Energyo Solutions Russia 2.3%MRSK Urals 5.8%Other 1.1%
LenenergoLenenergo IFRS financials, $ mln 2011 2012E 2013E 2014E 2015E 2016E 2017EINCOME STATEMENTRevenues 1,098 1,015 1,087 1,189 1,320 1,462 1,622 COGS (1,072) (1,001) (1,028) (1,085) (1,147) (1,198) (1,240)Gross income 26 15 59 104 174 263 382Gross margin 2.3% 1.5% 5.4% 8.8% 13.1% 18.0% 23.5% SG&A – – – – – – –EBITDA 194 177 233 291 379 484 613Adjusted EBITDA 194 177 233 291 379 484 613EBITDA margin 17.7% 17.5% 21.4% 24.5% 28.7% 33.1% 37.8% DD&A (169) (162) (174) (187) (205) (220) (231)EBIT 26 15 59 104 174 263 382 Interest income (54) (60) (101) (142) (186) (214) (223) Forex gain – – – – – – – Revaluation gain – – – – – – – Other gains – – – – – – – Exceptionals – – – – – – –EBT (29) (45) (43) (38) (12) 49 159 Income tax (3) 9 9 8 2 (10) (32) Minority interest (0) – – – – – – Discontinued operations – – – – – – –Net income (32) (36) (34) (30) (10) 39 127Adjusted net income (32) (36) (34) (30) (10) 39 127Net margin (2.9%) (3.5%) (3.1%) (2.5%) (0.7%) 2.7% 7.9%EPS, $ (0.0184) (0.0204) (0.0194) (0.0172) (0.0055) 0.0224 0.0726Adjusted EPS, $ (0.0184) (0.0204) (0.0194) (0.0172) (0.0055) 0.0224 0.0726BALANCE SHEETAssets Cash and equivalents 221 43 42 11 63 57 56 Receivables 31 30 33 37 41 45 50 Inventories 9 9 9 10 11 11 11 Other current assets 112 109 109 109 109 109 109 Total current assets 372 191 194 167 223 222 226 Total non�current assets 2,638 3,053 3,502 3,967 4,279 4,422 4,555Total assets 3,011 3,244 3,696 4,134 4,502 4,644 4,781Liabilities Short�term borrowings 197 193 193 193 193 193 193 Payables 226 223 238 251 265 277 287 Other current liabilities 354 345 345 345 345 345 345 Total current liabilities 777 761 776 789 803 815 825 Long�term borrowings 653 970 1,424 1,879 2,242 2,333 2,333 Other non�current liabilities 259 253 253 253 253 253 253 Total non�current liabilities 912 1,223 1,677 2,132 2,496 2,586 2,586 Total liabilities 1,690 1,983 2,453 2,921 3,299 3,401 3,411 Minority interest 1 1 1 1 1 1 1 Equity 1,320 1,260 1,242 1,212 1,203 1,242 1,369Total liabilities and equity 3,011 3,244 3,696 4,134 4,502 4,644 4,781Net debt/(cash) 630 1,119 1,575 2,061 2,372 2,469 2,470CASH FLOW STATEMENTNet income (32) (36) (34) (30) (10) 39 127 Minority interest 0 – – – – – – DD&A 169 162 174 187 205 220 231 Working capital change 126 2 11 9 10 7 4 Other assets change 8 – – – – – –Operating cash flow 270 128 152 166 206 267 362 Maintenance capex (169) (162) (174) (187) (205) (220) (231) Expansionary capex (232) (497) (449) (465) (311) (143) (133) Other investments (2) – – – – – –Investing cash flow (403) (660) (623) (652) (517) (364) (364) Change in debt 398 346 455 455 364 91 – Dividends paid (13) – – – – – – Share issues/(purchases) – – – – – – – Other (33) – – – – – –Financing cash flow 352 346 455 455 364 91 –Forex effects (20) 8 17 – – – –Net change in cash 199 (178) (1) (31) 52 (6) (1)RATIOSP/E neg neg neg neg neg 9.8 3.0EV/EBITDA 5.4 8.7 8.6 8.5 7.4 6.0 4.7P/BV 0.3 0.3 0.3 0.3 0.3 0.3 0.3ROE neg neg neg neg neg 3.2% 9.8%ROIC 1.3% 0.5% 1.6% 2.5% 3.8% 5.6% 7.8%Dividend per share, $ – – – – – – –Dividend yield – – – – – – –P/S 0.4 0.4 0.4 0.4 0.3 0.3 0.3P/CF 1.4 3.0 2.5 2.3 1.9 1.4 1.1Revenue growth 17% �7% 7% 9% 11% 11% 11%EBITDA growth �49% �9% 31% 25% 30% 28% 27%EPS growth – – – – – – 224%
Source: Company, Sberbank Investment Research

MRSKS – RAB REVISED, PRIVATIZATIONS AHEAD NOVEMBER 2012
SBERBANK INVESTMENT RESEARCH 35
Disclosure appendix
IMPORTANT US REGULATORY DISCLOSURES
An affiliate of Troika Dialog USA makes a market in the securities of Lenenergo, MOESK, MRSK
Center, MRSK Center�Volga, MRSK Holding, MRSK North Caucasus, MRSK North�West, MRSK
Siberia, MRSK South, MRSK Urals, MRSK Volga.
The research analysts, strategists, or research associates principally responsible for the preparation
of this research report have received compensation based upon various factors, including quality of
research, investor client feedback, stock picking, competitive factors, firm revenues and overall
investment banking revenues.
Analyst certification
The following analyst(s) hereby certify that the views expressed in this research report accurately
reflect such research analyst's personal views about the subject securities and issuers and that no
part of his or her compensation was, is, or will be directly or indirectly related to the specific
recommendations or views contained in the research report: Alexander Kotikov, Andrey Trufanov.

Senior Management
Co�Head of Sberbank CIB Ruben Vardanian, Alexander Bazarov Chief Economist, Managing Director Evgeny Gavrilenkov
Research Department +7 (495) 258 0511
Head of Research Paolo Zaniboni +7 (495) 787 2381
Head of Equity Research Andy Smith +7 (495) 787 2381
Head of FI Research Alexander Kudrin +7 (495) 933 9847
Strategy
Chief Strategist Chris Weafer +7 (495) 933 9886
Strategist Ovanes Oganisyan +7 (495) 933 9868
Strategist/Quant Analyst Iskander Abdullaev +7 (495) 787 2346
Oil and Gas
Senior Analyst Oleg Maximov +7 (495) 933 9830
Senior Analyst Alex Fak +7 (495) 933 9829
Analyst Valery Nesterov +7 (495) 933 9832
Utilities
Senior Analyst Alexander Kotikov +7 (495) 933 9841
Analyst Andrey Trufanov +7 (495) 933 9831
Telecoms, Media and IT
Senior Analyst Anna Lepetukhina +7 (495) 933 9835
Assistant Analyst Yana Kuznetsova +7 (495) 933 9834
Metals and Mining, Chemicals
Senior Analyst Mikhail Stiskin +7 (495) 933 9839
Analyst Irina Lapshina +7 (495) 933 9852
Analyst Zaurbek Zhunisov +7 (495) 787 2302
Analyst Anton Rumyantsev +7 (495) 933 9840
Assistant Analyst Alexander Levinskiy +7 (495) 258 0511
Manufacturing, Small and Mid Cap
Senior Analyst Mikhail Ganelin +7 (495) 933 9851
Senior Analyst Igor Vasilyev +7 (495) 933 9842
Assistant Analyst Ivan Belyaev +7 (495) 933 9853
Financials
Senior Analyst Andrew Keeley +44 (20) 7936 0439
Analyst Ainur Medeubayeva +7 (727) 355 3355
Consumer
Senior Analyst Mikhail Krasnoperov +7 (495) 933 9838
Analyst Georgy Tarakanov +7 (495) 933 9858
Assistant Analyst Artur Galimov +7 (495) 933 9833
Assistant Analyst Maria Sukhanova +7 (495) 933 9856
Real Estate
Senior Analyst Julia Gordeyeva, CFA +7 (495) 933 9846
Transport
Senior Analyst Mikhail Ganelin +7 (495) 933 9851
Senior Analyst Igor Vasilyev +7 (495) 933 9842
Assistant Analyst Ivan Belyaev +7 (495) 933 9853
Economy
Senior Economist Anton Stroutchenevski +7 (495) 933 9843
Junior Economist Sergei Konygin +7 (495) 933 9848
Fixed Income
Head of FI Research Alexander Kudrin +7 (495) 933 9847
Senior Analyst Alexey Bulgakov +7 (495) 933 9866
Senior Analyst Dmitry Poliakov +7 (495) 258 0511
Analyst Sergey Goncharov +7 (495) 933 9854
Assistant Analyst Nikolay Minko + 7 (495) 933 9857
Ukraine
Strategist Roman Zakharov +38 (044) 207 3780
Economist Iryna Piontkivska
Senior Analyst Yevhen Hrebeniuk, CFA
Senior Analyst Ivan Kharchuk
Senior Analyst Sergey Nevmerzhitsky
Senior Analyst Konstantin Fastovets
Analyst Maria Repko
Kazakhstan
Analyst Zaurbek Zhunisov +7 (495) 787 2302
Analyst Ainur Medeubayeva +7 (727) 355 3355
Production Research Production Manager Jon Pyne
English Editors
Chief Editor Cole Akeson
Senior Editor Chris Clough
Senior Editor Jeremy Lanou
Editor Nathan Gardener
Editor Danielle Gill
Layout Chief Layout Specialist Yaroslav Pavlov
Senior Layout Specialist Dmitry Orlov
Senior Layout Specialist Ekaterina Ilyina
Russian Editors and Translators Chief Editor Konstantin Mertsalov
Senior Editor Nikolay Efremov
Senior Editor Vladimir Romanov
Senior Translator Maxim Sukhmanskiy
Senior Translator Anna Skvortsova
Senior Translator Ekaterina Pezhemskaya
Translator Ekaterina Levchenko
Translator Kirill Lyubchenko
Administrator Sergey Tkachev

Head Office, Moscow 4, Romanov Pereulok Moscow 125009, Russia Phone +7 (495) 258 0500 Fax +7 (495) 258 0547 Research +7 (495) 258 0511 Equity Sales +7 (495) 258 0550 Fixed Income Sales +7 (495) 258 0510 Trading +7 (495) 258 0525 Options Trading +7 (495) 258 0555 Structured Products +7 (495) 258 0572 Treasury Products +7 (495) 258 0530
St Petersburg “Petrovski Fort” Business Center
4, let. A, Finlyandski prospect St. Petersburg, 194153, Russia
Phone +7 (812) 332 3300; fax +7 (812) 332 6657
Chelyabinsk Office 507, Business Center “Arkaim Plaza”
38, ul. Karla Marksa Chelyabinsk, 454091, Russia
Phone +7 (351) 778 6120; fax +7 (351) 778 6121
Ekaterinburg Office 504�505, Business Center “Palladium”, 5th floor
10, ul. Khokhryakova Ekaterinburg, 620014, Russia
Phone +7 (343) 310 7000; fax +7 (343) 379 2164
Irkutsk 19, ul. Lenina
Irkutsk, 664003, Russia Phone/fax +7 (3952) 563 636
Kazan “Suvar Plaza” Office Center
6, ul. Spartakovskaya Kazan, 420107, Russia
Phone/fax +7 (843) 526 5522
Khabarovsk “Khabarovsk City” Business Center
22a, ul. Postysheva Khabarovsk, 680030, Russia
Phone +7 (4212) 415 162; fax +7 (4212) 415 165
Krasnodar 41, ul. Krasnaya
Krasnodar, 350000, Russia Phone/fax +7 (861) 210 6061
Krasnoyarsk 26, Prospekt Mira
Krasnoyarsk, 660049, RussiaPhone +7 (3912) 91 8100; fax +7 (3912) 918 102
Naberezhnye Chelny 52/16 (3/01), Prospekt Mira
Naberezhnye Chelny, 423810, RussiaPhone +7 (8552) 39 5100; fax +7 (8552) 395 103
Nizhni Novgorod “Lobachevski Plaza” Business Center
10/16, ul. Alekseevskaya , 6 etazhNizhni Novgorod, 603006, Russia
Phone +7 (831) 220 1949
Novosibirsk 1, Prospekt Dimitrova
Novosibirsk, 630004, RussiaPhone +7 (383) 210 5502; fax +7 (383) 210 5503
Perm 58, ul. Lenina
Perm, 614000, RussiaPhone +7 (342) 218 6146; fax +7 (342) 218 6149
Rostov�on�Don 206, ul. Krasnoarmeyskaya
Rostov�on�Don, RussiaPhone/fax +7 (863) 268 8899
Samara 204, ul. Molodogvardeiskaya
Samara, 443001, RussiaPhone +7 (846) 378 0000; fax +7 (846) 273 3328
Tyumen 2/9A, ul. 8 Marta, 2 etazh
Tyumen, 625000, Russia Phone +7 (3452) 39 5450; fax +7 (3452) 395 451
Ufa 100/1, ul. Dostoevskogo
Ufa, 450077, RussiaPhone +7 (347) 279 8880; fax +7 (347) 279 8881
Vladivostok 6, ul. Mordovtseva
Vladivostok, 690091, RussiaPhone +7 (423) 249 9925; fax +7 (423) 249 9926
Volgograd 11, ul. Mira
Volgograd, 400131, RussiaPhone +7 (8442) 96 8211; fax +7 (8442) 335 198
Voronezh 43, ul. Plekhanovskaya
Voronezh, 394000, RussiaPhone +7 (4732) 35 5647; fax +7 (4732) 619 961
Yaroslavl 22, ul. Trefoleva
Yaroslavl, 150000, RussiaPhone +7 (4852) 67 0407; fax +7 (4852) 670 406
Troika Dialog USA Carnegie Hall Tower
152 West 57th Street, 44th floorNew York, NY 10019
Phone +1 (212) 300 9600; fax +1 (212) 300 9601
Sberbank CIB (UK) Limited 85 Fleet Street, 4th floor
London, EC4Y 1AEPhone +44 (20) 7583 3257; fax +44 (20) 7822 0779
Troika Dialog Ukraine 6, Rylskyi Pereulok, 6th floor
Kyiv 01025, UkrainePhone +380 (44) 207 3780; fax +380 (44) 207 3784
Troika Dialog Kazakhstan Block B, Business Center “Hermes”, 5th floor
101, ul. Tole Bi,Almaty, Kazakhstan
Phone +7 (727) 355 3355; fax +7 (727) 355 3356
Troika Dialog Group, Cyprus 57 Digeni Akrita Ave
Zachariades Building, Office 301Nicosia CY�1070
Phone +357 (22) 87 5380; fax +357 (22) 875 393
This Sberbank Investment Research report is prepared by CJSC "Sberbank CIB" (together with its affiliate, "Sberbank CIB") and provides general information only. Neither the information nor any opinionexpressed constitutes a recommendation, an offer or an invitation to make an offer, to buy or sell any securities or other investment or any options, futures or derivatives related to such securities orinvestments. It is not intended to provide personal investment advice and it does not take into account the specific investment objectives, financial situation and the particular needs of any specificperson who may receive this report. Investors should seek financial advice regarding the appropriateness of investing in any securities, other investment or investment strategies discussed orrecommended in this report and should understand that statements regarding future prospects may not be realized.
Investors should note that income from such securities or other investments, if any, may fluctuate and that price or value of such securities and investments may rise or fall. Accordingly, investors mayreceive back less than originally invested. Past performance is not necessarily a guide to future performance.
Any information relating to the tax status of financial instruments discussed herein is not intended to provide tax advice or to be used by anyone to provide tax advice. Investors are urged to seek taxadvice based on their particular circumstances from an independent tax professional.
Foreign currency rates of exchange may adversely affect the value, price or income of any security or related investment mentioned in this report. In addition, investors in securities such as ADRs orGDRs, whose values are influenced by the currency of the underlying security, effectively assume currency risk.
The information contained herein has been obtained from, and any opinions herein are based upon, sources believed to be reliable, but no representation is made that it is accurate or complete and itshould not be relied upon as such. All such information and opinions are subject to change without notice.
From time to time, Sberbank CIB or its affiliates or the principals or employees of Sberbank CIB or its affiliates may have or have had positions or derivative positions in the securities or other instrumentsreferred to herein or make or have made a market or otherwise act or have acted as principal in transactions in any of these securities or instruments or may provide or have provided investment bankingor consulting services to or serve or have served as a director or a supervisory board member of a company being reported on herein.
Sberbank CIB maintains strict internal policies, which are designed to manage any actual or potential conflicts of interest from harming the interests of investors.
Further information on the securities referred to herein may be obtained from Sberbank CIB upon request.
This report may not be reproduced, copied nor extracts taken from it, without the express written consent of Sberbank CIB.
For residents of the United States. This research report is being distributed in the United States by TROIKA DIALOG USA, INC., which accepts responsibility for the contents hereof. Any U.S. personreceiving this report who wishes to effect transactions in any securities referred to herein should contact TROIKA DIALOG USA, INC., not its affiliate. Further information on the securities referred toherein may be obtained from TROIKA DIALOG USA, INC. upon request.
For residents of the United Kingdom and rest of Europe. Except as may be otherwise specified herein, this research report is communicated to persons who are qualified as eligible counterparties orprofessional clients (as defined in the FSA Rules) and is made available to such persons only. The information contained herein is not intended for, and should not be relied upon by, retail clients (asdefined in the FSA Rules).
© SBERBANK CIB 2012