mrs physics€¦ · web viewhow to create a graph in excel open the data source centre the data by...
TRANSCRIPT
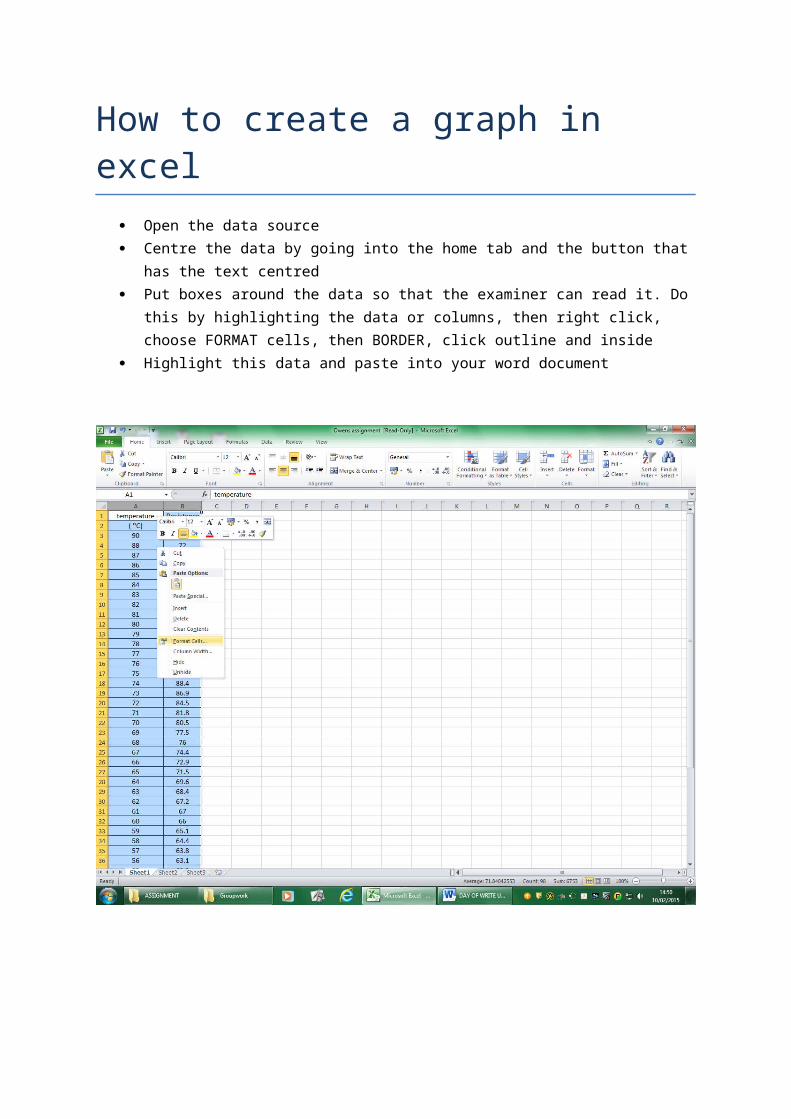
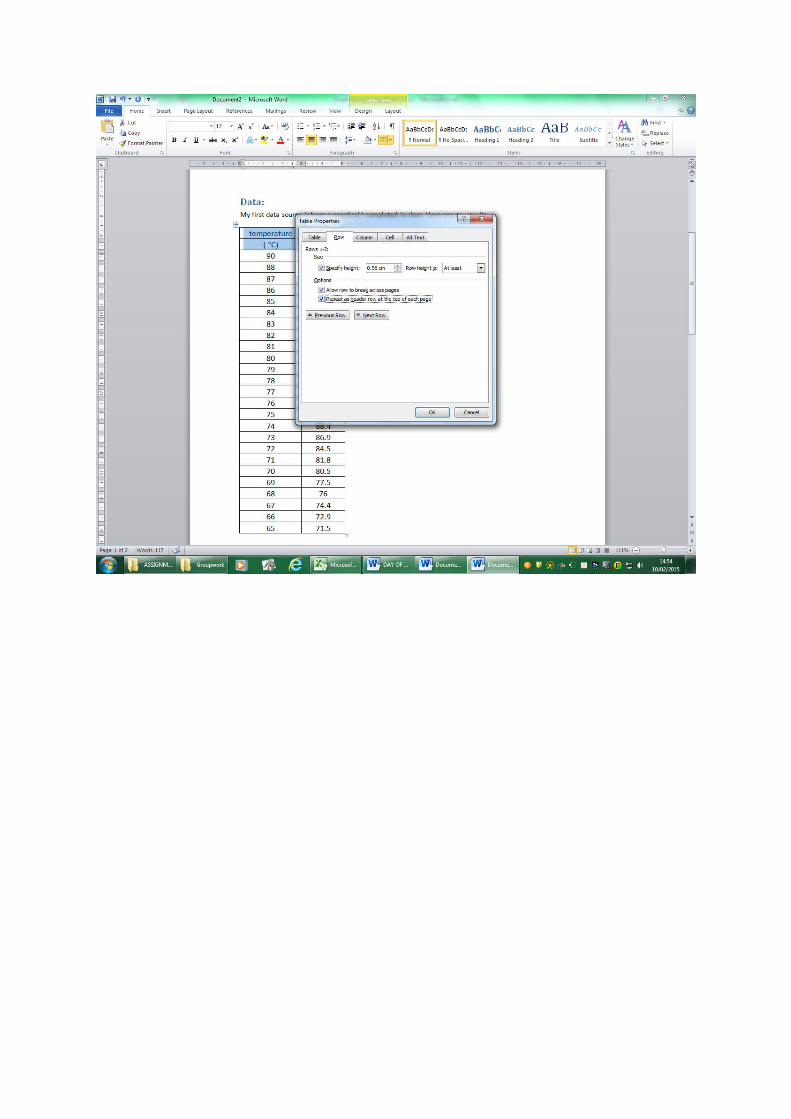
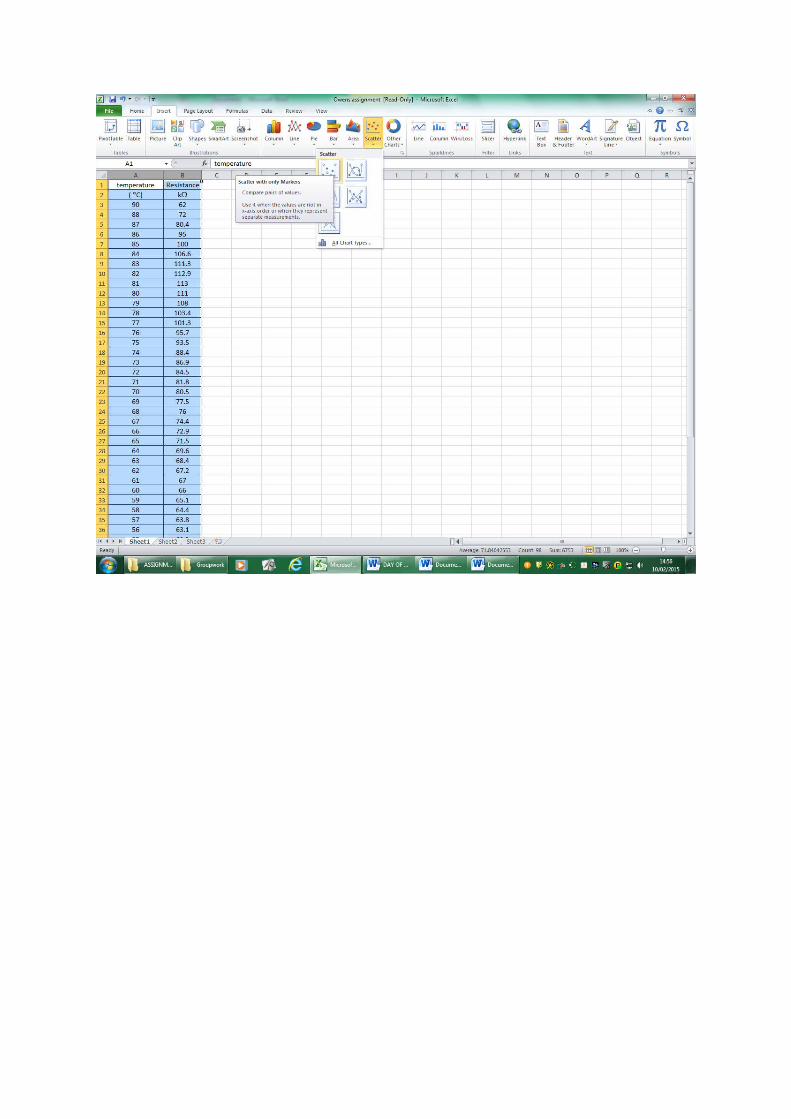
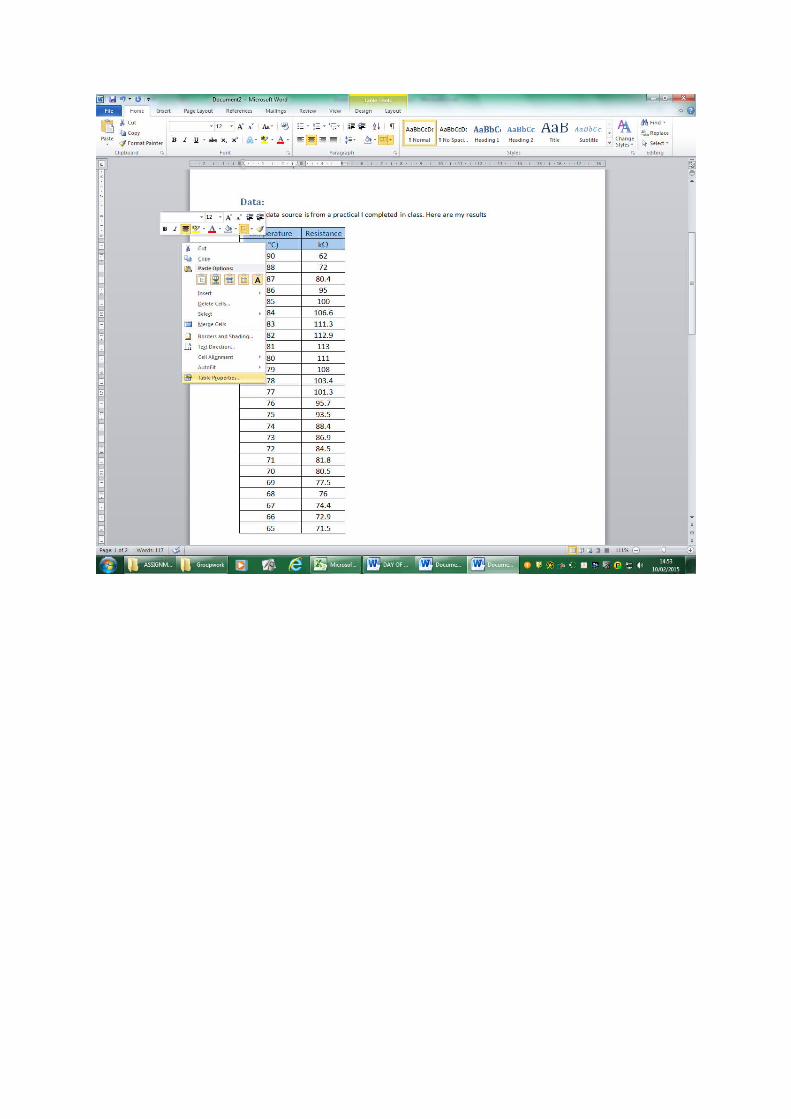
How to create a graph in excel Open the data source Centre the data by going into the home tab and the button that has the text centred Put boxes around the data so that the examiner can read it. Do this by highlighting the data
or columns, then right click, choose FORMAT cells, then BORDER, click outline and inside Highlight this data and paste into your word document