mrmpilot
DESCRIPTION
Key Features of MRMPilot™ Software development of assays for low level peptides from complex real- world biological matrices or sets of synthetic peptides. MRMPilot™ Software can leverage multiple sources of information as input to build MRM and MIDAS Workflow assays in addition to enabling iterative optimization of assays and storing and reporting qualitative and quantitative results. The end result is an optimized MRM based quantitative assay. p 1TRANSCRIPT
p 1
MRMPilot™ Software: Accelerating MRM Assay Development for Targeted Quantitative Proteomics With Unique QTRAP® System Technology
Targeted peptide quantification is a rapidly growing application within protein mass spectrometry due to its widespread utility in biomarker verification, protein/peptide confirmation and characterization, and pathway mapping (e.g., tracking changes in phosphorylation signaling networks during various cellular perturbations). A key requirement of this application is the existence of a robust, quantitative peptide MRM assay, that can stand-up to the rigorous demands for sensitivity, specificity, accuracy, and reproducibility in complex biological samples. The efficient development of these assays requires careful design to obtain the highest sensitivity MRM transitions for the best peptides for the proteins of interest. Without dedicated software, this experimental design and subsequent data tracking is prohibitively tedious and time consuming.
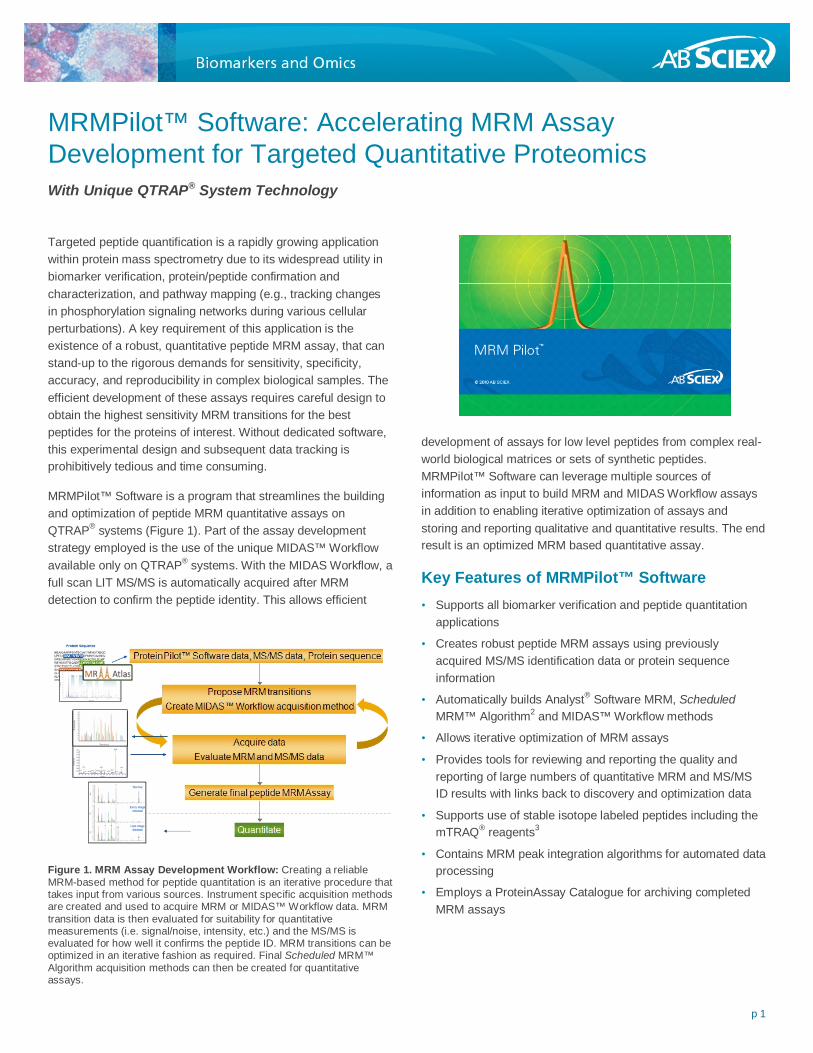
MRMPilot™ Software is a program that streamlines the building and optimization of peptide MRM quantitative assays on QTRAP® systems (Figure 1). Part of the assay development strategy employed is the use of the unique MIDAS™ Workflow available only on QTRAP® systems. With the MIDAS Workflow, a full scan LIT MS/MS is automatically acquired after MRM detection to confirm the peptide identity. This allows efficient
development of assays for low level peptides from complex real-world biological matrices or sets of synthetic peptides. MRMPilot™ Software can leverage multiple sources of information as input to build MRM and MIDAS Workflow assays in addition to enabling iterative optimization of assays and storing and reporting qualitative and quantitative results. The end result is an optimized MRM based quantitative assay.
Key Features of MRMPilot™ Software • Supports all biomarker verification and peptide quantitation
applications
• Creates robust peptide MRM assays using previously acquired MS/MS identification data or protein sequence information
• Automatically builds Analyst® Software MRM, Scheduled MRM™ Algorithm2 and MIDAS™ Workflow methods
• Allows iterative optimization of MRM assays
• Provides tools for reviewing and reporting the quality and reporting of large numbers of quantitative MRM and MS/MS ID results with links back to discovery and optimization data
• Supports use of stable isotope labeled peptides including the mTRAQ® reagents3
• Contains MRM peak integration algorithms for automated data processing
• Employs a ProteinAssay Catalogue for archiving completed MRM assays
Figure 1. MRM Assay Development Workflow: Creating a reliable MRM-based method for peptide quantitation is an iterative procedure that takes input from various sources. Instrument specific acquisition methods are created and used to acquire MRM or MIDAS™ Workflow data. MRM transition data is then evaluated for suitability for quantitative measurements (i.e. signal/noise, intensity, etc.) and the MS/MS is evaluated for how well it confirms the peptide ID. MRM transitions can be optimized in an iterative fashion as required. Final Scheduled MRM™ Algorithm acquisition methods can then be created for quantitative assays.
p 2
Importing Starting Information The basic steps for creating a robust high quality MRM peptide assay are outlined in Figure 1. A wide range of starting information can be used by MRMPilot™ Software to create the first acquisition methods. Protein ID results can be imported from a variety of database search engines: ProteinPilot™ Software, Mascot, Sequest, XTandem and Spectrum Mill database search results. Peptide and MS/MS data are imported and used for designing the MRM transitions for initial peptide detection. In addition, data from PeptideAtlas and MRMAtlas can be imported directly. Finally, if no MS data has been previously obtained, a protein sequence can be loaded into the software and MRM methods can be generated in silico using basic peptide and MRM prediction rules.
Automatically Build MRM Acquisition Methods The workflow task bar across the top guides the user through the assay creation process. First, the proteins of interest are selected from the database search results. All available information is loaded into the MRMPilot™ Software. Additional MS/MS or specific target peptides can also be added and associated with the protein targets. Next, the best peptides and best MRM transitions for all the proteins are automatically selected using the available data or in silico prediction rules. The
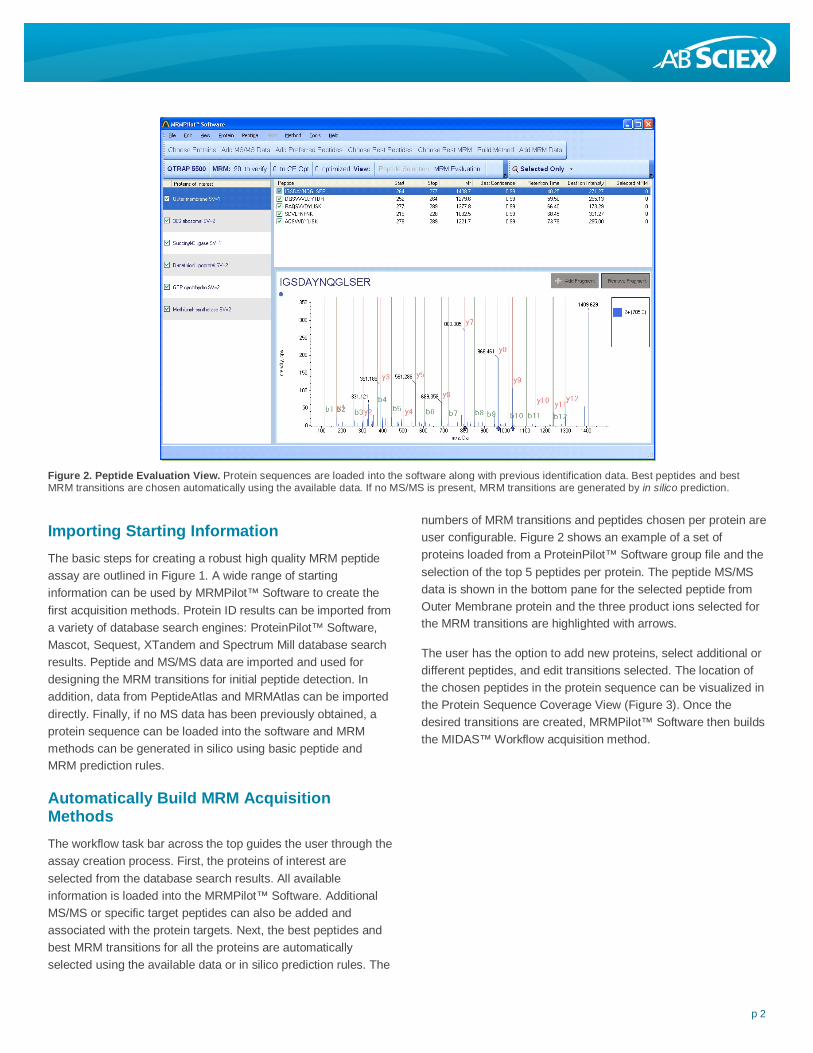
numbers of MRM transitions and peptides chosen per protein are user configurable. Figure 2 shows an example of a set of proteins loaded from a ProteinPilot™ Software group file and the selection of the top 5 peptides per protein. The peptide MS/MS data is shown in the bottom pane for the selected peptide from Outer Membrane protein and the three product ions selected for the MRM transitions are highlighted with arrows.
The user has the option to add new proteins, select additional or different peptides, and edit transitions selected. The location of the chosen peptides in the protein sequence can be visualized in the Protein Sequence Coverage View (Figure 3). Once the desired transitions are created, MRMPilot™ Software then builds the MIDAS™ Workflow acquisition method.
Figure 2. Peptide Evaluation View. Protein sequences are loaded into the software along with previous identification data. Best peptides and best MRM transitions are chosen automatically using the available data. If no MS/MS is present, MRM transitions are generated by in silico prediction.

p 3
Automatic Data Processing MRM data is acquired on the biological sample of interest or protein/peptide standards using the acquisition methods created. This data is automatically processed with the embedded MRM peak integration algorithms in MRMPilot™ Software, then assessed for quality in the MRM Evaluation View (Figure 4). The peptide MRM transitions are listed in the top pane and the MRM data for the selected peptide transition is shown in the bottom pane along with the full scan MS/MS data acquired using the MIDAS™ Workflow for confirmatory purposes. Overlaid with the experimental MS/MS data is either the MS/MS data from the discovery phase or a theoretical MS/MS pattern for comparison. MIDAS Workflow data files can be searched with ProteinPilot Software to identify all the MS/MS spectra. The identification results can also be loaded into MRMPilot™ Software to further confirm the MRM transition retention times and identities.
Iteratively Optimize MRM Transitions MRMPilot™ Software allows iterative optimization of MRM transitions and assays. Multiple MRM transitions per peptide can be analyzed with the goal of finding the MRMs with the best qualitative and quantitative quality. Collision energies for each peptide are automatically computed with good accuracy using the embedded rolling collision energy equations. However, for lower level peptides that require fully optimized sensitivity, collision energy optimization (CE Opt) can be performed. Here, multiple collision energies around a computed rolling collision energy are measured and collision energies that provide the best peak intensity per MRM transition are selected.
Once the retention time of the peptides is known, the multiplexing capabilities of the Scheduled MRM™ Algorithm2 can be leveraged during the optimization or reproducibility testing, further improving the efficiency of assay development3. With Scheduled MRM Algorithm, an MRM transition is only monitored across its expected retention time, reducing MRM concurrency and allowing for many more MRMs to be analyzed in a single run.
Figure 4. MRM Evaluation View: After acquiring MRM data, the data is integrated automatically and associated with the MRM transitions. Any MS/MS data acquired can be identified by ProteinPilot™ Software and also linked to the MRM transitions to confirm retention times. Qualitative and quantitative data are visualized together for quality assessment.

p 4
Easy Assessment of Data Quality There are a number of ways in MRMPilot™ Software to quickly assess the current data quality and make decisions as to the next steps for the peptides under investigation. In order to assess the quality of the MRM transitions, multiple MRMs per peptide can be overlaid and assessed for peak shape to ensure there are no peak interferences (MRM Evaluation View, Figure 4). MRM transitions that have significant interferences can be deselected with a single button click. Some peak metrics are also computed, mean height, S/N, specificity and %CV can all be evaluated for each measured MRM transition (Figure 5, SamplesTable).
A Stats Graph is displayed (Figure 5, left) showing mean intensity vs. %CV for the best MRM transition from each peptide
in the MRM table. This graph allows one to easily visualize which peptides have the highest intensity and reproducibility for quantitative purposes. The peptides can be selected directly from the graph. The lower intensity peptides can be selected and set to “CE Opt”. They will be used when building the next Collision Energy Optimization method. A key requirement in producing a reliable MRM based method is to acquire replicate samples and evaluate which MRM transitions are the most sensitive and reproducible. In the Stats Graph, higher intensity peptides with good reproducibility can be selected and set to “Optimized” indicating that no further iterative optimization is required (Figure 7). They will be used when building final acquisition methods.
Final MRM Acquisition Methods After all optimization is completed, a final MRM assay is built. This method can be an MRM only acquisition method, a MIDAS™ Workflow acquisition method or a Scheduled MRM™ Acquisition method for any AB SCIEX Triple Quad™ or QTRAP® based system.
Final, fully optimized MRM transitions for target proteins can be stored for future use in the ProteinAssay Catalogue. Here the optimized MRMs are archived and can be easily pulled in to future working sessions and used. ProteinAssay Catalogue can also be easily shared between collaborators as a a means to share quantitative assays.
Figure 6: Building a CE Opt Acquisition Method. Multiple types of acquisition methods can be built automatically. Shown here is the settings for building collision energy optimization methods. A set of MRM transitions at incremental collision energies are monitored and assessed for highest sensitivity.
Figure 5: Summary Information for Easy Tracking of Assay Development Progress. The Stats Graph and Samples Table shown in the top right of the MRM Evaluation view are very useful for evaluating the status and progress of MRM transitions and peptides. By selecting on a particular protein, the best peptide MRM transitions are displayed for each peptide in the Stats Graph. For a selected peptide MRM transition, the progress of that MRM across the various assay development steps can be evaluated in the Samples Table.

p 5
Conclusions MRMPilot™ Software provides a very intuitive, easy to use workspace for rapidly developing high quality, robust quantitative MRM assays4. Automated acquisition method building and MRM peak integration makes it easy to acquire and process MRM data. The ability to view both the MRM quantitative data along with the full scan MS/MS qualitative data provided by the QTRAP® systems is key to ensuring confidence in the created assay. Easy visualization tools (user friendly graphics and tables) help accelerate the decision making during the assay development process. The final result is a set of high quality MRM transitions that can be used in a true biological assay.
References 1. To download a trial version of MRMPilot™ Software please
visit: http://www.absciex.com/mk/get/Software_downloads
2. Scheduled MRM™ Algorithm Enables Intelligent Use of Retention Times During Multiple Reaction Monitoring. AB SCIEX Technical Note, Publication 0921010-01.
3. Chemical Labeling Strategy for Generation of Internal Standards for Targeted Quantitative Proteomics. AB SCIEX Technical Note, Publication 0923410-01.
4. Accelerating Throughput for Targeted Quantitation of Proteins/Peptides in Biological Samples. AB SCIEX Technical Note, Publication 0920810-01.
Figure 7: A Final Step in Creation of an MRM Assay is to Assess the Reproducibility of an MRM Transition. By selecting on a particular protein, only the best peptide MRM transitions are displayed for each peptide. This graph allows the user to quickly assess which MRM transitions are best since the highest intensity MRM transitions with the lowest %CV will appear closest to the top left corner. Selecting those MRM transitions allows them to be set as “Optimized” so that no further optimization is required. Poor MRM transitions are set to “Failed” and not used in creating the final methods.
For Research Use Only. Not for use in diagnostic procedures.
© 2010 AB SCIEX. The trademarks mentioned herein are the property of AB Sciex Pte. Ltd. or their respective owners. AB SCIEX™ is being used under license.
Publication number: 0960210-01