mrf-10 - 東京計器株式会社
TRANSCRIPT

Doc No. KF09-003B
Flat Radar Level Sensor
MRF-10
Installation & Operation Manual

Safety Cautions The caution message shown in the User’s Guide is defined as follows: The following safety precautions contain important information pertaining to the safe use of the Radar Level Gauge. Read this text carefully and make sure to fully understand its contents before installing and operating this equipment. Follow directions given herein at all times when operation. TOKYO KEIKI INC. is not at all liable for an injury and/or a damage resulting from misuse of this equipment by the user that is contrary to these cautionary notes. For quick reference, store this manual in a designated location with easy access (preferably near the equipment). In this manual and on the equipment, the following safety symbols are used to ensure the equipment is used safety and to protect operators and property from possible hazards or damage. Read the explanations below carefully and familiarize yourself with the symbols before reading the manual. Safety symbols
DANGER Indicates that incorrect usage can result directly in death or serious injury to the operator.
WARNING Indicates that incorrect usage may result in loss of life or serious injury to the operator.
CAUTION Indicates that incorrect usage may result in injury to the operator or damage to the equipment.
Indicates referring to information for usage of the function or features. (Put on the equipment)
[Warning Label] Indicates that incorrect usage may result in death or serious injury to the operator.
Warning Label
Left warning label means Caution Do not remove cable glands or any screws that attached with main unit. In case of removal it, main unit can not satisfy performance of protection class.
( ) 1

Usage Precautions This instrument is used to measure level height by means of microwave. For safe usage and optimum performance of the radar level sensor, always operate the instrument according to the usage precautions below.
CAUTION 1. Failure to comply with one or more of the following conditions may result in poor
measurement performance or incorrect measurement values. ・Use an appropriate power supply rated for the voltage range designated in the
specifications. ・Do not subject the main unit to vibration or mechanical shock. ・Place the main unit, transducer and cable in a location without noise interference. ・Use the equipment within the predetermined ambient temperature and humidity
range. 2. If the signal level is below the minimum detection requirement of the instrument, the
alarm will be reported through analog output in accordance with alarm setting. 3. Be sure to use the instructions in the Manual when changing settings on the main
unit. Incorrect settings will result in poor performance or incorrect measurement values (output signals).
4. Do not modify or disassemble the unit. Such actions may result in electrical shock or
equipment damage. 5. If this Operation manual is lost, contact the nearest dealership.
( ) 2

Introduction Thank you for your selecting our radar level sensor. This Manual includes detailed explanations regarding safety cautions, structure, set up, operation, troubleshooting, and maintenance of the radar level sensor. Read this manual carefully before operation to ensure an adequate understanding of the equipment. Proper use of the Operation Manual The following points must be observed:
CAUTION
1. Carefully read the Manual. The contents of this Manual are very important and should be read completely.
2. Store the Manual in a safe location. The Manual is essential for appropriate operation of the equipment. Store the manual in a safe and accessible location. The storage location and person in charge should be determined after careful consideration.
3. Ensure that the Manual is supplied to the operator of the equipment. The representative or dealer of this equipment must provide this Manual to the user who will actually operate the equipment.
4. The Manual must be replaced if lost or damaged. If the Manual is lost, contact the representative. A new manual is available for purchase.
5. Ensure that the warning label is properly attached. If the warning label is illegible or has come off, contact the manufacturer to purchase a new label.
Precautions regarding the Manual This Manual was written in accordance with the standard specifications of the original instrument. In case of discrepancies between written specifications and approved drawings, the drawings should be given precedence. Restrictions and precautions necessary to maintain the equipment The following items must be observed in order to maintain the equipment.
CAUTION
1. Do not drop or bump the unit and the transducer. 2. Do not use the unit in environmental conditions (ambient temperature, ambient
humidity) other than those prescribed in this manual. 3. Do not use the unit with a power supply other than the one prescribed in this manual. 4. Do not use damaged or worn-out cables (power cables, coaxial cables, signal
cables). 5. Under no circumstances attempt to modify or disassemble the instrument. Contact
the manufacturer in the event of a malfunction. 6. Do not remove cable glands or any screws that attached with main unit. In case of
removal it, main unit can not satisfy performance of protection class. 7. Do not modify or disassemble the unit. Such actions may result in electrical shock or
equipment damage. 8. Do not use the unit and/or accessories in restricted hazardous areas.
( ) 3
Safety Precautions ……………………………………………………………………….. (1) Usage Precautions ……………………………………………………………………….. (2) Introduction ………………………………………………………………………………... (3) Proper use of the Operation Manual …………………………………………………… (3) Precautions regarding to the Manual ………………………………………………….. (3) Restrictions and precautions necessary to maintain the equipment ………………... (3)
INDEX 1. Product Description 1-1 1.1 Features 1-1 1.2 Measuring principle 1-1 1.3 MRF-10 measuring system 1-1 2. Mechanical Installation 2-1 2.1 Requirements 2-1 2.2 Beam area in the measuring range 2-2 2.3 Recommended installation example 2-3 (1) Installation for water channel 2-3 (2) Installation for storage tank 2-4 3. Electrical Installation 3-1 3.1 Wiring connection 3-1 (1) Transmitter side 3-1 (2) Connection fro commissioning software 3-2
3.2 Cables 3-2 3.3 Load 3-2 3.4 Power Supply 3-2 3.5 Grounding 3-3 (1) Connecting only with attached standard
cable or extended with 3-core shielded cable 3-3 (2) Extended 2-core cable with shield 3-3 (3) With lightening arrester 3-3 (4) When base of the mounting position made
by metal parts which connected with the grounding line 3-4
4. Commissioning 4-1 4.1 Working conditions 4-1 4.2 Produced File 4-1 4.3 Connection 4-2 4.4 Initial Setup 4-2 (1) Startup Screen 4-2 (2) Reading HART ID 4-3 (3) Message after data communication 4-4
4.5 Basic Operation 4-5 (1) Read parameter 4-5 (2) Rewrite of parameters 4-6
4.6 Measuring Value 4-7
( ) 4
(1) Monitoring of measuring value 4-7 (2) Logging the measured data 4-8 4.7 Tank Spectrum 4-9 (1) Plotting Tank Spectrum 4-9 (2) Zoom-in a part of spectrum 4-10 (3) Save spectrum data 4-11 4.8 Noise Table 4-12 (1) Plotting points 4-12 (2) Deleting data from noise table 4-14 4.9 Parameter instructions 4-15 5. Setup 5-1 5.1 Basic Parameters 5-1 5.2 Negative level measurement 5-1 5.3 Avoiding Disturbance Echoes 5-2 (1) Dead Band 5-2 (2) Noise table 5-2
5.4 Volume calculation 5-5 (1) Defined tanks 5-5 (2) User defined tank 5-6
5.5 Analog value compensation 5-7 (1) Analog check 5-7 (2) Analog calibration 5-7
5.6 Measuring value compensation 5-8 5.7 Bottom recognition 5-8 6. Technical Information 6-1 6.1 Main unit specification 6-1 (1) Main unit specification 6-1 (2) Power 6-1 (3) Output 6-1 (4) Accuracy 6-2
6.2 Environmental resistance 6-2 6.3 Construction 6-3 (1) Cable connection 6-3 (2) Material and Mass 6-3
6.4 Dimension 6-4
( ) 5

(blank) ( ) 6
1. Product Description 1.1 Features
The MRF-10 is a loop-powered radar level gauge, which can be installed easily in a variety of applications. The MRF-10 employs a non-contact radar level gauging principle based on pulsed microwave signals and is suitable for level measurement in applications such as liquids, pastes and slurries.
MRF-10 uses 5.8GHz low power pulsed microwave. It provides good measurement stability, because propagation of microwaves is less affected by change of temperature, pressure or gas conditions in tank.
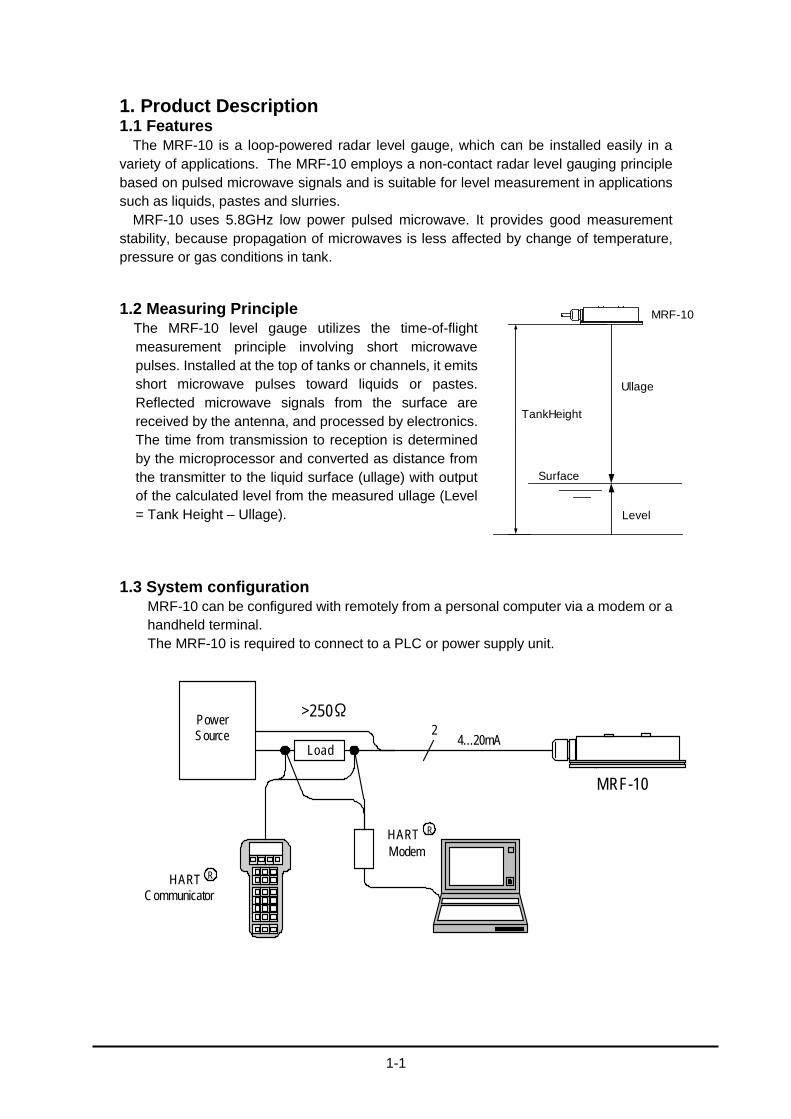
1.2 Measuring Principle The MRF-10 level gauge utilizes the time-of-flight measurement principle involving short microwave pulses. Installed at the top of tanks or channels, it emits short microwave pulses toward liquids or pastes. Reflected microwave signals from the surface are received by the antenna, and processed by electronics. The time from transmission to reception is determined by the microprocessor and converted as distance from the transmitter to the liquid surface (ullage) with output of the calculated level from the measured ullage (Level = Tank Height – Ullage).
1.3 System configuration MRF-10 can be configured with remotely from a personal computer via a modem or a handheld terminal. The MRF-10 is required to connect to a PLC or power supply unit.
Ullage
Level
Surface
Tank Height
MRF-10
HARTModem
HARTCommunicator
PowerSource
Load
>250Ω4...20mA
2
R
R
MRF-10
1-1

(blank) 1-2

2. Mechanical Installation 2.1 Requirements
Please regard to following points to install MRF-10 transmitter head.
(1)Directivity angle of microwave MRF-10 has elliptical (oval) directivity of microwave as below Fig. 2.1-1. Please refer to chapter 2.3 example of recommended installation to install transmitter head properly.
Fig. 2.1-1 Beam angle
(2)Free space requirement The transmitter should be mounted so that no obstacles are present in the radar beam. Obstacles in the radar beam may reduce the measuring range. Please refer to list 2.2-1.
(3)Mounting allowance
Center of microwave radiation must be vertical against target fluid surface. Allowance of the mounting angle should be +/- 1degree.
Beam angle23° (Crosswise direction)
Cable Entry
Beam angle 50° (Lengthwise direction)
Beam area
MRF-10
2-1

2.2 Beam area in the measuring range List 2.2-1:Beam angle & Beam area (* -3dB Half-power beam angle)
Distance (m)
Beam area (m) Lengthwise direction
(cable direction) Beam angle*=50°
Crosswise direction Beam angle*=23°
2 1.9 0.8 4 3.7 1.6 6 5.5 2.4 8 7.5 3.3 10 9.3 4.1
[ Key factors for measurement ] 1. Compared to calm fluid surfaces, measuring ranges of turbulent surfaces are
reduced due to poorer reflection. 2. Deposit buildup on the antenna, foaming on liquid surfaces, powder granules in air
suspension and other interior tank conditions may affect measuring range and performance.
3. Obstructions in the microwave radiating area or target fluid surface areas less than
the radiating area will reduce microwave reflection and decrease and narrow the measurable range.
4. Measurable range may be varied when area of target fluid surface is smaller than
radiated beam area.
2m
4m
6m
8m
10m
Distance
23.0°
50.0°
Beam area
Long side Short side
2-2

2.3 Recommended installation example
Following installation examples are recommended installations.
(1) Installation for water channel Install MRF-10 lengthwise direction of transmitter head to be same direction of flow direction as below. Also please keep the required free space from the wall.
Fig. 2.3-1 example of wall side mounting installation
Fig. 2.3-2 example of top roof mounting installation below grating cover
Wall
H
Required space =H x 0.5
Wat
er C
hann
el
Flow Direction
Any obstructions mustnot be on this wall.
H
Grating cover
Concreteslab
Grating cover / Top roof mountingWate
r Cha
nnel
Required space = H x 0.5
Flow Direction
2-3
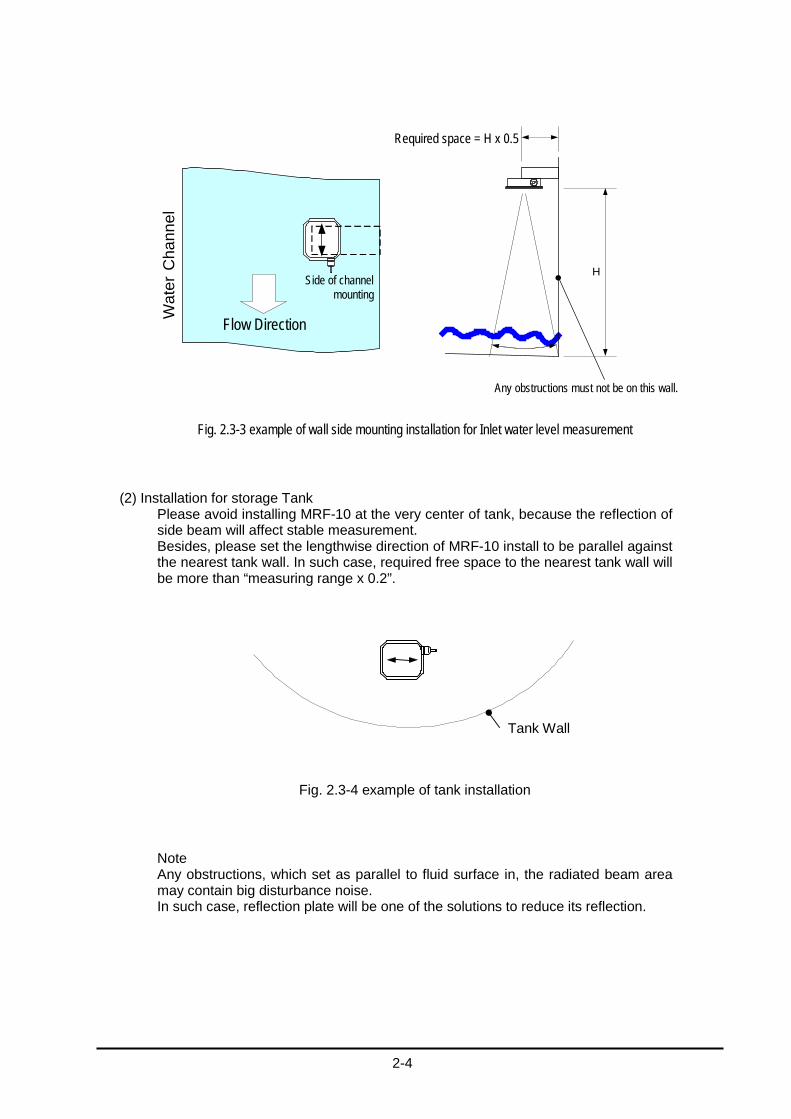
Fig. 2.3-3 example of wall side mounting installation for Inlet water level measurement
(2) Installation for storage Tank Please avoid installing MRF-10 at the very center of tank, because the reflection of side beam will affect stable measurement. Besides, please set the lengthwise direction of MRF-10 install to be parallel against the nearest tank wall. In such case, required free space to the nearest tank wall will be more than “measuring range x 0.2”.
Fig. 2.3-4 example of tank installation
Note Any obstructions, which set as parallel to fluid surface in, the radiated beam area may contain big disturbance noise. In such case, reflection plate will be one of the solutions to reduce its reflection.
Tank Wall
HSide of channel
mounting
Any obstructions must not be on this wall.
Wat
er C
hann
el
Flow Direction
Required space = H x 0.5
2-4

3. Electrical Installation 3.1 Wiring connection (1) Transmitter side
! Caution
Do not remove cable glands or any screws that attached with main unit. In case of removal it, main unit can not satisfy performance of protection class.
Any cable work must be done at the end side of cable, not at the cable entry of the main unit. If cable extension is required, please use chemical binder at the end of cable to keep water protection class.
Fig. 3.1.1-1 wiring connection
・ FG (frame ground) must be connected to ground line with cable shield as below.
Fig. 3.1.1-2 Standard wiring diagram
Connet to + side power line
Frame Ground
Connect to power line shield at cabinet side.
MRF-10 Cable
+ (blue)
- (white)
FG (yellow)
Shield
Connet to - side power line
Connect to the groung terminal of the cabinet with cable shield line.In case of grounding already at transmitter head side, do notconnect this line to the ground line at the cabinet.
MRF-10+-
FG
Powerscource
+-
Shield
MRF-10 standard cable
3-1
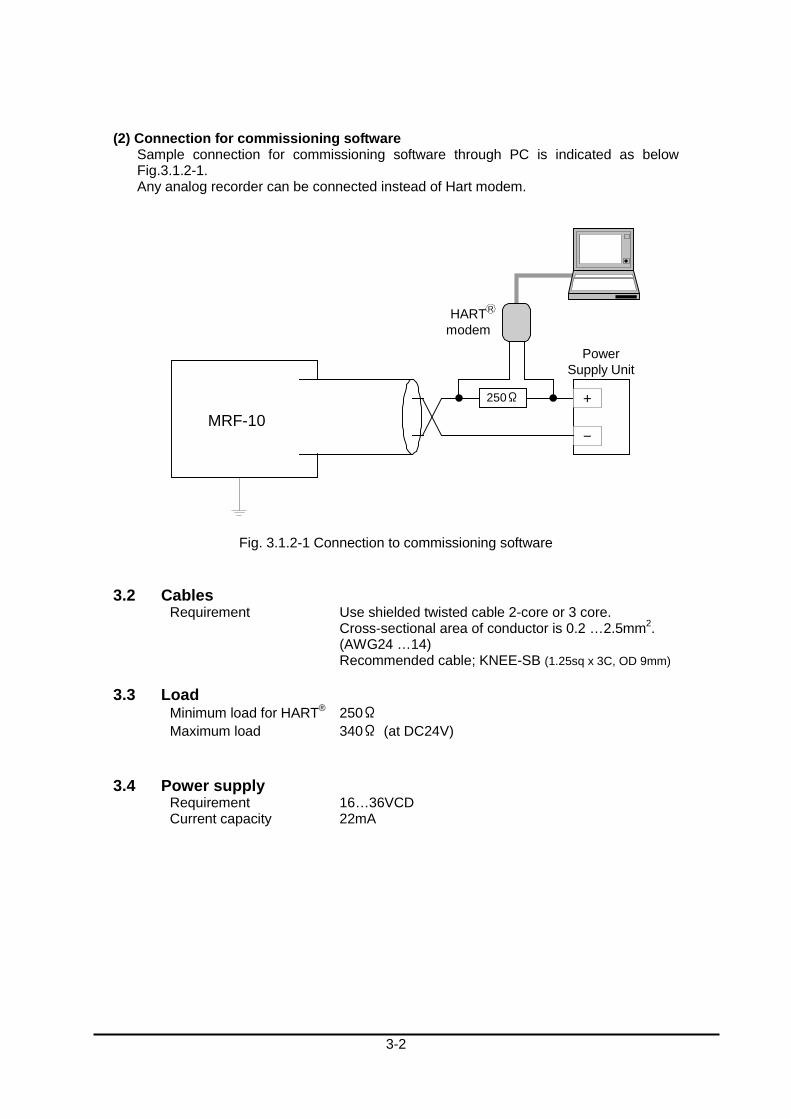
(2) Connection for commissioning software Sample connection for commissioning software through PC is indicated as below Fig.3.1.2-1. Any analog recorder can be connected instead of Hart modem.
Fig. 3.1.2-1 Connection to commissioning software
3.2 Cables
Requirement Use shielded twisted cable 2-core or 3 core. Cross-sectional area of conductor is 0.2 …2.5mm2.
(AWG24 …14) Recommended cable; KNEE-SB (1.25sq x 3C, OD 9mm)
3.3 Load
Minimum load for HART® 250Ω Maximum load 340Ω (at DC24V)
3.4 Power supply Requirement 16…36VCD Current capacity 22mA
HARTmodem
PowerSupply Unit
250Ω
-
+
R
MRF-10
3-2

3.5 Grounding The terminal must be connected to earth ground prior to connection to any other equipment. The grounding resister should be less than 100 ohm.
(1) Example of connecting only with attached standard cable or extended with 3-core shielded cable Please connect with shield & FG line to grounding line at power source side as below.
(2) Extended 2-core cable with shield
Please connect shield line to FG line at connection part, then grounding at power source side as below.
(3) With lightening arrester
Please connect only FG line to arrester grounding line. The shield of extension line should be taken at ground line of power source side as below. The lightening arrester should be installed near-by MRF-10 transmitter head.
MRF-10+-
FG
Powerscource
+-
Shield
MRF-10 standard cable
MRF-10+-
FG
Powersource
+-
Shield
Extention cable
MRF-10 Arrester+-
FG
+-
Extention cablePowersource
3-3

(4) When base of the mounting position made by metal parts which connected with the grounding line already. Please connect the grounding terminal near by cable entry to the ground.
Do not use FG line, only with cable shield connects to grounding line as below.
MRF-10+-
FG
+-
Powersource
Shield
MRF-10+-
FG
+-
Extention cablePowersource
Shield
Grounding Terminal
3-4

4. Commissioning 4.1 Working Conditions
Microsoft Windows 2000 / XP
Personal Computer which can activate HART modem
HART Modem (* We have checked following products in the market.)
Maker : MAC Tek
Modem : VIATOR RS232 HART Interface (Model 010001)
VIATOR USB HART Interface (Model 010031)
4.2 Produced file MRFConfig.exe : Main program of configuration software
MRFConfig.ini : Initial File (When the configuration software was quitted, this file is
automatically created.)
Note This software has no installer. Hence, please copy all files to any folder.
! Caution Carefully read this manual prior to use this software because incorrect operation will cause malfunction and/or breakdown. This software is subject to change for upgrade without prior notice
Initial File
Configuration Software
4- 1
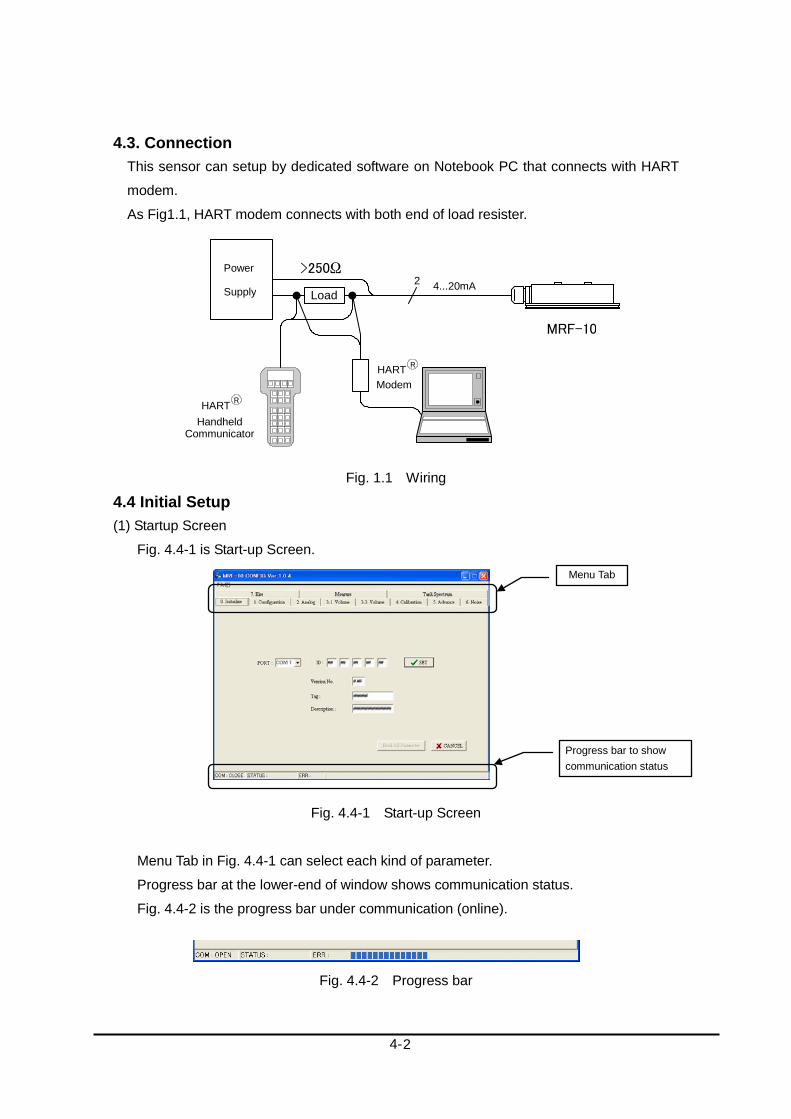
4.3. Connection This sensor can setup by dedicated software on Notebook PC that connects with HART
modem.
As Fig1.1, HART modem connects with both end of load resister.
Fig. 1.1 Wiring
4.4 Initial Setup (1) Startup Screen
Fig. 4.4-1 is Start-up Screen.
Fig. 4.4-1 Start-up Screen
Menu Tab in Fig. 4.4-1 can select each kind of parameter.
Progress bar at the lower-end of window shows communication status.
Fig. 4.4-2 is the progress bar under communication (online).
Fig. 4.4-2 Progress bar
Menu Tab
Progress bar to show communication status
HART Modem
HART Handheld
Power
Supply Load
>250Ω 4...20mA 2
R
R
MRF-10
Communicator
4- 2

(2) Reading HART ID
Get HART ID from MRF-10.
Fig. 4.4-3 Start-up Screen after getting HART ID
Select serial port No. that connected with HART modem from PORT column in Fig.
4.4-3 at first.
Secondly, click [SET] button and download HART ID from the sensor.
After download of HART ID, individual ID and software version No. will be filled in each
column. All communication with MRF-10 will use this ID.
Fig. 4.4-4 After getting HART ID
[SET] button: Retrieve HART ID from the sensor.
[Read All Parameter] button: Retrieve all parameters from the sensor at one time.
[Cancel] button: Interrupt communication with the sensor on the way.
HART ID No.
Select serial port number.
Get ID by [SET] button.
Download all parameters
Cancel download
4- 3

(3) Message after data communication
After completion of data communication between the sensor and PC, a message
window will appear as Fig. 4.4-5.
Fig. 4.4-5 The message of Successful Communication
In case of communication failure or time-out error, the status will indicate FAIL or
TIME OUT as Fig. 4.4-6.
These messages are mostly caused by improper connection of HART modem or there
is a possibility of noise on communication pathway. Please check each condition.
Fig. 4.4-6 Status Indication by communication failure or timeout
4- 4

4.5. Basic Operation (1) Read Parameter
It shows how to read configuration parameters on the screen of “1.Configuration” for
example.
Fig. 4.5-1 Screen of “1.Configuration” before “READ”
Configuration Screen will be shown by click a tab of “1.Configuration” as Fig. 3.1.
Watery blue column means the parameter was not read yet.
[READ] button make start to retrieve all parameters that are on the screen from the
sensor. In Fig. 4.5-1, [1-1] ~ [1-5] will be downloaded.
Fig. 4.5-2 Screen of “1.Configuration” after “READ”
After finish the download of parameters, each column’s color will be white as Fig. 4.5-2.
When it is necessary to retrieve other parameters, please select another menu tab and
click [READ] button same as the above.
Parameter Name
Input Column
READ Button
4- 5

(2) Rewrite of Parameters
It shows how to change configuration parameters on the screen of “1.Configuration” for
example.
[Note] When changing parameter, it is necessary to retrieve parameters by clicking
[READ] button prior to parameters change. There is a possibility of malfunction
if any parameter was changed without retrieving parameter.
The column that was changed inside value or item choice will be light blue color.
Fig. 4.5-3 Parameter change by Combo Box
As Fig. 4.5-3, Combo Box can select listed items. When item was selected, the
column’s color will be changed to light blue.
Fig. 4.5-4 Parameter change by value input
As Fig. 4.5-4, when overwrite new value, click Enter key of PC. After that, text box’s
color will be changed to light blue.
Change from “meter” to ”feet”
After input “5”, click “Enter”.
4- 6

After changing parameters, click [WRITE] button in order to upload latest parameters to
MRF-10. After completion of data transferring, all columns’ color will be changed to
white as Fig. 4.5-5.
Fig. 4.5-5 After uploading changed parameters
That is all how to change parameters. When the other parameters in other screen are
changed, repeat same operations after select other tabs.
4.6 Measuring Value (1) Monitoring of measuring value
Measuring value can monitor by HART communication. Select “Measure” tab and the
menu shows as Fig. 4.6-1.
Fig. 4.6-1 Screen of “Measure” for monitoring measurement
This screen can indicate the value of Level, Ullage (Distance), Volume, Current (% and
mA) and Signal Amplitude in real time. “Current” shows in accordance with the selected
parameter in [2-1] Analog Output Parameter.
Start to monitor measuring value
4- 7

[START] button : Monitoring starts. All value will be refreshed at every 1s.
[STOP] button : Monitoring stops.
(2) Logging the measured data
Real time logging is available. In order to use logging function, check the box of “Save
Data Log” and input logging interval as Fig. 4.6-2.
Fig. 4.6-2 Logging setup
[...] button can open a dialogue (Fig. 4.6-3) to browse & create a save file. Please input
file name and select repository here.
Fig. 4.6-3 Dialogue to save logging data
After the above setup, logging will be started by clicking [START] button while
displaying measured values.
Set logging interval.
Open the dialogue to browse file folders.
Check Box for Logging
4- 8
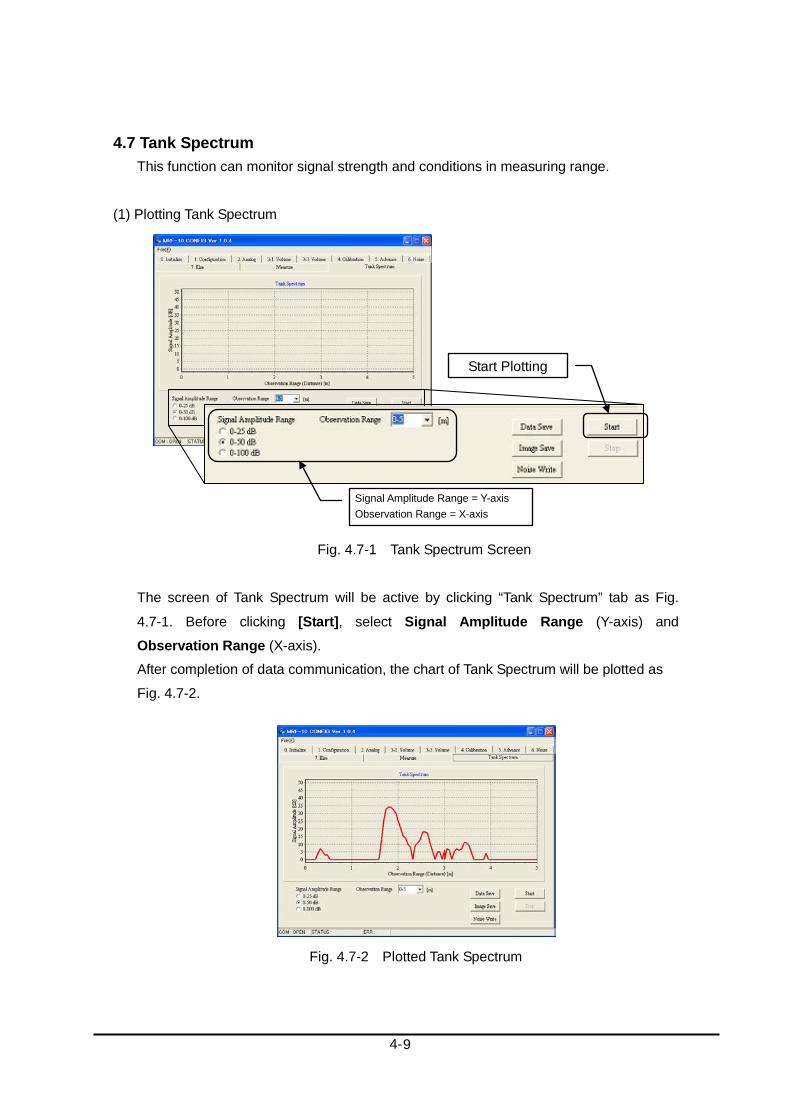
4.7 Tank Spectrum This function can monitor signal strength and conditions in measuring range.
(1) Plotting Tank Spectrum
Fig. 4.7-1 Tank Spectrum Screen
The screen of Tank Spectrum will be active by clicking “Tank Spectrum” tab as Fig.
4.7-1. Before clicking [Start], select Signal Amplitude Range (Y-axis) and
Observation Range (X-axis).
After completion of data communication, the chart of Tank Spectrum will be plotted as
Fig. 4.7-2.
Fig. 4.7-2 Plotted Tank Spectrum
Signal Amplitude Range = Y-axis Observation Range = X-axis
Start Plotting
4- 9
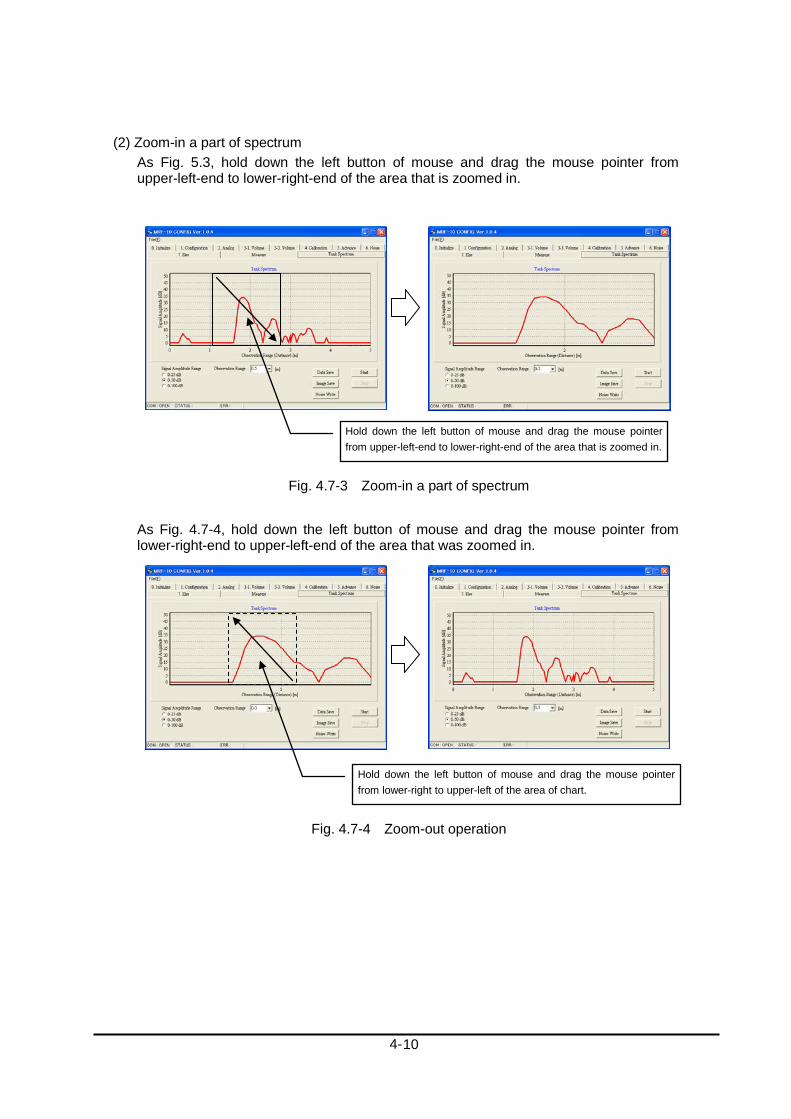
(2) Zoom-in a part of spectrum As Fig. 5.3, hold down the left button of mouse and drag the mouse pointer from upper-left-end to lower-right-end of the area that is zoomed in.
Fig. 4.7-3 Zoom-in a part of spectrum
As Fig. 4.7-4, hold down the left button of mouse and drag the mouse pointer from lower-right-end to upper-left-end of the area that was zoomed in.
Fig. 4.7-4 Zoom-out operation
Hold down the left button of mouse and drag the mouse pointer from upper-left-end to lower-right-end of the area that is zoomed in.
Hold down the left button of mouse and drag the mouse pointer from lower-right to upper-left of the area of chart.
4- 10
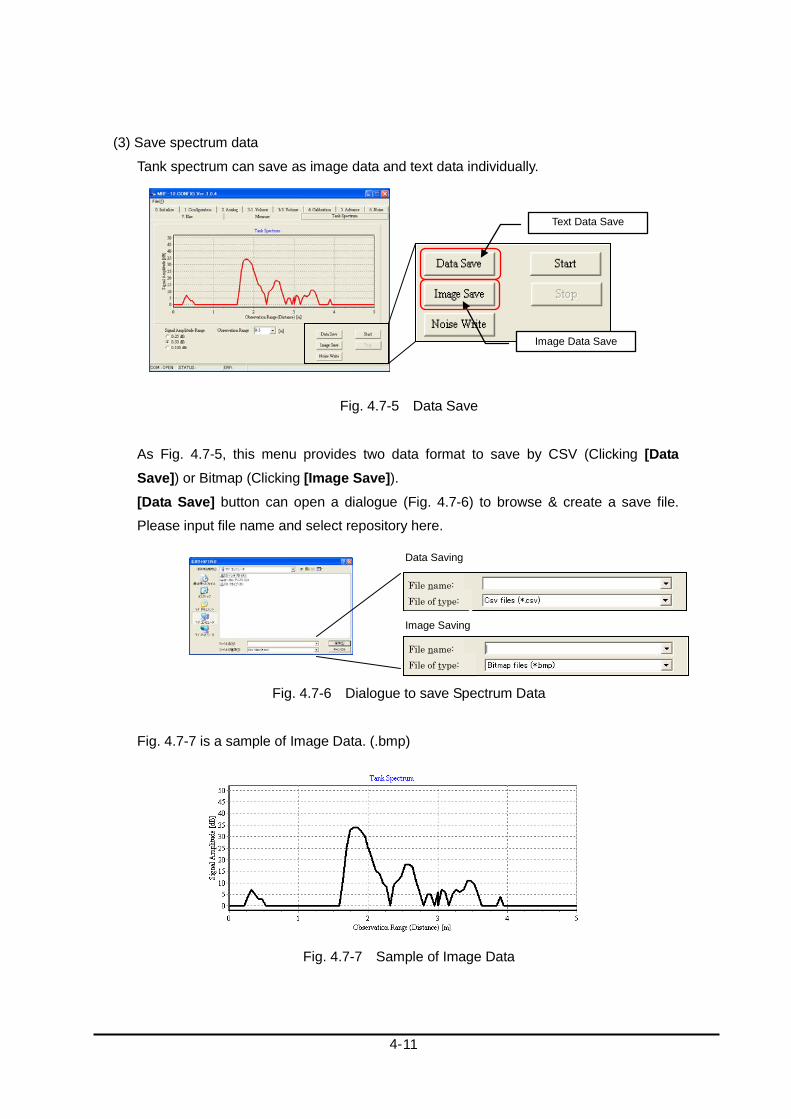
(3) Save spectrum data
Tank spectrum can save as image data and text data individually.
Fig. 4.7-5 Data Save
As Fig. 4.7-5, this menu provides two data format to save by CSV (Clicking [Data Save]) or Bitmap (Clicking [Image Save]). [Data Save] button can open a dialogue (Fig. 4.7-6) to browse & create a save file.
Please input file name and select repository here.
Fig. 4.7-6 Dialogue to save Spectrum Data
Fig. 4.7-7 is a sample of Image Data. (.bmp)
Fig. 4.7-7 Sample of Image Data
Text Data Save
Image Data Save
Data Saving
Image Saving
File of type: File name:
File of type: File name:
4- 11
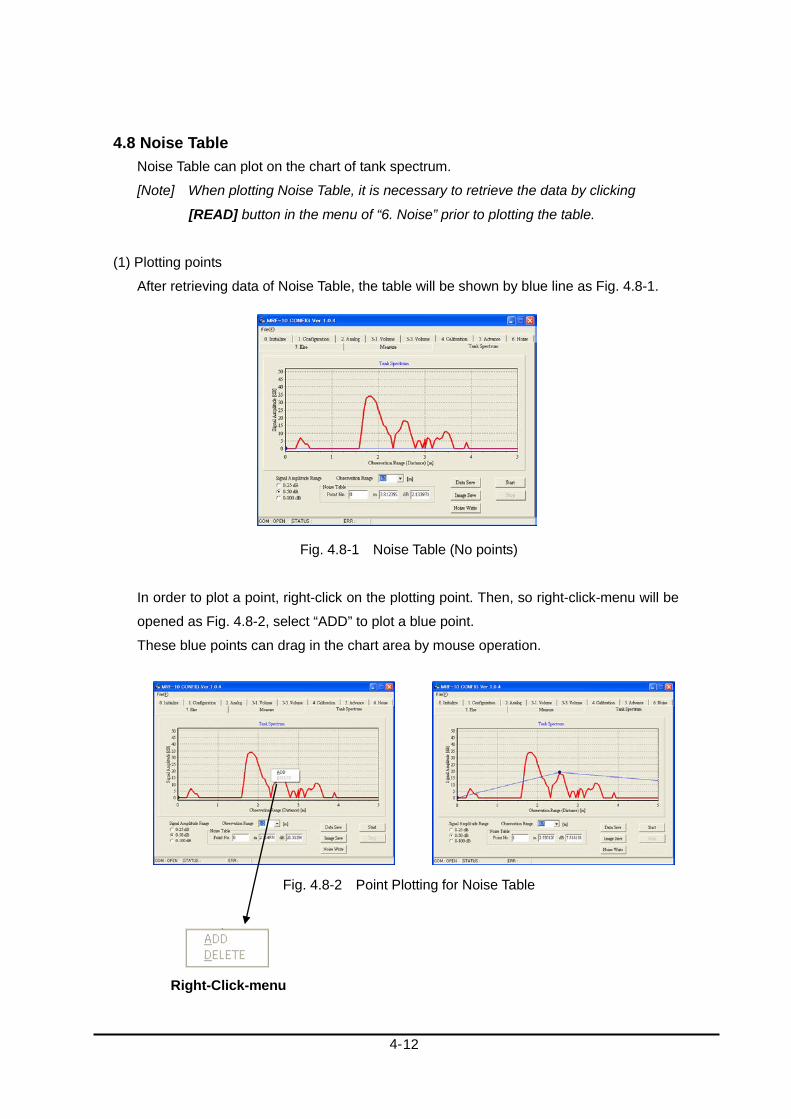
4.8 Noise Table Noise Table can plot on the chart of tank spectrum.
[Note] When plotting Noise Table, it is necessary to retrieve the data by clicking
[READ] button in the menu of “6. Noise” prior to plotting the table.
(1) Plotting points
After retrieving data of Noise Table, the table will be shown by blue line as Fig. 4.8-1.
Fig. 4.8-1 Noise Table (No points)
In order to plot a point, right-click on the plotting point. Then, so right-click-menu will be
opened as Fig. 4.8-2, select “ADD” to plot a blue point.
These blue points can drag in the chart area by mouse operation.
Fig. 4.8-2 Point Plotting for Noise Table
Right-Click-menu
4- 12

Repeat the above procedure to complete Noise Table. Fig. 4.8-3 is an example of
completed Noise Table.
Fig. 4.8-3 Sample of Noise Table
After all plotting, click [Noise Write] button to upload the data to MRF-10.
Fig. 4.8-4 Uploading of Noise Table data
After uploading, all data can be shown in the menu of “6. Noise”. The data can be
inputted and adjusted in this menu also.
Fig. 4.8-5 The data of Noise Table
Upload Noise Table data
4- 13

(2) Deleting Data from Noise Table
In order to delete a point, right-click on the blue point that should be deleted. Then, so
right-click-menu will be opened as Fig. 4.8-6, select “DELETE” to erase the blue point.
Fig. 4.8-6 Delete a point
After deleting, click [Noise Write] button to upload the data to MRF-10. After uploading,
all data can be shown in the menu of “6. Noise”. The deleted data was eliminated from
this list as Fig. 4.8-7.
Fig. 4.8-7 The data of Noise Table after deleting
With the above procedures, this manual comes to the end of lecture for cardinal operation.
Right-Click & Select “DELETE”
4- 14

4.9 Parameter instructions - shaded areas indicate default settings.
[1--] CONFIGURATION Settings [1-1] Measuring Unit
Value Description m Sets display in Metric units ft Sets display in Feet units
Note: When ‘Measuring Unit’ is changed, units of other parameters also change.
[1-2] G parameter (distance between flange reference point and measuring reference point) Parameter Default Value Description
-3.000-3.000 0.000 R+C-G ≦ 20 (Parameter range in metric [m] units) If measurement unit is [ft], display will be converted to show ‘feet’ units.
[1-3] R parameter (Measurement range) Parameter Default Value Description
0.000-13.000 10.000 R+C-G ≦ 10 (Parameter range in metric [m] units) If measurement unit is [ft], display will be converted to show ‘feet’ units.
[1-4] C parameter (Below measurement range) Parameter Default Value Description
0.000-10.000 0.000 R+C-G ≦ 10 (Parameter range in metric [m] units) If measurement unit is [ft], display will be converted to show ‘feet’ units.
[1-5] H parameter (Deadband) Parameter Default Value Description
0.000-13.000 0.000 Parameter range in metric [m] units If measurement unit is [ft], display will be converted to show ‘feet’ units
4- 15

[2--] ANALOG Settings [2-1] Analog output parameter
Parameter Description Level Level value converted to 4-20 mA Ullage Ullage value converted to 4-20 mA Volume Volume value converted to 4-20 mA Amplitude Signal strength amplitude value converted to 4-20 mA
[2-2] Minimum output (4 mA) Parameter Output Default
Value Description
-3.000-13.000 Level 0.000 Parameter range in metric [m] units -3.000-13.000 Ullage 0.000 Parameter range in metric [m] units 0.000-100.000 Volume 0.000 [%] 0.000-100.000 Amplitude 0.000 [dB]
When [ft] units are selected for “Level” or “Ullage” display, parameter range is
calculated in ‘feet’.
[2-3] Maximum output (20 mA) Parameter Output Default
Value Description
-3.000-13.000 Level 10.000 Parameter range in metric [m] units -3.000-13.000 Ullage 10.000 Parameter range in metric [m] units 0.000-100.000 Volume 100.00 [%] 0.000-100.000 Amplitude 100.00 [dB]
When [ft] units are selected for “Level” or “Ullage” display, parameter range is
calculated in ‘feet’.
[2-4] Alarm selection Parameter Value Description
0 High output 22 mA alarm output 1 Low output 3.9 mA alarm output 2 Hold output Hold last value
[2-5] Fixed current output setting Parameter Value Description
0 Measuring Value [mA] 3.900-22.000 Fixed current Any current value selectable
4- 16

[3--] Volume Setting [3-1] Linearization Selection
Parameter Description Not Calculated Linear Vertical Cylinder Spherical Cylindrical Horizontal Cylinder User Tank Table
Tank Configurations
[3-2] Linearization Point Number Parameter Default
Value Description
0-20 0 Input required no. of points for table
[3-3] Level point ( [300] ~ [319] ) Parameter Default
Value Description
-3.000-13.000 0.000 Parameter range in metric [m] units If measurement unit is [ft], display will be converted to show ‘feet’ units
[3-4] Volume point ( [320] ~ [339] ) Parameter Default
Value Description
0-99999.99 0.000 Display will be converted to the volumetric unit setting under [3-9].
If you create a volumetric table incorporating settings [3-2] ~ [3-4], you can produce a line
chart such as that shown below which enables you to quickly calculate level and
volumetric values.
Linear Spherical Cylindrical
32
1
419
20
[300] [301] [302] [303] [318] [319]
[320]
[321][322]
[323][338]
[339]
Volume point Number on [3-2]
Volume table on [3-4]
Volume
Level
Level table on [3-3]
Level and Volume correlation on the user tank table
4- 17

[3-5] Delete all tables Parameter Value Description
Off Do not delete On Delete all Setting “1” clears table
[3-6] Diameter of the tank Parameter Default Value Description
0.000-10.000 1.000 Parameter range in metric [m] units If measurement unit is [ft], display will be converted to show ‘feet’ units.
[3-7] Length of the tank Parameter Default Value Description
0.000-10.000 1.000 Parameter range in metric [m] units If measurement unit is [ft], display will be converted to show ‘feet’ units.
[3-8] Offset level Parameter Default Value Description
-3.000-13.000 0.000 Parameter range in metric [m] units If measurement unit is [ft], display will be converted to show ‘feet’ units.
Diameter
Linear
R
G
Offset
Diameter
Spherical
R
G
Offset
Length
Diameter
Cylinderical
R
G
Offset
[3-9] Volume unit Parameter Value
m3 Cubic meter Gallons US Gallons (1m3 = 264.17 gal) Barrels Barrel (1m3 = 6.290 bbl) Ft3 Cubic feet (1m3 = 35.31 ft3)
4- 18

[4--] Calibration [4-1] 4mA Calibration
Parameter Default Value Description 3.50-4.50 4.00 In fixed current output mode with current set at
4mA, input ammeter reading.
[4-2] 20mA Calibration Parameter Default Value Description
15.00-25.00 20.00 In fixed current output mode with current set at 20mA, input ammeter reading.
[4-3] Offset Calibration Parameter Default Value Description -1.00-1.00 0.00 Parameter range in metric [m] units
If measurement unit is [ft], display will be converted to show ‘feet’ units.
[4-4] Span Calibration Parameter Default Value 0.90-1.10 1.00
[5--] Advanced Setting [5-1] Averaging Time
Parameter Default Value Description 1-120 10 Measuring value is averaged in accordance with
[sec] setting
[5-2] Noise Margin Parameter Default Value Description 0-100.00 3.00 Noise is eliminated in accordance with [dB]
setting When noise level is high, noise can be masked by attenuating the signal gain.
10
24
Signal Amplitude
[dB]
14
Set noise marginas 10.00dB
Noise
Signal Amplitude
[dB]
4- 19

[5-3] Search Delay Parameter Default Value Description
1-120 120 Time delay after loss of echo until restart in accordance with [sec] setting.
[5-4] Alarm Delay Parameter Default Value Description
1-120 120 Time delay after loss of echo until alarm sounds in accordance with [sec] setting.
[5-5] Bottom Window Parameter Default Value Description
0-0.5 0 Parameter range in metric [m] units If measurement unit is [ft], display will be converted to show ‘feet’ units.
Valid only when [5-7] is set at “0".
[5-6] First Echo Flag Parameter Description
Max Echo Max strength echo defined as surface echo First Echo First echo defined as surface echo
[5-7] Bottom Visible Parameter Description
Bottom Visible When tank bottom echo is larger than surface echo (such as with oil fluids). Effective against echo misdetection.
Bottom Invisible When tank bottom echo is smaller than surface echo (such as with water, setting “Bottom Invisible”, invalidates this function.
Measurement Range (R)
Peak detectable rangeBottom window
Surface echo Bottom echo
Distance
Detected as Surface echoat First Echo setting
Detected as Surface echoat Max Echo setting
Signal Amplitude
4- 20
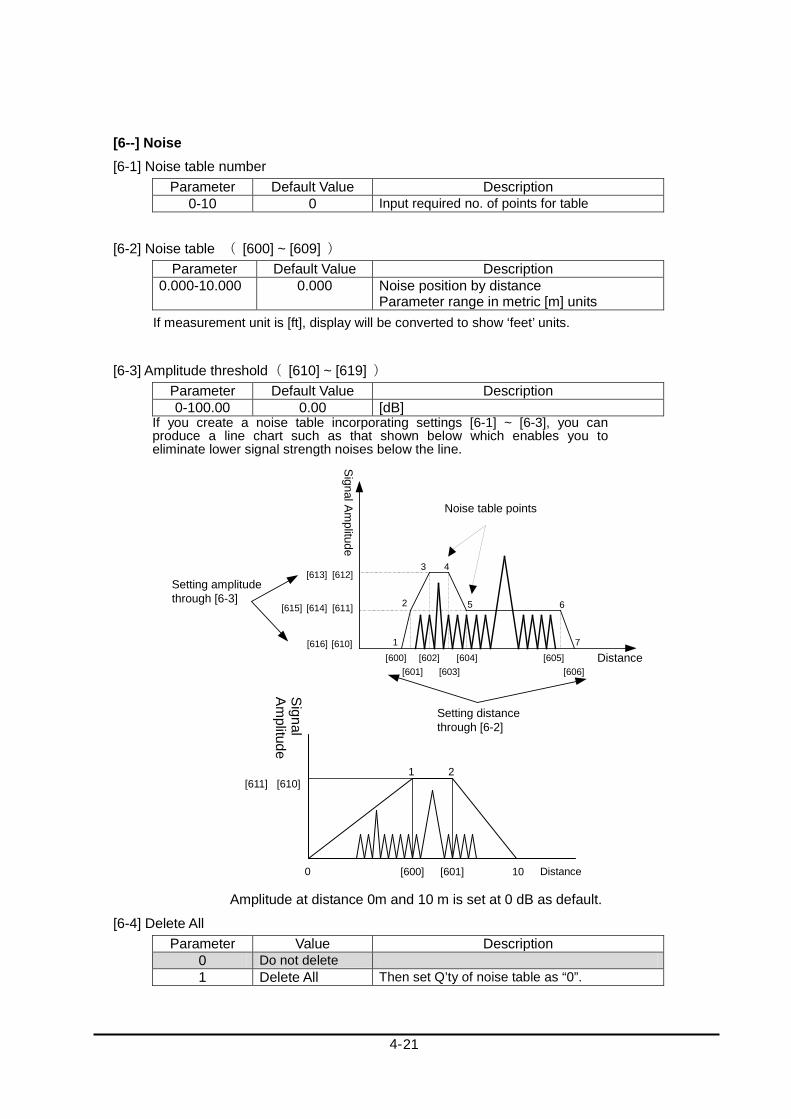
[6--] Noise [6-1] Noise table number
Parameter Default Value Description 0-10 0 Input required no. of points for table
[6-2] Noise table ( [600] ~ [609] ) Parameter Default Value Description
0.000-10.000 0.000 Noise position by distance Parameter range in metric [m] units
If measurement unit is [ft], display will be converted to show ‘feet’ units.
[6-3] Amplitude threshold( [610] ~ [619] ) Parameter Default Value Description 0-100.00 0.00 [dB]
If you create a noise table incorporating settings [6-1] ~ [6-3], you can produce a line chart such as that shown below which enables you to eliminate lower signal strength noises below the line.
Amplitude at distance 0m and 10 m is set at 0 dB as default.
[6-4] Delete All Parameter Value Description
0 Do not delete 1 Delete All Then set Q’ty of noise table as “0”.
Distance[600][601]
[602][603]
[604] [605][610]
[611][614]
[612][613]
[615]
[616]
[606]
Signal Amplitude
Setting amplitudethrough [6-3]
Setting distancethrough [6-2]
3
2
1
4
5 6
Noise table points
7
2
Distance
Signal
Am
plitude
1
0 10
[600]
[601]
[610]
[611]
4- 21
[7--] Other [7-1] Re-search
Parameter Value Description SET Research Mandatory surface echo re-search
[7-2] Parameters Reset Parameter Value Description
SET Initialization Initialized by “1” setting
[7-3] Hardware Reset Parameter Value Description
SET Reset Setting “1” executes hardware reset
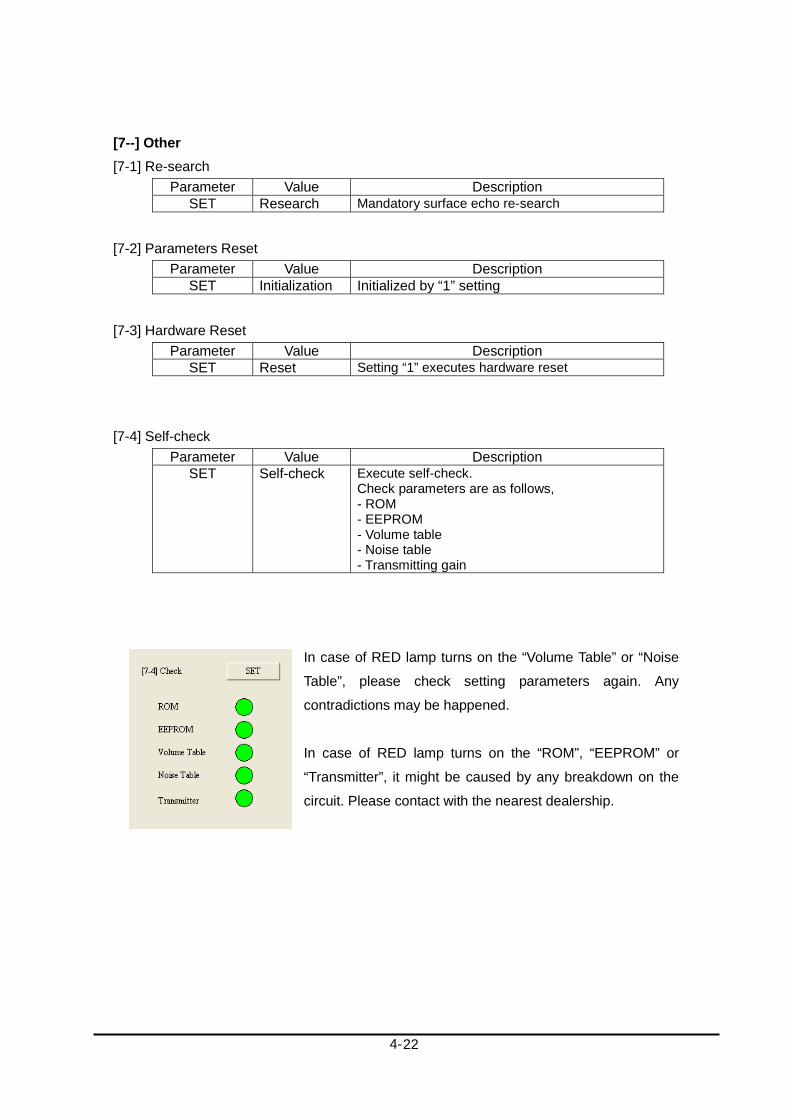
[7-4] Self-check Parameter Value Description
SET Self-check Execute self-check. Check parameters are as follows, - ROM - EEPROM - Volume table - Noise table - Transmitting gain
In case of RED lamp turns on the “Volume Table” or “Noise
Table”, please check setting parameters again. Any
contradictions may be happened.
In case of RED lamp turns on the “ROM”, “EEPROM” or
“Transmitter”, it might be caused by any breakdown on the
circuit. Please contact with the nearest dealership.
4- 22

5 Setup 5.1 Basic Parameters
Following parameters must be inputted to measure properly.
Tank Dimensions G (Offset Distance from Hand-dipping point to Reference Point [MRF-10’s face].)
R (Distance from Hand-dipping point to level zero.)
C (Measuring range that is lower than level zero.)
H (Dead band)
Fig. 5.1-1 Basic Parameters for Measurement
5.2 Negative level measurement
Value ”C” defines below zero level. When “C” values are set, the Hart communicating
PC will show negative values, if the level is below level zero.
[Note] If 4mA corresponds to Lv 0m, analog output will be maintained at 4mA even if
measurement values fall below Lv 0m.
Hand-dipping Point
Reference Point
Ullage
(Distance)
Level
Level Zero
Bottom
Measuring Range
Surface
H Dead Band
R
G
C
5- 1

5.3 Avoiding disturbance echoes There are two ways to avoid the disturbance echo problem.
(1) Dead Band (=”H”)
When there are disturbance echoes in the near zone such as stairs at the top of
the tank, the gauge may capture and interpret these echoes as coming from the
liquid surface.
Set up “H” to avoid this problem.
All echoes within this area would be outside of the measuring range and ignored.
(2) Noise Table
If there are disturbance echoes in the effective measuring range and the gauge
tracks such echoes, set up “Noise Table” parameters.
You can adjust the threshold level for sections of the measurement range with
these parameters.
“Noise Table” parameters are comprised of ullage points and threshold values. Up
to 10 points of values can be established respectively with linear interpolation
between points. (Amplitude at distance 0m and 10 m is set at 0 dB as default.)
If disturbance echoes are tracked, you should first check the ullage and the
amplitude level with the configuration software.
Fig. 5.3-1 Tank Spectrum of inside tank
Please refer to 4.9-[6] “Noise Table” and use commissioning software to input noise
data.
5- 2

[ How to create a noise table ] 1) Open Menu tab [6-1] and then set the noise table number (maximum10 points). 2) Open Menu tab [6-2], and set distance parameters into the data field in accordance
with selected numbers. (For example, if “10” is set at [6-1], you will need to set data [600]~[609] for distance values.)
3) Set distance data for [600], and push “ENTER key” of PC to complete the entry.
Similarly set distance values for [601]…[609].
4) After completing input of distance values, the next step is entering amplitude values.
5) Open Menu tab [6-3] and set threshold level parameters into the data fields in accordance with selected numbers. For example, if “10” is set at [6-1], you will need to set data [610]~[619] for amplitude values.)
6) Amplitude points must correlate to the distances defined under [6-2]. Select table address(ex. [610] and enter amplitude data, then push “ENTER key” of PC to complete the entry. Similarly, set amplitude data for [611]…[619].
7) After setting all data, then click “WRITE”.
Setting of distance data must be in ascending order, that is, from shortest to longest distance. Noise table error and noise table malfunction will occur if settings are mis-ordered. Error status will appear under [7-3]
Example of a noise table is shown above. All noise lower than the noise threshold line will be ignored.
1
2 3
4 5
6 7
8[600]
[601][602]
[603][604]
[605][606]
[607]
[610]
[611][612]
[613][614]
[615][616]
[6167
Signal Amplitude
Distance
Noise TableSurface Echo
5- 3

[ One point advice regarding noise table input procedure ] It is necessary to provide some allowance around the echo peak and a margin of threshold for noise amplitude. These are +-0.3m and +5dB respectively. Noise Table point “n” must also be nearer than next Noise Table point “n+1”. If this rule is not maintained, noise table errors will occur and this function will become invalid.
Also by using the PC configuration software, you can add or change the position of the noise table with a right click.
1) On the “Tank Spectrum” tab, when the “START” button is clicked, you may view the
red line wave form data from the main unit as shown below.
2) If you would like to set the noise table manually, right click and select “ADD” at designated points for the new table. Also the table (points) can be moved by a left-click and dragging.
3) After the noise table is set, click the “Noise Write” button to complete.
5 dB
- 0.3m +0.3m
SignalAm
plitude
Distance
Peak Point
Peak Position
Right Click Option
5- 4

5.4 Volume calculation There are 4 types of volume calculations which are set up by the Linearization Selection parameter.
(1) Defined tanks
- Linear Tank (Vertical Cylinder Tank) Volume is calculated from diameter, offset level and measured level. Diameter is the diameter of the tank and offset level is the measurement level compensation factor.
- Spherical Tank Volume is calculated from diameter, offset level and measured level. Diameter is the diameter of the sphere and offset level is the measurement level compensation factor.
- Cylindrical Tank (Horizontal Cylinder Tank)
Volume is calculated from diameter, length, offset level and measured level. Diameter is the diameter of the tank and offset level is the measurement level compensation factor. Length is the horizontal length of tank as shown.
[ How to set parameters ] 1. Select tank form at [3-1] “Linearization Selection” from above selectable tank figures. 2. Input following parameters, then push”Write”.
[3-6] Tank “Diameter” [3-7] Tank ”Length” [3-8] Offset level [3-9] Volume unit
5- 5

(2) User defined tank - Tank Table
It is possible to set up 20 points each for level and volume respectively in the Tank Table which are linearly interpolated between points. More than two points must be input to set up the Tank Table. (Tank Table Error) Four volume units can be selected - cubic meter, gallons, barrels and cubic feet.
[ How to create the volume table ] 1) Select “User Tank Table” for menu tab [3-1]. 2) Set the required number of point settings for Menu tab [3-2]. (Max 20 points.) 3) Open Menu tab [3-3]. Select point and set level parameters into the data field in
accordance with the selected numbers. (e.g. when setting 20 points at [3-2], [300]~[319] can be set.)
4) Input Level data then, enter values for [300] ~ [319]. 5) After completing input of Level data, the next step is entering the Volume data.
6) Then Open Menu tab [3-3], and set the volume parameters into the data fields in
accordance with the selected numbers. (e.g. when setting 20 points” at [3-2], [320]~[329] can be set.)
7) Volume point must correlate to the level data defined under [3-2]. Select table address
( ex. [320]), enter volume data to complete entry. Similarly, enter data for [321]…[329].
8) After setting all data, then click “WRITE”.
Note
Setting of distance data must be in ascending order, that is, from shortest to longest distance. Volume table error and volume table malfunction will occur if settings are mis-ordered. Error status will appear under [7-3]
3
2
1
419
20
[300][301] [302] [303] [318] [319]
[320]
[321][322]
[ 323][338]
[339]
Volume table points
Level
Volume
Level table pointson [3-3]
Volume dataon [3-4]
5- 6

5.5 Analog value compensation (1) Analog check
Input designated value at [2-5] “Fixed Current Output”, then monitored on multi-meter like analog current meter.
(2) Analog calibration When analog output current is not correct, revise the value in the following manner. Input “4.000mA” under “Fixed Current Output” [2-5], then input the measured current value under “4mA Calibration” [4-1]. Input “20.000mA” under “Fixed Current Output” [2-5], then input the measured current value under “20mA Calibration” [4-2].
Input any values of current.
5- 7

5.6 Measuring value compensation Offset level from reference point and scale factor are adjusted under [4-3] “Offset Calibration” and [4-4] “Span Calibration”. If there is a difference between the Tank ref. point and the MRF-10 ref. point, you can input “G” for calibration [1-4].
5.7 Bottom recognition Tank bottom recognition is necessary for measurement of low reflection targets such as oil surfaces. In such cases, the smaller amplitude echo from liquid surface reflections is concealed in the larger echo from the tank bottom and the gauge can not distinguish the surface reflection echo from the bottom echo. [5-7] “Bottom Visible” and [4-5] “Zero cut” parameters of the gauge function to avoid the tracking of bottom echoes. Initial settings of these parameters are [5-7] “Bottom Visible” and [4-5] “Zero cut” as 0m. The gauge outputs level value as the bottom level, when the surface echo is in the low cut area. However when the level is higher and the surface echo is not in the low cut area, the gauge can distinguish surface echoes from bottom echoes. On the other hand, if bottom echoes cannot be discerned in high reflection targets such as water, the “Bottom Visible” parameter should be set at “Bottom Invisible” to eliminate any bottom echo from dead-band (Zero Cut).
5- 8

6 Technical Information 6.1 Main unit specification (1) Overview
Measuring principle Microwave Pulse Echo
Operating frequency 5.8 GHz
Half-power beam width Lengthwise : 50 deg
Crosswise : 23deg
Transmitting power less than 35 µV/m at 3m
Measuring range Max. 10 m (33’)
(2) Power Supply voltage 16..36 VDC
(3) Output Variable Ullage / Level / Volume / Current /
Signal amplitude/Volume Max Unit Level, Ullage : m/ft Volume : % Current : mA Amplitude : dB
Signal type Analog 4..20 mA, HART
Resolution • Analog: 4 µA • Digital: 1 mm (0.04")
Update time 1 s
Averaging time 1..120 s
Signal on alarm Hold/Low(3.9mA)/High(22 mA)
6-1

Load Minimum load is 250Ω for HART communication
(4) Accuracy
Measured error *) ±5 mm (0.2”) (0.1m up to 5m)
±10 mm (0.4”) (5m up to 10m)
Linearity *) less than ±10 mm (0.4”)
Repeatability *) ±1 mm (0.04”)
Ambient temperature effect ±0.01% / 10 K
*): Free-space reflection from flat metal surface, ambient temperature 25 °C (77 °F), atmospheric pressure.
6.2 Environment resistance
Ambient temperature -20..70 °C (-40..158 °F)
Storage temperature -40..80 °C (-40..176 °F)
Degree of protection IP68 (under water 10m / 24hours)
Vibration resistance IEC 68-2-6 /1G
Harmonized standard (Immunity) EN 61000-4-4
EN 61000-4-6
Lightening Arrester IEC 61000-4-5 (Level 4)
(Common mode 4kV / Normal mode 2kV)
Inpu
t V
oltag
e [
V]
16
21.5
36
0 250 900
Load[Ohm]
R0≦(Vin-16)/0.022
Not available
6-2

6.3 Construction (1) Cable Connection
Cable type Shielded twisted 3-cores Cross-section area of cable: 0.2..2.5 mm2, (AWG24..14)
Cable Length 10m
(2) Material and Mass
Transmitter Case Stainless steel Di-cast SCS-14
Antenna face panel For sewer: PVC
For open ditch: PC
Mass 2.7kg (except attached cable)
6-3

6.4 Dimension (mm)
4-M6 (depth: 5.5)
Grounding Terminal
Radiation face
6-4

(blank) 6- 5

Doc No. KF09-003B
Flat Radar Level Sensor Installation & Operation Manual 2009 April 1st Edition 2015 August 3rd Edition TOKYO KEIKI INC. Measurement Systems Company 2-16-46, Minami-Kamata, Ohta-ku, Tokyo 144-8551, Japan TEL: +81-3-3737-8621 FAX: +81-3-3737-8665 Web: http://www.tokyo-keiki.co.jp/
Copyright 2009 by TOKYO KEIKI INC. All rights reserved.
(Specifications are subject to change without notice.)