· member mr. sudhir mathur ceo, cairn oil & gas, ... member mr. nitin prasad country chair,...
TRANSCRIPT

1

2

3

4
Designation Name/OrganisationChairman Mr. Shashi Shanker
CMD, Oil and Natural Gas Corporation LimitedCo-Chairman Mr. Sanjiv Singh
Chairman, Indian Oil Corporation Limited Vice-Chairman Mr. P.M.S. Prasad
ED & Member of the Board, Reliance Industries LimitedMember Mr. B.C. Tripathi
CMD, GAIL (India) LimitedMember Mr. Utpal Bora
CMD, Oil India LimitedMember Mr. M.K. Surana
CMD, Hindustan Petroleum Corporation LimitedMember Mr. D. Rajkumar
CMD, Bharat Petroleum Corporation LimitedMember Mr. Sudhir Mathur
CEO, Cairn Oil & Gas, Vedanta LimitedMember Mr. A.N. Deshpande
Director (Tech) & CMD (Addl. Charge), Engineers India LimitedMember Mr. Prabh Das
MD & CEO, HPCL Mittal Energy LimitedMember Mr. Nitin Prasad
Country Chair, Shell Companies in IndiaMember Mr. Sashi Mukundan
Regional President and Head of Country, India, BP Group Member Mr. Prabhat Singh
Managing Director & CEO, Petronet LNG LimitedMember Mr. B. Anand
CEO, Essar Oil LimitedMember Prof. D.C. Panigrahi
Director, IIT (ISM), DhanbadMember Dr. Anjan Ray
Director, CSIR-Indian Institute of Petroleum, Dehradun
Governing Council

5
Member OrganizationsS No Organization Name Designation
1. Aban Offshore Ltd. Mr. Reji Abraham Managing Director2. Adani Gas Ltd. Mr. Rajeev Sharma CEO3. Adani Welspun Exploration Ltd. Mr. Arvind Hareendran CEO4. Axens India (P) Ltd. Mr. M. Suresh Managing Director 5. Baker Hughes, A GE Company Mr. Ashish Bhandari CEO (Oil & Gas) South Asia6. Bharat Heavy Electricals Ltd. Mr. Atul Sobti Chairman & Managing Director7. Bharat Oman Refineries Ltd. Mr. S.S. Sunderajan Managing Director8. Bharat Petroleum Corporation Ltd. Mr. D. Rajkumar Chairman & Managing Director9. BP Group Mr. Sashi Mukundan Regional President and Head of
Country, India10. Cairn Oil & Gas, Vedanta Limited Mr. Sudhir Mathur Chief Executive Officer11. Chandigarh University Mr. Satnam Singh
SandhuChancellor
12. Chemtrols Industries Pvt. Ltd. Mr. K. Nandakumar Chairman & Managing Director13. Chennai Petroleum Corp. Ltd. Mr. Gautam Roy Managing Director 14. Deepwater Drilling & Industries Ltd Mr. Naresh Kumar Chairman & Managing Director 15. Deloitte Touche Tohmatsu India LLP Mr. N. Venkatram Managing Partner & CEO16. Delonex Energy Advisors India Private
Ltd.Mr. Rahul Dhir Managing Director
17. DuPont India Private Ltd. Mr. Ram Mudholkar President South Asia18. Dynamic Drilling & Services Pvt. Ltd. Mr. S. M. Malhotra President19. East India Petroleum Pvt. Ltd. Managing Director 20. Engineers India Ltd. Mr. A.N. Deshpande Director (Tech) & CMD (Addl.
Charge)21. Ernst & Young LLP Mr. Rajiv Memani Country Manager & Partner22. Essar Oil Ltd. Mr. B. Anand CEO23. ExxonMobil Gas (India) Pvt. Ltd. Mr. Bill Davis CEO24. Fabtech Projects & Engineers Ltd. Mr. R. A. Rupnar Managing Director25. GAIL (India) Ltd. Mr. B.C. Tripathi Chairman & Managing Director26. GOL Offshore Ltd Mr. R.M. Choudhary President & COO27. GSPC LNG Ltd. Mr. G.R. Aloria Chairman & Managing Director28. Gujarat State Petroleum Corporation Ltd. Mr. T. Natarajan Joint Managing Director
29. Gulf Publishing Company Mr. John T. Royall President & CEO
30. Haldor Topsoe India Pvt. Ltd. Mr. Alok Verma Managing Director31. Hindustan Petroleum Corporation Ltd. Mr. M.K. Surana Chairman & Managing Director32. Honeywell Automation India Ltd. Mr. Vikas Chadha Managing Director33. HPCL Mittal Energy Ltd. Mr. Prabh Das MD & CEO34. IHS Markit Mr. James Burkhard Managing Director35. IMC Ltd. Mr. A. Mallesh Rao Managing Director

6
S No Organization Name Designation 36. Indian Oil Corporation Ltd. Mr. Sanjiv Singh Chairman37. Indraprastha Gas Ltd. Mr. E.S. Ranganathan Managing Director38. IOT Infrastructure & Energy Services Mr. Vivek
VenkatachalamManaging Director
39. Jagson International Ltd Mr. Pradeep Gupta Executive Director40. Jindal Drilling & Industries Pvt. Ltd. Mr. Raghav Jindal Managing Director41. Jubilant Oil & Gas Pvt. Ltd. Mr. Rakesh Jain Chief Executive Officer42. KBR India Private Ltd. Mr. Subas C. Das Managing Director – India
Operations43. KEI-RSOS Petroleum & Energy Pvt. Ltd. Mr.Lt. J.V.V.S Murthy Chief Executive Officer44. KPMG Mr. Arun M. Kumar Chairman & CEO45. Lanco Infratech Ltd. Mr. L. Madhusudhan Rao Executive Chairman46. LanzaTech Dr. Jennifer Holmgren Chief Executive Office47. Mangalore Refinery & Petrochemicals
Ltd. Mr. H. Kumar Managing Director
48. Mitsui Chemicals India Pvt. Ltd. Mr. Omura Toshihiro Managing Director49. NTPC Ltd Mr. Gurdeep Singh Chairman & Managing Director50. Numaligarh Refinery Ltd. Mr. S.K. Barua Director (F) & MD (I/c)51. Oil and Natural Gas Corporation Ltd. Mr. Shashi Shanker Chairman & Managing Director 52. Oil India Ltd. Mr. Utpal Bora Chairman & Managing Director53. Petronet LNG Ltd. Mr. Prabhat Singh Managing Director & CEO54. Praj Industries Ltd. Mr. Pramod Chaudhari Executive Chairman55. PricewaterhouseCoopers Pvt. Ltd. Mr. Shyamal Mukherjee Chairman56. Prize Petroleum Company Ltd. Mr. R.K. Mohal Chief Executive Officer57. Rajiv Gandhi Institute of Petroleum
TechnologyProf. P.K. Bhattacharya Director
58. Reliance Industries Ltd., Mr. Mukesh Ambani Chairman & Managing Director59. SAP India Private Ltd. Mr. Deb Deep Sengupta Managing Director60. SAS Institute (India) Pvt Ltd. Mr. Noshin Kagalwalla CEO & Managing Director-India61. Schlumberger Asia Services Ltd. Mr. Prachur Sah Managing Director62. Shell Companies in India Mr. Nitin Prasad Country Chair63. Shiv-Vani Oil & Gas Exploration
Services Ltd.Mr. Prem Singhee Chairman & Managing Director
64. South Asia Gas Enterprise Pvt. Ltd. Mr. Subodh Kumar Jain Director65. Sud-Chemie India Pvt. Ltd. Ms. Arshia A. Lalljee Managing Director66. Tata Petrodyne Ltd. Mr. S. V. Rao ED & CEO67. Tecnimont Pvt. Ltd. Mr. Mario Ruzza Chairman & Managing Director68. Total Oil India Pvt. Ltd. Mr. Dilip Vaswani Chairman & Managing Director69. University of Petroleum & Energy
StudiesDr. S.J. Chopra Chancellor
70. UOP India Pvt. Ltd. Mr. Steven Gimre Managing Director71. VCS Quality Services Private Ltd. Mr. Shaker Vayuvegula Director72. World LP Gas Association Mr. James Rockall CEO and Managing Director
7

8
9
Greetings from the Federation of Indian Petroleum Industry (FIPI)!
The World Economic Situation and Prospects 2018 report of the United Nations states that the Indian economy is projected to grow at 7.2 per cent in 2018-19 and 7.4 per cent in 2019-20. The report specifies that the outlook for India remains largely positive, underpinned by robust private consumption and public investment as well as on-going structural reforms. The confidence in the Indian economy has increased on account of policy measures taken up by the government. Recently, Moody’s rating agency upgraded India’s local and foreign currency issuer rating to Baa2 with a stable outlook from Baa3 on the expectation that continued progress in India’s economic reforms will enhance India’s growth potential over time. According to World Bank’s Ease of Doing Business 2018 Report, India’s ranking improved by 30 positions to 100th rank in 2018. As per the World Economic Forum, India’s rank in Global Competitiveness Index is 40 out of 137 countries in 2017-18, improvement over 71 out of 144 countries in 2014-15 and 55 out of 140 countries in 2015-16.
With crude surpassing $ 60 mark towards the end of year 2017, the steep rise in crude prices has sent alarm bells ringing for the country’s economy. With India importing crude oil to meet nearly 80% of the country’s oil demand, the unprecedented
dependence on oil imports and the resultant impact it can have on economic instability, we need to create an ecosystem for encouraging domestic production and cutting down dependence on imports with a sustained approach.
During the year 2017, the Ministry of Petroleum & Natural Gas has taken several policy initiatives which will bring in more investments and help increase the domestic oil & gas production. The new Hydrocarbon Exploration Licensing Policy (HELP) for award of Hydrocarbon Acreages in the Upstream Sector of India was formally launched on July 1, 2017. The year also witnessed the success of Discovered Small Fields Bid Round-I and launch of the National Data Repository (NDR) to make the entire E&P data available for commercial exploration, research and development and academic purposes.
To have a gas-based economy and enhance the share of gas in the energy basket to 15%, the Government has envisaged developing additional 15,000 km of gas pipeline network to improve connectivity in the Eastern part of the country. At present, 31 CGD companies are developing CGD networks in 81 GAs in 21 State(s)/UTs which are supplying clean cooking fuel in the form of PNG to about 40 Lakhs in the country. Further Govt. has envisaged expanding the coverage of CGD network across the country in synchronisation with the Gas availability and pipeline connectivity.
From the Desk of the
Director General
10
The country presently has an installed refining capacity of 230 MT which includes the Reliance export oriented refinery. Considering the current demand of nearly 190 MMT and the growth on account of positive economic outlook, India in the years to come will need more refining capacity in the form of green field projects or by expanding the existing capacity.
More than 3.2 crore new LPG connections have been given till the beginning of December, 2017 under the Pradhan Mantri Ujjwala Yojana (PMUY), which was launched with an aim to provide LPG connections to 5 crore women belonging to the Below Poverty Line(BPL) families, over a period of 3 years starting from Financial Year 2016-17. On the total LPG provision, during 2016-17, more than 3.31 crore new LPG connections have been released and during 2017-18 (up to 18.12.2017), more than 2.15 crore new LPG connections have been released. As on 1.11.2017, National LPG coverage has reached to 78.3% up from 60.6% as on 11.1.2015.
The OMCs are now supplying BS-IV auto fuels in the entire country from 01.04.2017. Further, Government has also decided to leapfrog from BS-IV to BS-VI directly and a notification has been issued for implementation of BS-VI w.e.f. 01.04.2020 in the entire country. However, considering the recent rise in environmental pollution in Delhi, the OMCs have agreed to supply BS-VI fuels from 01.04.2018 in Delhi.
India’s oil demand is expected to grow at a CAGR of 3.6 per cent to 458 Million Tonnes of Oil Equivalent (MTOE) by 2040, while demand for energy will be more than double by 2040 as economy will grow to nearly four times its current size. The gas production is likely to touch 90 Billion Cubic Metres (BCM) by 2040 while demand for natural gas will grow at a CAGR of 4.6 per cent to touch 149 MTOE.
In view of the above growth projections coupled with the policy initiatives of the Government, India will see significant investments and hectic activities in the entire oil & gas sector in the coming years. According to an estimate, a cumulative investment of $ 40 billion is expected in the E&P sector alone during the next 4-5 years.
During the year 2017, India’s three public sector oil companies, namely Indian Oil Corp. Ltd, Bharat Petroleum Corp. Ltd and Hindustan
Petroleum Corp. Ltd signed an agreement to build one of the world’s largest integrated refinery-cum-petrochemicals complexes in Ratnagiri district of Maharashtra. The 60 million metric tonnes per annum (MMTPA) west coast refinery-cum-petrochemicals complex will be built at an estimated cost of $40 billion, and is expected to be commissioned by the year 2022.
There has been lot of discussions around the electric vehicles during the year 2017, but the World Energy Outlook estimates that in spite of the push by several governments, the global share of electric vehicles in the overall vehicle population shall be only 13% in 2040. The countries wherever the electric vehicles have seen more sales have offered significant incentives to buyers. In India, the issues related to the cost of battery vehicles and dependence on lithium with major reserves in few countries like Chile and China need to be considered for planning large scale switchover to Electric Vehicles. Further the tax revenues of the Govt. from petroleum products vis-a-vis need of fiscal incentives for promoting battery vehicles, the present investments being made for BS-VI fuels & engine technology, and employment in the related industries producing internal combustion engines are likely to influence the future policies and the pace of shift towards electric vehicles.
During the year 2017, the Government decided to sell its stake of 51% in HPCL to ONGC with a view to create a vertically integrated public sector oil major company having presence across the entire value chain. In the coming year we may see further decisions regarding merger and restructuring of some other entities as well.
While the year 2017 saw the biggest tax reforms in India in the form of Goods & Services Tax (GST) but the exclusion of crude oil, natural gas, petrol, diesel and ATF did not augur well for the oil & gas industry. Oil producers, refiners and marketers are set to take a hit of over Rs. 22,000 crore a year because of the exclusion of the five petroleum products.
The Hon’ble Minister for Petroleum & Natural Gas has been supporting the cause of oil & gas industry and pushing for inclusion of petroleum products under GST. FIPI has also been continuously taking up the issue with the concerned authorities. Recently we

11
• A progressive and credible energy advisory body stimulating growth of Indian hydrocarbon sector with global linkages.
• A healthy and strong interface with Government, legislative agencies and regulatory bodies.
• Create value for stakeholders in all our actions.
• Enablers of collaborative research and technology adoption in the domain of energy and environment.
• A vibrant, adaptive and trustworthy team of professionals with domain expertise.
• A financially self-sustaining, not-for-profit organization.
For more details, kindly visit our website: www.fipi.org.in
Follow us on:
have seen some respite for the stakeholders in the form of reduction in rates for transport of natural gas through pipelines, offshore work contracts and bunker fuel as well as exemption from IGST on import of leased oil rigs and ancillary goods. While these
are only interim benefits which we could secure from the Government for the industry, we will continue our efforts for inclusion of petroleum products under GST and hope that this may happen in the year 2018.
My team FIPI joins me in wishing you and your families a very happy New Year 2018.
Dr. R. K. MalhotraDirector General
Core Purpose Statement
Federation of Indian Petroleum Industry
Shared Vision
To be the credible voice of Indian hydrocarbon industry enabling its sustained growth and global competitiveness.

12
AbstractThere is a strong perception amongst the public at large that oil prices drive inflation. Pressure has been building on international crude oil prices, which crossed the $65/barrel mark in December 2017 for the first time after 2015. In India, inflationary pressures too have been edging up, with WPI inflation rising to an 8 month high of 3.9% and CPI inflation soaring to a 16 month high of 4.9% in November 2017. This article estimates the direct impact oil prices have made on inflation in India and also explores the indirect channels through which oil prices impact inflation in India.
Introduction:International oil prices are on the rise, in December 2017, Brent crossed the $65/barrel mark first time after 2015. Implementation and extension up to 2018 of OPEC and Non-OPEC production cuts and resurgence in global oil demand are pulling oil prices up. On the domestic front, inflationary pressures are slowly building up in India and RBI in its recent Monetary Policy Statements has been watchful regarding the escalation in inflation. Given this backdrop, this article puts forth a discussion on how crude oil prices influence inflation in India. The direct impact of oil prices on inflation in the last couple of years in calculated and the channels of indirect impact are explored.
There is a strong perception that oil prices drive inflation. The high inflation rates of the 1970s, driven by the oil price shocks (1973 & 1979) are probably the basis of this perception. Besides,
International Crude Oil Prices & Their Impact on Inflation in India
given the fact that oil does have strong forward linkages with various sectors of the economy such as transportation (especially road and aviation), cooking, industry, and agriculture (pump sets and tractors) there is a factual basis to this perception. In India as well, there is a strong perception that high oil prices can dent the budgets of the common man.
Oil contributes about 30% of the Indian energy basket and is the second most important energy source after coal. India is heavily dependent on imported oil, with annual imports of over 4mbpd. On consumption basis, India imports over 80% of its consumption requirement. Pricing of domestic crude oil production is linked to international prices and prices of petroleum products too are linked to international product prices which are known to be closely correlated with international crude oil prices. Currently, pricing of petroleum products involves three stages:
- Refinery Transfer Price (RTP) - Price at which refineries sells their product to marketing companies. Presently, import parity principle / trade parity principle (with 80% import parity and 20% export parity) is being followed.
- Ex-storage Point price (ESPP) - Marketing cost and margin elements are added to RTP to arrive at ESPP
- Retail Selling Price (RSP) - Price at which product is sold to the consumer. Elements like Excise Duty, Dealer commission, Delivery Charges, VAT, GST are added to ESPP to arrive at RSP.
Dr. S.K. DamCGM (CP&ES and HR)
Indian Oil Corporation Ltd.
Jessica SinghManager (Corpotate Planning & Economic Studies)
Indian Oil Corporation Ltd.
Finance

13
While the prices of many bulk and industrial fuels have been under the free market in the reform era, prices of four sensitive products, petrol(MS), diesel (HSD), LPG(Domestic) and SKO(PDS) had continued to be under price control. The process of freeing prices of these began in 2010, when petrol prices were deregulated, this was followed by prices of diesel in bulk sales in 2013 and full deregulation of diesel prices took place in 2014. In case of LPG (Domestic) the Government in 2014 began cash transfers of subsidy in 2014, while price of SKO(PDS) continues to be subsidized. In 2016, the Government allowed oil marketing companies (OMCs) to gradually raise prices of LPG (Domestic) and SKO (PDS) to bring the prices closer to the free market levels.
The Two Measures of Inflation in India-WPI & CPIInflation is defined as an increase in the general price level. It is measured on percentage year on year basis, i.e. the percentage change in the general price level in a given period of the current year versus general price level in the same period last year. And, the means to
measure the general price level is a price index. A price index is a weighted average of the prices of a selected basket of goods and services relative to their prices in some base-year. Most commonly use index is the Laspeyer’s index , where pre-assigned weights based on quantities in the base year are used. The percentage change in the price index (as compared to the previous year), gives us the measure of inflation. At present, India has two main inflation measures, which are based on Wholesale Price Index (WPI) and the Consumer Price Index (CPI).
WPI is a measure of the movement of average wholesale prices in the economy. The universe of WPI, therefore, comprises all possible transactions at first point of bulk sale in the domestic market. The wholesale price does not include indirect taxes and inflation estimates are not influenced by fiscal policy changes. The latest WPI series uses year 2011-12 as the base year. Weights used are derived on the basis of the wholesale transactions of the commodities. WPI is used as a deflator of various nominal macroeconomic variables including Gross Domestic Product (GDP). The WPI based inflation estimates also serve as an
1It = ∑ (Iit × Wi ) / ∑Wi= ∑(Pit*Qi0)/ ∑(Pi0*Qi0)
It : Value of the composite price index at time t, Iit: The index of prices of the ith commodity at time t
Wi: The weight of the ith commodity in the index
Iit=Pit/Pi0, & Wi= Pi0*Qio, where Pin is the price of the ith commodity at time n & Qin is the quantity of the ith commodity at time n
here n=0 is the base year

14
important determinant, in formulation of trade, fiscal and other economic policies by the Government. Besides, WPI is used as an indexing tool in price adjustment clauses in the supply of raw materials, machinery and construction work.
CPI measures the changes over time in general level of retail prices of selected goods and services that households purchase for the purpose of consumption. Such changes affect the real purchasing power of consumers’ income and their welfare. It is also therefore called the cost of living index. The CPI measures price changes by comparing, through time, the cost of a fixed basket of commodities. The latest
2 The Reserve Bank of India and Government of India signed a Monetary Policy Framework Agreement on 20th February 2015. As per terms of the agreement, the objective of monetary policy framework would be primarily to maintain price stability, while keeping in mind the objective of growth. The monetary policy framework would be operated by the RBI. RBI would aim to contain consumer price inflation within 6 percent by January 2016 and within 4 percent with a band of (+/-) 2 percent for all subsequent years.
CPI series has 2012 as the base year. The weights are assigned on the basis of average monthly consumer expenditure of households obtained from Consumer Expenditure Survey 2011-12. Over the years, CPIs have been widely used as a macroeconomic indicator of inflation, and also as a tool by Government and Central Bank for targeting inflation and monitoring price stability2 . In India, Reserve Bank of India (RBI) uses CPI inflation as its inflation target for monetary policy, presently RBI is targeting CPI inflation of 4 per cent within a band of +/- 2 per cent. In addition, there are other CPI measures such as CPI for Industrial Workers, Agricultural Labourers, CPI Urban & CPI Rural.

15
WPI Inflation and Oil PricesAn examination of the relationship between the overall WPI Inflation and year on year percentage growth in international crude oil prices3 shows visibly high co-movement between the two series and a high positive correlation 4 of 0.8 between the two. Further, the basis of the relation is explored by looking in to components of
WPI, out of the total weight of 100 of WPI, Mineral Oils/Petroleum Products5 have a combined weight of 7.95, details provided in Table 1, in addition, crude oil too has a weight of 1.94 in the index. Additionally, natural
Table 1: Weights of Oil Related Items in WPI Base 2011-12
Group/Commodity Weight in WPI
Crude Petroleum 1.94
Mineral Oils 7.95
of which
Naphtha 0.87
Petrol 1.60
Petroleum Coke 0.05
Lube Oils 0.29
LPG 0.64
Kerosene 0.19
HSD 3.10
Furnace Oil 0.67
Bitumen 0.23
ATF 0.32
Combined weight of commodities directly related to crude oil prices 9.90
Source: Office of Economic Adviser, Ministry of Commerce & Industry, Government of India
16
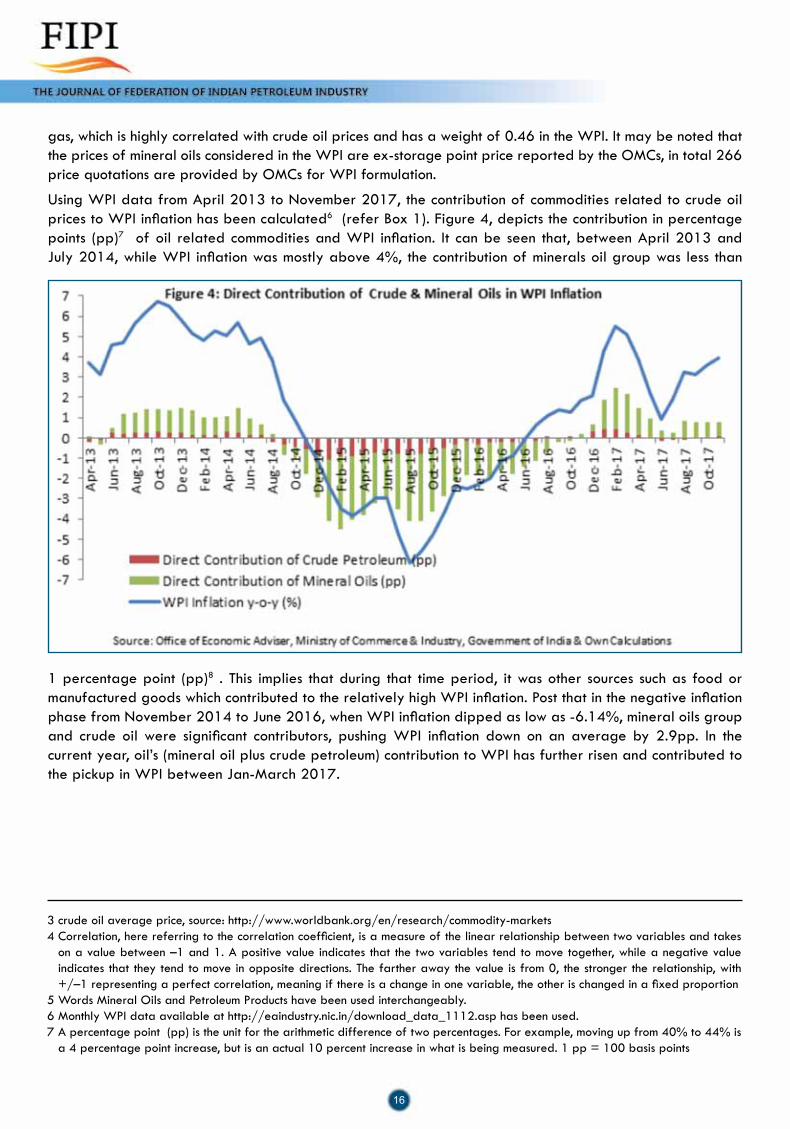
gas, which is highly correlated with crude oil prices and has a weight of 0.46 in the WPI. It may be noted that the prices of mineral oils considered in the WPI are ex-storage point price reported by the OMCs, in total 266 price quotations are provided by OMCs for WPI formulation.
Using WPI data from April 2013 to November 2017, the contribution of commodities related to crude oil prices to WPI inflation has been calculated6 (refer Box 1). Figure 4, depicts the contribution in percentage points (pp)7 of oil related commodities and WPI inflation. It can be seen that, between April 2013 and July 2014, while WPI inflation was mostly above 4%, the contribution of minerals oil group was less than
1 percentage point (pp)8 . This implies that during that time period, it was other sources such as food or manufactured goods which contributed to the relatively high WPI inflation. Post that in the negative inflation phase from November 2014 to June 2016, when WPI inflation dipped as low as -6.14%, mineral oils group and crude oil were significant contributors, pushing WPI inflation down on an average by 2.9pp. In the current year, oil’s (mineral oil plus crude petroleum) contribution to WPI has further risen and contributed to the pickup in WPI between Jan-March 2017.
3 crude oil average price, source: http://www.worldbank.org/en/research/commodity-markets4 Correlation, here referring to the correlation coefficient, is a measure of the linear relationship between two variables and takes
on a value between –1 and 1. A positive value indicates that the two variables tend to move together, while a negative value indicates that they tend to move in opposite directions. The farther away the value is from 0, the stronger the relationship, with +/–1 representing a perfect correlation, meaning if there is a change in one variable, the other is changed in a fixed proportion
5 Words Mineral Oils and Petroleum Products have been used interchangeably. 6 Monthly WPI data available at http://eaindustry.nic.in/download_data_1112.asp has been used.7 A percentage point (pp) is the unit for the arithmetic difference of two percentages. For example, moving up from 40% to 44% is
a 4 percentage point increase, but is an actual 10 percent increase in what is being measured. 1 pp = 100 basis points

17
Further, looking in to the components of CPI, out of the total weight of 100 of CPI, petroleum products have a combined weight of 4.22. The highest weight is of petrol used for running passenger vehicles, followed by LPG. Using the CPI data from January 2011 to November 2017, direct contribution of oil related items to overall CPI inflation since January 201211 has been calculated, as presented in Figure 6. It can be seen that, direct contribution10 of oil related items to CPI has been small, going maximum up to 0.64 pp and an average of 0.13 pp, average CPI inflation during the period has been 6.5%. The observed lower contribution of oil related commodities to CPI inflation as compared to WPI inflation can accounted by -
CPI Inflation and Oil PricesAn examination of the relationship between the overall CPI Inflation and year on year percentage growth in international crude oil prices9 shows a very low positive correlation of 0.07, and in fact, there have been instances when the two have moved in opposite directions as can seen from Figure 5.
Table 2: Weights of Mineral Oils in CPI (Base 2012)Item Weight in CPI
Petrol 2.19
LPG 1.29
Lubricants 0.05
Diesel for conveyance 0.15
Diesel for other uses 0.002
Kerosene PDS 0.342
Kerosene open market 0.207
Combined weight of petroleum fuels 4.22
Source: Ministry of Statistics & Programme Implementation, Government of India
9 crude oil average price, source: http://www.worldbank.org/en/research/commodity-markets10 Refer Box 111 Data available at RBI’s Database on Indian Economy (https://dbie.rbi.org.in/DBIE/dbie.rbi?site=home) & MoSPI’s CPI Warehouse
(http://164.100.34.62:8080/cpiindex/Default1.aspx) has been used. Monthly commodity wise CPI data from January 2011 onwards to December 2014 is available for the old series base 2010 and data from January 2014 onwards to September 2017 is available for the new series base 2012. As a first step linking factors between the two series were developed in line with MoSPI’s guidelines and after that a consolidated series from January 2011 onwards was built with base 2012.

18
12 Of the petroleum fuels entering the CPI, petrol was decontrolled in 2010 and diesel at retail level was decontrolled only towards the end of 2014, lubes have been a free market product and prices of LPG domestic and Kerosene continue to be controlled, with monthly increments allowed since last year.
• Firstly, the weight of petroleum fuels in the CPI is small at 4.22% as compared to an almost 10% weight in WPI.
• Further, it may also be noted that in contrast to WPI, which takes pre tax prices, in case of CPI final retail level prices inclusive of taxes and subsidies are taken. So, potentially a wedge gets created between the international crude oil prices and prices going into CPI calculations. During the period under consideration there was a shift towards market based pricing12 and thereby reduction in the impact of subsidies. However,
at present, the indirect taxation rate (excise duty plus VAT) on petrol and diesel is over 100% and over 75%, respectively.
• During July 2014 and September 2016, when international oil price inflation was in the negative territory (refer Graph 5) and had averaged at -33%, the contribution of mineral oils to lowering of inflation was only 0.12 pp, CPI inflation during this period had averaged at 5.2%. The lowering of international oil prices had provided the Government legroom to go for tax hikes, which otherwise in a high oil price scenario would have been difficult. For instance, between July 2014 and March 2016, there was a 65% decline international crude oil prices, while retail prices of petrol in Delhi declined by only 23% as excise duty on petrol rose from Rs. 5.46/litre on 1st March 2015 to 9.48/litre on 1st March 2016.
• In June 2017, dynamic pricing was adopted, wherein there are daily revisions in the retail prices of petrol and diesel in line with changes in the international oil prices. During this phase, which also coincides with a phase of rising international crude oil prices (year-on-year inflation in oil prices has averaged at 12.9%), contribution of petroleum fuels the CPI inflation has risen to an average of 0.32 pp (Jun-Nov 2017).

19
Box 1Formula of a WPII = ∑ (Ii × Wi ) / ∑Wi (a)I : The composite price index (WPI/CPI)Ii: The index of prices of the ith commodity Wi: The weight if the ith commodity in the indexInflation MeasurementInflation in month a of year y =(( Iay- Ia(y-1))/ Ia(y-1))*100 (b)Contribution of ith commodity group to inflation Using equations (a) & (b) inflation in month a of year y can be represented as =∑ Wi (Iiay- Iia(y-1))/ Ia(y-1)And, from this follows the formula of contribution of ith commodity group to inflation in month a of year y = Wi (Iiay- Iia(y-1))/ Ia(y-1)
Oil Prices and Their Indirect Influence on CPI & WPI Inflation
Derived Demand RouteBeyond the direct impact, since the demand for oil is essentially a “derived demand”, its impact also plays out through the prices of products where it goes as an input.
• Industry: Plastics and other petrochemicals have oil or natural gas as a feedstock, similarly for fertilizers. Petroleum products account for about 18% of the energy mix of the industry sector in India. Further, business firms often employ price adjustment (escalation) clauses in long-term sales and purchase contracts. WPI is commonly used for the purpose of escalation clauses in the supply of raw materials, machinery and construction work. This potentially builds a connection between movements in WPI of petroleum products and prices of the final products, in case the producers pass on the increase in input costs to the final product’s price.
• Agriculture: Over 10% of the total diesel consumption in the country is accounted for by agriculture, where it is used for running irrigation pump-sets and tractors.
• Transportation: In India, around 95% of the energy requirements of the transportation sector are met through petroleum products .
Looking at freight transportation, over 2/3rds of freight transportation in the country takes place through roads (basically through trucks running on diesel), where fuel costs account for more than 50%
of the operational costs of the truck operators . So, this establishes a link between petroleum product prices and the prices of most of the goods and services in the CPI & WPI baskets- higher fuel costs passed on as higher transportation costs, which in turn are passed on through higher prices of the products are services. However, some studies show that in India the pass-through of higher fuel costs is not always easy for transporters. Fierce competition and fragmentation in the market makes the truck operators price takers and freight rates are mostly decided by brokers, who balance the supply and demand for trucking. Hence, fuel cost increases often do not reflected in the freight rates.
As regards passenger transportation, here again there is dominance of the road in the modal mix, with 90% share. There is high reliance on private transportation in the road As regards passenger transportation, here again there is dominance of the road in the modal mix, with 90% share. There is high reliance on private transportation in the road segment of passenger transportation, which is directly affected by the prices of petrol and diesel and is captured directly in the CPI. Further, in CPI transport services find representation, with a combined weight of 2.45 (details in Table 4). The overall the direct contribution of the travel services to CPI inflation has had an average of 0.16 pp, with max a of 0.32 pp (January 2012 to November 2017).Looking at the components of the transport services, as regards Rail, passenger rail fares are known to be sticky in India and besides, in addition to diesel, electricity is also a major source of meeting energy requirements

20
Table 3: Weights of Transport Services (Motorized) in CPI (2012)
Other conveyance expenses 0.0098
Railway fare 0.18495
Bus/tram fare 1.36717
Taxi, auto-rickshaw fare 0.56825
School bus, van, etc. 0.24583
Air fare (normal): economy class(adult) 0.07722
Steamer, boat fare 0.00043
Total 2.4537
Source: Ministry of Statistics & Programme Implementation, Government of India
in the Indian Railways. Buses play a major role in public transportation by road, and have the highest weight amongst the transportation services. State Transport Undertakings (STUs)’ fare setting is guided by public service objectives and STUs avoid frequent hikes in fares , while decreases in diesel prices are frequently passed down. This is corroborated by the weak correlation of 0.096 found between CPI of Bus/Tram fare
inflation and WPI of diesel inflation between April 2013 & November 2017. A component of travel services that is highly correlated with oil prices is Air Fare, during the period April 2013 to November 2017, a high correlation of 0.86 was found between WPI Inflation of ATF and CPI Inflation of Air Fare. However, the share of air fare in CPI basket is very low at 0.077 only.
Dearness Allowance RouteCPI for Industrial Workers (IW) is used for wage indexation and fixation of dearness allowance (DA) for government employees. Petroleum products have a weight of 4.0 in the CPI IW (1.09 for Kerosene, 1.73 for LPG and 1.18 for petrol). Direct increases in CP (IW) on account of increases in prices of mineral oils and indirect increases (through the channels discussed) get passed on to the salaries of Government employees. Wage increases on account of increases in DA turn can lead to cost push increases in WPI and CPI.
Inflation Expectations RouteIn the beginning of the article, it was mentioned that there exists a strong perception amongst the public at large that oil prices affect inflation. And, in fact, it is this very perception, which is another source of bringing out the impact of oil prices on
inflation. Expectations are beliefs about the future or how we perceive the future. Inflation expectations can be understood as economic agents’ belief or views or perceptions about inflation in the future. Inflation expectations play a very important role in determining inflation; let us see how this happens-
• If inflation is expected to be persistently high, workers bargain for higher wages to protect their purchasing power. Higher wages increase firms’ costs and they may in turn increase prices to maintain their profits.
• If firms are expecting inflation to be higher in the future, they might increase prices to protect their profit margins.
Therefore, the rate of inflation that economic agents -workers, businesses and investors think will prevail in the future, i.e. their inflation expectation influences their decision-making and this in turn feeds in to

21
price formation in the future and inflation. In fact, taming or “anchoring” inflation expectations is one of the key objectives of Central Banks.
In India, RBI conducts surveys called the Inflation Expectations Survey of Households at regular intervals. On looking at one year ahead median inflation expectations data from these surveys we
find these to be highly correlated with international crude oil prices. The co-movement is distinctly visible and the correlation between the two is high at 0.848. Post the great collapse in international crude oil prices in 2014, inflation expectations nosedived from 16% in September 2014 to 8.9% in December 2014.
Conclusion • With a weight of almost 10% in the WPI
weighing scheme, changes in international oil prices are bound to have an in impact on WPI, holding other things constant. Besides, since the prices taken in WPI exclude subsidies and taxes, the wedge between the domestic and international prices that fiscal instruments can create is not applicable. Since refinery gate prices and pricing of domestically produced crude oil is linked to international crude oil prices (either import parity pricing or trade parity pricing), the observed high correlation between (WPI inflation and inflation in international oil prices) and high contributions to WPI at different points of time are understandable.
• Direct impact of oil prices on CPI inflation has been limited, which can be attributed to the lower weights and also to the wedge created by taxes and subsidies.
• Further, there are a number of complex indirect channels arising from the derived demand nature of oil products that can impact inflation. The impact however, is at times might get limited to sector specific issues, regulations, demand and supply forces, and the overall weight of the affected commodity/service in WPI and CPI.
• Another very import indirect channel through which oil prices seem to influence inflation is that of public perception or inflation expectations. A very high correlation of inflation expectation of Indian household and international crude oil prices points towards that.
• With international oil prices edging up steadily inflation pressures could build up in the economy. RBI in its recent Monetary Policy Statements has marked the recent rise in international crude oil prices on account of the OPEC’s decision to maintain production cuts through 2018 as a key risk to inflation.

22
One of the important challenges at the hands of RBI would be that of taming the inflation expectations of households, which are very responsive to crude oil prices at present.
References:
• Manual on Wholesale Price Index (Base: 2011-12 = 100), Office of the Economic Adviser, Department of Industrial Policy & Promotion, Ministry of Commerce & Industry, Government of India
• Consumer Price Index- Changes in the Revised Series (Base Year 2012 = 100), Ministry of Statistics & Programme Implementation, Central Statistics Office, Government of India, 2015
• Technical Report of the Working Group for Revision of Index Numbers of Wholesale Prices in India from the Base Year 2004-05 to 2009-10/2011-12, Office of the Economic Adviser, Department of Industrial Policy & Promotion, Ministry of Commerce & Industry, Government of India, 2014
• Consumer Price Index for Industrial Workers (2001=100), Annual Report, Ministry of Labour & Employment, Labour Bureau, Government of India, 2016
• Fifth Bi-monthly Monetary Policy Statement, 2017-18 Resolution of the Monetary Policy Committee (MPC) Reserve Bank of India, December 2017
• Fourth Bi-monthly Monetary Policy Statement, 2017-18 Resolution of the Monetary Policy
Committee (MPC) Reserve Bank of India, October 2017
• “The Impacts of Diesel Price Increases on India’s Trucking Industry”, Jyoti Parikh and Gayatri Khedkar, The International Institute for Sustainable Development, 2013
• Operational Efficiency of Freight Transportation by Road in India, Joint Study Report by TCI & IIM Calcutta, 2nd edition
• “The importance of inflation expectations”, Deepak Mohanty, BIS central bankers’ speeches, November 2012
• “Oil Prices and Inflation Expectations: Is There a Link?”, Alejandro Badel , Joseph McGillicuddy, Federal Reserve Bank of St. Lious, July 2015
• Bus Karo 2.0 Case Studies from India, World Resources Institute, http://wricitieshub.org/online-publications
• World Energy Outlook, 2017, International Energy Agency
Data Sources:
• Database on Indian Economy, RBI’s Data Warehouse
• Consumer Price Index Warehouse, Ministry of Statistics & Programme Implementation , Government of India
• Office of the Economic Adviser, Department of Industrial Policy & Promotion, Ministry of Commerce & Industry, Government of India
• World Bank Commodity Markets
• CEIC

23
The Government of India has undertaken series of revolutionary reforms to open up the
Exploration and Production (‘E & P’) sector for domestic and foreign investors. The main objective behind these policy reforms is augmentation of domestic production and ensure energy security of India. Several policy changes in this regard include Discovered Small Field Bid Round, National Data Repository and market based gas pricing and the Hydrocarbon Exploration & Licensing Policy (HELP) framework.
The market driven Open Acreage Licensing (OAL) programme was launched in July 2017. Through this programme, India opened up its 90% of total sedimentary basin area to Indian and global investors under the ambit of HELP. Blocks under
the HELP policy will be available for bid twice a year. This policy has received good response from investors, and thus it may be worthwhile to have a look at the tax incentives available under the Income-tax Act, 1961 (‘the Act’). Incentives available to the companies engaged in E & P of oil and gas and non-resident service providers to such companies are summarized hereunder.
Tax incentives to companies engaged in E & P of Oil and Gas1 In the E & P sector, it is a common practice that an
unincorporated consortium is formed by different companies for the purpose of bidding for the contract and operating oil and gas fields. Under normal provisions of the Act, such unincorporated
Neetu Vinayek Partner – B S R & Associates LLP
Hiten Sutar Associate Director - B S R & Associates LLP
Manmay Chandawalla Manager, B S R & Associates LLP
Hydrocarbon Exploration and Licensing Policy – Corporate Tax Incentives

24
consortium could be considered as an ‘Association Person’ (‘AOP’), a separate taxable entity, required to pay tax on the profits earned by such unincorporated consortium. The taxability of an AOP is a complex regime, which could result in loss of deductions in certain cases. However, in view of specific provisions under the Act for companies in E & P sector, such unincorporated consortium is not considered as an AOP and each member of unincorporated consortium is taxed on its share of profits. This clarification removes the complexity of taxation of members of unincorporated consortium and brings clarity on taxation system to the individual members.
2 The blocks awarded under HELP policy would have initial exploration period, followed by period of development and production of mineral oil. Under the Act, any expenditure incurred before commencement of production or capital expenditure or abortive expenditure, are generally considered non-deductible from the income earned by a company. However, for a company engaged in the business of E & P of mineral oil, the aforesaid expenditure is considered as deductible, if such company has entered into an agreement with the Central Government1 , which provides for 100% tax deduction of exploration and drilling expenditure.
The Model Revenue Sharing Contract (‘RSC’)2 for the new rounds of bidding under HELP policy provides for deduction of all expenditure incurred on exploration and drilling activities. Accordingly, the companies, which would be awarded fields under HELP policy could claim 100% deduction for exploration and drilling expenditure from its taxable income on entering into RSC with the Central Government3 .
3 Depreciation on capital expenditure4 , on the acquisition of assets is allowed to the E & P companies as per the rates prescribed under the Act. Plant and Machinery are generally depreciated at the rate of 15% of the acquisition cost, if they are used for more than 180 days. If the Plant and Machinery are acquired / used for less than 180 days, depreciation is available at 7.5% of the acquisition cost.
4 Apart from the normal depreciation mentioned in Sr. No. 3 above, additional depreciation at the rate of 20% of actual cost is available in
respect of any new machinery and plant5 , which has been acquired and installed by a taxpayer and used for more than 180 days. The additional depreciation at the rate of 10% of acquisition cost is available on the plant and machinery which are used for less than 180 days in a financial year. However, balance 10% additional depreciation on these assets is available as deduction in the subsequent financial year.
In addition to the above, in case investment is made in blocks located in notified backward areas in the state of West Bengal, Andhra Pradesh, Bihar and Telangana, additional depreciation at the rate of 15%6 over and above aforesaid additional depreciation of 20% of actual cost would be available to such taxpayers.
It is interesting to note that aforesaid benefit of additional depreciation is available only to the companies engaged in the manufacture or production of an article of thing or the companies engaged in the business of generation, transmission or distribution of power. Based on the facts, it would be required to analysed as to whether E & P companies can be considered to be engaged in the business of manufacture or production of an article or thing.
5 Where companies7 make investment, by way of acquisition of new plant and machinery in blocks located in notified backward areas in the state of West Bengal, Andhra Pradesh, Bihar and Telangana, the said company may further be eligible to claim additional investment allowance of 15% of the acquisition8 cost of the new plant and machinery. This deduction shall be over and above the additional depreciation allowance of 35% available for new plant and machinery deployed in the aforesaid states.
6 To incentivize research and development in the Indian companies, specific provisions were introduced in the Act to provide deduction equal to one and half times the expenditure on scientific research incurred by these companies. Such weighted deduction is available to the companies9 in respect of expenditure incurred on in-house research and development facility as approved by prescribed authority. Such companies need to register and seek approval from the Department of Scientific and Industrial Research (DSIR) and file annual statements

25
The information contained herein is of a general nature and is not intended to address the specific circumstances of any particular individual or entity. The views and opinions expressed herein are those of the author.
giving details of capital and revenue expenditure incurred, etc.
7 Additional deduction on account of contribution to Site Restoration Account is allowed to the companies operating in the E & P sector. Such deduction restricted to the lower amount of following
i) Actual contribution to specified bank account towards site restoration costs; or
ii) upto 20% of profits for the year earned by a taxpayer.
Tax incentives to Non-resident Service providers to the companies engaged in E & P of Oil and GasThe Act contains special tax provisions (i.e. presumptive taxation) for non-residents engaged in the business of providing services / facilities or supplying plant & machinery on hire for prospecting / extraction / production of mineral oils. Under the said provision, 10% of gross receipts of such non-residents are deemed to be income of such companies and tax is computed on the said deemed income. Non-residents opting for such deemed
income provisions are not required to maintain books of account in India. In case a non-resident does not want to offer its income on deemed income basis, and file tax return on net income basis (i.e. income less eligible expenses) then it may be required to maintain books of account and have them audited by an independent accountant before filing of tax return. Income of such companies can also be characterized in the nature of Royalty / Fees for Technical Services, in which case such non-residents may not be eligible to offer their income on deemed income basis. It is accordingly advisable to analyse the nature of income to ascertain taxability of income of such non-resident service provider.
Apart from the aforesaid fiscal incentives, HELP policy also allows incentives in the form of reduced royalties in case of offshore areas. Further, cess under Oil Industry (Development) Act, 1974 shall not be applicable on crude oil production from blocks offered under HELP Round. It is advisable for the bidders for the aforesaid round to consider and analyse aforesaid tax incentives and also understand provisions of Goods and Service Tax regime to ascertain the tax cost or the tax benefit available on the future investments under HELP policy.
1 The contracts with the Central Government are required to be tabled before each House of Parliament.
2 Source: http://182.19.5.116/oalp/tender - Website of Directorate General of Hydrocarbons
3 Which would be tabled before both House of Parliament4 other than those incurred in respect of exploration and
drilling operation
5 other than ships and aircraft, office appliances, computers, vehicles etc.
6 7.5% in case of assets used for less than 180 days7 Engaged in the business of manufacture or production of
an article or thing8 On or before 31 March 20209 Engaged in the business of manufacture or production of specified article or thing
26
Abstract
India is one of the major growing economies in the world. To sustain the growth rate of it’s gross domestic product (‘GDP’), India needs environmental friendly and economically viable energy supply - Natural Gas
being one such potential source of energy. With stagnant domestic gas production and limited future prospects, liquefied natural gas (‘LNG’) imports are required to bridge the demand – supply gap.
As such there is a requirement to commensurate LNG import infrastructure in the country. Accordingly, several LNG regasification terminals have been planned/ announced in India. While some terminals like Ennore of Indian Oil Corporation Limited (‘IndianOil’) are planned on “Merchant Model” wherein terminal operator sells Regasified LNG (RLNG) to the consumers, there are other terminals like Mundra Terminal which are likely to operate on “Tolling Model”, wherein the terminal operator is only a service provider. It is however easier to get project finance for projects under “Tolling Model” on the basis of firm “Use or Pay” capacity agreements with credit worthy shippers.
This paper examines some of the techno-commercial issues, which bear legal implications and may need to be suitably addressed in the contract documents to ensure proper working of the “Tolling Model”.
IntroductionNiti Aayog in its “Draft National Energy Policy (27.06.2017) has stated that :
“….The Government has already declared its intention of transitioning towards a gas economy.
Availability of domestic gas supplies, which is likely to grow only over medium term, cannot be the lone strategy. LNG and gas supplies via pipelines from West and Central Asia need to be assimilated in our energy system. With a view to promoting LNG uptake, the provisions of ‘open access’ and ‘regulated tariff’ in the PNGRB Act need to be extended to gas off-takers at the LNG terminals. The Government will issue necessary policy guidelines for the same. ….”
Based on Government’s emphasis to promote renewable energy, Niti Aayog has projected the following Gas Demand and supply scenarios:
Regasification Terminals on “Tolling Model” in India - Contractual Issues
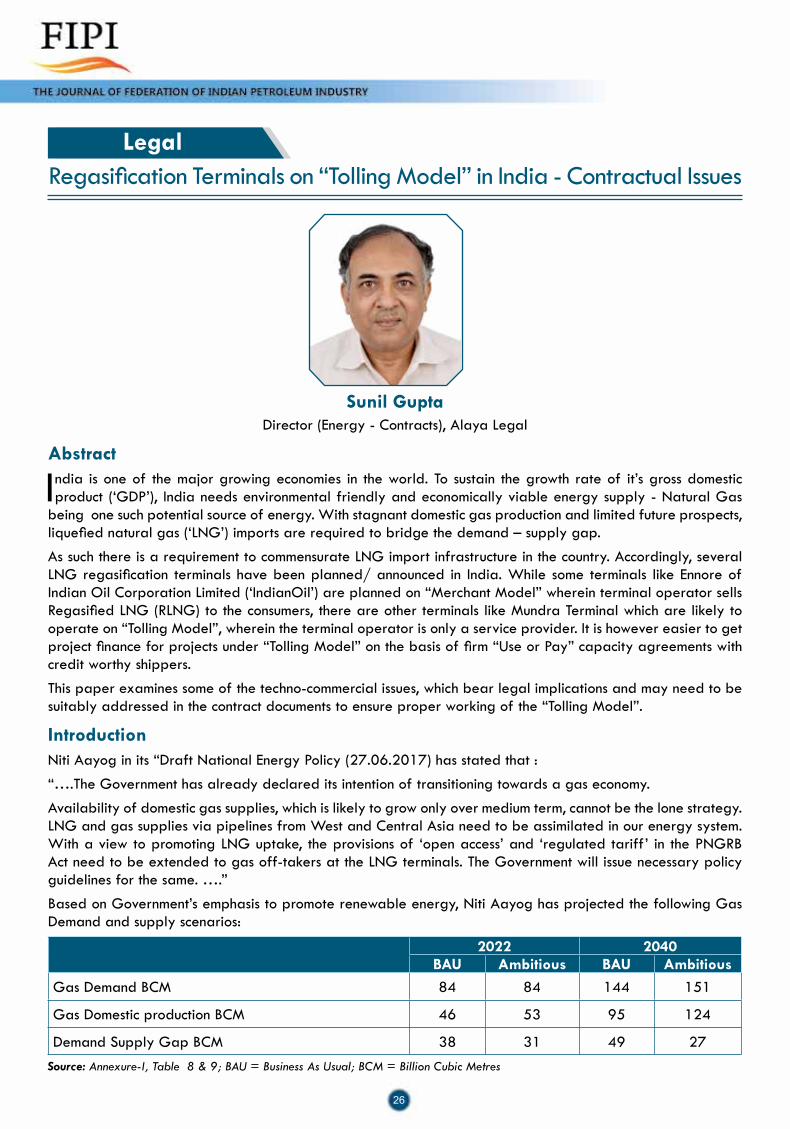
Sunil Gupta Director (Energy - Contracts), Alaya Legal
2022 2040BAU Ambitious BAU Ambitious
Gas Demand BCM 84 84 144 151
Gas Domestic production BCM 46 53 95 124
Demand Supply Gap BCM 38 31 49 27Source: Annexure-I, Table 8 & 9; BAU = Business As Usual; BCM = Billion Cubic Metres
Legal

27
Different models for regasification terminals
Merchant Model
Considering the high level of investment required in the value chain, long term tie-up for LNG production, transportation, regasification and end customer tie-up was considered necessary from the perspective of project financing. Most of the liquefaction terminals and regasification terminals came up on “Merchant Model”. Under this model, operator/ owner of the terminal was required to have a long term LNG tie-up with the supplier, required to arrange the transportation of LNG, undertake storage and regasification at facility owned by him and sell RLNG to end consumer. Petronet LNG Limited’s (PLL) terminal at Dahej came up with this model.
Considering the inherent risks involved, it was necessary to have financially strong counterparties in the arrangement.
Tolling Model
Over the years, the LNG trade has undergone a significant change. From being predominantly long term trade, LNG is being increasingly traded on medium term and spot basis. Unlike in the past where the LNG supplies were project linked, now suppliers are comfortable making portfolio sales.
This has led to development of regasification terminals on “Tolling Model”. Under this model, operator/ owner of the terminal is only a service provider and enables unloading of LNG, storage and regasification of LNG for a “Shipper”.
Since the risk to owner/ operator is reduced drastically, regasification terminals can be project financed on the financial strength of shipper(s) backed by firm capacity agreement on “Use or Pay” basis.
Hybrid Model
As the name suggests, the “Hybrid Model” is a combination of the “Merchant Model” and the “Tolling Model”. For example, PLL has entered
into long term capacity agreements for expanded capacity. Thus, it has 8.5 MMTPA of RLNG sales contracts on long term basis and balance 6.5 MMTPA capacity offered to shippers on long term basis mostly to its long term RLNG off-takers.
Contractual risks of regasification models
Each regasification model has its own contractual risk distribution matrix. However, there are some additional risks in the tolling model, which needs to be suitably addressed in capacity agreements. These issues are enumerated below:
Issues with tolling model
Continuity of supply for downstream customers:
One of the important requirements for a shipper would be continuity of RLNG supplies to meet the downstream contractual commitments. Shipper will have long term capacity tie-up with gas transporter and gas sales agreement with the end consumer.
Commercially, to achieve the above objective, the capacity agreement could be structured on following modalities:
a) RLNG offtake rate commensurate with time between two successive cargoes of the same shipper.
Under this arrangement, the shipper will always have LNG inventory in the terminal to meet the RLNG requirements till the next cargo is unloaded. The available storage capacity is dynamically allocated to various shippers to accommodate unloading of LNG cargoes.
This may however, reduce the terminal capacity utilization due to reduction in available LNG unloading slots at the terminal. The capacity risk therefore is taken by terminal operator, which is sought to be mitigated by ‘use or pay’ provisions.
b) Provide additional LNG storage
In this scenario, the terminal provides additional storage facility to the shipper to maintain own stock of LNG as per requirement. This increases the project cost due to additional
Substantial regasification capacity needs to be added to meet this demand and it is expected that the LNG regasification projects that have been planned/ announced will enable bridge the gap in the future. However, the access terms for regasification terminals vary based on the commercial model.

28
operator for other shippers’ defaults and have to directly settle commercial disputes with the defaulting shipper.
Going by the precedent of tolling agreements in US LNG projects, inter-user liability can be quite substantive.
From a shipper’s perspective, an inter-user agreement is best avoided. However, if it cannot be avoided, shipper should do due diligence on other shippers to ensure their financial ability to meet inter-user liabilities.
Inter-User AgreementThe issue of inter-user liabilities is a complex subject and it is difficult to capture all possible scenarios in the “inter – user agreement”. Some of the issues which need to be addressed are as follows:
a) Allocation of ship slots : terminal has a fixed number of unloading slots. At the time of finalising annual programme, multiple shipper(s) may prefer a particular slot. The rules for determining priority need to be specified.
b) Handling different ship sizes : Terminal operator generally fixes the minimum and maximum ship size which it will be able to unload for planning purposes. Procedure for handling higher ship size on request and rules for adjustments to offtake rates of other shippers to accommodate the ship need to be defined.
c) Bunching of ships for unloading : At times, several ships may arrive at the terminal. Some of the reasons for this could be,
(i) Late arrival of a particular ship;
(ii) Unavailability of unloading berth to the ship at scheduled time due to problem not attributable to shipper;
(iii) Early arrival of a ship.
Rules need to be defined for fixing priority of berthing in such cases.
d) Change of slots/ exchange of slots amongst users/ trading of slots/ allocation of additional slots: Rules need to be specified.
storage leading to additional charges or higher regasification tariff. This however provides the operational flexibility, both to the operator and the shipper.
c) Facilitate lending and borrowing of LNG
The operator facilitates lending and borrowing amongst the shippers to ensure continuous supplies of RLNG to all shippers. The borrowed quantity is returned when the cargo of the borrowing shipper unloads. This is the model most of the terminal owners prefer as they can achieve higher capacity tie-up.
This may however have legal and tax implications which may require policy intervention by the Government.
d) Minimum capacity threshold for a shipper
Under this commercial structure, the minimum capacity tie-up is based on RLNG offtake rate matching time period between unloading of two successive cargoes of the same shipper.
This limits the number of terminal users and contractually much less complicated than other options.
Other Shipper Performance RiskThere will be several shippers entering into capacity agreements with the terminal operator on bilateral basis. However, the performance of the terminal depends upon performance of all the shippers together. A default of one shipper may lead to chain of events which may affect the other shippers and the terminal owner.
Contractually, it is desirable that the operator should take the responsibility of settling inter-user commercial issues. This will ensure proper due-diligence by the operator of the potential shipper.
This is particularly desirable as the operator would be required to ensure the shippers have sound financials to fulfil obligations of inter-user liabilities, if the need arises. However, most of the operators would like to have limited role and liability and would not take open exposure of such commercial risks.
Certain terminals are now proposing “Inter-User Agreements” where the shippers indemnify the

29
e) Shipper defaults: Terminal performance is affected if one shipper defaults on its contractual obligations. While the consequences and settlement procedures between the defaulting shipper and operator are covered in the tolling agreement, the same between defaulting shipper and other shipper(s) need to be included in the agreement. The Rules should not only cover the default events directly attributable to a shipper but also the events which cannot be directly attributed to a single shipper.
Open access to regasification terminalsPetroleum and Natural Gas Regulatory Board (PNGRB) has been advocating open access to regasification terminals. A draft regulation for the same was also prepared. Subsequently Ministry of Petroleum and Natural Gas was also considering issuance of a notification for reserving part of the regasification capacity for 3rd party access. All
new regasification terminal projects are keeping 0.5 MMTPA for the purpose.
The issues highlighted above should be considered and incorporated in the regulation as and when a final decision in respect of open access to Regasification Terminals is taken.
ConclusionTo sustain the GDP growth, India will require eco-friendly fuels like natural gas. With stagnant domestic production, the demand - supply gap will have to be met through LNG imports, leading to the need for augmenting nation’s regasification capacity.
Initially, the Regasification Terminals in India came up on ”Merchant model”. However, due to ease of project financing and low risk to operators, some terminals are being put up on ”Tolling model”. This model is contractually much more complex than the “Merchant model”. However. the critical issues highlighted above need to be addressed in the agreement, in order to avoid operational hardship and disputes.

30
D Mohana Rao Rajesh M Badhe Alok Sharma
Abstract
Climate change due to increase in concentration of green house gases has become global
concern in recent years. Carbon dioxide is regarded as one of the major green house gases causing global warming. Carbon capture and sequestration (CCS) has been identified as potential solution to the mitigate global warming. But implementation of CCS is associated with substantial costs and energy penalty. To offset the cost associated with CCS, there is growing interest in developing commercially viable technologies which can use CO2 as feed stock and produce valuable products. This article reviews emerging CO2 utilization technologies highlighting current challenges and opportunities for commercial deployment of CCU technologies. Further, details of operating and planned demonstration or commercial CO2 utilization plants are also presented.
Keywords: carbon dioxide capture and utilization (CCU), enhance hydrocarbon recovery, energy products, mineral carbonates
IntroductionConcentration of greenhouse gases (GHGs) such as carbon dioxide (CO2), methane (CH4) and nitrous oxide (N2O) in earth’s atmosphere have increased drastically since pre-industrial era. Despite a growing
number of climate change mitigation policies, annual GHG emissions grew at an average rate of 2.2% per year from 2000 to 2010 compared to 1.3% per year from 1970 to 2000[1]. Although the radiative effect of CO2 is much less than the other GHGs, CO2 is emitted in large quantities into the atmosphere and has long atmospheric lifetime[2]. Out of 49 Gt-CO2 eq/yr GHG emissions in 2010, CO2 emissions alone account for 76% of total emissions. Globally, economic development and population growth are two most important drivers in increase of CO2 emissions from fossil fuel combustion[1].
Despite increasing emphasis on renewable energy, fossil fuels will remain the main source of energy for coming years and the CO2 emissions derived from these energy sources contribute significantly to global warming[3]. Coal fired power plants are one of the major CO2 emissions sources, which accounts for 33-40% of the total anthropogenic carbon emissions worldwide. Reduction of green house gas emissions that promote climate change is necessary globally[4]. There are several possible approaches to reduce anthropogenic CO2 emissions. Promising approaches are increase in energy efficiency, change of fossil fuels to non-carbon form of energy(e.g. renewable and nuclear) and implementing carbon capture and sequestration(CCS) technology[5].
Emerging carbon dioxide utilization technologies: Opportunities and Challenges
Indian Oil Corporation Ltd. R&D Centre Faridabad
Technology

31
CCS refers to technologies that focus on selective removal of CO2 from industrial gas streams, compression of it into supercritical state, transportation of it to storage site and sequestration in deep geological formations which includes depleted oil and gas reservoirs or oceans[3,6]. Implementation of CCS is necessary for successful transition to a low-carbon economy and achieve long term goal of limiting global warming below 20C which was agreed in U.N. Climate Change Conference, COP21 held in Paris. CCS technology is a well proven and reliable technology that has been in successful operation use for more than 40 years. At present, there are 22 large-scale CCS facilities in operation or under construction globally[7].
Even though, CSS is a well proven technology with significant potential to reduce CO2 emissions, large scale deployment of CCS is associated with substantial capital and operating costs. The high cost of CCS comes mainly from capture and compression which accounts for 75% of total CCS cost[3]. Further, CCS technologies require around 15-20% more energy depending on the type of technology used[8]. Hence, implementation of CCS requires more fuel than conventional plants without CCS. CCS implementation in existing power plants leads to increased energy prices and at the same time decrease in overall energy efficiency. Moreover, the long term effects of geological sequestered CO2 are another major concern with CCS.
Carbon capture and utilization(CCU) describes capture of CO2 from industrial emissions and utilization of captured CO2 to produce value
added products. In CCU, utilization of captured CO2 can result in generation of revenues that can contribute to offset the costs associated with carbon capture. Some of the application of CO2 are enhanced oil recovery(EOR), as a chemical feed stock for production of urea, energy products such as methanol and DME[9]. The objective of this paper is to review emerging CO2 utilization technologies while highlighting current challenges and future opportunities for commercial deployment of these technologies. Further, details of operating and planned commercial or demonstration CO2 utilization plants have also been presented.
Emerging CO2 utilization technologiesCO2 is considered to be waste product in the context of industrial flue gas. However, CO2 can be used as a renewable feedstock to produce variety of valuable products. CO2 utilization can contribute in the reduction of CO2 emissions in two ways : by sequestering CO2 in the production process and by substituting fossil fuels there by reduction of fossil fuel consumption[10]. CO2 is already being used in various industries such as soft drink, food, agro-chemistry, welding, foaming, fire-extinguishers, propellant, and as a fluid / solvent in various processes like drying-cleaning, separation, water treatment, packaging etc. Though such applications of CO2 utilization exist and feasible, their market scales are small and hence, generate small impact on the overall CO2 emissions. Figure 1 shows various emerging CO2 utilization technologies.
Fig.1 Emerging carbon dioxide utilization technologies

32
Enhanced hydrocarbon recoveryCaptured CO2 can be used to enhance oil recovery(EOR) from depleting oil reservoirs and enhance coalbed methane(ECBM) from deep unmineble coal seems by injecting CO2 into oil reservoirs or deeper coal bed seams. In case of CO2-EOR, injected CO2 mixes with oil and reduces oil viscosity, and CO2-oil mixture is brought to the surface, where the oil and CO2 are separated. Separated CO2 is reutilized back into the cycle to repeat the process. This process yields more barrels of oil per reservoir than the traditional oil recovery methods[11]. CO2-EOR is a matured and commercialized technology having well defined techno economic parameters and is in practise since several decades[12]. CO2 flooding is one of the most efficient and common methods used in EOR[3].
One of the major challenge faced by CO2-EOR is that due to heterogeneity of the rock formation between the wells, fluid properties and capillary pressure reduce effectiveness of CO2 flooding[3]. To assess economic viability of CO2-EOR, it is important to understand the relation between CO2 price and oil price. At oil prices of US$100 per bbl, for CO2-EOR to be economically viable, CO2 needs to be available at less than US$45 per tonne. At current oil prices in the range of US$40-60 per bbl and CO2 costs of US$60-60 per tonne, CO2-EOR looks to be less economically viable[12].
Injecting CO2 into unminable coal seems to enhance production of methane from coalbed methane (CBM) is referred to as CO2-ECBM. Injected CO2 preferentially gets adsorbed onto the coal, displacing and releasing adsorbed methane, which can be recovered at the surface. Pilot plant experience on ECBM indicates CO2 injection into coal beds can significantly improve methane recovery. Further, it shows that methane recovery can be improved from 77% (under traditional practices) to 95% (using CO2 injection) of original gas. Even though ECBM has been demonstrated at many locations, further research and demonstration is required before commercial deployment of this technology[17]. Key challenge in ECBM is decrease in permeability and injectivity of CO2 which is accompanied by CO2 induced swelling of the coal.
CO2 to energy products Conversion of CO2 to energy products can open up sustainable technologies that can supplement conventional fossil fuels. Methanol, dimethyl ether(DME), methane, syngas and algae biofuels are some of potential fuels that can be produced using captured CO2 as feedstock. Several pathways have been indentified for conversion CO2 to fuels. Since CO2 is thermodynamically stable molecule, conversion of it into fuel products requires substantial heat energy and catalyst inventory. Promising pathways identified for conversion of CO2 to fuels are hydrogenation, dry reforming and tri-reforming.
Hydrogenation of CO2 offers possibility of recycling CO2, storing H2, production of fuels and solving the issue of electrical energy storage[3]. To make the hydrogenation process carbon neutral, required hydrogen has to be produced from renewable energy sources such as solar, wind and geothermal. Dry reforming of methane is another potential method for conversion of CO2 to syngas that can be used to produce variety of liquid fuels using Fischer Tropsch process. In tri-reforming process, CO2, H2O and O2 present in flue gas reacts with methane in the presence of catalyst and produce syngas. Because of thermodynamic stability of CO2 molecule, high energy input, effective reaction conditions and active catalysts are essential for chemical conversion of CO2 to fuels.
Carbon Recycling International (CRI) jointly with HS Orka has set up renewable methanol plant in Iceland which produces 5 million litres of methanol per year by using CO2 and renewable hydrogen as feedstock[18]. Audi motor company set up e-gas plant in Germany which produces 1000 metric tons of e-gas (i.e. methane) per year using by chemically combining CO2 and renewable hydrogen[24].
CO2 use for microalgae growthBio-fixation of CO2 to microalgae has gained significant momentum because of its high photosynthetic rate. Micro algae can fix CO2 using solar energy with efficiency ten times greater than terrestrial plants. The direct use of CO2 to cultivate microalgae is interesting and extensively investigated because microalgae can not only consume CO2 but also be the feedstock to produce bio-fuel. Bubbling CO2 through microalgae cultivation systems can

33
greatly increase production yields of algae. Microalgae can be grown either in open ponds or closed systems (photo bioreactors). Microalgae use CO2 as their main building block and grow very fast with doubling their biomass volume in less than 24 h for most species. Microalgae cultivation show much potential in CO2 mitigation because 1.8 ton of CO2 can be fixed by cultivating 1 ton microalgae[8]. Microalgae systems can directly use CO2 present in flue gas without the need of CO2 capture. Major challenges in cultivating microalgae are largest requirement of inorganic nutrients source, intensive energy in cultivating, harvesting and drying of microalgae biomass, and improving the solubility of CO2 in water[25].
Alganol and reliance industries had set up microalgae demonstration plant at Jamnagar to convert 1 tonne of CO2 into 144 gallons of fuel while recycling CO2 from industrial processes and converting 85% of the used CO2 into ethanol, gasoline, diesel and jet fuels[26]. Indian Oil Corporation Limited (IOCL) and National Thermal Power Corporation (NTPC) have jointly set up a pilot plant in Faridabad for bio-fixation of CO2 present in power plant flue gas to microalgae[27].
CO2 to mineral carbonates CO2 mineralization is an alternative to conventional geological storage in which CO2 is reacted with metal cations such as magnesium and calcium to form mineral carbonates. The mineralization method can be considered as sequestration method, since it aims at permanently fixing CO2. Further, unlike CCS(geological storage) which suffers risk of leakage, mineral carbonates are stable and safe. CO2 mineralization does not require pure CO2. Further, flue gas from emission sources can be directly used in CO2 mineralization without removing SOx and NOx.
Mineralization is broadly classified into two categories: in situ and ex situ. In situ mineralization is a component of geologic sequestration, in which a portion of the injected CO2 reacts with the alkaline minerals present in the geologic formation to form solid carbonate species. In ex situ mineralization, the carbonation reaction occurs above ground, within a separate reactor or industrial process. Mineral CO2 sequestration mimics the natural weathering process in which calcium or magnesium silicates are
transformed into carbonates through the reaction with CO2 gas and/or aqueous CO2[19].
CO2 mineralization with magnesium and calcium silicates through atmospheric CO2 under ambient conditions is a naturally occurring process. But this process proceeds at very slow rate. Improvements in the mineralization kinetics can be achieved by injecting CO2 at higher concentrations and increasing the temperature. Despite significant efforts to accelerate mineralization reaction, the slow kinetics is still a major drawback in scaling up of this process.
Some of the industrial CO2 mineralization applications are calcium and magnesium carbonate production, baking soda production, CO2 concrete curing and bauxite residue carbonation. Sodium carbonation is another form of CO2 mineralization in which CO2 is reacted with brine solution to produce baking soda. Instead of conventional energy intensive steam concrete curing, CO2 curing uses onsite flue gases to precast concrete products. In bauxite residue, which is generated in extraction of alumina from bauxite ore, treatment, CO2 is used to neutralise high alkalinity of residue.
Carbon Clean Solutions Limited (CCSL) jointly with Tuticorin Alkali Chemicals and Fertilizers Ltd.(TACFL) set up a plant to capture 60,000 tonnes of CO2 from power plant flue gases. Captured CO2 is used for soda ash production[14]. Calera is operating a continuous pilot plant facility in California which produces an average 5 TPD of supplementary cementitious material by reacting CO2 from flue gas with calcium hydroxide. Skyonic Corporation set up a plant to capture 75000 TPA of CO2 from flue gas and use captured CO2 for production of baking soda and hydrochloric acid[20].
CO2 to polymersPolymers are made up of large chains of repeating structural units, generally formed with carbon as backbone. Currently, the most widely used feed stocks in polymer production are ethylene and propylene which are petroleum derived. Utilization of CO2 as raw material for polymer production is not only important from CO2 utilization point of view but also as a substitute to petroleum feed stocks. There are growing efforts to synthesize polymers using renewable raw materials. A recent approach in polymer processing is to combine traditional feed
34
stocks with CO2 to synthesize polymers and high value chemicals. Catalytic coupling of CO2 with heterocyclic compounds has received considerable attention, especially the copolymerization of CO2 with epoxides to polycarbonates[21].
Epoxides such as propylene oxide(PO), cyclohexene oxide (CHO) and epichlorohydrin (ECH) have been reported for copolymerization with CO2. Among these, polypropylene carbonate (PPC), the alternating copolymer of PO and CO2, has received the significant attention both in industry and academic research as one of the emerging low cost and eco-friendly polymer material[21]. Depending on the type of catalyst used, end product could be alternating polycarbonate or polyethercarbonate. Aliphatic polycarbonates are used as packaging materials and polyethercarbonates are promising raw materials for polyurethanes production[22]. Major challenges in conversion of CO2 to polymers are large energy inputs and economics of synthesized polymers compared to traditional polymers.
Novomer Inc developed proprietary catalyst for efficiently converting CO2 and propylene oxide to polypropylene carbonate (PPC) polyol. Novomer is commercializing this technology under Converge trade name that enables the transformation of waste CO2 into high performance and low cost polymers for a variety of applications. Produced PPC polymers contain up to 50% CO2 by mass; thus sequestering CO2 permanently from atmosphere[28].
CO2 to chemicals CO2 can be used as feed stocks to produce various chemicals such as urea, inorganic carbonates and salicyclic acid. Urea has been produced from CO2 on an industrial scale for many years and currently represents the largest market for CO2 outside of EOR. Urea is manufactured through a two-step process that involves reaction of liquid ammonia and dry ice (solid CO2) to form ammonium carbonate, followed by the endothermic decomposition and dehydration of ammonium carbonate to produce urea[23]. Organic carbonates such as acyclic carbonates (dimethyl carbonate (DMC), diallyl carbonate (DAC), diethyl carbonate (DEC), and diphenyl carbonate (DPC)), cyclic carbonates (ethylene carbonate (EC), propylene carbonate (PC), cyclohexene carbonate (CC), and styrene carbonate (SC)) which have
variety of industrial applications are other class of chemicals that can be synthesized using CO2. Formic acid is another important chemical that can be manufactured using CO2[3]. Major challenges in CO2 chemical conversion are requirement of high temperatures and pressures and high catalyst inventory. Separation of the catalyst from the products is also another challenge in this process.Liquid Light Inc developed electrochemical process to convert CO2 to chemicals. Company says that it has developed prototype that can make ethylene glycol from carbon dioxide, electricity, and a source of hydrogen, such as water. Further, it says that developed method is significantly cheaper than conventional methods for converting CO2 into chemicals [16].
Conclusions Implementation of CCS is essential to mitigate climate change and to limit the global rise in temperature below 20C by de-carbonating the atmosphere. Many technologies have been developed by utilizing CO2 as feed stock and generate value added products. These utilization technologies not only provide solution to carbon sequestration but also generate additional revenue by sale of end products which can compensate the costs associated with carbon capture. However, due to inert nature of CO2, most of the carbon utilization methods other than enhanced hydro carbon recovery require large energy inputs and active catalyst inventory. To make the overall utilization process carbon neutral, it is necessary to generate required energy for CO2 utilization via renewable energy sources.
Utilization methods such as CO2-EOR, ECBM and CO2 mineralization locks CO2 permanently. Other utilization methods such as CO2 to fuels and chemicals stores CO2 temporarily and releases CO2 back into atmosphere during their utilization. CO2-EOR is a well maturated technology and quite a number of commercial plants are already operating. Other emerging technologies such as CO2 to fuels, chemicals, mineralization and polymers require further research and demonstration before commercial deployment. High energy input and active catalyst with good selectivity and better conversion are the major constraints in chemical conversion of CO2. CO2 mineralization is confronted by slow kinetics and improving reaction rates is essential for industrial utilization of these technologies.

35
References 1. IPCC climate change 2014 : Synthesis report2. Houghton, J., “Global Warming: The Complete Briefing”,
Cambridge University, 2004 3. Al-Mamoori A, Krishnamurthy A, Rownaghi A A, Rezaei
F, “Carbon Capture and Utilization Update”, Energy Technol. 2017, 5, 834-849
4. L. Lei, Z. Ning, W. Wei, S. Yuhan, “A review of research progress on CO2 capture, storage, and utilization in Chinese Academy of Sciences” Fuel 108 (2013) 112–130
5. B. Sreenivasulu, D.V.Gayatri, I.Sreedhar , K.V.Raghavan, ” A journey into the process and engineering aspects of carbon capture technologies” Renewable and Sustainable Energy Reviews 41, 2015, 1324–1350
6. M. E. Boot-Handford, J. C. Abanades, E. J. Anthony, M. J. Blunt, S. Brandani, N. Mac Dowell, J. R. Fernandez, M.-C. Ferrari, R. Gross, J. P. Hallett, R. S. Haszeldine, P. Heptonstall, A. Lyngfelt, Z. Makuch, E. Mangano, R. T. J. Porter, M. Pourkashanian, G. T. Rochelle, N. Shah, J. G. Yao, P. S. Fennell, “Carbon capture and storage update”, Energy Environ. Sci. 2014, 7, 130–189
7. https://www.globalccsinstitute.com/projects/large-scale-ccs-projects
8. Aramesh Shahbazi and Behnam Rezaei Nasab, “Carbon Capture and Storage (CCS) and its Impacts on Climate Change and Global Warming”, J Pet Environ Biotechnol 2016, 7:4
9. Novel CO2 Utilization Concepts: Working Paper, DOE/NETL-2012/1588, November 2013
10. Zimmermann A. W., Schomäcker R., “Assessing Early-Stage CO2 utilization Technologies—Comparing Apples and Oranges?”, Energy Technol. 2017, 5, 850-860
11. L. Stephen Melzer, “Carbon Dioxide Enhanced Oil Recovery (CO2 EOR): Factors Involved in Adding Carbon Capture, Utilization and Storage (CCUS) to Enhanced Oil Recovery”, February 2012
12. Dowell N. M., P. S. Fennell3, Shah N. Maitland G. C., “The role of CO2 capture and utilization in mitigating climate change”, Nature climate change, 2017, 7, 243-249
13. M Aresta and A Dibenedetto, “Utilisation of CO2 as a chemical feedstock: opportunities and challenges” Dalton Trans., 2007, 2975-2992
14. http://www.carboncleansolutions.com/media-center/news/article/2016/10/first-fully-commercial-ccsu-plant-launches-capturing-CO2-at-30-per-tonne
15. Report on “Carbon capture and utilization in the green economy-using CO2 to manufacture fuel, chemicals and materials” by the centre for low carbon futures 2011
16. http://www.technologyreview.com/news/525356/a-cheaper-route-to-making-chemicals-from-CO2/
17. Godec M, Koperna G, Gale J., “CO2-ECBM: A Review of its Status and Global Potential”, Energy Procedia 63 ( 2014 ) 5858 – 5869
18. http://carbonrecycling.is/george-olah/2016/2/14/worlds-largest-CO2-methanol-plant
19. Romanov V., Soong Y., Carney C., Rush G. E., Nielsen B., O’Connor W., “Mineralization of Carbon Dioxide: A Literature Review”, Chem Bio Eng Rev 2015, 2, No. 4, 231–256
20. https://hub.globalccsinst i tute.com/publications/accelerating-uptake-ccs-industrial-use-captured-carbon-dioxide/appendix-f-CO2-feedstock
21. Qin Y., Sheng X., Liu S., Ren G., Wang X., Wang F., “Recent advances in carbon dioxide based copolymers” Journal of CO2 Utilization (2014).
22. Liu S., Wang X., “Polymers from carbon dioxide: polycarbonates, polyurethanes”, Current Opinion in Green and Sustainable Chemistry,2017, 3, 61-66
23. M. E. Boot-Handford, J. C. Abanades, E. J. Anthony, M. J. Blunt, S. Brandani et al., “Carbon capture and storage update”, Energy Environ. Sci., 2014, 7, 130–189
24. http://www.audi .com/corporate/en/corporate-responsibility/we-live-responsibility/product/audi-e-gas-project.html
25. Lam M. K., Lee K. T., Mohamed A. R., “Current status and challenges on microalgae-based carbon capture-Review”, International Journal of Greenhouse Gas Control 10 (2012) 456–469
26. http://www.biofuelsdigest.com bdigest/2015/01/26/worlds-largest-oil-refinery-adds-algae-demonstration-project/
27. http://www.algaeindustrymagazine.com/indian-pilot-plant-mitigating-CO2-with-algae/
28. http://www.novomer.com/CO2-business-overview

36
At the time of writing this article it is 2017. We have cars that drive themselves, auto-landing
planes, and household thermostats that can detect when you are getting close to home so they switch on the heating before you arrive. Innovations to automate our everyday lives surround us, and they continue to be developed. Yet, if you take yourself onto a refinery you will find that there are some activities that, although easily automated, continue to be carried out manually. One particular task, that is focused on in this article, is the intermittent withdrawal of 700 DegC catalyst from FCC/RFCC and DCC regenerators. This task exposes the withdrawal piping and valves to significant temperature fluctuations, a highly abrasive transferring medium, and ultimately, places our operators at risk. Many process operations on an oil refinery are automated in order to minimize risk and improve the safety of the people working in that environment; pressure control and the refinery flare system is a perfect example of this. So why are some hazardous operations left to be carried out manually when they can be automated by implementing some very simple engineering design?
As a junior FCC Engineer, I recall one evening when I was shadowing a process operator to learn about some of their day-to-day activities. We stood on the FCC platform, it was dark and the rumbling
Improving FCC Safety with Continuous Catalyst Withdrawal
Kate Hovey Senior Technical Service Engineer
Johnson Matthey
Martin Evans Vice President Engineering
Johnson Matthey
regenerator was pouring out heat. The operator was instructed to unload some of the catalyst from the regenerator so he proceeded to open the valves on the withdrawal piping. The pipe began to glow red as if the metal was melting before my eyes. It was vibrating slightly from the flow of the scorching catalyst within, and the operator showed me the sections of piping that had been repeatedly patched from where pinhole leaks had previously developed. I remember feeling quite impressed at being able to see this but at the same time quite astonished that the operator had to do this on a regular basis and that it was normal to simply weld a patch of metal over areas where the erosion had overcome the integrity of the piping. I had accepted that this was an old unit and perhaps that some of the operations were a bit ‘outdated’. But I was wrong, this is not an outdated procedure at all, in fact this is the normal procedure for the majority of FCC’s in the field today. Of course, some new designs have engineered in methods to try and reduce the erosion of the piping, but ultimately the procedure is still the same and the catalyst is withdrawn as a batch process.
Current Batch Withdrawal Practices – Life as we know itCatalyst is continuously added to the FCC and it has been proven that costs are minimized when the addition is carried out as continuously as

37
Chart 1 – US Refiner 1: Batch Catalyst Withdrawal (Bed Levels) 2
Chart 2 - US Refiner 1: Batch Catalyst Withdrawal (Regenerator Temperature) 2
possible. This has been commercially demonstrated in a joint paper between BP & JM Intercat in the March 2006 edition of Hydrocarbon Processing1. Although undesired, catalyst is continuously lost from the FCC, from the regenerator side along with the flue gas, and from the reactor side along with the product vapours. In most units these losses are less than the daily additions and hence it is normal for the inventory in the FCC to gradually build. On many FCCUs, the Reactor level is controlled by the spent catalyst slide valve and kept at a continuous level to ensure sufficient stripping efficiency, and the regenerator level is allowed to change. Because of this, catalyst needs to be withdrawn from the regenerator in order to maintain a constant inventory capacity, and refiners typically do this periodically by a batch withdrawal carried out by the operators. In most cases, the catalyst withdrawal rate is not well controlled and the velocities are both unmonitored, and often unknown, due to the excessive carrier or “cooling” air. It is common for holes to form especially at elbows and areas of higher velocity, and experience shows that the erosion is significantly minimized when the withdrawal velocity is kept below 10 meters/second. Additionally, the cooling of the catalyst through the finned sections of piping is greater when the velocities are reduced.
FCCU licensors will often provide their standard design for catalyst withdrawal piping, which will specify the pipe class, a section of finned piping for cooling, as well as temperature indications for visibility. It is also common to see some method of controlling the withdrawal flow without the requirement to partially close the isolation valves. These include sacrificial orifice plates, or venturis, which do unfortunately erode over time and need replacement. There are some refiners that actually use a number of manual valves in series which are choked back to control the flow. In this case, once one valve has been significantly eroded the refiner will move on to the next one, and will continue to do this until the turnaround cycle when all the valves will need replacement. This is not an ideal operating practice.
As mentioned, this procedure subjects both the operators and the withdrawal piping to unnecessary
risk. In addition to this risk, the continuous addition and batch withdrawals also mean that the level in the regenerator is fluctuating and not kept steady.
Does Batch Withdrawal Affect the FCC Operation?Aside from the above mentioned safety concerns associated with batch withdrawals, the unit stability is also compromised by the periodic changes in the Regenerator bed level. When the Regenerator bed level is reduced as a step change, it has an impact on the heat balance, which directly impacts the catalyst circulation, and ultimately, the unit conversion. An example of this phenomenon is shown at a US refinery that periodically withdraws approximately 5% of its unit inventory. The quantity withdrawn amounts to approximately 6.8 MT of equilibrium catalyst and the withdrawal takes about 8 minutes. This withdrawal rate is only 3.5% of the catalyst circulation rate; however, the impact is still significant. The Regenerator temperature increases by 5 °C as shown in the charts below. Chart 1 shows the reduction in bed level during the withdrawal, and Chart 2 shows the impact on the regenerator temperature.

38
But what impact does this have? The importance of these changes can be realized by looking at how the product yields have been impacted. Although the batch withdrawal only results in a temporary period of instability, the economics associated with these periods are highly significant and should not be overlooked. The Regenerator temperature and pressure may be able to recover shortly after the episode, but the same is not realized for the product yields and unit conversion. Chart 5 shows how the FCCU slurry yield elevates by 1 wt% during the batch withdrawal and takes twice as long as the withdrawal period to recuperate. This temporary reduction in performance, and economic deficit that results, is highly significant when cumulated over an extended period.
Chart 4 – US Refiner 1: Batch Catalyst Withdrawal (Reactor Pressure) 2
Chart 5 – US Refiner 1: Batch Catalyst Withdrawal (Impact on Slurry Yield) 2
Chart 3 – US Refiner 1: Batch Catalyst Withdrawal (Regenerator Pressure) 2
In addition to the increase in Regenerator temperature, the Regenerator pressure also spikes during the batch withdrawal procedure. Charts 3 and 4 show how the Regenerator and Reactor pressures respond during the batch withdrawal period.
The displayed impact on Regenerator conditions does not only have an impact on the unit conversion, but also on the Regenerator combustion kinetics. Excess bed levels will result in longer residence times in the dense phase and can result in poor air distribution & air channeling. Regenerator cross sectional mixing can be affected, resulting in coke combustion issues and localized areas of high temperatures. The same can be said for the low Regenerator levels following a withdrawal where the dense phase residence time is reduced. Chart 6 below shows an example of another US refiner who experienced elevated levels of carbon monoxide as the Regenerator level increased. The carbon monoxide concentration in the flue gas trends closely with the changes in bed level, and although not represented in the below chart, also has a direct impact on the flue gas temperature. Fluctuations like these are not desirable and should be avoided where possible. A clear indication of how the bed level has a direct impact on the combustion kinetics.
Chart 6 – US Refiner 2: Batch Catalyst Withdrawal (Impact on Regenerator Emissions) 2

39
Image 1 – Continuous Catalyst Withdrawal (Mark-I) Installation – Marathon, Garyville 2
Continuous Catalyst Withdrawal – Back To the FutureDo we need to stick to historical, outdated, and unsafe practices of batch wise catalyst withdrawal? The answer is no. A fully continuous and automated catalyst withdrawal has been designed, commercially installed, and has been in use since March 2016 at MPC Garyville, Louisiana2. This system was directly tied into the existing withdrawal piping and is comprised of an Everlasting isolation valve, a positive displacement fan and three finned pipe-in-pipe heat exchangers to cool the catalyst, and a collection vessel to receive the cooled catalyst. An overview of the installation at Garyville is shown in Image 1.
The collection vessel uses a sophisticated control logic which is able to carefully control the withdrawal velocity in continuous operation by using a pressure balance between the regenerator and the collection vessel. The collection vessel is mounted on load cells so the exact quantity of catalyst withdrawn is continuously known. This results in the FCCU catalyst balance closure being significantly more accurate, and catalyst loss troubleshooting is made far easier. Any FCC engineer will recognize the difficulties involved in closing the catalyst mass balance and anything that can help improve this is a huge help in times of catalyst loss issues. In the continuous Catalyst Withdrawal System, the cooled and collected catalyst can be transferred to the equilibrium catalyst (E-Cat) storage hopper prior to removal from site.
As MPC’s Garyville refinery has a Flexicracker FCCU, catalyst inventory changes take place in the reactor instead of the regenerator, and the Reactor level is controlled by the withdrawal of equilibrium catalyst from the unit. Fluctuations in the Reactor level have a significant impact on the unit heat balance and product yields. The implementation of the continuous Catalyst Withdrawal System (CWS) has allowed MPC to control the Reactor level more consistently and identify the most optimum level to operate. This results in an economic advantage that has minimized the payback of this project to less than one year. MPC has led the way when it comes to optimizing the FCCU operation through stable and continuous catalyst withdrawals and moved away from the industry norm of the outdated, unreliable, and unsafe batch wise withdrawal practices.
The Mark-II design of the continuous Catalyst Withdrawal System is the latest design and allows for a fully continuous operation by the use of two collection vessels, one in operation whilst the other is in standby. Once the operating collection vessel becomes full, the withdrawal is rerouted to the standby collection vessel, and the filled vessel can unload into the ECat hopper. This setup means that there is no need to isolate the catalyst withdrawal to empty the filled collection vessel. The Mark-II design also incorporates an induced draft fan in

40
replacement of the air blower, which is positioned above a patented helical finned pipe design heat exchanger. This draws the cooling medium (air) through the finned piping and up out of the top of the unit to atmosphere. The helical finned piping is designed in such a way that it eliminates the requirement for expansion joints which can be prone to failure and costly to replace. It is a simple, yet effective design which has the added benefit of significantly reducing the unit footprint. The exchanger skid is only 2.5 x 2.5 meters at the base with a height of 6 meters. See Image 3 which shows the Mark-II setup.
An additional feature of the continuous Catalyst Withdrawal System is that an E-Cat sample point can be included. The relocation of the E-Cat sample point from the regenerated catalyst standpipe to the Catalyst Withdrawal skid means that the operator will no longer need to be regularly exposed to high temperature catalyst. Conventional E-Cat sample points are unreliable and often experience plugging issues, which are a safety concern and require the operator to manually correct. By allowing the E-Cat samples to be collected cold, these safety risks are eliminated. The inlet temperature to the Collection Vessel installed at MPC Garyville is <90 DegC and when the withdrawal rate is low it reduced to only 40 DegC.
Final SummaryIn this article we have discussed the unreliable and unsafe FCC catalyst withdrawal practices carried out today by many refiners about the globe. This can very easily be a thing of the past, and a solution has been commercially demonstrated proving that the catalyst withdrawals can be carried out continuously and reliably, both minimizing the operator risk and maintaining the integrity of the withdrawal piping.
This new Technology includes recent developments aimed at further improving efficiency and reducing costs compared to the initial prototype design. A patented helical finned piping section is cooled using an induced
Image 3 – Mark-II Design Continuous Catalyst Withdrawal System

41
draft fan rather than a centrifugal blower which significantly reduces the footprint. The helical finned piping additionally eliminates the requirement for expansion joints which helps to reduce costs and improve reliability. And finally, the Mark-II design includes two collection vessels which can operate in such a way that there is no requirement to isolate the catalyst withdrawals during normal operation, improving the stability and reliability of the withdrawal system. A fully continuous approach.
As a junior FCC engineer, I thought it was ‘impressive’ to see a glowing red pipe as catalyst was being withdrawn. I also thought it was an ‘outdated’ procedure, albeit probably typical in older units. I was wrong. There is nothing impressive about it. But I was right in thinking that it is outdated and still a typical way of operating today, and this does not only apply to older units. Having had firsthand experience of searing hot catalyst leaking out of FCC’s in various locations, I know that anything that can be done to mitigate the risk of this happening is of paramount importance. There should be no question about whether the risk is there or not. The risk is there, I have seen it, and others have also, and luckily there are available solutions ready to target this safety concern today. This additionally comes with an added economic advantage of improving the combustion kinetics in the Regenerator and stability of the unit as a whole, protecting the conversion and performance of the FCC.
M/S Johnson Matthey has developed a catalyst withdrawal system using this technology.
References:
[1] Brown, M., Ford, J. & Cameron, A. 2006, “A Fresh Approach,” Hydrocarbon Engineering, Vol. 11, Number 3”
[2] Fisher, R., Evans, M., Hovey, K., Hedges, K., Larsen, N., & Dinkel, B. 2017, “Improvements in FCCU Operation through Controlled Catalyst Withdrawals at a Marathon Petroleum Refinery,” AFPM AM-17-45

42

43
Oil & Gas in Media
Consultative Workshop on New National Policy on Biofuels and Pradhan Mantri Ji- Van Yojana
A consultative workshop on New National Policy on Biofuels & Pradhan Mantri Ji- Van Yojana (VGF
for 2nd Generation Ethanol Bio Refineries) was organised by Ministry of Petroleum and Natural Gas for inviting suggestions for drafting a suitable roadmap for Biofuels in India. The workshop was organised as the government is promoting Biofuels with an objective to reduce dependency on import of crude oil, savings in foreign exchange, provide better remuneration for the farmers and address growing environment concerns in the light of Prime Minister Narendra Modi’s Commitment at COP 21.
During the day long workshop 5 Working Groups on 1-G Ethanol, 2-G Ethanol, Biodiesel, Municipal Solid Wastes to Fuel & Bio-CNG comprising of all the stakeholders (producers, bankers and buyers) deliberated issues related to their segment in detail and came up with many constructive suggestions and inputs.
Minister of Petroleum and natural Gas, Skill Development and Entrepreneurship Shri Dharmendra Pradhan in his speech said that 1-G and 2-G Ethanol, Biodiesel, MSW to Fuel and Bio-CNG together with Methanol(DME) have huge potential in augmenting economic growth, generating employment and doubling farmers’ income. He said this will be instrumental in achieving the target of 10% import reduction by 2022 set by the Prime Minister Shri Narendra Modi.
He said, during the workshop many constructive suggestions related to feedstock management, technology, capacity augmentation, fiscal incentives and Supply chain management were received. Shri Pradhan said he is happy to share that all the technologies are indigenously developed in India and will immensely boost Make In India campaign.
Shri Dharmendra Pradhan launches Start-up Programs for entrepreneurs in Oil and Gas sector
In a novel initiative by the Petroleum Ministry, 10 oil and gas companies under it launched a startup program for entrepreneurs.
Speaking at the launch function, Minister of Petroleum and Natural Gas, Skill Development and
Entrepreneurship Shri Dharmendra Pradhan said that it is important to develop new business models, marketing plans, technology and innovations in the sector. For the same, the oil and gas PSUs have setup venture capital funds to encourage start-ups based on innovative ideas in the energy sector. Hon’ble Minister said that the initiative will change the status of the youth of our country from job seeker to that of job provider as envisaged by Prime Minister Shri Narendra Modi. Shri Pradhan said the business partnership between the start-ups and the PSUs of Petroleum Ministry will create a new benchmark for growth and job creation as India has a huge potential for investment of over USD 300 bn in the energy sector in the next ten years.
CEO, Niti Ayog, Shri Amitabh Kant, Secretary DIPP Shri Ramesh Abhishek, Secretary, PNG Shri K. D Tripathi, Academicians, Chiefs of Oil and Gas

44
PSUs and young entrepreneur were also present on the occasion.
Backing the spirit of innovation, 10 public sector undertakings under the Ministry of Petroleum and Natural Gas, including the IOCL, ONGC, EIL, OIL, NRL, BPCL, HPCL, GAIL and MRPL, have created a corpus of Rs. 320 crore to support start-up initiatives.
Development of Natural Gas Infrastructure in Orissa
In the year 2016, Prime Minister laid the foundation stone of Jagdishpur - Haldia & Bokaro - Dhamra Natural Gas Pipeline (JHBDPL), popularly known as ‘Pradhan Mantri Urja Ganga’ which is Rs. 51,000-crore gas pipeline project. The project aims to cater to millions of people in states like Uttar Pradesh, Bihar, Jharkhand, West Bengal and Odisha. The 800-km pipeline will be laid and is aimed to cater to 50,000 households by having Piped Natural Gas (PNG) connections and around 20,000 vehicles to get Compressed Natural Gas (CNG).
During the month of October 2017, as a next step under ‘Pradhan Mantri Urja Ganga’ (PMUG) project, Union Minister of Petroleum and Natural Gas and Skill Development and Entrepreneurship, Shri Dharmendra Pradhan, launched supply of PNG for the residents of Bhubaneswar. The project for supply of PNG to the residents has been executed by GAIL. With this, GAIL started supply of environment-friendly PNG to 255 houses in Nalco Nagar located at Chandrasekharpur area. City Gas Distribution (CGD) projects in Bhubaneswar and Cuttack are being taken up in parallel with the JHBDPL.
To further progress on the penetration of use of Natural Gas in the state of Odisha, CNG stations were inaugurated in Bhubaneswar at Chandrasekharpur and Patia by Shri Dharmendra Pradhan in December 2017. Two more stations are being constructed in the city. Altogether there is a plan of commissioning 25 CNG stations in the twin cities of Bhubaneswar and Cuttack to supply CNG to vehicles. Initially natural gas will reach Bhubaneswar in cascades which will be transported by road from Vijaywada in Andhra Pradesh. Later, Natural Gas will be supplied through the 2,655 km
long Pradhan Mantri Urja Ganga pipeline.
LNG Producer-Consumer Conference 2017
Union Minister of Petroleum and Natural Gas and Skill Development and Entrepreneurship, Shri Dharmendra Pradhan, led a delegation to Tokyo, Japan from 17-18 October 2017 to participate in LNG Producer- Consumer Conference.
The conference was organized by the Ministry of Economy, Trade and Industry of Japan (METI) and the Asia Pacific Energy Research Centre (APERC) and is a global annual dialogue which provides participants a forum for sharing the latest trends in the global LNG market. During the conference the transformation which global LNG market is undergoing was discussed. Shri Dharmendra Pradhan was of the view that with the oversupply situation in the market, producers and consumers of LNG should join hands to design flexible terms such as pricing review, flexible take or pay, abolition of destination restriction clause in the LNG contracts. He also stressed on the reforms which are essential to develop a transparent, efficient, truly global and balanced LNG market. During the meeting between Shri Pradhan and Minister of Economy, Trade, and Industry of Japan Mr Hiroshige Seko, they explored joint cooperation in the areas of LNG sourcing, swapping and optimization of LNG sources and commercial exploitation of Methane Hydrates.
A Memorandum of Cooperation (MoC) was signed on establishing a liquid, flexible and global LNG Market which will provide a framework to cooperate in facilitating flexibility in LNG contracts, abolition of Destination Restriction Clause and also explore possibilities of cooperation in establishing reliable LNG spot price indices reflecting true LNG demand and supply. In the LNG sector, Japan is the world’s largest importer and India is the 4th largest importer.
51 bids for oil and gas exploration under revamped policy
Under the open acreage licensing regime as many as 51 proposals seeking about 60,000 square kilometre of area for exploration of oil and gas have been bid. In July, 2.8 million sq km of sedimentary basins for oil and gas exploration was opened in a bid to raise domestic production and cut excessive dependence on imports. The
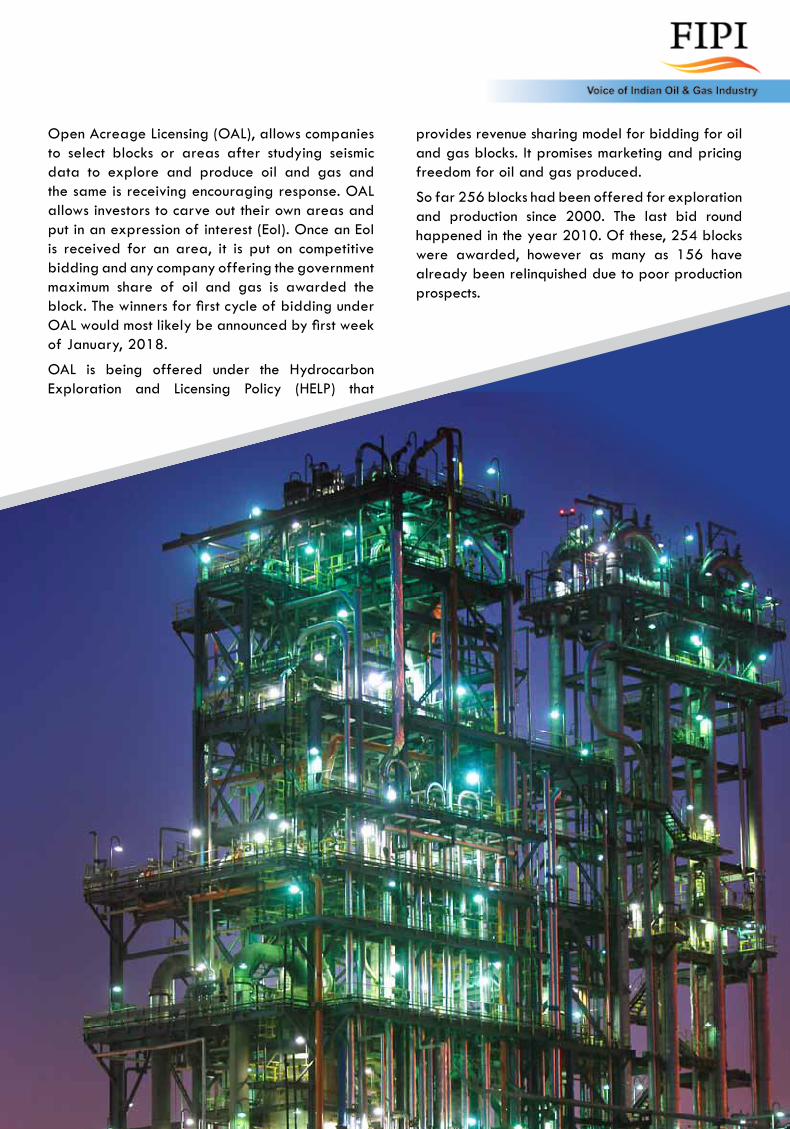
45
Open Acreage Licensing (OAL), allows companies to select blocks or areas after studying seismic data to explore and produce oil and gas and the same is receiving encouraging response. OAL allows investors to carve out their own areas and put in an expression of interest (EoI). Once an EoI is received for an area, it is put on competitive bidding and any company offering the government maximum share of oil and gas is awarded the block. The winners for first cycle of bidding under OAL would most likely be announced by first week of January, 2018.
OAL is being offered under the Hydrocarbon Exploration and Licensing Policy (HELP) that
provides revenue sharing model for bidding for oil and gas blocks. It promises marketing and pricing freedom for oil and gas produced.
So far 256 blocks had been offered for exploration and production since 2000. The last bid round happened in the year 2010. Of these, 254 blocks were awarded, however as many as 156 have already been relinquished due to poor production prospects.

46

47
Future of IC Engines and Liquid Fuels for TransportationFederation of Indian Petroleum Industry (FIPI) and SAE India in association with Automotive Component Manufacturers Association of India (ACMA) and Society of Indian Automobile Manufacturers (SIAM) organized a program on 04 December, 2017, at New Delhi, on “Future of IC Engines and liquid fuels for transportation”. The program was organized with the objective of understanding the landscape of fuel consumption in transport sector, opportunities and challenges associated with e-mobility and its impact on IC Engines and liquid fuels in future. The program was attended by dignitaries from the Oil & Gas and Automotive industry.
Inaugural address by Dr. R.K. Malhotra, Director General, FIPI
Dr. R.K. Malhotra, DG, FIPI & SAE India President delivering the opening remarks and welcome address.
Inaugural address for the event was delivered by Dr. R.K. Malhotra, Director General, FIPI and President, SAE India. Dr. Malhotra in his address highlighted the present domination of fossil fuels in global and India’s energy mix and that this trend will continue in future. He mentioned that though the share of renewables is expected to increase in the energy mix as reported by various global energy agencies, still it will not be able to displace major share of fossil fuels from the energy mix. As per projections the demand for oil in India is expected to more than double by 2035, primarily driven by demand from transportation and petrochemicals sector. On the other hand, there have been widespread talks on various forums, globally and in India for a mass scale transition to e-mobility, which has led to confusion in energy and automotive markets.
Dr. Malhotra in his address discussed the challenges associated with e-mobility such as, high battery costs, lithium availability, price and associated geopolitics,
lack of charging infrastructure, long charging time, issues related to range of electric vehicles (EVs), and issues of grid stability and energy storage while considering renewables for power generation for EVs. He summarised his speech by saying that in view of the projections for oil and challenges associated with EVs, the dependency on liquid fuels may continue in future, and IC engines may coexist with EVs. He concluded by wishing the program success and hoping that the presence of imminent speakers at the event who would share their insights and experiences will help in paving the right path of progress for the future.
Panel Discussion
The inaugural address was followed by an insightful panel discussion on “Future of IC Engines and liquid fuels for transportation”. The panellists for the discussion were - Dr. Teich Christian, VP - Bosch, Dr. SSV Ramakumar, Director (R&D) - IOCL, Mr. Vikram Gulati, Country Head & VP (External Affairs) - Toyota Kirloskar Motors, Mr. Ashok Taneja, Managing Director & CEO - Shriram Pistons & Rings and Mr. Harjeet Singh, Executive Advisor-Tech, Hero Moto Corp. The panel discussion was moderated by Mr. Deepangshu Dev Sarmah who is the Editor-in-Chief of Auto Tech Review and Head of Professional Publishing at Springer Nature India.
Panel discussion moderated by Mr. Deepangshu Dev Sarmah, Editor-in-Chief, Autotech Review.
FIPI Events

48
(L-R) Mr. Harjeet Singh, Executive Advisor-Tech, Hero Moto Corp; Mr Ashok Taneja, Managing Director & CEO, Shriram Pistons & Rings Ltd; Mr. Vikram Gulati, Country Head & VP
(External Affairs), Toyota Kirloskar Motors; Dr. S. S. V. Ramakumar, Director (R&D), IOCL;
Dr. Teich Christian, VP, Bosch.
Key points shared by Dr. Christian in his presentation are as follows:
• Mobility is going to be redefined in the future and will be driven by three major factors globally:
o There will be 6 billion people living in cities by 2050,
o Traffic is going to increase by three times from present in 2050 and,
o There will be more online shops leading to more product deliveries
• For changes in mobility market in India he stated that:
o In India, 17% of car sales in 2020 will be in commercial segment, which will grow at a CAGR of 25% over the 2015 – 2020 period
o By 2030, India will be the 3rd largest automobile market in the world
o Consumers in India, will continue to have a value orientation
• Electric mobility is a good idea but will take time to develop in India
o The short and mid-term energy mix is not expected to enable emission reduction in India
o There are challenges associated with electrical infrastructure, specifically in the last mile connectivity (transmission & distribution) side
o There are limitations to availability of key battery materials such as Lithium, Cobalt, etc.
o The range vs. cost paradigm for EVs is going to exist for foreseeable future. Cost of battery goes up significantly for long range requirement
• Future IC Engine technology can lead to significant reduction in emissions. For India, particulate matter reduction is a major challenge; only 2% of particulate emission is because of fuel, rest 98% of particulate matter is contributed by tire wear, brake and street abrasion. Application of new technology in IC engines can reduce NOX emissions by 68% and particulate matter by 82%
• To meet the target of reducing global temperature by 2 degree C, a mix of fuel types in vehicles will play a key role in achieving the objective. Bosch projects that by 2050, IC engine, hybrids, gas, E-mobility and Fuel cell vehicles will all be present and be a part of vehicle mix.
Panel discussion commenced with the presentation by Dr. T Christian, VP – Bosch on “Future of IC Engine in India”.
Dr. T. Christian, VP, Bosch delivering the presentation on ‘Future of IC Engine in India’.
A section of participants.
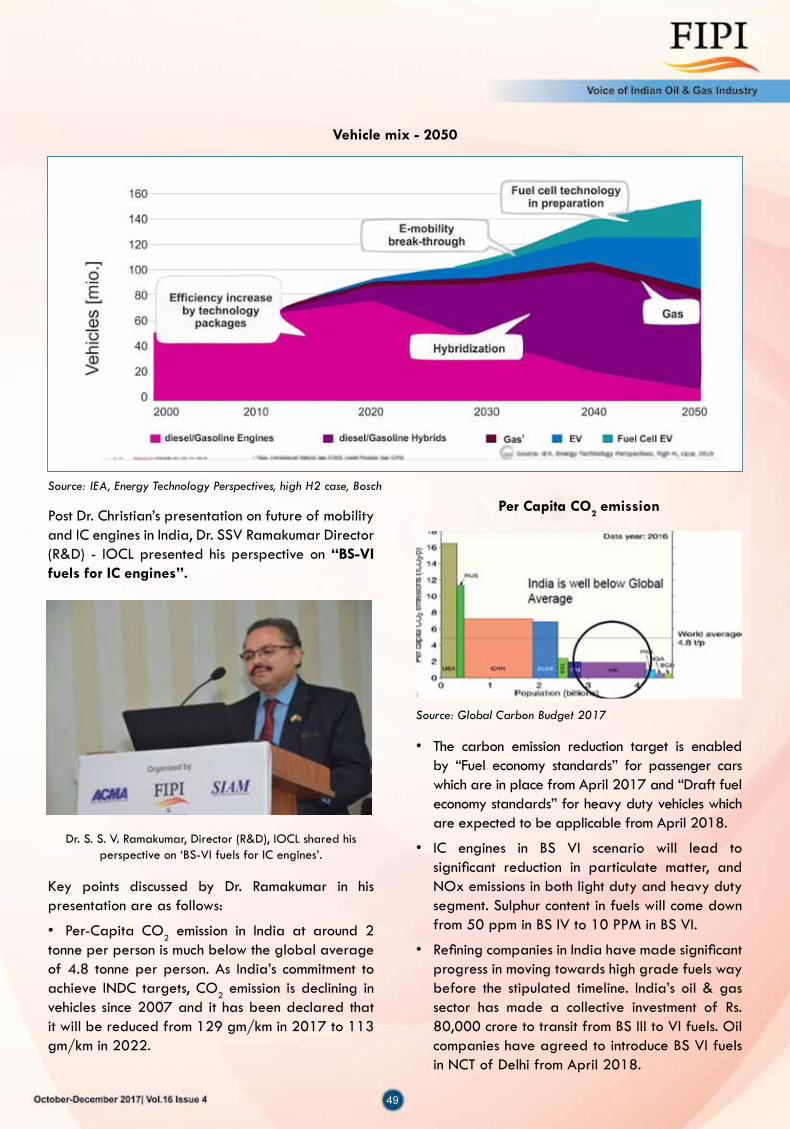
49
Vehicle mix - 2050
Source: IEA, Energy Technology Perspectives, high H2 case, Bosch
Dr. S. S. V. Ramakumar, Director (R&D), IOCL shared his perspective on ‘BS-VI fuels for IC engines’.
Key points discussed by Dr. Ramakumar in his presentation are as follows:
• Per-Capita CO2 emission in India at around 2 tonne per person is much below the global average of 4.8 tonne per person. As India’s commitment to achieve INDC targets, CO2 emission is declining in vehicles since 2007 and it has been declared that it will be reduced from 129 gm/km in 2017 to 113 gm/km in 2022.
Per Capita CO2 emissionPost Dr. Christian’s presentation on future of mobility and IC engines in India, Dr. SSV Ramakumar Director (R&D) - IOCL presented his perspective on “BS-VI fuels for IC engines”.
Source: Global Carbon Budget 2017
• The carbon emission reduction target is enabled by “Fuel economy standards” for passenger cars which are in place from April 2017 and “Draft fuel economy standards” for heavy duty vehicles which are expected to be applicable from April 2018.
• IC engines in BS VI scenario will lead to significant reduction in particulate matter, and NOx emissions in both light duty and heavy duty segment. Sulphur content in fuels will come down from 50 ppm in BS IV to 10 PPM in BS VI.
• Refining companies in India have made significant progress in moving towards high grade fuels way before the stipulated timeline. India’s oil & gas sector has made a collective investment of Rs. 80,000 crore to transit from BS III to VI fuels. Oil companies have agreed to introduce BS VI fuels in NCT of Delhi from April 2018.

50
Mr. Harjeet Singh, Executive Advisor-Tech, Hero Moto Corp sharing the background of e-mobility plan in India.
Mr Ashok Taneja, Managing Director & CEO, Shriram Pistons & Rings Ltd sharing his views on e-mobility.
• Mr. Taneja stressed on recognizing the ultimate objective which is affordable mobility for all, and keeping emission levels within permissible limits and working towards it. The pathways for achieving the end objective should not be defined by the government. IC Engine technologies are developing at a rapid pace, and in future the well to wheel emissions by ICEs will be equivalent or lower than battery vehicles. The focus of the government should be towards reducing vehicle congestion on roads and promoting shared mobility. The society and government should work towards ensuring fuel quality compliance, pollution control, maintaining vehicle compliance, scrapping of old vehicles and targeting such similar low hanging fruits. Minimizing number of vehicles on road and promoting public transport with BS VI vehicles will lead to lower overall total cost of ownership than stressing to move to an all-electric platform.
• The improvements in emission reduction by using BS VI fuel in BS IV vehicles will only be marginal. Particulate matter from heavy duty diesel vehicles may reduce only by 0.4%, while no change in NOx is expected. In gasoline vehicles, HC, CO and NOx emissions may reduce by 7%, 12% and 16%. IOCL R&D is carrying out studies to quantify benefits of using BS VI fuels in BS IV in-use Indian vehicles.
• For BS VI fuels compliance, fuel additives and lubricants also have to be in compliance with BS VI fuel for achieving emission reduction targets.
• Dr Ramakumar summarised his presentation by highlighting the following points:
o CO2 and fuel economy legislations will govern future engine technologies
o BS VI emission compliance imposes stringent fuel specifications
o Ultra-low sulphur fuels need major changes and investment in refineries
o Fuel additives and engine oils contribute towards fuel economy and they require continuous R&D interventions.
Post the presentations, the panel discussion commenced with views of panellists on role of IC Engines in our energy future:
• Mr. Harjeet Singh initiated the discussion by putting forth the background of e-mobility plan in India. National Electric Mobility Mission plan was launched by Government of India in 2013, which set the target and also gave the way forward for sale of 6-7 million EVs annually by 2020. As a next step, FAME scheme was launched in 2015 for faster adoption and manufacturing of hybrid and EVs in India which had a provision for incentivizing EVs. Mr. Singh being a part of the two wheeler industry, discussed about the opportunities and challenges in two wheeler industry and highlighted the fact that, to compete with the overall economics of existing two wheeler IC engine vehicle, cost of two wheeler EVs will have to be reduced by around three times. Consumer acceptability remains a major challenge, where consumers are not ready to compromise on cost, range and speed of the vehicles.

51
Mr. Vikram Gulati, Country Head & VP (External Affairs), Toyota Kirloskar Motors discussed the various scenarios by agencies, for e-mobility penetration in market by 2030.
• Mr. Gulati discussed about various scenarios by agencies, for e-mobility penetration in market by 2030 which has led to confusion among the industry members. E-mobility is going to happen in future, however it is not possible to exactly replicate in numbers the extent of EV penetration in 2030. The key part that people are missing out is that electrification does not mean all electric. Along with battery vehicles, there will be a host of technologies such as hybrids, plugin hybrids, fuel cell vehicles etc. which will be contributing to achieve the end objective of emission reduction.
• The panel discussion was followed by a question answer session, where panellists addressed questions from the audience.
Q&A session in progress
Few of the key questions that were put forth to the panellists were:
o Role of alternative fuels in India’s future: The question was responded by Dr. Ramakumar, who shared his views on alternative fuels such as methanol, ethanol and hydrogen and how hydrogen as an energy carrier holds promise if renewable routes for hydrogen production are explored.
o Development of technology in next 10 years with coming of EVs by 2030: To which the panellists had a consensus that different technologies should be allowed to evolve over the period, and let the market and society choose the best alternative.
o There were other questions also in relation to cost of EVs in two wheeler and four wheeler segments, future penetration of EVs and new technologies, which were aptly responded by panel members.

52
Mr. Douglas Patton, President, SAE International delivering the presentation on ‘Is IC Engine Dead or Not Yet’.
Key points shared by Mr. Patton in his presentation are as follows:
• As far as the history of IC engine goes, the IC Engine took centuries to take its today’s form and has survived many challengers in the past, such as steam and electric in the early 1900’s, and the gas turbine thereafter. Still in 2017, more than 90 million IC engines were built for various applications.
• However, in recent past, with concerns of growing emissions, transformation to electric vehicles has taken centre stage globally. China in its new energy policy plans to ban fossil fuel vehicles and shift to electric vehicles. UK, France and Germany are in the process of banning IC engine vehicles from cities. Every major OEM has a full electric vehicle, extending to entire vehicle lines. Charge times are being reduced and range of EVs is moving from 200 miles to 300 miles. Hence, the electric vehicles are here to stay.
The panel discussion concluded with felicitation of panellists and moderator by Mr. Rajeev Bahl, Director (Finance, Taxation & Legal), FIPI.
Post the panel discussion, Douglas Patton, President - SAE International and Executive Vice President & Chief Technology Officer - DENSO International America was invited to present on “The IC Engine – Is it dead again”.
Presentation by Douglas Patton, President SAE International
In his Presentation Mr. Patton highlighted the globally changing scenario in the field of mobility, with a push towards electrification of mobility.
• The push for E-mobility doesn’t mean that it will be the end of IC engines. IC engines and electric vehicle will coexist along with plugin hybrids. For achieving the greater objective of reducing carbon di oxide emissions, plugin hybrids can play a key role, as they do not have the typical issues of electric vehicles such as range anxiety and charging time.
• Globally various agencies are projecting very different scenarios for IC Engine and electric vehicles. Worst case scenario projects 18 million new IC engine vehicles in 2050, while the best case scenario projects 120 million IC engine vehicles in 2050. Bloomberg estimates 85 million new electric vehicles in 2040.
• Mr. Patton stressed on the fact that electrification is definitely happening in transport segment but it is not going to be all electric. The transformation is going to be gradual from IC engines to micro hybrids to hybrid electric to plug in hybrid electric and then fully electric.
• He further quoted Toyota’s powertrain executive program manager Ben Schlimme, who at a seminar, presented a vision of the future for automobiles that includes a broad portfolio of hybrid-electric vehicles, plug-ins and fuel-cell cars and trucks going out to 2050. He goes on further to say “Electrification will play a significant role in the future, but that doesn’t mean the death of the IC engine and going ahead there is no one single solution for the automobile market.” It is going to be a mix of different powertrains including ICEs, EVs, hybrid vehicles and hydrogen fuel cell cars.
Source: SAE International
Technology cost significantly increases with electrification

53
• There are many possible ways of electrification and there is no single solution, but they all require IC engines. Today’s IC engines are very complex. The new IC engines being developed, such as Skyactive – X Mazda Engine have increased torque of 10 – 30 percent, super lean burn and engine efficiency up to 20 - 30 percent over the current models. Next generation, Infiniti Variable compression engines, are offering significantly higher mileage and provide great opportunities for carbon di oxide emission reductions.
• Diesel trucks will continue to stay in the future, off road applications for IC engines such as construction vehicles, agriculture and heavy equipment machineries etc. will continue to run on IC engines.
• Mr. Patton summarised his presentation by stating that:
o Passenger car applications for electrified vehicles will increase but with limited Battery Electric Vehicles. Plugin Hybrid Electric Vehicles will play a major role in electrification
o On highways, light, medium and heavy duty applications will remain primarily on diesel
o Agriculture and construction equipment will remain on diesel
o IC Engines will continue to survive
The program was concluded by closing remarks from Mr. C V Raman, Senior Executive Director (Engineering) - Maruti Suzuki India Limited & Chairman SAE NIS, who in his closing remarks stated that it is essential to have a long term plan which should be well thought for any disruption. The vision of the country for controlling emissions and transitioning to e-mobility is commendable but it will require a clear cut plan with enablers and policy push in the right direction. Various technologies should be looked at for achieving the ultimate objective of carbon di oxide reduction. Mr. Raman thanked the organizers, presenters and panellists for the insightful program and the discussions that emerged during the session.

54
Annual General Body MeetingThe first ever Annual General Body Meeting of “Federation of Indian Petroleum Industry” FIPI was held on 2nd December 2017 which was a historic day for FIPI as the amalgamation of PetroFed into Petrotech took place on this very day last year.
Dr. R.K. Malhotra, Director General FIPI, welcomed Chairman, Co-Chairman, Vice Chairman & the members present.
Mr. Shashi Shanker, Chairman FIPI & CMD, ONGC addressed the august gathering in the presence of Mr. Sanjiv Singh, Co-Chairman FIPI & Chairman IOCL. He mentioned that FIPI has continued with the legacy of its predecessors to emerge as the unequivocal voice of the Oil & Gas Industry in the country.
In his address, the Chairman brought out the important developments which have come forth in India in
recent times. Some of the policy decisions included a forward-looking Hydrocarbon Exploration and Licensing Policy (HELP), marketing and pricing
freedom for gas produced from Deepwater, Ultra Deepwater and High Pressure-High Temperature areas, Extension of the Production Sharing Contracts of small and medium sized discovered blocks, the Discovered Small Field Policy, etc. In a ground-breaking decision, India has switched over to the Open Acreage Licensing (OAL) regime making it a part of the elite league of nations that offer areas for exploration and production of oil and gas round the year on liberal fiscal terms including marketing and pricing freedom.
Speaking on GST, the chairman said that the exclusion of crude oil, Natural Gas, MS, HSD & ATF from the purview of GST has brought about a multitude of challenges for the industry.
During his address Mr. Shanker also mentioned about the Vison 2030 released by Hon’ble Minister for Petroleum and Natural gas for North East India with the objective of leveraging the North-Eastern
Region’s hydrocarbon potential.
He also stated that April 01, 2017 saw an important landmark for our sector when the Hon’ble Minister Shri Dharmendra Pradhan formally launched BS IV fuel from Bhubaneswar to mark the supply of environment friendly fuels across the country. OMCs are investing heavily to leapfrog to BSVI by April 2020. In view of the serious environmental concerns in NCR, OMCs have agreed to supply BSVI fuel from April 2018 in Delhi and are looking at options to supply BSVI in entire NCR from April 2019.
Chairman stated that under the Government’s flagship programme, Pradhan Mantri Ujjwala Yojana (PMUY), the state-owned Oil Marketing Companies (OMCs) have successfully released 3.25 crore new LPG connections during FY 2016-17.
1 (L-R) Sh. Sanjiv Singh, Co-chairman, FIPI and Chairman, Indianoil; Sh. Shashi Shanker, Chairman FIPI and CMD, ONGC; Dr. R. K. Malhotra, Director General, FIPI

55
Chairman mentioned that FIPI is well into paving the way towards the determined bright future of the Oil & Gas industry and in order to commit itself to this
resounding vision, it has undertaken several projects and programs.
Chairman apprised the members that FIPI plays an important role as an apex industry body in Oil & Gas Sector in advocating & addressing the issues & Concerns of member organizations and appropriately taking up with the Government, regulatory authorities and stake holders.
He thanked all the members for their constant support & inputs, which helped the Federation, make an effective contribution for the healthy growth & development of the Industry. Chairman also thanked the Government for their support in propelling the growth of the industry and appreciated Team FIPI for their excellent work.

56
• The future is electrifying, spurred by cooling, electric vehicles & digitalization
China and India will lead the incremental global energy consumption fuelled by increasing energy appetite of their middle class. During the presentation it was also highlighted that India’s growth pace will be double than the rest of the world going forward till 2040 driven by the need for electrification, industrialization and urbanization. The demand for oil will continue to rise however at a slower pace due to EVs, driven by consumption from Petrochemicals, trucks, aviation and shipping segments. Demand for natural gas will continue to rise primarily in Asia, with share of LNG increasing from 39% in 2016 to 59% in 2040 of the total gas consumption.
He summarized the presentation by highlighting the need to address issues related to climate change, achieving universal energy access and improve air quality which will be critical in defining a new energy strategy for sustainable development.
The presentation invoked a lot of interest among
participants and provided an excellent opportunity to all the participants to understand the future energy dynamics, its drivers and seek clarifications.
Mr. R. Bahl, Director (Finance, Taxation & Legal), FIPI delivering the Concluding Remarks
Presentation on “Energy Outlook” by Mr. Tim GouldFederation of Indian Petroleum Industry (FIPI)
organized a program on 07 December, 2017, at New Delhi, where a presentation was delivered on “Global Energy Outlook” by Mr. Tim Gould, Head of Energy Supply Division, International Energy Agency (IEA). The program was organized primarily with the objective of understanding the future global dynamics of demand and supply of energy and the fundamentals that are driving the shift in energy mix.
Mr. Gould in his presentation highlighted that, there are four large-scale upheavals in global energy
scene which will set the new energy outlook. These four factors are:• The United States is turning into the undisputed
global leader for oil & gas production backed by shale revolution.
• Solar Photovoltaic is on track to be the cheapest source of new electricity in many countries, which is leading to a shift in energy mix of the world with higher share given to renewables.
• China’s new economic model & cleaner power mix is recasting its role in energy
Dr. R. K. Malhotra, DG FIPI delivering the welcome address and opening remarks
Mr. Tim Gould delivering the presentation on World Energy Outlook 2017
A section of Participants

57
introduce BS VI compliant fuels in National Capital
Territory from April 2018. OMCs have also been asked to examine the possibility of introduction of BS-VI auto fuels in the whole of NCR area w.e.f. 01.04.2019.
Current BS VI petrol specifications envisage
requirement of 91 octane (RON). The higher octane quality of the fuel is required in high compression engines for smooth ignition of fuel which help in improving the fuel efficiency. Indian automobile manufacturers, in line with the European trends and also to comply with fuel efficiency norms proposed
Federation of Indian Petroleum Industry (FIPI) and Asian Clean Fuel Association (ACFA), Singapore
organised a fuel quality workshop on moving towards high octane petrol in India: beyond 2020 on November 21, 2017 at New Delhi. The aim was to deliberate on the options available for shifting to 95 RON petrol production in due course.
India is leapfrogging to BS VI emission standards compliant auto-fuels by April 2020 when these fuels will be rolled out on all India basis. In view of the serious air pollution problem in NCR, MoP&NG in consultation with OMCs has already decided to
Mr. Sandeep Poundrik, Joint Secretary (R), Ministry of Petroleum & Natural Gas, Govt. of India delivering the
inaugural address
Dr. Partha Maitra, President-LT Initiative, RIL delivering his presentation on ‘Gasoline Maximization Strategy’
Mr. Anoop Bhat, Vice President, Maruti Suzuki India Limited giving his presentation on ‘Gasoline Fuel - RON - Industry
Prespecive’Mr. Clarence Woo, Executive Director, ACFA address the
participants
Mr. Brij Behari Chief General Manager (T), Indian Oil Corporation Ltd giving his presentation on ‘MS QUALITY UPGRADATION-
Challenges and Approach for 95 RON beyond 2020’Dr. R.K. Malhotra, Director General, FIPI welcoming the participants
Fuel Quality Workshop on ‘Moving Towards High Quality Requirements in India: Beyond 2020’

58
by the Bureau of Energy Efficiency, are planning to roll out vehicles with engines which may need 95 RON petrol. Automobiles manufacturers, therefore, desired that 95 RON petrol only be supplied. It may be mentioned that OMCs are currently marketing limited volumes of 95 RON petrol in Indian market to meet the requirement of imported cars.
Shri Sandeep Poundrik, Joint Secretary (Refineries), Ministry of Petroleum & Natural Gas in his Inaugural Address mentioned that the workshop is being held at a very appropriate time when the country is leapfrogging from BS IV to BS VI fuels within a short period of 3 years. He congratulated Indian refineries and marketing companies for smooth transition to BS IV fuel supply all over India from April, 2017. He expressed confidence that oil companies will also achieve the target of BS VI fuel for which refineries are making investment of
Rs. 28,000 crore. He highlighted the role of auto fuel quality for emission control and informed that the decision of the Government for advancing the roll out of BS VI fuels in national capital territory by April 2018 has been taken with a view to reduce the vehicular pollution in Delhi.
On the issue of increasing RON of BS VI petrol from 91 to 95, he stated that the same was not found feasible because any increase of octane will impact the production of LPG in refineries. As Govt. has prioritized the supply of LPG to rural households its consumption is steadily increasing. He, therefore, desired that this workshop should deliberate on the production of 95 RON through various other options including the impact of ethanol blending which so far was only on account of environmental considerations only.
Experts from other countries presented the best practices adopted elsewhere for improving octane
Dr. Hendrik Fischer, Product Stewardship, EvonikEFOA delivering the presentation on ‘EU Fuel Standards and Fuel
Ethers Contribution’
quality of fuel in a cost effective manner. During the workshop, Indian Refiners informed that while it may be relatively easier to shift to 95 RON petrol in new
big size refineries, it calls for specific solution for old refineries due to the technological configurations. The refineries also currently have the priority to supply BS VI fuel from April 2020 all over the country to tackle the serious problem of vehicular pollution for which they already have on-going projects. However, the OMCs are actively examining various
options and will keep on increasing the supply of 95 RON petrol as the demand grows in line with the production of advanced vehicles and will switch over completely to such grade at the earliest.
Mr. John Paisie, Executive Vice President, Stratas Advisor delivering his presentation on ‘Assessment of Indian Gasoline
Market and the Role of MTBE ’
Mr. N.K. Bansal, Director (Oil Refining & Marketing), FIPI delivering the Valedictory address

59
Mr. Rajiv Bahl, Director (Finance, Taxation & Legal), FIPI delivering the
welcome address and opening remarks
P.K. Jain addressing the gatheringMr. Harishanker Subramaniam giving the overview and approach on the GST
(L-R) Mr. Rajiv Bahl, Director (Finance, Taxation & Legal), FIPI, Dr. R. K. Malhotra,
Director General, FIPI; Mr. P. K. Jain, Director General, Directorate General
of Audit; Mr. Harishanker Subramaniam, Indirect Tax leader, EY; Mr. S. Rath,
Member, PNGRB
Symposium on Impact of GST on Oil & Gas sectorFederation of Indian Petroleum Industry (FIPI) organized a workshop on the impact of Goods & Services Tax (GST) on the Oil and Gas Sector in association with its knowledge partner, EY on December 06, 2017 at New Delhi. The workshop was organized primarily with the objective of understanding and analyzing the collective impact of GST on the oil & gas sector. The aim of the symposium was to highlight the core issues affecting the sector and deliberate on the possible resolution for the same by taking it up with the government.
Mr. Rajiv Bahl, Director (Finance, Taxation & Legal), FIPI welcomed the participants and emphasized on the opportune timing of the symposium. Mr. Abhishek Jain, Partner Indirect Tax, EY and Mr. Achal Chawla, Partner Tax & Regulatory Services, EY presented to the roundtable for deliberation and clarification, the various issues that had cropped up due to the new GST law. The roundtable was moderated by Mr. Harishanker Subramaniam, Indirect Tax Leader, EY. The roundtable was chaired by Mr. P.K. Jain, Chief Commissioner, (AR), CBEC who resolved the queries of the participants while also encouraging the industry members to submit representations on issues that were affecting them.
The roundtable invoked an intense debate and provided an excellent opportunity to all the participants to raise their queries and seek clarification.
Mr. Abishek Jain, Partner Indirect Tax, EY delivering the presentation on
‘Impact of GST on oil and gas sector’
Mr. Achal Chawala, Partner Tax & Regulatory Services, EY delivering the presentation on ‘Impact of GST on oil
and gas sector’

60
highlighted the efforts PLL is making in making LNG as a mainstream fuel by introducing LNG bus and working towards development of LNG corridors for heavy duty vehicles. He also asked the participant for out of the box ideas for LNG supply vessels worldwide to be connected to a platform and the travel time, in line with Uber, Ola etc.
Dr R K Malhotra, Director General, FIPI addressed the gathering. In his address he mentioned that the worldwide average of natural gas consumption is around 24% of primary energy mix and India stands pretty low with share of natural gas at 6.2% in the year 2016. LNG imports have increased significantly from 11.8 BCM in year 2009-10 to
24.7 BCM in 2016-17, making India as the 4th largest LNG importer in 2016. India has targets to increase its natural gas pipelines infrastructure from existing 17,000 km and capacity of around 430 MMSCMD to 31,000 km with a design capacity of 782 MMSCMD by end of 2022 with a nationwide gas grid and more uniformed pipeline network coverage in place. With such growth figures, the need & development of regasification infrastructure
in India is a must which will act as a key link for flow of natural gas to growing energy demand in India.
Workshop on A to Z of Natural Gas & LNGFederation of Indian Petroleum Industry in collaboration
with Petronet LNG Ltd organized a residential Workshop on ‘A to Z of Natural Gas and LNG’ from 28th-30th November 2017 at Petronet LNG Terminal, Kochi which is 6th in series & 2nd at Kochi. The program was conducted by experts from the industry and designed for the teaching faculty of Engineering Colleges, Universities and Industry managers.
The workshop was attended by 41 participants, which consists of 12 faculty from academic institutions viz. Jawaharlal Nehru Technological
University, Kakinada, NIT Warangal, IIT Madras, College of Engineering Trivandrum and School of Engineering CUSAT, Kochi and 29 executives from major oil and gas companies like ONGC, Oil India, GAIL (India) Ltd , BPCL, HPCL, Essar Oil Ltd and KEI-RSOS Petroleum & Energy Ltd.
In the inaugural Session, Mr Hemant Bahura, GM (HR & Admin), PLL welcomed the august gathering and briefed about the workshop and its objectives. The workshop was inaugurated by Mr. Prabhat Singh, MD & CEO, Petronet LNG. In his address he mentioned the growth story of LNG imports in India and the role PLL is playing in this value chain. He
Dr. R K Malhotra, Director General, FIPI addressing the participants.
Mr. Prabhat Singh, MD & CEO, Petronet LNG Ltd giving the inaugural address.
A section of participants.
Mr. S. Rath, Director (E&P), FIPI delivering the presentation on ‘Oil & Gas Scenario: Global and India’.

61
Mr S Rath, Director (E&P) proposed vote of thanks on the occasion and thanked PLL for their continued co-operation.
The workshop had ten lectures during nine sessions
and a half day visit to Petronet LNG’s Kochi Terminal for the participants. Since the theme of the program was A to Z, every topic pertaining to LNG was
Group photograph.
touched upon by the industry experts during their lectures.
Mr Suresh Mathur, Founding CEO &MD chaired the Valedictory Session and the panelists were Mr R. Singh, Director (Tech) PLL, Mr T. N. Neelakantan, VP & Plant Head Kochi Terminal and Mr S. Rath, Director (E&P) FIPI. Shri Mathur shared his experience of starting PLL from scratch to commission and the leadership role played by his team. At the end there was a feedback session.
The feedback of participants was excellent. Few of the suggestion are given below for consideration while finalizing the contact for next workshop.
• To incorporate a module on pricing of LNG (commercial aspects)
• FIPI to arrange specialized lecture on Design of LNG tanks, the process of course of LNG in Engineering Collages.

62
Conference on ‘Realizing Hydrocarbon Vision 2030 for North East India’Oil and gas exploration in India dates back to the
19th century, when production commenced at Digboi in Assam. Even today, Assam contributes about 12% of the country’s total crude oil and 8.7%
of country’s natural gas production on a 5 year average. Since then, the national oil companies have added substantial hydrocarbon reserves, acquired production technical knowhow and made large
investments to manage complex reservoirs in the north-eastern region.
The Hydrocarbon Vision 2030 for North East India document was launched by the government of
Mr. S. Rath, Director(E&P), FIPI welcoming the participants
India in February, 2016 and it aims to prepare a roadmap till 2030 to increase the production of oil and gas in northeast India and outline the necessary investment in the hydrocarbon sector to increase exploration activities, expand the piped natural gas (PNG) network and ensure availability of petroleum products, including LPG, in the remotest corners of
the region. The vision aims at doubling oil & gas production by 2030, making clean fuels accessible, fast track projects, generating employment opportunities and promoting cooperation with neighbouring countries.
The conference on “Realizing Hydrocarbon Vision
2030 for North East India – Way Ahead” was held during 2nd – 3rd November, 2017 at Kaziranga, Assam. The conference was attended by senior level officials both from industry as well as Government.
The key speakers during the session include:
• Shri Anil Kumar Jain, IAS Additional Secretary, MoEF & CC, Govt. of India
• Shri. Utpal Bora, CMD, OIL
• Shri. V P Mahawar, Director (Onshore), ONGC
• Shri. Padmanabhan, ex-Managing Director, NRL
Lighting of lamp
Mr. Utpal Bora, CMD Oil India delivering his keynote address on ‘E&P outlook for North East’
Mr. S. M.Vaidya, Executive Director, IOCL delivering the address on ‘Downstream & midstream outlook for
North East’.
Mr. V. P. Mahawar, Director(onshore) delivering the keynote address on ‘Oil & Gas Production Outlook’

63
concerns for carrying out exploration activities. The speakers opined that there is a huge potential of
carrying out exploration activities in regions of Manipur, Nagaland & Mizoram which can act as
future hydrocarbon potential areas of North East India.
A special emphasis was given by the speakers on sharing of specialized services used by various players in Oil & Gas industry for the optimization of resources. In order to enhance production from the non-flowing wells in the North East region, a mechanism should be developed wherein, on pilot basis such wells may be handed over to service providers to implement advanced technologies for their monetization and incentives to such service providers can be linked to the performance. Government of India is looking towards North East India as a gateway for South East Asian Nations and in the same line the players in Oil & Gas industry must come forward with proper development strategy for Realizing Hydrocarbon Vision 2030.
• Dr. P. Chandrasekaran, Director (E&D), OIL
• Shri P. Elango, Managing Director, HOEC
During the opening session various speakers gave
emphasis on doubling production of hydrocarbons by 2030 from North East region by inducting state of the art technology. The speakers mentioned that
there has been challenge to work in North East region due to difficult terrain and is one of the major
Mr. S. K. Barua, MD NRL talking on ‘An overview on expansion plan of NRL – Vision 2030’
Session on ‘Exploration – Production & Environment’ chaired by Mr. V. P. Mahawar, Director (Onshore) ONGC and Co-
chair by Mr. S. Rath, Director(E&P), FIPI
. Session on ‘Marketing, Pipeline and Safety’ chaired by Mr. S. K Satija, Executive Director, IOCL-PPL-ER and co-chair
by Ms. Shukla Mistry, CGM (T), IOCL-AOD

64
Producing 9% Of India’s
Refining Output
India’s Largest Private Sectors Retail Network
India’s Largest CBM Gas Producer
Investing In Our Future
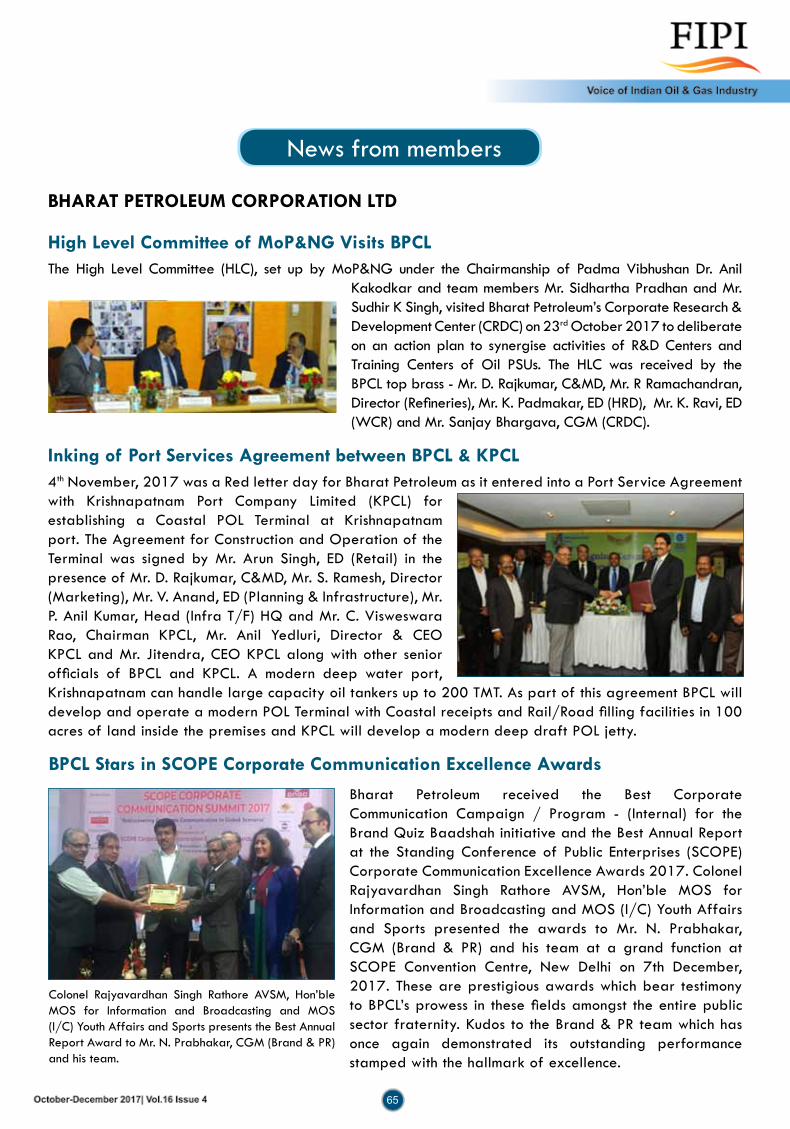
65
High Level Committee of MoP&NG Visits BPCLThe High Level Committee (HLC), set up by MoP&NG under the Chairmanship of Padma Vibhushan Dr. Anil
Kakodkar and team members Mr. Sidhartha Pradhan and Mr. Sudhir K Singh, visited Bharat Petroleum’s Corporate Research & Development Center (CRDC) on 23rd October 2017 to deliberate on an action plan to synergise activities of R&D Centers and Training Centers of Oil PSUs. The HLC was received by the BPCL top brass - Mr. D. Rajkumar, C&MD, Mr. R Ramachandran, Director (Refineries), Mr. K. Padmakar, ED (HRD), Mr. K. Ravi, ED (WCR) and Mr. Sanjay Bhargava, CGM (CRDC).
Inking of Port Services Agreement between BPCL & KPCL4th November, 2017 was a Red letter day for Bharat Petroleum as it entered into a Port Service Agreement with Krishnapatnam Port Company Limited (KPCL) for establishing a Coastal POL Terminal at Krishnapatnam port. The Agreement for Construction and Operation of the Terminal was signed by Mr. Arun Singh, ED (Retail) in the presence of Mr. D. Rajkumar, C&MD, Mr. S. Ramesh, Director (Marketing), Mr. V. Anand, ED (Planning & Infrastructure), Mr. P. Anil Kumar, Head (Infra T/F) HQ and Mr. C. Visweswara Rao, Chairman KPCL, Mr. Anil Yedluri, Director & CEO KPCL and Mr. Jitendra, CEO KPCL along with other senior officials of BPCL and KPCL. A modern deep water port, Krishnapatnam can handle large capacity oil tankers up to 200 TMT. As part of this agreement BPCL will develop and operate a modern POL Terminal with Coastal receipts and Rail/Road filling facilities in 100 acres of land inside the premises and KPCL will develop a modern deep draft POL jetty.
BHARAT PETROLEUM CORPORATION LTD
BPCL Stars in SCOPE Corporate Communication Excellence Awards
Colonel Rajyavardhan Singh Rathore AVSM, Hon’ble MOS for Information and Broadcasting and MOS (I/C) Youth Affairs and Sports presents the Best Annual Report Award to Mr. N. Prabhakar, CGM (Brand & PR) and his team.
Bharat Petroleum received the Best Corporate Communication Campaign / Program - (Internal) for the Brand Quiz Baadshah initiative and the Best Annual Report at the Standing Conference of Public Enterprises (SCOPE) Corporate Communication Excellence Awards 2017. Colonel Rajyavardhan Singh Rathore AVSM, Hon’ble MOS for Information and Broadcasting and MOS (I/C) Youth Affairs and Sports presented the awards to Mr. N. Prabhakar, CGM (Brand & PR) and his team at a grand function at SCOPE Convention Centre, New Delhi on 7th December, 2017. These are prestigious awards which bear testimony to BPCL’s prowess in these fields amongst the entire public sector fraternity. Kudos to the Brand & PR team which has once again demonstrated its outstanding performance stamped with the hallmark of excellence.
News from members

66
A brilliant innovation at Bharat Petroleum’s Mumbai Refinery by Mrs. K. Shreya, Mr. P.A. Shanware and their team resulted in making India the first in the history of refining to produce stringent quality hexane as a byproduct along with isomerate – a motor spirit (MS) blend component - from its Isomerization unit. This unit has the world’s first top divided wall column ! Semi regeneration reformer at Mumbai Refinery was being revamped into an isomerization unit to take India on the road of total Bharat Stage (BS) IV MS sufficiency. Mumbai Refinery chose to incorporate a divided wall column in the design of the unit. The high energy saving potential, 27%, as compared
to a multi column system gave the final push in this decision. This is also in line with the requirement of being a refinery in ‘quartile one’.
BPCL’s Integrated Data Center (IDC)’s case study - “Advanced Racks And Energy Management in Data Center” submitted by Ankit Nigam (Asst.Manager, IDC) was adjudged as the Winner amongst 200 tough competitors in “Data Center – Energy Efficiency” category of awards organized by UBS Transformance at JW Marriot, Mumbai on 3rd November 2017.
IDC serves as the Disaster Recovery (DR) Center for BPCL for the past 14 years providing Data Center (DC) services with high availability. The IDC team has successfully completed the project of ‘Installing Intelligent Racks with IP-PDU’ in year 2017-18. These intelligent racks provide real time information on power consumption, temperature and humidity of each rack in IDC which assists in continuous monitoring of power consumption at rack level and also capacity planning in future. IDC also recently won an Award in DC Infrastructure Design category for High Availability Tier III ready designed Data Center.
BPCL’s Kochi Refinery bags Kerala State Productivity Award for 2015-16
Bharat Petroleum’s IDC Wins Data Centre Awards
A brilliant innovation at Bharat Petroleum’s Mumbai Refinery by Mrs. K. Shreya, Mr. P.A. Shanware and their team resulted in making India the first in the history of refining to produce stringent quality hexane as a byproduct along with isomerate – a motor spirit (MS) blend component - from its Isomerization unit. This unit has the world’s first top divided wall column ! Semi regeneration reformer at Mumbai Refinery was being revamped into an isomerization unit to take India on the road of total Bharat Stage (BS) IV MS sufficiency. Mumbai Refinery chose to incorporate a divided wall column in the design of the unit. The high energy saving potential, 27%, as compared to a multi column system gave the final push in this decision. This is also in line with the requirement of being a refinery in ‘quartile one’.
First in the World ‘Top Divided Wall Column’ at BPCL Mumbai Refinery

67
HPCL bags INDIASTAR 2017 Award for Excellence in Packaging
HPCL Vigilance Department conferred with “Vigilance Excellence Award-2017”
HPCL has been conferred with the prestigious INDIASTAR 2017 Award, for excellence in Packaging for ‘Shipper Cum Display Pack’ for our Racer Synth premium four stroke bike engine oil.
The INDIASTAR award is presented for excellence in the field of packaging in India by the Indian Institute of Packaging (IIP). HPCL was selected for this Innovation Award in Packaging from a list of 622 entries received from all over India. The jury consisted of eminent personnel from Institutions, Government Bodies, Consumer Forum, BIS and experts from the Industry.
HPCL’s Shipper cum Display pack carries 10 bottles of Racer Synth, 800ml SKU size in a colored carton and after shipment to the end ‘Point of Sale’ can be converted to a display pack on the merchandise. The carton pack was conceptualized and developed in-house by Direct Sales Packaging Team. Notably, the team has won five INDIASTAR awards since 2012.
HPCL Vigilance Department has been conferred with the prestigious “Vigilance Excellence Award-2017” in the ‘outstanding’ category instituted by the Central Vigilance Commission for CPSEs, PSBs, Ministries and Departments. The selection of award winners was done by a high level Committee of the CVC.
The Commission’s objective of the award is to encourage and motivate organizations for bringing out innovative ideas of anti-corruption measures; recognize individuals and teams for their resourcefulness and perseverance in turning concepts into reality; documentation process enabling replication and
knowledge sharing for propagation of innovations to other organizations.
The coveted award was received by HPCL’s CVO, Shri U. Krishna Murty at the hands of Hon’ble Vice President of India, Shri Venkaiah Naidu in the presence of Hon’ble Minister of State for Prime Minister Office and Personnel, Public Grievances & Pensions, Dr. Jitendra Singh, Central Vigilance Commissioner, Shri K. V. Chowdary and other dignitaries during the inaugural function of Vigilance Awareness Week 2017 held at Vigyan Bhavan, New Delhi.
HINDUSTAN PETROLEUM CORPORATION LTD
HPCL conferred with Golden Peacock Award for Sustainability 2017HPCL has been declared as the Winner of the Golden Peacock Award for Sustainability 2017. The award nomination highlighted the company’s performance on economic, environmental and social aspects and various initiatives on energy efficiency, water management, emission reduction, waste management, health & safety, CSR, etc.
HPCL was selected from 207 responses received for the Golden Peacock Awards 2017, out of which 109 applications were shortlisted for final selection by an eminent jury comprising of corporate governance and sustainability experts. The assessment process was held under the chairmanship of Justice (Dr.) Arijit Pasayat, Former Judge, Supreme Court of India.
The award was received during the 17th London Global Convention on Corporate Governance & Sustainability held recently in London. The award was received by Shri K. Ananda Rao, CGM – HSE, HPCL at the hands of Hon’ble Chief Minister of Andhra Pradesh, Shri N. Chandrababu Naidu.
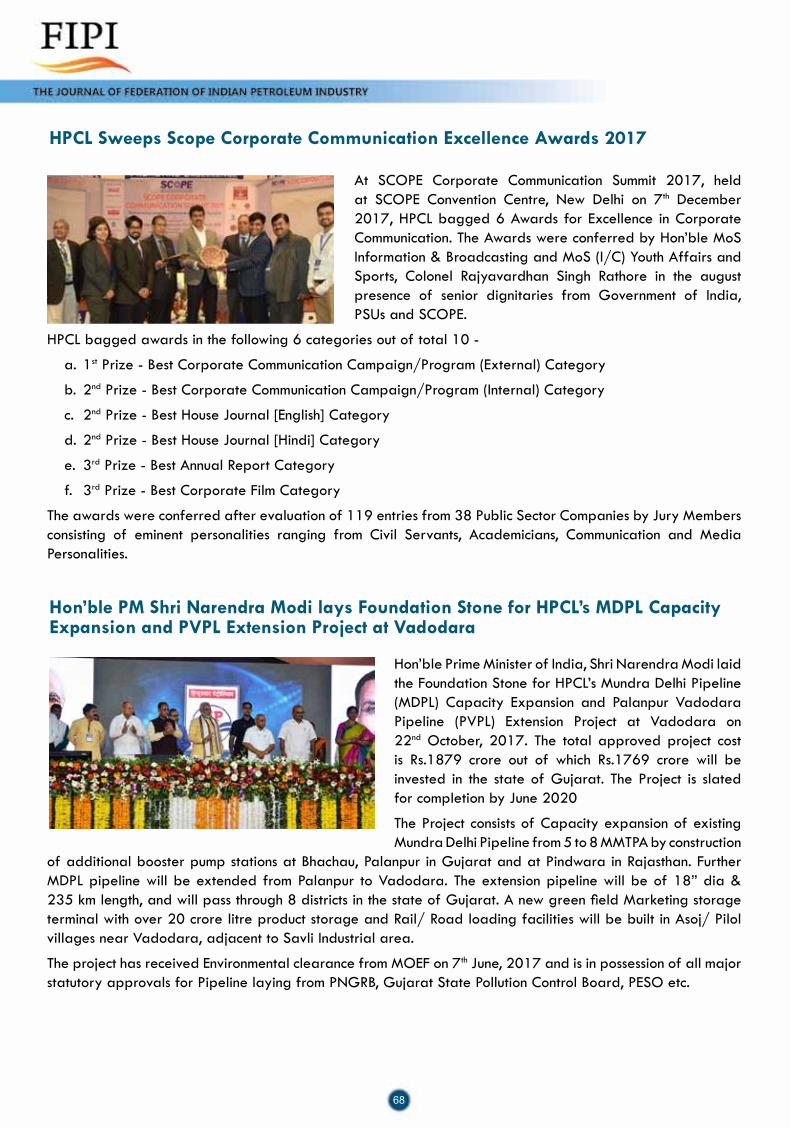
68
Hon’ble Prime Minister of India, Shri Narendra Modi laid the Foundation Stone for HPCL’s Mundra Delhi Pipeline (MDPL) Capacity Expansion and Palanpur Vadodara Pipeline (PVPL) Extension Project at Vadodara on 22nd October, 2017. The total approved project cost is Rs.1879 crore out of which Rs.1769 crore will be invested in the state of Gujarat. The Project is slated for completion by June 2020
The Project consists of Capacity expansion of existing Mundra Delhi Pipeline from 5 to 8 MMTPA by construction
of additional booster pump stations at Bhachau, Palanpur in Gujarat and at Pindwara in Rajasthan. Further MDPL pipeline will be extended from Palanpur to Vadodara. The extension pipeline will be of 18” dia & 235 km length, and will pass through 8 districts in the state of Gujarat. A new green field Marketing storage terminal with over 20 crore litre product storage and Rail/ Road loading facilities will be built in Asoj/ Pilol villages near Vadodara, adjacent to Savli Industrial area.
The project has received Environmental clearance from MOEF on 7th June, 2017 and is in possession of all major statutory approvals for Pipeline laying from PNGRB, Gujarat State Pollution Control Board, PESO etc.
HPCL Sweeps Scope Corporate Communication Excellence Awards 2017
At SCOPE Corporate Communication Summit 2017, held at SCOPE Convention Centre, New Delhi on 7th December 2017, HPCL bagged 6 Awards for Excellence in Corporate Communication. The Awards were conferred by Hon’ble MoS Information & Broadcasting and MoS (I/C) Youth Affairs and Sports, Colonel Rajyavardhan Singh Rathore in the august presence of senior dignitaries from Government of India, PSUs and SCOPE.
HPCL bagged awards in the following 6 categories out of total 10 -
a. 1st Prize - Best Corporate Communication Campaign/Program (External) Category
b. 2nd Prize - Best Corporate Communication Campaign/Program (Internal) Category
c. 2nd Prize - Best House Journal [English] Category
d. 2nd Prize - Best House Journal [Hindi] Category
e. 3rd Prize - Best Annual Report Category
f. 3rd Prize - Best Corporate Film Category
The awards were conferred after evaluation of 119 entries from 38 Public Sector Companies by Jury Members consisting of eminent personalities ranging from Civil Servants, Academicians, Communication and Media Personalities.
Hon’ble PM Shri Narendra Modi lays Foundation Stone for HPCL’s MDPL Capacity Expansion and PVPL Extension Project at Vadodara
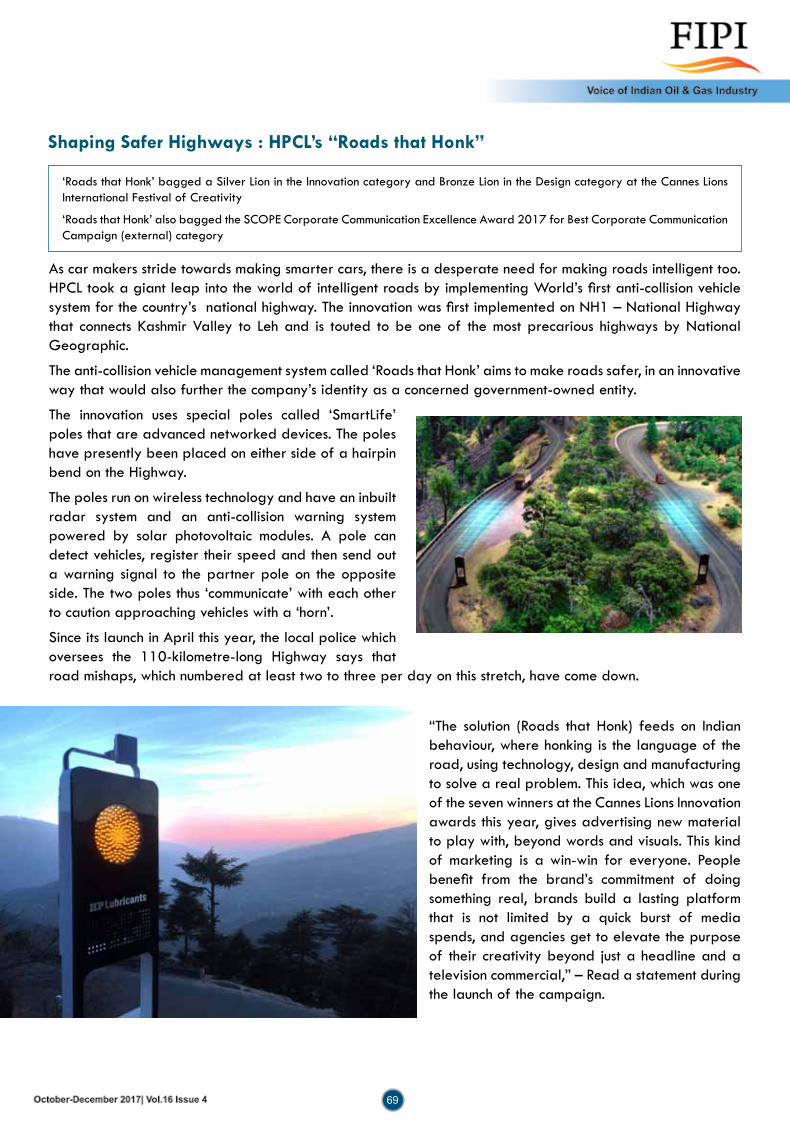
69
Shaping Safer Highways : HPCL’s “Roads that Honk”
‘Roads that Honk’ bagged a Silver Lion in the Innovation category and Bronze Lion in the Design category at the Cannes Lions International Festival of Creativity
‘Roads that Honk’ also bagged the SCOPE Corporate Communication Excellence Award 2017 for Best Corporate Communication Campaign (external) category
As car makers stride towards making smarter cars, there is a desperate need for making roads intelligent too. HPCL took a giant leap into the world of intelligent roads by implementing World’s first anti-collision vehicle system for the country’s national highway. The innovation was first implemented on NH1 – National Highway that connects Kashmir Valley to Leh and is touted to be one of the most precarious highways by National Geographic.
The anti-collision vehicle management system called ‘Roads that Honk’ aims to make roads safer, in an innovative way that would also further the company’s identity as a concerned government-owned entity.
The innovation uses special poles called ‘SmartLife’ poles that are advanced networked devices. The poles have presently been placed on either side of a hairpin bend on the Highway.
The poles run on wireless technology and have an inbuilt radar system and an anti-collision warning system powered by solar photovoltaic modules. A pole can detect vehicles, register their speed and then send out a warning signal to the partner pole on the opposite side. The two poles thus ‘communicate’ with each other to caution approaching vehicles with a ‘horn’.
Since its launch in April this year, the local police which oversees the 110-kilometre-long Highway says that road mishaps, which numbered at least two to three per day on this stretch, have come down.
“The solution (Roads that Honk) feeds on Indian behaviour, where honking is the language of the road, using technology, design and manufacturing to solve a real problem. This idea, which was one of the seven winners at the Cannes Lions Innovation awards this year, gives advertising new material to play with, beyond words and visuals. This kind of marketing is a win-win for everyone. People benefit from the brand’s commitment of doing something real, brands build a lasting platform that is not limited by a quick burst of media spends, and agencies get to elevate the purpose of their creativity beyond just a headline and a television commercial,” – Read a statement during the launch of the campaign.

70
MANGALORE REFINERY & PETROCHEMICALS LTD.
MRPL Kaushal Vikas Kendra As a part of its Skill development initiatives, Mangalore Refinery and Petrochemicals Ltd. (MRPL) has launched “MRPL Kaushal Vikas Kendra. In this program, youth from the surrounding villages from around the
refinery are trained in selected trades for a period of about four months and on successful completion of the training, they are provided with job placement offers. All the expenses including food, lodging, tutorial expenses, clothing in the form of uniform, is borne by MRPL Kaushal Vikas Kendra during the training period.
MRPL has tied up with Nettur Technical Training Foundation (NTTF), Bangalore for providing the training. In the first batch, 57 candidates have been trained in the “Industrial Electrician” and “CNC Operator – Turning” trades and on successful completion, all of them have been provided with job offers.
The second batch of training has commenced in October 2017 and currently 22 trainees are undergoing training in “CNC operator - Vertical Machining Centre” and “Through Hole assembly operator”.
( In the photograph, Certificate of Placement is being handed over to a successful trainee by Shri H.Kumar, Managing Director, MRPL. In the left, Shri M.Venkatesh, Director(Refinery), MRPL and Shri N.Reguraj, MD-NTTF in the right are also seen.)

71
Mr. Shashi Shanker has taken over as the Chairman and Managing Director of Oil and Natural Gas Corporation Limited (ONGC) on 1 October 2017. Mr. Shanker is on the Board of ONGC since 2012.
Mr Shanker is an industry veteran with over 30 years of experience in diverse E&P activities. He is a Petroleum Engineer from Indian School of Mines (ISM), Dhanbad. He also holds an MBA degree with specialisation in Finance. He has also received executive education from prestigious Indian Institute of Management, Lucknow and Indian School of Business, Hyderabad.
Prior to his appointment as Director (T&FS) in 2012, he has progressed through senior management roles in various work-centers including Institute of Drilling Technology, Dehradun; West Bengal Project; Assam Project and Deep Water group at Mumbai. He was acclaimed for his performance in spearheading the deep/ultra-deep water campaign of ONGC which was christened ‘Sagar Samriddhhi’.
Shashi Shanker takes over as CMD
of ONGC
D.K. Sarraf appointed as Chairman
PNGRB
Mr. D.K. Sarraf, who superannuated as the CMD of Oil and Natural Gas Corporation Ltd, has been appointed to head the Petroleum and Natural Gas Regulatory Board (PNGRB) by the Appointments Committee of the Cabinet.
Mr. Sarraf graduated in Commerce from Delhi University and did his post-graduation from the same University. He is an associate member of the Institute of Cost and Works Accountants of India and the Institute of Company Secretaries of India. He has experience of over three and half decades in the oil and gas industry, having started his oil and gas career in Oil India Ltd. He joined ONGC in 1991 and handled various key assignments at corporate offices. He was elevated to the post of Director (Finance) in ONGC Videsh in 2005 where he served till 2007. In December 2007, he joined back ONGC as Director (Finance). In 2011, Mr. Sarraf went back to ONGC Videsh, assuming the charge of Managing Director. In March, 2014, he was selected as CMD of ONGC.
New Appointments
S. Rath appointed as member
of PNGRB
Mr. S Rath, former Director (Operations), Oil India Ltd. and Director (E&P), FIPI has been appointed as a member of Petroleum and Natural Gas Regulatory Board (PNGRB).
Mr. Rath is an upstream petroleum professional with the right blend of experience and expertise in the oil & gas industry. He has more than 35 years of experience across diverse geographies and functions, with Indian Navaratna NOC –Oil India Ltd. As director (Operations), he was responsible for Company’s drilling, production (crude oil, natural gas and LPG), commercial and also its pipeline business from 2011-2015. Additionally he was in charge of the health, safety and environmental aspects of the Company.
Prior to joining PNGRB he was with Federation of Indian Petroleum Industry (FIPI) as its Director (Exploration & Production) since October 2015.

72
: For prompt action on any Oil & Gas related query, please contact /MoPNGeSeva | /MoPNG_eSeva
/hpcl74 | /hpcl | /hpcl74www.hindustanpetroleum.com

73
: For prompt action on any Oil & Gas related query, please contact /MoPNGeSeva | /MoPNG_eSeva
/hpcl74 | /hpcl | /hpcl74www.hindustanpetroleum.com
2013-14 2014-15 2015-16 2016-17 April-Sept 2017Qty. % of Total
On Shore
ONGC 6.71 6.07 5.82 5.93 3.02 34.44OIL 3.47 3.41 3.23 3.26 1.69 19.27Pvt./ JV (PSC) 9.41 9.06 8.81 8.40 4.06 46.29Sub Total 19.59 18.54 17.86 17.59 8.77 100
Off Shore
ONGC 15.54 16.19 16.54 16.28 8.28 89.51OIL 0 0 0 0 0 0.00Pvt./ JV (PSC) 2.66 2.73 2.55 2.14 0.97 10.49Sub Total 18.2 18.92 19.09 18.42 9.25 100.00
Source : PIB/PPAC
Source:PPAC
Statistics
INDIA: OIL & GAS
Domestic Oil Production (Million MT)
Oil Import - Volume and Value
Total Domestic Production 37.79 37.46 36.95 36.01 18.02 100ONGC 22.25 22.26 22.36 22.21 11.3 62.71OIL 3.47 3.41 3.23 3.26 1.69 9.38Pvt./ JV (PSC) 12.07 11.79 11.36 10.54 5.03 27.91
Total Domestic Production
Sub Total 37.79 37.46 36.95 36.01 18.02 100
2013-14 2014-15 2015-16 2016-17 April-Septe 2017
Quantity, Million Mt 189.2 189.4 202.1 181.15 106.77
Value, INR '000 cr. 864.88 687.42 415.36 431.62 241.91
Value, USD Billion 143 112.7 64.4 66.70 37.57
Average conversion Rate, INR per USD (Calculated)
60.48 61.00 64.50 64.71 64.39

74
2013-14 2014-15 2015-16 2016-17 April-Sept 2017Brent (Low Sulphur - LS- marker) (a)
107.5 85.43 47.46 48.65 50.95
Dubai (b) 104.58 83.77 45.63 46.98 50.08Low sulphur-High sulphur differential (a-b)
2.92 1.66 1.83 1.67 0.87
Indian Crude Basket (ICB) 105.52 84.15 46.17 47.16 50.35ICB High Sulphur share % 69.9 72.04 72.28 71.03 72.38ICB Low Sulphur share % 30.1 27.96 27.72 28.97 27.62
Source: PPAC/OPEC
Total Refining Capacity of India 234.5* (4.7 million barrels per day)
* Not include capacity of 6000 TMT of Cuddalore Refinery of Nagarjuna.
Source : PPAC
Oil Import - Price USD / Barrel
REFINING
Refining Capacity (Million MT on 1st April 2017)
Indian Oil Corporation Ltd.
Digboi 0.65
Guwahati 1.00
Koyali 13.70
Barauni 6.00
Haldia 7.50
Mathura 8.00
Panipat 15.00
Bongaigoan 2.35
Pradip 15.00
Total 69.20
Hindustan Petroleum Corp. Ltd.
Mumbai 7.50
Visakhapattnam 8.30
Total 15.80
Other PSU Refineries
NRL, Numaligarh 3.00
MRPL 15.00
ONGC, Tatipaka 0.10
Total PSU Refineries Capacity 139.50
Private Refineries
RIL, Jamnagar 33.00
RIL , (SEZ), Jamnagar 27.00
Essar Oil Ltd. , Jamnagar 20.00
Pvt. Total 80.00
Chennai Petroleum Corp. Ltd.
Chennai 10.50
Narimanam 1.50
Total 12.00
JV RefineriesDBPC, BORL-Bina 6.00HMEL,GGSR 9.00JV Total 15.00
Bharat Petroleum Corp. Ltd.Mumbai 12.00Kochi 12.40Total 24.40

75
PSU Refineries 2013-14 2014-15 2015-16 2016-17 April-Sept 2017IOCL 53.13 53.59 57.19 65.19 33.61HPCL 15.51 16.18 17.23 17.85 9.13BPCL 22.97 23.18 24.09 25.36 13.23CPCL 10.63 10.78 9.63 10.25 5.23MRPL 14.65 14.68 15.6 15.97 7.52NRL 2.61 2.78 2.52 2.69 1.41Sub Total 119.5 121.19 126.26 137.31 70.13
Capacity 0n 01/04/2017 MMT
% Share Crude Processing MMT April-Sept 2017
% Share
PSU Ref 139.50 59.49 70.13 57.32JV. Ref 15.00 6.40 6.49 5.30Pvt. Ref 80.00 34.12 45.73 37.38Total 234.50 100.00 122.35 100
JV Refineries 2013-14 2014-15 2015-16 2016-17 April-Sept 2017
HMEL 9.27 7.34 10.71 10.52 2.86BORL 5.45 6.21 6.4 6.36 3.63Sub Total 14.72 13.55 17.11 16.88 6.49
2013-14 2014-15 2015-16 2016-17 April-Sept 2017All India Crude Processing 222.45 223.27 231.92 245.28 122.35
Pvt. Refineries 2013-14 2014-15 2015-16 2016-17 April-Sept 2017
ESSAR 20.2 20.49 19.11 20.92 10.36RIL 68.03 68.04 69.44 70.17 35.37Sub Total 88.23 88.53 88.55 91.09 45.73
Source : PIB Release/PPAC
Crude Processing (Million MT)
Crude Capacity vs. Processing

76
2013-14 2014-15 2015-16 2016-17 April-Sept 2017
From Refineries 216.44 217.08 227.9 238.96 120.63From Fractionators 3.87 3.65 3.38 4.29 2.24Total 220.31 220.73 231.28 243.25 122.87
2013-14 2014-15 2015-16 2016-17 April-Sept 2017Gasoline crack
Dubai crude based 9.73 11.68 16.09 11.13 12.45Indian crude basket 8.79 11.29 15.55 10.95 12.18
Diesel crackDubai crude based 17.41 15.67 12 11.95 13.24Indian crude basket 16.47 15.28 11.46 11.77 12.98
2013-14 2014-15 2015-16 2016-17 April-Sept 2017
Light Distillates, MMT 58.81 59.54 63.60 67.53 37.15
Middle Distillates , MMT 112.85 113.41 118.31 122.54 61.65
Total Distillates, MMT 171.66 172.95 181.91 190.07 98.8
% Distillates Production on Crude Processing
77.17 77.46 78.43 77.46 80.75
2013-14 2014-15 2015-16 2016-17 April-Sept 2017Gasoline 114.31 95.45 61.72 58.11 62.53Naphtha 100.22 82.22 48.54 47.22 49.61Kero / Jet 121.23 66.62 58.17 58.42 62.12Gas Oil (0.05% Sulphur) 121.99 99.44 57.63 58.93 63.33Dubai crude 104.58 83.77 45.63 46.98 50.08Indian crude basket 105.52 84.16 46.17 47.16 50.35
Source: PIB/PPAC/OPEC
Pol Production (Million MT)
Distillate Production (Million MT)
International Price Ex Singapore, ($/bbl.)
Cracks Spreads ($/ bbl.)

77
GAS
Gas Production/Comsumption/Import
Domestic Gas Price ($/mmbtu)
2013-14 2014-15 2015-16 2016-17 April-Sept 2017
Net Gas Production (MMSCM) 34574 32693 31138 30848 15956LNG Imports (MMSCM) 17728 18536 21309 24686 12446Import Dependency (%) 34 36 41 44 44
Total Gas Consumption (MMSCM)
52302 51229 52447 55534 28402
Period Domestic Gas Price (GCV Basis)
Price Cap for Deepwater, High temp Hingh Pressure Areas
November 14 - March 15 5.05 -April 15 - September 15 4.66 -October 15 - March 16 3.82 -April 16 - September 16 3.06 6.61October 16 - March 17 2.50 5.30April 17- September 17 2.48 5.56October 17 - March 18 2.89 6.30
Source: PPAC
Gas Production (Qty. in MMSCM)
2015-16 2016-17 April-Sept 2017ONGC 21177 22088 11675Oil India 2838 2937 1481Private/ Joint Ventures 8235 6872 3256Total 32250 31897 16412
Ons
hore
2015-16 2016-17 April-Sept 2017Natural Gas 8844.61 9293.88 4950.18CBM 392.87 564.59 333.42Sub Total 9237.48 9858.47 5283.6
Off
shor
e 23011.74 22038.23 11129.3
Sub Total 23011.74 22038.23 11129.3
Total 32249.22 31896.7 16412.9(-) Flare loss 1120.22 1048.7 456.9Net Production 31129 30848 15956

78
Consumption
Availabilty
2015-16 2016-17 April-Sept 2017Net Production 31129 30848 15956Own Consumption 5822.27 5856.01 2899Availabilty 25306.73 24991.99 13057
2015-16 2016-17 April-Sept 2017Total Consumption 46694.73 49677.99 25503Availabilty 25306.73 24991.99 13057LNG Import 21388 24686 12446
2015-16 2016-17 April-Sept 2017ONGC 16076.12 17059.52 9235Oil India 2313.89 2412.09 1222Private/ Joint Ventures 6916.72 5520.38 2600Total 25306.73 24991.99 13057

79

80