moving industry - season 2012
TRANSCRIPT

by www.MyMovingReviews.c
om
The MyMovingReviews.com team, engaged to provide interesting facts about the moving industry, reveals the numbers behind the US moving season for the year of 2012. Let's see what all the numbers coming from the reviews that people wrote and the quotes filled in on their website tell.

Migration FlowsOutbound
StatesConnecticut
DelawareIndiana
IowaKansas
MarylandMassachusetts
MichiganMississippi
MissouriNebraska
New HampshireNew Jersey
New YorkOhio
PennsylvaniaRhode Island
VirginiaWest Virginia
Wisconsin
Inbound StatesArizonaCaliforniaColoradoFloridaGeorgiaIdahoIllinoisNevadaNorth CarolinaOklahomaOregonSouth CarolinaTexasTennesseeWashington

top fi
ve
5routes

top fi
ve
5routes

Show me the money!After revealing the most popular routes in the moving business, let's
see how much, on average, did Americans spend on their move.
San Diego to Seattle1 bedroom - $1800 - $23002 bedroom - $4000 - $4600
L.A. to Vancouver1 bedroom - $2000 - $24002 bedroom - $4200 - $5000
Moving on the West Coast seems to be more expensive. For 2012, prices started from $1800 to $5000 on average.

Show me the money!After revealing the most popular routes in the moving business, let's
see how much, on average, did Americans spend on their move.
L.A. to Austin1 bedroom - $1500 - $23002 bedroom - $4000 - $4500
San Francisco to Austin1 bedroom - $1900 - $25002 bedroom - $4200 - $5100
NYC to L.A.1 bedroom - $3000 - $41002 bedroom - $5000 - $6800
NYC to San Francisco1 bedroom - $3000 - $41002 bedroom - $5000 - $6800
Check out how much did Americans pay for the moving service on average.

Show me the money!After revealing the most popular routes in the moving business, let's
see how much, on average, did Americans spend on their move.
NYC to Miami1 bedroom - $1800 - $22002 bedroom - $3200 - $3600
Boston to NYC1 bedroom - $1600 - $20002 bedroom - $3000 - $3400
Americans who relocated on the East Coast paid from $1600 to $3600 on average, depending on the size of their property.

Top 10 States – Local movesCalifornia New York Texas Florida Massachusetts Illinois Maryland Pennsylvania Virginia New Jersey
California takes first place when it comes to intrastate relocation. We guess Californians like to move it, move it. As a whole, it seems that those living on the East Cost move more often.

Top 10 citiesWhere did people want to move most in the year of 2012?
5 out of the top 10 cities are in California and Texas. Interesting is the case of Los Angeles. The second most populous city in the USA comes to be the sixth most wanted one to move to in 2012 after Houston, TX and Boston, MA. Other milestones that couldn't be overlooked in our top 10 are Atlanta's 8th and Denver's 10th place. With a population of less than a million, these cities seem to have what it takes to attract people.
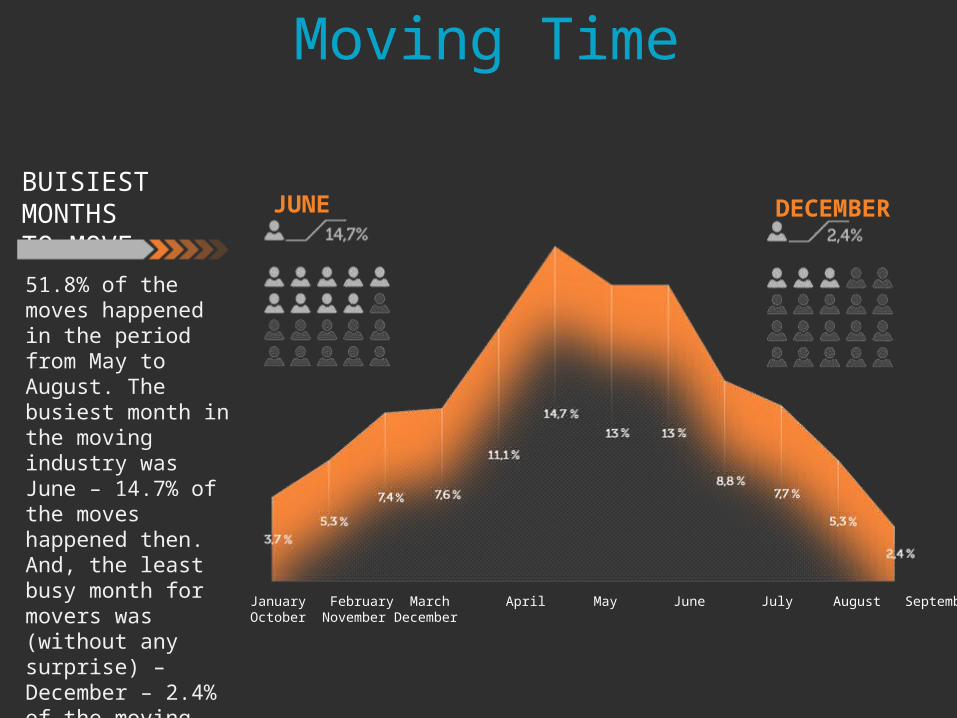
Moving Time
51.8% of the moves happened in the period from May to August. The busiest month in the moving industry was June – 14.7% of the moves happened then. And, the least busy month for movers was (without any surprise) – December – 2.4% of the moving jobs took place in that month.
BUISIEST MONTHS TO MOVE
DECEMBERJUNE
January February March April May June July August September October November December

Moving Time
36.4% of the moves happened during Fridays and Saturdays. On the other hand, Sunday and Tuesday were the least preferred days for a move.
BUISIEST DAYS TO MOVE
20%
18%
16%
14%
12%
10%
8%
6%
4%
2%
0%

Moving Size Data
Partial Home
4 Bedroom
3 Bedroom
1 Bedroom
2 Bedroom
Studio
PROPERTY SIZE
It turns out that the 1-bedroom dwellers move the most. And this should not come as a surprise, as respectively, that size property is the most common one.

Moving Size Data
INTRASTATE vs. INTERSTATE
For every person who moved locally, within the state, two others moved interstate. Actually, 68.7% of the moves were interstate.
10%
25%
5%
15%
20%
0%

Pickup and delivery promptness
PICKUP AND DELIVERY PROMPTNESS
56.7% of the movers managed to arrive on time on moving day, but less than half of the movers kept their agreement and arrived on time to deliver the shipment. 11.1% didn't show up and 34.8% were late. It seems that movers need to work on their punctuality a little more.
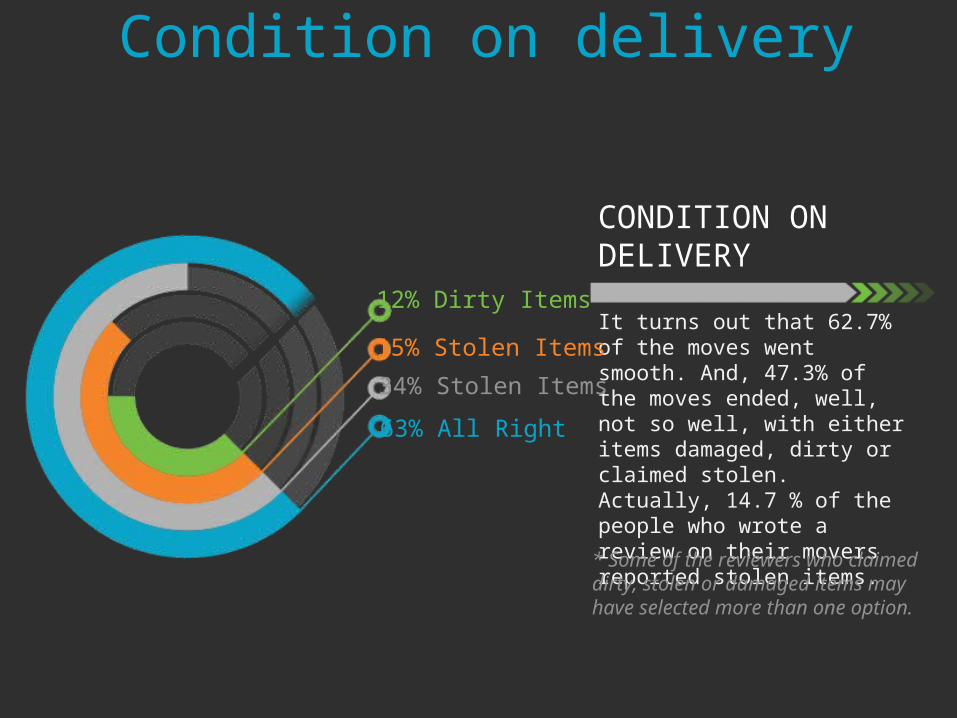
Condition on delivery
CONDITION ON DELIVERY
It turns out that 62.7% of the moves went smooth. And, 47.3% of the moves ended, well, not so well, with either items damaged, dirty or claimed stolen. Actually, 14.7 % of the people who wrote a review on their movers reported stolen items.
* Some of the reviewers who claimed dirty, stolen or damaged items may have selected more than one option.
12% Dirty Items
15% Stolen Items
34% Stolen Items
63% All Right

&
Brought to you by
ReviewsQuotes
SOURCES:
MyMovingReviews.com – Moving QuotesMyMovingReviews.com – Moving Reviews

Scan this QR code with your phone to get the free My Move organizer app
www.MyMovingReviews.com