moveon.pdf
TRANSCRIPT

Electronic copy available at: http://ssrn.com/abstract=1316927
Quarterly Journal of Political Science, 2008, 3: 63–82
Do Community-Based Voter MobilizationCampaigns Work Even in BattlegroundStates? Evaluating the Effectiveness ofMoveOn’s 2004 Outreach Campaign∗Joel A. Middleton and Donald P. Green
Yale University, USA
ABSTRACT
One of the hallmarks of the 2004 presidential election was the unusual emphasis onface-to-face voter mobilization, particularly face-to-face mobilization conductedwithin neighborhoods or social networks. Unlike previous studies of face-to-facevoter mobilization, which have focused largely on nonpartisan campaigns con-ducted during midterm or local elections, this study assesses the effects of acampaign organized by MoveOn.org, an organization that allied itself with theDemocratic Party in 2004 to aid presidential candidate John Kerry. A regressiondiscontinuity analysis of 46,277 voters from 13 swing states demonstrates thatneighbor-to-neighbor mobilization substantially increased turnout among targetvoters during the 2004 presidential election. Contact with MoveOn volunteersincreased turnout by approximately nine percentage-points. This finding corrob-orates experimental findings showing the effectiveness of door-to-door canvassingbut contradicts results suggesting that such mobilization is ineffective in the con-text of high-salience elections.
One of the hallmarks of the 2004 presidential election was the extraordinary emphasisthat campaigns across the political spectrum placed on voter mobilization. Hundreds ofthousands, and possibly millions, of paid and volunteer canvassers conducted get-out-the-vote activities during the final weeks of the campaign. An unprecedented proportion
∗ We would like to thank Terence Leong for his expert help with GIS. We are also grateful to JustinRuben, Adam Ruben, and Randall Farmer at MoveOn who made this study possible.
MS submitted 30 April 2007; final version received 4 February 2008ISSN 1554-0626; DOI 10.1561/100.00007019© 2008 J. A. Middleton and D. P. Green

Electronic copy available at: http://ssrn.com/abstract=1316927
64 Middleton and Green
of National Election Studies respondents (50.4%) reported having been contacted bya campaign, a number that far surpasses any election since the survey began in 1952(Bergan et al. 2006, p. 764). In the end, both parties exceeded their target vote totals,as voter turnout rose from 107.4 million votes in 2000 to over 123.5 million in 2004(McDonald 2007).
The 2004 election is remembered not only for the scale of its get-out-the-vote activ-ities, but also for the manner in which these activities were organized. Republicansrecruited conservative Christians, gun owners, and other pro-Bush social groups as can-vassers of potential Republican voters. Democratic campaigns relied more heavily onpaid canvassers, but large numbers of liberal activists migrated to battleground states aspart of volunteer get-out-the-vote efforts. The net result was that although the campaignfeatured a heavy volume of impersonal communications via television and direct mail,voters in 2004 also received unusually personal and heartfelt appeals on behalf of thepresidential candidates.
How effective were the GOTV campaigns conducted by core activists? Although polit-ical scientists from Rosenstone and Hansen (1993) to Putnam (2000) to Gerber and Green(2000) have long argued that face-to-face canvassing by committed volunteers consti-tutes an effective means for increasing voter turnout, a close look at the evidence revealshow little the discipline knows about the effectiveness of partisan canvassing campaignsduring presidential elections. Since the 1990s, randomized experiments gauging theeffectiveness of canvassing have primarily looked at nonpartisan campaigns conducted inlow-salience elections. Of the experiments that have targeted populations of registeredvoters, Gerber and Green (2000) studied a nonpartisan campaign in an uncompetitive1998 midterm election, and their follow-up studies focused on nonpartisan campaigns inmunicipal elections (Green et al. 2003; Nickerson 2005). Michelson (2003, 2005) studiedLatino voters primarily in municipal elections (exception noted below), while Arceneaux(2005) studied African–American voters in municipal and federal midterm elections.Nickerson et al. (2006) examined a youth-targeted partisan campaign during the 2002midterm election, but the canvassing effort was small. More conclusive is Nickerson’s(2006) study of a large-scale campaign conducted by the Young Democrats of Americaduring the 2005 Virginia gubernatorial election, but again the strong effects of canvassingemerge from a study of voters aged 18–35.
Although these studies are fairly uniform in their conclusion that canvassing increasesthe turnout of those who are reached at their doorsteps, it is not clear whether onecan generalize their findings to partisan presidential campaigns, particularly in light ofthree studies: Bennion’s (2005) study of nonpartisan canvassing in a hotly contestedcongressional district in 2002; Michelson’s (2005) study of a partisan effort targetingLatinos in the California gubernatorial recall election of 2003; and Middleton’s (2007)study in swing states during the 2004 presidential election. None of the studies that tookplace in contentious environments find significant positive canvassing effects, and thefindings have been interpreted to mean that canvassing may be generally ineffective inhigh-salience elections. Given the small number of studies upon which this interpreta-tion is based, the effectiveness of canvassing in high-salience elections remains an openquestion.

Community-Based Voter Mobilization Campaigns Work Even in Battleground States 65
Addressing this question is no mean feat. For fear of losing votes, partisan campaigns inpresidential elections are reluctant to randomize their canvassing efforts in battlegroundstates. One therefore must rely on some type of non-experimental research design. Oneoption is to analyze election survey data, but these have been roundly criticized on thegrounds that campaign contact is endogenous — campaigns target and reach voterswith unusually high voting propensities (Gerber and Green 2000, 2005). An alternativeapproach and one that has received increasing attention in political science is regression-discontinuity analysis (Thislethwaite and Campbell 1960), which takes advantage ofsituations in which geographical boundaries partition otherwise similar neighbors intotreatment and control groups. This approach requires detailed information about themanner in which campaigns targeted and treated individuals living in different areas.Fortunately, we were able to obtain such data from a group that coordinated large-scalecanvassing efforts in several battleground states, MoveOn.org. These data afford us theopportunity to estimate the effects of door-to-door canvassing by comparing across-the-street neighbors who, due to the arrangement of precinct boundaries, fell just inside ofor just outside of areas that MoveOn.org precinct captains canvassed.
MOVEON
MoveOn.org was organized in 1998 during the Clinton impeachment hearings to col-lect signatures for an online petition asking congress to “immediately censure PresidentClinton and MoveOn to pressing issues facing the country (Hafner 1998).” MoveOn col-lected 500,000 online signatures (Evangelista 1998; Hafner 1999) and garnered nationalmedia attention as a result. MoveOn founders chose to continue their operation indefi-nitely, gathering petition signatures for a broad range of liberal and progressive causes(Schemo 2004). MoveOn expanded its repertoire of political activism to include polit-ical fundraising (Feifer 2004; Scott 2004) and the production of documentary films(Grynbaum 2004) and political advertisements (Rutenberg 2004; Hefling 2005). Theseactivities were integrated into a set of community organizing tactics (Packer 2003), asMoveOn sponsored events such as house parties where volunteers hosted other localmembers at their homes and discussed political issues, made advocacy phone calls, orwatched political documentaries.
The goal of MoveOn’s 2004 effort was to increase turnout among supporters ofDemocratic presidential candidate John Kerry. MoveOn worked with a political firm toidentify precinct leaders from membership rolls. Once the precinct leaders were in place,MoveOn’s web interface provided these precinct leaders with voter contact informationand gathered information about attempted contacts. The targeting strategy provides theanalytic foundation for our regression discontinuity analysis, while the data gatheredfrom field workers enables us to estimate the effects of actual contact with intendedtargets. This section therefore lays out in detail the steps by which MoveOn targetedand contacted voters.
MoveOn selected target precincts in 17 swing states. Voters considered most likely tovote for Kerry were identified by combining voter files with information from commercial
66 Middleton and Green
data aggregators. Although the precise targeting criteria varied somewhat across states,the following factors were considered when selecting precincts:
• Number of voters who would presumably lean toward or consider Kerry accordingto information provided by The National Committee for an Effective Congress.
• Number of MoveOn members in the precinct. To mount a successful mobilizationeffort, sufficient numbers of MoveOn members had to be present to run theoperation.
• Proportion of voters registered as Democrats. Precincts with the highest propor-tion of Democrats were ruled out based on the assumption that these were likelytargets for other organizations.
Ultimately MoveOn identified precincts containing a total of 10,798,949 target voters.This pool of precincts represents the initial population from which our subset of treat-ment and control precincts is drawn.
Next, MoveOn recruited precinct leaders from among their membership within targetprecincts. Initial contact was made through email or telephone. The precinct leaders inturn recruited and organized local volunteers for local canvassing. As they canvassedpotential Kerry supporters, volunteers in turn recruited additional canvassers.
The voter outreach component of the MoveOn canvassing campaign took place inthree phases. During each phase an internet interface was the backbone of managing theefforts of local volunteers and recording information on canvassing outcomes.
In the first phase, targeted voters were contacted to identify individuals intendingto vote for Democrat John Kerry. When contacted, individuals were asked their votepreference. Individuals who indicated Kerry were classified by the campaign as likelyKerry voters and encouraged to vote on Election Day. If the individual favored anothercandidate, they were simply thanked for their time. Volunteers recorded the candidatepreference of each contacted voter using MoveOn’s online interface.
In the second phase, during the five days prior to Election Day, MoveOn volunteersattempted to re-contact those who indicated they would vote for Democrat John Kerryand once again asked them to vote. In the second phase volunteers also attempted tocontact voters who could not be reached during the first phase to determine if the votersupported John Kerry and if so, to encourage them to vote. The third phase took placeon Election Day, as volunteers attempted to re-contact voters who indicated support forKerry in either of the first two phases.
In the analysis that follows, the term contact refers to encouragement to vote by acanvasser. As the canvassing scripts in the appendix indicate, the first round of communi-cation was essentially a brief opinion survey; once the respondent expressed a preferencefor Bush, the survey ended. Given that recent large-scale experiments show that pre-election surveys have no effect on voter turnout (Smith et al. 2003; Mann 2005), it seemsquite reasonable to assume that this initial conversation has no effect. Upon expressingsome type of pro-Kerry preference, respondents were encouraged to vote and slated fora possible follow-up visit. Overall, 24.7% of the initial target group participated in thevoter identification phase of the campaign, and 15.4% of those targeted were, by dint of

Community-Based Voter Mobilization Campaigns Work Even in Battleground States 67
their expressed preference, encouraged to vote. Below we develop a statistical model toestimate the average effect of contact among the 15.4% who were contacted.
Although a few contacts were made over the phone, the MoveOn effort was primarilya face-to-face campaign. Overall, 91% of successful contacts were made via door-to-door canvassing.1 Given the preponderance of face-to-face contact and the researchliterature’s conclusion that face-to-face contact is more effective than phone contact(Green and Gerber 2004), we interpret the effects estimated below as the effects of door-to-door visits. Prior experimental research on campaigns that employed an initial waveof voter identification canvassing followed by voter mobilization canvassing during thelast week of the campaign found this strategy to be highly effective (Arceneaux 2005;Michelson 2005). It is worth emphasizing that estimates represent the effect of the entiretreatment regimen, which in some cases included multiple contacts.
METHOD AND ANALYSIS
To measure the effectiveness of MoveOn’s mobilization campaign we use regressiondiscontinuity analysis.2 This type of analysis is valuable in situations where individualswere selected for treatment based on a cutoff value along a continuum. As illustrated inFigure 1, we consider cases along the discontinuity boundary which is the geographiclocation dividing (1) a precinct where MoveOn found a precinct leader and attempted tomobilize voters from (2) a precinct initially identified for mobilization efforts but whereMoveOn was unable to find a precinct leader. It should be stressed that this comparisonfocuses solely on adjacent precincts that MoveOn originally sought to mobilize. The differenceis that in some precincts, leaders were found and therefore GOTV efforts went forward.No canvassing occurred in leaderless precincts.
Our analytic focus is the narrow set of voters who live on the border between adjacentleader-led and leaderless precincts. While one approach might be to include the entiretyof adjacent precincts in such a discontinuity analysis, we limit the data set to just thoseindividuals who live on streets bisected by such a boundary. The critical assumption inour analysis is that across-the-street neighbors have the same expected turnout rates in
1 When a canvasser successfully made contact with a registered voter, MoveOn recorded (1) thatthe contact occurred and (2) the mode of contact (i.e., phone vs. door-to-door). However, when acanvasser made an unsuccessful attempt at contact, the attempted contact was recorded but not themode of the attempt. This was an unfortunate gap in MoveOn’s record keeping. One consequenceof the gap is that independent effects of phone and door-to-door are slightly confounded for 2SLSanalysis. One can look at this as a bounds problem. Our estimates represent one end of the continuum,where phone and in-person contacts are assumed to be equally effective. At the opposite end of thecontinuum, phone contacts are assumed to have no effect. Because phone contact occurs so rarely,the difference in coefficients is less than 10%, and our assumption errs on the side of producingmore conservative point estimates.
2 Regression discontinuity analysis was conceived by Thislethwaite and Campbell (1960) to examinethe effects of merit based scholarships on academic outcomes (see also Visser and De Leeuw 1984;Angrist and Lavy 1999). This methodology is used to study topics in political science as well (Lee2008; Butler and Butler 2005).

68 Middleton and Green
Figure 1. Illustration of how voters were selected for inclusion in the regression discon-tinuity analysis. Represented is the intersection of three fictional precincts. Precinct Awas not chosen by MoveOn for canvassing. Precinct B and C were selected by MoveOn,and target voters (those likely to vote for Democrat John Kerry) were identified. Suitableprecinct leaders were sought for precincts B and C, but a precinct leader was found forprecinct C only. As a result, voters in precinct B were never canvassed. Target votersalong the precinct boundary between precincts B and C were included in the study.Target voters on the south side of the 200’s and 300’s blocks of 1st Street are in precinctC and are in the treatment group. Voters on the north side are in precinct B and are inthe control group.
the absence of contact from canvassers. On the basis of this assumption, voters on thenon-targeted side of the street are considered a control group for the individuals targetedacross the street.
We attempted to verify our assumption that voters on opposite sides of a precinctboundary have similar voting propensities. Under the null hypothesis, variables suchas past voting and age should fail to predict the quasi-random assignment of somevoters to the treated side of the block and others to the untreated side. Visual inspec-tion of Table 1 does not reveal any striking differences. The treatment and controlgroups have voting rates within 2 percentage-points of one another in 41 of 52 pair-wise comparisons. However, an F-test based on individual-level data and allowing forclustering by street block shows a statistically significant deviation from the null modelof no relationship between the covariates listed in Table 1 and whether an individualwas “assigned” to treatment or control blocks (F = 2.27, df1 = 107, df2 = 7641,p < 0.001).

Community-Based Voter Mobilization Campaigns Work Even in Battleground States 69
Tab
le1.
Sum
mar
yst
atis
tics
for
avai
labl
eco
vari
ates
byst
ate
%G
ende
rM
issi
ng
Gen
eral
Ele
ctio
nT
urno
ut(%
)Pr
imar
yE
lect
ion
Tur
nout
(%)
%V
ote
His
tory
Mis
sing
Stat
eSi
deof
Blo
ckN
#B
lock
sC
onta
ctR
ate
(%)
Avg
.A
ge%
Reg
.D
em.
% Mal
e19
9619
9820
0020
0219
9619
9820
0020
0220
04
AZ
Tre
atm
ent
513
144
23.6
40.7
74.9
43.7
5.7
32.2
34.3
3.9
10.3
23.6
0.0
Com
pari
son
435
39.3
76.1
45.7
4.6
34.0
32.2
6.4
10.6
24.4
0.0
FL
Tre
atm
ent
2322
47.5
70.0
39.1
Com
pari
son
2279
403
10.2
51.7
66.6
38.8
IAT
reat
men
t11
1339
.742
.63.
19.
522
.511
.81.
41.
03.
113
.5C
ompa
riso
n93
927
67.
047
.242
.74.
28.
821
.011
.11.
30.
93.
519
.8M
IT
reat
men
t19
2032
.649
.41.
6C
ompa
riso
n19
2359
13.8
31.4
48.6
1.3
MN
Tre
atm
ent
688
45.5
19.0
24.4
46.4
5.7
5.2
7.1
5.2
Com
pari
son
732
268
12.1
48.2
18.4
19.1
47.8
5.2
3.1
5.6
7.5
MO
Tre
atm
ent
2525
37.6
44.7
10.7
8.2
7.7
30.7
26.3
2.5
2.5
7.3
7.6
8.9
8.3
Com
pari
son
2495
394
11.5
36.6
44.2
11.3
8.8
9.5
30.6
22.4
2.2
2.5
8.3
7.9
8.5
7.7
NC
Tre
atm
ent
529
43.9
94.7
43.1
17.0
18.1
44.8
31.8
5.7
4.9
8.5
12.7
0.0
Com
pari
son
588
186
15.1
42.9
94.2
40.3
13.4
17.3
42.5
37.8
3.4
5.1
7.1
12.4
0.0
NM
Tre
atm
ent
415
37.9
57.3
40.7
14.2
15.4
27.2
12.0
11.1
Com
pari
son
325
102
13.0
30.2
57.2
44.0
10.2
11.4
25.2
12.9
24.3
NV
Tre
atm
ent
380
32.9
58.4
38.2
11.8
9.7
32.4
Com
pari
son
342
4312
.133
.465
.237
.713
.78.
232
.5O
HT
reat
men
t11
8533
.18.
786
.2C
ompa
riso
n12
6741
47.
432
.57.
786
.1O
RT
reat
men
t17
644
.451
.130
.110
.15.
716
.30.
0C
ompa
riso
n21
551
5.1
35.5
52.1
47.0
6.6
14.0
19.8
0.0
PAT
reat
men
t11
512
40.9
78.3
43.1
5.6
8.2
4.7
22.3
17.3
1.5
1.7
3.5
12.0
9.8
0.0
Com
pari
son
1118
284
019
.140
.778
.745
.56.
68.
04.
421
.716
.91.
71.
73.
111
.79.
20.
0W
IT
reat
men
t10
630
.050
.9C
ompa
riso
n17
141
6.6
24.6
36.3

70 Middleton and Green
Table 2. State-by-state randomization checks
State N Blocks p
AZ 948 144 0.021FL 4601 403 0.008IA 2052 276 0.032MI 3843 659 0.002MN 1420 268 0.005MO 5020 394 0.001NC 1117 186 0.010NM 740 102 <0.001NV 722 43 0.096OH 2452 414 0.839OR 391 51 0.033PA 22694 840 0.758WI 277 41 0.100
Because targeted voters were identified by MoveOn in advance of the volunteer recruit-ment phase it is not clear why this difference occurs. During the campaign, to the bestof our knowledge, the list of target voters was not modified as new voters were registeredor existing voters were found to have moved. Our data base consists of only those indi-viduals who were originally targeted by MoveOn. Apparently, precinct boundaries differin a subtle fashion that a large-N statistical analysis is able to detect.
In Table 2 a state-by-state examination of covariate balance reveals that certain statesmake for an especially apt natural experiment. In particular, Pennsylvania shows out-standing balance between treatment and control groups; when the F-test presented aboveis conducted solely on observations from Pennsylvania, the test statistics is nonsignifi-cant (F = 0.72, df1 = 14, df2 = 1679, p = 0.758). Because Pennsylvania is the onlystate with both a full set of covariates and excellent covariate balance, we present overallresults and also analyze the cases from Pennsylvania separately. Reassuringly, resultsfrom Pennsylvania are not substantively different from the results obtained using thefull sample.3
To estimate the intent-to-treat of treatment assignment (as opposed to actual contactby a MoveOn canvasser), we begin by using a linear probability model with and withoutcovariates. The model without covariates is
Yi = α0 + α1Xi + λ1D1i + λ2D2i + · · · + λJ−1DJ−1,i + Ui , (1)
3 We do not include estimates for each state because the precision of state-level estimates for statesother than Pennsylvania is too low for meaningful interpretation. Exploratory analysis using themetareg procedure in STATA did not reveal any significant predictors of state-level effects.Covariates in this analysis included baseline turnout rate, closeness of the Presidential race in state,2000 presidential vote in state and party-registration status of the state. The null result is interestingin light of Goldstein and Ridout’s (2002) observational study that finds an interaction between theeffectiveness of mobilization efforts and target voters’ propensity to vote.

Community-Based Voter Mobilization Campaigns Work Even in Battleground States 71
where Yi is a dummy variable scored 1 if person i voted, Xi is a dummy variable scored1 if person i lives on the treated side of a precinct-boundary street, Dji are dummyvariables scored 1 if person i lives on block j ∈ {1, 2, . . . , J}, and Ui is a disturbanceterm. The inclusion of block-level fixed effects means that cross-street comparisons aremade within each block; the intent-to-treat effect is essentially a weighted average of allwithin-block comparisons. An analogous probit model was also used to corroborate thelinear regression analysis. The findings, presented in the Appendix, show that the linearand nonlinear regression models produce substantively identical results.
Equation (1) can be augmented with a set of covariates: dummy variables indicatingwhether an individual voted in the 1996, 1998, 2000, and 2002 general elections, dummyvariables for voting in the 1996, 1998, 2000, 2002 and 2004 primary elections, the voter’sage and the square of age, an indicator for whether the voter is a registered Democrat, andan indicator for whether the voter is male.4 We do not ascribe a causal interpretation tothe coefficients obtained for these variables, as they are collinear and redundant indicatorsof baseline voting propensities. The reason to include covariates is that doing so allowsfor a more precise estimation of the treatment effect.
The focal parameter in Equation (1) is α1, the average effect of being assigned to atreatment block, or the intent-to-treat effect. The parameter of interest, however, is theaverage effect of actual (as opposed to attempted) contact. Although it is tempting toreplace attempted with actual contact in the above equations, applying OLS regressionto such a model would produce biased estimates, because the kinds of individuals whoare reachable by canvassers may have higher unobserved voting propensities (Gerberand Green 2000). The proper estimation approach is instrumental variables regression,which takes these unobserved differences into account (Angrist et al. 1996). This method,which is now widely used in the experimental voting literature, is based on a two equationsystem. The first equation expresses contact by canvassers as a function of the quasi-random variable, attempted contact. When the matrix of covariates (W ) listed above isincluded as control variables, the equation predicting actual contact (Ci) is
Ci = γ0 + γ1Xi + λ′1D1i + λ′
2D2i + · · · + λ′J−1DJ−1,i + W � + UC
i . (2)
The second equation in this system models vote as function of actual contact, covariates,and block level dummies.
Yi = β0 + β1Ci + λ′′1D1i + λ′′
2D2i + · · · + λ′′J−1DJ−1,i + W � + UY
i . (3)
The key parameter in this system is β1, the average effect of actual contact with can-vassers.5
4 In some states one or more of the above-listed covariates were unavailable, in which case dummyvariables were added to specify missing data as distinct from a value of zero. No observations weredropped on account of missing data.
5 Although techniques such as bivariate probit regression may be used to model a binary dependentvariable embedded in a two-equation system such as ours, 2SLS accurately estimates the averagetreatment effect among the treated. Because no one in the control group received the treatment, theaverage treatment effect in this application is the same as what Angrist et al. (1996) refer to as thecomplier average causal effect.

72 Middleton and Green
Five key assumptions ensure that the treatment effect may be estimated consistentlyby two stage least squares (2SLS), using treatment group assignment as an instrumentfor actual contact. Angrist et al. (1996) describe these assumptions in detail, and webriefly comment on their suitability in our application. The first assumption is the stableunit treatment value assumption, which states that the outcome for each unit is unrelatedto the treatment status of other units. This assumption could be violated, for example,if voters were to mobilize their across-the-street neighbors. We expect that this is arelatively uncommon problem and a relatively weak influence on voter turnout ratesin the control group. To the extent that this assumption is violated, the voting ratesof treatment and control groups will be more similar, causing us to underestimate theeffects of the treatment.
The second assumption is that of random assignment. While random assignment wasnot used in this study, the core idea behind the regression discontinuity method is thatthe process that determines the treatment cut-off is nearly random, in the sense that itis arbitrary and unrelated to factors that might correlate with outcomes, at least at thepoint of discontinuity (Rubin 1977).
The third assumption is the exclusion restriction which says that the outcome can onlybe affected if treatment is delivered — meaning that contact with the voter is made —and no other process related to (near) random assignment has a causal effect on theseindividuals.
The last two assumptions concern the relationship between assignment to treatmentgroup and the probability of receiving treatment. The fourth assumption is that there isat least some relationship between treatment assignment and the receipt of the treatment,which is certainly true in this study. The fifth assumption is that of monotonicity, whichstates that for every unit the likelihood of receiving treatment is not lower when assignedto the treatment group compared to the control group. Additionally for at least one casethe likelihood of receiving treatment must be greater when assigned to the treatmentgroup compared to the control group. Since the control group was not canvassed, thisassumption is satisfied by design.
It should be stressed that 2SLS generates consistent estimates even though contactby canvassers is a function of unobservables (UC
i ) that may be correlated with UYi .
The models above estimate the effect of the MoveOn campaign by applying 2SLS topooled data from all blocks. These models treat the individual as the unit of analysis,but our quasi-experiment assigned sides of street-blocks to treatment or control condi-tions. In order to take account of the possibility that those living on the same side of astreet-block share unobserved characteristics, we estimate robust cluster standard errors(Arceneaux 2005).
Only 13 out of 17 states where canvassing took place could be included in the analysis.Four states — Colorado, Maine, New Hampshire, and Washington — had no casesrepresented in the analysis because there were no blocks where: (1) MoveOn identifiedtarget voters in adjacent precincts; (2) MoveOn found a precinct leader in only oneof the two precincts and therefore volunteers canvassed only one of the two precincts;and (3) the boundary between this pair of precincts runs down the middle of a streetcontaining targeted voters on both sides of the street (as in Figure 1). Narrowing our focus

Community-Based Voter Mobilization Campaigns Work Even in Battleground States 73
to the set of cases subject to this natural experiment, we analyze the 23,384 individuals inthe treated precincts and 22,893 in the adjacent untreated precincts. Nearly half of thesecases are from Pennsylvania: 11,512 in the treatment group, and 11,182 in the control.
RESULTS
Our estimation results are presented in Table 3. Without covariates, 2SLS produces anestimated treatment effect of 8.7 percentage-points, with a standard error of 2.9. Whenwe control for covariates, this estimate rises to 10.5, and the standard error declinesto 2.7. This is the complier average causal effect, also known as the treatment-on-treatedeffect.6 Substantively, the results suggest that the turnout rate among those encouragedto vote by MoveOn canvassers was approximately 9 percentage-points higher than itwould have been in the absence of this voter mobilization effort.
Based on a reported 570,004 Kerry supporters contacted by MoveOn nationwide,7
an 8.7 percentage point effect would correspond to 49,590 additional votes. A 10.5percentage point effect corresponds to an estimated 60,420 additional votes.
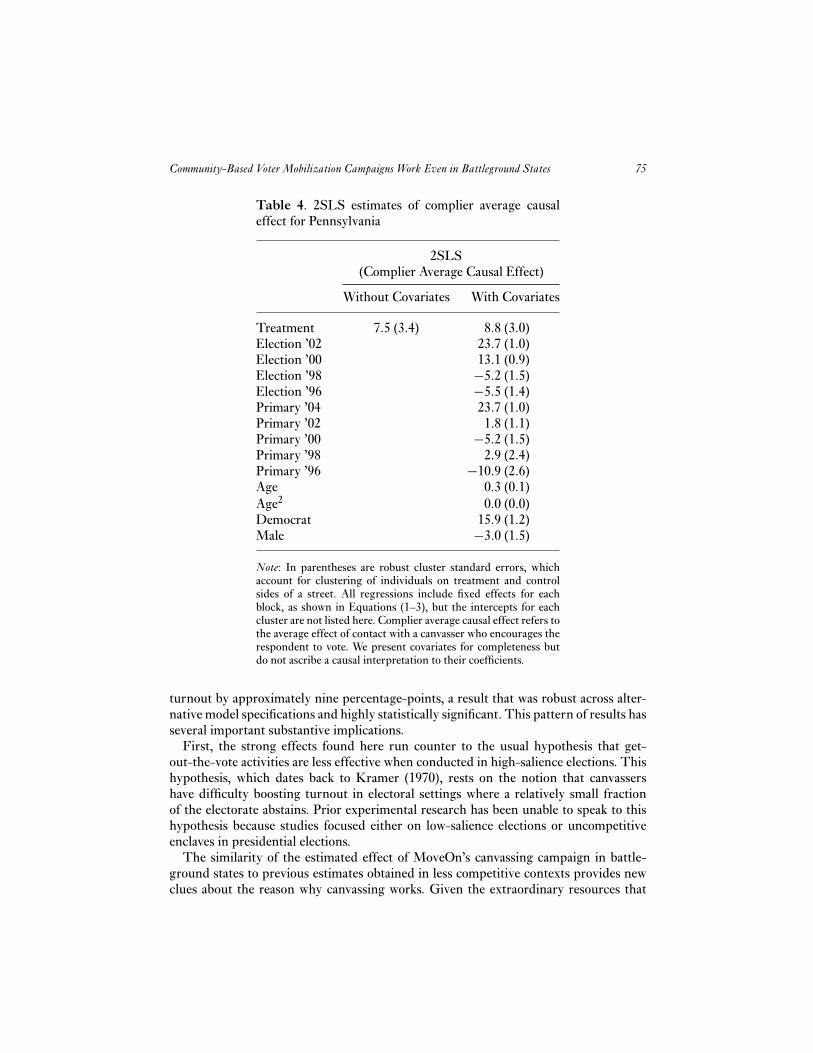
Restricting our attention to Pennsylvania, we obtain very similar results. Table 4reports that voter mobilization contacts increased turnout by 7.5 percentage points witha standard error of 3.4. Controlling for covariates, the estimate rises to 8.8 with a standarderror of 3.0.8 Based on a total of 120,978 contacts in Pennsylvania, a 7.5 percentagepoint effect corresponds to 9,073 additional votes due to MoveOn’s efforts. For an 8.8percentage point effect we would estimate an additional 10,646 votes in Pennsylvania.
DISCUSSION AND CONCLUSIONS
Our findings indicate that MoveOn’s 2004 get-out-the-vote efforts raised turnout ratessubstantially among targeted voters. Contact with MoveOn canvassers increased voter
6 The intent-to-treat estimates — which estimate the effect of assignment to treatment group ratherthan the effect of actual contact tell a similar story. Table A.1 shows the overall intent-to-treateffects. Without covariates the intent-to-treat effect is 1.4 percentage points with a standard errorof 0.5. When we control for covariates the estimate rises to 1.7 percentage points with a standarderror of 0.4. Dividing by the contact rate of 15.2% we arrive at approximate complier average causaleffect estimates of 9.2 percentage points and 11.2 percentage points for without and with covariatesspecifications, respectively.
7 Note that this estimate is based on all MoveOn contacts nationwide, not only the contacts thatoccurred within the subset of the data that we analyze. It seems reasonable to generalize to thepopulation of MoveOn targets based on estimates derived from the subset of across-the-streetneighbors.
8 For Pennsylvania, we obtain similar intent-to-treat effects. Table A.2 shows the specification withoutcovariates generates an estimate of 1.6 percentage points with a standard error of 0.7. With covariatesthe estimate increases to 1.9 with a standard error of 0.7. Dividing by the contact rate in Pennsylvaniaof 19.1% we achieve complier average causal effects of 8.4 percentage points and 9.9 percentagepoints for without and with covariates specifications, respectively.

74 Middleton and Green
Tab
le3.
2SL
Ses
timat
esof
com
plie
rav
erag
eca
usal
effe
ct2S
LS
(Com
plie
rA
vera
geC
ausa
lEff
ect)
No
Cov
aria
tes
With
Cov
aria
tes
Tre
atm
ent
8.7
(2.9
)10
.5(2
.7)
Cov
aria
teE
stim
ates
AZ
FL
IAM
IM
NM
ON
CN
MN
VO
HO
RPA
WI
Ele
ctio
n’0
28.
4(3
.6)
33.5
(3.7
)13
.4(3
.1)
16.9
(2.1
)26
.8(3
.8)
29.7
(4.8
)21
.3(6
.2)
11.6
(6.9
)23
.6(1
.0)
Ele
ctio
n’0
04.
6(3
.4)
20.1
(3.3
)20
.1(3
.2)
6.1
(1.5
)17
.0(3
.0)
8.5
(5.3
)22
.6(5
.3)
0.8
(9.2
)13
.0(1
.0)
Ele
ctio
n’9
81.
6(4
.3)
7.6
(3.2
)−1
.8(2
.2)
−5.5
(4.0
)−1
1.4
(7.8
)−2
8.6
(8.4
)−5
.2(1
.6)
Ele
ctio
n’9
6−1
.6(2
.5)
−2.8
(4.4
)−9
.2(7
.6)
5.4
(1.4
)Pr
imar
y’0
417
.5(3
.1)
13.5
(2.4
)23
.6(1
.1)
Prim
ary
’02
6.0
(4.4
)3.
6(6
.8)
3.9
(4.2
)−4
.2(2
.1)
10.3
(3.9
)1.
7(1
.1)
Prim
ary
’00
−3.5
(5.7
)−4
.6(9
.4)
10.0
(5.4
)−1
.2(2
.5)
6.9
(5.2
)−5
.1(1
.6)
Prim
ary
’98
−4.2
(5.5
)0.
2(4
.0)
−7.1
(7.0
)2.
9(2
.5)
Prim
ary
’96
0.2
(3.2
)6.
9(7
.1)
−10.
9(2
.7)
Age
0.7
(0.5
)2.
0(0
.2)
0.2
(0.3
)0.
1(0
.2)
0.7
(0.4
)−0
.5(0
.5)
0.3
(0.3
)0.
1(0
.3)
1.5
(0.4
)0.
3(0
.1)
−3.6
(0.5
)A
ge2
0.0
(0.0
)0.
0(0
.0)
0.0
(0.0
)0.
0(0
.0)
0.0
(0.0
)0.
0(0
.0)
0.0
(0.0
)0.
0(0
.0)
0.0
(0.0
)0.
0(0
.0)
0.0
(0.0
)D
emoc
rat
2.6
(3.9
)4.
7(1
.7)
12.5
(2.4
)−3
.1(8
.2)
0.0
(4.4
)3.
3(4
.2)
14.4
(4.3
)15
.9(1
.2)
Mal
e1.
2(8
.6)
−3.8
(1.4
)11
.6(6
.2)
−10.
8(7
.9)
8.3
(5.2
)−0
.1(1
.6)
−3.8
(2.5
)−4
.0(3
.6)
−10.
0(3
.0)
−7.9
(5.0
)−2
.9(5
.2)
−3.0
(1.6
)2.
6(4
.9)
Not
e:R
obus
tclu
ster
edst
anda
rder
rors
are
pres
ente
din
pare
nthe
ses.
Com
plie
rave
rage
caus
alef
fect
refe
rsto
the
aver
age
effe
ctof
cont
actw
itha
canv
asse
rw
hoen
cour
ages
the
resp
onde
ntto
vote
.All
spec
ifica
tions
incl
ude
bloc
k-le
velfi
xed
effe
cts
(not
repo
rted
).W
epr
esen
tthe
coef
ficie
nts
for
the
cova
riat
esfo
rco
mpl
eten
ess
butd
ono
tasc
ribe
aca
usal
inte
rpre
tatio
nto
them
.
Community-Based Voter Mobilization Campaigns Work Even in Battleground States 75
Table 4. 2SLS estimates of complier average causaleffect for Pennsylvania
2SLS(Complier Average Causal Effect)
Without Covariates With Covariates
Treatment 7.5 (3.4) 8.8 (3.0)Election ’02 23.7 (1.0)Election ’00 13.1 (0.9)Election ’98 −5.2 (1.5)Election ’96 −5.5 (1.4)Primary ’04 23.7 (1.0)Primary ’02 1.8 (1.1)Primary ’00 −5.2 (1.5)Primary ’98 2.9 (2.4)Primary ’96 −10.9 (2.6)Age 0.3 (0.1)Age2 0.0 (0.0)Democrat 15.9 (1.2)Male −3.0 (1.5)
Note: In parentheses are robust cluster standard errors, whichaccount for clustering of individuals on treatment and controlsides of a street. All regressions include fixed effects for eachblock, as shown in Equations (1–3), but the intercepts for eachcluster are not listed here. Complier average causal effect refers tothe average effect of contact with a canvasser who encourages therespondent to vote. We present covariates for completeness butdo not ascribe a causal interpretation to their coefficients.
turnout by approximately nine percentage-points, a result that was robust across alter-native model specifications and highly statistically significant. This pattern of results hasseveral important substantive implications.
First, the strong effects found here run counter to the usual hypothesis that get-out-the-vote activities are less effective when conducted in high-salience elections. Thishypothesis, which dates back to Kramer (1970), rests on the notion that canvassershave difficulty boosting turnout in electoral settings where a relatively small fractionof the electorate abstains. Prior experimental research has been unable to speak to thishypothesis because studies focused either on low-salience elections or uncompetitiveenclaves in presidential elections.
The similarity of the estimated effect of MoveOn’s canvassing campaign in battle-ground states to previous estimates obtained in less competitive contexts provides newclues about the reason why canvassing works. Given the extraordinary resources that
76 Middleton and Green
campaigns pump into battleground states in presidential election years, it seems unlikelythat canvassing works because it reminds people of the upcoming election. Rather, likeother highly effective community-based canvassing campaigns (see Arceneaux 2005;Michelson 2005), this one appears to work because it conveys social norms about par-ticipation in the upcoming election as modeled by the behavior of a local volunteer.Communicating the same partisan or nonpartisan appeals by phone has consistentlyproven to be less influential than face-to-face communication (see experiments summa-rized in Green and Gerber 2004), arguably because the appearance of a canvasser is astronger social cue.
Second, the findings suggest the political relevance and technical feasibility of anational voter mobilization campaign. Scholars in recent years have expressed increasingconcern about diminished membership in civic and political organizations and corre-sponding declines in social capital (Putnam 2000). MoveOn came to life in an environ-ment where members of civic organizations are relied upon less for the delivery of votes(Mayhew 1992) and more as a source of funding for lobbying efforts in Washington orpaid advertising (Skocpol 2003; Fisher 2006). Using the internet to recruit and coordinatea vast network of local activists, MoveOn conducted a campaign that was simultaneouslybroad in geographic scope yet ideologically focused. MoveOn’s capacity to put tens ofthousands of unpaid activists on the streets shows that membership organizations stillhave low-cost opportunities to act as vote-brokers in the political system.
Finally, our results demonstrate the feasibility of quasi-experimental approaches tothe assessment of campaign effects. In closely contested races, experimental researchis often infeasible, because campaigns resist the extraction of random control groups.Researchers are therefore forced to come up with second-best approaches. This studydemonstrates the scientific value of having extremely detailed information about target-ing, because it enables the researcher to take advantage of discontinuities in the applica-tion of treatments. Our study seized upon geographic discontinuities, but depending onthe targeting criteria, other designs may focus on discontinuities associated with voters’age or date of registration. The broader point is that campaigns’ targeting criteria, farfrom creating an impenetrable endogeneity problem, present research opportunities thatmay significantly advance our understanding of elections.
APPENDIX
Phase 1 Canvass Script
Hi, how are you. My name is ______. Is _______[name] in?[If the person you are seeking is not in, ask when they might be in, and then thank theperson for their time][Otherwise continue] I live here in ______ [name of neighborhood or section of town]and I’m working on the upcoming election. Have you decided who you are going tovote for?

Community-Based Voter Mobilization Campaigns Work Even in Battleground States 77
Tab
leA
.1.O
LS
estim
ates
ofin
tent
-to-
trea
teff
ect
Lin
ear
Reg
ress
ion
(Int
ent-
to-t
reat
effe
ct)
No
Cov
aria
tes
With
Cov
aria
tes
Tre
atm
ent
1.4
(0.5
)1.
7(0
.4)
Cov
aria
teE
stim
ates
AZ
FL
IAM
IM
NM
ON
CN
MN
VO
HO
RPA
WI
Ele
ctio
n’0
29.
3(3
.6)
32.7
(3.5
)13
.4(3
.0)
17.2
(2.0
)27
.1(3
.7)
29.5
(4.6
)23
.8(5
.8)
11.4
(6.6
)24
.0(1
.0)
Ele
ctio
n’0
04.
2(3
.3)
20.3
(3.2
)20
.1(3
.1)
6.1
(1.4
)16
.9(2
.9)
8.4
(5.0
)22
.7(5
.1)
1.1
(8.8
)13
.2(0
.9)
Ele
ctio
n’9
81.
5(4
.1)
7.9
(3.1
)−1
.8(2
.1)
−5.7
(3.8
)−1
1.9
(7.6
)−2
8.7
(8.0
)−5
.1(1
.5)
Ele
ctio
n’9
6−1
.5(2
.4)
−2.6
(4.2
)−8
.9(7
.4)
−5.8
(1.3
)Pr
imar
y’0
418
.5(3
.1)
14.1
(2.3
)24
.0(1
.0)
Prim
ary
’02
5.2
(4.3
)3.
9(6
.5)
3.0
(3.9
)−4
.3(2
.0)
10.5
(3.8
)2.
0(1
.1)
Prim
ary
’00
−4.0
(5.4
)−4
.6(9
.0)
10.8
(5.2
)−0
.9(2
.3)
6.9
(5.0
)−5
.3(1
.5)
Prim
ary
’98
−0.5
(8.9
)−4
.3(5
.3)
0.2
(3.9
)−7
.0(6
.7)
2.9
(2.4
)Pr
imar
y’9
6−0
.2(3
.1)
6.3
(6.8
)−1
0.8
(2.6
)A
ge0.
7(0
.4)
2.0
(0.2
)0.
2(0
.3)
0.1
(0.2
)0.
7(0
.4)
−0.5
(0.5
)0.
2(0
.3)
0.1
(0.3
)1.
5(0
.4)
0.3
(0.1
)−3
.6(0
.5)
Age
20.
0(0
.0)
0.0
(0.0
)0.
0(0
.0)
0.0
(0.0
)0.
0(0
.0)
0.0
(0.0
)0.
0(0
.0)
0.0
(0.0
)0.
0(0
.0)
0.0
(0.0
)0.
0(0
.0)
Dem
ocra
t3.
1(3
.9)
4.8
(1.6
)12
.9(2
.3)
−3.2
(7.8
)−0
.2(4
.3)
3.8
(3.9
)14
.7(4
.1)
16.2
(1.2
)M
ale
0.7
(8.4
)−3
.8(1
.4)
11.5
(6.0
)−1
0.7
(7.9
)9.
5(4
.8)
−0.1
(1.5
)−3
.8(2
.4)
−4.0
(3.4
)−1
0.1
(2.9
)−7
.9(4
.8)
−2.8
(5.0
)−3
.0(1
.5)
2.5
(4.7
)
Not
e:R
obus
tclu
ster
edst
anda
rder
rors
are
pres
ente
din
pare
nthe
ses.

78 Middleton and Green
Table A.2. OLS estimates of intent-to-treats forPennsylvania
Linear Regression(intent-to-treat effects)
Without Covariates With Covariates
Treatment 1.6 (0.7) 1.9 (0.7)Election ’02 24.0 (1.0)Election ’00 13.2 (1.0)Election ’98 −5.1 (1.6)Election ’96 −5.8 (1.4)Primary ’04 24.0 (1.0)Primary ’02 2.0 (1.1)Primary ’00 −5.3 (1.5)Primary ’98 2.9 (2.5)Primary ’96 −10.8 (2.6)Age 0.3 (0.1)Age2 0.0 (0.0)Democrat 16.2 (1.2)Male −3.0 (1.5)
Note: In parentheses are robust cluster standard errors, whichaccount for cluastering of individuals on treatment and controlsides of a street. All regressions include fixed effects for eachblock, as shown in Equations (1–3), but intercepts for each clus-ter are not listed here. Intent-to-treat effect refers to the averageeffect associated with assignment to the treatment group, ignor-ing actual contact. We include covariates for completeness but donot ascribe a causal interpretation to their coefficients.
[If Kerry]: Great! I’m a volunteer with MoveOn PAC and we’re working to defeatGeorge Bush and elect John Kerry. For our get-out-the-vote efforts, we’re compilinga list of Kerry supporters, can I get a contact phone # and e mail address ______[name]? (turn over clipboard)
[If Yes]: Great, thanks.[If No]: Ok, just one more question. What issue is most important to you inmaking your decision for president?
OK, thank you for your time _______ [name], and thank you for your support. Be sureto vote on November 2 — this race is incredibly close, but if we all get out and vote,we can definitely defeat George Bush. Here’s a fact sheet from MoveOn PAC about thiselection. And if you want to volunteer to help us out here in our neighborhood, we’d
Community-Based Voter Mobilization Campaigns Work Even in Battleground States 79T
able
A.3
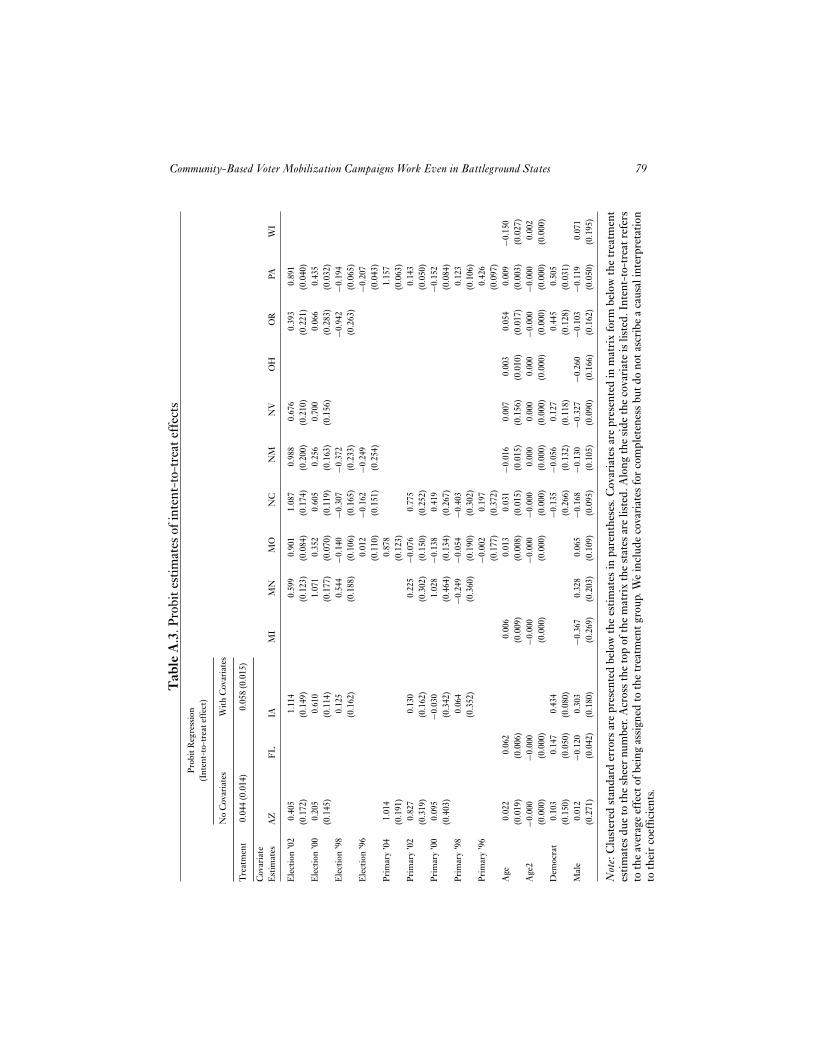
.Pro
bite
stim
ates
ofin
tent
-to-
trea
teff
ects
Prob
itR
egre
ssio
n(I
nten
t-to
-tre
atef
fect
)
No
Cov
aria
tes
With
Cov
aria
tes
Tre
atm
ent
0.04
4(0
.014
)0.
058
(0.0
15)
Cov
aria
teE
stim
ates
AZ
FL
IAM
IM
NM
ON
CN
MN
VO
HO
RPA
WI
Ele
ctio
n’0
20.
405
1.11
40.
599
0.90
11.
087
0.98
80.
676
0.39
30.
891
(0.1
72)
(0.1
49)
(0.1
23)
(0.0
84)
(0.1
74)
(0.2
00)
(0.2
10)
(0.2
21)
(0.0
40)
Ele
ctio
n’0
00.
205
0.61
01.
071
0.35
20.
605
0.25
60.
700
0.06
60.
435
(0.1
45)
(0.1
14)
(0.1
77)
(0.0
70)
(0.1
19)
(0.1
63)
(0.1
56)
(0.2
83)
(0.0
32)
Ele
ctio
n’9
80.
125
0.54
4−0
.140
−0.3
07−0
.372
−0.9
42−0
.194
(0.1
62)
(0.1
88)
(0.1
06)
(0.1
65)
(0.2
33)
(0.2
63)
(0.0
65)
Ele
ctio
n’9
60.
012
−0.1
62−0
.249
−0.2
07(0
.110
)(0
.151
)(0
.254
)(0
.043
)Pr
imar
y’0
41.
014
0.87
81.
157
(0.1
91)
(0.1
23)
(0.0
63)
Prim
ary
’02
0.82
70.
130
0.22
5−0
.076
0.77
50.
143
(0.3
19)
(0.1
62)
(0.3
02)
(0.1
50)
(0.2
52)
(0.0
50)
Prim
ary
’00
0.09
5−0
.030
1.02
8−0
.138
0.41
9−0
.152
(0.4
03)
(0.3
42)
(0.4
64)
(0.1
34)
(0.2
67)
(0.0
84)
Prim
ary
’98
0.06
4−0
.249
−0.0
54−0
.403
0.12
3(0
.352
)(0
.360
)(0
.190
)(0
.302
)(0
.106
)Pr
imar
y’9
6−0
.002
0.19
70.
426
(0.1
77)
(0.3
72)
(0.0
97)
Age
0.02
20.
062
0.00
60.
013
0.03
1−0
.016
0.00
70.
003
0.05
40.
009
−0.1
50(0
.019
)(0
.006
)(0
.009
)(0
.008
)(0
.015
)(0
.015
)(0
.156
)(0
.010
)(0
.017
)(0
.003
)(0
.027
)A
ge2
−0.0
00−0
.000
−0.0
00−0
.000
−0.0
000.
000
0.00
00.
000
−0.0
00−0
.000
0.00
2(0
.000
)(0
.000
)(0
.000
)(0
.000
)(0
.000
)(0
.000
)(0
.000
)(0
.000
)(0
.000
)(0
.000
)(0
.000
)D
emoc
rat
0.10
30.
147
0.43
4−0
.135
−0.0
560.
127
0.44
50.
505
(0.1
50)
(0.0
50)
(0.0
80)
(0.2
66)
(0.1
32)
(0.1
18)
(0.1
28)
(0.0
31)
Mal
e0.
012
−0.1
200.
303
−0.3
670.
328
0.06
5−0
.168
−0.1
30−0
.327
−0.2
60−0
.103
−0.1
190.
071
(0.2
71)
(0.0
42)
(0.1
80)
(0.2
69)
(0.2
03)
(0.1
09)
(0.0
95)
(0.1
05)
(0.0
90)
(0.1
66)
(0.1
62)
(0.0
50)
(0.1
95)
Not
e:C
lust
ered
stan
dard
erro
rsar
epr
esen
ted
belo
wth
ees
timat
esin
pare
nthe
ses.
Cov
aria
tes
are
pres
ente
din
mat
rix
form
belo
wth
etr
eatm
ent
estim
ates
due
toth
esh
eer
num
ber.
Acr
oss
the
top
ofth
em
atri
xth
est
ates
are
liste
d.A
long
the
side
the
cova
riat
eis
liste
d.In
tent
-to-
trea
tref
ers
toth
eav
erag
eef
fect
ofbe
ing
assi
gned
toth
etr
eatm
entg
roup
.We
incl
ude
cova
riat
esfo
rco
mpl
eten
ess
butd
ono
tasc
ribe
aca
usal
inte
rpre
tatio
nto
thei
rco
effic
ient
s.

80 Middleton and Green
love to have you come to our next meeting and get involved — just give me a call or goto our website, which is on the fact sheet.[If Undecided] OK, which of these best describes your position? (Show ID options.) OK,and which issue will be most important to you in making your decision for president?Ok, thank you for your time _______ [name]. I’m a volunteer with MoveOn PAC and webelieve George Bush has taken the country in the wrong direction on Iraq, the economy,and other issues, so we’re working to elect John Kerry. I’d like to leave you with this factsheet, and I hope you’ll decide to support John Kerry on November 2nd.[If Nader] Would you say you’re leaning toward Nader or definitely going to vote forNader?[If Leaning Nader] Ok, thank you for your time _______ [name]. I’m a volunteer withMoveOn PAC and we believe George Bush has taken the country in the wrong directionon Iraq, the economy, and other issues, and the best way to defeat Bush is to vote for JohnKerry. I’d like to leave you with this fact sheet, and I hope you’ll consider supportingJohn Kerry on November 2nd.[If Strong Nader] Ok, thanks for participating in our survey, and have a nice day.[If Bush] OK, thanks for participating in our survey, and have a nice day.
Phase 2 Canvass Script — For Voters Identified as Kerry Voters in Phase 1
Hi, how are you. My name is _____. Is ______ [name] in?I am here with MoveOn PAC and I want to make sure you are all set to vote to defeatGeorge Bush Tuesday. The race is really close, but we have an upsurge of momentumand we’re all going to get out and vote and put our country on a new and better course.What time are you planning to vote? [Write down time]Do you need a ride to the polls [or any other assistance to allow you to vote]? I can sendsomeone over to pick you up. [Mark that they need a ride, and if they need other help]Here’s a fact sheet from MoveOn PAC about this election and directions to our pollingplace. Please share it with like-minded friends and make sure they get out to vote! [if youdon’t have these new materials, just use your existing ones and you’ll get the new onesin by the weekend] Can you volunteer to help us out here in our neighborhood? We’dlove to have your help even for 2 hours.
[If Yes] Great! Here’s a sign up sheet, you can pick any day and time and give 2 hours;it’s fun. Thanks for your time _______ [name], and thank you for your support.When you go vote, will you check in with one of our volunteers at the polls so weknow you’ve voted? Look for the volunteer in the red hat and with the red and silverMoveOn armband. See you on Tuesday!

Community-Based Voter Mobilization Campaigns Work Even in Battleground States 81
REFERENCES
Angrist, Joshua D., and V. Lavy. 1999. “Using Maimonides’ Rule to Estimate the effect of Class Sizeon Scholastic Achievement.” The Quarterly Journal of Economics 114(2): 533–575.
Angrist, Joshua D., G. W. Imbens, and D. B. Rubin. 1996. “Identification of Causal Effects UsingInstrumental Variables.” Journal of the American Statistical Association 91(434): 444–455.
Arceneaux, K. 2005. “Using Cluster Randomized Field Experiment to Study Voting Behavior.” TheAnnals of the American Academy of Political and Social Science 601(September): 169–179.
Bennion, E. A. 2005. “Caught in the Ground Wars: Mobilizing Voters during a CompetitiveCongressional Campaign.” The Annals of the American Academy of Political and Social Science601(September): 123–141.
Bergan, D. E., A. S. Gerber, D. P. Green, and C. Panagopoulos. 2006. “Grassroots Mobilization andVoter Turnout in 2004.” Public Opinion Quarterly 69(5): 760–777
Butler, D. M., and M. J. Butler. 2005. “Causal Inference and Theories of Split-party Delegations.”Unpublished Manuscript.
Evangelista, B. 1998. “Web Site Lets You Tell Your Lawmaker to Censure, Move On.” San FranciscoChronicle 18(October), p. A9.
Fisher, D. R. 2006. Activism Inc. Palo Alto: Stanford University Press.Feifer, J. 2004. “Politics from the Living Room: Liberal-minded Folks Find Voice at MoveOn.” Worces-
ter Telegram and Gazette 23(July), p. B1.Gerber, A., and D. P. Green. 2000. “The Effects of Canvassing, Telephone Calls and Direct Mail on
Voter Turnout: A Field Experiment.” American Political Science Review 94(3): 653–663.Gerber, A., and D. P. Green. 2005. “Correction to Gerber and Green (2000), Replication of Disputed
Findings, and Reply to Imai (2005).” American Political Science Review 99: 301–313.Goldstein, K. M., and T. N. Ridout. 2002. “The Politics of Participation: Mobilization and Turnout
over Time.” Political Behavior 24(1): 3–29.Green, D. P., and A. Gerber. 2004. Get Out the Vote! How to Increase Voter Turnout. Washington, DC:
Brookings Institution.Green, D. P., A. S. Gerber, and D. W. Nickerson. 2003. “Getting Out the Vote in Local Elections:
Results from Six Door-to-Door Canvassing Experiments.” Journal of Politics 65(4): 1083–1096.Grynbaum, M. 2004. “Two Groups of Kerry Backers Want to Un-Balance Fox News’s Slogan.” The
New York Sun July 20, p. 1.Hafner, K. 1998. “On-Line Petition Solicits Outrage at Congress.” The New York Times September
24, p. G3.Hafner, K. 1999. “Screen Grab: Mobilizing on Line for Gun Control.” The New York Times May 20,
p. G5.Hefling, K. 2005. “Liberal Group Targets House Races with Anti-War Ads.” The Associated Press
State & Local Wire December 20.Kramer, G. H. 1970. “The Effects of Precinct-Level-Canvassing on Voting Behavior.” Public Opinion
Quarterly 34(Winter): 560–572.Lee D. S. 2008. “Randomized Experiments From Non-Random Selection in U.S. House Elections.”
Journal of Econometrics 142: 675–697.Mann, C. B. 2005. “Unintentional Voter Mobilization: Does Participation in Preelection Sur-
veys Increase Voter Turnout?” Annals of the American Academy of Political and Social Science601(September): 155–168.
Mayhew, L. 1992. “Political Rhetoric and the Contemporary Public.” In The Dynamic of Social Systems,ed. Paul Colomy. London: Sage, pp. 190–213.
McDonald, M. P. 2007. “Presidential Turnout Rates for Voting-Age Population (VAP) and EligiblePopulation (VEP).” http://elections.gmu.edu/turnout_rates_graph.htm, January 12.
Michelson, M. R. 2003. “Getting Out the Latino Vote: How Door-to-Door Canvassing InfluencesVoter Turnout in Rural Central California” Political Behavior 25(3): 247–263.
Michelson, M. R. 2005. “Meeting the Challenge of Latino Voter Mobilization.” The Annals of theAmerican Academy of Political and Social Science 601(September): 85–101.

82 Middleton and Green
Middleton, J. A. 2007. “Are the Canonical Studies in the Mobilization Literature Externally Valid?”Unpublished Manuscript.
Nickerson, D. W. 2005. “Partisan Mobilization Using Volunteer Phone Banks and Door Hangers.” TheAnnals of the American Academy of Political and Social Science 601(September): 10–25.
Nickerson, D. W. 2006. “Volunteer Phone Calls Can Mobilize Voters: Evidence from Eight FieldExperiments.” American Politics Research 34: 271–292.
Nickerson, D. W., R. D. Friedrichs, and D. C. King. 2006. “Partisan Mobilization Campaigns in theField: Results from a Statewide Turnout Experiment in Michigan.” Political Research Quarterly59(1): 85–97.
Packer, G. 2003. “Smart-Mobbing The War.” The New York Times Magazine March 9, p. 46.Putnam, R. C. 2000. Bowling Alone: The Collapse and Renewal of American Community. New York:
Simon and Schuster.Rosenstone, S. J., and J. Mark Hansen. 1993. Mobilization, Participation, and Democracy in America.
New York: Macmillan Publishing Company.Rubin, D. B. 1977. “The Assignment to Treatment Group on the Basis of a Covariate.” Journal of
Educational Statistics 2(1): 1–26.Rutenberg, J. 2004. “Ad Rejections by CBS Raise Policy Questions.” New York Times January 19, p. C7.Schemo, D. J. 2004. “Groups Seek Ouster of Education Secretary.” The New York Times March 9,
p. A23.Scott, A. O. 2004. “Tallyho! Spin, Flag Waving And Shouting To Catch a Fox.” The New York Times
July 20, p. E1 (Late Edition — Final).Skocpol, T. 2003. Diminished Democracy: From Membership to Management in American Civic Life.
Norman, OK: University of Oklahoma Press.Smith, J. K., A. S. Gerber, and A. Orlich. 2003. “Self-Prophecy Effects and Voter Turnout: An
Experimental Replication.” Political Psychology 24(3): 593–604.Thislethwaite, D., and D. Campbell. 1960. “Regression-discontinuity analysis: An alternative to ex post
facto experiment.” Journal of Educational Psychology 51: 309–317.Visser, R., and J. De Leeuw. 1984. “Maximum Likelihood Estimation for a Generalized Regression-
Discontinuity Design.” Journal of Educational Statistics 9(1): 45–60.