mouse transcriptome: neutral evolution of ‘non-coding’ complementary dnas
TRANSCRIPT
Okazaki et al. have argued that as manyas 15,815 of 33,409 non-redundantmouse complementary DNAs may
represent functional RNA genes1, on thebasis of their findings that some of thesecDNAs are confirmed by expressed sequencetagging and are found near CpG islands orpolyadenylation signals2 — although manyare expressed at such low levels that theycould not be detected by microarrayanalysis3. We show here that conservation ofthese ‘non-coding’ cDNAs in rats or humansis no better than in an evolutionarily neutralcontrol. Our results indicate that they areeither non-functional or, if they are func-tional, are specific to a given species.
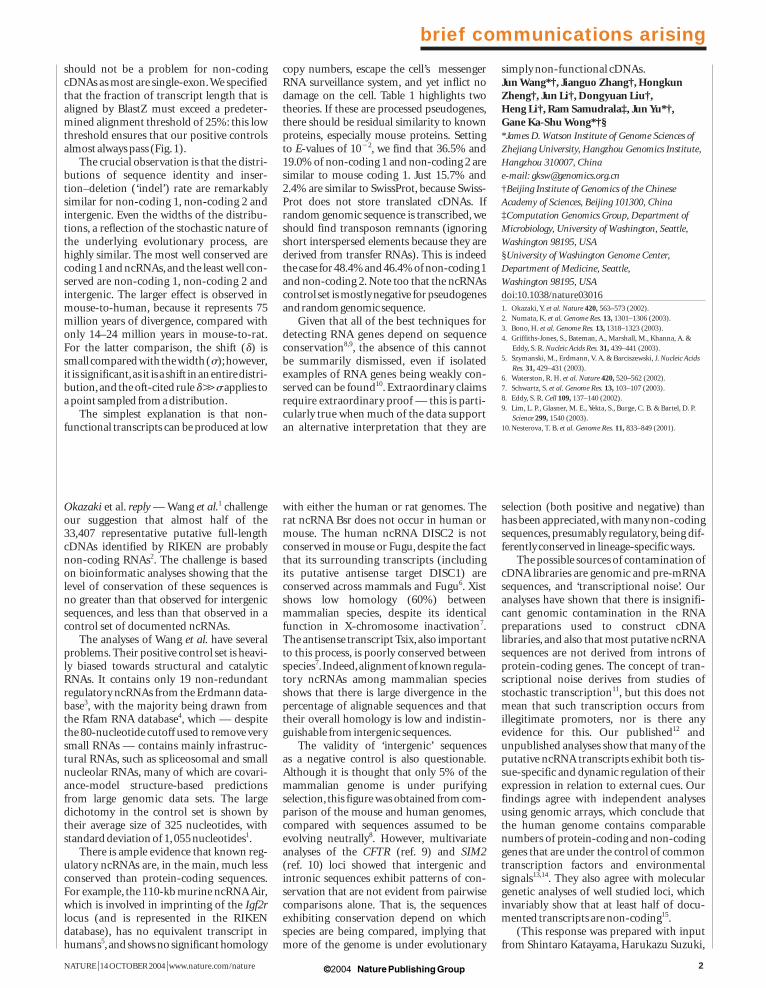
We downloaded FANTOM release 2.0cDNAs from the authors’ website. Table 1shows the data from the four categoriesdefined by the authors, which we refer to ascoding 1 (probably protein), coding 2 (mar-ginal protein), non-coding 1 (marginalRNA), and non-coding 2 (probably RNA).Overall transcript sizes average about 2 kilo-bases (kb) in each category; most knownRNA genes are much smaller than this — forexample, the 587 mouse entries in the Rfamdatabase4 average 96 base pairs (bp) in length.Larger RNA genes do exist (such as H19 andXist) and many are stored in the Erdmanndatabase5. Another striking differencebetween the given categories is the increasefrom 13.4% single-exon genes in coding 1 to68.7% and 73.1% single-exon genes in non-coding 1 and non-coding 2,respectively.
As an evolutionarily neutral control, weuse ‘intergenic’ sequences of 2 kb in lengththat are at least 5 kb distant from genes anno-tated by Ensembl, predicted by FgeneSH, oraligned to cDNAs.Transposons identified byRepeatMasker are excluded, as is the 5% ofhighly conserved mouse sequence that isunder purifying selection6. Conversely, wehave two positive controls: one is the coding1 category of protein-coding genes and theother is a set of all known mouse RNA genes.To avoid an overt bias towards small RNAgenes, we removed genes smaller than 80 bpin Rfam, leaving behind many encodingsplicing factors such as U1 and U6. We thenadded all the mouse genes in the Erdmanndatabase, which total 40. The resultant set of321 RNA genes is referred to as ‘ncRNAs’.
Genome sequences were taken from theUCSC Genome Browser with time stamp 28June 2003 (rat) and 10 April 2003 (human).BlastZ (ref. 7) was used for the alignments,with default settings K43,000 andH42,200. The C42 option enabled us tochain exons together.Although the complex-ities of the chaining procedure may prevent afew multi-exon genes from aligning, this
brief communications arising
NATURE | 14 OCTOBER 2004 | www.nature.com/nature 1
Mouse transcriptome
Neutral evolution of ‘non-coding’ complementary DNAsArising from: Y. Okazaki et al. Nature 420, 563–573 (2002)
0
10
20
30
60 70 80 90 100
Num
ber
of c
omp
lem
enta
ry D
NA
s (%
)
0
10
20
30
40
50
0 1 2 3
0
25
50
75
100
0 25 50 75 100
0
10
20
30
40
0 1 2 3 4Insertion–deletion rate (%)
0
10
20
30
50 60 70 80 90 100Sequence identity (%)
0
25
50
75
100
0 25 50 75 100Alignment threshold (%)
a
c
e f
d
b
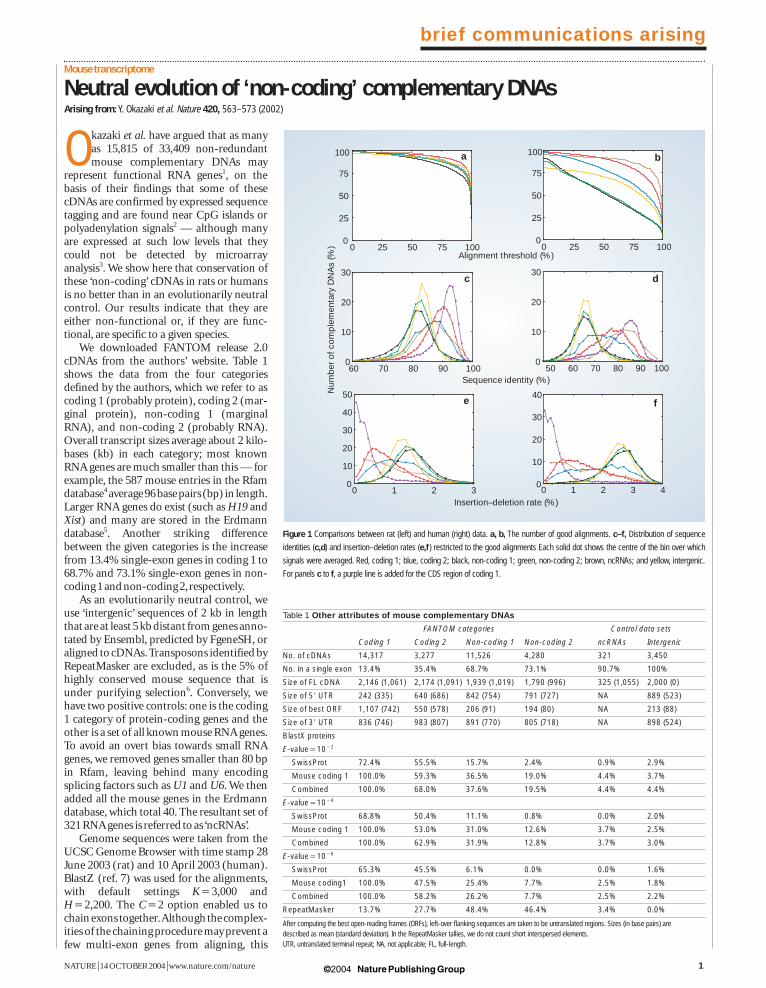
Figure 1 Comparisons between rat (left) and human (right) data. a, b, The number of good alignments. c–f, Distribution of sequence
identities (c,d) and insertion–deletion rates (e,f ) restricted to the good alignments Each solid dot shows the centre of the bin over which
signals were averaged. Red, coding 1; blue, coding 2; black, non-coding 1; green, non-coding 2; brown, ncRNAs; and yellow, intergenic.
For panels c to f, a purple line is added for the CDS region of coding 1.
Table 1 Other attributes of mouse complementary DNAs
FANTOM categories Control data sets
Coding 1 Coding 2 Non-coding 1 Non-coding 2 ncRNAs Intergenic
No. of cDNAs 14,317 3,277 11,526 4,280 321 3,450
No. in a single exon 13.4% 35.4% 68.7% 73.1% 90.7% 100%
Size of FL cDNA 2,146 (1,061) 2,174 (1,091) 1,939 (1,019) 1,790 (996) 325 (1,055) 2,000 (0)
Size of 58 UTR 242 (335) 640 (686) 842 (754) 791 (727) NA 889 (523)
Size of best ORF 1,107 (742) 550 (578) 206 (91) 194 (80) NA 213 (88)
Size of 38 UTR 836 (746) 983 (807) 891 (770) 805 (718) NA 898 (524)
BlastX proteins
E-value41012
SwissProt 72.4% 55.5% 15.7% 2.4% 0.9% 2.9%
Mouse coding 1 100.0% 59.3% 36.5% 19.0% 4.4% 3.7%
Combined 100.0% 68.0% 37.6% 19.5% 4.4% 4.4%
E-value41014
SwissProt 68.8% 50.4% 11.1% 0.8% 0.0% 2.0%
Mouse coding 1 100.0% 53.0% 31.0% 12.6% 3.7% 2.5%
Combined 100.0% 62.9% 31.9% 12.8% 3.7% 3.0%
E-value41016
SwissProt 65.3% 45.5% 6.1% 0.0% 0.0% 1.6%
Mouse coding1 100.0% 47.5% 25.4% 7.7% 2.5% 1.8%
Combined 100.0% 58.2% 26.2% 7.7% 2.5% 2.2%
RepeatMasker 13.7% 27.7% 48.4% 46.4% 3.4% 0.0%
After computing the best open-reading frames (ORFs), left-over flanking sequences are taken to be untranslated regions. Sizes (in base pairs) are described as mean (standard deviation). In the RepeatMasker tallies, we do not count short interspersed elements.UTR, untranslated terminal repeat; NA, not applicable; FL, full-length.
© 2004 Nature Publishing Group
should not be a problem for non-codingcDNAs as most are single-exon.We specifiedthat the fraction of transcript length that isaligned by BlastZ must exceed a predeter-mined alignment threshold of 25%: this lowthreshold ensures that our positive controlsalmost always pass (Fig.1).
The crucial observation is that the distri-butions of sequence identity and inser-tion–deletion (‘indel’) rate are remarkablysimilar for non-coding 1, non-coding 2 andintergenic. Even the widths of the distribu-tions, a reflection of the stochastic nature ofthe underlying evolutionary process, arehighly similar. The most well conserved arecoding 1 and ncRNAs,and the least well con-served are non-coding 1, non-coding 2 andintergenic. The larger effect is observed inmouse-to-human, because it represents 75million years of divergence, compared withonly 14–24 million years in mouse-to-rat.For the latter comparison, the shift (d) issmall compared with the width (s);however,it is significant,as it is a shift in an entire distri-bution,and the oft-cited rule d¤¤s applies toa point sampled from a distribution.
The simplest explanation is that non-functional transcripts can be produced at low
copy numbers, escape the cell’s messengerRNA surveillance system, and yet inflict nodamage on the cell. Table 1 highlights two theories. If these are processed pseudogenes,there should be residual similarity to knownproteins, especially mouse proteins. Setting to E-values of 1012, we find that 36.5% and19.0% of non-coding 1 and non-coding 2 aresimilar to mouse coding 1. Just 15.7% and2.4% are similar to SwissProt, because Swiss-Prot does not store translated cDNAs. Ifrandom genomic sequence is transcribed, weshould find transposon remnants (ignoringshort interspersed elements because they arederived from transfer RNAs). This is indeedthe case for 48.4% and 46.4% of non-coding 1and non-coding 2. Note too that the ncRNAscontrol set is mostly negative for pseudogenesand random genomic sequence.
Given that all of the best techniques fordetecting RNA genes depend on sequenceconservation8,9, the absence of this cannotbe summarily dismissed, even if isolated examples of RNA genes being weakly con-served can be found10. Extraordinary claimsrequire extraordinary proof –– this is parti-cularly true when much of the data supportan alternative interpretation that they are
brief communications arising
NATURE | 14 OCTOBER 2004 | www.nature.com/nature 2
simply non-functional cDNAs.Jun Wang*†, Jianguo Zhang†, HongkunZheng†, Jun Li†, Dongyuan Liu†,Heng Li†, Ram Samudrala‡, Jun Yu*†,Gane Ka-Shu Wong*†§*James D. Watson Institute of Genome Sciences ofZhejiang University, Hangzhou Genomics Institute,Hangzhou 310007, Chinae-mail: [email protected]†Beijing Institute of Genomics of the ChineseAcademy of Sciences, Beijing 101300, China‡Computation Genomics Group, Department ofMicrobiology, University of Washington, Seattle,Washington 98195, USA§University of Washington Genome Center,Department of Medicine, Seattle,Washington 98195, USAdoi:10.1038/nature030161. Okazaki, Y. et al. Nature 420, 563–573 (2002).2. Numata, K. et al. Genome Res. 13, 1301–1306 (2003).3. Bono, H. et al. Genome Res. 13, 1318–1323 (2003).4. Griffiths-Jones, S., Bateman, A., Marshall, M., Khanna, A. &
Eddy, S. R. Nucleic Acids Res. 31, 439–441 (2003).5. Szymanski, M., Erdmann, V. A. & Barciszewski, J. Nucleic Acids
Res. 31, 429–431 (2003).6. Waterston, R. H. et al. Nature 420, 520–562 (2002).7. Schwartz, S. et al. Genome Res. 13, 103–107 (2003).8. Eddy, S. R. Cell 109, 137–140 (2002).9. Lim, L. P., Glasner, M. E., Yekta, S., Burge, C. B. & Bartel, D. P.
Science 299, 1540 (2003).10.Nesterova, T. B. et al. Genome Res. 11, 833–849 (2001).
Okazaki et al. reply — Wang et al.1 challengeour suggestion that almost half of the33,407 representative putative full-lengthcDNAs identified by RIKEN are probablynon-coding RNAs2. The challenge is basedon bioinformatic analyses showing that thelevel of conservation of these sequences isno greater than that observed for intergenicsequences, and less than that observed in acontrol set of documented ncRNAs.
The analyses of Wang et al. have severalproblems. Their positive control set is heavi-ly biased towards structural and catalyticRNAs. It contains only 19 non-redundantregulatory ncRNAs from the Erdmann data-base3, with the majority being drawn fromthe Rfam RNA database4, which — despitethe 80-nucleotide cutoff used to remove verysmall RNAs — contains mainly infrastruc-tural RNAs, such as spliceosomal and smallnucleolar RNAs, many of which are covari-ance-model structure-based predictionsfrom large genomic data sets. The largedichotomy in the control set is shown bytheir average size of 325 nucleotides, withstandard deviation of 1,055 nucleotides1.
There is ample evidence that known reg-ulatory ncRNAs are, in the main, much lessconserved than protein-coding sequences.For example, the 110-kb murine ncRNA Air,which is involved in imprinting of the Igf2rlocus (and is represented in the RIKEN database), has no equivalent transcript inhumans5,and shows no significant homology
with either the human or rat genomes. Therat ncRNA Bsr does not occur in human ormouse. The human ncRNA DISC2 is notconserved in mouse or Fugu, despite the factthat its surrounding transcripts (includingits putative antisense target DISC1) are conserved across mammals and Fugu6. Xistshows low homology (60%) between mammalian species, despite its identicalfunction in X-chromosome inactivation7.The antisense transcript Tsix,also importantto this process, is poorly conserved betweenspecies7.Indeed,alignment of known regula-tory ncRNAs among mammalian speciesshows that there is large divergence in thepercentage of alignable sequences and thattheir overall homology is low and indistin-guishable from intergenic sequences.
The validity of ‘intergenic’ sequences as a negative control is also questionable.Although it is thought that only 5% of themammalian genome is under purifyingselection, this figure was obtained from com-parison of the mouse and human genomes,compared with sequences assumed to beevolving neutrally8. However, multivariateanalyses of the CFTR (ref. 9) and SIM2(ref. 10) loci showed that intergenic andintronic sequences exhibit patterns of con-servation that are not evident from pairwisecomparisons alone. That is, the sequencesexhibiting conservation depend on whichspecies are being compared, implying thatmore of the genome is under evolutionary
selection (both positive and negative) thanhas been appreciated,with many non-codingsequences, presumably regulatory, being dif-ferently conserved in lineage-specific ways.
The possible sources of contamination ofcDNA libraries are genomic and pre-mRNAsequences, and ‘transcriptional noise’. Ouranalyses have shown that there is insignifi-cant genomic contamination in the RNApreparations used to construct cDNAlibraries, and also that most putative ncRNAsequences are not derived from introns ofprotein-coding genes. The concept of tran-scriptional noise derives from studies ofstochastic transcription11, but this does notmean that such transcription occurs fromillegitimate promoters, nor is there any evidence for this. Our published12 andunpublished analyses show that many of theputative ncRNA transcripts exhibit both tis-sue-specific and dynamic regulation of theirexpression in relation to external cues. Ourfindings agree with independent analysesusing genomic arrays, which conclude thatthe human genome contains comparablenumbers of protein-coding and non-codinggenes that are under the control of commontranscription factors and environmental signals13,14. They also agree with moleculargenetic analyses of well studied loci, whichinvariably show that at least half of docu-mented transcripts are non-coding15.
(This response was prepared with inputfrom Shintaro Katayama, Harukazu Suzuki,
© 2004 Nature Publishing Group