mortality among the working age population receiving incapacity benefits in new zealand, 1981–2004
TRANSCRIPT

lable at ScienceDirect
Social Science & Medicine 73 (2011) 568e575
Contents lists avai
Social Science & Medicine
journal homepage: www.elsevier .com/locate/socscimed
Mortality among the working age population receiving incapacity benefitsin New Zealand, 1981e2004q
Caroline Shawa,*, Tony Blakely a, Martin Tobias b
aDepartment of Public Health, University of Otago, PO Box 7343, Wellington South, New ZealandbHealth and Disability Intelligence, Ministry of Health, Wellington, New Zealand
a r t i c l e i n f o
Article history:Available online 30 June 2011
Keywords:New ZealandMortalityAdultDisability insuranceFollow-up studies
q TheNewZealand CensuseMortality Study is a studsocial factors and mortality in New Zealand, based on tpopulation census data fromStatistics NewZealand anZealand Health Information Service. The project wasZealand as a Data Laboratory project under the MicroThe data sets created by the integration process are cocan be used for statistical purposes only. Only approvedStatistics New Zealand’s declaration of secrecy can accData Laboratory. For further information about confidthis study, please contact Statistics New Zealand.This paper is publishedwith the approval of the DeputyDisability Systems and Strategy), Ministry of Healthauthors’ own and do not necessarily reflect the Minist* Corresponding author. Tel.: þ64 4 918 5087.
E-mail address: [email protected] (C. Sha
0277-9536/$ e see front matter � 2011 Elsevier Ltd.doi:10.1016/j.socscimed.2011.06.003
a b s t r a c t
Like many OECD countries New Zealand has experienced a large increase in the number of working-agepeople receiving incapacity benefits in the last 3 decades, despite apparent improvements in populationhealth. This paper examines trends in mortality rates of people receiving sickness benefit or invalid’sbenefit (SBIB) between 1981 and 2004 using repeated cohort studies (linking the 1981, 1986, 1991, 1996,and 2001 censuses to mortality data). Mortality rates, standardised for age and ethnicity, were calculatedfor each census cohort for 25e64 year olds by benefit receipt status. Standardised rate differences andrate ratios and 95% confidence intervals were calculated to measure disparities on both absolute andrelative scales. Between 1981 and 2004 overall SBIB receipt increased from 2% to 5% of the working agepopulation. Mortality rates were at least three times higher in the SBIB than the non-SBIB group at allpoints in time for men and women. Mortality rates declined in all groups, for example in men receivingSBIB, mortality decreased from 2354/100 000 in the 1981e84 cohort to 1371/100 000 in the 2001e04cohort. Absolute inequalities between SBIB and non-SBIB declined in both men and women (for examplein women standardised rate differences decreased from 954/100 000 to 688/100 000) but relativeinequalities remained largely stable (for example in men the risk ratio increased from 4.27 to 4.54).Mortality rates declined more in sickness benefit than invalid’s benefit recipients. The substantialexpansion of SBIB receipt in New Zealand has not been accompanied by any reduction in the excessmortality risk experienced by SBIB recipients. These findings are likely to reflect the changing nature ofthe economy, labour force and disability experience in New Zealand.
� 2011 Elsevier Ltd. All rights reserved.
Introduction
Similar to other developed countries New Zealand providesincome support for working age people with an illness or disabilitywhich limits employment. To be eligible for an invalid’s benefit (IB)
y of the relationship betweenhe integration of anonymiseddmortality data from theNewapproved by Statistics New
data Access Protocols in 1997.vered by the Statistics Act andresearcherswho have signedess the integrated data in theentiality matters in regard to
Director General (Health and. However, opinions are thery’s policy advice.
w).
All rights reserved.
an individual must be permanently and severely restricted in his orher capacity for work. “Permanently” is defined as an illness/disability which is either expected to last longer than 2 years or isterminal, with survival being estimated at less than two years.“Severe” indicates that an individual is not capable of working 15 hormore aweek. Sickness benefit (SB) is targeted to individuals withshorter-term conditions; to qualify an individual must havea condition that limits capacity to seek or undertake full timeemployment, or be in employment but losing earnings throughsickness or injury (Wilson, McLeod, & Sathiyandra, 2005). There ishowever evidence that the distinctions between these groups areless clear in practice than in theory (Beynon & Tucker, 2006). Bothof these benefits are income tested (i.e. dependent on the income ofthe person and their partner, but not assets). In New Zealanddisability caused by injury is covered by a separate employment-related social insurance scheme (Accident Compensation Corpo-ration), which pays earnings-related weekly compensation (Wilsonet al., 2005). Payments for all of these benefits continue as long asthe incapacity is present.

Textbox 1. The New Zealand macroeconomic environment
1980s and beyond
The number of people receiving SBIB in New Zealand has
increased substantially introduction of these benefits in the
1970s through to the present time (see Fig. 1). This increase
is against a backdrop of changes in the conceptualisation of
disability in society, as well as substantive (and largely
unevaluated) modifications in benefit policy e.g. changes in
medical entitlement, benefit levels, and work expectations.
(Wilson et al., 2005) Additionally this consistent increase in
numbers receiving SBIB occurred during a period of
upheaval in the New Zealand macro-and micro- economic
environment. This included a transition from a universal
welfare state to a more residual welfare state from 1984 to
the late 1990s, followed by a return to policies more
consistent with a universal welfare state model from 1999
onwards. (Belich, 2001; Boston, Dalziel, & John, 1999a;
Cheyne, O’Brien, & Belgrave, 1997).
The economy was largely stagnant during the 1980s; there
were economic recessions in the early 1990s and again in
1998/1999 followed by a sustained and unprecedented
period of economic growth in the early 2000s. Over this time
unemployment increased from 4.1% in 1986 to 10.2% in
1993 and then fell to 3.7% by 2005 (Ministry of Social
Development, 2008).
C. Shaw et al. / Social Science & Medicine 73 (2011) 568e575 569
In New Zealand the number of people receiving sickness bene-fits and invalids’ benefits (SBIB) has increased in a relatively linearfashion in the last 3 decades, in comparison to uptake of unem-ployment benefit which clearly shows the impact of macroeco-nomic cycles (see Fig. 1). While the New Zealand macro-economiccontext may be relatively unique (see Box 1), New Zealand hasnot been alone in facing an increase in the population receivingdisability-type benefits. For example in the UK between 1984 and2003 the proportion of the working age population receivingdisability benefits increased from about 3% to 7%. The Netherlandsexperienced increases in this population in the 1970s, which thenstabilised over the 1980s and 1990s at about 10% of theworking agepopulation, whereas the Scandinavian countries showed sustainedincreases between 1984 and 2003 (Kemp, 2006a).
Correspondingly the proportion of GDP spent on SBIB orequivalent incapacity benefits has also increased in many countries(Kemp, 2006a; Organisation for Economic Co-operation andDevelopment, 2003).
Concerns have been voiced, locally and internationally, aboutthe increase in numbers of people receiving disability benefits(Kemp, 2006b; Lunt, 2006). In the context of a global economicrecession and associated governmental parsimony, this will onlyintensify.(Bambra, 2008, 2010; Welfare Working Group, 2010) Atfirst glance, the increase in numbers of people receiving SBIB isparadoxical: the number of working age people receiving incomesupplementation for disability or sickness is increasing, but, in NewZealand at least, the population is increasingly long-lived andhealthy (Ajwani, Blakely, Robson, Tobias, & Bonne, 2003; Ministryof Health, 2008; New Zealand Health Information Service, 2007).
Internationally the increase in numbers of people receivingdisability-type benefits is thought to be due to a complex range ofsociological, policy and economic processes; changes in populationprevalence of illness and disability are not thought to account fora large proportion of the growth in benefit numbers (Kemp, 2006a).Specifically any growth in numbers of people on SBIB is due to anincrease in inflow and/or a decrease in outflow (i.e. increasedduration on benefit) (Wilson et al., 2005). These flows are influ-enced by drivers acting on the supply side (e.g. benefit coverage,eligibility criteria or benefit level, the availability of other benefits,the facilitated restructuring of the workforce and financial
-
20,000
40,000
60,000
80,000
100,000
120,000
140,000
160,000
180,000
200,000
1976
1978
1980
1982
1984
1986
1988
End of March to 1
Nu
mb
er o
f recip
ien
ts
Unemployment and Training Benefits
Domestic Purposes and Widows Benefits
Note: Unemployment benefit also includ
Fig. 1. Number receiving state benefits all ages, 1975e2005. Source: Wilson et a
incentives/disincentives) and demand side (e.g. demographictrends, trends in population health, disability and mortality andeconomic cycles) (Kemp, Sunden, & Bakker-Tauritz, 2006).
The increase in SBIB between 1981 and 2004 in New Zealandreflects a complexmix of supply and demand side factors, similar toother OECD countries (Kemp et al., 2006). Some potential factorsinclude:
� Growth and ageing of the New Zealand population (Wilson &McLeod, 2006; Wilson et al., 2005).
� The increase in female participation in the New Zealandworkforce (Statistics New Zealand, 2008).
1990
1992
1994
1996
1998
2000
2002
2004
2006
989, end of June thereafter
Invalid's Benefit
Sickness Benefit
es an emergency benefit
l., 2005. Note: Unemployment benefit also includes an emergency benefit.
C. Shaw et al. / Social Science & Medicine 73 (2011) 568e575570
� Deinstitutionalisation of long-term residents of mental healthunits (Wilson et al., 2005).
� The effect of macroeconomic cycles over this time period,although the direction of the effect of such cycles on benefituptake is not entirely clear (Gjesdal, Lie, & Maeland, 2004;Kemp et al., 2006; Wilson & McLeod, 2006).
� The effect of structural reforms in New Zealand between 1984and the early 1990s, which (simplistically) involved neoliberalreforms from a universal to a residual type welfare state(Boston et al., 1999b).
In addition to these structural societal changes there have beenextensive policy reforms to SB and IB (as well as other benefits,which had flow on effects to SB and IB). Changes include increasingthe age of New Zealand Superannuation eligibility from 60 to 65between 1992 and 2001; cutting the level of all working agebenefits except SB in 1991; changes in the eligibility for IB from ‘75%incapacitated’ to ‘permanently and severely restricted’; and theintroduction and then abandonment of a ‘designated doctor’scheme, which required individuals to prove ongoing incapacityfrom specific doctors. In addition there were changes in thestructure and focus of the agency responsible for welfare paymentsand in expectations around work and case management of indi-viduals on benefits (Wilson et al., 2005). The impact of many ofthese changes seems to have been largely unevaluated; however SBand IB receipt in New Zealand has continued to rise despite thesechanges. This is consistent with policy efforts in other jurisdictionsaimed at decreasing the numbers of people receiving disabilitybenefits, which have had little success (Organisation for EconomicCo-operation and Development, 2003).
Given increasing numbers of people receiving benefits,improving overall population health and the lack of successfulpolicy interventions to limit the increase in benefit uptake, ananalysis of mortality patterns in the beneficiary population shouldbe of interest to policy makers. Mortality is an objective measure of(poor) health. There are good reasons to expect that the SBIBpopulation would have higher mortality risks than the rest of theworking age population, as this is a population with moderate tosevere incapacity, which might be expected to increase theirmortality risks. Box 2 summarises what is known aboutmortality inrecipients of SBIB.
Textbox 2. Mortality in populations receiving disability
benefits
Little is known about this in New Zealand. Twenty five
percent of a cohort of people who commenced IB in 1993
died in the subsequent 9 years, compared to 4% of SB
recipients (Wilson et al., 2005). Internationally it has been
noted in a number of (largely Scandinavian) studies that
people receiving disability benefits have higher mortality
than the remainder of the working age population (Ahs &
Westerling, 2006b; Karlsson, Carstensen, Gjesdal, &
Alexanderson, 2007; Quaade, Engholm, Johansen, &
Moller, 2002; Rupp & Scott, 1996; Wallman et al., 2006).
The majority of these studies show mortality risk 2e3 times
higher than the remainder of the working age population.
Studies that have looked at cause-specific mortality have
shown that people who receive disability benefits die of
similar causes to those who do not receive them, although
some causes of death (such as psychiatric conditions) may
be more common in this group (Lunt, 2006; Quaade et al.,
2002; Wallman et al., 2006).
All available information on mortality in populations receivingdisability benefits is cross-sectional; to our knowledge no one hasexamined mortality trends in the SBIB population over time,specifically over this period characterised by expansion of receipt inbenefits and substantive improvements in population health.
This paper examinesmortality rates and trends in SBIB recipientsin New Zealand and compares themwith the rest of theworking agepopulation. We hypothesise that mortality rates will be higheramong SBIB recipients but that rates will have declined over time(similar to the rest of the New Zealand population).Wewere unsurewhether SBIB mortality rates will have declined more or less thanthe rest of the New Zealand population. If mortality rates declinemore for the SBIB group (in percentage terms at least), one mightdeduce that the average health of this group has improved overtime. On the other hand, if SBIB mortality rates decrease less thanthose of the general population, one might speculate that (amongother reasons) the targeting of these benefits to the sicker people inthe population has improved over time. Findings from New Zealandwill be of interest to other countries as, despite contextual differ-ences, there are probably common processes occurring acrossjurisdictions that have led to increases in benefit receipt over time.Having a better understanding of the health outcomes of this groupmay be useful to inform ongoing policy work.
Methods
Data
We created five retrospective cohort studies of the entire NewZealand population, by linking records from 1981, 1986, 1991, 1996,or 2001 census respondents aged 0e74 to mortality records for thethree years following each census. We used probabilistic recordlinkage methods to anonymously link these data, using Automatchand Validity software. The matching variables were sex, date ofbirth, country of birth, and ethnic group. The blocking variable wasaddress geocoded at meshblock (about 100 people) or census areaunit level (about 2000 people), so individuals who changed addressbetween the census night and death were less likely to be linked.The percentages of eligible mortality records linked to a censusrecordwere 70.9%, 73.7%, 76.3%, 77.6%, and 79.6% for the five censuscohorts, respectively (Fawcett, Atkinson, Herd, & Blakely, 2008; Hill,Atkinson, & Blakely, 2002). Over 96% of these linkages were esti-mated to be true positives (T Blakely & Salmond, 2002). To correctfor any linkage bias and to avoid underestimation of mortality ratesusing the linked datasets, we calculated weights for strata based onage, sex, ethnicity, and small area deprivation. For example, if, out of30 M�aori men who died aged 45e64 years and had lived inmoderately deprived small areas of New Zealand, 20 were linked toa census record, each of the 20 linked records received a weight of1.5 (30/20). All analyses presented in this report use these weights,and they have been shown to satisfactorily adjust for linkage bias(Fawcett, Blakely, & Atkinson, 2002).
Statistical analysis
This analysis was restricted to individuals aged 25e64 yearswho were present in their usual residence on census night. Receiptof benefit was identified from census forms, which ask aboutsource(s) of income for the preceding 12 months. Individuals couldreport receiving one or both benefits over the last 12 months (butcould not receive the benefits concurrently). In two New Zealandcensuses (1986 and 1991) censuses SBIB receipt were combined inone question. Hence for all cohorts analyses are presented for bothbenefits together and separately for the 1981, 1996 and 2001cohorts.

Table
1Se
xan
dag
edistribution
ofSB
IBrecipients
compared
totherest
oftheNew
Zealan
dworkingag
epop
ulation
.
1981
e84
1986
e89
1991
e94
1996
e99
2001
e04
NoSB
IBSB
IBNoSB
IBSB
IBNoSB
IBSB
IBNoSB
IBSB
IBNoSB
IBSB
IB
n%
n%
n%
n%
n%
n%
n%
n%
n%
n%
Female
25e39
32,189
799
.032
401.0
359,00
798
.555
801.5
378,52
297
.884
572.2
397,45
596
.514
,304
3.5
385,53
996
.514
,043
3.5
40e49
150,69
398
.719
471.3
169,59
998
.231
921.8
199,48
897
.061
473.0
227,72
795
.810
,092
4.2
246,34
595
.511
,508
4.5
50e59
139,98
398
.126
431.9
134,35
597
.533
962.5
134,63
795
.070
175.0
151,52
793
.310
,899
6.7
181,13
792
.414
,880
7.6
60e64
62,490
99.4
351
0.6
66,051
99.3
480
0.7
65,253
98.9
735
1.1
60,546
96.6
2139
3.4
66,753
92.2
5631
7.8
25e64
6750
6098
.881
811.2
729,01
598
.312
,651
1.7
777,90
097
.222
,356
2.8
837,25
295
.737
,437
4.3
879,77
495
.046
,065
5.0
Male
25e39
313,84
898
.451
121.6
345,84
097
.782
682.3
354,86
197
.210
,224
2.8
364,98
996
.015
,276
4.0
340,98
995
.814
,820
4.2
40e49
151,42
298
.030
212.0
167,60
497
.641
402.4
196,58
497
.158
472.9
219,48
395
.896
244.2
229,88
195
.311
,277
4.7
50e59
140,97
996
.255
293.8
135,43
895
.268
224.8
133,75
893
.986
316.1
149,31
393
.210
,881
6.8
178,09
293
.312
,807
6.7
60e64
56,109
98.7
714
1.3
62,718
98.3
1074
1.7
65,217
98.0
1314
2.0
58,839
94.7
3315
5.3
628,14
90.1
6933
9.9
25e64
662,35
597
.914
,373
2.1
711,60
097
.220
,307
2.8
750,41
796
.626
,016
3.4
792,61
895
.339
,090
4.7
811,77
394
.745
,840
5.3
SBIB
¼sick
nessbe
nefi
tor
inva
lid’s’be
nefi
t.Numbe
rsareweigh
tedto
dea
lwithlin
kage
bias
andhav
ebe
enrandom
rounded
asper
Statistics
New
Zealan
dprotoco
lsto
preserveco
nfiden
tiality.
C. Shaw et al. / Social Science & Medicine 73 (2011) 568e575 571
All other individual (and household) characteristics werederived from the relevant census forms. A modified “totalethnicity” approach was used to classify ethnicity (Statistics NewZealand, 2005), meaning that if an individual indicated ethnicaffiliation with M�aori, Pacific and/or Asian peoples they werecounted in any/all of these groups. People who did not indicateaffiliation with any of these groups were placed in a residual group(non M�aori/Pacific/Asian- nMPA). This approach allows multipleethnic affiliations to be recorded when breaking down the SBIBpopulation. (However, for standardisation results a prioritised (oneethnic group only per person) approach was used.) Overall, theproportion of this population with affiliation to more than oneethnic group was <1% in all cohorts.
In the scenario of decreasing average mortality rates over time,there could be four types of trend in inequalities: both increasingrelative and absolute inequalities; increasing relative inequalities,but stable absolute inequalities; stable relative inequalities, butdecreasing absolute inequalities; and both decreasing relative andabsolute inequalities (Blakely, Tobias, & Atkinson, 2008). Therefore,it is important to present trends in mortality rates, rate differences,and rate ratios (Mackenbach & Kunst, 1997).
We calculated rates standardised for age and ethnicity, ratedifferences, and rate ratios. We applied the age distribution fromWHO’s world population to each of the three main ethnic groups ofNew Zealand (M�aori, Pacific and other), and ensured that the sumof age-weights within each ethnic group equalled that ethnicgroup’s proportion of the 2001 census (14.1% M�aori, 5.2% Pacific,80.7% other). Ethnicity is a determinant of both benefit receipt andmortality and varies in its distribution over time, making ita confounder of associations between benefit receipt and mortality.We conducted comparisons over time by comparing age andethnicity standardised mortality rates, rate differences, and rateratios over the five census cohorts, looking for patterns andconsidering 95% confidence intervals.
All analyses were conducted in SAS.Ethics approval was granted to the NZCMS work programme by
the Wellington Regional Ethics Committee (WGT/98/01/001).
Results
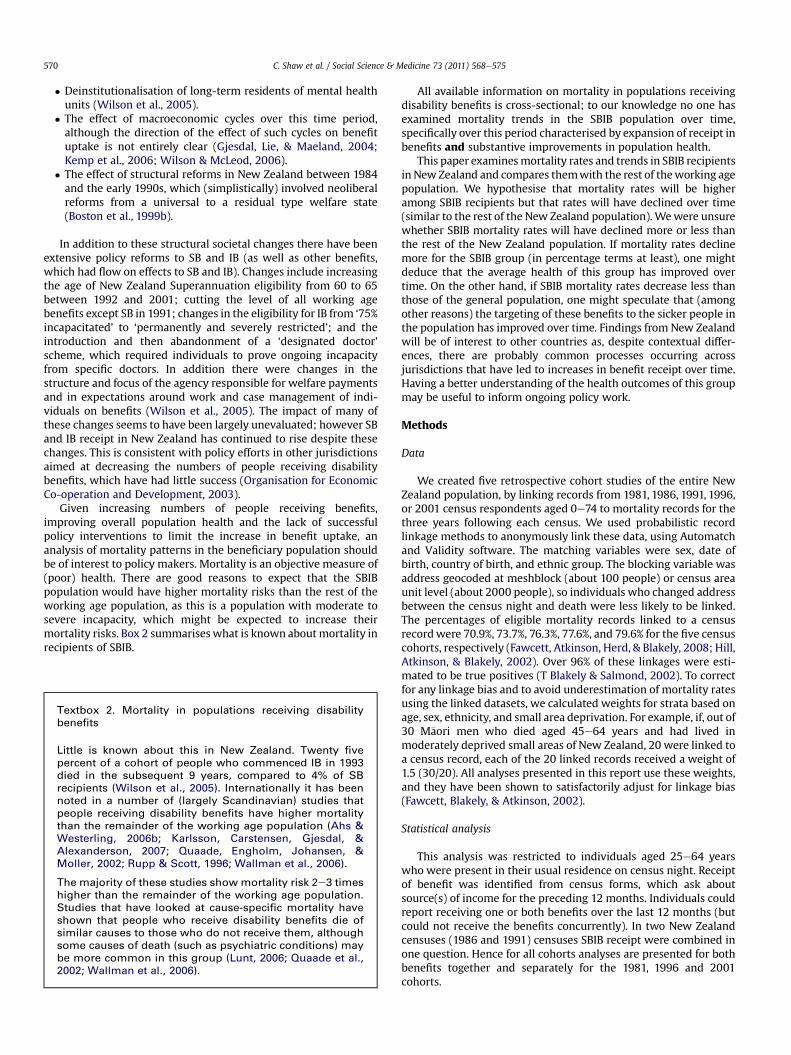
Table 1 and Fig. 2 show the basic demographics of SBIB recipi-ents in the 5 cohorts. There has been an increase in the proportionof the working age population in New Zealand receiving SBIB overtime, from 1.7% in the 1981 cohort to 5.2% in the 2001 cohort. Therewas a change in the gender distribution of SBIB receipt over thistime period. In the 1981 cohort, menwere twice as likely to receivethe SBIB compared towomen; however, by the 2001 cohort, receiptof SBIB was equal by gender.
Receipt of SBIB was linked to age: the 50e59-year age-groupwere more likely to be in receipt of SBIB than the 25e39-year-oldage group. For example 50e59 year old males in 1986e89 weretwice as likely to be receiving SBIB as males aged 25e46 and in the2001e2004 period were 1.6 times more likely. Over the 25 yearsstudied, however, all age groups had an increase in SBIB receipt. Theincrease was most marked in 60e64-year-olds (from 1% of this agegroup in 1981-84 to 8e10% in 2001e04) reflecting the gradualincrease in the age of eligibility for New Zealand Superannuationfrom 60 to 65 between 1992 and 2001.
Between 69 and 85 percent of people receiving SBIB were in thenon-M�aori/Pacific/Asian (nMPA) group depending on sex andcohort. However, there were differences in the likelihood ofreceiving a benefit which varied by ethnic group. People of Asianethnicity were roughly half as likely to receive SBIB as nMPA. Theproportion of the Pacific population receiving SBIB was initiallyquite similar to the nMPA, but by the 2001 cohort Pacific men and
0.0%
1.0%
2.0%
3.0%
4.0%
5.0%
6.0%
7.0%
8.0%
9.0%
10.0%
Maori Pacific Asian nMPA Maori Pacific Asian nMPA
Female Male
19811986199119962001
Fig. 2. Proportion of population receiving SBIB by ethnicity aged 25e64 1981e2004.
C. Shaw et al. / Social Science & Medicine 73 (2011) 568e575572
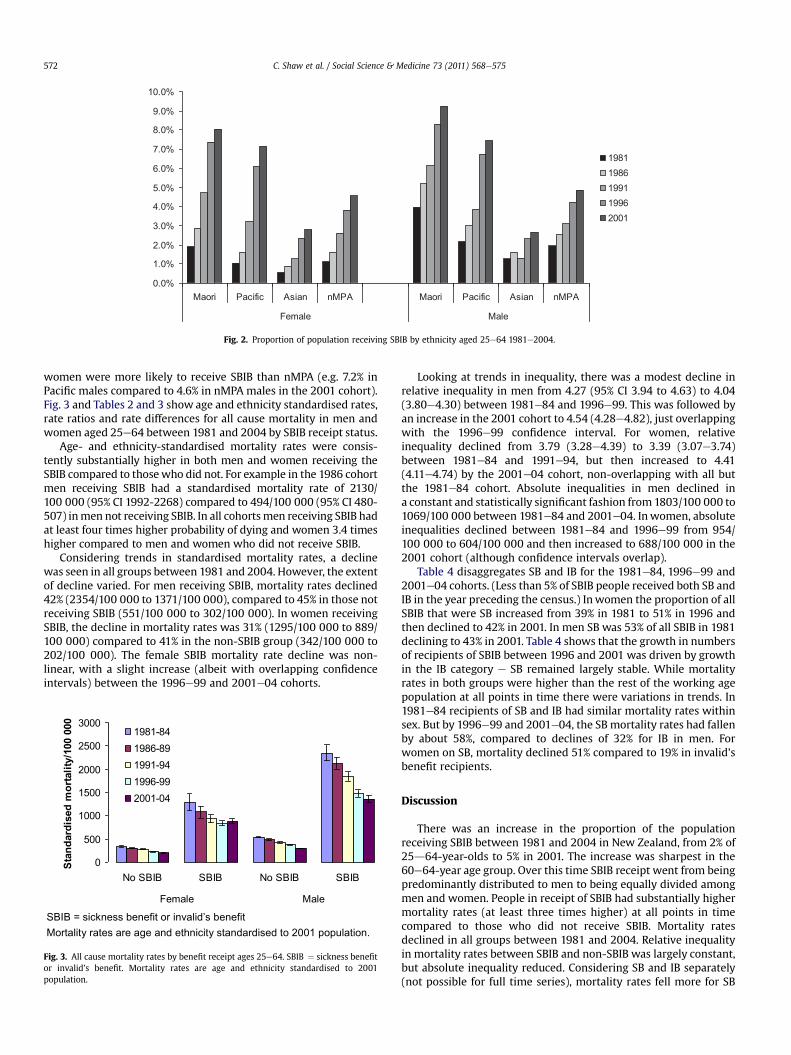
women were more likely to receive SBIB than nMPA (e.g. 7.2% inPacific males compared to 4.6% in nMPA males in the 2001 cohort).Fig. 3 and Tables 2 and 3 show age and ethnicity standardised rates,rate ratios and rate differences for all cause mortality in men andwomen aged 25e64 between 1981 and 2004 by SBIB receipt status.
Age- and ethnicity-standardised mortality rates were consis-tently substantially higher in both men and women receiving theSBIB compared to thosewho did not. For example in the 1986 cohortmen receiving SBIB had a standardised mortality rate of 2130/100 000 (95% CI 1992-2268) compared to 494/100 000 (95% CI 480-507) inmen not receiving SBIB. In all cohortsmen receiving SBIB hadat least four times higher probability of dying and women 3.4 timeshigher compared to men and women who did not receive SBIB.
Considering trends in standardised mortality rates, a declinewas seen in all groups between 1981 and 2004. However, the extentof decline varied. For men receiving SBIB, mortality rates declined42% (2354/100 000 to 1371/100 000), compared to 45% in those notreceiving SBIB (551/100 000 to 302/100 000). In women receivingSBIB, the decline in mortality rates was 31% (1295/100 000 to 889/100 000) compared to 41% in the non-SBIB group (342/100 000 to202/100 000). The female SBIB mortality rate decline was non-linear, with a slight increase (albeit with overlapping confidenceintervals) between the 1996e99 and 2001e04 cohorts.
SBIB = sickness benefit or invalid’s benefitMortality rates are age and ethnicity standardised to 2001 population.
0
500
1000
1500
2000
2500
3000
No SBIB SBIB No SBIB SBIB
Female Male
Stan
dard
ised
m
ortality/100 000
1981-841986-891991-941996-992001-04
Fig. 3. All cause mortality rates by benefit receipt ages 25e64. SBIB ¼ sickness benefitor invalid’s benefit. Mortality rates are age and ethnicity standardised to 2001population.
Looking at trends in inequality, there was a modest decline inrelative inequality in men from 4.27 (95% CI 3.94 to 4.63) to 4.04(3.80e4.30) between 1981e84 and 1996e99. This was followed byan increase in the 2001 cohort to 4.54 (4.28e4.82), just overlappingwith the 1996e99 confidence interval. For women, relativeinequality declined from 3.79 (3.28e4.39) to 3.39 (3.07e3.74)between 1981e84 and 1991e94, but then increased to 4.41(4.11e4.74) by the 2001e04 cohort, non-overlapping with all butthe 1981e84 cohort. Absolute inequalities in men declined ina constant and statistically significant fashion from1803/100 000 to1069/100 000 between 1981e84 and 2001e04. Inwomen, absoluteinequalities declined between 1981e84 and 1996e99 from 954/100 000 to 604/100 000 and then increased to 688/100 000 in the2001 cohort (although confidence intervals overlap).
Table 4 disaggregates SB and IB for the 1981e84, 1996e99 and2001e04 cohorts. (Less than 5% of SBIB people received both SB andIB in the year preceding the census.) Inwomen the proportion of allSBIB that were SB increased from 39% in 1981 to 51% in 1996 andthen declined to 42% in 2001. In men SB was 53% of all SBIB in 1981declining to 43% in 2001. Table 4 shows that the growth in numbersof recipients of SBIB between 1996 and 2001 was driven by growthin the IB category e SB remained largely stable. While mortalityrates in both groups were higher than the rest of the working agepopulation at all points in time there were variations in trends. In1981e84 recipients of SB and IB had similar mortality rates withinsex. But by 1996e99 and 2001e04, the SB mortality rates had fallenby about 58%, compared to declines of 32% for IB in men. Forwomen on SB, mortality declined 51% compared to 19% in invalid’sbenefit recipients.
Discussion
There was an increase in the proportion of the populationreceiving SBIB between 1981 and 2004 in New Zealand, from 2% of25d64-year-olds to 5% in 2001. The increase was sharpest in the60e64-year age group. Over this time SBIB receipt went from beingpredominantly distributed to men to being equally divided amongmen and women. People in receipt of SBIB had substantially highermortality rates (at least three times higher) at all points in timecompared to those who did not receive SBIB. Mortality ratesdeclined in all groups between 1981 and 2004. Relative inequalityin mortality rates between SBIB and non-SBIB was largely constant,but absolute inequality reduced. Considering SB and IB separately(not possible for full time series), mortality rates fell more for SB

Table 2Person time, deaths, standardised rates, rate ratios and rate differences all cause mortality by SBIB status for females.
Cohort SBIB receipt Person Time (years) Deaths (n) Std Rate 95 % CI SRR 95 % CI SRD 95 % CI
1981 No SBIB 1,961,440 6228 341.7 329.7e353.6 Reference groupSBIB 24,060 336 1295.4 1112.3e1478.5 3.79 3.28e4.39 953.7 770.2e1137.2
1986 No SBIB 2,119,379 5889 312 301.5e322.5 Reference groupSBIB 37,262 417 1084.7 955.5e1213.9 3.48 3.07e 3.93 772.7 643.1e902.3
1991 No SBIB 2,267,953 5349 277.2 267.8e286.5 Reference groupSBIB 65,961 696 939.6 853e1026.2 3.39 3.07e3.74 662.4 575.3e749.5
1996 No SBIB 2,448,567 5019 234.7 226.8e242.6 Reference groupSBIB 110,287 1083 838.6 779.4e897.8 3.57 3.30e3.86 603.9 544.2e663.6
2001 No SBIB 2,595,331 4725 201.5 194.6e208.4 Reference groupSBIB 76,678 1530 889.3 833.8e944.9 4.41 4.11e4.74 687.8 631.9e743.8
Numbers of deaths are random rounded after calculation of rates.Mortality rates are age and ethnicity standardised to 2001 population.SBIB¼ sickness benefit or invalid’s benefit.
C. Shaw et al. / Social Science & Medicine 73 (2011) 568e575 573
(over 50%) than IB (about a quarter) between 1981 and 2004. At thesame time, a shift in the composition of the beneficiary populationoccurred, with the proportion of SB recipients decreasing (and IBrecipients increasing) over the study period.
The increase in uptake seen, and the proportion of the workingage population receiving SBIB in New Zealand, is similar to that seenin many other OECD countries (Gjesdal et al., 2004; Kemp et al.,2006; Organisation for Economic Co-operation and Development,2003). About 5e7% of the working age population were receivingdisability benefits in most OECD countries in the late 1990s(Organisation for Economic Co-operation and Development, 2003).
The level of excess mortality among SBIB recipients in NewZealand is similar to, or slightly higher than, other countries (Ahs &Westerling, 2006a; Karlsson et al., 2007; Quaade et al., 2002; Rupp& Scott, 1996; Wallman et al., 2006). Four non-mutually-exclusiveexplanations have been posited for the increased mortality rates inrecipients of incapacity benefits in working age persons. Firstly,excess mortality risk could be due to the underlying disease forwhich the person was awarded the specific benefit. Secondly, it ispossible that individuals that receive SBIB may have other seriousmedical conditions that both preclude employment and increasemortality risk, but were not the recorded reason for receiving SBIB.Thirdly, people who receive the SBIB may have other risk factorsthat increase mortality risk. Finally, lack of work itself couldincrease the risk of mortality (Wallman et al., 2006).
While this study is not able to look at most of these factorsdirectly due to the use of linked census data (as opposed to healthsurvey follow-up) there is some evidence from other New Zealanddata to support the second and fourth explanations (T. Blakely,Collings, & Atkinson, 2003; Ministry of Health/IntersectoralAdvisory Group, 2004). Additionally, analysis of other informationon the NZCMS dataset provides support for the third explanation as
Table 3Person time, deaths, standardised rates, rate ratios and rate differences all cause mortali
Cohort SBIB receipt Person Time (years) Deaths (n) Std Rate
1981 No SBIB 1,923,956 10,071 551.1SBIB 41,543 1203 2353.7
1986 No SBIB 2,066,312 9456 493.6SBIB 59,145 1488 2130.5
1991 No SBIB 2,180,950 8280 428.5SBIB 75,973 1641 1846.2
1996 No SBIB 2,311,584 7467 366.6SBIB 114,054 2037 1482.2
2001 No SBIB 2,397,858 6768 301.6SBIB 74,020 2289 1370.5
Numbers of deaths are random rounded after calculation of rates.Mortality rates are age and ethnicity standardised to 2001 population.SBIB ¼ sickness benefit or invalid’s benefit.
the population of people receiving SBIB in New Zealand are morelikely to smoke, be unmarried, live in a deprived neighbourhood,have low income and no educational qualifications compared to therest of the working age population (data not shown). These are allrisk factors that increase mortality risk either in their own right orclustered with the others (Marmot & Wilkinson, 2006). Althoughthe first explanation is intuitively appealing there is no New Zea-land-specific evidence to support it. Interestingly one follow-upstudy of mortality in individuals receiving incapacity benefits inSweden showed no significant association between cause of deathand original reason for the award of the incapacity benefits(Wallman et al., 2006).
The decline in mortality rates among SBIB recipients reflectssecular trends in mortality among the New Zealand population ingeneral (T. Blakely, Tobias, Atkinson, Yeh, & Huang, 2007). There area number of possible explanations for why the differences inmortality between the two populations have been preserved overthis time period, despite both declining. These explanations includefirstly, mortality drivers are the same in both groups and arechanging at similar rates in both groups (thus preserving the gap).Secondly, that mortality drivers are different between the groupsbut change in such a way that the net effect is comparable declinesin the two populations. In the absence of detailed panel data canweshed any light on these theories? We could consider what thecauses of death are in the SBIB population compared to theremainder of the working age population and we could also look attrends in the distributions of drivers/risk factors for mortalitybetween the populations. The NZCMS allows us to look at high levelcauses of death. This data shows that broadly speaking, althoughrates are higher in the SBIB population, causes of death are thesame as the non-SBIB population at any point in time (e.g. cancer,cardiovascular disease)(data not presented). In terms of risk factors,
ty by SBIB status for males.
95 % CI SRR 95 % CI SRD 95 % CI
535.6e566.6 Reference group2174.8e2532.5 4.27 3.94e4.63 1802.6 1623.1e1982.1480.2e507 Reference group1992.5e2268.5 4.32 4.02e4.63 1636.9 1498.2e1775.5416.3e440.7 Reference group1731.8e1960.6 4.31 4.02e4.61 1417.7 1302.6e1532.7356e377.2 Reference group1400.9e1563.5 4.04 3.80e4.30 1115.6 1033.6e1197.6292.7e310.4 Reference group1298.7e1442.4 4.54 4.28e4.82 1069 996.6e1141.4

Table 4Sickness and invalid’s benefit numbers, death and mortality rates.
Sex Benefit Type Cohort Number on benefit Number of deaths Std Rate 95% CI
Female Invalid’s Benefit 1981 5046 225 1378.5 1126e1630.91996 19,227 747 1081.0 982.6e1179.52001 27,309 1161 1118.9 1032e1205.3
Sickness Benefit 1981 3168 114 1204.8 923.6e14861996 19,620 390 623.3 548.5e698.22001 19,926 417 588.9 520.7e657.1
Male Invalid’s Benefit 1981 6765 591 2445.8 2144.4e2747.21996 19,620 1326 1867.2 1734.5e20002001 26,763 1674 1699.6 1591e1808.2
Sickness Benefit 1981 7680 621 2326.0 2086.3e2565.71996 21,057 834 1166.3 1067.9e1264.72001 20,442 708 976.0 886.3e1065.7
Mortality rates are age and ethnicity standardised to 2001 population.
C. Shaw et al. / Social Science & Medicine 73 (2011) 568e575574
the NZCMS has access to smoking data in the 1981 and 1996cohorts. This shows that the proportion of the SBIB populationwhosmoked in 1981 was higher than the rest of the working age pop-ulation (42% vs. 34%) and did not reduce as much over the 15-yearperiod between 1981 and 1996 (38% vs. 24%). Thus, factors otherthan smoking must have improved over time among SBIB tocounteract the lesser fall in smoking rates. Further work is justifiedto explore possible reasons for similar percentage declines inmortality between SBIB and non-SBIB, despite different risk factorprofiles at any point in time.
The finding of different mortality rates between SB and IBrecipients was not surprising given the different purposes of thebenefits. However the different rates of decline in mortalitybetween SB and IB populations is intriguing. As most of the declineoccurred between the 1981 and 1996 cohorts, it is difficult to knowwhether this was a gradual process, or whether the 1981 cohortwas an outlier. If it is a real finding then one potential explanation isthat, over time, the targeting of the IB to the long-term disabled andthe SB to the short-term sick populations improved, possibly due tosome of the extensive policy and operational changes that occurredto these benefits over that time (Wilson et al., 2005).
Strengths and limitations
The strengths of this study include the use of census data withalmost complete population coverage (Statistics New Zealand,1996, 2002), thus results are unlikely to be affected by selectionbias. There was also relative stability of benefit identification andascertainment of death over this time in New Zealand.
There are some limitations. Firstly, we could not completely linkall eligiblemortality records to census records, thoughwebelieve theweights used in our analyses remove resultant linkage bias by socio-demographics. It may be that due to higher residential mobilityamong SBIBwe are less likely to link themand their rates are not fullycorrected. However, to bias the trend results in this paper wouldrequire a changing amount of linkage bias over timee somethingweconsider unlikely. Secondly, there may be under-reporting of benefitincome in the census, but this is likely to be consistent over time.Finally, due to thewording of the census question, wewere unable toseparately analyse SB and IB in all cohorts.
Conclusion
Mortality rates in SB and IB recipients are high and, despitedeclining over time, they remain substantially higher than theremainder of the working age population. The factors that deter-mine this high mortality rate and the trends in rates are not simpleto disentangle. One possible explanation for these trends is that the
drivers of mortality in this group have been declining at the samerate as the population not receiving SBIB, thus preserving the ‘gap’.To examine these factors further, research is required that includesbetter data on pre-existing health status, more detail on reasons forreceipt of any benefit, and incorporates comprehensive analysis ofthe structural determinants of benefit receipt.
Acknowledgements
Thanks to Moira Wilson, Keith McLeod and Joanna Broad forhelpful discussions. Thanks also to June Atkinson for assistancewith the data analysis.
References
Ahs, A., & Westerling, R. (2006a). Health care utilization among persons who areunemployed or outside the labour force. Health Policy, 78, 178e193.
Ahs, A., & Westerling, R. (2006b). Mortality in relation to employment status duringdifferent levels of unemployment. Scandinavian Journal of Public Health, 34,159e167.
Ajwani, S., Blakely, T., Robson, B., Tobias, M., & Bonne, M. (2003). Decades ofdisparity: ethnic mortality trends in New Zealand 1980e1999. Wellington:Ministry of Health and University of Otago.
Bambra, C. (2010). Yesterday once more? Unemployment and health in the 21stcentury. Journal of Epidemiology and Community Health, 64, 213e215.
Bambra, C. I. (2008). Incapacity benefit reform and the politics of ill health. BMJ, 337.a1452-.
Belich, J. (2001). Paradise reforged: A history of the New Zealanders from the 1880s tothe year 2000. Auckland: Penguin.
Beynon, P., & Tucker, S. (2006). Ill health, disability, benefit and work: a summary ofrecent research. Social Policy Journal of New Zealand, 78e101.
Blakely, T., Collings, S., & Atkinson, J. (2003). Unemployment and suicide. Evidencefor a causal association? Journal of Epidemiology & Community Health, 57,594e600, [see comment].
Blakely, T., & Salmond, C. (2002). Probabilistic record linkage and a method tocalculate the positive predictive value. International Journal of Epidemiology, 31,1246e1252.
Blakely, T., Tobias, M., & Atkinson, J. (2008). Inequalities in mortality during andafter restructuring of the New Zealand economy: repeated cohort studies. BMJ,336, 371e375.
Blakely, T., Tobias, M., Atkinson, J., Yeh, L.-C., & Huang, K. (2007). Tracking disparity:trends in ethnic and socioeconomic inequalities in mortality, 1981e2004.Wellington: Ministry of Health.
Boston, J., Dalziel, P., & John, S. (1999a). Redesigning the welfare state in New Zealand:Problems, policies and prospects. Auckland: Oxford University Press.
Boston, J., Dalziel, P., & St John, S. (Eds.). (1999b). Redesigning the welfare state in NewZealand. Auckland: Oxford University Press.
Cheyne, C., O’Brien, M., & Belgrave, M. (1997). Social policy in aotearoa New Zealand:A critical introduction. Auckland: Oxford University Press.
Fawcett, J., Atkinson, J., Herd, P., & Blakely, T. (2008). Record linkage of census andmortality 2001e04 records: New Zealand census-mortality study technical reportNo. 6. Public health monograph series. Wellington: University of OtagoWellington.
Fawcett, J., Blakely, T., & Atkinson, J. (2002). Weighting the 81, 86, 91 and 96 census-mortality cohorts to adjust for linkage bias. NZCMS Technical report No. 5. PublicHealth Monograph Series. Wellington: Department of Public Health, WellingtonSchool of Medicine and Health Sciences.

C. Shaw et al. / Social Science & Medicine 73 (2011) 568e575 575
Gjesdal, S., Lie, R. T., & Maeland, J. G. (2004). Variations in the risk of disabilitypension in Norway 1970e99. A gender-specific age-period-cohort analysis.Scandinavian Journal of Public Health, 32, 340e348.
Hill, S., Atkinson, J., & Blakely, T. (2002). Anonymous record linkage of census andmortality records: 1981, 1986, 1991, 1996 census cohorts. NZCMS Technical ReportNo. 3. Public Health Monograph Series. Wellington: Department of PublicHealth, Wellington School of Medicine and Health Sciences.
Karlsson, N. E., Carstensen, J. M., Gjesdal, S., & Alexanderson, K. A. E. (2007).Mortality in relation to disability pension: findings from a 12-year prospectivepopulation-based cohort study in Sweden. Scandinavian Journal of Public Health,35, 341e347.
Kemp, P. (2006a). Comparing trends in disability benefit receipt. In P. Kemp,A. Sunden, & B. Bakker-Tauritz (Eds.), Sick societies? Trends in disability benenfits inpost-industrial welfare states. Geneva: International Social Security Association.
Kemp, P. (2006b). Introduction. In P. Kemp, A. Sunden, & B. Bakker-Tauritz (Eds.),Sick societies? Trends in disability benefits in post-industrial welfare states.Geneva: International Social Security Association.
Kemp, P., Sunden, A., & Bakker-Tauritz, B. (Eds.). (2006). Sick societies? Trends indisability benefits in post-industrial welfare states. Geneva: International SocialSecurity Association.
Lunt, N. (2006). Sickness and invalid’s benefits: new developments and continuingchallenges. Social Policy Journal of New Zealand, 77e99.
Mackenbach, J. P., & Kunst, A. E. (1997). Measuring the magnitude of socio-economic inequalities in health: an overview of available measures illustratedwith two examples from Europe. Social Science & Medicine, 44, 757e771.
Marmot, M., & Wilkinson, R. (Eds.). (2006). Social determinants of health. Oxford:Oxford University Press.
Ministry of Health. (2008). A portrait of health. Key results of the 2006/07 NewZealand health survey. Wellington: Ministry of Health.
Ministry of Health/Intersectoral Advisory Group. (2004). Living with disability inNew Zealand. Wellington: Ministry of Health.
Ministry of Social Development. (2008). The social report: Indicators of social well-being in New Zealand. Wellington: Ministry of Social Development.
New Zealand Health Information Service. (2007). Cancer: New registrations anddeaths 2004. Wellington: Ministry of Health.
Organisation for Economic Co-operation and Development. (2003). Transformingdisability into ability: Policies to promote work and income security for disabledpeople. Paris: Organisation for Economic Co-operation and Development.
Quaade, T., Engholm, G., Johansen, A. M. T., & Moller, H. (2002). Mortality in relationto early retirement in Denmark: a population-based study. Scandinavian Journalof Public Health, 30, 216e222.
Rupp, K., & Scott, C. (1996). Trends in the characteristics of DI and SSI disabilityawardees and duration of program participation. Social Security Bulletin, 59, 18.
Statistics New Zealand. (1996). Report on the 1996 post enumeration survey.Wellington: Statistics New Zealand.
Statistics New Zealand. (2002). A report on the post enumeration survey 2001.Wellington: Statistics New Zealand.
Statistics New Zealand. (2005). Statistical standard for ethnicity 2005. Wellington:Statistics New Zealand.
Statistics New Zealand. (2008). Labour market statistics:2007. Wellington: StatisticsNew Zealand.
Wallman, T., Wedel, H., Johansson, S., Rosengren, A., Eriksson, H., Welin, L., et al.(2006). The prognosis for individuals on disability retirement. An 18-yearmortality follow-up study of 6887 men and women sampled from thegeneral population. BMC Public Health, 6, 103.
Welfare Working Group. (2010). Long-term benefit dependency: the issues.Wellington: Welfare Working Group.
Wilson, M., & McLeod, K. (2006). Understanding the growth in invalid’s benefitreceipt in New Zealand. Social Policy Journal of New Zealand, 127e145.
Wilson, M., McLeod, K., & Sathiyandra, S. (2005). Growth in numbers of sickness andinvalid’s benefit recipients 1993e2002. Wellington: Ministry of SocialDevelopment.