morphology and origin of the osbourn troughauthors.library.caltech.edu/44934/1/jgrb12240.pdf ·...
TRANSCRIPT
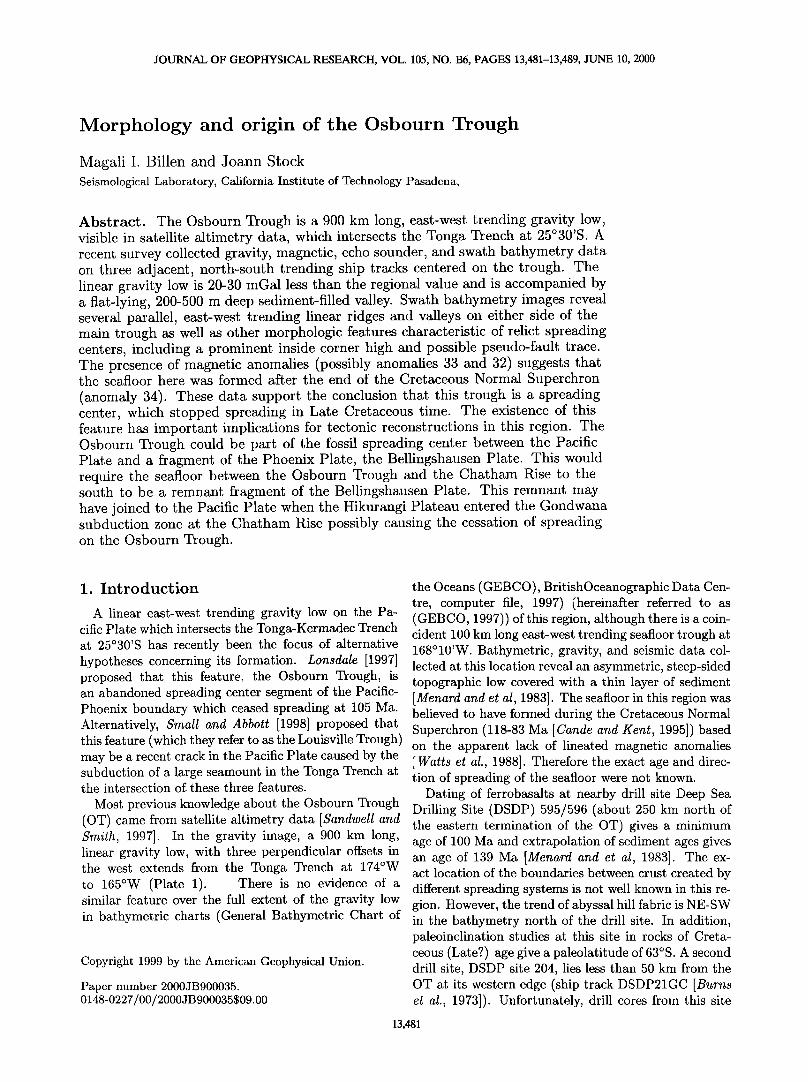
JOURNAL OF GEOPHYSICAL RESEARCH, VOL. 105, NO. B6, PAGES 13,481-13,489, JUNE 10, 2000
Morphology and origin of the Osbourn Trough
Magali I. Billen and Joann Stock Seismological Laboratory, California Institute of Technology Pasadena,
Abstract. The Osbourn Trough is a 900 km long, east-west trending gravity low, visible in satellite altimetry data, which intersects the Tonga Trench at 25ø30'S. A recent survey collected gravity, magnetic, echo sounder, and swath bathymetry data on three adjacent, north-south trending ship tracks centered on the trough. The linear gravity low is 20-30 regal less than the regional value and is accompanied by a fiat-lying, 200-500 m deep sediment-filled valley. Swath bathymetry images reveal several parallel, east-west trending linear ridges and valleys on either side of the main trough as well as other morphologic features characteristic of relict spreading centers, including a prominent inside corner high and possible pseudo-fault trace. The presence of magnetic anomalies (possibly anomalies 33 and 32) suggests that the seafloor here was formed after the end of the Cretaceous Normal Superchron (anomaly 34). These data support the conclusion that this trough is a spreading center, which stopped spreading in Late Cretaceous time. The existence of this feature has important implications for tectonic reconstructions in this region. The Osbourn Trough could be part of the fossil spreading center between the Pacific Plate and a fragment of the Phoenix Plate, the Bellingshausen Plate. This would require the seafloor between the Osbourn Trough and the Chatham Rise to the south to be a remnant fragment of the Bellingshausen Plate. This remnant may have joined to the Pacific Plate when the Hikurangi Plateau entered the Gondwana subduction zone at the Chatham Rise possibly causing the cessation of spreading on the Osbourn Trough.
1. Introduction
A linear east-west trending gravity low on the Pa- cific Plate which intersects the Tonga-Kermadec Trench at 25ø30'S has recently been the focus of alternative hypotheses concerning its formation. LonsdaIe [1997] proposed that this feature,the Osbourn Trough, is an abandoned spreading center segment of the Pacific- Phoenix boundary which ceased spreading at 105 Ma. Alternatively, Small and Abbott [1998] proposed that this feature (which they refer to as the Louisville Trough) may be a recent crack in the Pacific Plate caused by the subduction of a large seamount in the Tonga Trench at the intersection of these three features.
Most previous knowledge about the Osbourn Trough (OT) came from satellite altimetry data [Sandwell and Smith, 1997]. In the gravity image, a 900 km long, linear gravity low, with three perpendicular offsets in the west extends from the Tonga Trench at 174øW to 165øW (Plate 1). There is no evidence of a similar feature over the full extent of the gravity low in bathymetric charts (General Bathymetric Chart of
Copyright 1999 by the American Geophysical Union.
Paper number 2000JB900035. 0148-0227/00/2000JB900035509.00
the Oceans (GEBCO), BritishOceanographic Data Cen- tre, computer file, 1997) (hereinafter referred to as (GEBCO, 1997)) of this region, although there is a coin- cident 100 km long east-west trending seafloor trough at 168ø10'W. Bathymetric, gravity, and seismic data col- lected at this location reveal an asymmetric, steep-sided topographic low covered with a thin layer of sediment [Menard and et aI, 1983]. The seafloor in this region was believed to have formed during the Cretaceous Normal Superchron (118-83 Ma [Cande and Kent, 1995]) based on the apparent lack of lineated magnetic anomalies [Watts et al., 1988]. Therefore the exact age and direc- tion of spreading of the seafloor were not known.
Dating of ferrobasalts at nearby drill site Deep Sea Drilling Site (DSDP) 595/596 (about 250 km north of the eastern termination of the OT) gives a minimum age of 100 Ma and extrapolation of sediment ages gives an age of 139 Ma [Menard and et aI, 1983]. The ex- act location of the boundaries between crust created by different spreading systems is not well known in this re- gion. However, the trend of abyssal hill fabric is NE-SW in the bathymetry north of the drill site. In addition, paleoinclination studies at this site in rocks of Creta- ceous (Late?) age give a paleolatitude of 63øS. A second drill site, DSDP site 204, lies less than 50 km from the OT at its western edge (ship track DSDP21GC [Burns et al., 1973]). Unfortunately, drill cores from this site
13,481

13,482 BILLEN AND STOCK' MORPHOLOGY OF THE OSBOURN TROUGH
recovered very few fossils for core depths corresponding to ages older than Oligocene. Those fossil fragments recovered (of possible Late Cretaceous age) are difficult to identify, showing evidence for considerable transport before deposition at this location. The sediments in the drill core comprised abyssal clays and ash (0-103 m, Miocene to Oligocene), tuffaceous sandstone and con- glomerate (103-126.5 m, ?Early Cretaceous age), and vitric tuff (125.5-147 m, unknown age). An uncomfor- mity in deposition occurs at the base of the Oligocene precluding extrapolation of sedimentation rates to bet- ter constrain the ages of the deeper sediments. The drill site did not reach basement material.
We present magnetic, gravity, echo sounder, and swath bathymetry data recently collected near the west- ern edge of the OT. These data provide strong evidence that the trough is a relict, slow-spreading center. We also discuss several possibilities for the origin of a large (100-400 nT), asymmetric magnetic anomaly across the trough and the implications of this new data set for plate tectonic reconstructions of this region.
2. Observations
In October 1998 the research vessel ice breaker(RVIB) Nathaniel B. Palmer (cruise NBP9806A) traversed the OT on three north-south lines, each approximately 150 kin long. We collected magnetic, gravity, Bathy-2000 echo sounder, and SeaBeam-2100 swath bathymetry
data covering the eastern edge of the westernmost seg- ment (segment 1) of the trough. The swath bathymetry data has an across-track coverage of 12 km providing a 36 km wide by 150 km long image of the seafloor sur- rounding the trough (Plate 2a). This Seabeam im- age reveals several features normally found along slow- spreading centers: (1) The trough is a 200-500 m deep, steep-sided graben, shallowing to the west, with a fiat valley floor approximately 6 km wide (Figures ld-lf).
(2) The surrounding seafloor rises gently toward the trough from either side. (3) The abyssal hill fabric is oriented east-west parallel to the trend of the OT with several adjacent grabens and ridges. (4) At the east end of segment I (line 1: see gravity image, Plates I or 2b and discussion below), where the OT is offset south- ward, there is a large asymmetry in the cross-sectional topography, with the inside corner of the offset reaching 0.8 km higher than the outside corner (see Plate 2b). (5) Lines 2 and 3 of the survey exhibit a more symmet- ric graben-like cross-sectional profile. Other features apparent in the swath bathymetry image include two discontinuities in the topography, stemming from the segment offset, which resemble pseudo-faults typically observed at propagating spreading centers, and a second trough-like feature in line I at 25ø52'S with morphology similar to the crossings of segment I on lines 2 and 3. This feature will be discussed below.
The shipboard gravity measurements agree in ampli- tude and shape with satellite altimetry data (Figures
30
15
0
-30
-4.5
•2 -5.5
Line 1 a.
ß
Line 2 b
0 50 100 150 0 50 100
Line 3 c.
150 0 50 100 150
Line 1 [ d. _
Line 2 e. Line 3 f.
0 50 100 150 0 50 100 150 0 50 100
Distance (km) Distance (km) Distance (km) Figure 1. Cross-sectional profiles of flee-air gravity and bathymetry of the western OT from 3 adjacent profiles (line 1, east; line 2, center; line 3, west). All lines are oriented with north at 0 km and south at 170 km. Diamond marks crossing of segment I and triangle marks crossing of segment 2. (a-c) Free-air gravity anomalies with the regional value of 38 mGal removed: shipboard data (thick, shaded), satellite (dotted), model for crustal structure in Figures ld-lf (thin, solid). (d-f) Bathymetry (thick, black) and crustal density structure for gravity models in Figures la-lc. Background density is 2700 kg/m 3. Stippled regions are sediment layers (1380 kg/m 3) required to fit the observed profiles.
150

BILLEN AND STOCK: MORPHOLOGY OF THE OSBOURN TROUGH 13,483
la-lc). The average free-air gravity anomaly in this region is about 38 mGal, due to the proximity of the fore-bulge of the Tonga Trench (this mean value is re- moved from the profiles shown in Figures la-lc). The trough itself is delineated by a narrow (15 km wide) gravity low, 20-30 mGal less than the regional value. The topographic asymmetry of the trough in line 1 is mirrored in the gravity. Based on the good agreement between the satellite and shipboard data, we have as- sumed that the offset in the trough seen in the gravity image is also an offset in the topographic feature, thus leading us to the conclusion that our survey covers the eastern termination of segment 1 and that the oil'set in the trough and segment 2 lay just to the east of our sur- vey area (Plate 1). In addition, the second trough-like feature crossed in line 1 at 25ø52'S lines up well with a similar feature in the gravity that is an extension of segment 2 to the southwest.
We did not expect to find easily identifiable mag- netic anomalies near the OT, due to the absence of such features in previous ship tracks (cruises C1713, C0906, DSDP91GC, ELT40, V3601, V3602; Plate 1). However, these tracks do exhibit some consistent features which
are also seen in the three new tracks of data presented in this paper (Figure 2a). The trough coincides with a transition between a negative or low magnetic anomaly to the north and a broad positive anomaly to the south in the three profiles presented here as well as four of the eight previous ship tracks across the trough (see Plate 1). While our survey lines are not long enough to de- tect a more complete set of linearions, if they exist, this consistent feature may provide a clue to the age of the trough.
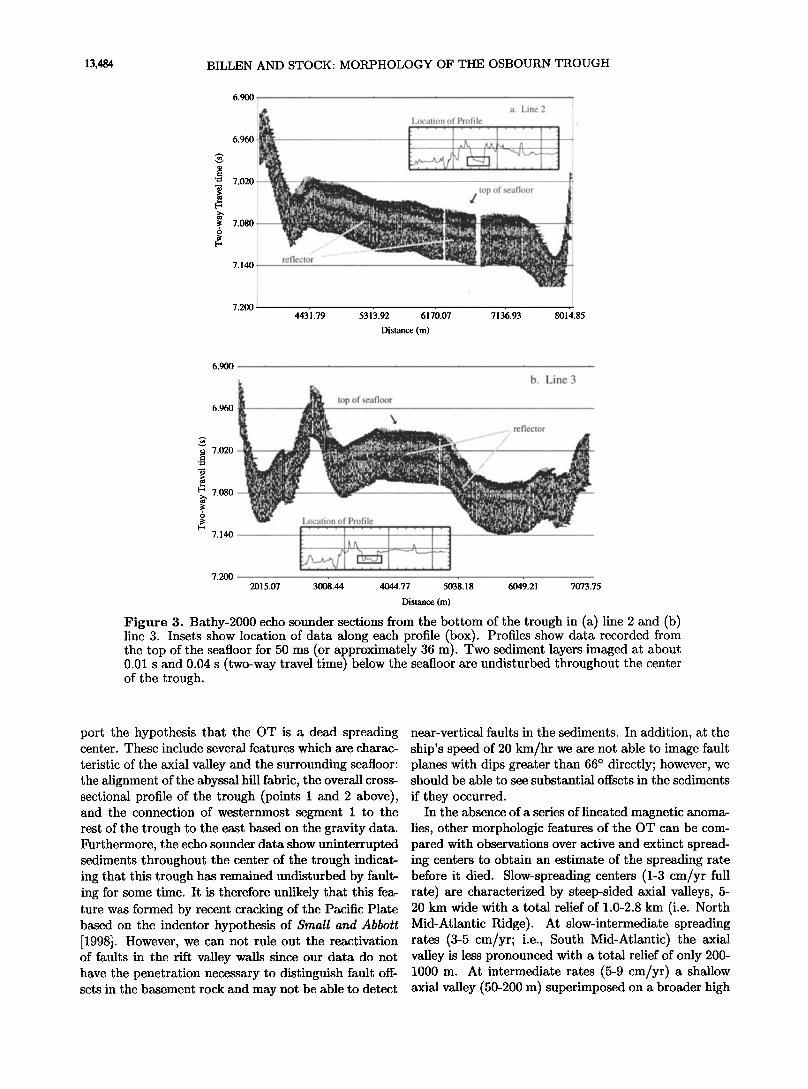
The final set of data collected during this survey is ODEC Bathy-2000, 3.5-12 kHz echo sounder profiles for lines 2 and 3 (Figure 3, line 1 is not available due to problems with the data recorder during the sur- vey). While echo sounder data are mainly used for bathymetry determination, they do provide some sub- bottom penetration and can image layering in the top 50-100 m of sediments covering the seafloor. The echo sounder data collected on lines 2 and 3 reveal undis-
turbed sediments of at least 36 m thickness (assuming a sediment velocity of 1800 m/s) covering the center of the trough. In line 3 this layer can be seen to drape over the slight incline in topography near the center of the trough. Due to the low signal-to-noise ratio on this recording with the single echo sounder system, it is dif- ficult to follow this layer all the way across the trough and particularly at the trough edges. In line 2 the sed- iment layer appears to taper out near the edges, while in line 3 it ends against high basement topography.
3. Analysis of Ship Track Data
The swath bathymetry map of the trough and its sur- roundings reveals several features which strongly sup-
Magnetic ,•nomaly a.
Line 1]• Line 2
Lin. t •
25
-25
-5O
250
-250
-500
, , ,
-Model 2 • -
250
-250
0 50 100 150
Distance (km)
Figure 2. Magnetic anomaly profiles and models: (a) Observed magnetic anomalies on lines 1-3. Scale bar of 200 nT is shown on line 1. (b) Model 1: magnetic anomaly due to seafloor topography (using bathymetry from line 2). This is also the anomaly expected if the spreading center stopped spreading prior to 83 Ma. (c) Model 2: spreading center axis age is 82 Ma. (d) Model 3: spreading center axis age is 71 Ma. All models have a full spreading rate of 5 cm/yr, skewness of 49 ø, source layer thickness of 1 km and susceptibility of 0.01 emu/cm 3. Cretaceous and Cenozoic magnetic anoma- lies are labeled; intervals of normal polarity magnetiza- tion are shown in black.
13,484 BILLEN AND STOCK: MORPHOLOGY OF THE OSBOURN TROUGH
6.900 I a. Line 2 I Location of Profile
6.96O
,, 7.020
'h•,::,,', , II'"::;•liiit:!,i:'-:...[: :':: ..: ..... top of seafloor ".,'•i]':{: ';i' ,:½!"1' ?atl!l{•l•ilt!• i i ';,'"i'" .... , , :' I½ ',a•.iJ•alI;:':,; .: ': t'.tl,.l{,tll't ,..' ....... :." .,..', •,,.... " t .lq,,.,,.::, .......... :,11...,i, ..........
7.080 - ' '" -
"1 'r: ....... ',.'.,,.:',',,i'.','.--;,",', ' .... ..... ,"; ........ ,!wil,, i'.',," . t,.:;:.. ;:•;'...., ',',i,itl•,.....)....,,,;•i" ß ' I½"' ..... .':-': i'"':iq i'l"l; '•t! ..... 1J"tIl,l'q i'i ...... ..l,,I :tlu,,l,:ti•,•!•11 ,11ai'ti•i, ' •.l',!11thll,l!l•i t t. I "' . .......................... _ ......... ')i..;;!!!]:'•"!:?Q)."'.!'""i:Si:i.•ii:i";i ,11!11!',!,!,:;!i I !'::",•ii'11!!iii'::!:i•!itlii]!•!:• reflectc;'• ................................. ': ..... ' '
7.140 ,::.i:l,.i..!,i•]:l,,t::,ll , '.t',..lq .';t '1:
ß
7.200 443'1.79 531}t.92 6170.07 7136.93 8014.85
Distance (m)
6.900
6.960
• 7.020 .,-,
• 7.080
7.140
b. Line 3
'.••_• of seafloor • ...... reflector
- r. .................. '•'" ........ .::::::
.:::--
Location of Profile
7.200 201}.07 3008.44 4044.77 503•.18 604½.21 7073'.75 Distance (m)
Figure 3. Bathy-2000 echo sounder sections from the bottom of the trough in (a) line 2 and (b) line 3. Insets show location of data along each profile (box). Profiles show data recorded from the top of the seafloor for 50 ms (or approximately 36 m). Two sediment layers imaged at about 0.01 s and 0.04 s (two-way travel time) below the seafloor are undisturbed throughout the center of the trough.
port the hypothesis that the OT is a dead spreading near-vertical faults in the sediments. In addition, at the center. These include several features which are charac- ship's speed of 20 km/hr we are not able to image fault teristic of the axial valley and the surrounding seafloor: the alignment of the abyssal hill fabric, the overall cross- sectional profile of the trough (points I and 2 above), and the connection of westernmost segment I to the rest of the trough to the east based on the gravity data. Furthermore, the echo sounder data show uninterrupted sediments throughout the center of the trough indicat- ing that this trough has remained undisturbed by fault- ing for some time. It is therefore unlikely that this fea- ture was formed by recent cracking of the Pacific Plate based on the indentor hypothesis of Small and Abbott [1998]. However, we can not rule out the reactivation of faults in the rift valley walls since our data do not have the penetration necessary to distinguish fault off- sets in the basement rock and may not be able to detect
planes with dips greater than 66 ̧ directly; however, we should be able to see substantial offsets in the sediments
if they occurred. In the absence of a series of lineated magnetic anoma-
lies, other morphologic features of the OT can be com- pared with observations over active and extinct spread- ing centers to obtain an estimate of the spreading rate before it died. Slow-spreading centers (1-3 cm/yr full rate) are characterized by steep-sided axial valleys, 5- 20 km wide with a total relief of 1.0-2.8 km (i.e. North Mid-Atlantic Ridge). At slow-intermediate spreading rates (3-5 cm/yr; i.e., South Mid-Atlantic) the axial valley is less pronounced with a total relief of only 200- 1000 m. At intermediate rates (5-9 cm/yr) a shallow axial valley (50-200 m) superimposed on a broader high
ß
.

BILLEN AND STOCK' MORPHOLOGY OF THE OSBOURN TROUGH 13,485
-24'
-25'
-26'
mgal 100
60
15
xk . -15 B'9806 •" • •.• m - ' •.. .• 'N x•-• ..S lvi •, 4- :. + + • . • -60
-- -100
-175' -174' -173' -172' -171' -170' -169' -168' -167' -166' -165' Plate 1. •a•dwell a•d Smith [1997] satellite gravity image. Ship tracks (labeled by cruise ID) with magnetic anomalies &ore GEODAS (Marine geological and geophysical data from U.S. Deptartment of Commerce National Oceanic and Atmospheric Administration and National Geo- physical Data Center, CD-ROM, 1992). Thick line, this survey NBP9806 (without magnetics for clarity, see Plate 2 and Figure 1). DSDP drilling sites 204 (white triangle) and 595/596 (white star) are indicated. Inset shows location map: TT, Tonga Trench; CR, Chatham Rise; H, Hiku- rangi Plateau; M, Manihiki Plateau; S, Samoa; OT, Osbourn Trough.
173.25' +' * + • '
-173.5' +
-173.75' I + .24.75øS -25.0øS -25.25'S -25.5'S -25.75'S
+
1500 nT
Line 1
- Li•
,..,i,.e 3 n
-26.0'S -26.25'S
G R A V I T Y
mgal (b)
60
G 50 R 40 A
V
30 I T
20 Y
10
-173.5' * (a)
5.4 D E
4.8 P T H
4.2
Plate 2. (a) SeaBeam-2100 swath bathymetry image. OT segment 1 is at 25ø30'S. Parallel ridges and troughs are seen both north and south of the main trough. The deep region to the east at 25ø53'S is the western termination of OT segment 2 (b) Smoothed satellite gravity image with tectonic interpretation. Lines with tic marks, normal faults bounding aligned ridges and troughs; ICH, inside corner high; dashed lines, possible pseudo-fault traces; circles, seamounts; triangle, crossing of segment 2 in line 1. Ship track plotted with magnetic anomalies. Location of segment 2 is inferred from satellite gravity image.

13,486 BILLEN AND STOCK: MORPHOLOGY OF THE OSBOURN TROUGH
may still be present. At faster rates (> 9 cm/yr) the axial valley is replace by a small axial high [Macdon- ald, 1986]. Gravity signals over both active [Small and Sandwell, 1989] and extinct [Jonas et al., 19911 spread- ing centers also exhibit a spreading rate dependence. Extinct slow-spreading centers have broad (30-90 kin) gravity lows with amplitudes of 17-45 mGal, whereas extinct fast-spreading centers have a narrower (40-60 kin) positive anomaly of 10-20 regal. For example, the Phillippine Basin Rift, with a 1500 m axial val- ley which stopped spreading at 35 Ma and had a full spreading rate of 3.6 cm/yr has a 40 km wide free-air gravity anomaly of-26 regal [Jonas et al., 1991]. The cross-sectional profiles of the OT, with the steep to- pography, broad axial floor, and large negative free-air anomaly agree well with the features observed for slow or slow-intermediate rate spreading centers. Other evi- dence that the trough was a slow-spreading center is the large topographic high in line i which we interpret as an "inside corner high" [e.g. Severinghaus and Macdonald, 1988]. Inside corner highs are not found at intermedi- ate (unless an axial valley is present) or fast-spreading centers and therefore this is a diagnostic feature of a slow-spreading center.
In addition to providing constraints on the spreading rate of the Osbourn Trough, the free-air gravity and bathymetry can be used to estimate the sediment thick- ness in the trough and therefore its true depth. For each profile across the trough a two dimensional model of crustal density is constructed. The background density is taken as the average oceanic crustal value for layer 3, 2700 kg/m 3. The density of the sediments is 1380 kg/m 3 based on density measurements at DSDP drill site 204 located less than 50 km (white star, Plate 1) from our profiles at 24.9øS, 174.1øW [Burns et al., 1973]. The flee-air gravity for each profile is calculated using the method of Talwani et al. [1959]. The model results, shown in Figures ld-lf, require a layer of sediments 350 m thick inside the trough as well as sediments 100 m thick on the northern flanks of the trough. Residuals are less than 5 regal except for the south flank of line i (above the high inside corner topography). We note that due to the large regional flee-air anomaly these models are fit to the observed profiles with the mean value removed. Therefore there may be a uniform layer of sediments throughout this region and our calculated layer thicknesses reflect additional sediments needed in specific regions. Also, there may be three dimensional effects which are not considered. These models predict trough depths of between 0.5 and 0.85 km.
Although the magnetic anomalies recorded in this survey do not reveal any obvious lineations, the pres- ence of large (100-400 nT) anomalies near the trough is puzzling if the spreading center stopped spreading dur- ing the Cretaceous Normal Superchron (chron 34). Our survey occurs at an average depth of 5 km with a to- tal variation in topography of less than i km. Using a thickness of the magnetized layer of I km and suscepti-
bility of 0.01 emu/cm a [Kent et al., 1978], the maximum amplitude for a magnetic anomaly measured at the sea surface is 10-20 nT (Model 1, Figure 2b), a factor of 10-50 times less than the anomalies we measured. It
is therefore unlikely that the anomalies we recorded are due only to variations in the topography. Another possi- bility is that the anomalies are due to fluctuations in the magnetic field strength which occurred during the Cre- taceous Normal Superchron [Cande and Kent, 1992]. These fluctuations normally have produced anomalies with amplitudes ranging from 25 to 100 nT, although larger anomalies (100-200 nT) have been measured for seafloor of this age in the Mid-Atlantic [Vogt, 1986]. Al- ternatively, these anomalies could record a cessation of spreading after chron 34, during the earliest part of the Cenozoic reversal sequence.
To test this hypothesis, we created several magnetic models varying the spreading rates, ages, and skew- ness. We present two possible models which both fit the data in our ship tracks. Both models have a full spreading rate of 5.0 cm/yr and a skewness of 49 ø. The spreading rate is constrained by our observations that the trough has several features consistent with it being a slow-intermediate rate spreading center. A magnetic anomaly skewness of 49 ø is expected, if the paleolati- tude of the Pacific Plate was about 30 ø further south
in Late Cretaceous time than it is now [Larson et al., 1992; Menard and et al, 1983]. We use standard values for the thickness of the magnetized layer (1 km) and the susceptibility of the crust (0.01 emu/cm 3) as stated above. Any model must fit the main features seen both in our data and in the other ship tracks which cross the trough: (1) the asymmetric anomaly crossing the trough with a large high to the south and (2) no addi- tional lineations farther away from the trough. These observations require that a change from a normal to a reversed magnetic polarity must occur on the seafloor close to the trough (to create the asymmetric anomaly) and that not many other reversals have occurred which would lead to more anomalies away from the spreading center.
Although many models with ages ranging from older than 84 Ma (end of chron 34) to younger than 71 Ma were tested, only two models can fit the consistent features of the magnetic anomalies mentioned above. Model 2, with a spreading center that dies at 82 Ma, has an asymmetric magnetic high and low across the trough and no other anomalies expected to the north or south of the trough (Figure 2c). This model fits the first constraint but does not reproduce some of the smaller anomalies which occur about 75 km from the
trough. These anomalies are better fit in Model 3 (Fig- ure 2d) in which the spreading center dies at 71 Ma. The maximum cross correlation and lag (offset distance of maximum cross correlation) values for Model 2 are 0.50 and 62 km, 0.51 and-33 km, and 0.46 and 12 km for line 1, line 2, and line 3, respectively. For Model 3 these improve with larger cross correlation values and

BILLEN AND STOCK: MORPHOLOGY OF THE OSBOURN TROUGH 13,487
_10 ø
_20 ø
_30 ø
_40 ø
_50 ø
':•. •;i,•r•% '•. •,,'"•.:..'i•?•.•.•?:;,.:/•-:•4':• ....
½'• /',•J Osbourn Trough,>
...,.•,.,.•.., , q.,...•,?.:-,•½ /•/• , %>,
.... • ........ • •u' •; %' ' '•'•'' • • )l
.... than n Rise
< .... .... . '•' /..Sub, tuction Zone '.• ...3,
• /' .... .. 0 "•
,'""/ V L,,"*"
<. ..... < ...,;•.•. .... :,,.: < •..A. Presen I
170 ø 180 ø -170 ø _160 ø
Pacific Plate
Osbourn Trough 9 •
Phoenix Plate •
(Fragment) A •.• '" rn L•'",••• l• R s •"am e •• '"'"':•:••'•••••••••.•••••.• Phoenix Plat
Figure 4. (a) Present location of the Osbourn Trough and its position relative to other features on the seafloor with bathymetry contours (2000 m interval starting at 1000 m (GEBCO 1997)). (b) Sketch of possible relative positions of the Osbourn Trough, Hikurangi and Manihiki Plateaus outboard of the Gondwana subduction zone, and what would become the Chatham Rise and north island of New Zealand in late Cretaceous time.
smaller lags of 0.63 and 8 km, and 0.64 and 9 km for lines 1 and 2. The fit for line 1 with a maximum cor-
relation of 0.56 at a lag of 60 km is not improved. The bad fit in line I may be due to this profile crossing the trough at the eastern edge of this segment. Model 3 predicts the presence of other anomalies very close to the trough which may be p?esent in other ship tracks (C1713, V3602, V3601). However, in Model 3 the young edge of chron 34 (83 Ma) should be present about 250 km from the trough as a magnetic low on the north- ern side of the spreading center and a magnetic high on the southern side. There is no convincing evidence this anomaly on any of the existing ship tracks, but these ship tracks are sparse and often interrupted by seamounts. In addition, it is possible that the spreading rate and direction may have changed with time. Thus we feel that the data may be inadequate to resolve be- tween these two models. More magnetic data as well as dredge samples from the seafloor may ultimately be needed to resolve this issue.
4. Discussion
The existence of this spreading center has important implications for tectonic reconstructions of this region. First, the crust south of the OT for some distance would formerly have been part of a different plate, perhaps the Phoenix Plate or a fragment that broke from it, such as the Bellingshausen Plate [Heinemann et al., 1999] (Figures 4a-4b). This fragment of crust south of the OT would have joined to the Pacific Plate at the time spreading stopped along the OT. Lonsdale [1997] pro- posed that this happened at 105 Ma, accompanied by the cessation of subduction along the Gondwana mar- gin when the Hikurangi Plateau entered the subduction zone at the location of the •: Chatham Rise; this tim- ing would coincide with the initiation of rifting in West Antarctica and the transfer of the New Zealand conti-
nental fragments and the Chatham Rise to the Pacific Plate [Luyendyk, 1995]. However, if the OT continued spreading until a younger time, as is suggested from our

13,488 BILLEN AND STOCK: MORPHOLOGY OF THE OSBOURN TROUGH
magnetic observations, then the crust south of the OT would have comprised a separate plate in existence be- tween the New Zealand fragments and the Pacific Plate to the north of the OT until later in the Cretaceous Nor-
mal Superchron, and possibly even until about 71 Ma (chron 32 time). The spreading center to the southeast of the Osbourn Trough (Figure 4b) would correspond to a section of spreading center between the Belling- shausen and Pacific Plates which continued spreading until 61 Ma when the Bellingshausen Plate joined the Antarctic Plate and this spreading center segment be- came part of the modern Pacific-Antarctic spreading center [Cande et al., 1995; Heinemann et al., 1999].
Lonsdale [1997] also proposed that the Hikurangi and Manihiki Plateaus comprised a single Early Cretaceous plateau which was split by the spreading system of the OT. In this scenario, the conjugate paleorift boundaries would be the southwest edge of the Manihiki Plateau and the northeast edge of the Hikurangi Plateau. Since the OT trends east-west, any such spreading system would have had to reorient between the times of initial
rifting and final spreading on the OT. Such a reori- entation might explain why the seafloor magnetic pat- terns in the region around the OT are so puzzling and why there are no throughgoing fracture zones seen in the gravity data between the OT and the Manihiki or Hikurangi Plateaus, although the eastern edge of the Hikurangi Plateau is connected to the eastern edge of the Osbourn Trough by the Wishbone Scarp (a sharp discontinuity seen in the topography and satellite al- timetry data). Our data show that during the final stages of spreading of the OT, some of its spreading center segments may have been propagating, generating pseudo-fault traces rather than stable fracture zones. If this geometry was typical, and the sparse existing ship tracks cross pseudo-fault offsets, then this would com- plicate our ability to interpret the magnetic anomaly pattern. If the Manihiki and Hikurangi Plateaus are not conjugate features, then a more complicated sce- nario for starting the OT is required.
Under Lonsdale's hypothesis, the OT stopped spread- ing at about 105 Ma. Thus all of the crust between the Manihiki and Hikurangi Plateaus would have formed in roughly 15 Myr at a very fast 20 cm/yr full spreading rate, similar to rates estimated for Cretaceous Phoenix- Pacific spreading northeast of the Eltanin fracture zone system [Weissel et al., 1977; Cande et al., 1982]. If, however, the OT continued spreading until a younger time (82-71 Me[), as our data suggest, the spreading rate need only have averaged 6 to 8 cm/yr. A slower spreading rate is more consistent with our observations of the morphology of the OT. It is, of course, possible that this morphology only characterizes the final stages of the history of the trough, for example, if the spread- ing rate slowed dramatically just before the spreading center died.
5. Conclusions
Our observations support the hypothesis of Lons- dale [1997] that the Osbourn Trough is an abandoned spreading center with an axial valley that has been par- tially filled in by 350 m of sediment. The morphology of the OT with its prominent axial valley and inside corner high surrounded by parallel-aligned abyssal hills agrees with observations over other extinct slow-spreading cen- ters indicating that this was a slow-spreading center, similar to the modern Mid-Atlantic Ridge. The echo sounder data reveal that the center of the trough is filled in by undisturbed sediments and thus do not sup- port the hypothesis of Small and Abbott [1998] that this trough represents a recent crack in the Pacific Plate. Seismic data are required to define the depth to base- ment beneath the sediments and to rule out the exis-
tence of deeper fault offsets or offsets occurring in the rift valley walls. However, the lack of visible offsets in the swath bathymetry and in the echo sounder data sug- gests that this is not a region of active cracking or fault- ing. In addition, we present several hypotheses for the origin of large magnetic anomalies crossing the trough and speculate that the spreading center could have died at a time after the end of chron 34 and could be as young as 71 Ma. The existence of this relict spreading center gives further constraints on plate reconstructions in this region, specifically, suggesting the existence of another plate in this region between the Pacific Plate and the New Zealand continental fragments in Late Cretaceous time.
Acknowledgments. This research was supported by NSF OPP 9317318 and OCE 9416779. Dallas Abbott, Bruce Luyendyk and Associate Editor Keith Louden pro- vided helpful reviews of this paper. We thank Antarctic Support Associates, the crew and Captain Joe Borkowski of the RVIB Nathaniel B. Palmer, and Suzanne O'Hara for their help in collecting and processing the data, and Steve Cande for his helpful comments. California Insitute of Tech- nology, Division of Geological and Planetary Science, con- tribution 8618.
References
Burns, R. E., et al., Initial t•eports of the Deep Sea Drilling Project, vol. 21, pp. 33-56, U.S. Gov. Print. Off., Wash- ington, D.C., 1973.
Cande, S.C., ancl D. V. Kent, Ultrahigh resolution marine magnetic anomaly profiles: A record of continuous pale- ointensity variations?, J. Geophys. Res., 97(Bll), 15075- 15083, 1992.
Cande, S.C., and D. V. Kent, Revised calibration of the ge- omagnetic polarity time scale for the late Cretaceous and Cenozoic, J. Geophys. Res., 100(B4), 6093-6095, 1995.
Cande, S.C., E. M. Herron, and B. R. Hall, The early Ceno- zoic tectonic history of the southeast Pacific, Earth and Planetary Science Letters, 57, 63-74, 1982.
Cande, S.C., C. A. Raymond, J. Stock, and W. F. Haxby, Geophysics of the Pitman Fracture Zone and Pacific- Antarctic plate motions during the Cenozoic, Science, 270,947-953, 1995.

BILLEN AND STOCK: MORPHOLOGY OF THE OSBOURN TROUGH 13,489
Heinemann, J., J. Stock, R. Clayton, K. Hafner, S. Cande, and C. Raymond, Constraints on the proposed Marie Byrd Land-Bellinshausen plate boundary from seismic re- flection data, J. Geophys. Res., 10,4 (Bll), 25,321-25,330, 1999.
Jonas, J., S. Hall, and J. Casey, Gravity anomalies over ex- tinct spreading centers: A test of gravity models of active centers, J. Geophys. Res., 96(B7), 11,759-11,777, 1991.
Kent, D. V., B. M. Honnerez, N. D. Opdyke, and Po J. Fox, Magnetic properties of dredged oceanic gabbros and the source marine magnetic anomalies, Geophys. J. R. Astro. Soc., 55,531-537, 1978.
Larson, R. L., et al., Proceedings of the Ocean Drilling Pro- gram, Scientific Results, vol. 129, pp. 431-446, Ocean Drill. Program, College Station, Tex., 1992.
Lonsdale, P., An incomplete geologic history of the south- west Pacific basin, Geol. a"oc. Am. Abstr. Programs, 29(5), 4574, 1997.
Luyendyk, B. P., Hypothesis for Cretaceous rifting of East Gondwana caused by subducted slab capture, Geology, 23(4), 373-376, 1995.
Macdonald, K. C., The crest of the Mid-Atlantic Ridge: Models for crustal generation processes and tectonics, in The Geology of North America; vol. M, The Western North Atlantic Region, edited by P. R. Vogt and B. E. Tucholke, Geol. Soc. of Am., Boulder, Colo., 1986.
Menard, H. W., and et al, Initial Reports of the Deep Sea Drilling Program, vol. 91, U.S. Gov. Print. Off., Washing- ton, D.C., 1983.
Sandwell, D. T., and W. H. F. Smith, Marine gravity anomaly from Geosat and ERS I satellite altimetry, J. Geophys. Res., 102(B5), 10,039-10,054, 1997.
Severinghaus, J.P., and K. C. Macdonald, High inside cor-
ners at ridge-transform intersections, Mar. Geophys. Res., 9,353-367, 1988.
Small, C., and D. Abbott, Subduction obstruction and the crack-up of the Pacific Plate, Geology, 26,795-798, 1998.
Small, C., and D. Sandwell, An abrupt change in ridge axis gravity with spreading rate, J. Geophys. Res., 9J(B12), 17,383-17,392, 1989.
Talwani, M., J. L. Worzel, and M. Landisman, Rapid gravity computations for two-dimensional bodies with application to the Mendocino submarine fracture zone, J. Geophys. Res., 64 (1), 49-59, 1959.
Vogt, P. R., Magnetic anomalies and crustal magnetization, in The Geology of North America; vol. M, The Western North Atlantic Region, edited by P. R. Vogt and B. Tu- cholke, pp. 229-256, Geol. Soc. of Am., Boulder, Colo., 1986.
Watts, A. B., J. K. Weissel, R. A. Duncan, and R. L. Lar- son, Origin of the Louisville Ridge and its relationship to the Eltanin Fracture Zone system, J. Geophys. Res., 93, 3051-3077, 1988.
Weissel, J. K., D. F,. Hayes, and E. M. Herron, Plate tecton- ics synthesis: The displacements between Australia, New Zealand and Antarctica since the late Cretaceous, Mar. Geol., 25,231-277, 1977.
M. I. Billen and J. Stock, California Institute of Tech- nology, Seismological Laboratory, 1200 E. California Blvd., MC 252-21, Pasadena, CA 91125. ([email protected]; jstock•gps.caltech.edu)
(Received July 22, 1999; revised December 16, 1999; accepted January 26, 2000.)